Puako, HI Map & Demographics
Puako Map
Puako Overview
$102,681
PER CAPITA INCOME
$180,417
AVG FAMILY INCOME
$110,000
AVG HOUSEHOLD INCOME
45.4%
WAGE / INCOME GAP [ % ]
54.6¢/ $1
WAGE / INCOME GAP [ $ ]
0.60
INEQUALITY / GINI INDEX
294
TOTAL POPULATION
139
MALE POPULATION
155
FEMALE POPULATION
89.68
MALES / 100 FEMALES
111.51
FEMALES / 100 MALES
63.4
MEDIAN AGE
2.6
AVG FAMILY SIZE
2.0
AVG HOUSEHOLD SIZE
94
LABOR FORCE [ PEOPLE ]
33.7%
PERCENT IN LABOR FORCE
9.6%
UNEMPLOYMENT RATE
Income in Puako
Income Overview in Puako
Per Capita Income in Puako is $102,681, while median incomes of families and households are $180,417 and $110,000 respectively.
| Characteristic | Number | Measure |
| Per Capita Income | 294 | $102,681 |
| Median Family Income | 71 | $180,417 |
| Mean Family Income | 71 | $307,786 |
| Median Household Income | 148 | $110,000 |
| Mean Household Income | 148 | $196,264 |
| Income Deficit | 71 | $0 |
| Wage / Income Gap (%) | 294 | 45.39% |
| Wage / Income Gap ($) | 294 | 54.61¢ per $1 |
| Gini / Inequality Index | 294 | 0.60 |
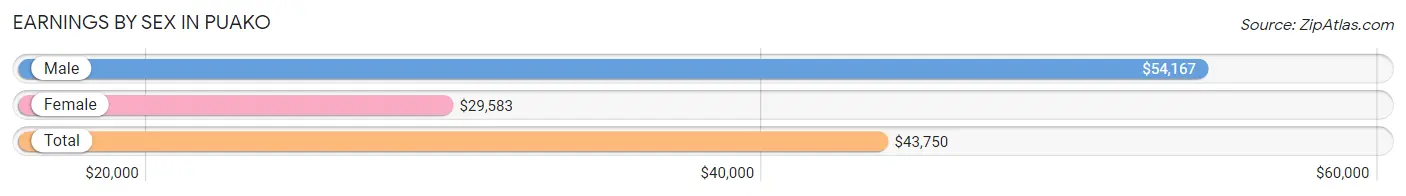
Earnings by Sex in Puako
Average Earnings in Puako are $43,750, $54,167 for men and $29,583 for women, a difference of 45.4%.
| Sex | Number | Average Earnings |
| Male | 68 (52.3%) | $54,167 |
| Female | 62 (47.7%) | $29,583 |
| Total | 130 (100.0%) | $43,750 |
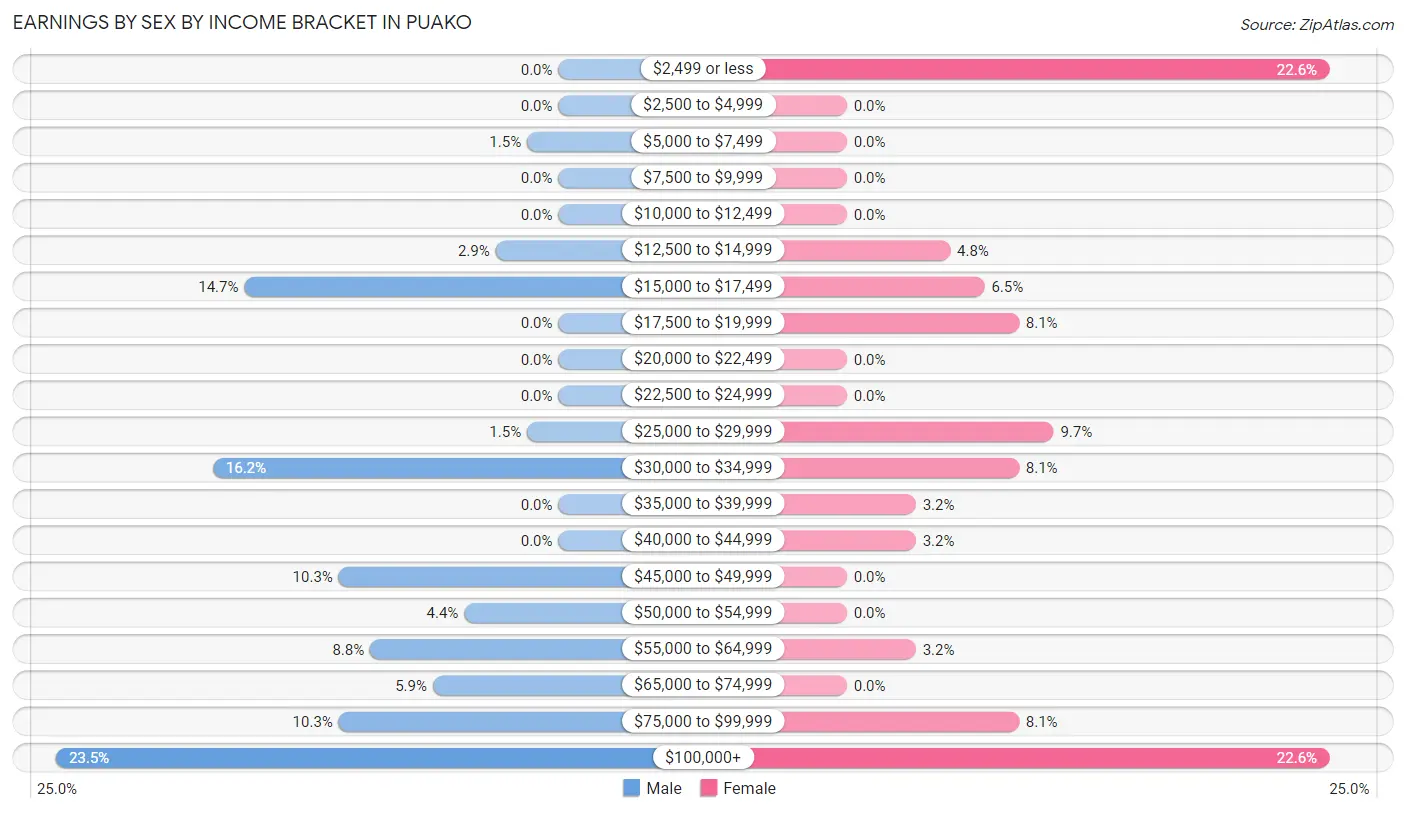
Earnings by Sex by Income Bracket in Puako
The most common earnings brackets in Puako are $100,000+ for men (16 | 23.5%) and $2,499 or less for women (14 | 22.6%).
| Income | Male | Female |
| $2,499 or less | 0 (0.0%) | 14 (22.6%) |
| $2,500 to $4,999 | 0 (0.0%) | 0 (0.0%) |
| $5,000 to $7,499 | 1 (1.5%) | 0 (0.0%) |
| $7,500 to $9,999 | 0 (0.0%) | 0 (0.0%) |
| $10,000 to $12,499 | 0 (0.0%) | 0 (0.0%) |
| $12,500 to $14,999 | 2 (2.9%) | 3 (4.8%) |
| $15,000 to $17,499 | 10 (14.7%) | 4 (6.5%) |
| $17,500 to $19,999 | 0 (0.0%) | 5 (8.1%) |
| $20,000 to $22,499 | 0 (0.0%) | 0 (0.0%) |
| $22,500 to $24,999 | 0 (0.0%) | 0 (0.0%) |
| $25,000 to $29,999 | 1 (1.5%) | 6 (9.7%) |
| $30,000 to $34,999 | 11 (16.2%) | 5 (8.1%) |
| $35,000 to $39,999 | 0 (0.0%) | 2 (3.2%) |
| $40,000 to $44,999 | 0 (0.0%) | 2 (3.2%) |
| $45,000 to $49,999 | 7 (10.3%) | 0 (0.0%) |
| $50,000 to $54,999 | 3 (4.4%) | 0 (0.0%) |
| $55,000 to $64,999 | 6 (8.8%) | 2 (3.2%) |
| $65,000 to $74,999 | 4 (5.9%) | 0 (0.0%) |
| $75,000 to $99,999 | 7 (10.3%) | 5 (8.1%) |
| $100,000+ | 16 (23.5%) | 14 (22.6%) |
| Total | 68 (100.0%) | 62 (100.0%) |
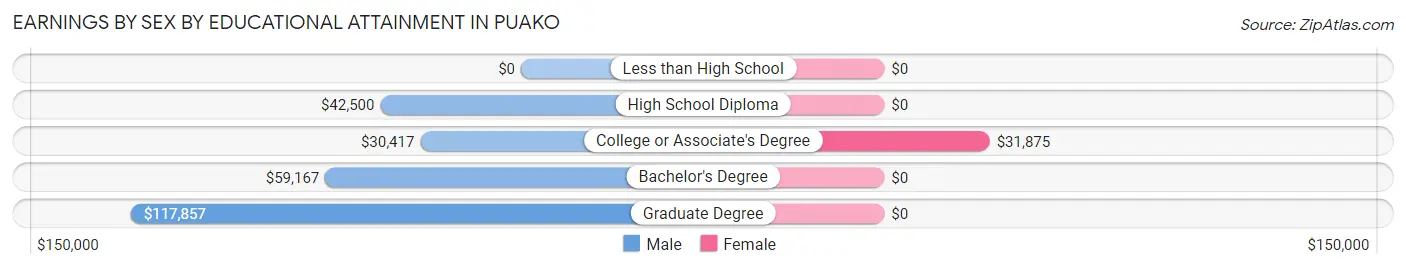
Earnings by Sex by Educational Attainment in Puako
| Educational Attainment | Male Income | Female Income |
| Less than High School | - | - |
| High School Diploma | $42,500 | $0 |
| College or Associate's Degree | $30,417 | $31,875 |
| Bachelor's Degree | $59,167 | $0 |
| Graduate Degree | $117,857 | $0 |
| Total | $54,167 | $0 |
Family Income in Puako
Family Income Brackets in Puako
According to the Puako family income data, there are 33 families falling into the $200,000+ income range, which is the most common income bracket and makes up 46.5% of all families.
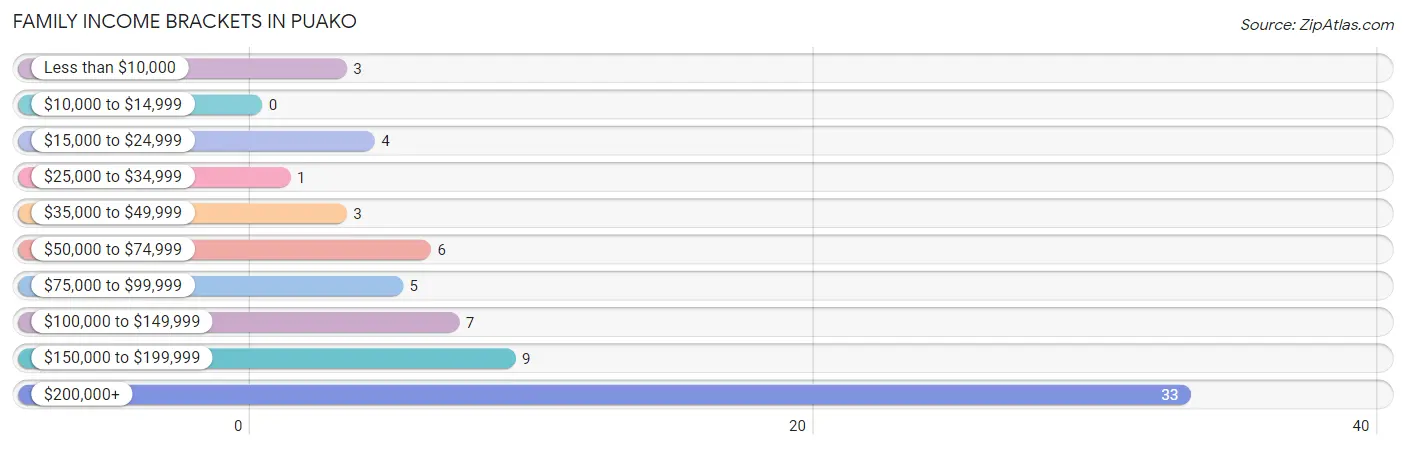
| Income Bracket | # Families | % Families |
| Less than $10,000 | 3 | 4.2% |
| $10,000 to $14,999 | 0 | 0.0% |
| $15,000 to $24,999 | 4 | 5.6% |
| $25,000 to $34,999 | 1 | 1.4% |
| $35,000 to $49,999 | 3 | 4.2% |
| $50,000 to $74,999 | 6 | 8.5% |
| $75,000 to $99,999 | 5 | 7.0% |
| $100,000 to $149,999 | 7 | 9.9% |
| $150,000 to $199,999 | 9 | 12.7% |
| $200,000+ | 33 | 46.5% |
Family Income by Famaliy Size in Puako
2-person families (56 | 78.9%) account for the highest median family income in Puako with $156,667 per family, while 2-person families (56 | 78.9%) have the highest median income of $78,334 per family member.
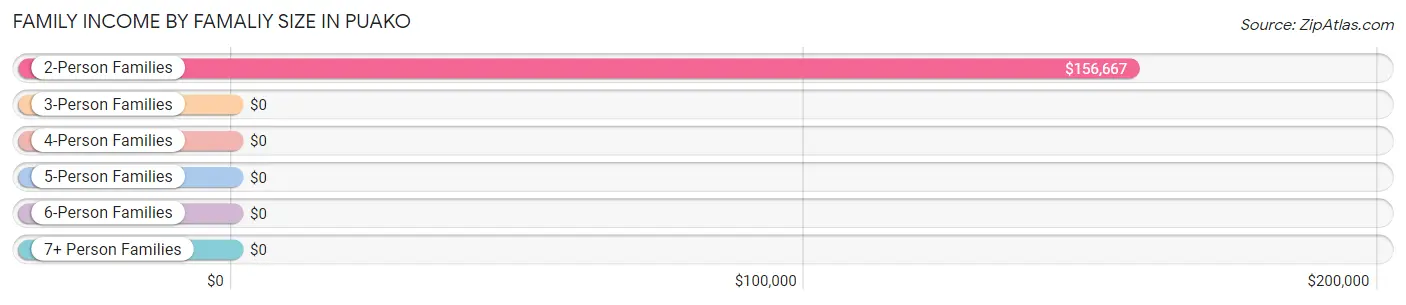
| Income Bracket | # Families | Median Income |
| 2-Person Families | 56 (78.9%) | $156,667 |
| 3-Person Families | 8 (11.3%) | $0 |
| 4-Person Families | 3 (4.2%) | $0 |
| 5-Person Families | 4 (5.6%) | $0 |
| 6-Person Families | 0 (0.0%) | $0 |
| 7+ Person Families | 0 (0.0%) | $0 |
| Total | 71 (100.0%) | $180,417 |
Family Income by Number of Earners in Puako
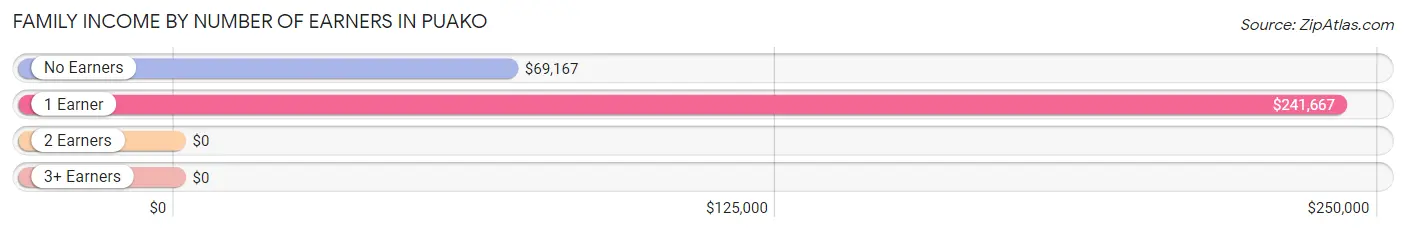
| Number of Earners | # Families | Median Income |
| No Earners | 20 (28.2%) | $69,167 |
| 1 Earner | 40 (56.3%) | $241,667 |
| 2 Earners | 8 (11.3%) | $0 |
| 3+ Earners | 3 (4.2%) | $0 |
| Total | 71 (100.0%) | $180,417 |
Household Income in Puako
Household Income Brackets in Puako
With 46 households falling in the category, the $200,000+ income range is the most frequent in Puako, accounting for 31.1% of all households.
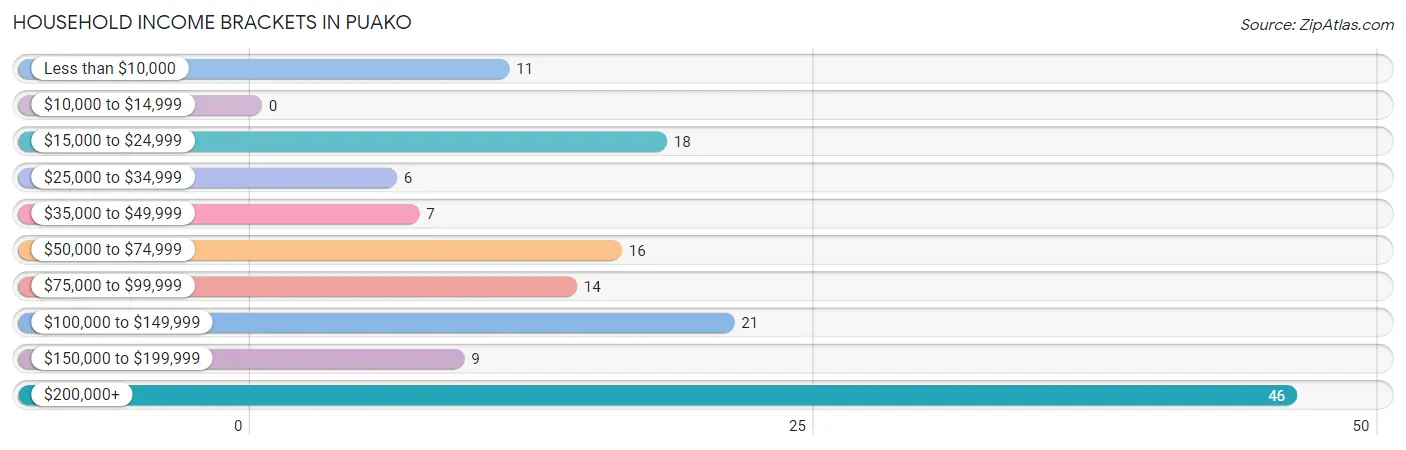
| Income Bracket | # Households | % Households |
| Less than $10,000 | 11 | 7.4% |
| $10,000 to $14,999 | 0 | 0.0% |
| $15,000 to $24,999 | 18 | 12.2% |
| $25,000 to $34,999 | 6 | 4.1% |
| $35,000 to $49,999 | 7 | 4.7% |
| $50,000 to $74,999 | 16 | 10.8% |
| $75,000 to $99,999 | 14 | 9.5% |
| $100,000 to $149,999 | 21 | 14.2% |
| $150,000 to $199,999 | 9 | 6.1% |
| $200,000+ | 46 | 31.1% |
Household Income by Householder Age in Puako
The median household income in Puako is $110,000, with the highest median household income of $143,036 found in the 65+ years age bracket for the primary householder. A total of 83 households (56.1%) fall into this category.
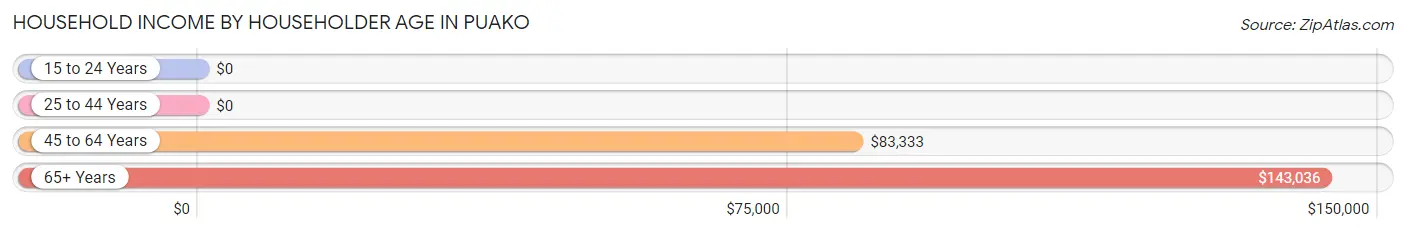
| Income Bracket | # Households | Median Income |
| 15 to 24 Years | 0 (0.0%) | $0 |
| 25 to 44 Years | 7 (4.7%) | $0 |
| 45 to 64 Years | 58 (39.2%) | $83,333 |
| 65+ Years | 83 (56.1%) | $143,036 |
| Total | 148 (100.0%) | $110,000 |
Poverty in Puako
Income Below Poverty by Sex and Age in Puako
With 7.2% poverty level for males and 9.0% for females among the residents of Puako, 16 and 17 year old males and 35 to 44 year old females are the most vulnerable to poverty, with 2 males (100.0%) and 4 females (57.1%) in their respective age groups living below the poverty level.
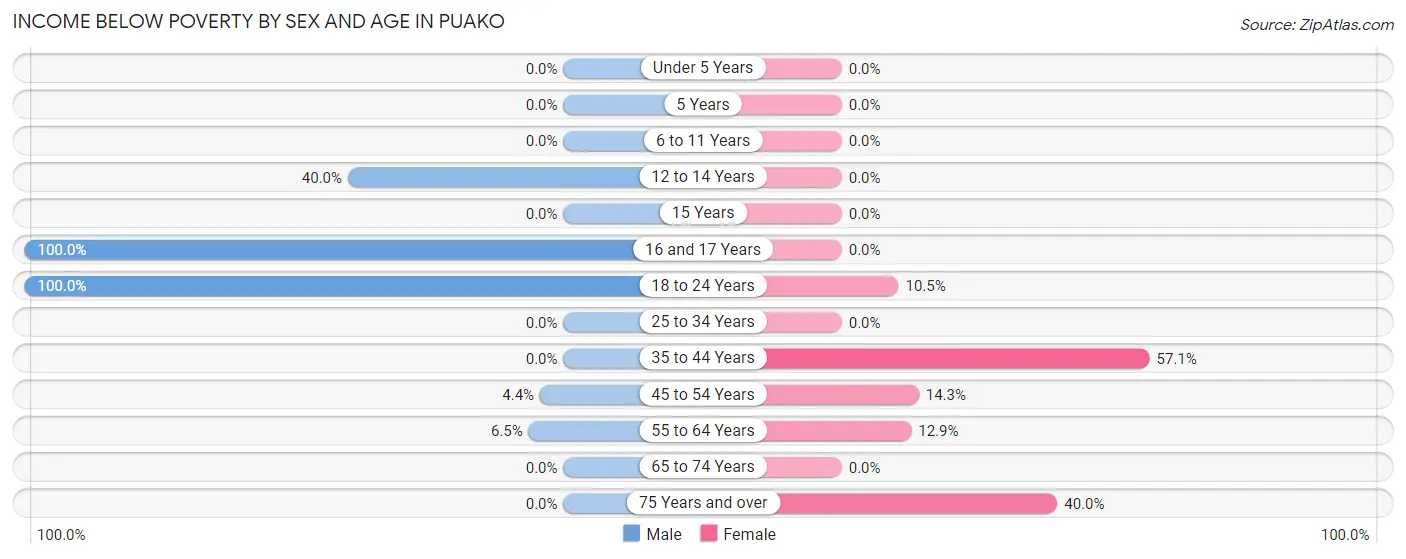
| Age Bracket | Male | Female |
| Under 5 Years | 0 (0.0%) | 0 (0.0%) |
| 5 Years | 0 (0.0%) | 0 (0.0%) |
| 6 to 11 Years | 0 (0.0%) | 0 (0.0%) |
| 12 to 14 Years | 2 (40.0%) | 0 (0.0%) |
| 15 Years | 0 (0.0%) | 0 (0.0%) |
| 16 and 17 Years | 2 (100.0%) | 0 (0.0%) |
| 18 to 24 Years | 3 (100.0%) | 2 (10.5%) |
| 25 to 34 Years | 0 (0.0%) | 0 (0.0%) |
| 35 to 44 Years | 0 (0.0%) | 4 (57.1%) |
| 45 to 54 Years | 1 (4.3%) | 2 (14.3%) |
| 55 to 64 Years | 2 (6.5%) | 4 (12.9%) |
| 65 to 74 Years | 0 (0.0%) | 0 (0.0%) |
| 75 Years and over | 0 (0.0%) | 2 (40.0%) |
| Total | 10 (7.2%) | 14 (9.0%) |
Income Above Poverty by Sex and Age in Puako
According to the poverty statistics in Puako, males aged 6 to 11 years and females aged 6 to 11 years are the age groups that are most secure financially, with 100.0% of males and 100.0% of females in these age groups living above the poverty line.
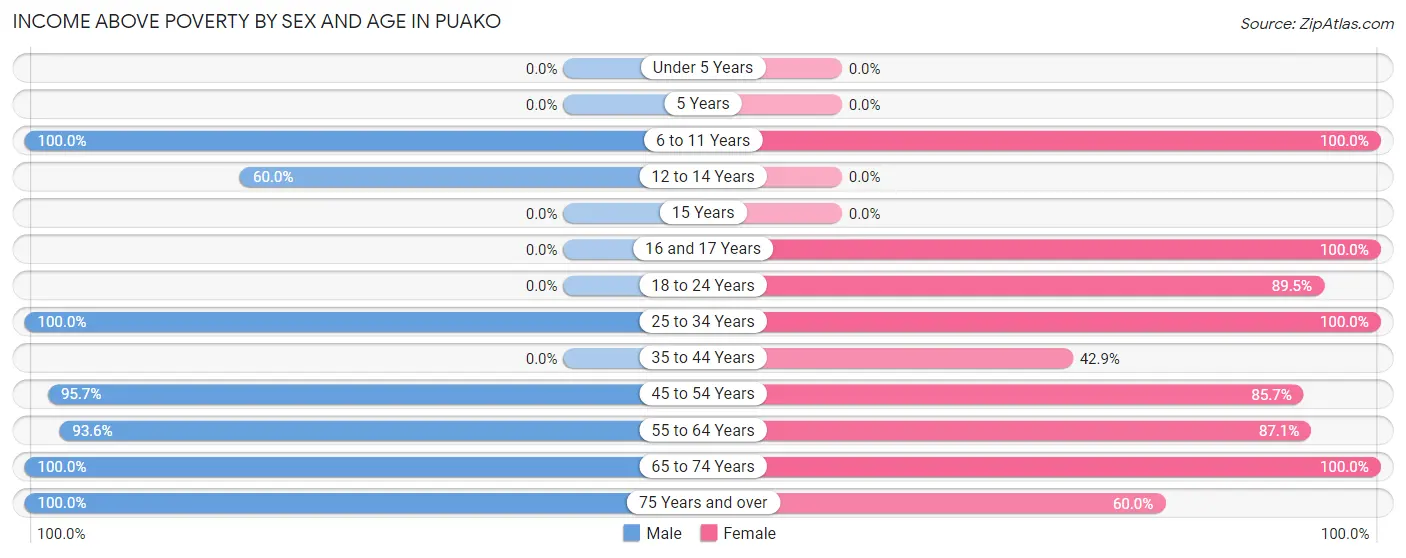
| Age Bracket | Male | Female |
| Under 5 Years | 0 (0.0%) | 0 (0.0%) |
| 5 Years | 0 (0.0%) | 0 (0.0%) |
| 6 to 11 Years | 5 (100.0%) | 5 (100.0%) |
| 12 to 14 Years | 3 (60.0%) | 0 (0.0%) |
| 15 Years | 0 (0.0%) | 0 (0.0%) |
| 16 and 17 Years | 0 (0.0%) | 6 (100.0%) |
| 18 to 24 Years | 0 (0.0%) | 17 (89.5%) |
| 25 to 34 Years | 3 (100.0%) | 4 (100.0%) |
| 35 to 44 Years | 0 (0.0%) | 3 (42.9%) |
| 45 to 54 Years | 22 (95.7%) | 12 (85.7%) |
| 55 to 64 Years | 29 (93.5%) | 27 (87.1%) |
| 65 to 74 Years | 33 (100.0%) | 64 (100.0%) |
| 75 Years and over | 34 (100.0%) | 3 (60.0%) |
| Total | 129 (92.8%) | 141 (91.0%) |
Income Below Poverty Among Married-Couple Families in Puako
The poverty statistics for married-couple families in Puako show that 4.5% or 3 of the total 66 families live below the poverty line. Families with 1 or 2 children have the highest poverty rate of 25.0%, comprising of 1 families. On the other hand, families with 3 or 4 children have the lowest poverty rate of 0.0%, which includes 0 families.
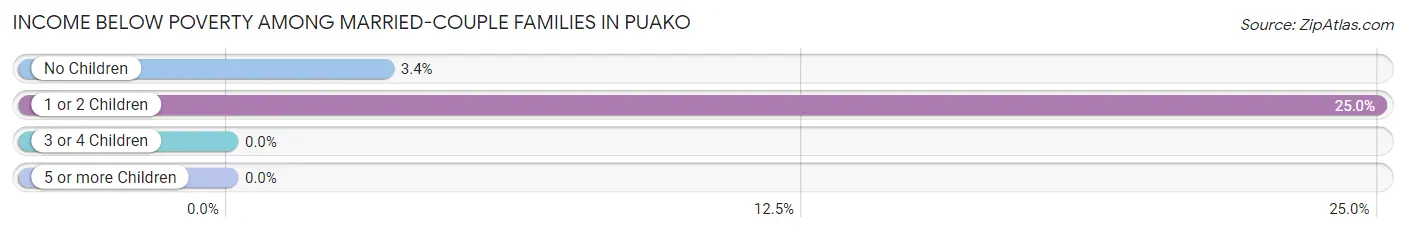
| Children | Above Poverty | Below Poverty |
| No Children | 57 (96.6%) | 2 (3.4%) |
| 1 or 2 Children | 3 (75.0%) | 1 (25.0%) |
| 3 or 4 Children | 3 (100.0%) | 0 (0.0%) |
| 5 or more Children | 0 (0.0%) | 0 (0.0%) |
| Total | 63 (95.5%) | 3 (4.5%) |
Income Below Poverty Among Single-Parent Households in Puako
| Children | Single Father | Single Mother |
| No Children | 0 (0.0%) | 0 (0.0%) |
| 1 or 2 Children | 0 (0.0%) | 0 (0.0%) |
| 3 or 4 Children | 0 (0.0%) | 0 (0.0%) |
| 5 or more Children | 0 (0.0%) | 0 (0.0%) |
| Total | 0 (0.0%) | 0 (0.0%) |
Income Below Poverty Among Married-Couple vs Single-Parent Households in Puako
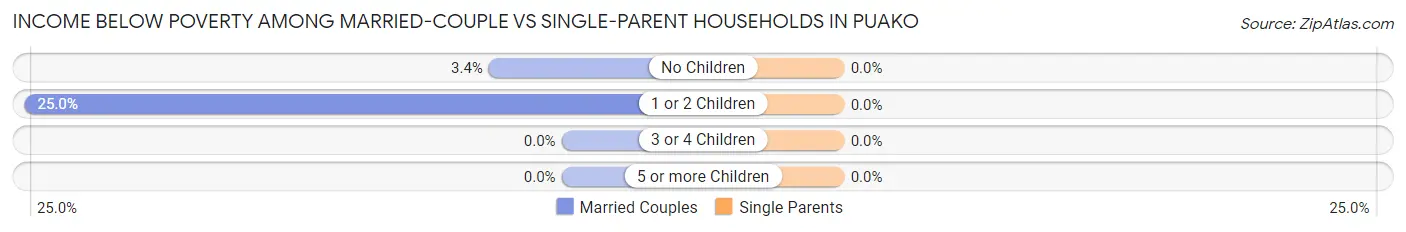
| Children | Married-Couple Families | Single-Parent Households |
| No Children | 2 (3.4%) | 0 (0.0%) |
| 1 or 2 Children | 1 (25.0%) | 0 (0.0%) |
| 3 or 4 Children | 0 (0.0%) | 0 (0.0%) |
| 5 or more Children | 0 (0.0%) | 0 (0.0%) |
| Total | 3 (4.5%) | 0 (0.0%) |
Race in Puako
The most populous races in Puako are White / Caucasian (211 | 71.8%), Two or more Races (43 | 14.6%), and Asian (34 | 11.6%).
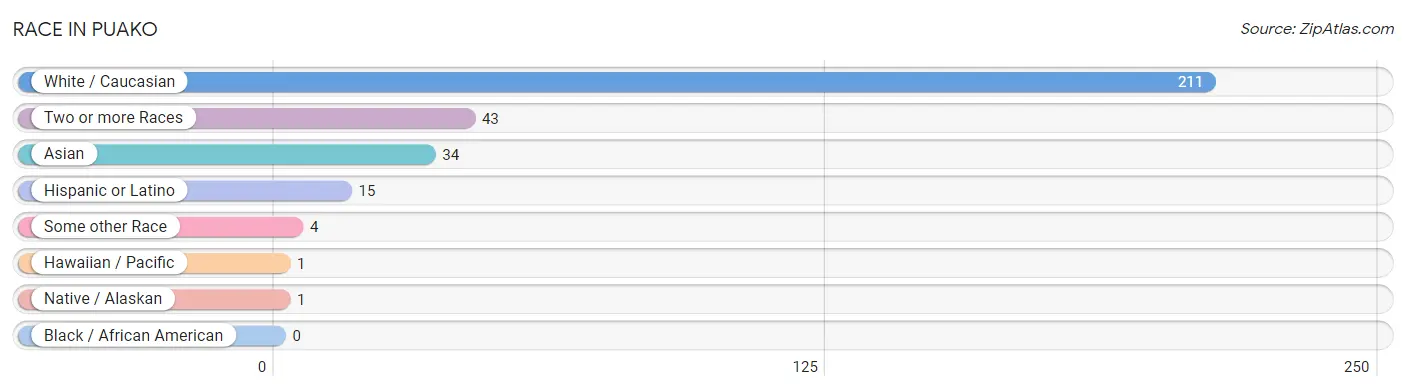
| Race | # Population | % Population |
| Asian | 34 | 11.6% |
| Black / African American | 0 | 0.0% |
| Hawaiian / Pacific | 1 | 0.3% |
| Hispanic or Latino | 15 | 5.1% |
| Native / Alaskan | 1 | 0.3% |
| White / Caucasian | 211 | 71.8% |
| Two or more Races | 43 | 14.6% |
| Some other Race | 4 | 1.4% |
| Total | 294 | 100.0% |
Ancestry in Puako
The most populous ancestries reported in Puako are German (71 | 24.1%), English (41 | 14.0%), Irish (27 | 9.2%), Italian (27 | 9.2%), and European (20 | 6.8%), together accounting for 63.3% of all Puako residents.
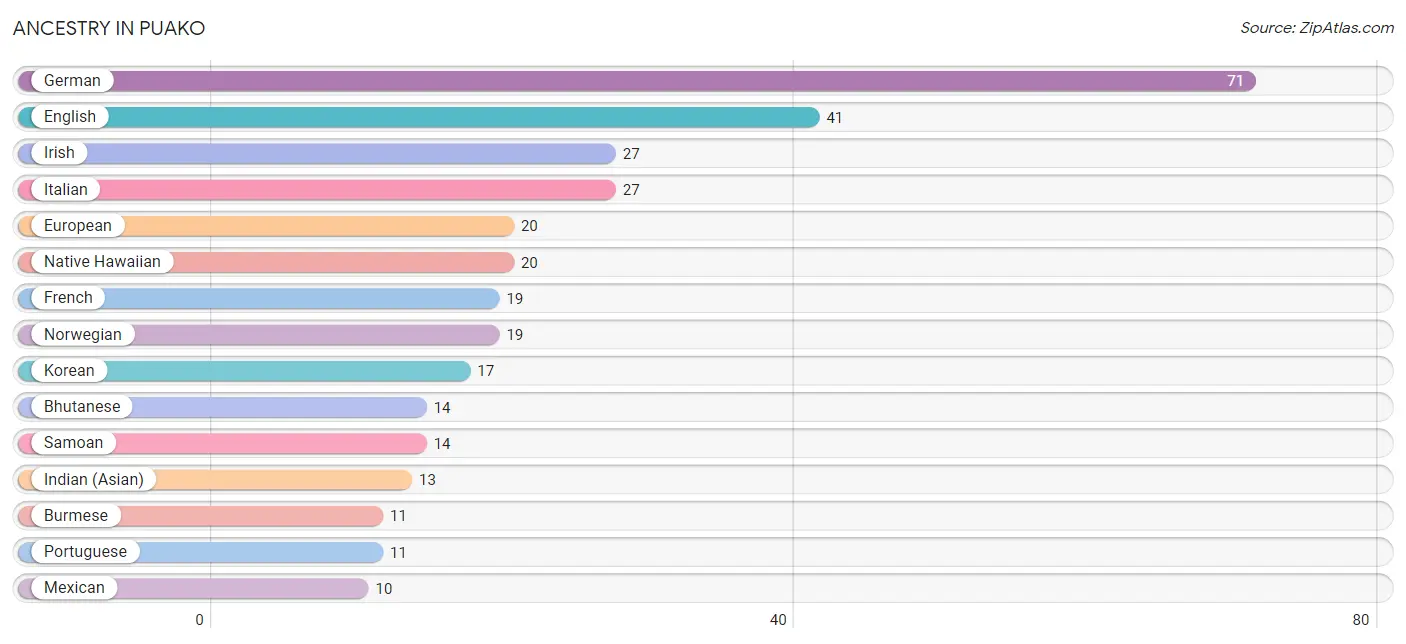
| Ancestry | # Population | % Population |
| Belgian | 4 | 1.4% |
| Bhutanese | 14 | 4.8% |
| British | 8 | 2.7% |
| Burmese | 11 | 3.7% |
| Choctaw | 1 | 0.3% |
| Creek | 1 | 0.3% |
| Czech | 4 | 1.4% |
| Danish | 4 | 1.4% |
| Dutch | 2 | 0.7% |
| English | 41 | 14.0% |
| European | 20 | 6.8% |
| French | 19 | 6.5% |
| French Canadian | 2 | 0.7% |
| German | 71 | 24.1% |
| Indian (Asian) | 13 | 4.4% |
| Irish | 27 | 9.2% |
| Italian | 27 | 9.2% |
| Korean | 17 | 5.8% |
| Lithuanian | 3 | 1.0% |
| Mexican | 10 | 3.4% |
| Native Hawaiian | 20 | 6.8% |
| Norwegian | 19 | 6.5% |
| Polish | 2 | 0.7% |
| Portuguese | 11 | 3.7% |
| Puerto Rican | 5 | 1.7% |
| Russian | 4 | 1.4% |
| Samoan | 14 | 4.8% |
| Scottish | 3 | 1.0% |
| Sioux | 2 | 0.7% |
| Sri Lankan | 1 | 0.3% |
| Swedish | 9 | 3.1% | View All 31 Rows |
Immigrants in Puako
The most numerous immigrant groups reported in Puako came from Europe (14 | 4.8%), France (7 | 2.4%), Northern Europe (7 | 2.4%), Western Europe (7 | 2.4%), and England (4 | 1.4%), together accounting for 13.3% of all Puako residents.
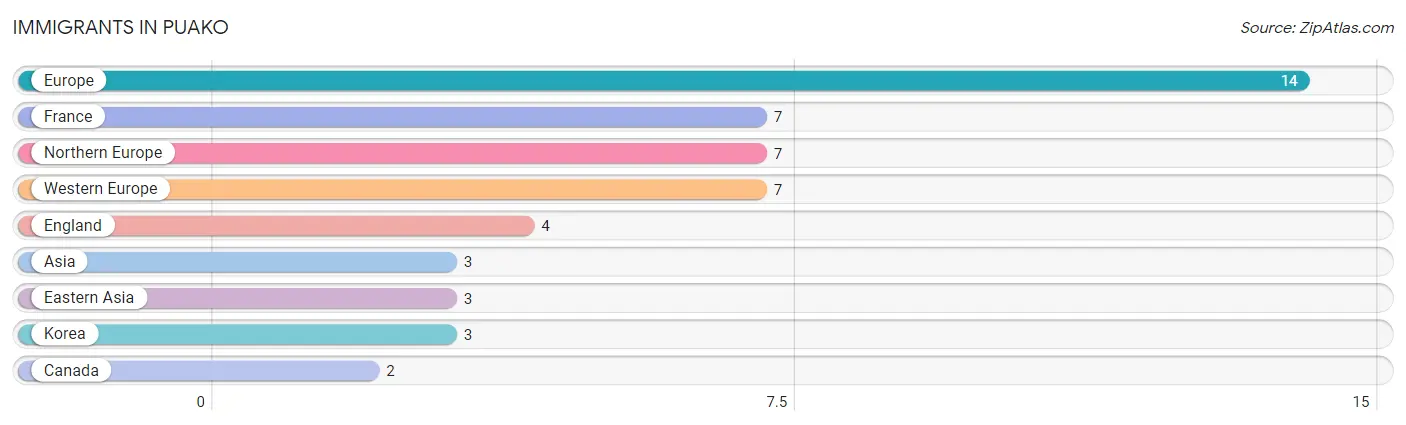
| Immigration Origin | # Population | % Population |
| Asia | 3 | 1.0% |
| Canada | 2 | 0.7% |
| Eastern Asia | 3 | 1.0% |
| England | 4 | 1.4% |
| Europe | 14 | 4.8% |
| France | 7 | 2.4% |
| Korea | 3 | 1.0% |
| Northern Europe | 7 | 2.4% |
| Western Europe | 7 | 2.4% | View All 9 Rows |
Sex and Age in Puako
Sex and Age in Puako
The most populous age groups in Puako are 75 to 79 Years (31 | 22.3%) for men and 65 to 69 Years (38 | 24.5%) for women.
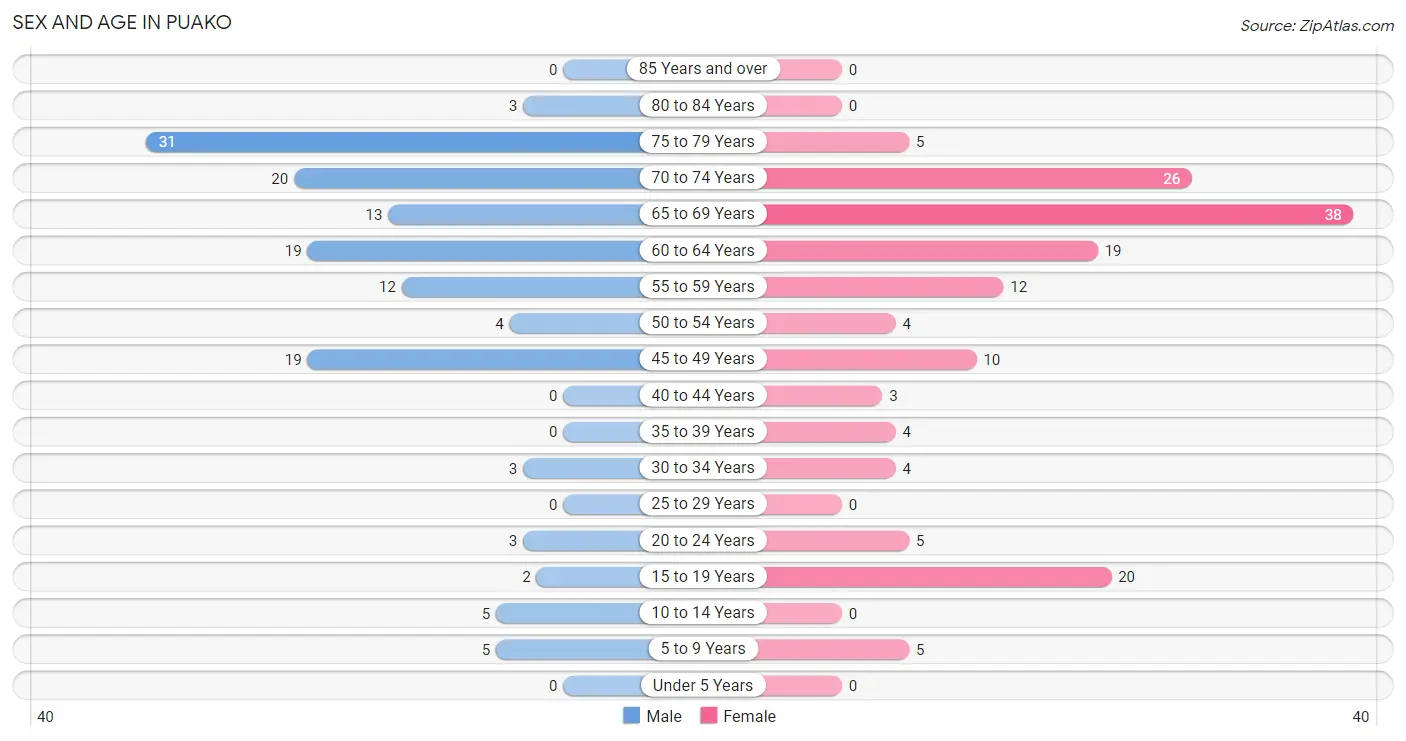
| Age Bracket | Male | Female |
| Under 5 Years | 0 (0.0%) | 0 (0.0%) |
| 5 to 9 Years | 5 (3.6%) | 5 (3.2%) |
| 10 to 14 Years | 5 (3.6%) | 0 (0.0%) |
| 15 to 19 Years | 2 (1.4%) | 20 (12.9%) |
| 20 to 24 Years | 3 (2.2%) | 5 (3.2%) |
| 25 to 29 Years | 0 (0.0%) | 0 (0.0%) |
| 30 to 34 Years | 3 (2.2%) | 4 (2.6%) |
| 35 to 39 Years | 0 (0.0%) | 4 (2.6%) |
| 40 to 44 Years | 0 (0.0%) | 3 (1.9%) |
| 45 to 49 Years | 19 (13.7%) | 10 (6.5%) |
| 50 to 54 Years | 4 (2.9%) | 4 (2.6%) |
| 55 to 59 Years | 12 (8.6%) | 12 (7.7%) |
| 60 to 64 Years | 19 (13.7%) | 19 (12.3%) |
| 65 to 69 Years | 13 (9.3%) | 38 (24.5%) |
| 70 to 74 Years | 20 (14.4%) | 26 (16.8%) |
| 75 to 79 Years | 31 (22.3%) | 5 (3.2%) |
| 80 to 84 Years | 3 (2.2%) | 0 (0.0%) |
| 85 Years and over | 0 (0.0%) | 0 (0.0%) |
| Total | 139 (100.0%) | 155 (100.0%) |
Families and Households in Puako
Median Family Size in Puako
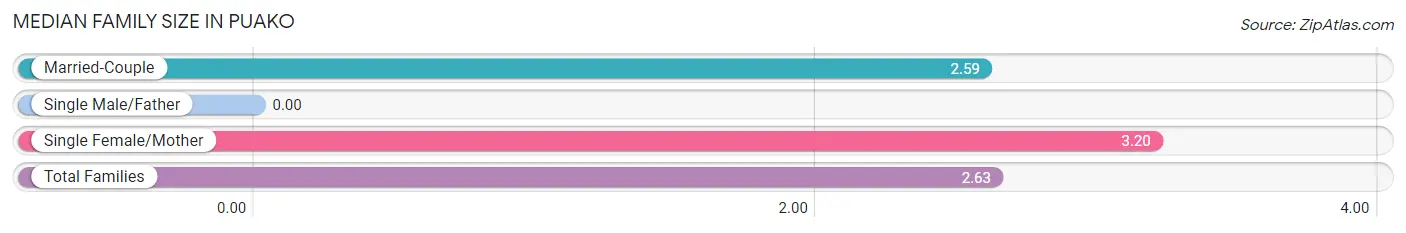
| Family Type | # Families | Family Size |
| Married-Couple | 66 (93.0%) | 2.59 |
| Single Male/Father | 0 (0.0%) | - |
| Single Female/Mother | 5 (7.0%) | 3.20 |
| Total Families | 71 (100.0%) | 2.63 |
Median Household Size in Puako
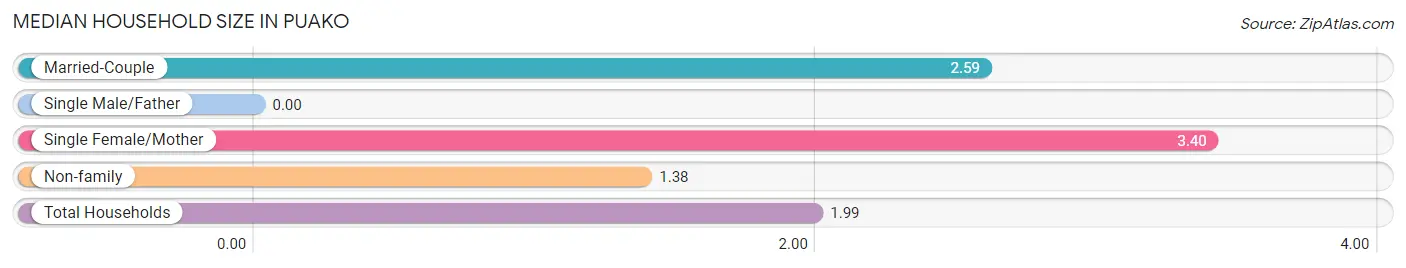
| Household Type | # Households | Household Size |
| Married-Couple | 66 (44.6%) | 2.59 |
| Single Male/Father | 0 (0.0%) | - |
| Single Female/Mother | 5 (3.4%) | 3.40 |
| Non-family | 77 (52.0%) | 1.38 |
| Total Households | 148 (100.0%) | 1.99 |
Household Size by Marriage Status in Puako
Out of a total of 148 households in Puako, 71 (48.0%) are family households, while 77 (52.0%) are nonfamily households. The most numerous type of family households are 2-person households, comprising 56, and the most common type of nonfamily households are 1-person households, comprising 50.
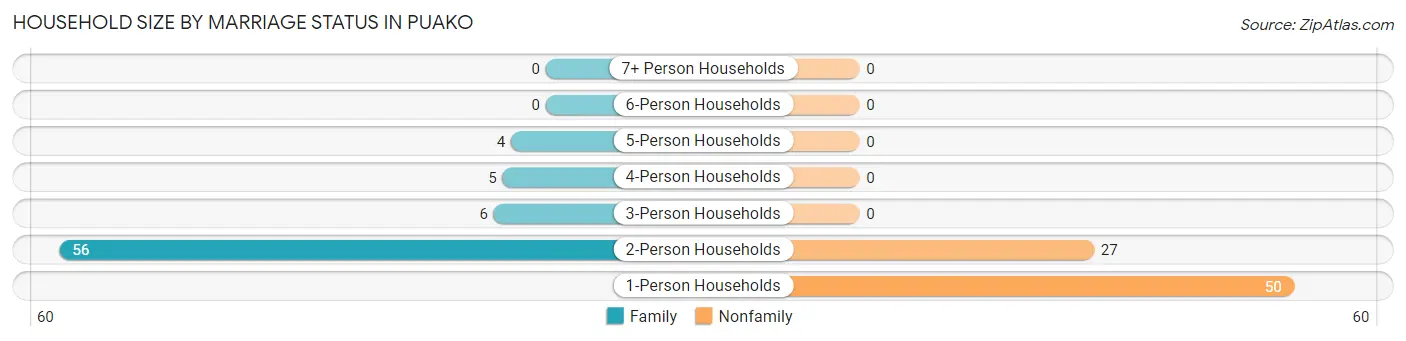
| Household Size | Family Households | Nonfamily Households |
| 1-Person Households | - | 50 (33.8%) |
| 2-Person Households | 56 (37.8%) | 27 (18.2%) |
| 3-Person Households | 6 (4.1%) | 0 (0.0%) |
| 4-Person Households | 5 (3.4%) | 0 (0.0%) |
| 5-Person Households | 4 (2.7%) | 0 (0.0%) |
| 6-Person Households | 0 (0.0%) | 0 (0.0%) |
| 7+ Person Households | 0 (0.0%) | 0 (0.0%) |
| Total | 71 (48.0%) | 77 (52.0%) |
Female Fertility in Puako
Fertility by Age in Puako
Average fertility rate in Puako is 21.0 births per 1,000 women. Women in the age bracket of 35 to 50 years have the highest fertility rate with 56.0 births per 1,000 women. Women in the age bracket of 35 to 50 years acount for 100.0% of all women with births.
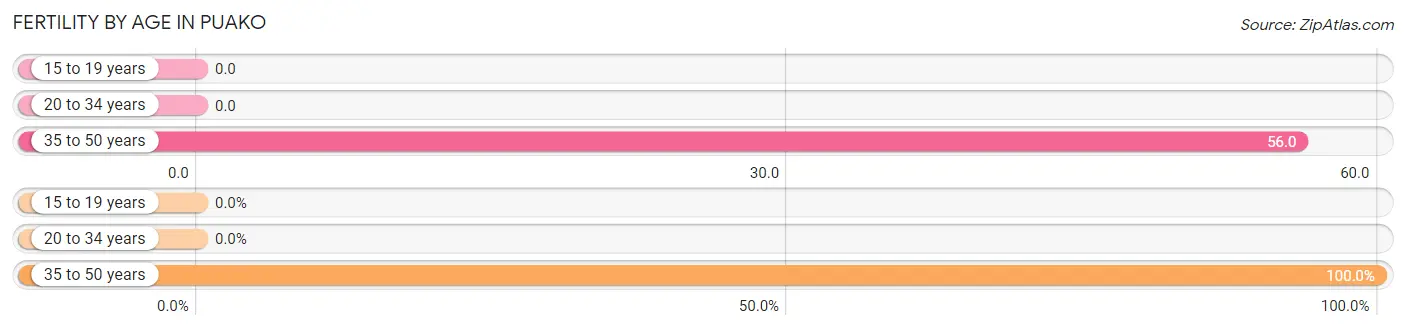
| Age Bracket | Women with Births | Births / 1,000 Women |
| 15 to 19 years | 0 (0.0%) | 0.0 |
| 20 to 34 years | 0 (0.0%) | 0.0 |
| 35 to 50 years | 1 (100.0%) | 56.0 |
| Total | 1 (100.0%) | 21.0 |
Fertility by Age by Marriage Status in Puako
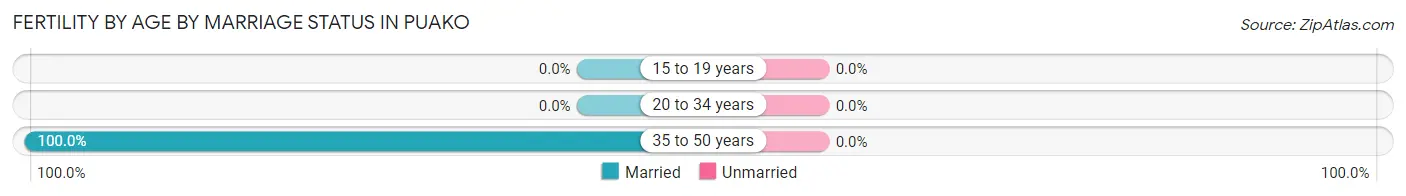
| Age Bracket | Married | Unmarried |
| 15 to 19 years | 0 (0.0%) | 0 (0.0%) |
| 20 to 34 years | 0 (0.0%) | 0 (0.0%) |
| 35 to 50 years | 1 (100.0%) | 0 (0.0%) |
| Total | 1 (100.0%) | 0 (0.0%) |
Fertility by Education in Puako
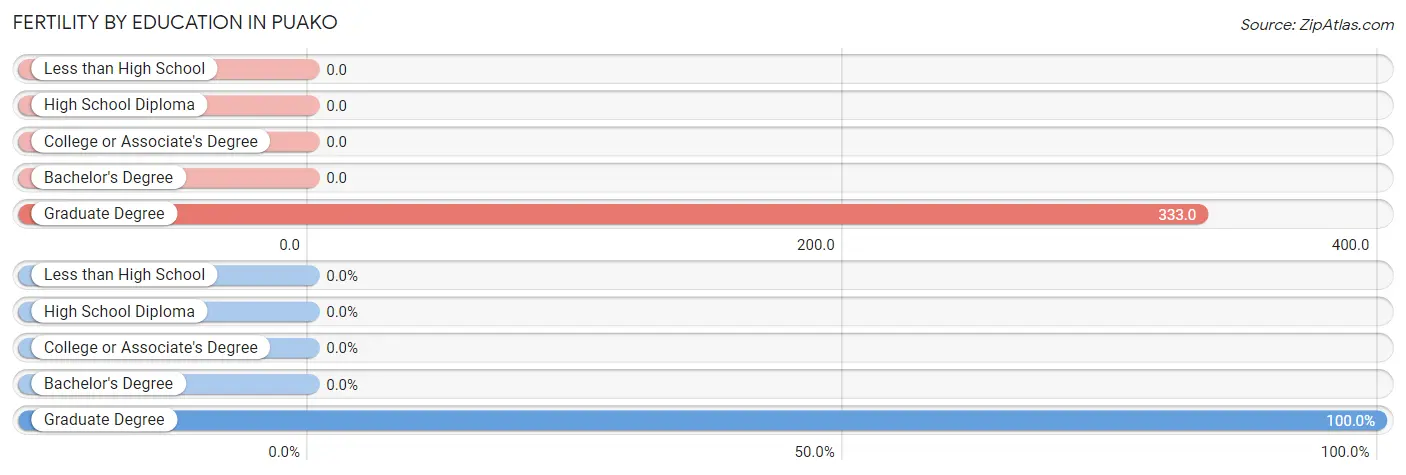
| Educational Attainment | Women with Births | Births / 1,000 Women |
| Less than High School | 0 (0.0%) | 0.0 |
| High School Diploma | 0 (0.0%) | 0.0 |
| College or Associate's Degree | 0 (0.0%) | 0.0 |
| Bachelor's Degree | 0 (0.0%) | 0.0 |
| Graduate Degree | 1 (100.0%) | 333.0 |
| Total | 1 (100.0%) | 21.0 |
Fertility by Education by Marriage Status in Puako
| Educational Attainment | Married | Unmarried |
| Less than High School | 0 (0.0%) | 0 (0.0%) |
| High School Diploma | 0 (0.0%) | 0 (0.0%) |
| College or Associate's Degree | 0 (0.0%) | 0 (0.0%) |
| Bachelor's Degree | 0 (0.0%) | 0 (0.0%) |
| Graduate Degree | 1 (100.0%) | 0 (0.0%) |
| Total | 1 (100.0%) | 0 (0.0%) |
Employment Characteristics in Puako
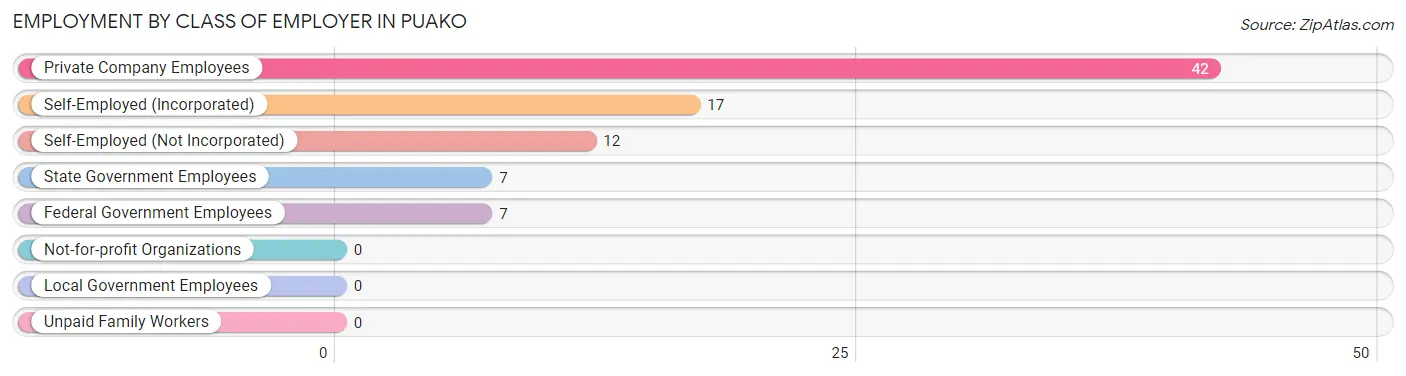
Employment by Class of Employer in Puako
Among the 85 employed individuals in Puako, private company employees (42 | 49.4%), self-employed (incorporated) (17 | 20.0%), and self-employed (not incorporated) (12 | 14.1%) make up the most common classes of employment.
| Employer Class | # Employees | % Employees |
| Private Company Employees | 42 | 49.4% |
| Self-Employed (Incorporated) | 17 | 20.0% |
| Self-Employed (Not Incorporated) | 12 | 14.1% |
| Not-for-profit Organizations | 0 | 0.0% |
| Local Government Employees | 0 | 0.0% |
| State Government Employees | 7 | 8.2% |
| Federal Government Employees | 7 | 8.2% |
| Unpaid Family Workers | 0 | 0.0% |
| Total | 85 | 100.0% |
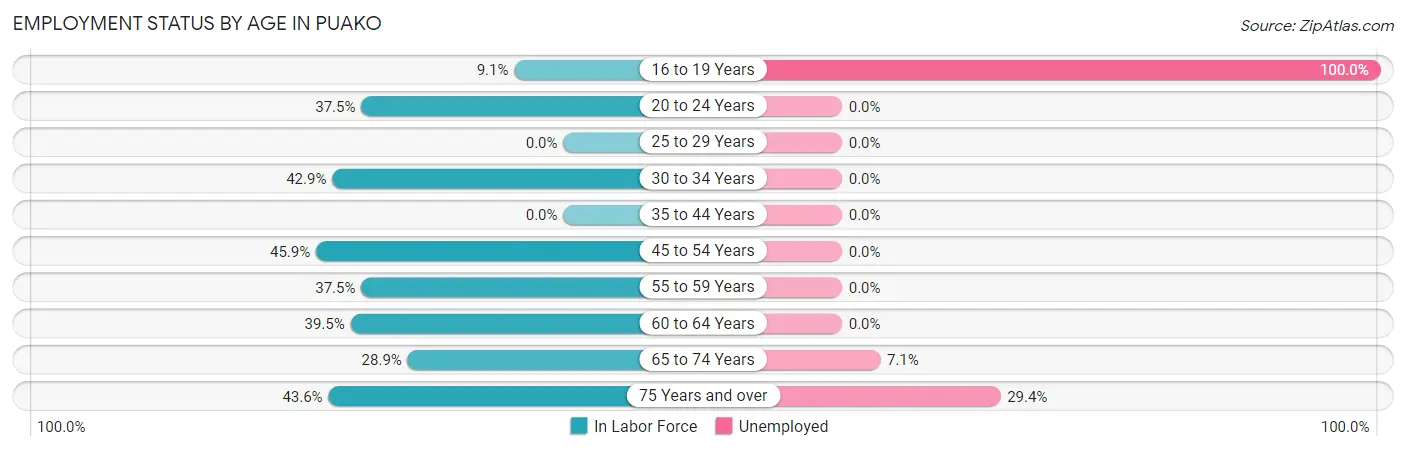
Employment Status by Age in Puako
According to the labor force statistics for Puako, out of the total population over 16 years of age (279), 33.7% or 94 individuals are in the labor force, with 9.6% or 9 of them unemployed. The age group with the highest labor force participation rate is 45 to 54 years, with 45.9% or 17 individuals in the labor force. Within the labor force, the 16 to 19 years age range has the highest percentage of unemployed individuals, with 100.0% or 2 of them being unemployed.
| Age Bracket | In Labor Force | Unemployed |
| 16 to 19 Years | 2 (9.1%) | 2 (100.0%) |
| 20 to 24 Years | 3 (37.5%) | 0 (0.0%) |
| 25 to 29 Years | 0 (0.0%) | 0 (0.0%) |
| 30 to 34 Years | 3 (42.9%) | 0 (0.0%) |
| 35 to 44 Years | 0 (0.0%) | 0 (0.0%) |
| 45 to 54 Years | 17 (45.9%) | 0 (0.0%) |
| 55 to 59 Years | 9 (37.5%) | 0 (0.0%) |
| 60 to 64 Years | 15 (39.5%) | 0 (0.0%) |
| 65 to 74 Years | 28 (28.9%) | 2 (7.1%) |
| 75 Years and over | 17 (43.6%) | 5 (29.4%) |
| Total | 94 (33.7%) | 9 (9.6%) |
Employment Status by Educational Attainment in Puako
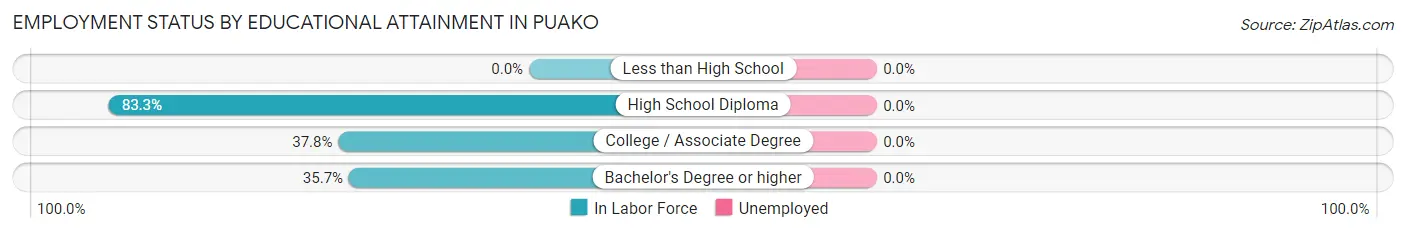
| Educational Attainment | In Labor Force | Unemployed |
| Less than High School | 0 (0.0%) | 0 (0.0%) |
| High School Diploma | 5 (83.3%) | 0 (0.0%) |
| College / Associate Degree | 14 (37.8%) | 0 (0.0%) |
| Bachelor's Degree or higher | 25 (35.7%) | 0 (0.0%) |
| Total | 44 (38.9%) | 0 (0.0%) |
Employment Occupations by Sex in Puako
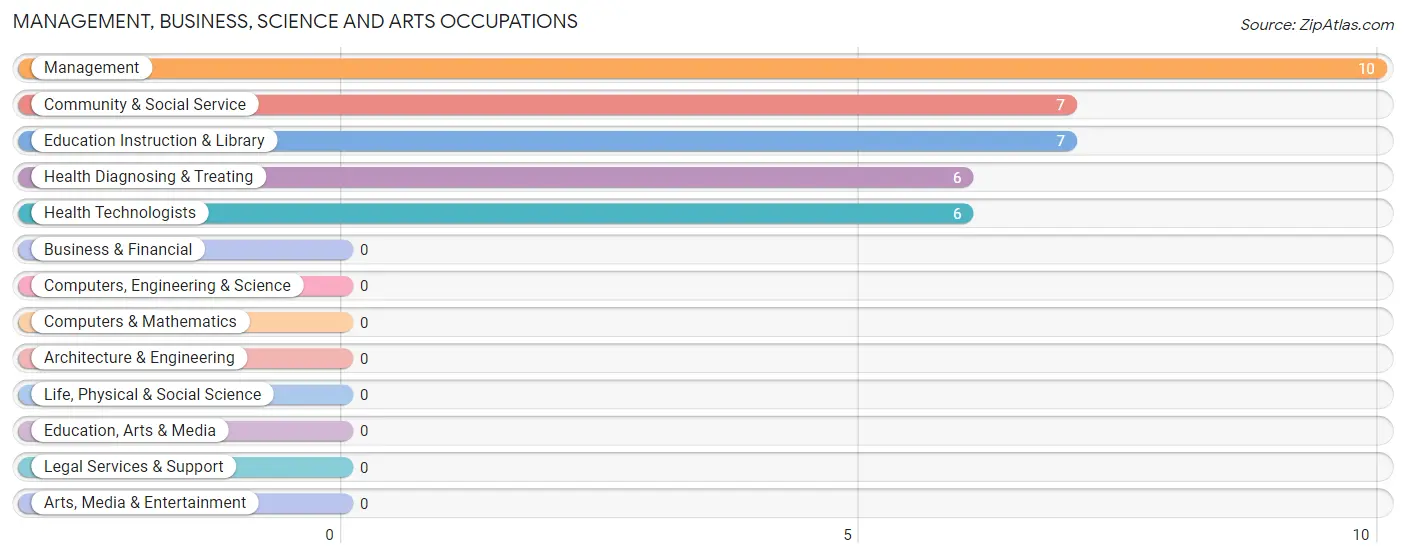
Management, Business, Science and Arts Occupations
The most common Management, Business, Science and Arts occupations in Puako are Management (10 | 11.8%), Community & Social Service (7 | 8.2%), Education Instruction & Library (7 | 8.2%), Health Diagnosing & Treating (6 | 7.1%), and Health Technologists (6 | 7.1%).
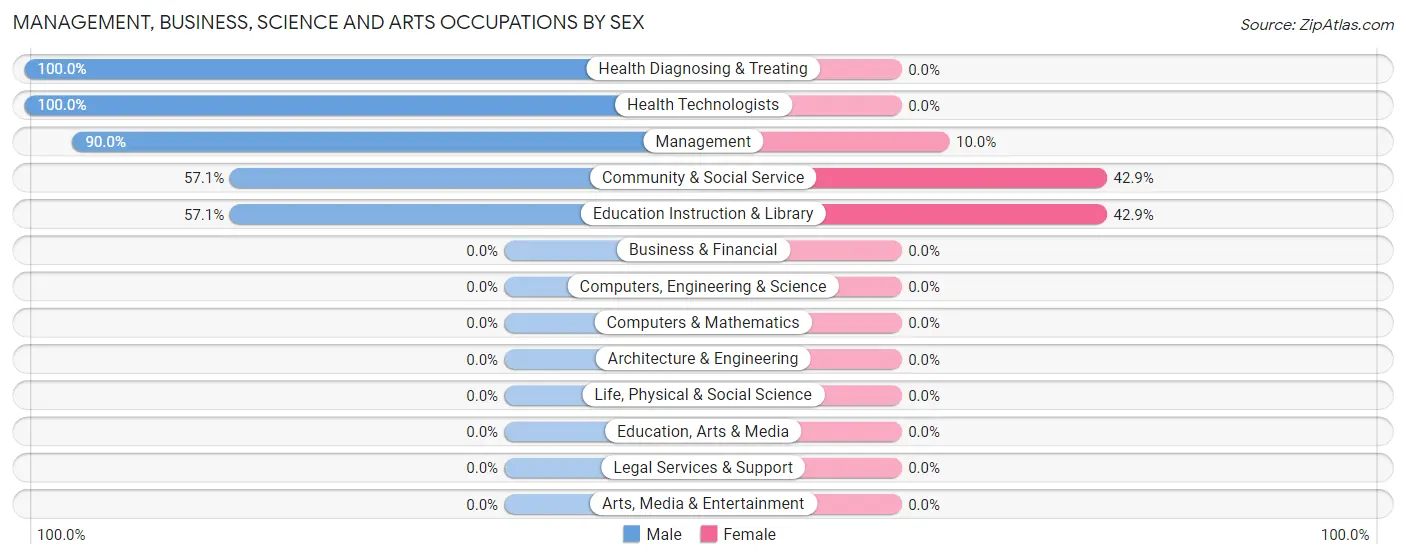
Management, Business, Science and Arts Occupations by Sex
Within the Management, Business, Science and Arts occupations in Puako, the most male-oriented occupations are Health Diagnosing & Treating (100.0%), Health Technologists (100.0%), and Management (90.0%), while the most female-oriented occupations are Community & Social Service (42.9%), Education Instruction & Library (42.9%), and Management (10.0%).
| Occupation | Male | Female |
| Management | 9 (90.0%) | 1 (10.0%) |
| Business & Financial | 0 (0.0%) | 0 (0.0%) |
| Computers, Engineering & Science | 0 (0.0%) | 0 (0.0%) |
| Computers & Mathematics | 0 (0.0%) | 0 (0.0%) |
| Architecture & Engineering | 0 (0.0%) | 0 (0.0%) |
| Life, Physical & Social Science | 0 (0.0%) | 0 (0.0%) |
| Community & Social Service | 4 (57.1%) | 3 (42.9%) |
| Education, Arts & Media | 0 (0.0%) | 0 (0.0%) |
| Legal Services & Support | 0 (0.0%) | 0 (0.0%) |
| Education Instruction & Library | 4 (57.1%) | 3 (42.9%) |
| Arts, Media & Entertainment | 0 (0.0%) | 0 (0.0%) |
| Health Diagnosing & Treating | 6 (100.0%) | 0 (0.0%) |
| Health Technologists | 6 (100.0%) | 0 (0.0%) |
| Total (Category) | 19 (82.6%) | 4 (17.4%) |
| Total (Overall) | 50 (58.8%) | 35 (41.2%) |
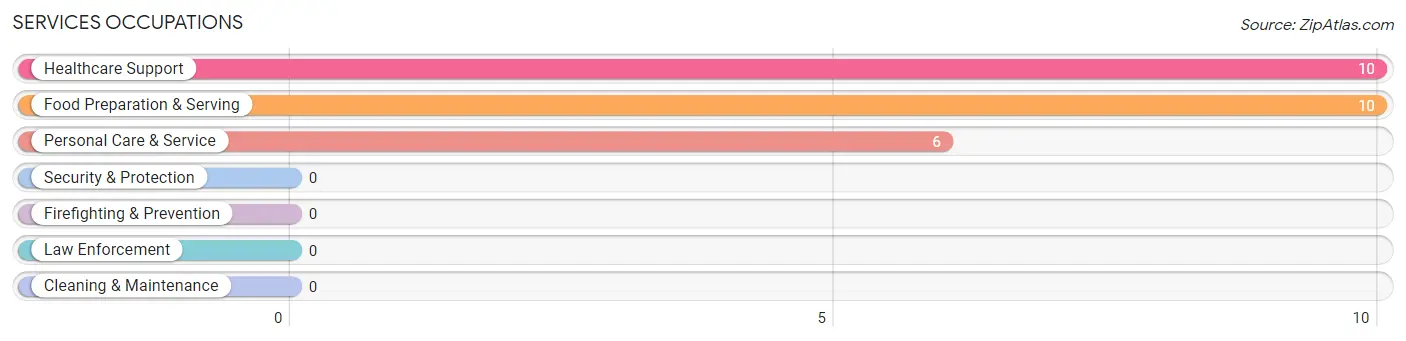
Services Occupations
The most common Services occupations in Puako are Healthcare Support (10 | 11.8%), Food Preparation & Serving (10 | 11.8%), and Personal Care & Service (6 | 7.1%).
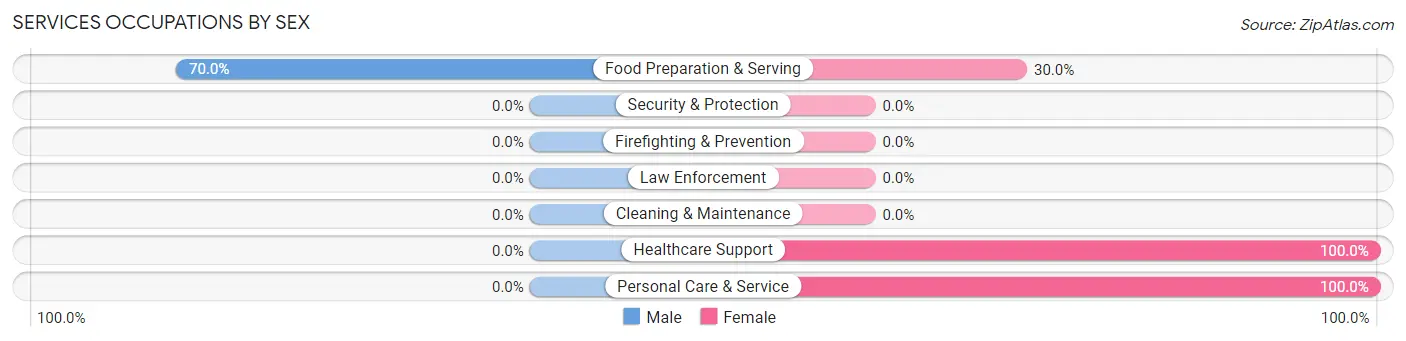
Services Occupations by Sex
| Occupation | Male | Female |
| Healthcare Support | 0 (0.0%) | 10 (100.0%) |
| Security & Protection | 0 (0.0%) | 0 (0.0%) |
| Firefighting & Prevention | 0 (0.0%) | 0 (0.0%) |
| Law Enforcement | 0 (0.0%) | 0 (0.0%) |
| Food Preparation & Serving | 7 (70.0%) | 3 (30.0%) |
| Cleaning & Maintenance | 0 (0.0%) | 0 (0.0%) |
| Personal Care & Service | 0 (0.0%) | 6 (100.0%) |
| Total (Category) | 7 (26.9%) | 19 (73.1%) |
| Total (Overall) | 50 (58.8%) | 35 (41.2%) |
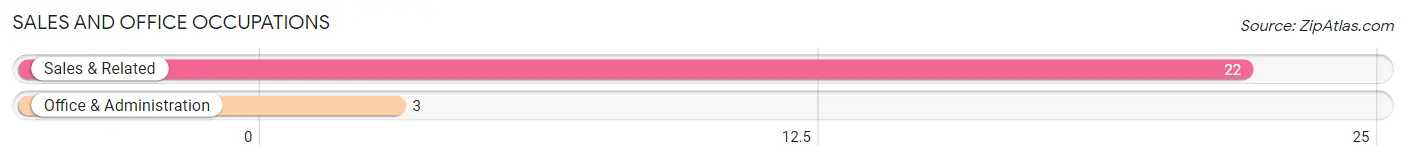
Sales and Office Occupations
The most common Sales and Office occupations in Puako are Sales & Related (22 | 25.9%), and Office & Administration (3 | 3.5%).
Sales and Office Occupations by Sex
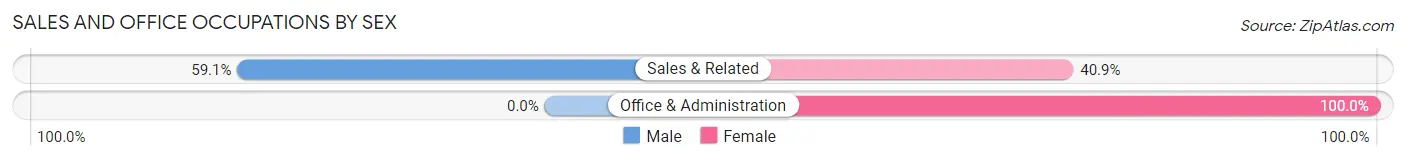
| Occupation | Male | Female |
| Sales & Related | 13 (59.1%) | 9 (40.9%) |
| Office & Administration | 0 (0.0%) | 3 (100.0%) |
| Total (Category) | 13 (52.0%) | 12 (48.0%) |
| Total (Overall) | 50 (58.8%) | 35 (41.2%) |
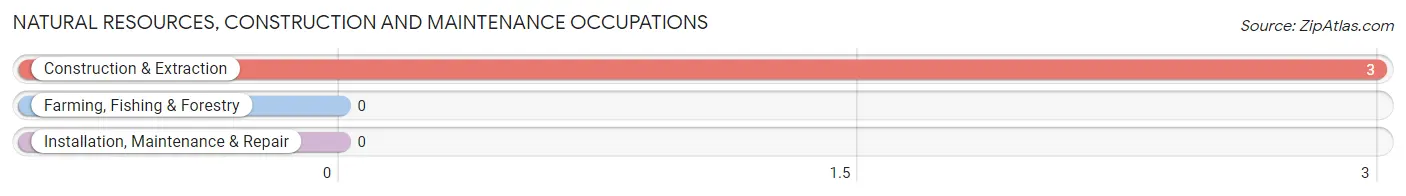
Natural Resources, Construction and Maintenance Occupations
The most common Natural Resources, Construction and Maintenance occupations in Puako are , and Construction & Extraction (3 | 3.5%).
Natural Resources, Construction and Maintenance Occupations by Sex
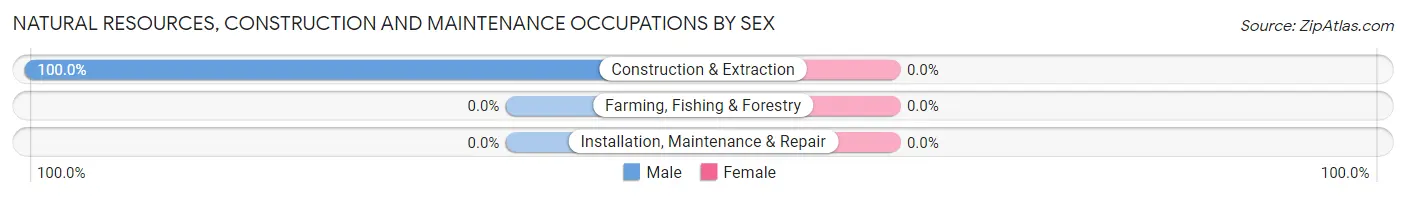
| Occupation | Male | Female |
| Farming, Fishing & Forestry | 0 (0.0%) | 0 (0.0%) |
| Construction & Extraction | 3 (100.0%) | 0 (0.0%) |
| Installation, Maintenance & Repair | 0 (0.0%) | 0 (0.0%) |
| Total (Category) | 3 (100.0%) | 0 (0.0%) |
| Total (Overall) | 50 (58.8%) | 35 (41.2%) |
Production, Transportation and Moving Occupations
The most common Production, Transportation and Moving occupations in Puako are , and Transportation (8 | 9.4%).
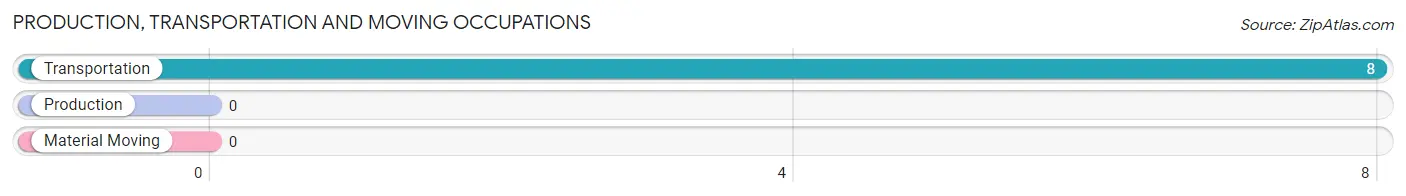
Production, Transportation and Moving Occupations by Sex
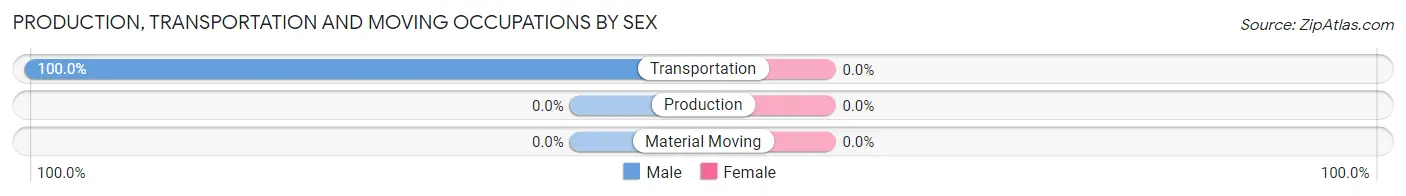
| Occupation | Male | Female |
| Production | 0 (0.0%) | 0 (0.0%) |
| Transportation | 8 (100.0%) | 0 (0.0%) |
| Material Moving | 0 (0.0%) | 0 (0.0%) |
| Total (Category) | 8 (100.0%) | 0 (0.0%) |
| Total (Overall) | 50 (58.8%) | 35 (41.2%) |
Employment Industries by Sex in Puako
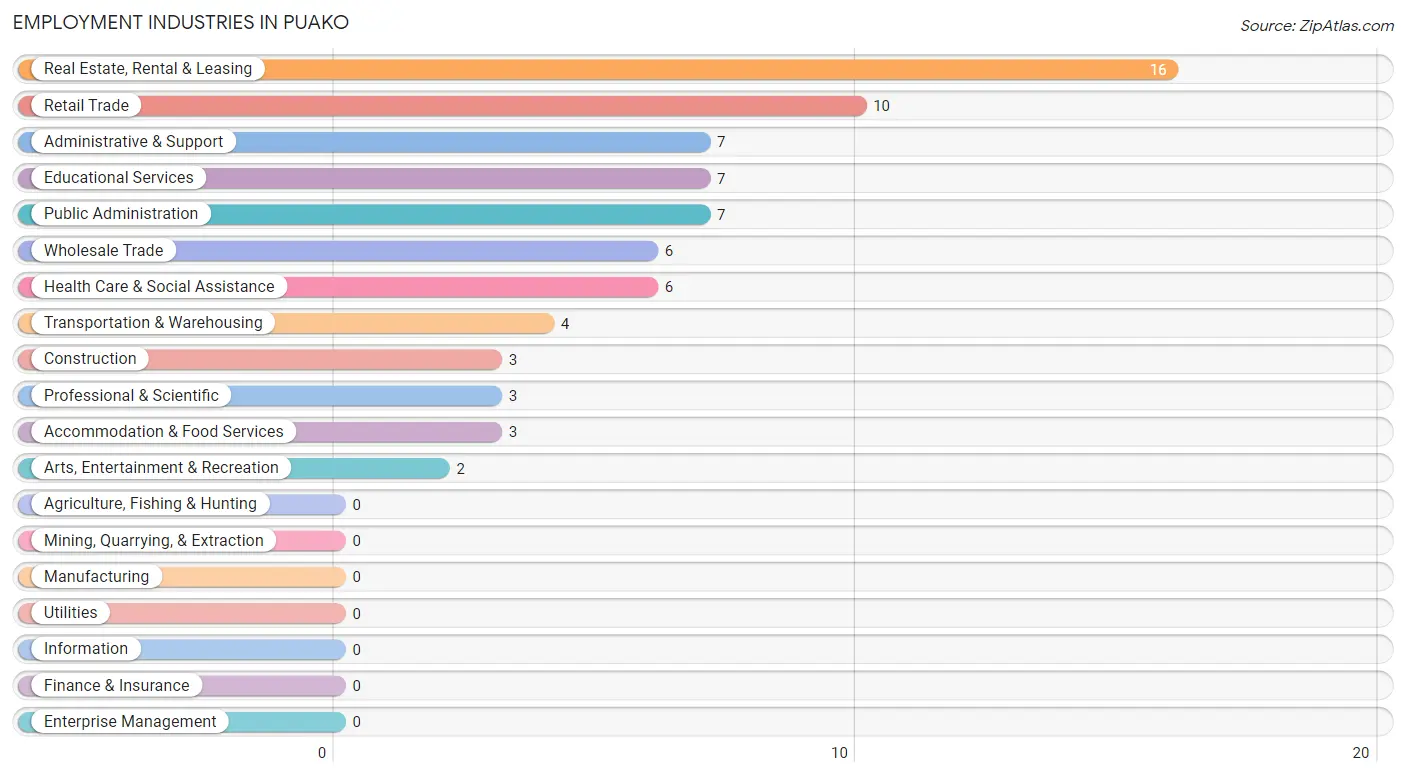
Employment Industries in Puako
The major employment industries in Puako include Real Estate, Rental & Leasing (16 | 18.8%), Retail Trade (10 | 11.8%), Administrative & Support (7 | 8.2%), Educational Services (7 | 8.2%), and Public Administration (7 | 8.2%).
Employment Industries by Sex in Puako
The Puako industries that see more men than women are Construction (100.0%), Wholesale Trade (100.0%), and Transportation & Warehousing (100.0%), whereas the industries that tend to have a higher number of women are Retail Trade (100.0%), Professional & Scientific (100.0%), and Arts, Entertainment & Recreation (100.0%).
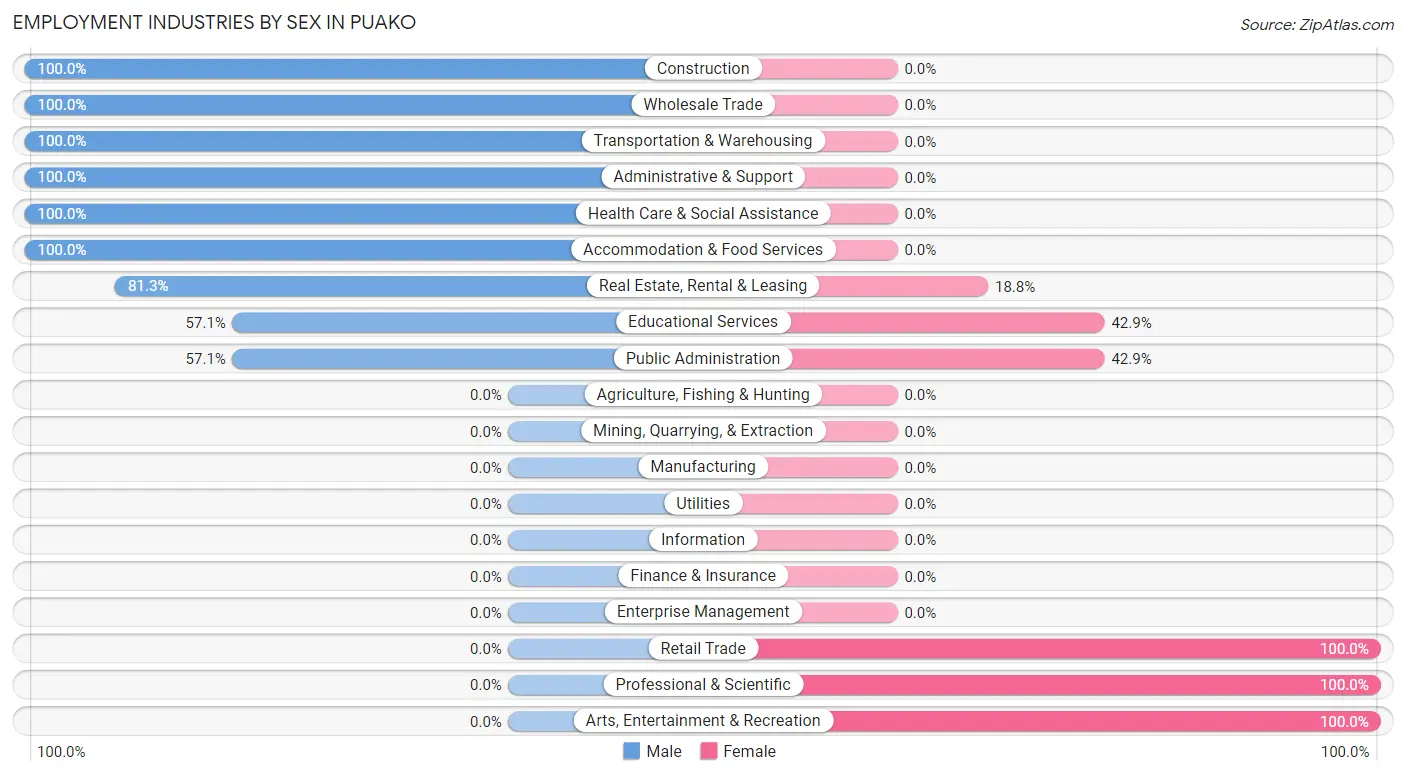
| Industry | Male | Female |
| Agriculture, Fishing & Hunting | 0 (0.0%) | 0 (0.0%) |
| Mining, Quarrying, & Extraction | 0 (0.0%) | 0 (0.0%) |
| Construction | 3 (100.0%) | 0 (0.0%) |
| Manufacturing | 0 (0.0%) | 0 (0.0%) |
| Wholesale Trade | 6 (100.0%) | 0 (0.0%) |
| Retail Trade | 0 (0.0%) | 10 (100.0%) |
| Transportation & Warehousing | 4 (100.0%) | 0 (0.0%) |
| Utilities | 0 (0.0%) | 0 (0.0%) |
| Information | 0 (0.0%) | 0 (0.0%) |
| Finance & Insurance | 0 (0.0%) | 0 (0.0%) |
| Real Estate, Rental & Leasing | 13 (81.2%) | 3 (18.8%) |
| Professional & Scientific | 0 (0.0%) | 3 (100.0%) |
| Enterprise Management | 0 (0.0%) | 0 (0.0%) |
| Administrative & Support | 7 (100.0%) | 0 (0.0%) |
| Educational Services | 4 (57.1%) | 3 (42.9%) |
| Health Care & Social Assistance | 6 (100.0%) | 0 (0.0%) |
| Arts, Entertainment & Recreation | 0 (0.0%) | 2 (100.0%) |
| Accommodation & Food Services | 3 (100.0%) | 0 (0.0%) |
| Public Administration | 4 (57.1%) | 3 (42.9%) |
| Total | 50 (58.8%) | 35 (41.2%) |
Education in Puako
School Enrollment in Puako
The most common levels of schooling among the 37 students in Puako are college / undergraduate (16 | 43.2%), elementary school (8 | 21.6%), and high school (8 | 21.6%).
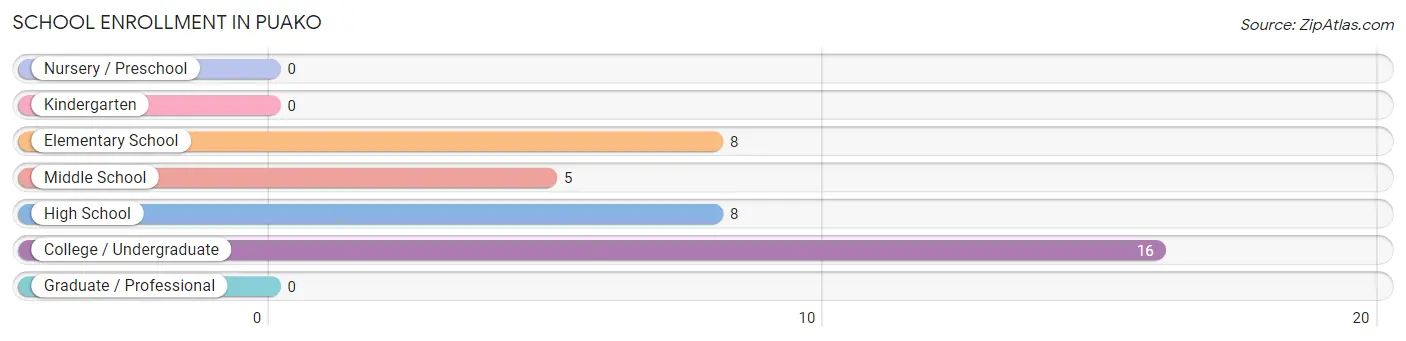
| School Level | # Students | % Students |
| Nursery / Preschool | 0 | 0.0% |
| Kindergarten | 0 | 0.0% |
| Elementary School | 8 | 21.6% |
| Middle School | 5 | 13.5% |
| High School | 8 | 21.6% |
| College / Undergraduate | 16 | 43.2% |
| Graduate / Professional | 0 | 0.0% |
| Total | 37 | 100.0% |
School Enrollment by Age by Funding Source in Puako
Out of a total of 37 students who are enrolled in schools in Puako, 32 (86.5%) attend a private institution, while the remaining 5 (13.5%) are enrolled in public schools. The age group of 10 to 14 year olds has the highest likelihood of being enrolled in private schools, with 5 (100.0% in the age bracket) enrolled. Conversely, the age group of 20 to 24 year olds has the lowest likelihood of being enrolled in a private school, with 2 (100.0% in the age bracket) attending a public institution.
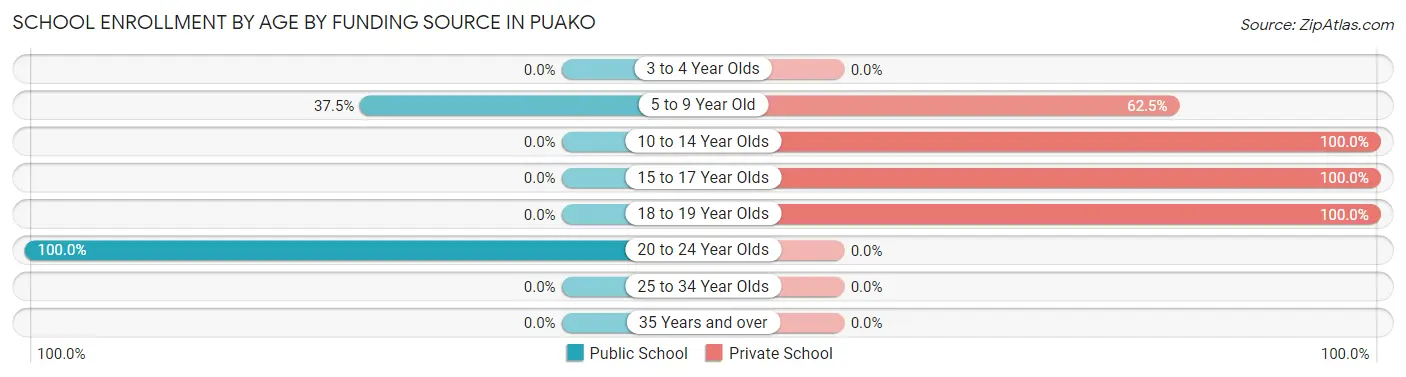
| Age Bracket | Public School | Private School |
| 3 to 4 Year Olds | 0 (0.0%) | 0 (0.0%) |
| 5 to 9 Year Old | 3 (37.5%) | 5 (62.5%) |
| 10 to 14 Year Olds | 0 (0.0%) | 5 (100.0%) |
| 15 to 17 Year Olds | 0 (0.0%) | 8 (100.0%) |
| 18 to 19 Year Olds | 0 (0.0%) | 14 (100.0%) |
| 20 to 24 Year Olds | 2 (100.0%) | 0 (0.0%) |
| 25 to 34 Year Olds | 0 (0.0%) | 0 (0.0%) |
| 35 Years and over | 0 (0.0%) | 0 (0.0%) |
| Total | 5 (13.5%) | 32 (86.5%) |
Educational Attainment by Field of Study in Puako
Business (27 | 18.0%), bio, nature & agricultural (22 | 14.7%), education (20 | 13.3%), science & technology (16 | 10.7%), and engineering (15 | 10.0%) are the most common fields of study among 150 individuals in Puako who have obtained a bachelor's degree or higher.
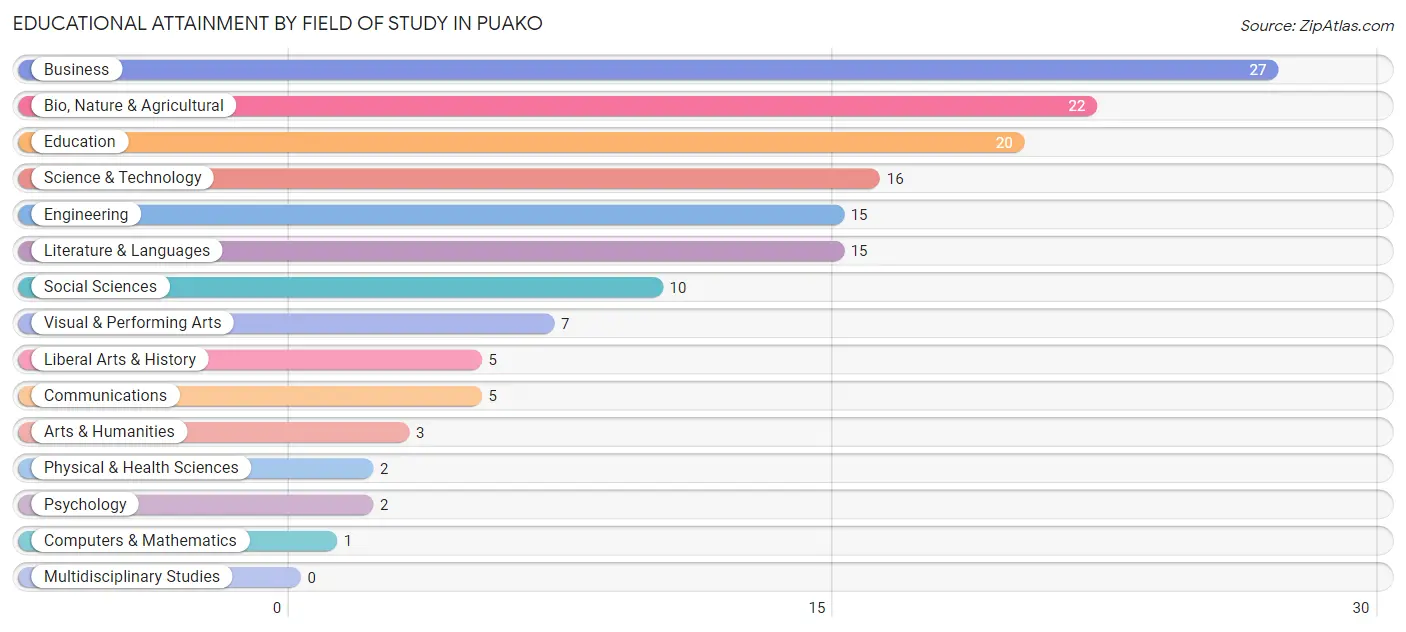
| Field of Study | # Graduates | % Graduates |
| Computers & Mathematics | 1 | 0.7% |
| Bio, Nature & Agricultural | 22 | 14.7% |
| Physical & Health Sciences | 2 | 1.3% |
| Psychology | 2 | 1.3% |
| Social Sciences | 10 | 6.7% |
| Engineering | 15 | 10.0% |
| Multidisciplinary Studies | 0 | 0.0% |
| Science & Technology | 16 | 10.7% |
| Business | 27 | 18.0% |
| Education | 20 | 13.3% |
| Literature & Languages | 15 | 10.0% |
| Liberal Arts & History | 5 | 3.3% |
| Visual & Performing Arts | 7 | 4.7% |
| Communications | 5 | 3.3% |
| Arts & Humanities | 3 | 2.0% |
| Total | 150 | 100.0% |
Transportation & Commute in Puako
Vehicle Availability by Sex in Puako
The most prevalent vehicle ownership categories in Puako are males with 1 vehicle (21, accounting for 42.0%) and females with 1 vehicle (9, making up 60.0%).
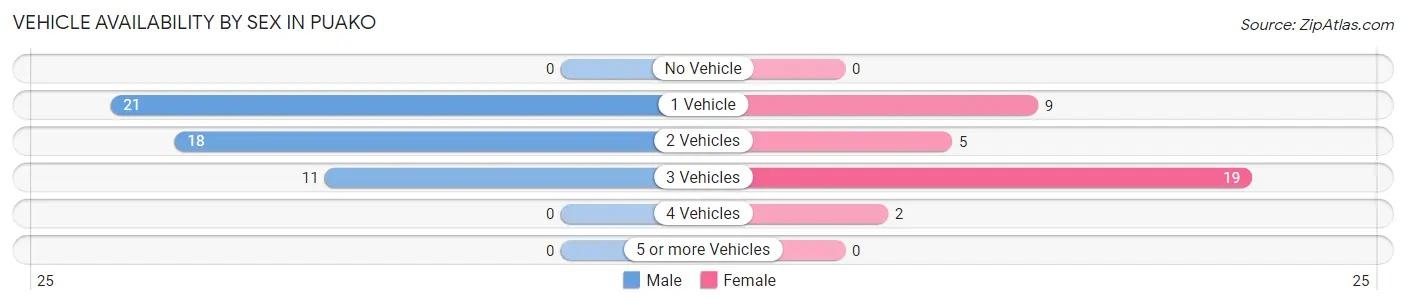
| Vehicles Available | Male | Female |
| No Vehicle | 0 (0.0%) | 0 (0.0%) |
| 1 Vehicle | 21 (42.0%) | 9 (25.7%) |
| 2 Vehicles | 18 (36.0%) | 5 (14.3%) |
| 3 Vehicles | 11 (22.0%) | 19 (54.3%) |
| 4 Vehicles | 0 (0.0%) | 2 (5.7%) |
| 5 or more Vehicles | 0 (0.0%) | 0 (0.0%) |
| Total | 50 (100.0%) | 35 (100.0%) |
Commute Time in Puako
The most frequently occuring commute durations in Puako are 30 to 34 minutes (14 commuters, 19.7%), 25 to 29 minutes (13 commuters, 18.3%), and 20 to 24 minutes (12 commuters, 16.9%).
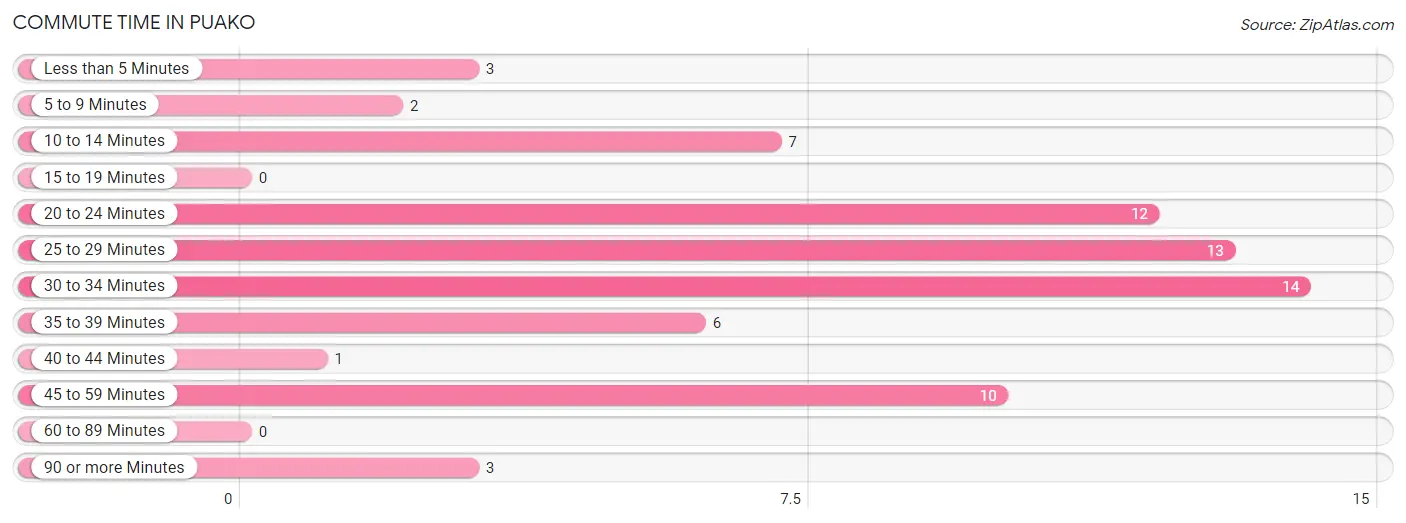
| Commute Time | # Commuters | % Commuters |
| Less than 5 Minutes | 3 | 4.2% |
| 5 to 9 Minutes | 2 | 2.8% |
| 10 to 14 Minutes | 7 | 9.9% |
| 15 to 19 Minutes | 0 | 0.0% |
| 20 to 24 Minutes | 12 | 16.9% |
| 25 to 29 Minutes | 13 | 18.3% |
| 30 to 34 Minutes | 14 | 19.7% |
| 35 to 39 Minutes | 6 | 8.5% |
| 40 to 44 Minutes | 1 | 1.4% |
| 45 to 59 Minutes | 10 | 14.1% |
| 60 to 89 Minutes | 0 | 0.0% |
| 90 or more Minutes | 3 | 4.2% |
Commute Time by Sex in Puako
The most common commute times in Puako are 25 to 29 minutes (13 commuters, 30.9%) for males and 10 to 14 minutes (7 commuters, 24.1%) for females.
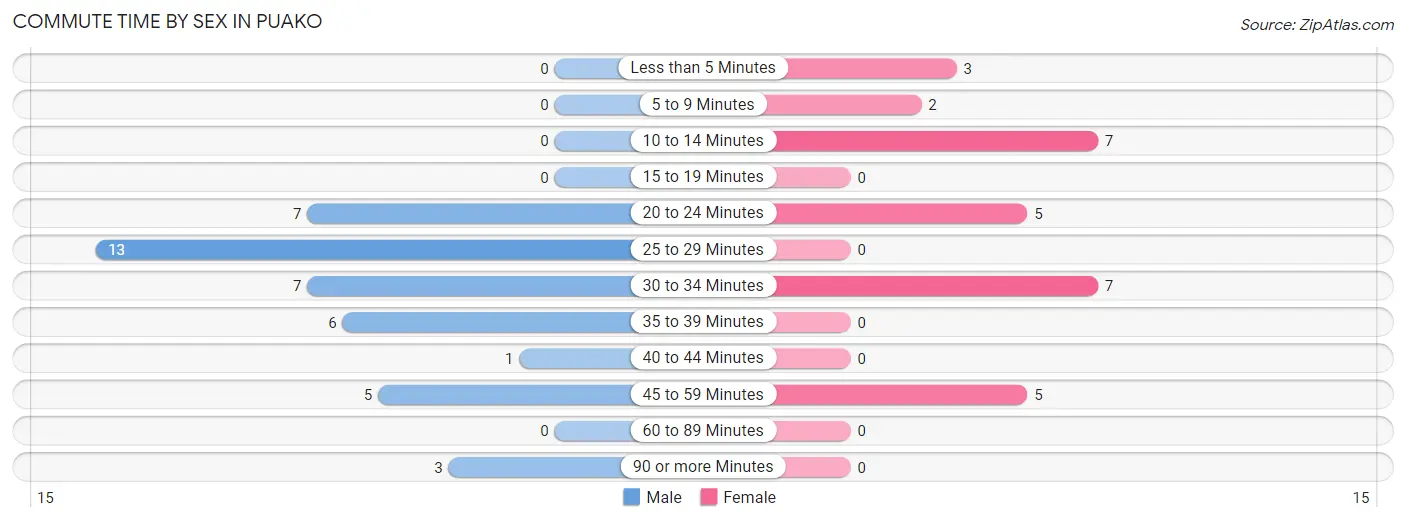
| Commute Time | Male | Female |
| Less than 5 Minutes | 0 (0.0%) | 3 (10.3%) |
| 5 to 9 Minutes | 0 (0.0%) | 2 (6.9%) |
| 10 to 14 Minutes | 0 (0.0%) | 7 (24.1%) |
| 15 to 19 Minutes | 0 (0.0%) | 0 (0.0%) |
| 20 to 24 Minutes | 7 (16.7%) | 5 (17.2%) |
| 25 to 29 Minutes | 13 (30.9%) | 0 (0.0%) |
| 30 to 34 Minutes | 7 (16.7%) | 7 (24.1%) |
| 35 to 39 Minutes | 6 (14.3%) | 0 (0.0%) |
| 40 to 44 Minutes | 1 (2.4%) | 0 (0.0%) |
| 45 to 59 Minutes | 5 (11.9%) | 5 (17.2%) |
| 60 to 89 Minutes | 0 (0.0%) | 0 (0.0%) |
| 90 or more Minutes | 3 (7.1%) | 0 (0.0%) |
Time of Departure to Work by Sex in Puako
The most frequent times of departure to work in Puako are 4:00 PM to 11:59 PM (14, 33.3%) for males and 6:00 AM to 6:29 AM (10, 34.5%) for females.
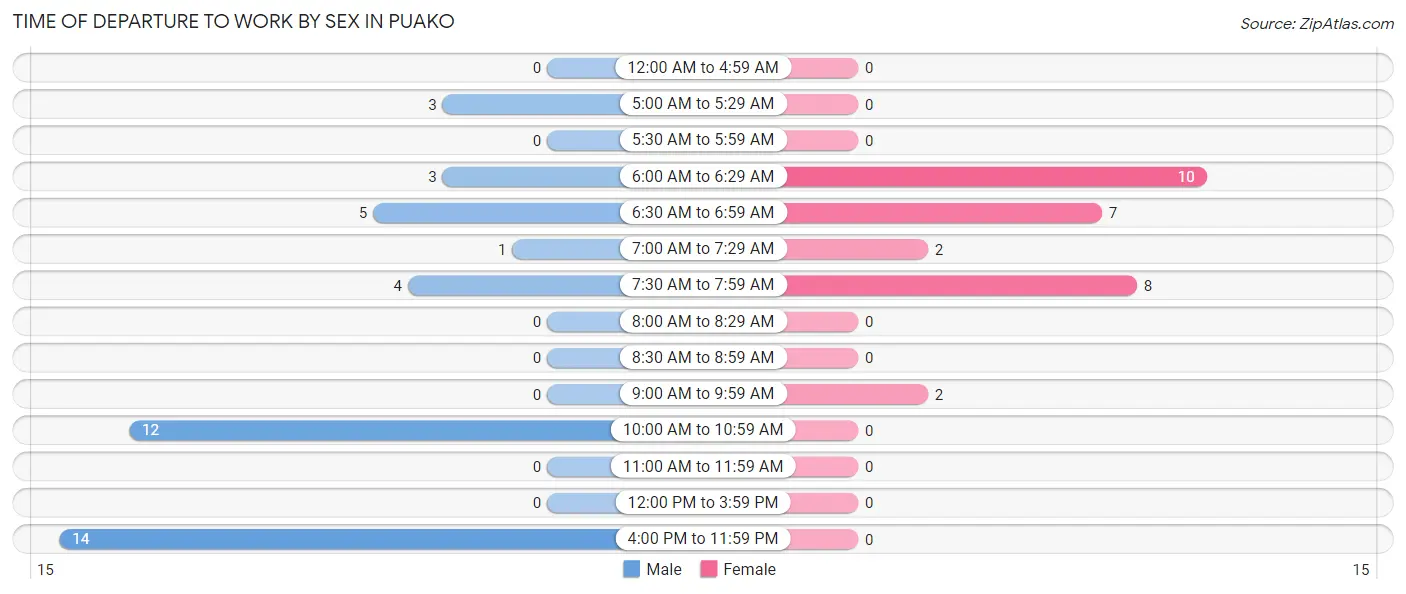
| Time of Departure | Male | Female |
| 12:00 AM to 4:59 AM | 0 (0.0%) | 0 (0.0%) |
| 5:00 AM to 5:29 AM | 3 (7.1%) | 0 (0.0%) |
| 5:30 AM to 5:59 AM | 0 (0.0%) | 0 (0.0%) |
| 6:00 AM to 6:29 AM | 3 (7.1%) | 10 (34.5%) |
| 6:30 AM to 6:59 AM | 5 (11.9%) | 7 (24.1%) |
| 7:00 AM to 7:29 AM | 1 (2.4%) | 2 (6.9%) |
| 7:30 AM to 7:59 AM | 4 (9.5%) | 8 (27.6%) |
| 8:00 AM to 8:29 AM | 0 (0.0%) | 0 (0.0%) |
| 8:30 AM to 8:59 AM | 0 (0.0%) | 0 (0.0%) |
| 9:00 AM to 9:59 AM | 0 (0.0%) | 2 (6.9%) |
| 10:00 AM to 10:59 AM | 12 (28.6%) | 0 (0.0%) |
| 11:00 AM to 11:59 AM | 0 (0.0%) | 0 (0.0%) |
| 12:00 PM to 3:59 PM | 0 (0.0%) | 0 (0.0%) |
| 4:00 PM to 11:59 PM | 14 (33.3%) | 0 (0.0%) |
| Total | 42 (100.0%) | 29 (100.0%) |
Housing Occupancy in Puako
Occupancy by Ownership in Puako
Of the total 148 dwellings in Puako, owner-occupied units account for 109 (73.7%), while renter-occupied units make up 39 (26.4%).
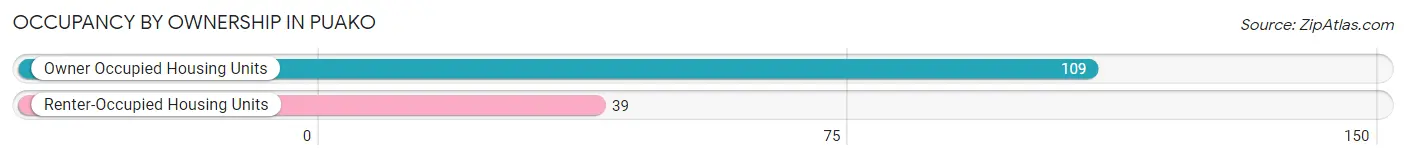
| Occupancy | # Housing Units | % Housing Units |
| Owner Occupied Housing Units | 109 | 73.7% |
| Renter-Occupied Housing Units | 39 | 26.4% |
| Total Occupied Housing Units | 148 | 100.0% |
Occupancy by Household Size in Puako
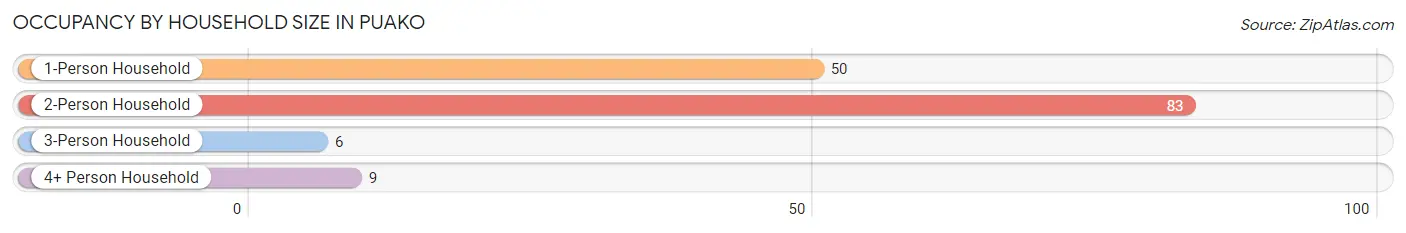
| Household Size | # Housing Units | % Housing Units |
| 1-Person Household | 50 | 33.8% |
| 2-Person Household | 83 | 56.1% |
| 3-Person Household | 6 | 4.1% |
| 4+ Person Household | 9 | 6.1% |
| Total Housing Units | 148 | 100.0% |
Occupancy by Ownership by Household Size in Puako
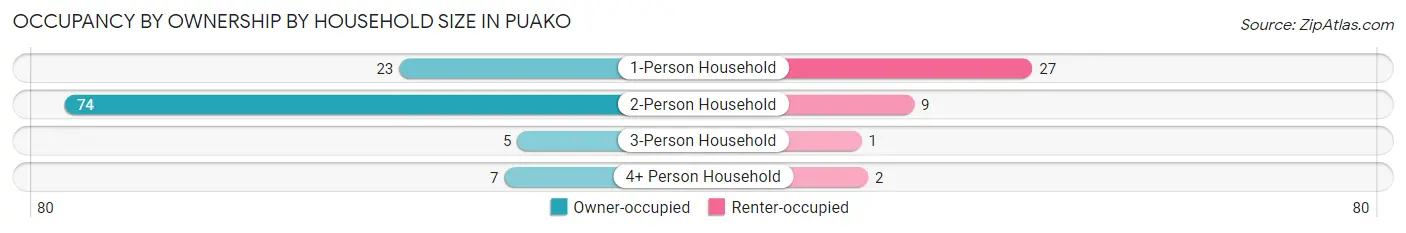
| Household Size | Owner-occupied | Renter-occupied |
| 1-Person Household | 23 (46.0%) | 27 (54.0%) |
| 2-Person Household | 74 (89.2%) | 9 (10.8%) |
| 3-Person Household | 5 (83.3%) | 1 (16.7%) |
| 4+ Person Household | 7 (77.8%) | 2 (22.2%) |
| Total Housing Units | 109 (73.7%) | 39 (26.4%) |
Occupancy by Educational Attainment in Puako
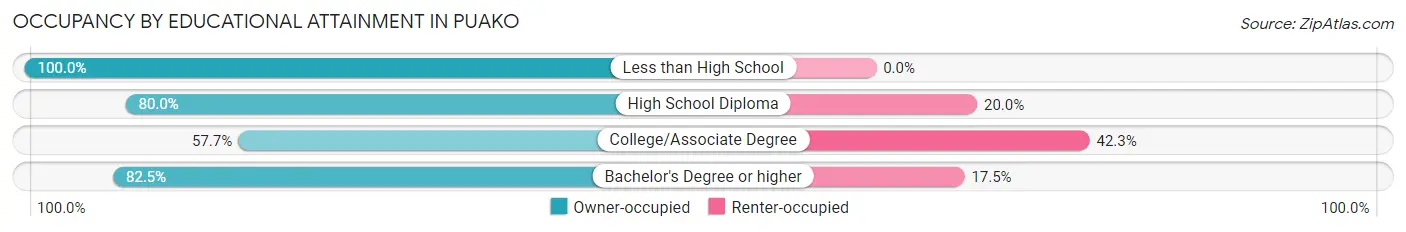
| Household Size | Owner-occupied | Renter-occupied |
| Less than High School | 1 (100.0%) | 0 (0.0%) |
| High School Diploma | 12 (80.0%) | 3 (20.0%) |
| College/Associate Degree | 30 (57.7%) | 22 (42.3%) |
| Bachelor's Degree or higher | 66 (82.5%) | 14 (17.5%) |
Occupancy by Age of Householder in Puako
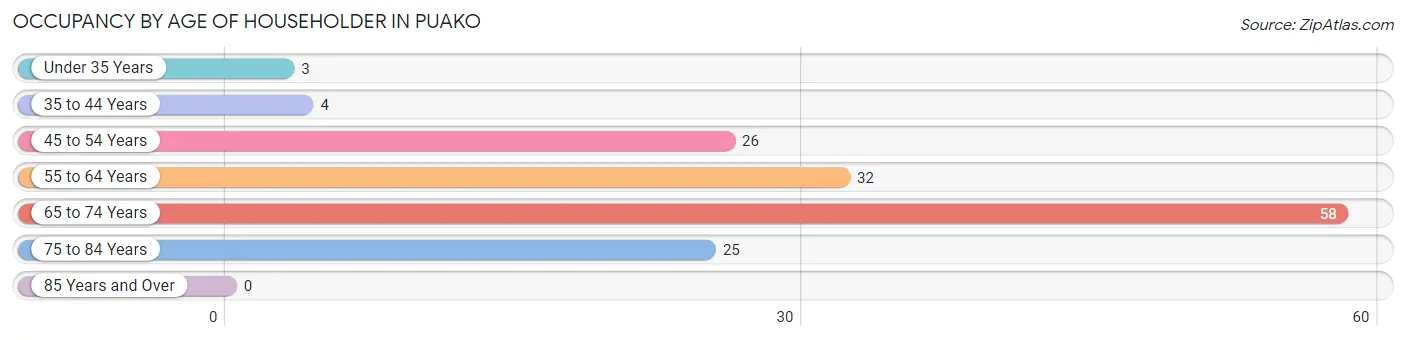
| Age Bracket | # Households | % Households |
| Under 35 Years | 3 | 2.0% |
| 35 to 44 Years | 4 | 2.7% |
| 45 to 54 Years | 26 | 17.6% |
| 55 to 64 Years | 32 | 21.6% |
| 65 to 74 Years | 58 | 39.2% |
| 75 to 84 Years | 25 | 16.9% |
| 85 Years and Over | 0 | 0.0% |
| Total | 148 | 100.0% |
Housing Finances in Puako
Median Income by Occupancy in Puako
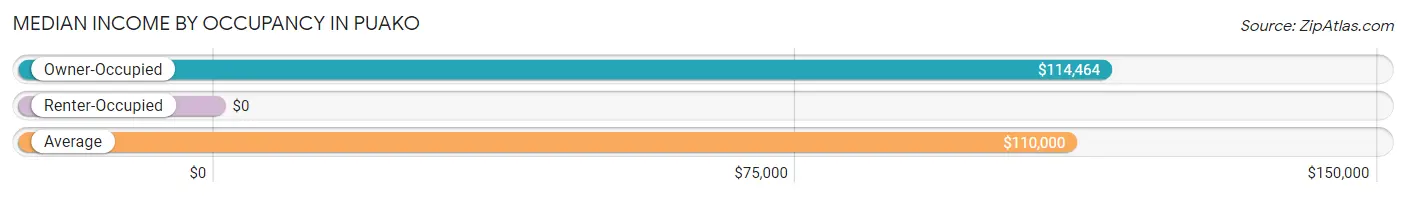
| Occupancy Type | # Households | Median Income |
| Owner-Occupied | 109 (73.7%) | $114,464 |
| Renter-Occupied | 39 (26.4%) | $0 |
| Average | 148 (100.0%) | $110,000 |
Occupancy by Householder Income Bracket in Puako
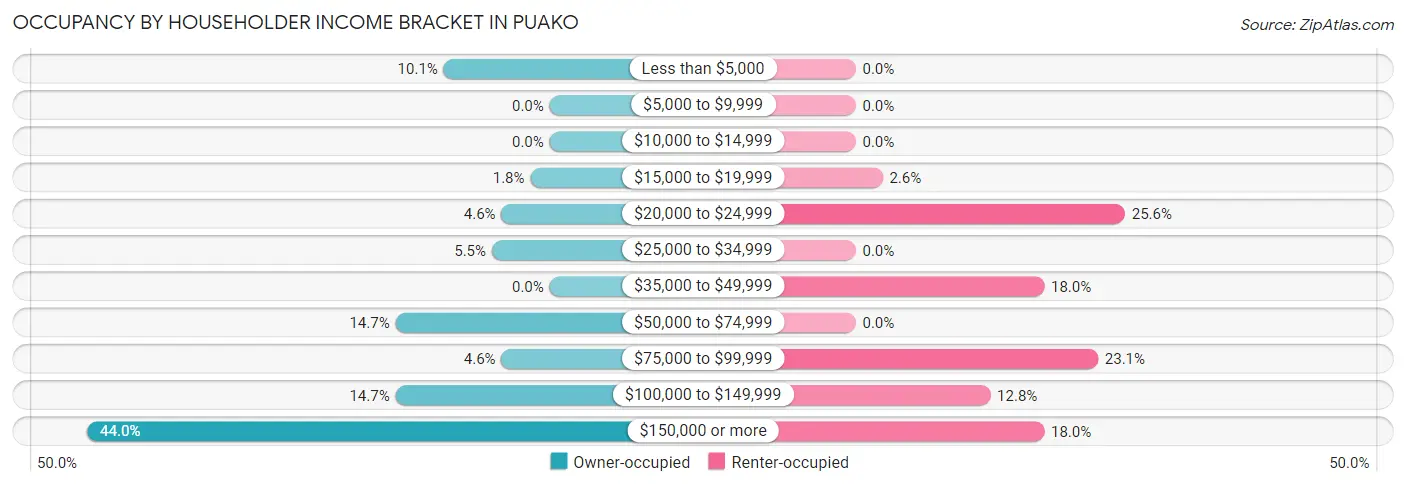
| Income Bracket | Owner-occupied | Renter-occupied |
| Less than $5,000 | 11 (10.1%) | 0 (0.0%) |
| $5,000 to $9,999 | 0 (0.0%) | 0 (0.0%) |
| $10,000 to $14,999 | 0 (0.0%) | 0 (0.0%) |
| $15,000 to $19,999 | 2 (1.8%) | 1 (2.6%) |
| $20,000 to $24,999 | 5 (4.6%) | 10 (25.6%) |
| $25,000 to $34,999 | 6 (5.5%) | 0 (0.0%) |
| $35,000 to $49,999 | 0 (0.0%) | 7 (17.9%) |
| $50,000 to $74,999 | 16 (14.7%) | 0 (0.0%) |
| $75,000 to $99,999 | 5 (4.6%) | 9 (23.1%) |
| $100,000 to $149,999 | 16 (14.7%) | 5 (12.8%) |
| $150,000 or more | 48 (44.0%) | 7 (17.9%) |
| Total | 109 (100.0%) | 39 (100.0%) |
Monthly Housing Cost Tiers in Puako
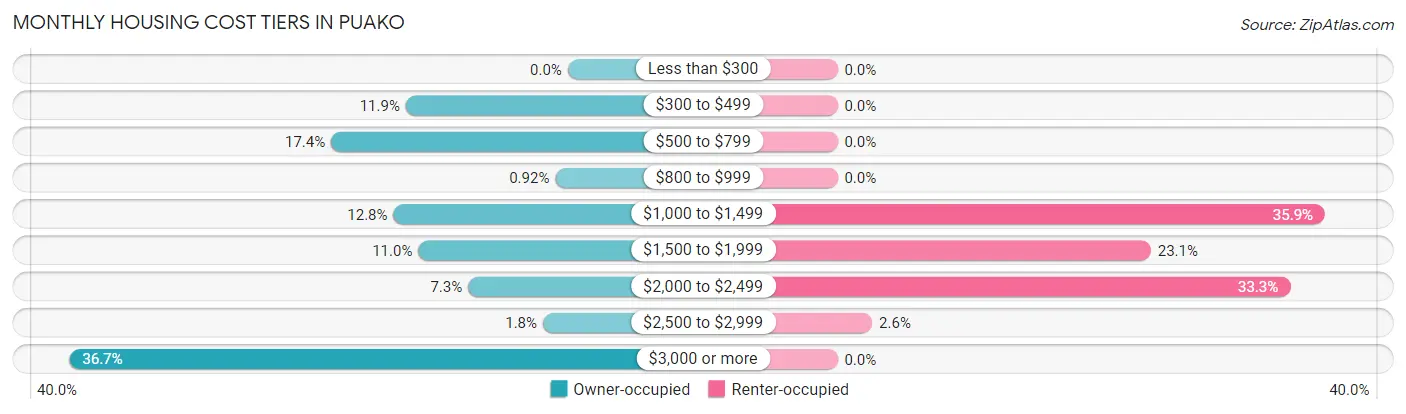
| Monthly Cost | Owner-occupied | Renter-occupied |
| Less than $300 | 0 (0.0%) | 0 (0.0%) |
| $300 to $499 | 13 (11.9%) | 0 (0.0%) |
| $500 to $799 | 19 (17.4%) | 0 (0.0%) |
| $800 to $999 | 1 (0.9%) | 0 (0.0%) |
| $1,000 to $1,499 | 14 (12.8%) | 14 (35.9%) |
| $1,500 to $1,999 | 12 (11.0%) | 9 (23.1%) |
| $2,000 to $2,499 | 8 (7.3%) | 13 (33.3%) |
| $2,500 to $2,999 | 2 (1.8%) | 1 (2.6%) |
| $3,000 or more | 40 (36.7%) | 0 (0.0%) |
| Total | 109 (100.0%) | 39 (100.0%) |
Physical Housing Characteristics in Puako
Housing Structures in Puako
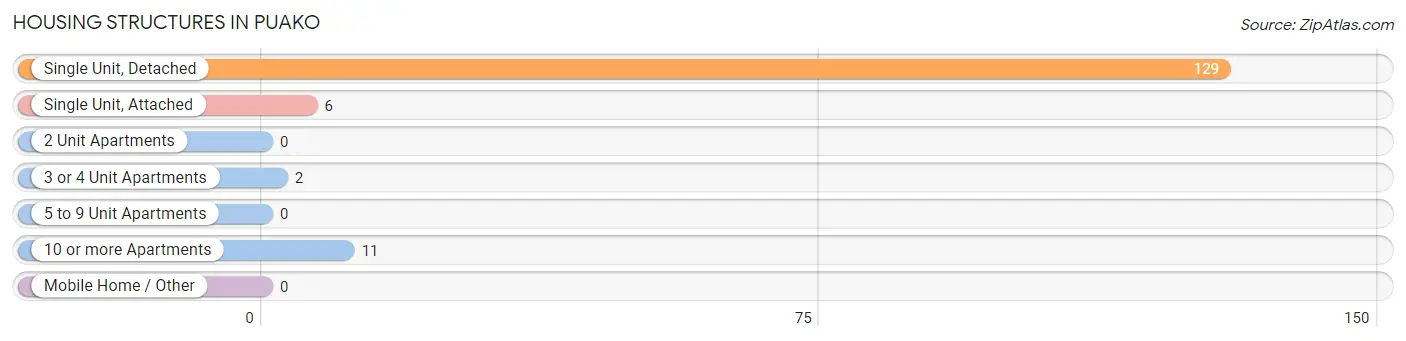
| Structure Type | # Housing Units | % Housing Units |
| Single Unit, Detached | 129 | 87.2% |
| Single Unit, Attached | 6 | 4.1% |
| 2 Unit Apartments | 0 | 0.0% |
| 3 or 4 Unit Apartments | 2 | 1.3% |
| 5 to 9 Unit Apartments | 0 | 0.0% |
| 10 or more Apartments | 11 | 7.4% |
| Mobile Home / Other | 0 | 0.0% |
| Total | 148 | 100.0% |
Housing Structures by Occupancy in Puako
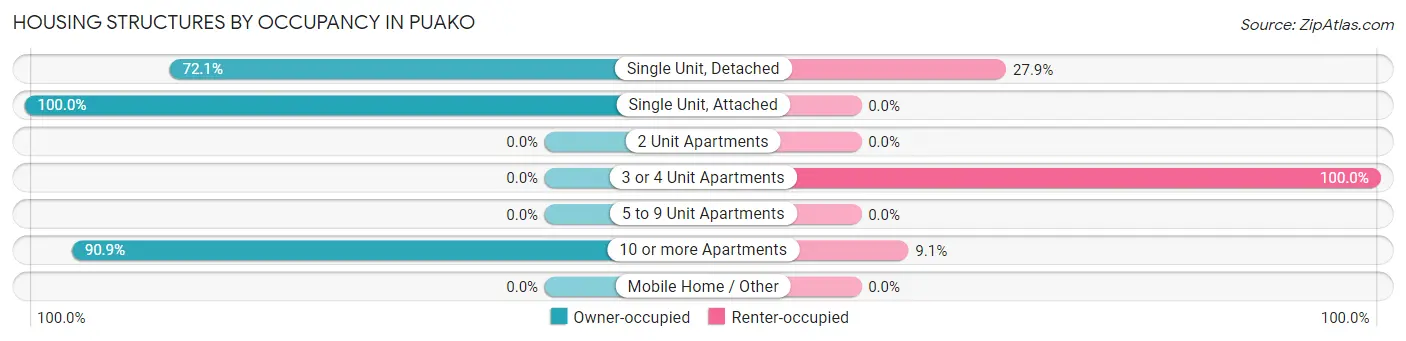
| Structure Type | Owner-occupied | Renter-occupied |
| Single Unit, Detached | 93 (72.1%) | 36 (27.9%) |
| Single Unit, Attached | 6 (100.0%) | 0 (0.0%) |
| 2 Unit Apartments | 0 (0.0%) | 0 (0.0%) |
| 3 or 4 Unit Apartments | 0 (0.0%) | 2 (100.0%) |
| 5 to 9 Unit Apartments | 0 (0.0%) | 0 (0.0%) |
| 10 or more Apartments | 10 (90.9%) | 1 (9.1%) |
| Mobile Home / Other | 0 (0.0%) | 0 (0.0%) |
| Total | 109 (73.7%) | 39 (26.4%) |
Housing Structures by Number of Rooms in Puako
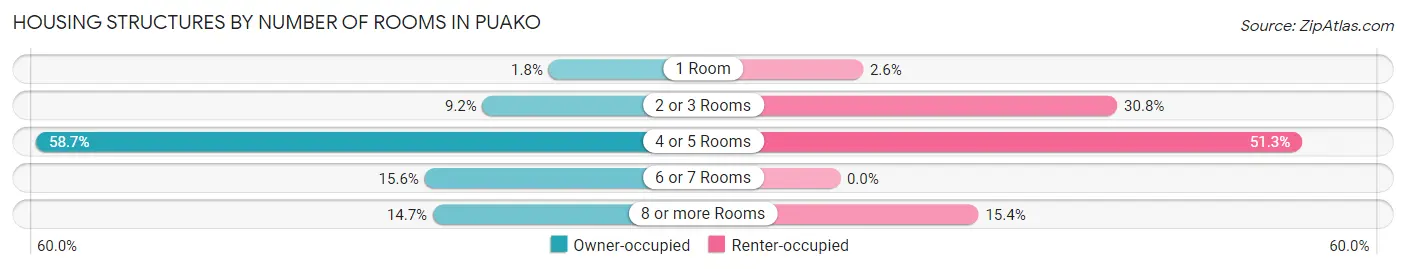
| Number of Rooms | Owner-occupied | Renter-occupied |
| 1 Room | 2 (1.8%) | 1 (2.6%) |
| 2 or 3 Rooms | 10 (9.2%) | 12 (30.8%) |
| 4 or 5 Rooms | 64 (58.7%) | 20 (51.3%) |
| 6 or 7 Rooms | 17 (15.6%) | 0 (0.0%) |
| 8 or more Rooms | 16 (14.7%) | 6 (15.4%) |
| Total | 109 (100.0%) | 39 (100.0%) |
Housing Structure by Heating Type in Puako
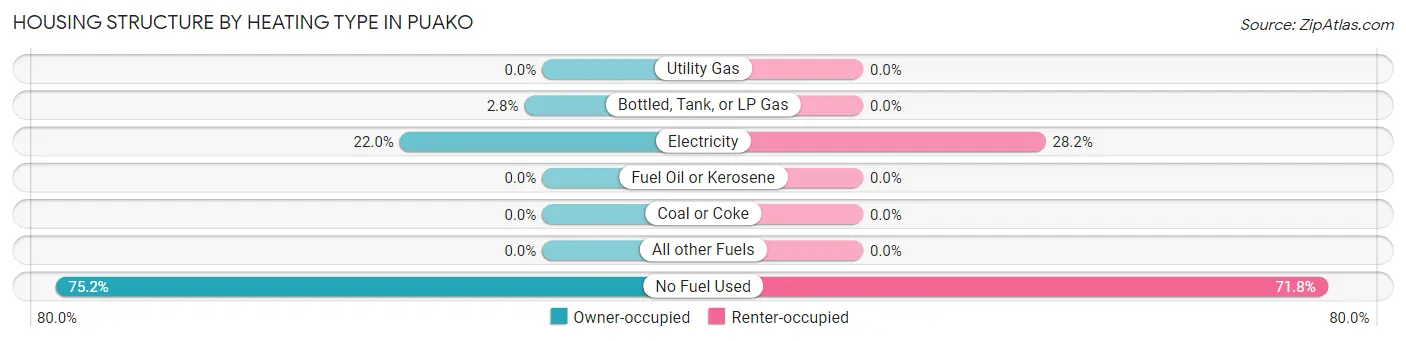
| Heating Type | Owner-occupied | Renter-occupied |
| Utility Gas | 0 (0.0%) | 0 (0.0%) |
| Bottled, Tank, or LP Gas | 3 (2.8%) | 0 (0.0%) |
| Electricity | 24 (22.0%) | 11 (28.2%) |
| Fuel Oil or Kerosene | 0 (0.0%) | 0 (0.0%) |
| Coal or Coke | 0 (0.0%) | 0 (0.0%) |
| All other Fuels | 0 (0.0%) | 0 (0.0%) |
| No Fuel Used | 82 (75.2%) | 28 (71.8%) |
| Total | 109 (100.0%) | 39 (100.0%) |
Household Vehicle Usage in Puako
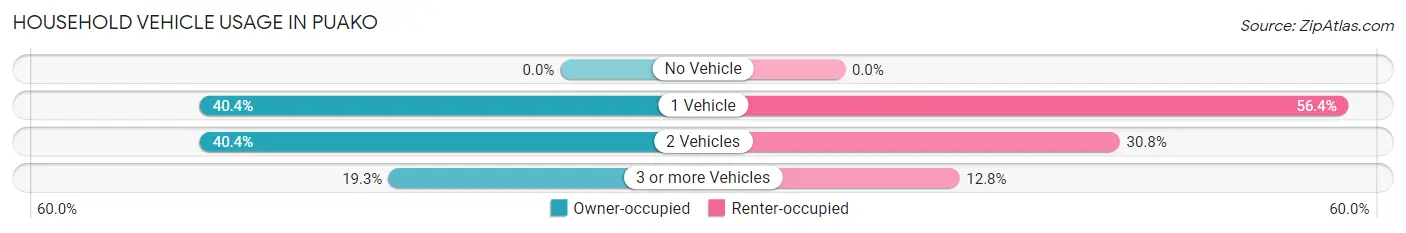
| Vehicles per Household | Owner-occupied | Renter-occupied |
| No Vehicle | 0 (0.0%) | 0 (0.0%) |
| 1 Vehicle | 44 (40.4%) | 22 (56.4%) |
| 2 Vehicles | 44 (40.4%) | 12 (30.8%) |
| 3 or more Vehicles | 21 (19.3%) | 5 (12.8%) |
| Total | 109 (100.0%) | 39 (100.0%) |
Real Estate & Mortgages in Puako
Real Estate and Mortgage Overview in Puako
| Characteristic | Without Mortgage | With Mortgage |
| Housing Units | 76 | 33 |
| Median Property Value | $1,250,000 | $1,152,800 |
| Median Household Income | $143,333 | $12 |
| Monthly Housing Costs | $1,360 | $22 |
| Real Estate Taxes | - | - |
Property Value by Mortgage Status in Puako
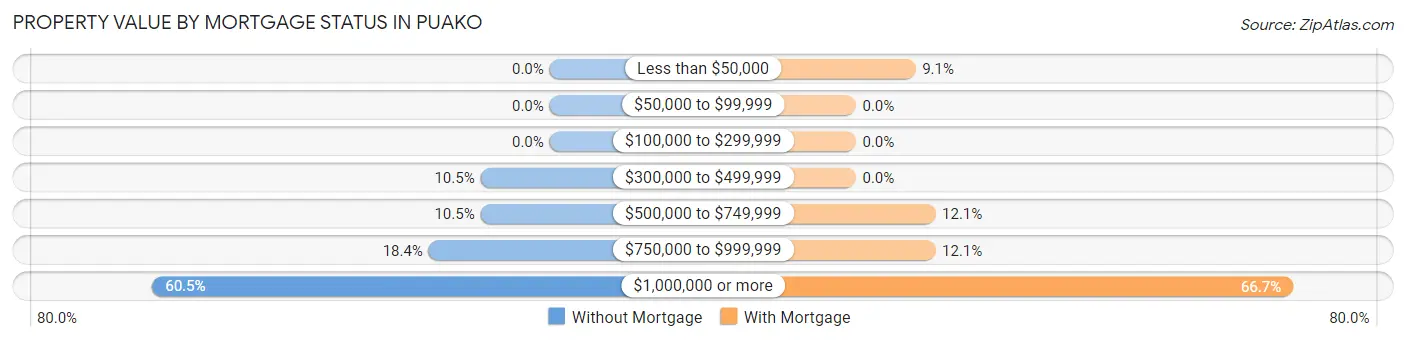
| Property Value | Without Mortgage | With Mortgage |
| Less than $50,000 | 0 (0.0%) | 3 (9.1%) |
| $50,000 to $99,999 | 0 (0.0%) | 0 (0.0%) |
| $100,000 to $299,999 | 0 (0.0%) | 0 (0.0%) |
| $300,000 to $499,999 | 8 (10.5%) | 0 (0.0%) |
| $500,000 to $749,999 | 8 (10.5%) | 4 (12.1%) |
| $750,000 to $999,999 | 14 (18.4%) | 4 (12.1%) |
| $1,000,000 or more | 46 (60.5%) | 22 (66.7%) |
| Total | 76 (100.0%) | 33 (100.0%) |
Household Income by Mortgage Status in Puako
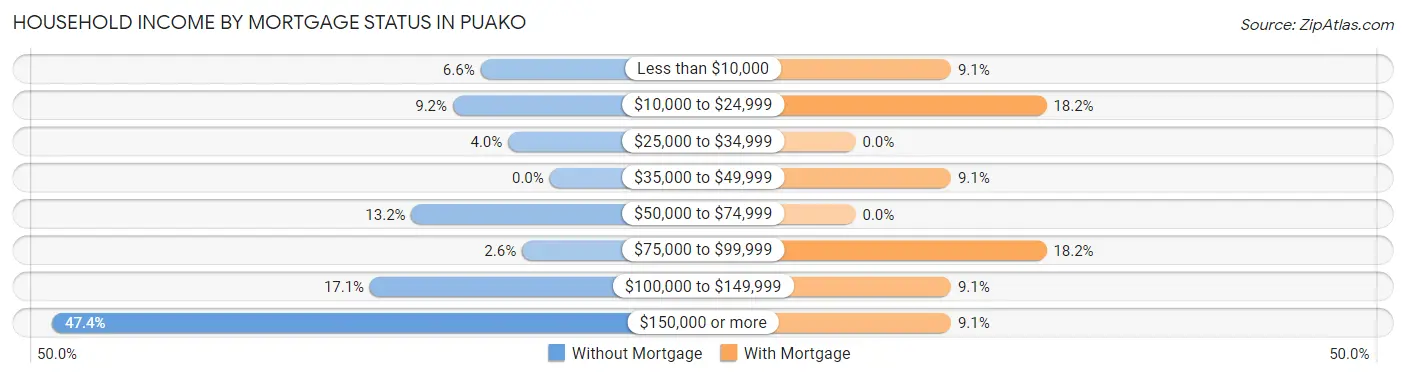
| Household Income | Without Mortgage | With Mortgage |
| Less than $10,000 | 5 (6.6%) | 3 (9.1%) |
| $10,000 to $24,999 | 7 (9.2%) | 6 (18.2%) |
| $25,000 to $34,999 | 3 (4.0%) | 0 (0.0%) |
| $35,000 to $49,999 | 0 (0.0%) | 3 (9.1%) |
| $50,000 to $74,999 | 10 (13.2%) | 0 (0.0%) |
| $75,000 to $99,999 | 2 (2.6%) | 6 (18.2%) |
| $100,000 to $149,999 | 13 (17.1%) | 3 (9.1%) |
| $150,000 or more | 36 (47.4%) | 3 (9.1%) |
| Total | 76 (100.0%) | 33 (100.0%) |
Property Value to Household Income Ratio in Puako
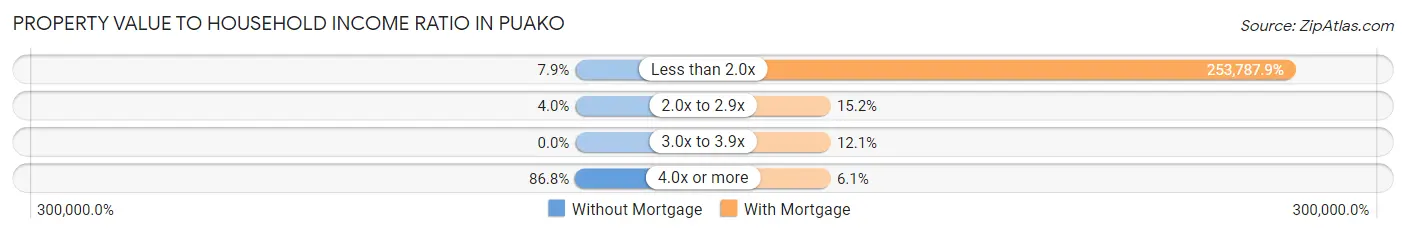
| Value-to-Income Ratio | Without Mortgage | With Mortgage |
| Less than 2.0x | 6 (7.9%) | 83,750 (253,787.9%) |
| 2.0x to 2.9x | 3 (4.0%) | 5 (15.1%) |
| 3.0x to 3.9x | 0 (0.0%) | 4 (12.1%) |
| 4.0x or more | 66 (86.8%) | 2 (6.1%) |
| Total | 76 (100.0%) | 33 (100.0%) |
Real Estate Taxes by Mortgage Status in Puako
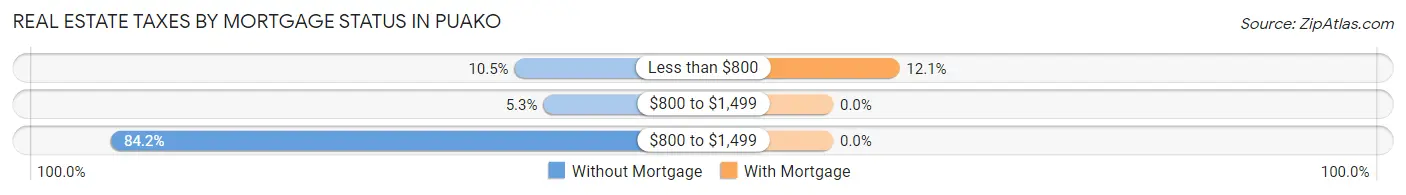
| Property Taxes | Without Mortgage | With Mortgage |
| Less than $800 | 8 (10.5%) | 4 (12.1%) |
| $800 to $1,499 | 4 (5.3%) | 0 (0.0%) |
| $800 to $1,499 | 64 (84.2%) | 0 (0.0%) |
| Total | 76 (100.0%) | 33 (100.0%) |
Health & Disability in Puako
Health Insurance Coverage by Age in Puako
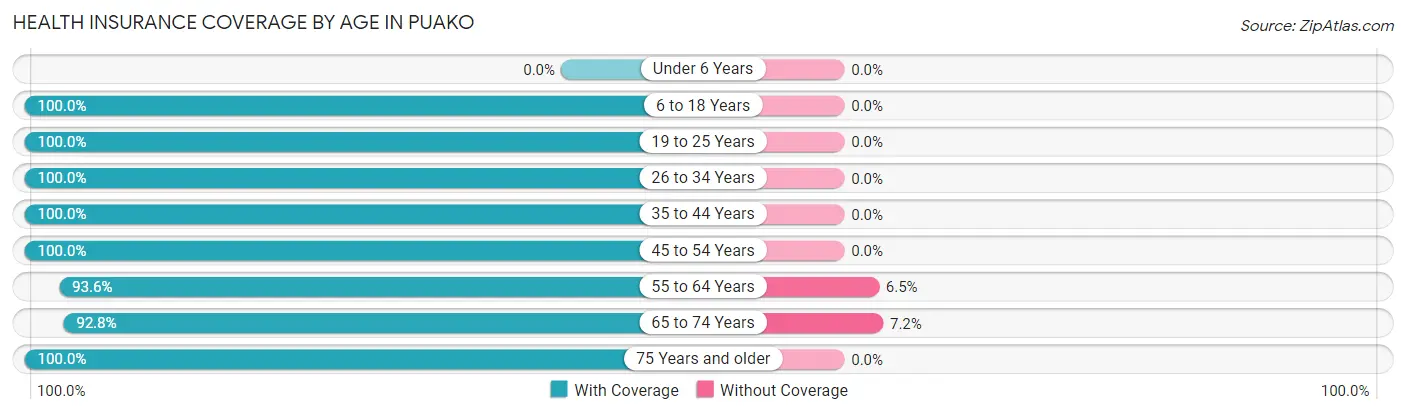
| Age Bracket | With Coverage | Without Coverage |
| Under 6 Years | 0 (0.0%) | 0 (0.0%) |
| 6 to 18 Years | 37 (100.0%) | 0 (0.0%) |
| 19 to 25 Years | 8 (100.0%) | 0 (0.0%) |
| 26 to 34 Years | 7 (100.0%) | 0 (0.0%) |
| 35 to 44 Years | 7 (100.0%) | 0 (0.0%) |
| 45 to 54 Years | 37 (100.0%) | 0 (0.0%) |
| 55 to 64 Years | 58 (93.5%) | 4 (6.5%) |
| 65 to 74 Years | 90 (92.8%) | 7 (7.2%) |
| 75 Years and older | 39 (100.0%) | 0 (0.0%) |
| Total | 283 (96.3%) | 11 (3.7%) |
Health Insurance Coverage by Citizenship Status in Puako
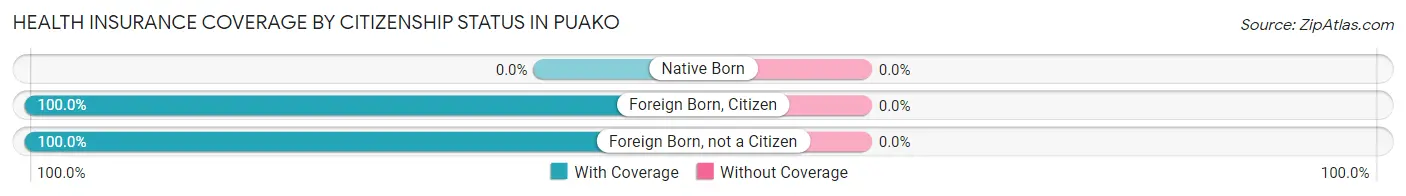
| Citizenship Status | With Coverage | Without Coverage |
| Native Born | 0 (0.0%) | 0 (0.0%) |
| Foreign Born, Citizen | 37 (100.0%) | 0 (0.0%) |
| Foreign Born, not a Citizen | 8 (100.0%) | 0 (0.0%) |
Health Insurance Coverage by Household Income in Puako
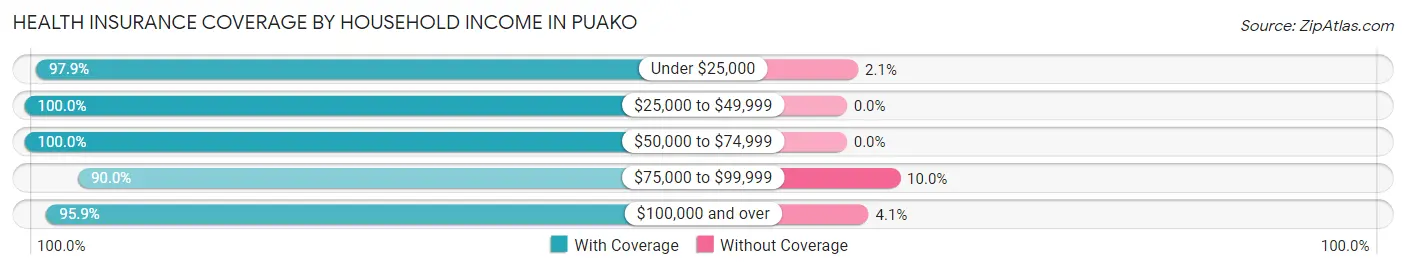
| Household Income | With Coverage | Without Coverage |
| Under $25,000 | 46 (97.9%) | 1 (2.1%) |
| $25,000 to $49,999 | 20 (100.0%) | 0 (0.0%) |
| $50,000 to $74,999 | 26 (100.0%) | 0 (0.0%) |
| $75,000 to $99,999 | 27 (90.0%) | 3 (10.0%) |
| $100,000 and over | 164 (95.9%) | 7 (4.1%) |
Public vs Private Health Insurance Coverage by Age in Puako
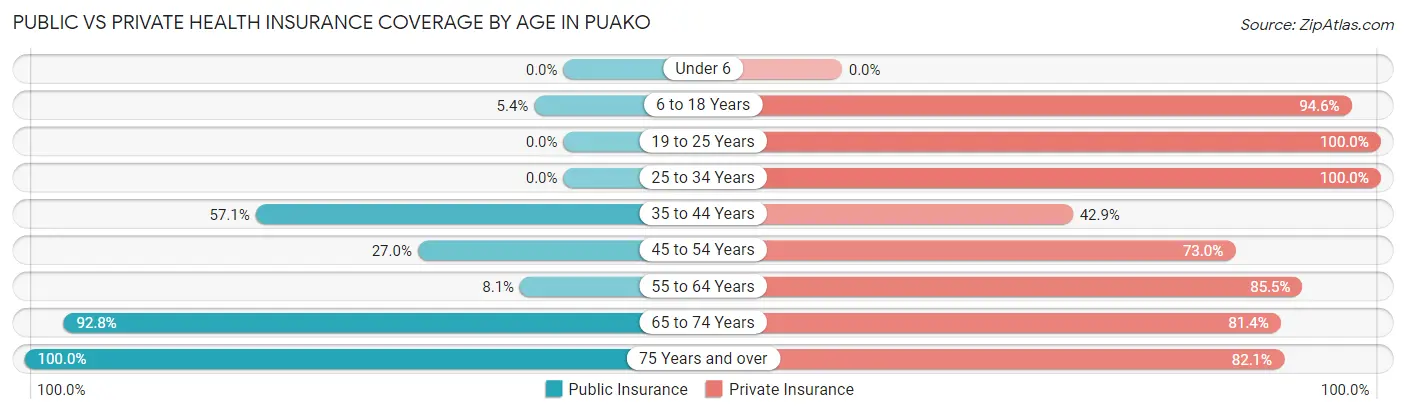
| Age Bracket | Public Insurance | Private Insurance |
| Under 6 | 0 (0.0%) | 0 (0.0%) |
| 6 to 18 Years | 2 (5.4%) | 35 (94.6%) |
| 19 to 25 Years | 0 (0.0%) | 8 (100.0%) |
| 25 to 34 Years | 0 (0.0%) | 7 (100.0%) |
| 35 to 44 Years | 4 (57.1%) | 3 (42.9%) |
| 45 to 54 Years | 10 (27.0%) | 27 (73.0%) |
| 55 to 64 Years | 5 (8.1%) | 53 (85.5%) |
| 65 to 74 Years | 90 (92.8%) | 79 (81.4%) |
| 75 Years and over | 39 (100.0%) | 32 (82.1%) |
| Total | 150 (51.0%) | 244 (83.0%) |
Disability Status by Sex by Age in Puako
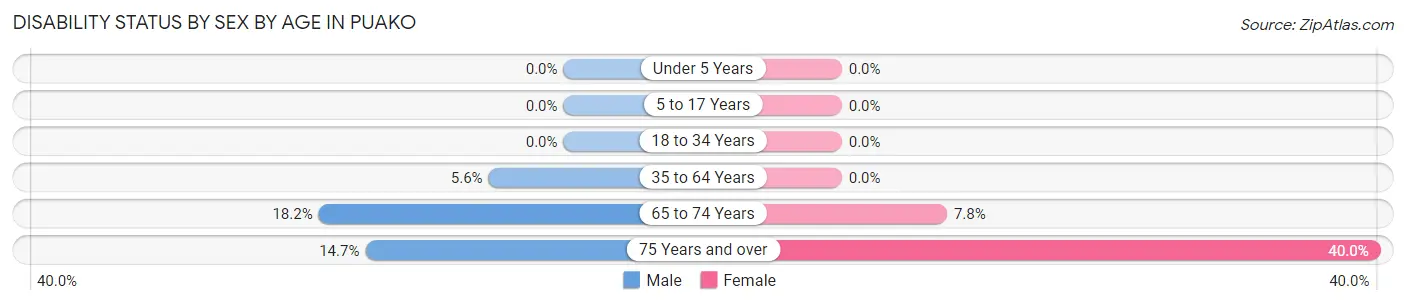
| Age Bracket | Male | Female |
| Under 5 Years | 0 (0.0%) | 0 (0.0%) |
| 5 to 17 Years | 0 (0.0%) | 0 (0.0%) |
| 18 to 34 Years | 0 (0.0%) | 0 (0.0%) |
| 35 to 64 Years | 3 (5.6%) | 0 (0.0%) |
| 65 to 74 Years | 6 (18.2%) | 5 (7.8%) |
| 75 Years and over | 5 (14.7%) | 2 (40.0%) |
Disability Class by Sex by Age in Puako
Disability Class: Hearing Difficulty
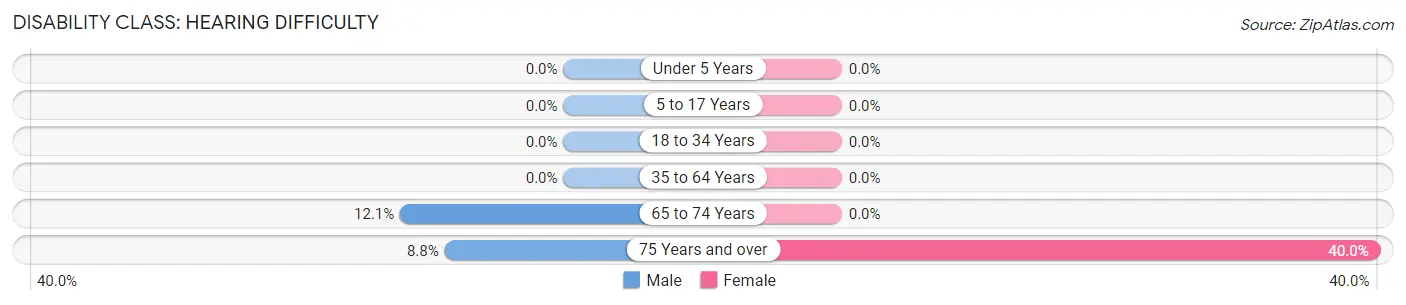
| Age Bracket | Male | Female |
| Under 5 Years | 0 (0.0%) | 0 (0.0%) |
| 5 to 17 Years | 0 (0.0%) | 0 (0.0%) |
| 18 to 34 Years | 0 (0.0%) | 0 (0.0%) |
| 35 to 64 Years | 0 (0.0%) | 0 (0.0%) |
| 65 to 74 Years | 4 (12.1%) | 0 (0.0%) |
| 75 Years and over | 3 (8.8%) | 2 (40.0%) |
Disability Class: Vision Difficulty
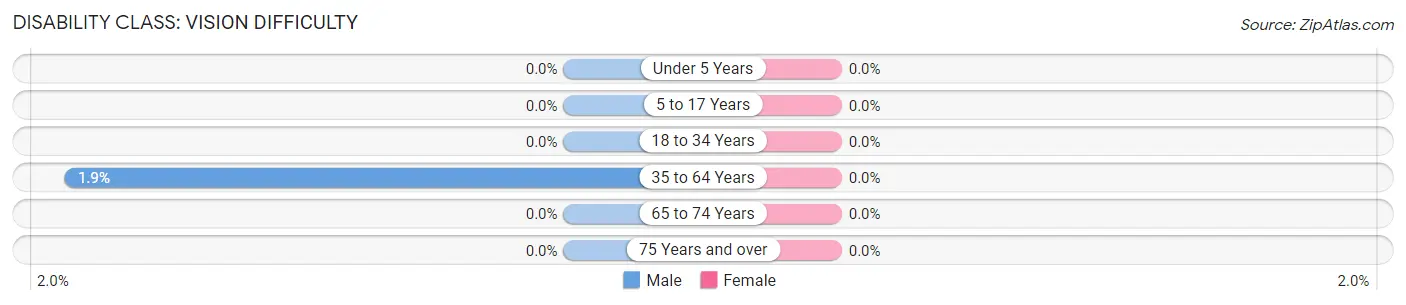
| Age Bracket | Male | Female |
| Under 5 Years | 0 (0.0%) | 0 (0.0%) |
| 5 to 17 Years | 0 (0.0%) | 0 (0.0%) |
| 18 to 34 Years | 0 (0.0%) | 0 (0.0%) |
| 35 to 64 Years | 1 (1.8%) | 0 (0.0%) |
| 65 to 74 Years | 0 (0.0%) | 0 (0.0%) |
| 75 Years and over | 0 (0.0%) | 0 (0.0%) |
Disability Class: Cognitive Difficulty
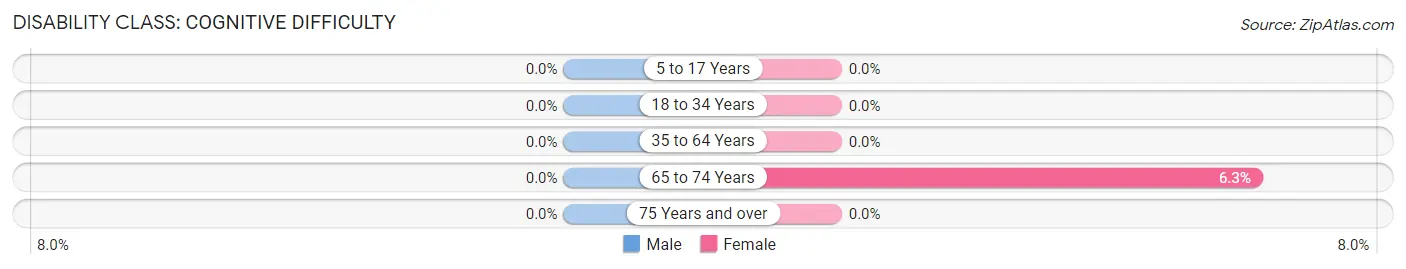
| Age Bracket | Male | Female |
| 5 to 17 Years | 0 (0.0%) | 0 (0.0%) |
| 18 to 34 Years | 0 (0.0%) | 0 (0.0%) |
| 35 to 64 Years | 0 (0.0%) | 0 (0.0%) |
| 65 to 74 Years | 0 (0.0%) | 4 (6.2%) |
| 75 Years and over | 0 (0.0%) | 0 (0.0%) |
Disability Class: Ambulatory Difficulty
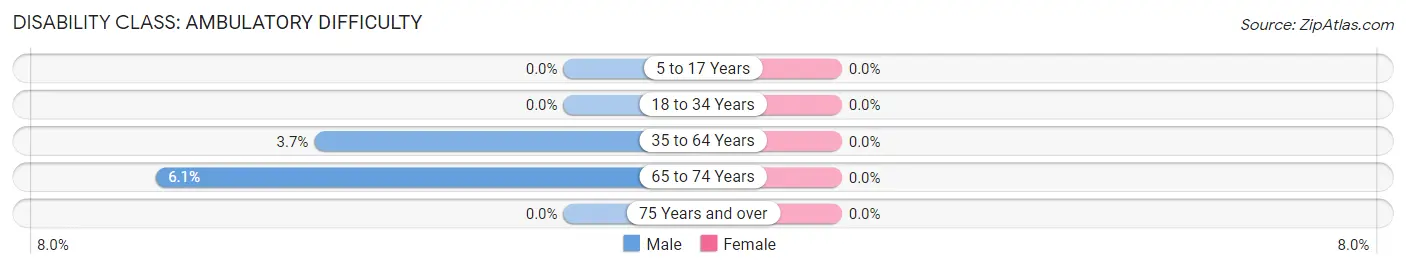
| Age Bracket | Male | Female |
| 5 to 17 Years | 0 (0.0%) | 0 (0.0%) |
| 18 to 34 Years | 0 (0.0%) | 0 (0.0%) |
| 35 to 64 Years | 2 (3.7%) | 0 (0.0%) |
| 65 to 74 Years | 2 (6.1%) | 0 (0.0%) |
| 75 Years and over | 0 (0.0%) | 0 (0.0%) |
Disability Class: Self-Care Difficulty
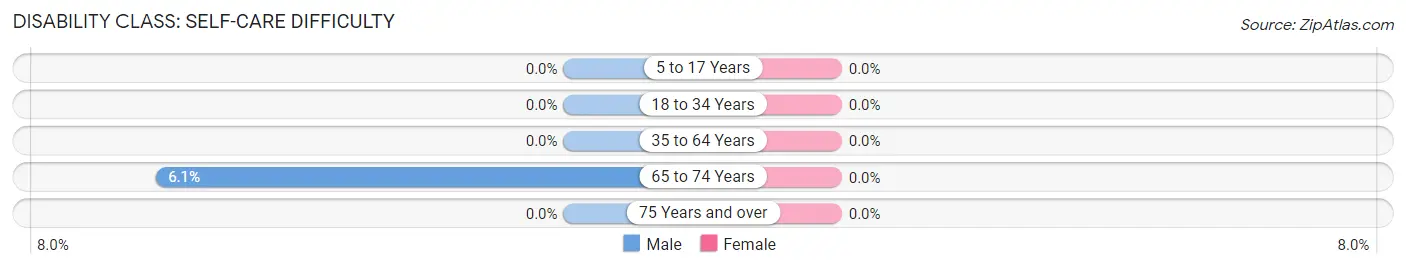
| Age Bracket | Male | Female |
| 5 to 17 Years | 0 (0.0%) | 0 (0.0%) |
| 18 to 34 Years | 0 (0.0%) | 0 (0.0%) |
| 35 to 64 Years | 0 (0.0%) | 0 (0.0%) |
| 65 to 74 Years | 2 (6.1%) | 0 (0.0%) |
| 75 Years and over | 0 (0.0%) | 0 (0.0%) |
Technology Access in Puako
Computing Device Access in Puako
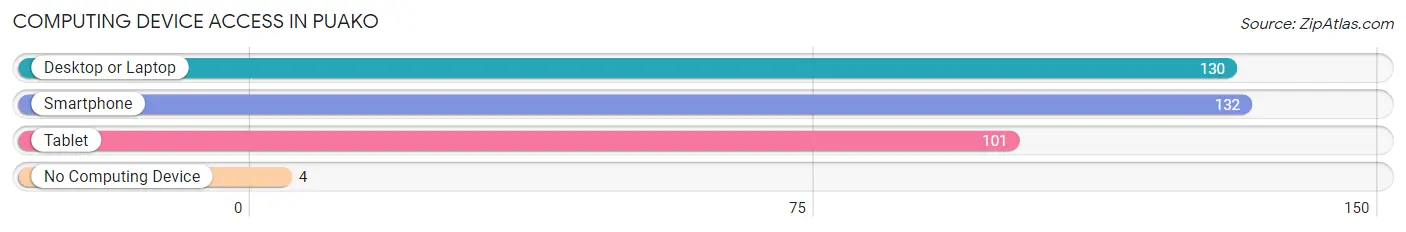
| Device Type | # Households | % Households |
| Desktop or Laptop | 130 | 87.8% |
| Smartphone | 132 | 89.2% |
| Tablet | 101 | 68.2% |
| No Computing Device | 4 | 2.7% |
| Total | 148 | 100.0% |
Internet Access in Puako
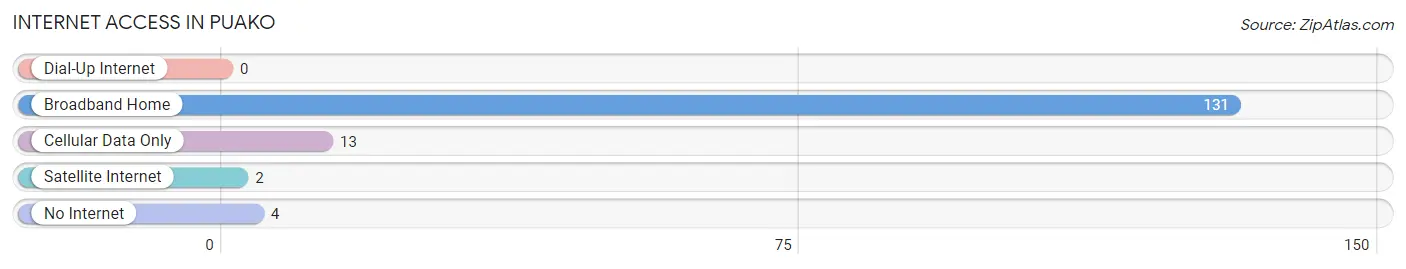
| Internet Type | # Households | % Households |
| Dial-Up Internet | 0 | 0.0% |
| Broadband Home | 131 | 88.5% |
| Cellular Data Only | 13 | 8.8% |
| Satellite Internet | 2 | 1.3% |
| No Internet | 4 | 2.7% |
| Total | 148 | 100.0% |
Puako Summary
Puako is a small unincorporated community located on the Kohala Coast of the Big Island of Hawaii. It is situated between the towns of Kawaihae and Waikoloa, and is home to a population of approximately 1,000 people. Puako is known for its beautiful beaches, lush tropical vegetation, and its unique cultural heritage.
History
Puako has a long and rich history that dates back to the early Polynesian settlers who first arrived in the area around 1000 AD. These settlers were part of the Menehune, a legendary group of people who were believed to have built many of the structures and roads in the area. The Menehune were also responsible for the construction of the Puako Fishpond, which is still in use today.
In the late 1700s, Puako was home to a thriving whaling industry. The whalers would use the area as a base of operations, and would often hunt for whales in the nearby waters. This industry eventually declined in the late 1800s, and Puako became a quiet fishing village.
In the early 1900s, Puako began to attract tourists from around the world. The area was known for its beautiful beaches, lush tropical vegetation, and its unique cultural heritage. Puako quickly became a popular destination for vacationers, and the population began to grow.
Geography
Puako is located on the Kohala Coast of the Big Island of Hawaii. It is situated between the towns of Kawaihae and Waikoloa, and is home to a population of approximately 1,000 people. The area is known for its beautiful beaches, lush tropical vegetation, and its unique cultural heritage.
The climate in Puako is tropical and humid, with temperatures ranging from the mid-70s to the mid-80s throughout the year. The area receives an average of about 20 inches of rain per year, and is known for its frequent rain showers.
Economy
The economy of Puako is largely based on tourism. The area is known for its beautiful beaches, lush tropical vegetation, and its unique cultural heritage. Puako is home to several resorts and hotels, as well as a variety of restaurants and shops.
The area is also home to a number of small businesses, including a few local farms and ranches. These businesses provide employment for many of the residents of Puako.
Demographics
As of the 2010 census, the population of Puako was 1,000 people. The racial makeup of the town was 94.2% White, 0.7% African American, 0.7% Native American, 0.7% Asian, 0.7% Pacific Islander, and 2.7% from two or more races.
The median household income in Puako was $50,000, and the median family income was $54,000. The per capita income in Puako was $25,000. The poverty rate in Puako was 8.3%.
Conclusion
Puako is a small unincorporated community located on the Kohala Coast of the Big Island of Hawaii. It is known for its beautiful beaches, lush tropical vegetation, and its unique cultural heritage. The economy of Puako is largely based on tourism, and the area is home to a population of approximately 1,000 people. The racial makeup of the town is predominantly White, with a small percentage of African American, Native American, Asian, and Pacific Islander residents. The median household income in Puako is $50,000, and the poverty rate is 8.3%.
Common Questions
What is Per Capita Income in Puako?
Per Capita income in Puako is $102,681.
What is the Median Family Income in Puako?
Median Family Income in Puako is $180,417.
What is the Median Household income in Puako?
Median Household Income in Puako is $110,000.
What is Income or Wage Gap in Puako?
Income or Wage Gap in Puako is 45.4%.
Women in Puako earn 54.6 cents for every dollar earned by a man.
What is Inequality or Gini Index in Puako?
Inequality or Gini Index in Puako is 0.60.
What is the Total Population of Puako?
Total Population of Puako is 294.
What is the Total Male Population of Puako?
Total Male Population of Puako is 139.
What is the Total Female Population of Puako?
Total Female Population of Puako is 155.
What is the Ratio of Males per 100 Females in Puako?
There are 89.68 Males per 100 Females in Puako.
What is the Ratio of Females per 100 Males in Puako?
There are 111.51 Females per 100 Males in Puako.
What is the Median Population Age in Puako?
Median Population Age in Puako is 63.4 Years.
What is the Average Family Size in Puako
Average Family Size in Puako is 2.6 People.
What is the Average Household Size in Puako
Average Household Size in Puako is 2.0 People.
How Large is the Labor Force in Puako?
There are 94 People in the Labor Forcein in Puako.
What is the Percentage of People in the Labor Force in Puako?
33.7% of People are in the Labor Force in Puako.
What is the Unemployment Rate in Puako?
Unemployment Rate in Puako is 9.6%.