Zip Codes with the Highest Percentage of Population Employed in Computer & Mathematics in Hawaii

RELATED REPORTS & OPTIONS

Computer & Mathematics
Population
Families and Households
Female Fertility
Female Fertility (Unmarried)
Race (Community Size)
Race (Percentage)
Ancestry (Community Size)
AfghanAfricanAlaska NativeAlaskan AthabascanAlbanianAleutAlsatianAmericanApacheArabArapahoArgentineanArmenianAssyrian / Chaldean / SyriacAustralianAustrianBahamianBangladeshiBarbadianBasqueBelgianBelizeanBermudanBhutaneseBlackfeetBolivianBrazilianBritishBritish West IndianBulgarianBurmeseCajunCambodianCanadianCape VerdeanCarpatho RusynCelticCentral AmericanCentral American IndianCherokeeCheyenneChickasawChileanChineseChippewaChoctawColombianColvilleComancheCosta RicanCreeCreekCroatianCrowCubanCypriotCzechCzechoslovakianDanishDelawareDominicanDutchDutch West IndianEastern EuropeanEcuadorianEgyptianEnglishEstonianEthiopianEuropeanFijianFilipinoFinnishFrenchFrench American IndianFrench CanadianGermanGerman RussianGhanaianGreekGuamanian / ChamorroGuatemalanGuyaneseHaitianHmongHonduranHopiHoumaHungarianIcelanderIndian (Asian)IndonesianInupiatIranianIraqiIrishIroquoisIsraeliItalianJamaicanJapaneseJordanianKenyanKiowaKoreanLaotianLatvianLebaneseLiberianLithuanianLumbeeLuxembourgerMacedonianMalaysianMalteseMarshalleseMenomineeMexicanMexican American IndianMongolianMoroccanNative HawaiianNavajoNepaleseNew ZealanderNicaraguanNigerianNorthern EuropeanNorwegianOkinawanOsageOttawaPaiutePakistaniPalestinianPanamanianParaguayanPennsylvania GermanPeruvianPimaPolishPortuguesePotawatomiPuebloPuerto RicanPuget Sound SalishRomanianRussianSalvadoranSamoanScandinavianScotch-IrishScottishSeminoleSenegaleseSerbianShoshoneSierra LeoneanSiouxSlavicSlovakSloveneSomaliSouth AfricanSouth AmericanSouth American IndianSoviet UnionSpaniardSpanishSpanish AmericanSpanish American IndianSri LankanSubsaharan AfricanSudaneseSwedishSwissSyrianTaiwaneseThaiTlingit-HaidaTohono O'OdhamTonganTrinidadian and TobagonianTsimshianTurkishU.S. Virgin IslanderUgandanUkrainianUruguayanUteVenezuelanVietnameseWelshWest IndianYakamaYaquiYugoslavianYumanYup'ikZimbabwean
Ancestry (Percentage)
AfghanAfricanAlaska NativeAlaskan AthabascanAlbanianAleutAlsatianAmericanApacheArabArapahoArgentineanArmenianAssyrian / Chaldean / SyriacAustralianAustrianBahamianBangladeshiBarbadianBasqueBelgianBelizeanBermudanBhutaneseBlackfeetBolivianBrazilianBritishBritish West IndianBulgarianBurmeseCajunCambodianCanadianCape VerdeanCarpatho RusynCelticCentral AmericanCentral American IndianCherokeeCheyenneChickasawChileanChineseChippewaChoctawColombianColvilleComancheCosta RicanCreeCreekCroatianCrowCubanCypriotCzechCzechoslovakianDanishDelawareDominicanDutchDutch West IndianEastern EuropeanEcuadorianEgyptianEnglishEstonianEthiopianEuropeanFijianFilipinoFinnishFrenchFrench American IndianFrench CanadianGermanGerman RussianGhanaianGreekGuamanian / ChamorroGuatemalanGuyaneseHaitianHmongHonduranHopiHoumaHungarianIcelanderIndian (Asian)IndonesianInupiatIranianIraqiIrishIroquoisIsraeliItalianJamaicanJapaneseJordanianKenyanKiowaKoreanLaotianLatvianLebaneseLiberianLithuanianLumbeeLuxembourgerMacedonianMalaysianMalteseMarshalleseMenomineeMexicanMexican American IndianMongolianMoroccanNative HawaiianNavajoNepaleseNew ZealanderNicaraguanNigerianNorthern EuropeanNorwegianOkinawanOsageOttawaPaiutePakistaniPalestinianPanamanianParaguayanPennsylvania GermanPeruvianPimaPolishPortuguesePotawatomiPuebloPuerto RicanPuget Sound SalishRomanianRussianSalvadoranSamoanScandinavianScotch-IrishScottishSeminoleSenegaleseSerbianShoshoneSierra LeoneanSiouxSlavicSlovakSloveneSomaliSouth AfricanSouth AmericanSouth American IndianSoviet UnionSpaniardSpanishSpanish AmericanSpanish American IndianSri LankanSubsaharan AfricanSudaneseSwedishSwissSyrianTaiwaneseThaiTlingit-HaidaTohono O'OdhamTonganTrinidadian and TobagonianTsimshianTurkishU.S. Virgin IslanderUgandanUkrainianUruguayanUteVenezuelanVietnameseWelshWest IndianYakamaYaquiYugoslavianYumanYup'ikZimbabwean
Immigrant Origin (Total)
AfghanistanAfricaAlbaniaArgentinaArmeniaAsiaAustraliaAustriaAzoresBahamasBangladeshBarbadosBelarusBelgiumBelizeBoliviaBosnia and HerzegovinaBrazilBulgariaBurma / MyanmarCabo VerdeCambodiaCameroonCanadaCaribbeanCentral AmericaChileChinaColombiaCongoCosta RicaCroatiaCubaCzechoslovakiaDenmarkDominicaDominican RepublicEastern AfricaEastern AsiaEastern EuropeEcuadorEgyptEl SalvadorEnglandEritreaEthiopiaEuropeFijiFranceGermanyGhanaGreeceGrenadaGuatemalaGuyanaHaitiHondurasHong KongHungaryIndiaIndonesiaIranIraqIrelandIsraelItalyJamaicaJapanJordanKazakhstanKenyaKoreaKuwaitLaosLatin AmericaLatviaLebanonLiberiaLithuaniaMalaysiaMexicoMicronesiaMiddle AfricaMoldovaMoroccoNepalNetherlandsNicaraguaNigeriaNorth MacedoniaNorthern AfricaNorthern EuropeNorwayOceaniaPakistanPanamaPeruPhilippinesPolandPortugalRomaniaRussiaSaudi ArabiaScotlandSenegalSerbiaSierra LeoneSingaporeSomaliaSouth AfricaSouth AmericaSouth Central AsiaSouth Eastern AsiaSouthern EuropeSpainSri LankaSt. Vincent and the GrenadinesSudanSwedenSwitzerlandSyriaTaiwanThailandTrinidad and TobagoTurkeyUgandaUkraineUruguayUzbekistanVenezuelaVietnamWest IndiesWestern AfricaWestern AsiaWestern EuropeYemenZaireZimbabwe
Immigrant Origin (Percentage)
AfghanistanAfricaAlbaniaArgentinaArmeniaAsiaAustraliaAustriaAzoresBahamasBangladeshBarbadosBelarusBelgiumBelizeBoliviaBosnia and HerzegovinaBrazilBulgariaBurma / MyanmarCabo VerdeCambodiaCameroonCanadaCaribbeanCentral AmericaChileChinaColombiaCongoCosta RicaCroatiaCubaCzechoslovakiaDenmarkDominicaDominican RepublicEastern AfricaEastern AsiaEastern EuropeEcuadorEgyptEl SalvadorEnglandEritreaEthiopiaEuropeFijiFranceGermanyGhanaGreeceGrenadaGuatemalaGuyanaHaitiHondurasHong KongHungaryIndiaIndonesiaIranIraqIrelandIsraelItalyJamaicaJapanJordanKazakhstanKenyaKoreaKuwaitLaosLatin AmericaLatviaLebanonLiberiaLithuaniaMalaysiaMexicoMicronesiaMiddle AfricaMoldovaMoroccoNepalNetherlandsNicaraguaNigeriaNorth MacedoniaNorthern AfricaNorthern EuropeNorwayOceaniaPakistanPanamaPeruPhilippinesPolandPortugalRomaniaRussiaSaudi ArabiaScotlandSenegalSerbiaSierra LeoneSingaporeSomaliaSouth AfricaSouth AmericaSouth Central AsiaSouth Eastern AsiaSouthern EuropeSpainSri LankaSt. Vincent and the GrenadinesSudanSwedenSwitzerlandSyriaTaiwanThailandTrinidad and TobagoTurkeyUgandaUkraineUruguayUzbekistanVenezuelaVietnamWest IndiesWestern AfricaWestern AsiaWestern EuropeYemenZaireZimbabwe
Income
Income (Families)
Income (Households)
Poverty
Poverty (Families)
Unemployment
Employment Occupations
Employment Industries
Employer Class
Commute Time
Commute Means
School Enrollment
Education by Degree Field
Occupancy
Finances
Physical Characteristics
Hawaii
Compare Zip Codes
Comparison Subject

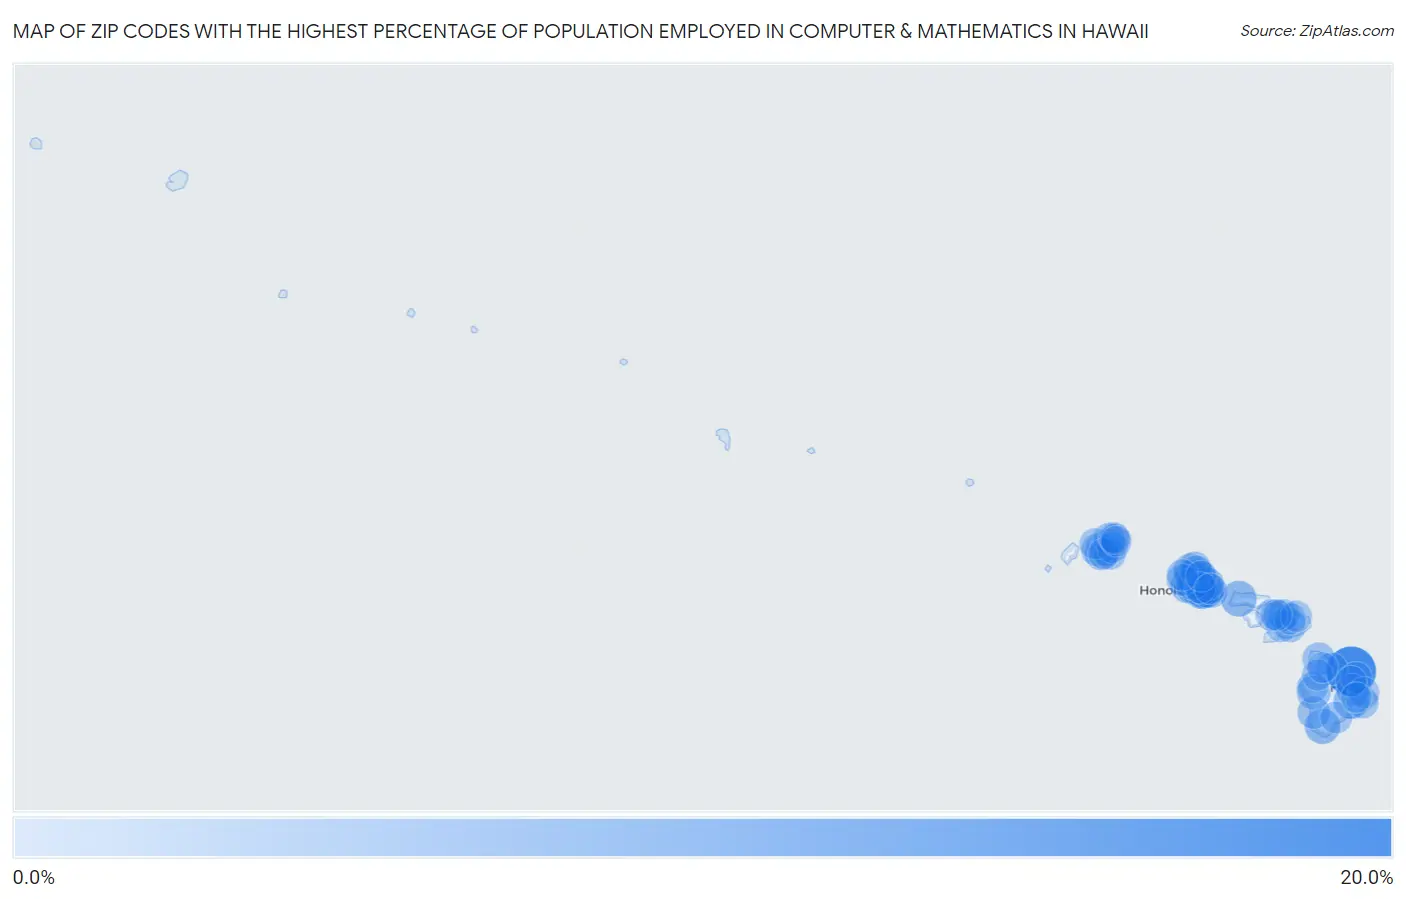
Map of Zip Codes with the Highest Percentage of Population Employed in Computer & Mathematics in Hawaii

0.0%
20.0%
Zip Codes with the Highest Percentage of Population Employed in Computer & Mathematics in Hawaii Map

Zip Codes with the Highest Percentage of Population Employed in Computer & Mathematics in Hawaii

Zip Code % Employed vs State vs National
1.9678020.0%2.3%(+17.7)#13.5%(+16.5)#129
2.967705.6%2.3%(+3.24)#23.5%(+2.03)#2,723
3.967725.4%2.3%(+3.05)#33.5%(+1.83)#2,943
4.967855.3%2.3%(+3.00)#43.5%(+1.78)#2,992
5.968145.0%2.3%(+2.65)#53.5%(+1.44)#3,402
6.968134.9%2.3%(+2.58)#63.5%(+1.37)#3,516
7.967014.4%2.3%(+2.11)#73.5%(+0.901)#4,229
8.967073.6%2.3%(+1.33)#83.5%(+0.123)#5,848
9.968183.6%2.3%(+1.29)#93.5%(+0.077)#5,953
10.968163.6%2.3%(+1.26)#103.5%(+0.048)#6,002
11.967253.4%2.3%(+1.06)#113.5%(-0.154)#6,570
12.967893.3%2.3%(+1.01)#123.5%(-0.199)#6,699
13.968223.2%2.3%(+0.933)#133.5%(-0.278)#6,955
14.967443.2%2.3%(+0.885)#143.5%(-0.327)#7,103
15.968252.9%2.3%(+0.608)#153.5%(-0.604)#8,035
16.967822.8%2.3%(+0.519)#163.5%(-0.693)#8,340
17.968482.8%2.3%(+0.454)#173.5%(-0.758)#8,577
18.967062.8%2.3%(+0.446)#183.5%(-0.766)#8,603
19.968262.7%2.3%(+0.386)#193.5%(-0.825)#8,822
20.967162.6%2.3%(+0.329)#203.5%(-0.883)#9,055
21.967172.6%2.3%(+0.293)#213.5%(-0.919)#9,189
22.968152.6%2.3%(+0.268)#223.5%(-0.944)#9,296
23.967552.5%2.3%(+0.200)#233.5%(-1.01)#9,594
24.967122.5%2.3%(+0.197)#243.5%(-1.01)#9,602
25.967042.5%2.3%(+0.142)#253.5%(-1.07)#9,822
26.968212.4%2.3%(+0.111)#263.5%(-1.10)#9,948
27.967962.3%2.3%(+0.033)#273.5%(-1.18)#10,244
28.967272.2%2.3%(-0.082)#283.5%(-1.29)#10,757
29.967862.1%2.3%(-0.174)#293.5%(-1.39)#11,176
30.967342.1%2.3%(-0.238)#303.5%(-1.45)#11,453
31.967202.0%2.3%(-0.319)#313.5%(-1.53)#11,824
32.967972.0%2.3%(-0.350)#323.5%(-1.56)#11,974
33.967321.8%2.3%(-0.519)#333.5%(-1.73)#12,776
34.967411.8%2.3%(-0.535)#343.5%(-1.75)#12,847
35.967901.7%2.3%(-0.576)#353.5%(-1.79)#13,048
36.967311.6%2.3%(-0.681)#363.5%(-1.89)#13,626
37.967561.6%2.3%(-0.685)#373.5%(-1.90)#13,660
38.967771.5%2.3%(-0.823)#383.5%(-2.03)#14,437
39.967781.5%2.3%(-0.833)#393.5%(-2.04)#14,499
40.967621.5%2.3%(-0.850)#403.5%(-2.06)#14,602
41.967921.4%2.3%(-0.941)#413.5%(-2.15)#15,109
42.968171.4%2.3%(-0.958)#423.5%(-2.17)#15,204
43.967531.3%2.3%(-0.967)#433.5%(-2.18)#15,253
44.968191.3%2.3%(-0.970)#443.5%(-2.18)#15,276
45.967221.3%2.3%(-1.00)#453.5%(-2.22)#15,481
46.967791.3%2.3%(-1.05)#463.5%(-2.26)#15,753
47.967681.2%2.3%(-1.12)#473.5%(-2.33)#16,154
48.967911.1%2.3%(-1.16)#483.5%(-2.38)#16,437
49.967611.1%2.3%(-1.21)#493.5%(-2.42)#16,751
50.967081.0%2.3%(-1.27)#503.5%(-2.48)#17,133
51.967521.0%2.3%(-1.28)#513.5%(-2.49)#17,157
52.967930.98%2.3%(-1.33)#523.5%(-2.54)#17,505
53.967280.96%2.3%(-1.36)#533.5%(-2.57)#17,653
54.967400.92%2.3%(-1.39)#543.5%(-2.60)#17,871
55.967490.83%2.3%(-1.48)#553.5%(-2.69)#18,430
56.967380.75%2.3%(-1.57)#563.5%(-2.78)#18,974
57.967660.66%2.3%(-1.66)#573.5%(-2.87)#19,511
58.967300.59%2.3%(-1.72)#583.5%(-2.93)#19,914
59.967050.50%2.3%(-1.81)#593.5%(-3.03)#20,504
60.967810.46%2.3%(-1.86)#603.5%(-3.07)#20,759
61.967430.45%2.3%(-1.87)#613.5%(-3.08)#20,802
62.967540.36%2.3%(-1.95)#623.5%(-3.16)#21,292
63.967030.32%2.3%(-1.99)#633.5%(-3.20)#21,509
64.967950.32%2.3%(-1.99)#643.5%(-3.20)#21,518
65.967710.31%2.3%(-2.00)#653.5%(-3.22)#21,578
66.967460.12%2.3%(-2.20)#663.5%(-3.41)#22,331

Common Questions

What are the Top 10 Zip Codes with the Highest Percentage of Population Employed in Computer & Mathematics in Hawaii?
Top 10 Zip Codes with the Highest Percentage of Population Employed in Computer & Mathematics in Hawaii are:
#1
20.0%
#2
5.6%
#3
5.4%
#4
5.3%
#5
5.0%
#6
4.9%
#7
4.4%
#8
3.6%
#9
3.6%
#10
3.6%
What zip code has the Highest Percentage of Population Employed in Computer & Mathematics in Hawaii?
96780 has the Highest Percentage of Population Employed in Computer & Mathematics in Hawaii with 20.0%.
What is the Percentage of Population Employed in Computer & Mathematics in the State of Hawaii?
Percentage of Population Employed in Computer & Mathematics in Hawaii is 2.3%.
What is the Percentage of Population Employed in Computer & Mathematics in the United States?
Percentage of Population Employed in Computer & Mathematics in the United States is 3.5%.