Launiupoko, HI Map & Demographics
Launiupoko Map
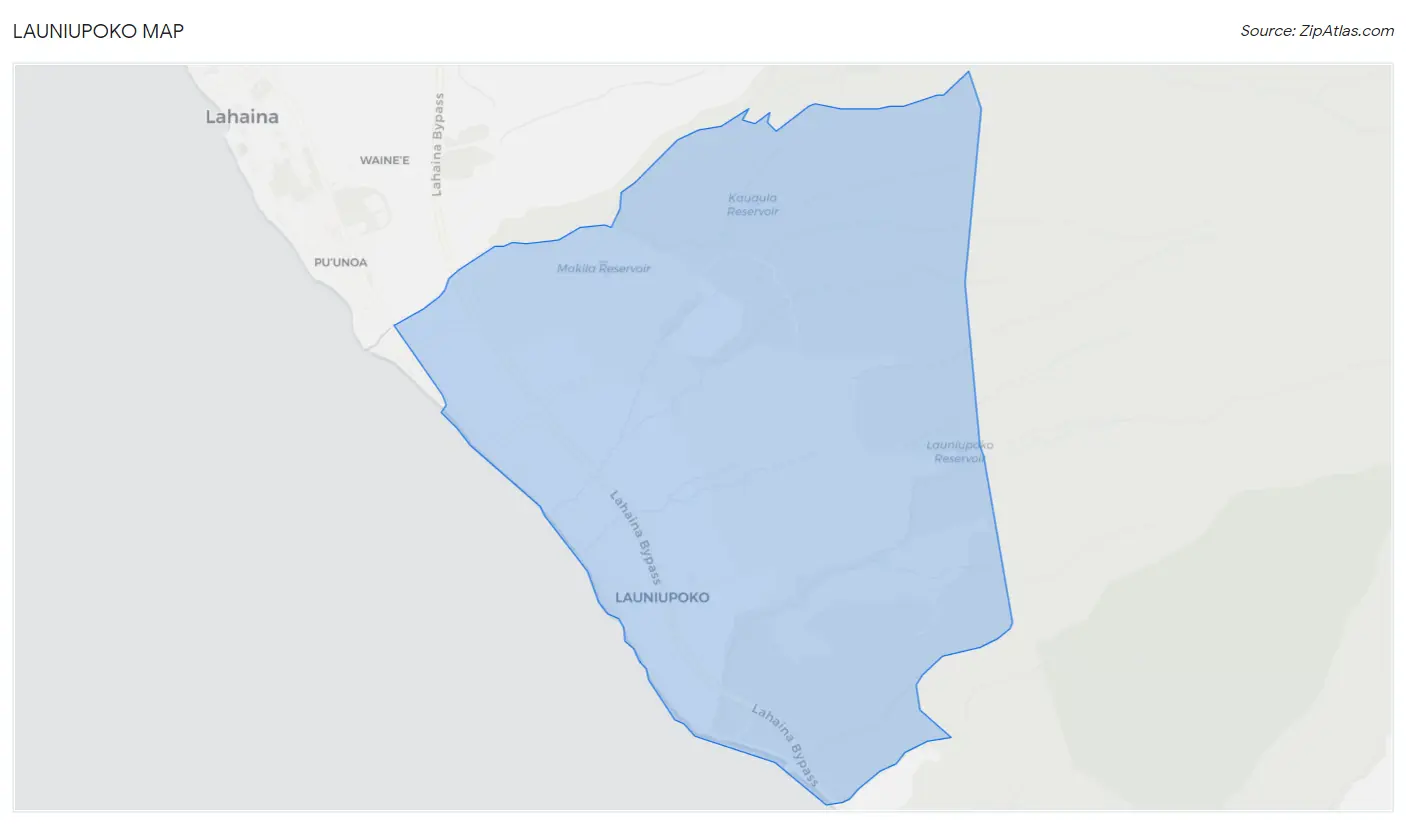
Launiupoko Overview
$73,173
PER CAPITA INCOME
$179,375
AVG FAMILY INCOME
$171,875
AVG HOUSEHOLD INCOME
3.4%
WAGE / INCOME GAP [ % ]
96.6¢/ $1
WAGE / INCOME GAP [ $ ]
0.46
INEQUALITY / GINI INDEX
649
TOTAL POPULATION
298
MALE POPULATION
351
FEMALE POPULATION
84.90
MALES / 100 FEMALES
117.79
FEMALES / 100 MALES
56.0
MEDIAN AGE
2.7
AVG FAMILY SIZE
2.6
AVG HOUSEHOLD SIZE
313
LABOR FORCE [ PEOPLE ]
55.4%
PERCENT IN LABOR FORCE
9.7%
UNEMPLOYMENT RATE
Income in Launiupoko
Income Overview in Launiupoko
Per Capita Income in Launiupoko is $73,173, while median incomes of families and households are $179,375 and $171,875 respectively.
| Characteristic | Number | Measure |
| Per Capita Income | 649 | $73,173 |
| Median Family Income | 201 | $179,375 |
| Mean Family Income | 201 | $207,444 |
| Median Household Income | 250 | $171,875 |
| Mean Household Income | 250 | $185,175 |
| Income Deficit | 201 | $0 |
| Wage / Income Gap (%) | 649 | 3.40% |
| Wage / Income Gap ($) | 649 | 96.60¢ per $1 |
| Gini / Inequality Index | 649 | 0.46 |
Earnings by Sex in Launiupoko
Average Earnings in Launiupoko are $34,750, $34,500 for men and $35,714 for women, a difference of 3.4%.
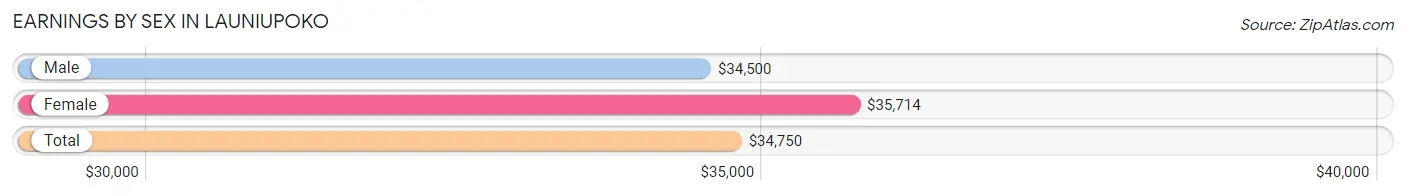
| Sex | Number | Average Earnings |
| Male | 192 (57.8%) | $34,500 |
| Female | 140 (42.2%) | $35,714 |
| Total | 332 (100.0%) | $34,750 |
Earnings by Sex by Income Bracket in Launiupoko
The most common earnings brackets in Launiupoko are $100,000+ for men (47 | 24.5%) and $100,000+ for women (17 | 12.1%).
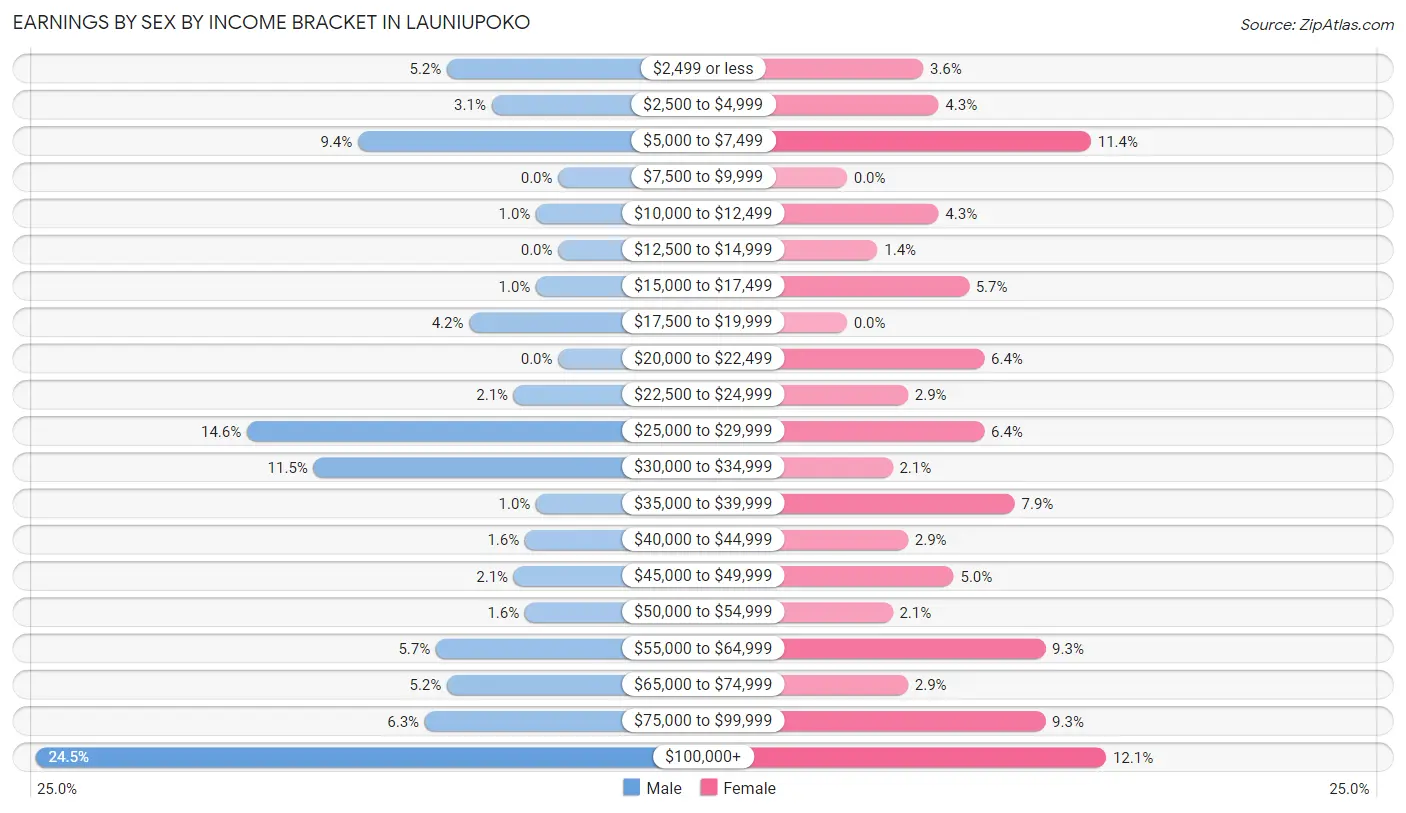
| Income | Male | Female |
| $2,499 or less | 10 (5.2%) | 5 (3.6%) |
| $2,500 to $4,999 | 6 (3.1%) | 6 (4.3%) |
| $5,000 to $7,499 | 18 (9.4%) | 16 (11.4%) |
| $7,500 to $9,999 | 0 (0.0%) | 0 (0.0%) |
| $10,000 to $12,499 | 2 (1.0%) | 6 (4.3%) |
| $12,500 to $14,999 | 0 (0.0%) | 2 (1.4%) |
| $15,000 to $17,499 | 2 (1.0%) | 8 (5.7%) |
| $17,500 to $19,999 | 8 (4.2%) | 0 (0.0%) |
| $20,000 to $22,499 | 0 (0.0%) | 9 (6.4%) |
| $22,500 to $24,999 | 4 (2.1%) | 4 (2.9%) |
| $25,000 to $29,999 | 28 (14.6%) | 9 (6.4%) |
| $30,000 to $34,999 | 22 (11.5%) | 3 (2.1%) |
| $35,000 to $39,999 | 2 (1.0%) | 11 (7.9%) |
| $40,000 to $44,999 | 3 (1.6%) | 4 (2.9%) |
| $45,000 to $49,999 | 4 (2.1%) | 7 (5.0%) |
| $50,000 to $54,999 | 3 (1.6%) | 3 (2.1%) |
| $55,000 to $64,999 | 11 (5.7%) | 13 (9.3%) |
| $65,000 to $74,999 | 10 (5.2%) | 4 (2.9%) |
| $75,000 to $99,999 | 12 (6.2%) | 13 (9.3%) |
| $100,000+ | 47 (24.5%) | 17 (12.1%) |
| Total | 192 (100.0%) | 140 (100.0%) |
Earnings by Sex by Educational Attainment in Launiupoko
Average earnings in Launiupoko are $43,750 for men and $39,063 for women, a difference of 10.7%. Men with an educational attainment of high school diploma enjoy the highest average annual earnings of $56,250, while those with college or associate's degree education earn the least with $27,143. Women with an educational attainment of graduate degree earn the most with the average annual earnings of $78,750, while those with college or associate's degree education have the smallest earnings of $35,893.
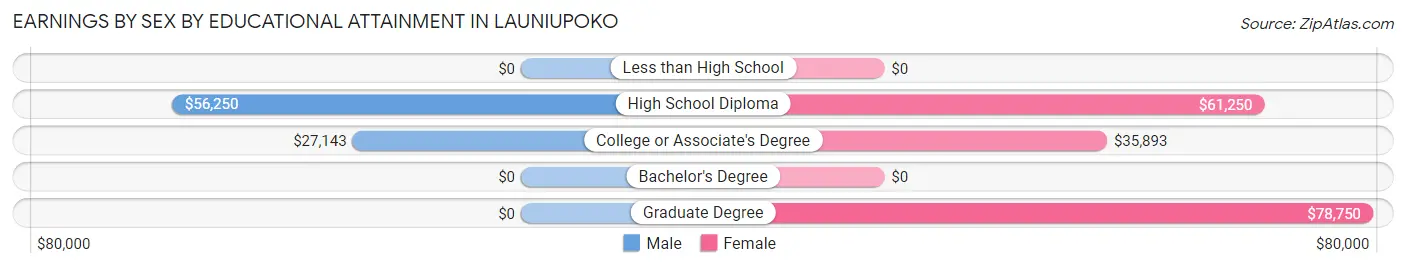
| Educational Attainment | Male Income | Female Income |
| Less than High School | - | - |
| High School Diploma | $56,250 | $61,250 |
| College or Associate's Degree | $27,143 | $35,893 |
| Bachelor's Degree | - | - |
| Graduate Degree | - | - |
| Total | $43,750 | $39,063 |
Family Income in Launiupoko
Family Income Brackets in Launiupoko
According to the Launiupoko family income data, there are 95 families falling into the $200,000+ income range, which is the most common income bracket and makes up 47.3% of all families.
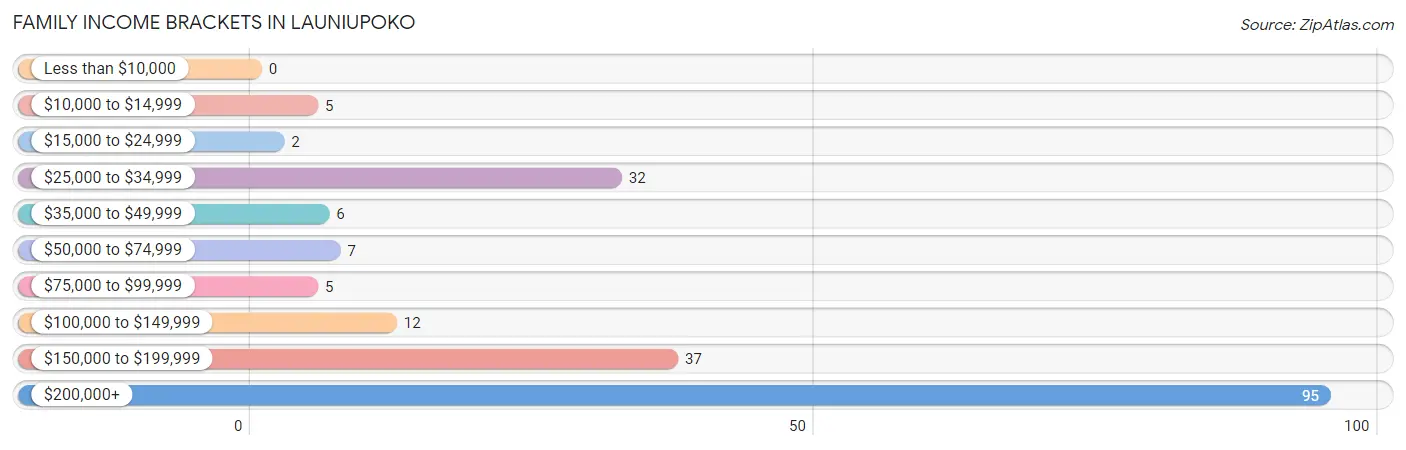
| Income Bracket | # Families | % Families |
| Less than $10,000 | 0 | 0.0% |
| $10,000 to $14,999 | 5 | 2.5% |
| $15,000 to $24,999 | 2 | 1.0% |
| $25,000 to $34,999 | 32 | 15.9% |
| $35,000 to $49,999 | 6 | 3.0% |
| $50,000 to $74,999 | 7 | 3.5% |
| $75,000 to $99,999 | 5 | 2.5% |
| $100,000 to $149,999 | 12 | 6.0% |
| $150,000 to $199,999 | 37 | 18.4% |
| $200,000+ | 95 | 47.3% |
Family Income by Famaliy Size in Launiupoko
2-person families (131 | 65.2%) account for the highest median family income in Launiupoko with $203,125 per family, while 2-person families (131 | 65.2%) have the highest median income of $101,562 per family member.
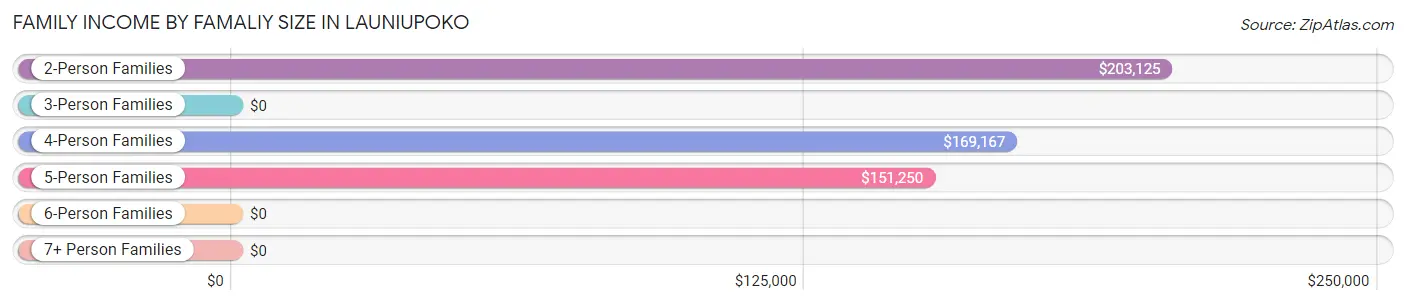
| Income Bracket | # Families | Median Income |
| 2-Person Families | 131 (65.2%) | $203,125 |
| 3-Person Families | 48 (23.9%) | $0 |
| 4-Person Families | 8 (4.0%) | $169,167 |
| 5-Person Families | 6 (3.0%) | $151,250 |
| 6-Person Families | 7 (3.5%) | $0 |
| 7+ Person Families | 1 (0.5%) | $0 |
| Total | 201 (100.0%) | $179,375 |
Family Income by Number of Earners in Launiupoko
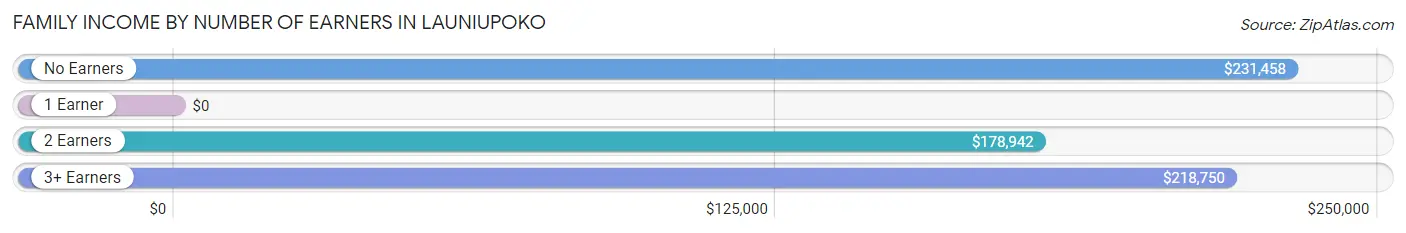
| Number of Earners | # Families | Median Income |
| No Earners | 59 (29.3%) | $231,458 |
| 1 Earner | 67 (33.3%) | $0 |
| 2 Earners | 63 (31.3%) | $178,942 |
| 3+ Earners | 12 (6.0%) | $218,750 |
| Total | 201 (100.0%) | $179,375 |
Household Income in Launiupoko
Household Income Brackets in Launiupoko
With 100 households falling in the category, the $200,000+ income range is the most frequent in Launiupoko, accounting for 40.0% of all households. In contrast, only 3 households (1.2%) fall into the less than $10,000 income bracket, making it the least populous group.
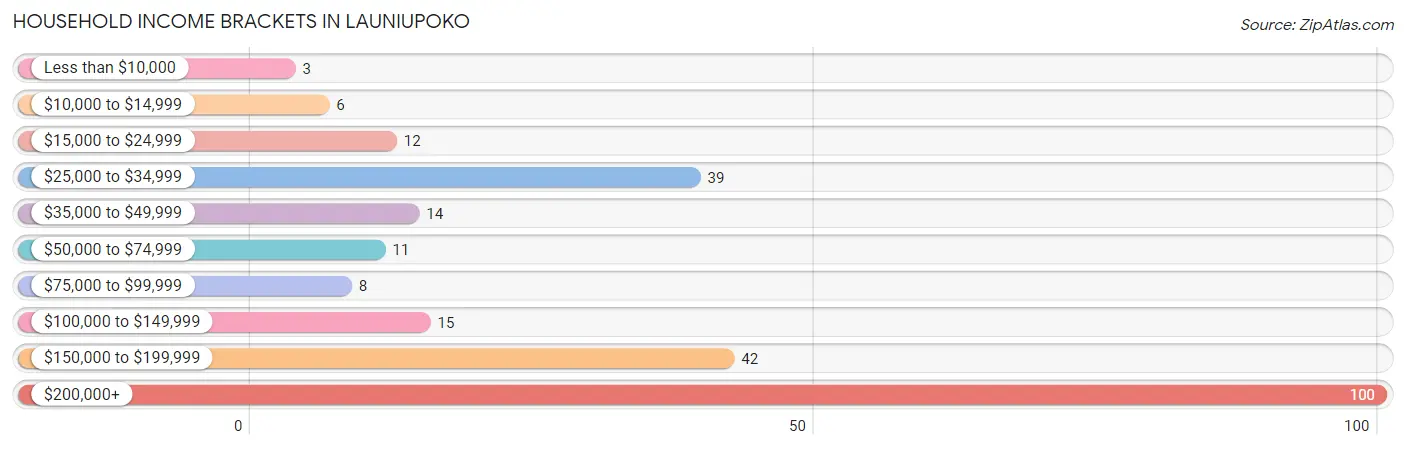
| Income Bracket | # Households | % Households |
| Less than $10,000 | 3 | 1.2% |
| $10,000 to $14,999 | 6 | 2.4% |
| $15,000 to $24,999 | 12 | 4.8% |
| $25,000 to $34,999 | 39 | 15.6% |
| $35,000 to $49,999 | 14 | 5.6% |
| $50,000 to $74,999 | 11 | 4.4% |
| $75,000 to $99,999 | 8 | 3.2% |
| $100,000 to $149,999 | 15 | 6.0% |
| $150,000 to $199,999 | 42 | 16.8% |
| $200,000+ | 100 | 40.0% |
Household Income by Householder Age in Launiupoko
The median household income in Launiupoko is $171,875, with the highest median household income of $231,250 found in the 65+ years age bracket for the primary householder. A total of 100 households (40.0%) fall into this category.
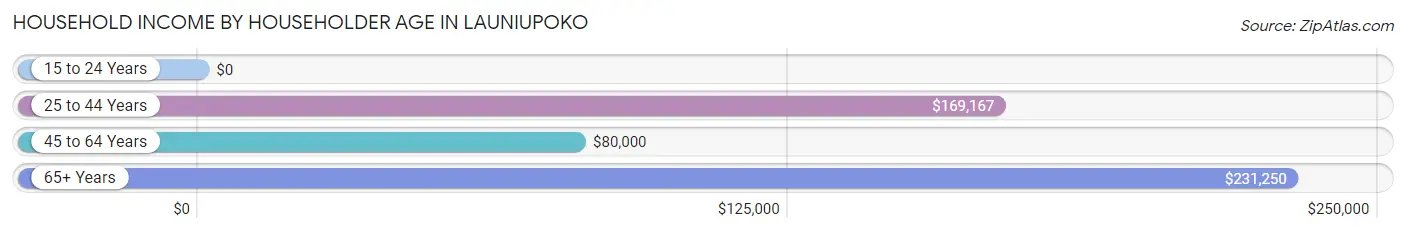
| Income Bracket | # Households | Median Income |
| 15 to 24 Years | 0 (0.0%) | $0 |
| 25 to 44 Years | 24 (9.6%) | $169,167 |
| 45 to 64 Years | 126 (50.4%) | $80,000 |
| 65+ Years | 100 (40.0%) | $231,250 |
| Total | 250 (100.0%) | $171,875 |
Poverty in Launiupoko
Income Below Poverty by Sex and Age in Launiupoko
With 10.8% poverty level for males and 3.4% for females among the residents of Launiupoko, under 5 year old males and 16 and 17 year old females are the most vulnerable to poverty, with 3 males (100.0%) and 1 females (50.0%) in their respective age groups living below the poverty level.
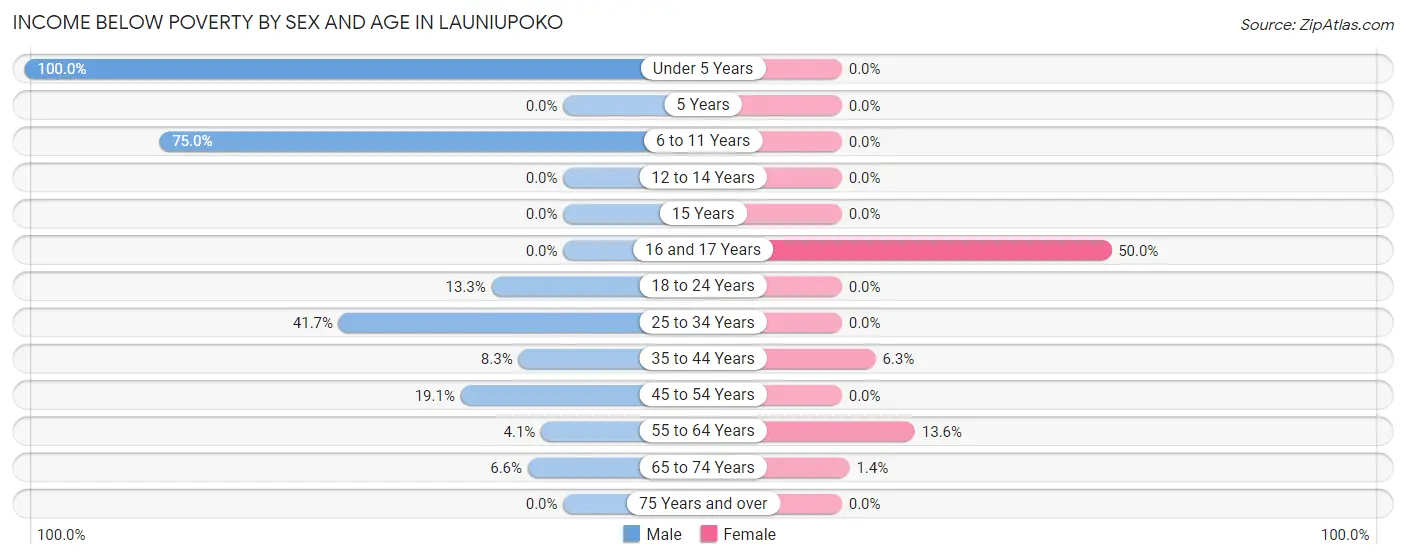
| Age Bracket | Male | Female |
| Under 5 Years | 3 (100.0%) | 0 (0.0%) |
| 5 Years | 0 (0.0%) | 0 (0.0%) |
| 6 to 11 Years | 3 (75.0%) | 0 (0.0%) |
| 12 to 14 Years | 0 (0.0%) | 0 (0.0%) |
| 15 Years | 0 (0.0%) | 0 (0.0%) |
| 16 and 17 Years | 0 (0.0%) | 1 (50.0%) |
| 18 to 24 Years | 2 (13.3%) | 0 (0.0%) |
| 25 to 34 Years | 5 (41.7%) | 0 (0.0%) |
| 35 to 44 Years | 2 (8.3%) | 2 (6.2%) |
| 45 to 54 Years | 8 (19.1%) | 0 (0.0%) |
| 55 to 64 Years | 3 (4.1%) | 8 (13.6%) |
| 65 to 74 Years | 6 (6.6%) | 1 (1.4%) |
| 75 Years and over | 0 (0.0%) | 0 (0.0%) |
| Total | 32 (10.8%) | 12 (3.4%) |
Income Above Poverty by Sex and Age in Launiupoko
According to the poverty statistics in Launiupoko, males aged 12 to 14 years and females aged under 5 years are the age groups that are most secure financially, with 100.0% of males and 100.0% of females in these age groups living above the poverty line.
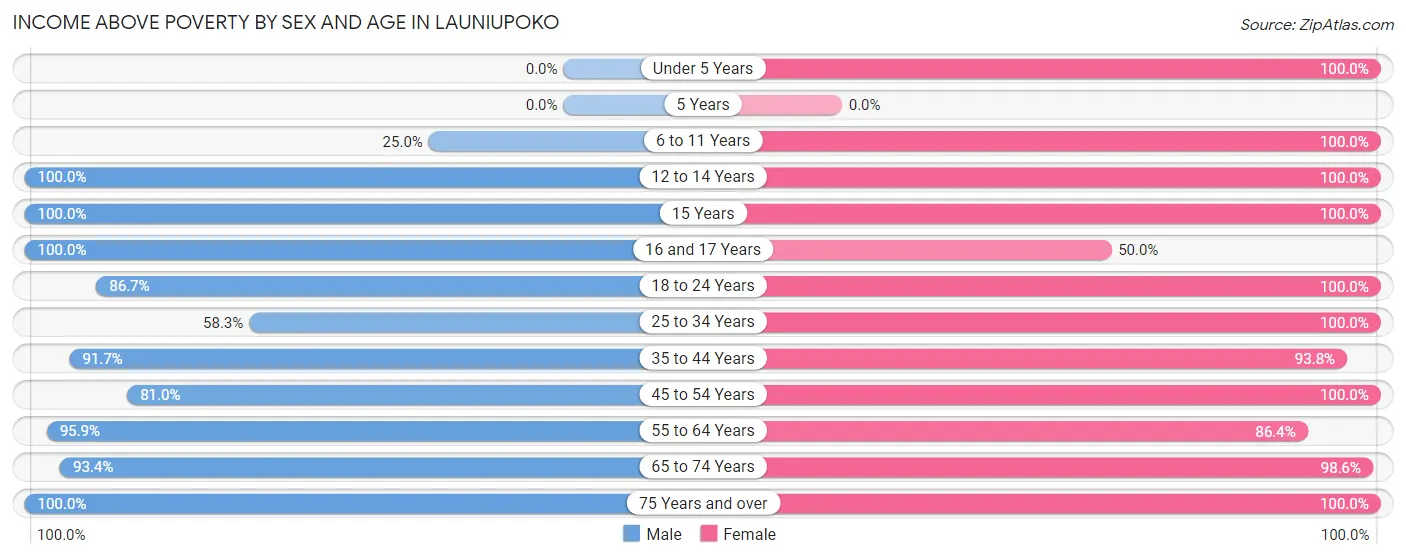
| Age Bracket | Male | Female |
| Under 5 Years | 0 (0.0%) | 1 (100.0%) |
| 5 Years | 0 (0.0%) | 0 (0.0%) |
| 6 to 11 Years | 1 (25.0%) | 16 (100.0%) |
| 12 to 14 Years | 2 (100.0%) | 11 (100.0%) |
| 15 Years | 10 (100.0%) | 33 (100.0%) |
| 16 and 17 Years | 1 (100.0%) | 1 (50.0%) |
| 18 to 24 Years | 13 (86.7%) | 14 (100.0%) |
| 25 to 34 Years | 7 (58.3%) | 13 (100.0%) |
| 35 to 44 Years | 22 (91.7%) | 30 (93.8%) |
| 45 to 54 Years | 34 (80.9%) | 74 (100.0%) |
| 55 to 64 Years | 70 (95.9%) | 51 (86.4%) |
| 65 to 74 Years | 85 (93.4%) | 69 (98.6%) |
| 75 Years and over | 19 (100.0%) | 24 (100.0%) |
| Total | 264 (89.2%) | 337 (96.6%) |
Income Below Poverty Among Married-Couple Families in Launiupoko
The poverty statistics for married-couple families in Launiupoko show that 3.0% or 5 of the total 166 families live below the poverty line. Families with 1 or 2 children have the highest poverty rate of 4.0%, comprising of 2 families. On the other hand, families with 3 or 4 children have the lowest poverty rate of 0.0%, which includes 0 families.
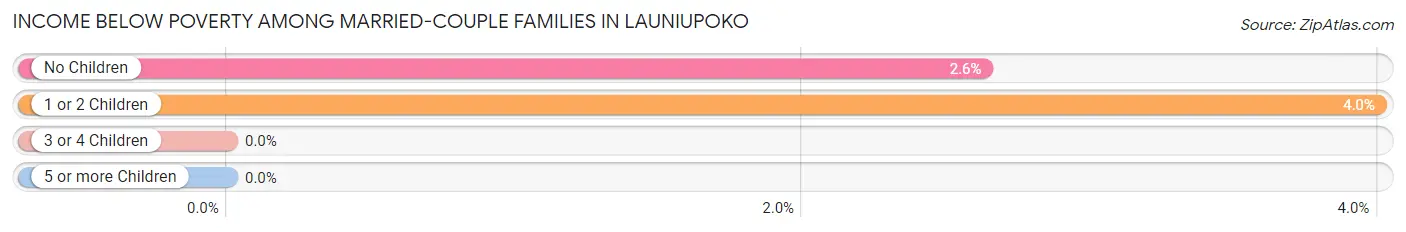
| Children | Above Poverty | Below Poverty |
| No Children | 111 (97.4%) | 3 (2.6%) |
| 1 or 2 Children | 48 (96.0%) | 2 (4.0%) |
| 3 or 4 Children | 2 (100.0%) | 0 (0.0%) |
| 5 or more Children | 0 (0.0%) | 0 (0.0%) |
| Total | 161 (97.0%) | 5 (3.0%) |
Income Below Poverty Among Single-Parent Households in Launiupoko
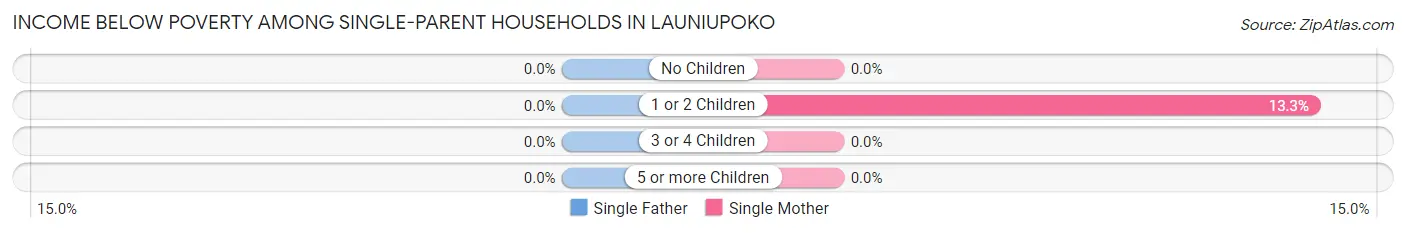
| Children | Single Father | Single Mother |
| No Children | 0 (0.0%) | 0 (0.0%) |
| 1 or 2 Children | 0 (0.0%) | 2 (13.3%) |
| 3 or 4 Children | 0 (0.0%) | 0 (0.0%) |
| 5 or more Children | 0 (0.0%) | 0 (0.0%) |
| Total | 0 (0.0%) | 2 (10.0%) |
Income Below Poverty Among Married-Couple vs Single-Parent Households in Launiupoko
The poverty data for Launiupoko shows that 5 of the married-couple family households (3.0%) and 2 of the single-parent households (5.7%) are living below the poverty level. Within the married-couple family households, those with 1 or 2 children have the highest poverty rate, with 2 households (4.0%) falling below the poverty line. Among the single-parent households, those with 1 or 2 children have the highest poverty rate, with 2 household (13.3%) living below poverty.
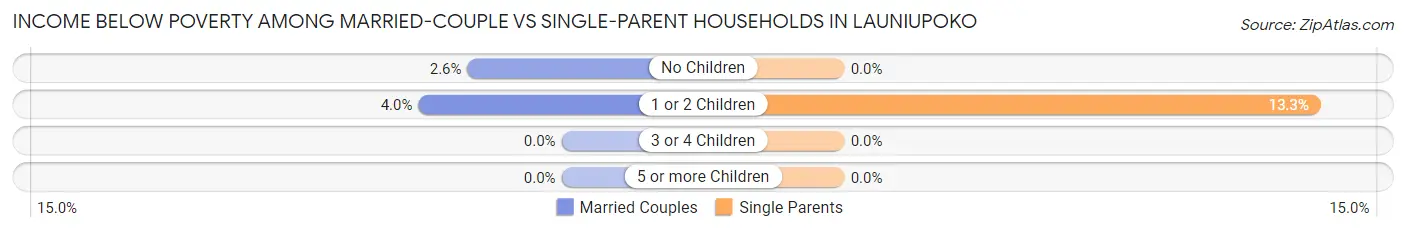
| Children | Married-Couple Families | Single-Parent Households |
| No Children | 3 (2.6%) | 0 (0.0%) |
| 1 or 2 Children | 2 (4.0%) | 2 (13.3%) |
| 3 or 4 Children | 0 (0.0%) | 0 (0.0%) |
| 5 or more Children | 0 (0.0%) | 0 (0.0%) |
| Total | 5 (3.0%) | 2 (5.7%) |
Race in Launiupoko
The most populous races in Launiupoko are White / Caucasian (461 | 71.0%), Two or more Races (118 | 18.2%), and Hispanic or Latino (44 | 6.8%).

| Race | # Population | % Population |
| Asian | 10 | 1.5% |
| Black / African American | 8 | 1.2% |
| Hawaiian / Pacific | 43 | 6.6% |
| Hispanic or Latino | 44 | 6.8% |
| Native / Alaskan | 0 | 0.0% |
| White / Caucasian | 461 | 71.0% |
| Two or more Races | 118 | 18.2% |
| Some other Race | 9 | 1.4% |
| Total | 649 | 100.0% |
Ancestry in Launiupoko
The most populous ancestries reported in Launiupoko are English (108 | 16.6%), Samoan (72 | 11.1%), German (65 | 10.0%), Irish (49 | 7.5%), and Bhutanese (48 | 7.4%), together accounting for 52.7% of all Launiupoko residents.
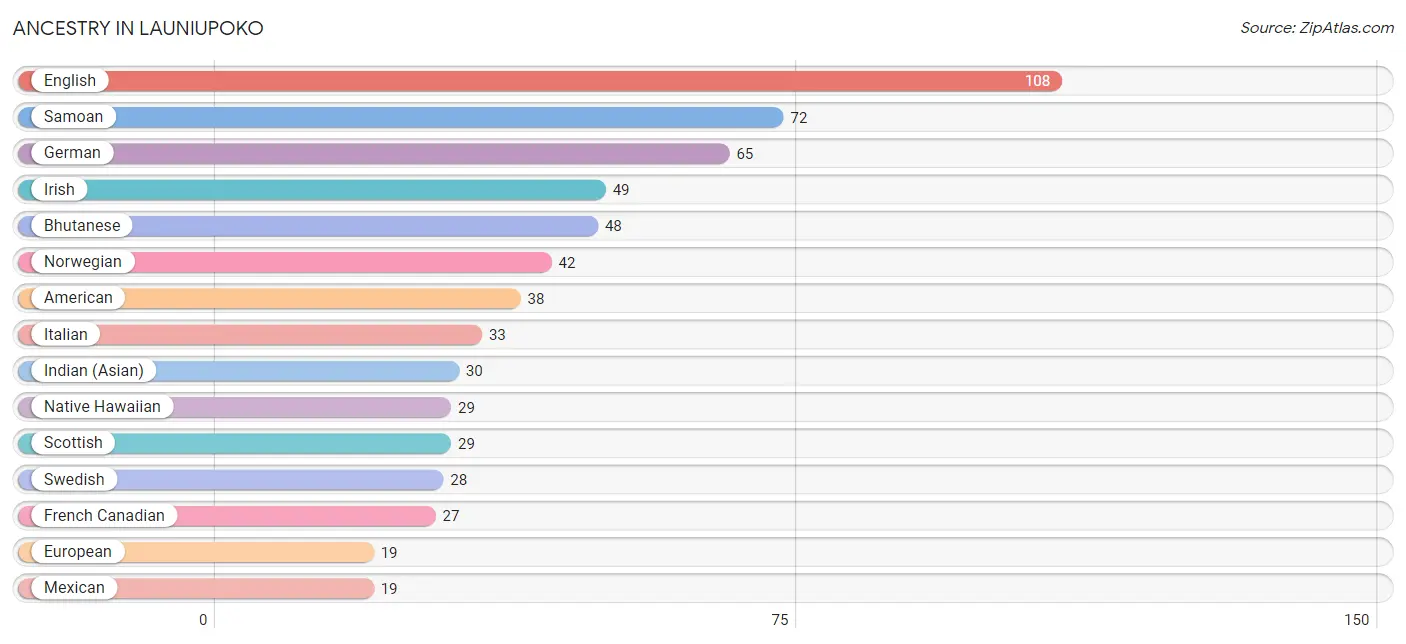
| Ancestry | # Population | % Population |
| American | 38 | 5.9% |
| Arab | 2 | 0.3% |
| Argentinean | 4 | 0.6% |
| Australian | 1 | 0.2% |
| Bhutanese | 48 | 7.4% |
| British | 4 | 0.6% |
| Burmese | 10 | 1.5% |
| Cherokee | 1 | 0.2% |
| Czech | 2 | 0.3% |
| Danish | 4 | 0.6% |
| Dutch | 16 | 2.5% |
| Eastern European | 2 | 0.3% |
| English | 108 | 16.6% |
| European | 19 | 2.9% |
| Fijian | 2 | 0.3% |
| Finnish | 2 | 0.3% |
| French | 3 | 0.5% |
| French Canadian | 27 | 4.2% |
| German | 65 | 10.0% |
| Hungarian | 12 | 1.8% |
| Indian (Asian) | 30 | 4.6% |
| Irish | 49 | 7.5% |
| Italian | 33 | 5.1% |
| Korean | 8 | 1.2% |
| Lebanese | 2 | 0.3% |
| Mexican | 19 | 2.9% |
| Native Hawaiian | 29 | 4.5% |
| New Zealander | 2 | 0.3% |
| Norwegian | 42 | 6.5% |
| Polish | 3 | 0.5% |
| Portuguese | 3 | 0.5% |
| Puerto Rican | 4 | 0.6% |
| Russian | 7 | 1.1% |
| Samoan | 72 | 11.1% |
| Scandinavian | 8 | 1.2% |
| Scotch-Irish | 12 | 1.8% |
| Scottish | 29 | 4.5% |
| Slovak | 7 | 1.1% |
| South American | 6 | 0.9% |
| Spaniard | 3 | 0.5% |
| Spanish | 12 | 1.8% |
| Swedish | 28 | 4.3% |
| Swiss | 5 | 0.8% |
| Tongan | 2 | 0.3% |
| Ukrainian | 3 | 0.5% |
| Venezuelan | 2 | 0.3% |
| Welsh | 4 | 0.6% | View All 47 Rows |
Immigrants in Launiupoko
The most numerous immigrant groups reported in Launiupoko came from Oceania (54 | 8.3%), Latin America (17 | 2.6%), Canada (13 | 2.0%), Europe (12 | 1.8%), and South America (9 | 1.4%), together accounting for 16.2% of all Launiupoko residents.
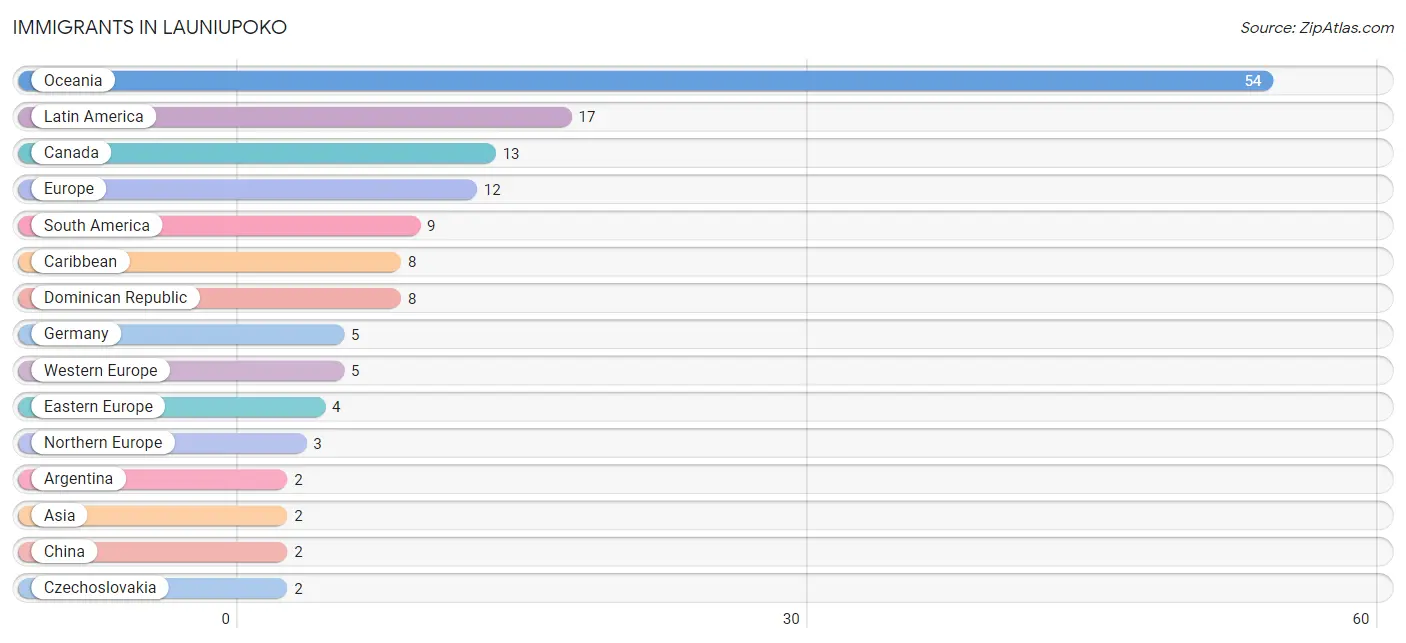
| Immigration Origin | # Population | % Population |
| Argentina | 2 | 0.3% |
| Asia | 2 | 0.3% |
| Australia | 1 | 0.2% |
| Canada | 13 | 2.0% |
| Caribbean | 8 | 1.2% |
| China | 2 | 0.3% |
| Czechoslovakia | 2 | 0.3% |
| Dominican Republic | 8 | 1.2% |
| Eastern Asia | 2 | 0.3% |
| Eastern Europe | 4 | 0.6% |
| Europe | 12 | 1.8% |
| Germany | 5 | 0.8% |
| Latin America | 17 | 2.6% |
| Northern Europe | 3 | 0.5% |
| Oceania | 54 | 8.3% |
| Poland | 2 | 0.3% |
| Scotland | 2 | 0.3% |
| South America | 9 | 1.4% |
| Taiwan | 2 | 0.3% |
| Western Europe | 5 | 0.8% | View All 20 Rows |
Sex and Age in Launiupoko
Sex and Age in Launiupoko
The most populous age groups in Launiupoko are 60 to 64 Years (57 | 19.1%) for men and 50 to 54 Years (52 | 14.8%) for women.
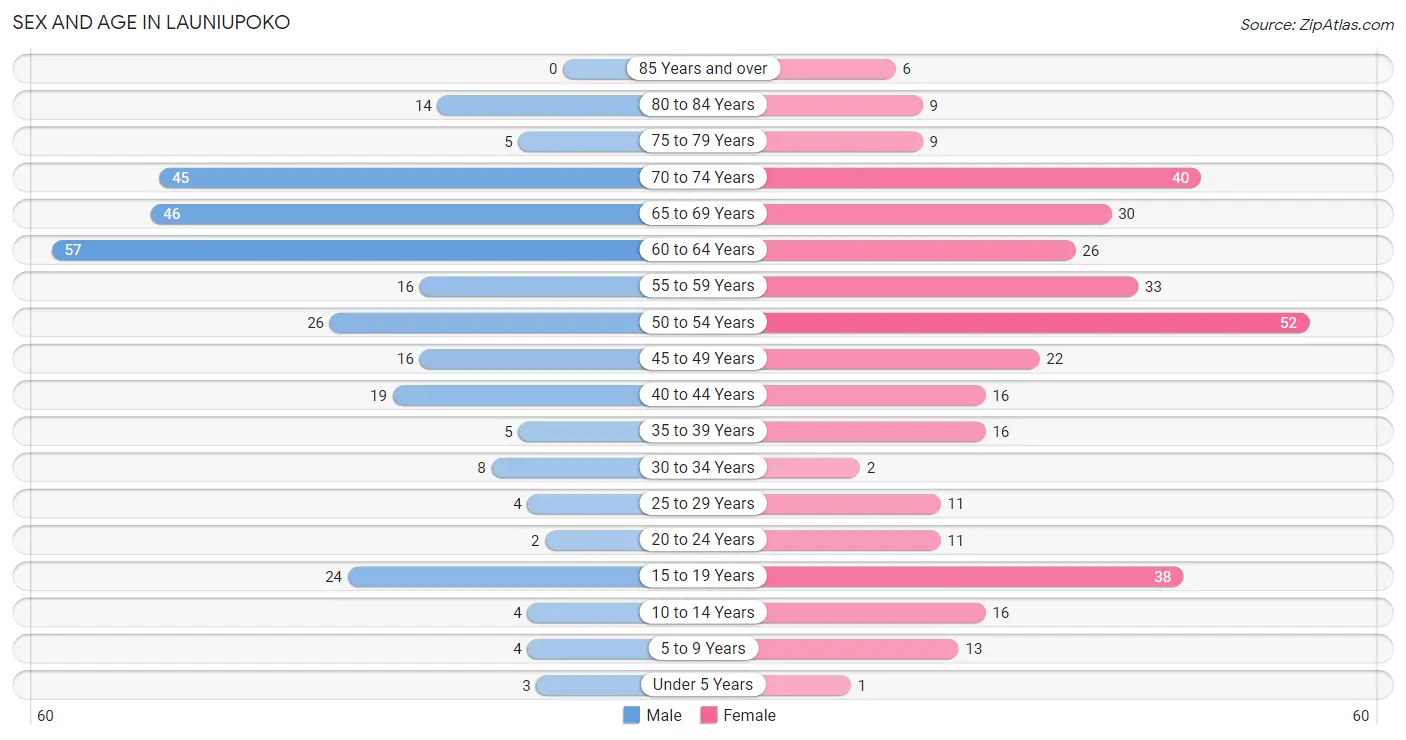
| Age Bracket | Male | Female |
| Under 5 Years | 3 (1.0%) | 1 (0.3%) |
| 5 to 9 Years | 4 (1.3%) | 13 (3.7%) |
| 10 to 14 Years | 4 (1.3%) | 16 (4.6%) |
| 15 to 19 Years | 24 (8.1%) | 38 (10.8%) |
| 20 to 24 Years | 2 (0.7%) | 11 (3.1%) |
| 25 to 29 Years | 4 (1.3%) | 11 (3.1%) |
| 30 to 34 Years | 8 (2.7%) | 2 (0.6%) |
| 35 to 39 Years | 5 (1.7%) | 16 (4.6%) |
| 40 to 44 Years | 19 (6.4%) | 16 (4.6%) |
| 45 to 49 Years | 16 (5.4%) | 22 (6.3%) |
| 50 to 54 Years | 26 (8.7%) | 52 (14.8%) |
| 55 to 59 Years | 16 (5.4%) | 33 (9.4%) |
| 60 to 64 Years | 57 (19.1%) | 26 (7.4%) |
| 65 to 69 Years | 46 (15.4%) | 30 (8.6%) |
| 70 to 74 Years | 45 (15.1%) | 40 (11.4%) |
| 75 to 79 Years | 5 (1.7%) | 9 (2.6%) |
| 80 to 84 Years | 14 (4.7%) | 9 (2.6%) |
| 85 Years and over | 0 (0.0%) | 6 (1.7%) |
| Total | 298 (100.0%) | 351 (100.0%) |
Families and Households in Launiupoko
Median Family Size in Launiupoko
The median family size in Launiupoko is 2.66 persons per family, with single female/mother families (20 | 10.0%) accounting for the largest median family size of 2.9 persons per family. On the other hand, single male/father families (15 | 7.5%) represent the smallest median family size with 2.53 persons per family.
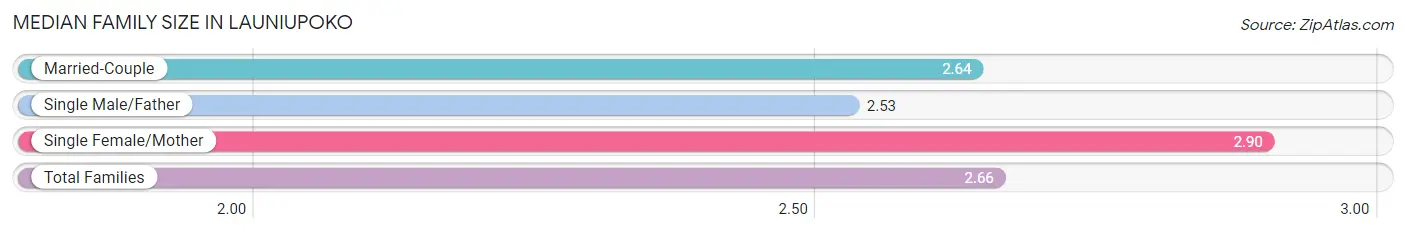
| Family Type | # Families | Family Size |
| Married-Couple | 166 (82.6%) | 2.64 |
| Single Male/Father | 15 (7.5%) | 2.53 |
| Single Female/Mother | 20 (10.0%) | 2.90 |
| Total Families | 201 (100.0%) | 2.66 |
Median Household Size in Launiupoko
The median household size in Launiupoko is 2.60 persons per household, with single female/mother households (20 | 8.0%) accounting for the largest median household size of 2.9 persons per household. non-family households (49 | 19.6%) represent the smallest median household size with 1.82 persons per household.
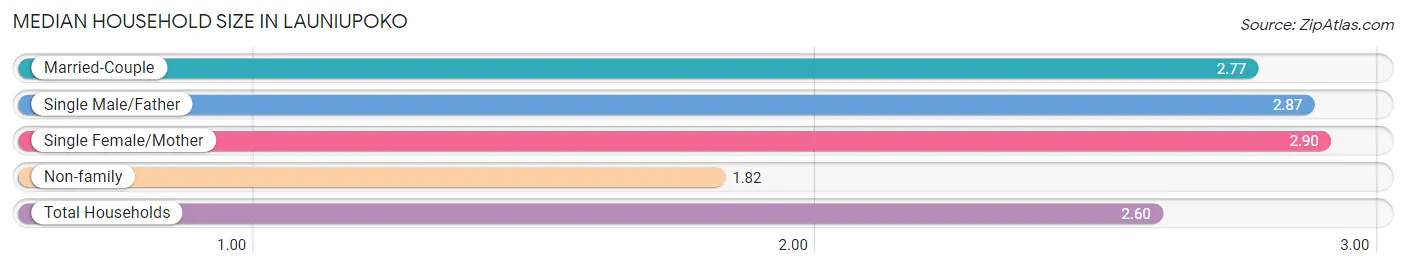
| Household Type | # Households | Household Size |
| Married-Couple | 166 (66.4%) | 2.77 |
| Single Male/Father | 15 (6.0%) | 2.87 |
| Single Female/Mother | 20 (8.0%) | 2.90 |
| Non-family | 49 (19.6%) | 1.82 |
| Total Households | 250 (100.0%) | 2.60 |
Household Size by Marriage Status in Launiupoko
Out of a total of 250 households in Launiupoko, 201 (80.4%) are family households, while 49 (19.6%) are nonfamily households. The most numerous type of family households are 2-person households, comprising 119, and the most common type of nonfamily households are 1-person households, comprising 34.
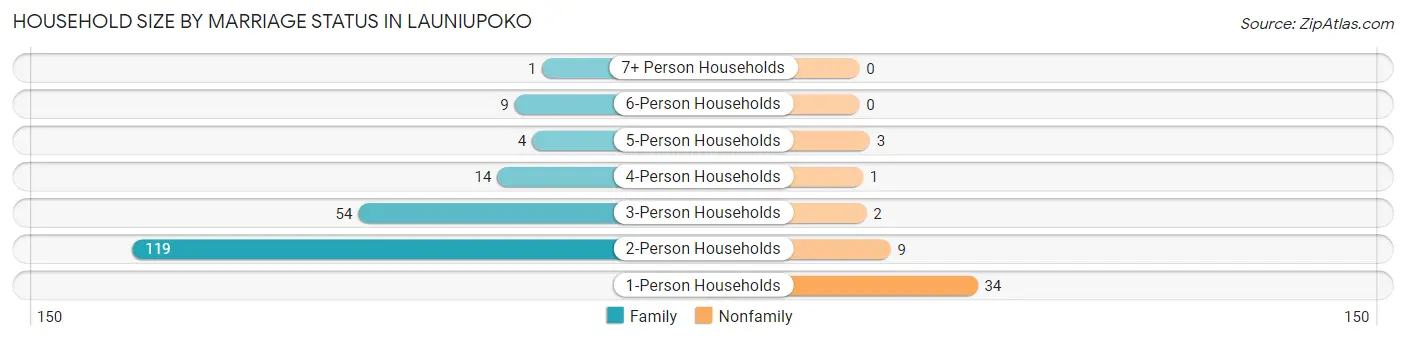
| Household Size | Family Households | Nonfamily Households |
| 1-Person Households | - | 34 (13.6%) |
| 2-Person Households | 119 (47.6%) | 9 (3.6%) |
| 3-Person Households | 54 (21.6%) | 2 (0.8%) |
| 4-Person Households | 14 (5.6%) | 1 (0.4%) |
| 5-Person Households | 4 (1.6%) | 3 (1.2%) |
| 6-Person Households | 9 (3.6%) | 0 (0.0%) |
| 7+ Person Households | 1 (0.4%) | 0 (0.0%) |
| Total | 201 (80.4%) | 49 (19.6%) |
Female Fertility in Launiupoko
Fertility by Age in Launiupoko
Average fertility rate in Launiupoko is 17.0 births per 1,000 women. Women in the age bracket of 35 to 50 years have the highest fertility rate with 37.0 births per 1,000 women. Women in the age bracket of 35 to 50 years acount for 100.0% of all women with births.
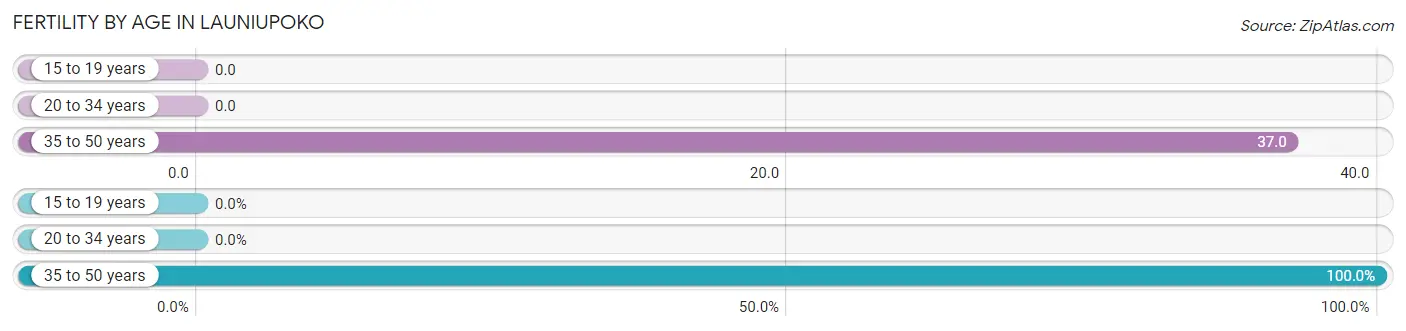
| Age Bracket | Women with Births | Births / 1,000 Women |
| 15 to 19 years | 0 (0.0%) | 0.0 |
| 20 to 34 years | 0 (0.0%) | 0.0 |
| 35 to 50 years | 2 (100.0%) | 37.0 |
| Total | 2 (100.0%) | 17.0 |
Fertility by Age by Marriage Status in Launiupoko
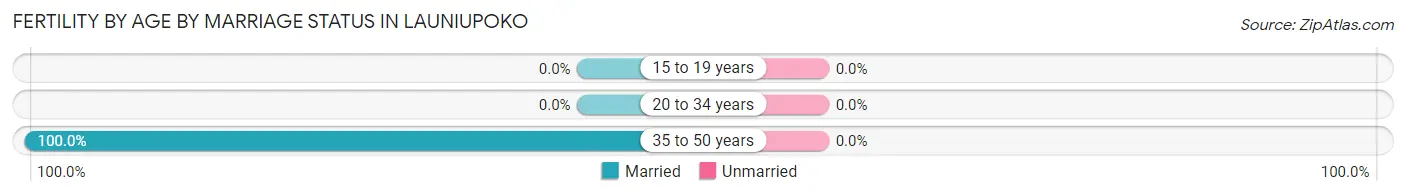
| Age Bracket | Married | Unmarried |
| 15 to 19 years | 0 (0.0%) | 0 (0.0%) |
| 20 to 34 years | 0 (0.0%) | 0 (0.0%) |
| 35 to 50 years | 2 (100.0%) | 0 (0.0%) |
| Total | 2 (100.0%) | 0 (0.0%) |
Fertility by Education in Launiupoko
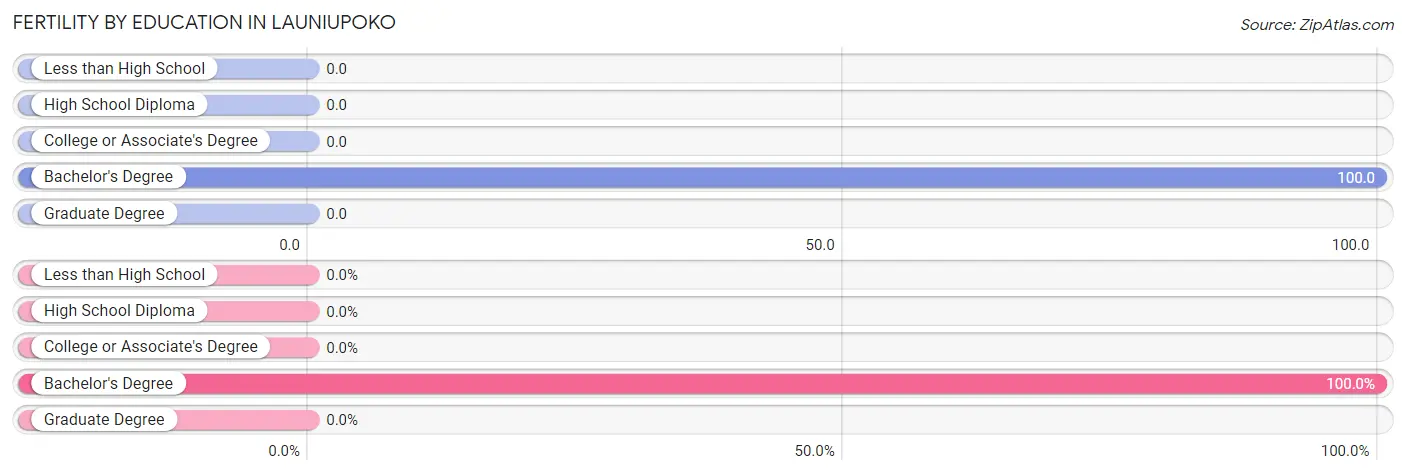
| Educational Attainment | Women with Births | Births / 1,000 Women |
| Less than High School | 0 (0.0%) | 0.0 |
| High School Diploma | 0 (0.0%) | 0.0 |
| College or Associate's Degree | 0 (0.0%) | 0.0 |
| Bachelor's Degree | 2 (100.0%) | 100.0 |
| Graduate Degree | 0 (0.0%) | 0.0 |
| Total | 2 (100.0%) | 17.0 |
Fertility by Education by Marriage Status in Launiupoko
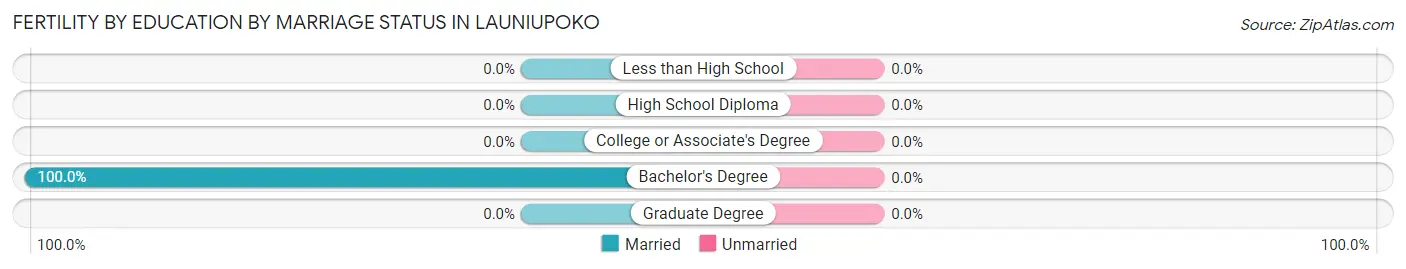
| Educational Attainment | Married | Unmarried |
| Less than High School | 0 (0.0%) | 0 (0.0%) |
| High School Diploma | 0 (0.0%) | 0 (0.0%) |
| College or Associate's Degree | 0 (0.0%) | 0 (0.0%) |
| Bachelor's Degree | 2 (100.0%) | 0 (0.0%) |
| Graduate Degree | 0 (0.0%) | 0 (0.0%) |
| Total | 2 (100.0%) | 0 (0.0%) |
Employment Characteristics in Launiupoko
Employment by Class of Employer in Launiupoko
Among the 275 employed individuals in Launiupoko, private company employees (154 | 56.0%), self-employed (not incorporated) (42 | 15.3%), and self-employed (incorporated) (35 | 12.7%) make up the most common classes of employment.
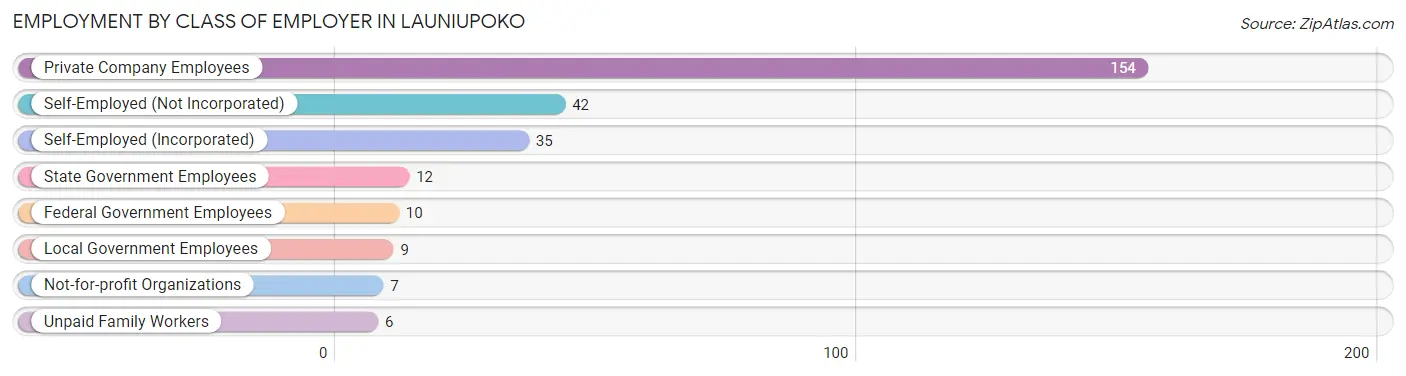
| Employer Class | # Employees | % Employees |
| Private Company Employees | 154 | 56.0% |
| Self-Employed (Incorporated) | 35 | 12.7% |
| Self-Employed (Not Incorporated) | 42 | 15.3% |
| Not-for-profit Organizations | 7 | 2.5% |
| Local Government Employees | 9 | 3.3% |
| State Government Employees | 12 | 4.4% |
| Federal Government Employees | 10 | 3.6% |
| Unpaid Family Workers | 6 | 2.2% |
| Total | 275 | 100.0% |
Employment Status by Age in Launiupoko
According to the labor force statistics for Launiupoko, out of the total population over 16 years of age (565), 55.4% or 313 individuals are in the labor force, with 9.7% or 30 of them unemployed. The age group with the highest labor force participation rate is 20 to 24 years, with 100.0% or 13 individuals in the labor force. Within the labor force, the 25 to 29 years age range has the highest percentage of unemployed individuals, with 40.0% or 6 of them being unemployed.
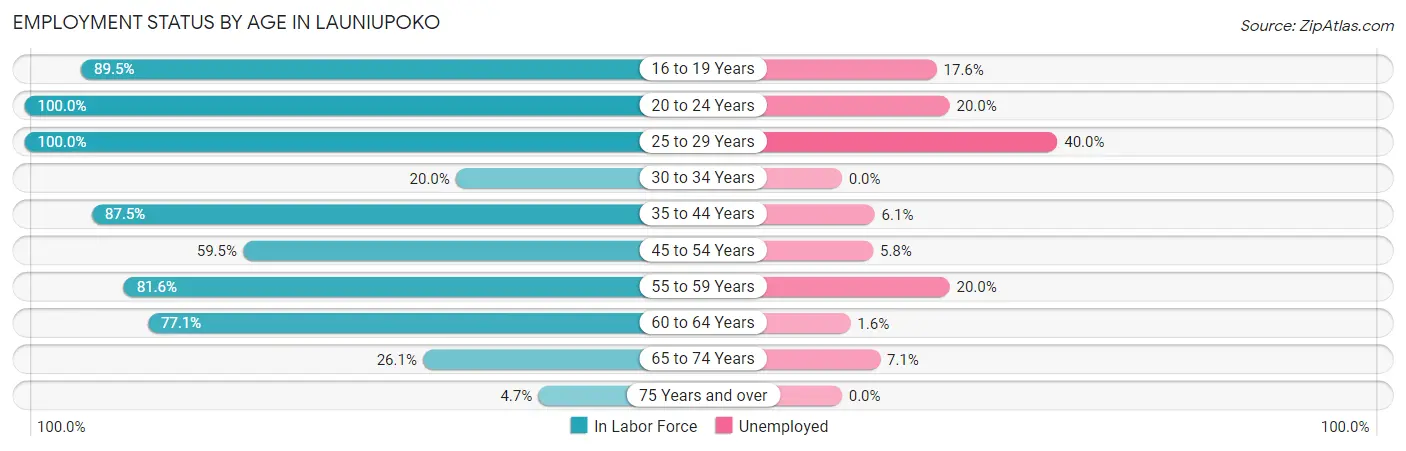
| Age Bracket | In Labor Force | Unemployed |
| 16 to 19 Years | 17 (89.5%) | 3 (17.6%) |
| 20 to 24 Years | 13 (100.0%) | 3 (20.0%) |
| 25 to 29 Years | 15 (100.0%) | 6 (40.0%) |
| 30 to 34 Years | 2 (20.0%) | 0 (0.0%) |
| 35 to 44 Years | 49 (87.5%) | 3 (6.1%) |
| 45 to 54 Years | 69 (59.5%) | 4 (5.8%) |
| 55 to 59 Years | 40 (81.6%) | 8 (20.0%) |
| 60 to 64 Years | 64 (77.1%) | 1 (1.6%) |
| 65 to 74 Years | 42 (26.1%) | 3 (7.1%) |
| 75 Years and over | 2 (4.7%) | 0 (0.0%) |
| Total | 313 (55.4%) | 30 (9.7%) |
Employment Status by Educational Attainment in Launiupoko
According to labor force statistics for Launiupoko, 72.6% of individuals (239) out of the total population between 25 and 64 years of age (329) are in the labor force, with 9.2% or 22 of them being unemployed. The group with the highest labor force participation rate are those with the educational attainment of college / associate degree, with 85.0% or 91 individuals in the labor force. Within the labor force, individuals with bachelor's degree or higher education have the highest percentage of unemployment, with 16.3% or 16 of them being unemployed.
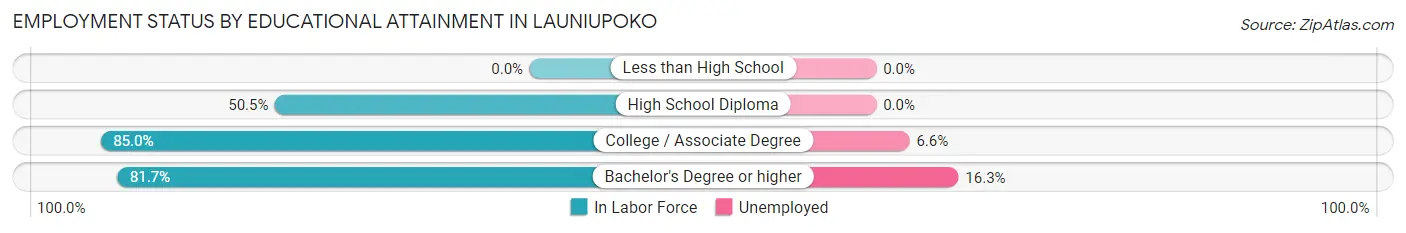
| Educational Attainment | In Labor Force | Unemployed |
| Less than High School | 0 (0.0%) | 0 (0.0%) |
| High School Diploma | 50 (50.5%) | 0 (0.0%) |
| College / Associate Degree | 91 (85.0%) | 7 (6.6%) |
| Bachelor's Degree or higher | 98 (81.7%) | 20 (16.3%) |
| Total | 239 (72.6%) | 30 (9.2%) |
Employment Occupations by Sex in Launiupoko
Management, Business, Science and Arts Occupations
The most common Management, Business, Science and Arts occupations in Launiupoko are Management (72 | 25.7%), Community & Social Service (36 | 12.9%), Education Instruction & Library (19 | 6.8%), Arts, Media & Entertainment (15 | 5.4%), and Computers, Engineering & Science (8 | 2.9%).
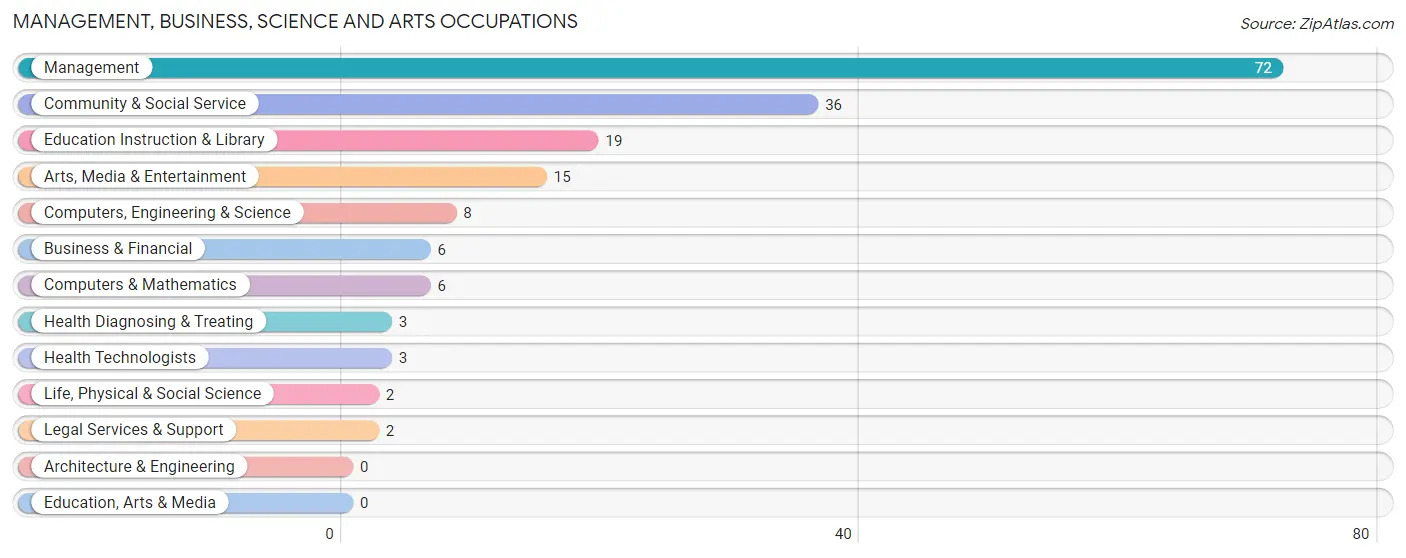
Management, Business, Science and Arts Occupations by Sex
Within the Management, Business, Science and Arts occupations in Launiupoko, the most male-oriented occupations are Life, Physical & Social Science (100.0%), Management (90.3%), and Computers, Engineering & Science (75.0%), while the most female-oriented occupations are Business & Financial (100.0%), Legal Services & Support (100.0%), and Education Instruction & Library (89.5%).
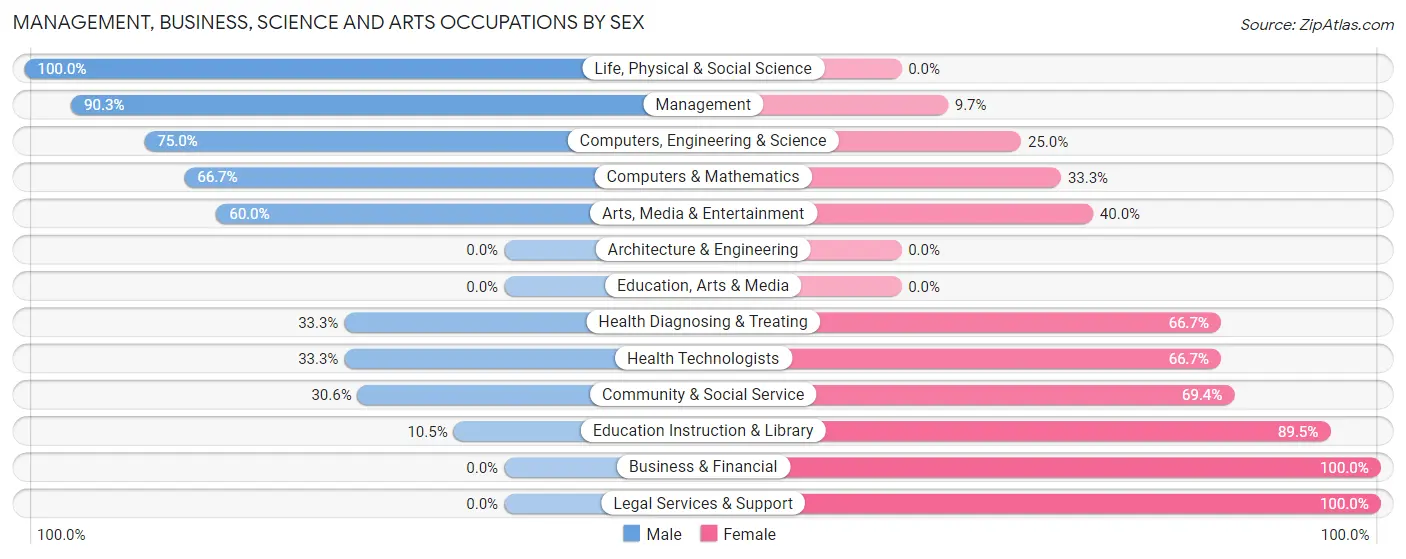
| Occupation | Male | Female |
| Management | 65 (90.3%) | 7 (9.7%) |
| Business & Financial | 0 (0.0%) | 6 (100.0%) |
| Computers, Engineering & Science | 6 (75.0%) | 2 (25.0%) |
| Computers & Mathematics | 4 (66.7%) | 2 (33.3%) |
| Architecture & Engineering | 0 (0.0%) | 0 (0.0%) |
| Life, Physical & Social Science | 2 (100.0%) | 0 (0.0%) |
| Community & Social Service | 11 (30.6%) | 25 (69.4%) |
| Education, Arts & Media | 0 (0.0%) | 0 (0.0%) |
| Legal Services & Support | 0 (0.0%) | 2 (100.0%) |
| Education Instruction & Library | 2 (10.5%) | 17 (89.5%) |
| Arts, Media & Entertainment | 9 (60.0%) | 6 (40.0%) |
| Health Diagnosing & Treating | 1 (33.3%) | 2 (66.7%) |
| Health Technologists | 1 (33.3%) | 2 (66.7%) |
| Total (Category) | 83 (66.4%) | 42 (33.6%) |
| Total (Overall) | 169 (60.4%) | 111 (39.6%) |
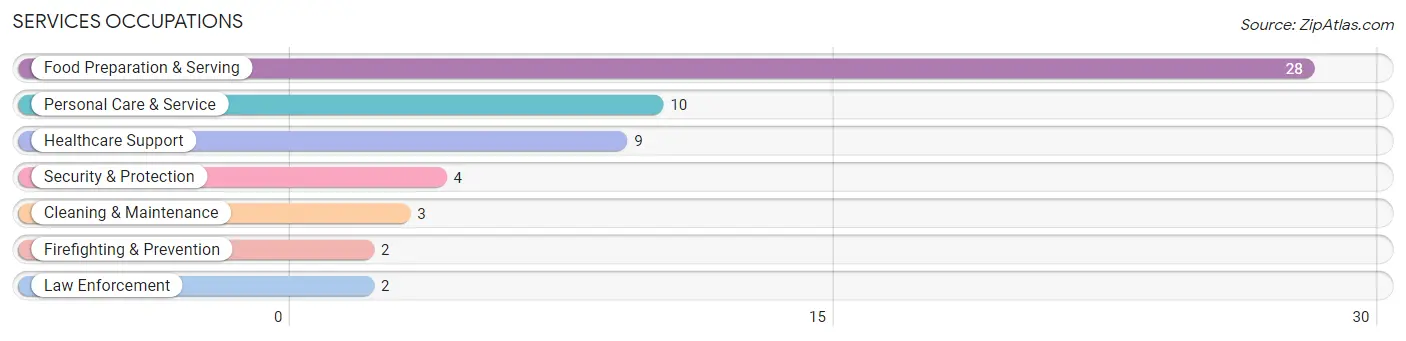
Services Occupations
The most common Services occupations in Launiupoko are Food Preparation & Serving (28 | 10.0%), Personal Care & Service (10 | 3.6%), Healthcare Support (9 | 3.2%), Security & Protection (4 | 1.4%), and Cleaning & Maintenance (3 | 1.1%).
Services Occupations by Sex
Within the Services occupations in Launiupoko, the most male-oriented occupations are Firefighting & Prevention (100.0%), Personal Care & Service (90.0%), and Food Preparation & Serving (67.9%), while the most female-oriented occupations are Healthcare Support (100.0%), Law Enforcement (100.0%), and Security & Protection (50.0%).
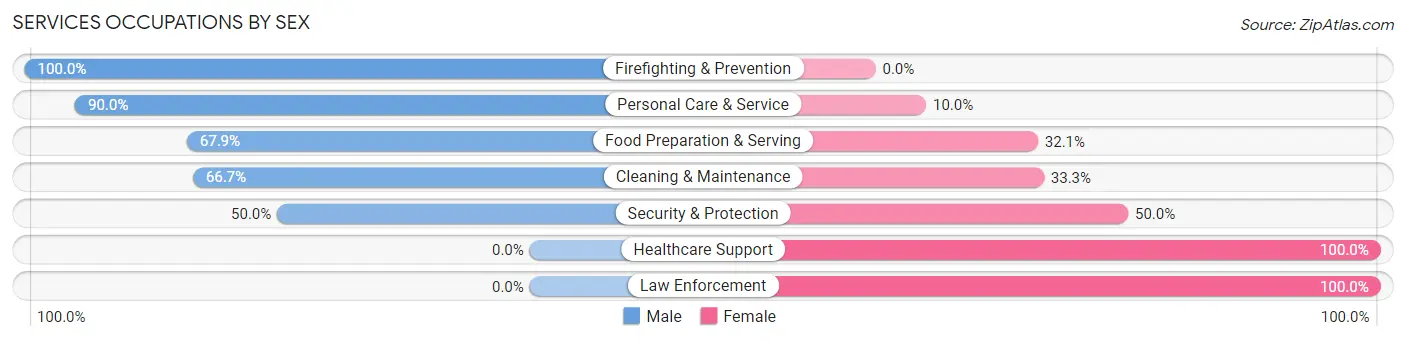
| Occupation | Male | Female |
| Healthcare Support | 0 (0.0%) | 9 (100.0%) |
| Security & Protection | 2 (50.0%) | 2 (50.0%) |
| Firefighting & Prevention | 2 (100.0%) | 0 (0.0%) |
| Law Enforcement | 0 (0.0%) | 2 (100.0%) |
| Food Preparation & Serving | 19 (67.9%) | 9 (32.1%) |
| Cleaning & Maintenance | 2 (66.7%) | 1 (33.3%) |
| Personal Care & Service | 9 (90.0%) | 1 (10.0%) |
| Total (Category) | 32 (59.3%) | 22 (40.7%) |
| Total (Overall) | 169 (60.4%) | 111 (39.6%) |
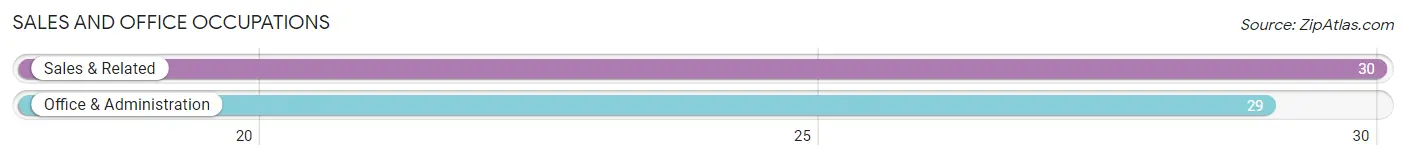
Sales and Office Occupations
The most common Sales and Office occupations in Launiupoko are Sales & Related (30 | 10.7%), and Office & Administration (29 | 10.4%).
Sales and Office Occupations by Sex
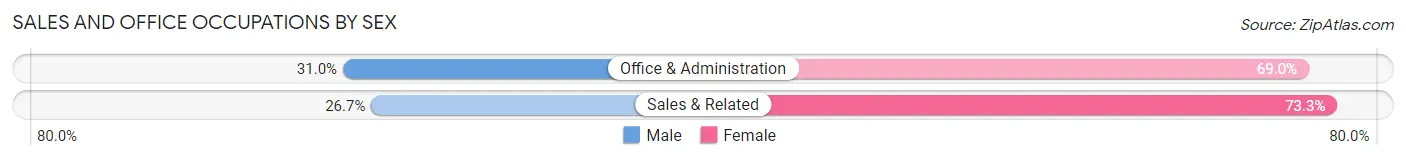
| Occupation | Male | Female |
| Sales & Related | 8 (26.7%) | 22 (73.3%) |
| Office & Administration | 9 (31.0%) | 20 (69.0%) |
| Total (Category) | 17 (28.8%) | 42 (71.2%) |
| Total (Overall) | 169 (60.4%) | 111 (39.6%) |
Natural Resources, Construction and Maintenance Occupations
The most common Natural Resources, Construction and Maintenance occupations in Launiupoko are , and Construction & Extraction (9 | 3.2%).
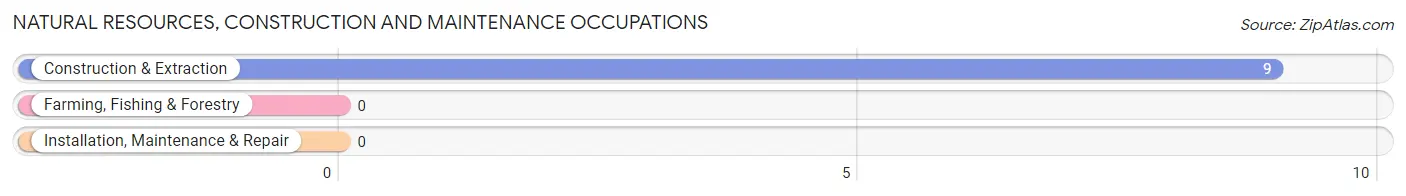
Natural Resources, Construction and Maintenance Occupations by Sex
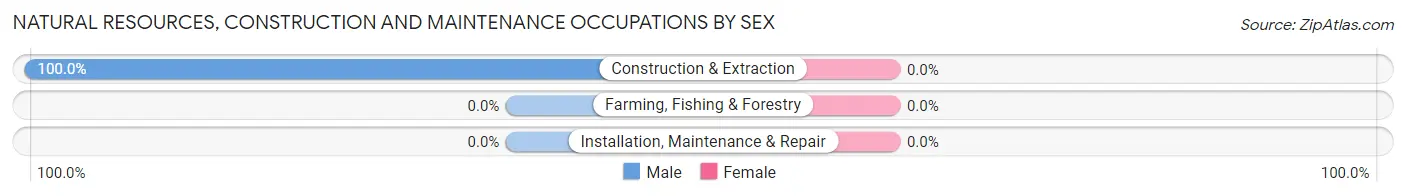
| Occupation | Male | Female |
| Farming, Fishing & Forestry | 0 (0.0%) | 0 (0.0%) |
| Construction & Extraction | 9 (100.0%) | 0 (0.0%) |
| Installation, Maintenance & Repair | 0 (0.0%) | 0 (0.0%) |
| Total (Category) | 9 (100.0%) | 0 (0.0%) |
| Total (Overall) | 169 (60.4%) | 111 (39.6%) |
Production, Transportation and Moving Occupations
The most common Production, Transportation and Moving occupations in Launiupoko are Transportation (19 | 6.8%), and Production (14 | 5.0%).
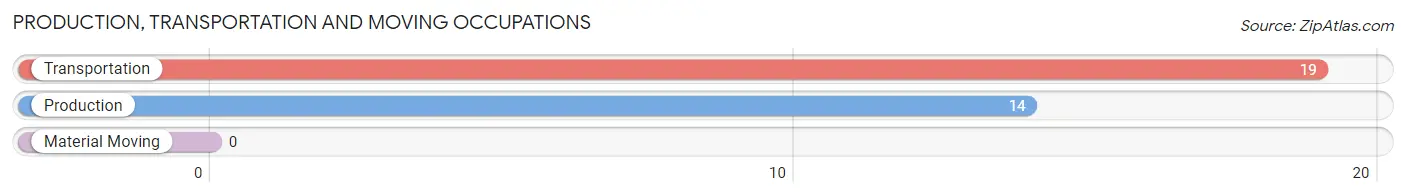
Production, Transportation and Moving Occupations by Sex
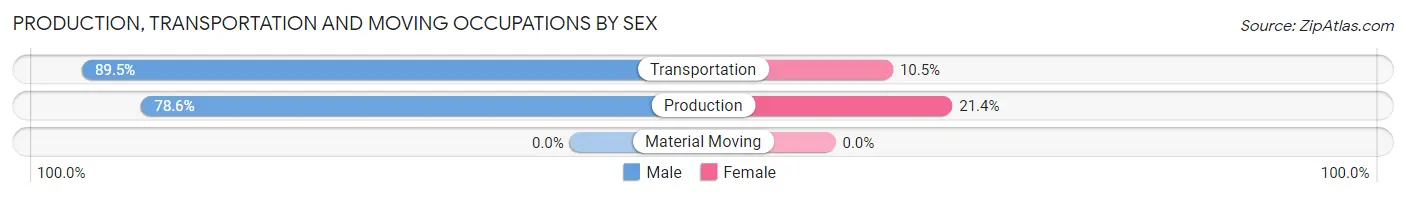
| Occupation | Male | Female |
| Production | 11 (78.6%) | 3 (21.4%) |
| Transportation | 17 (89.5%) | 2 (10.5%) |
| Material Moving | 0 (0.0%) | 0 (0.0%) |
| Total (Category) | 28 (84.9%) | 5 (15.1%) |
| Total (Overall) | 169 (60.4%) | 111 (39.6%) |
Employment Industries by Sex in Launiupoko
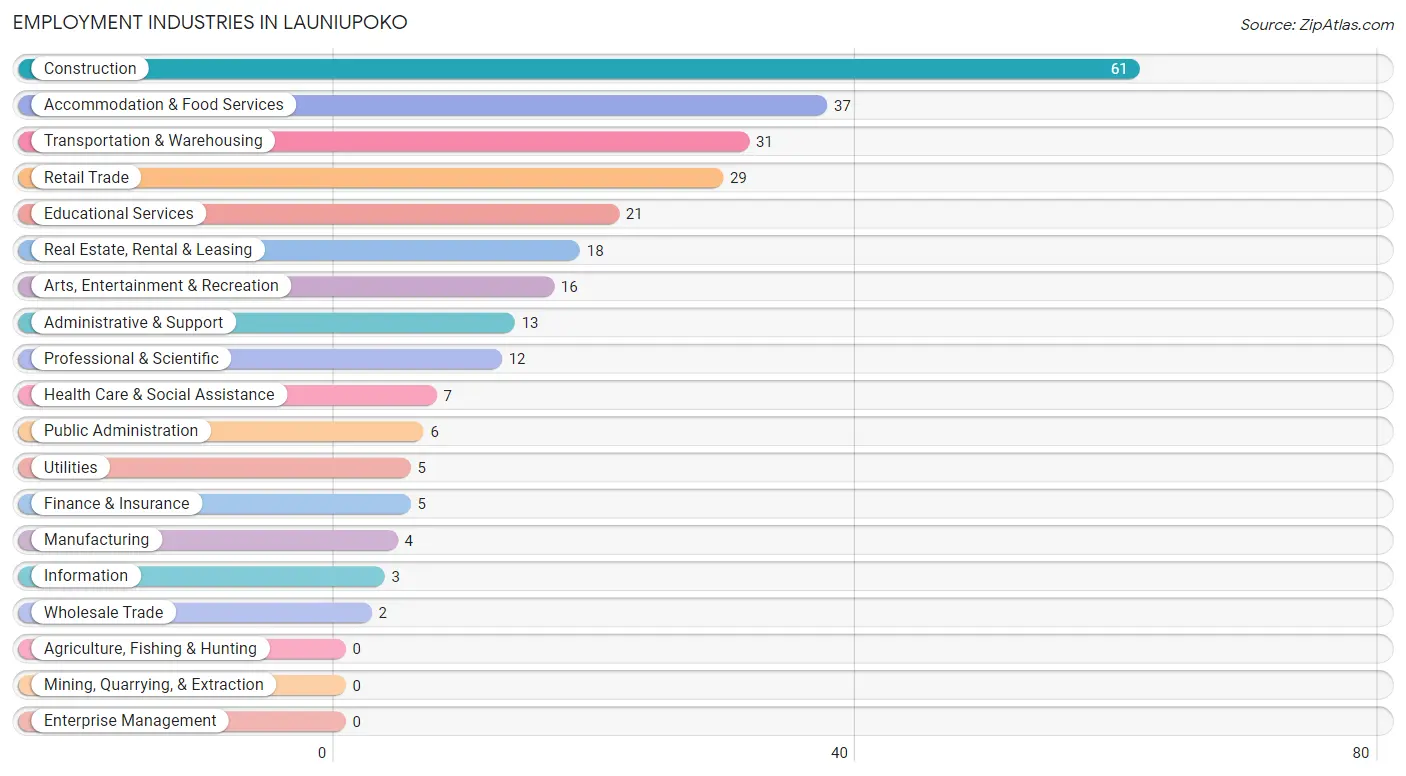
Employment Industries in Launiupoko
The major employment industries in Launiupoko include Construction (61 | 21.8%), Accommodation & Food Services (37 | 13.2%), Transportation & Warehousing (31 | 11.1%), Retail Trade (29 | 10.4%), and Educational Services (21 | 7.5%).
Employment Industries by Sex in Launiupoko
The Launiupoko industries that see more men than women are Construction (100.0%), Wholesale Trade (100.0%), and Utilities (100.0%), whereas the industries that tend to have a higher number of women are Information (100.0%), Finance & Insurance (100.0%), and Health Care & Social Assistance (85.7%).
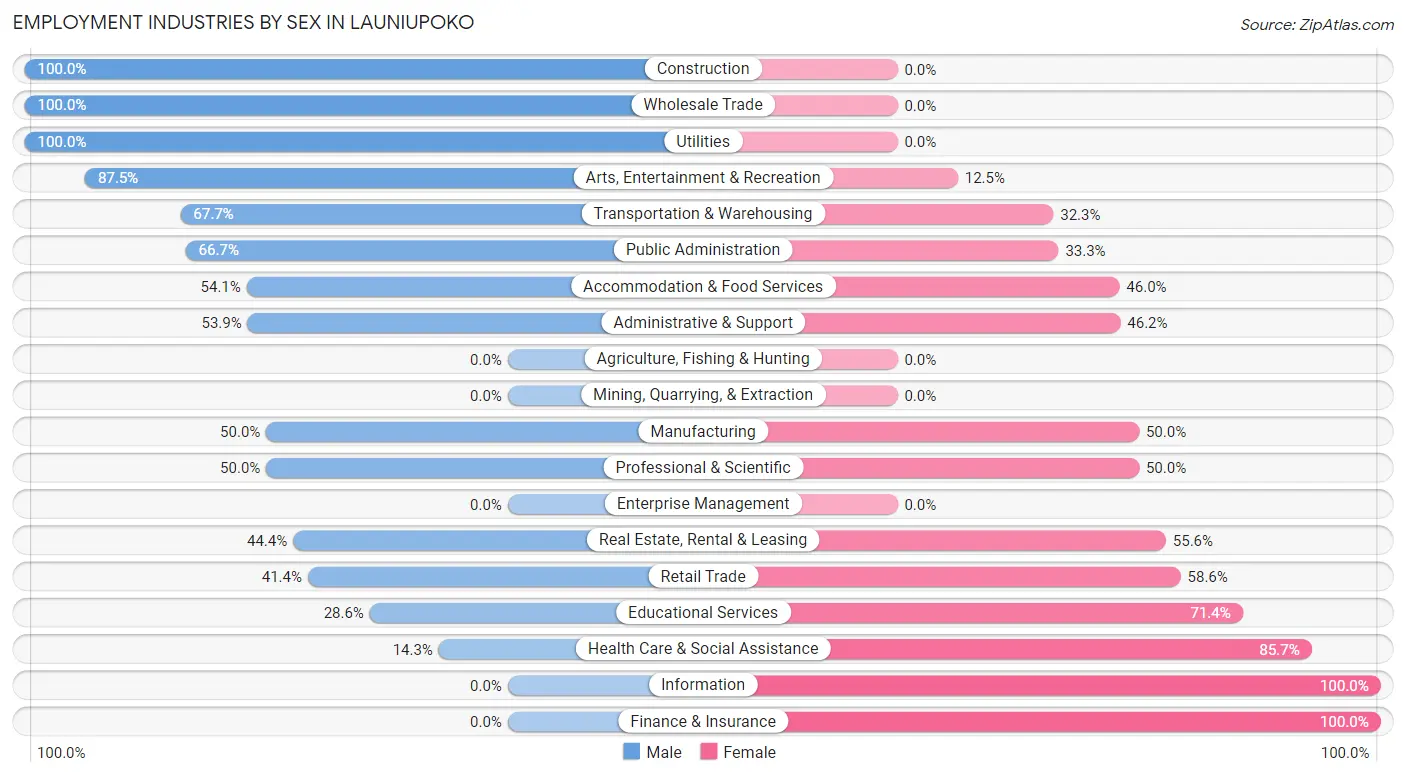
| Industry | Male | Female |
| Agriculture, Fishing & Hunting | 0 (0.0%) | 0 (0.0%) |
| Mining, Quarrying, & Extraction | 0 (0.0%) | 0 (0.0%) |
| Construction | 61 (100.0%) | 0 (0.0%) |
| Manufacturing | 2 (50.0%) | 2 (50.0%) |
| Wholesale Trade | 2 (100.0%) | 0 (0.0%) |
| Retail Trade | 12 (41.4%) | 17 (58.6%) |
| Transportation & Warehousing | 21 (67.7%) | 10 (32.3%) |
| Utilities | 5 (100.0%) | 0 (0.0%) |
| Information | 0 (0.0%) | 3 (100.0%) |
| Finance & Insurance | 0 (0.0%) | 5 (100.0%) |
| Real Estate, Rental & Leasing | 8 (44.4%) | 10 (55.6%) |
| Professional & Scientific | 6 (50.0%) | 6 (50.0%) |
| Enterprise Management | 0 (0.0%) | 0 (0.0%) |
| Administrative & Support | 7 (53.8%) | 6 (46.2%) |
| Educational Services | 6 (28.6%) | 15 (71.4%) |
| Health Care & Social Assistance | 1 (14.3%) | 6 (85.7%) |
| Arts, Entertainment & Recreation | 14 (87.5%) | 2 (12.5%) |
| Accommodation & Food Services | 20 (54.0%) | 17 (46.0%) |
| Public Administration | 4 (66.7%) | 2 (33.3%) |
| Total | 169 (60.4%) | 111 (39.6%) |
Education in Launiupoko
School Enrollment in Launiupoko
The most common levels of schooling among the 106 students in Launiupoko are high school (49 | 46.2%), middle school (20 | 18.9%), and college / undergraduate (17 | 16.0%).
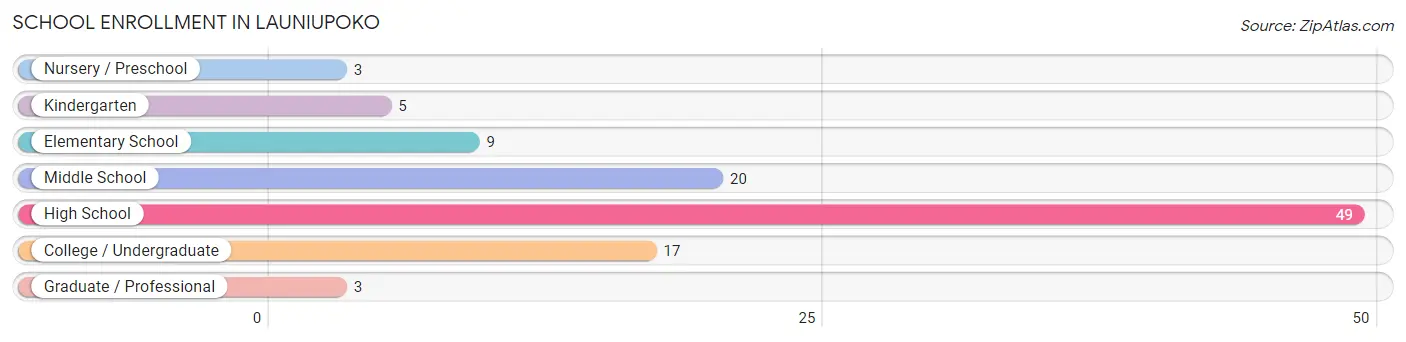
| School Level | # Students | % Students |
| Nursery / Preschool | 3 | 2.8% |
| Kindergarten | 5 | 4.7% |
| Elementary School | 9 | 8.5% |
| Middle School | 20 | 18.9% |
| High School | 49 | 46.2% |
| College / Undergraduate | 17 | 16.0% |
| Graduate / Professional | 3 | 2.8% |
| Total | 106 | 100.0% |
School Enrollment by Age by Funding Source in Launiupoko
Out of a total of 106 students who are enrolled in schools in Launiupoko, 14 (13.2%) attend a private institution, while the remaining 92 (86.8%) are enrolled in public schools. The age group of 3 to 4 year olds has the highest likelihood of being enrolled in private schools, with 3 (100.0% in the age bracket) enrolled. Conversely, the age group of 18 to 19 year olds has the lowest likelihood of being enrolled in a private school, with 16 (100.0% in the age bracket) attending a public institution.
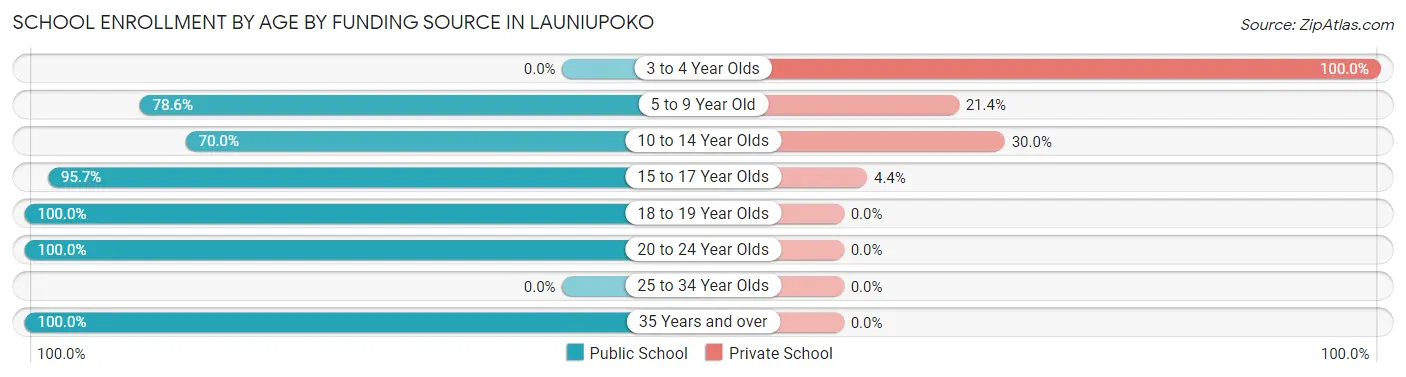
| Age Bracket | Public School | Private School |
| 3 to 4 Year Olds | 0 (0.0%) | 3 (100.0%) |
| 5 to 9 Year Old | 11 (78.6%) | 3 (21.4%) |
| 10 to 14 Year Olds | 14 (70.0%) | 6 (30.0%) |
| 15 to 17 Year Olds | 44 (95.7%) | 2 (4.3%) |
| 18 to 19 Year Olds | 16 (100.0%) | 0 (0.0%) |
| 20 to 24 Year Olds | 4 (100.0%) | 0 (0.0%) |
| 25 to 34 Year Olds | 0 (0.0%) | 0 (0.0%) |
| 35 Years and over | 3 (100.0%) | 0 (0.0%) |
| Total | 92 (86.8%) | 14 (13.2%) |
Educational Attainment by Field of Study in Launiupoko
Business (44 | 17.5%), education (32 | 12.7%), social sciences (26 | 10.3%), bio, nature & agricultural (21 | 8.3%), and liberal arts & history (21 | 8.3%) are the most common fields of study among 252 individuals in Launiupoko who have obtained a bachelor's degree or higher.
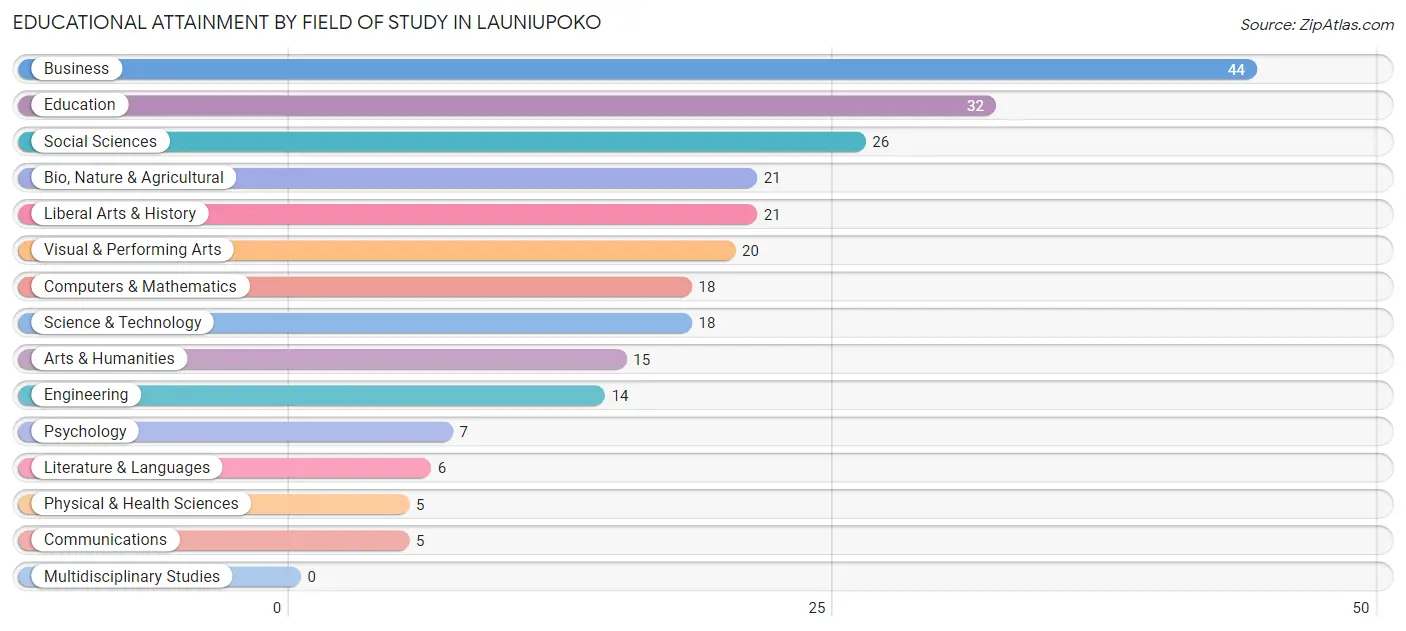
| Field of Study | # Graduates | % Graduates |
| Computers & Mathematics | 18 | 7.1% |
| Bio, Nature & Agricultural | 21 | 8.3% |
| Physical & Health Sciences | 5 | 2.0% |
| Psychology | 7 | 2.8% |
| Social Sciences | 26 | 10.3% |
| Engineering | 14 | 5.6% |
| Multidisciplinary Studies | 0 | 0.0% |
| Science & Technology | 18 | 7.1% |
| Business | 44 | 17.5% |
| Education | 32 | 12.7% |
| Literature & Languages | 6 | 2.4% |
| Liberal Arts & History | 21 | 8.3% |
| Visual & Performing Arts | 20 | 7.9% |
| Communications | 5 | 2.0% |
| Arts & Humanities | 15 | 5.9% |
| Total | 252 | 100.0% |
Transportation & Commute in Launiupoko
Vehicle Availability by Sex in Launiupoko
The most prevalent vehicle ownership categories in Launiupoko are males with 2 vehicles (110, accounting for 66.7%) and females with 2 vehicles (40, making up 100.0%).
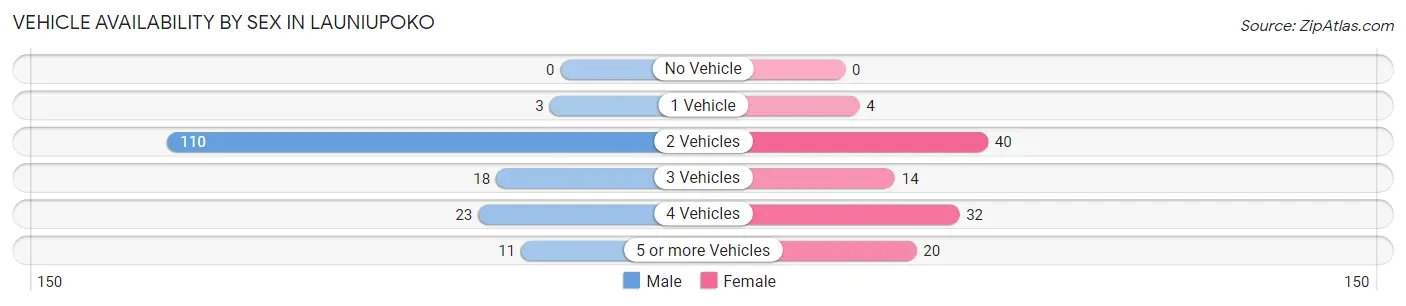
| Vehicles Available | Male | Female |
| No Vehicle | 0 (0.0%) | 0 (0.0%) |
| 1 Vehicle | 3 (1.8%) | 4 (3.6%) |
| 2 Vehicles | 110 (66.7%) | 40 (36.4%) |
| 3 Vehicles | 18 (10.9%) | 14 (12.7%) |
| 4 Vehicles | 23 (13.9%) | 32 (29.1%) |
| 5 or more Vehicles | 11 (6.7%) | 20 (18.2%) |
| Total | 165 (100.0%) | 110 (100.0%) |
Commute Time in Launiupoko
The most frequently occuring commute durations in Launiupoko are 15 to 19 minutes (39 commuters, 22.5%), 30 to 34 minutes (22 commuters, 12.7%), and 5 to 9 minutes (20 commuters, 11.6%).
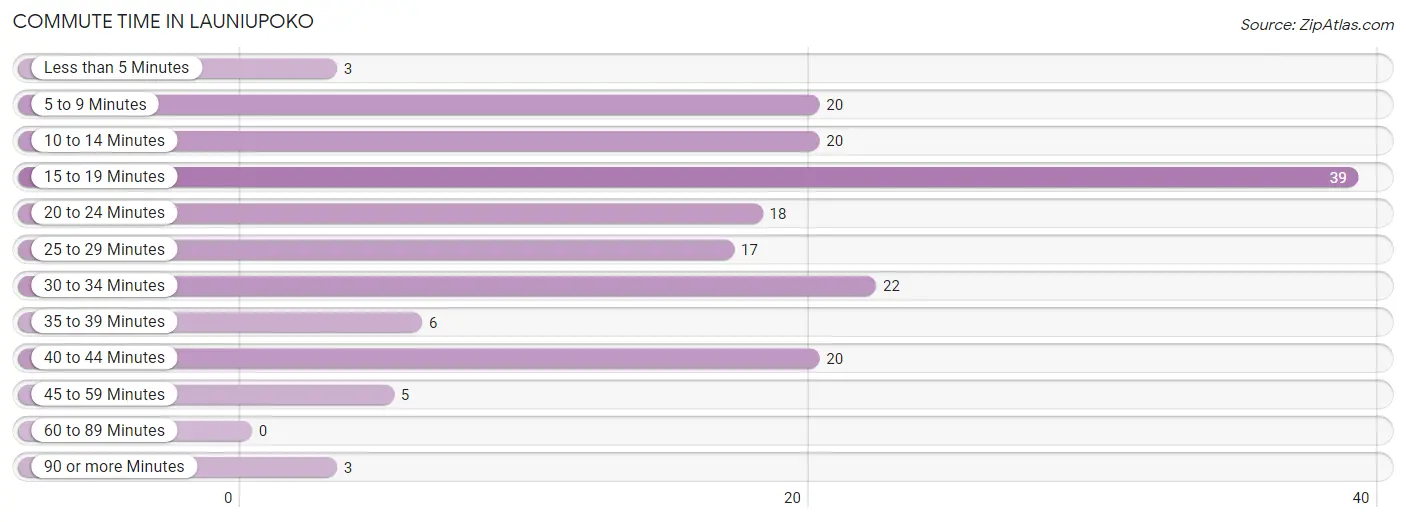
| Commute Time | # Commuters | % Commuters |
| Less than 5 Minutes | 3 | 1.7% |
| 5 to 9 Minutes | 20 | 11.6% |
| 10 to 14 Minutes | 20 | 11.6% |
| 15 to 19 Minutes | 39 | 22.5% |
| 20 to 24 Minutes | 18 | 10.4% |
| 25 to 29 Minutes | 17 | 9.8% |
| 30 to 34 Minutes | 22 | 12.7% |
| 35 to 39 Minutes | 6 | 3.5% |
| 40 to 44 Minutes | 20 | 11.6% |
| 45 to 59 Minutes | 5 | 2.9% |
| 60 to 89 Minutes | 0 | 0.0% |
| 90 or more Minutes | 3 | 1.7% |
Commute Time by Sex in Launiupoko
The most common commute times in Launiupoko are 15 to 19 minutes (25 commuters, 24.3%) for males and 10 to 14 minutes (16 commuters, 22.9%) for females.
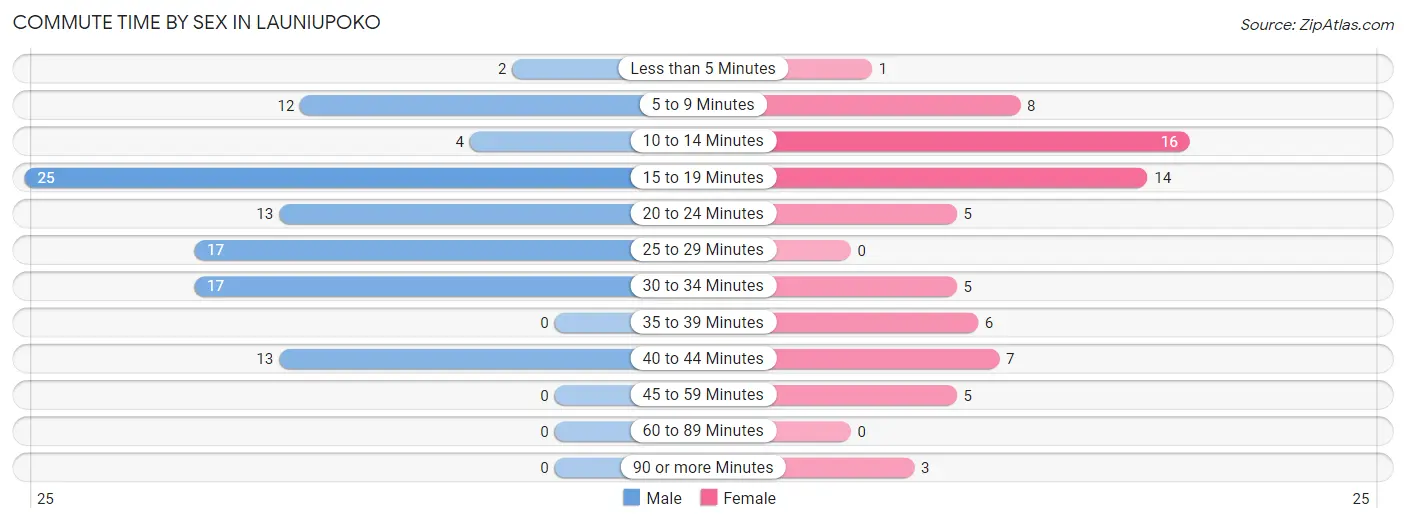
| Commute Time | Male | Female |
| Less than 5 Minutes | 2 (1.9%) | 1 (1.4%) |
| 5 to 9 Minutes | 12 (11.7%) | 8 (11.4%) |
| 10 to 14 Minutes | 4 (3.9%) | 16 (22.9%) |
| 15 to 19 Minutes | 25 (24.3%) | 14 (20.0%) |
| 20 to 24 Minutes | 13 (12.6%) | 5 (7.1%) |
| 25 to 29 Minutes | 17 (16.5%) | 0 (0.0%) |
| 30 to 34 Minutes | 17 (16.5%) | 5 (7.1%) |
| 35 to 39 Minutes | 0 (0.0%) | 6 (8.6%) |
| 40 to 44 Minutes | 13 (12.6%) | 7 (10.0%) |
| 45 to 59 Minutes | 0 (0.0%) | 5 (7.1%) |
| 60 to 89 Minutes | 0 (0.0%) | 0 (0.0%) |
| 90 or more Minutes | 0 (0.0%) | 3 (4.3%) |
Time of Departure to Work by Sex in Launiupoko
The most frequent times of departure to work in Launiupoko are 7:00 AM to 7:29 AM (23, 22.3%) for males and 8:00 AM to 8:29 AM (22, 31.4%) for females.
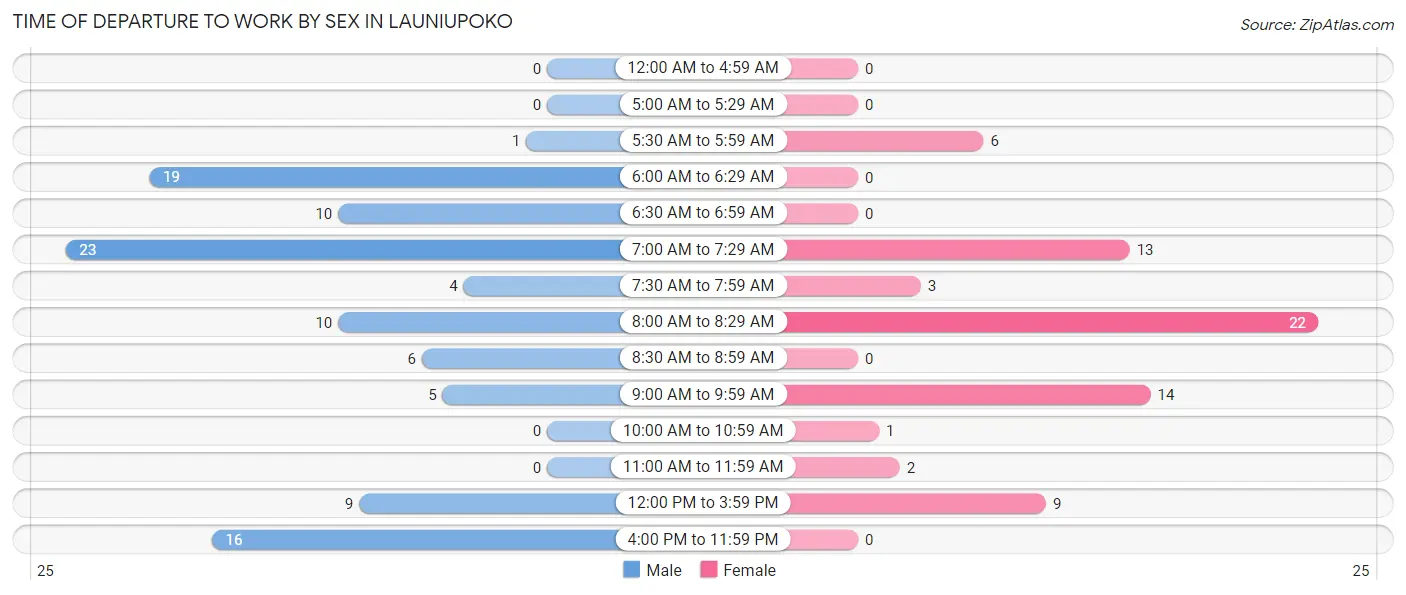
| Time of Departure | Male | Female |
| 12:00 AM to 4:59 AM | 0 (0.0%) | 0 (0.0%) |
| 5:00 AM to 5:29 AM | 0 (0.0%) | 0 (0.0%) |
| 5:30 AM to 5:59 AM | 1 (1.0%) | 6 (8.6%) |
| 6:00 AM to 6:29 AM | 19 (18.4%) | 0 (0.0%) |
| 6:30 AM to 6:59 AM | 10 (9.7%) | 0 (0.0%) |
| 7:00 AM to 7:29 AM | 23 (22.3%) | 13 (18.6%) |
| 7:30 AM to 7:59 AM | 4 (3.9%) | 3 (4.3%) |
| 8:00 AM to 8:29 AM | 10 (9.7%) | 22 (31.4%) |
| 8:30 AM to 8:59 AM | 6 (5.8%) | 0 (0.0%) |
| 9:00 AM to 9:59 AM | 5 (4.9%) | 14 (20.0%) |
| 10:00 AM to 10:59 AM | 0 (0.0%) | 1 (1.4%) |
| 11:00 AM to 11:59 AM | 0 (0.0%) | 2 (2.9%) |
| 12:00 PM to 3:59 PM | 9 (8.7%) | 9 (12.9%) |
| 4:00 PM to 11:59 PM | 16 (15.5%) | 0 (0.0%) |
| Total | 103 (100.0%) | 70 (100.0%) |
Housing Occupancy in Launiupoko
Occupancy by Ownership in Launiupoko
Of the total 250 dwellings in Launiupoko, owner-occupied units account for 210 (84.0%), while renter-occupied units make up 40 (16.0%).
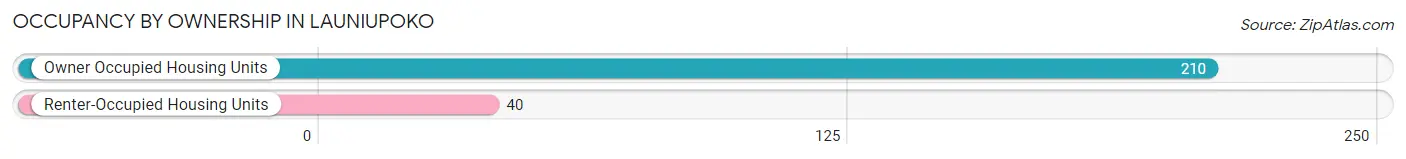
| Occupancy | # Housing Units | % Housing Units |
| Owner Occupied Housing Units | 210 | 84.0% |
| Renter-Occupied Housing Units | 40 | 16.0% |
| Total Occupied Housing Units | 250 | 100.0% |
Occupancy by Household Size in Launiupoko
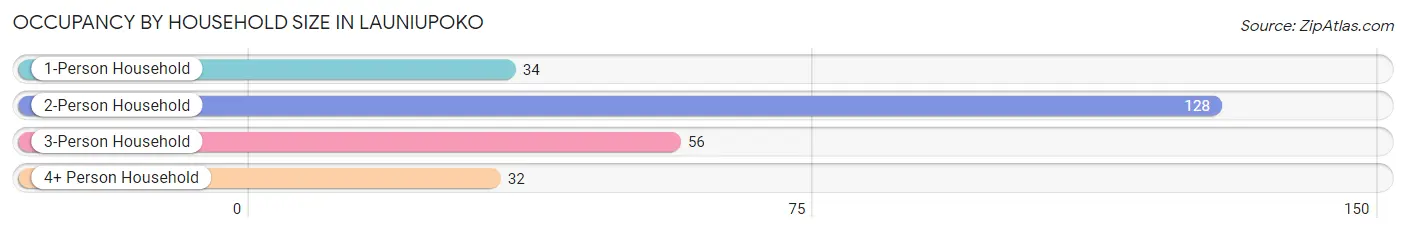
| Household Size | # Housing Units | % Housing Units |
| 1-Person Household | 34 | 13.6% |
| 2-Person Household | 128 | 51.2% |
| 3-Person Household | 56 | 22.4% |
| 4+ Person Household | 32 | 12.8% |
| Total Housing Units | 250 | 100.0% |
Occupancy by Ownership by Household Size in Launiupoko
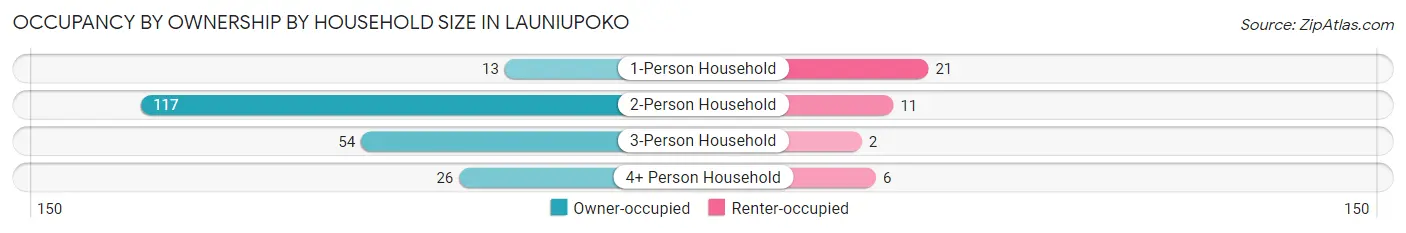
| Household Size | Owner-occupied | Renter-occupied |
| 1-Person Household | 13 (38.2%) | 21 (61.8%) |
| 2-Person Household | 117 (91.4%) | 11 (8.6%) |
| 3-Person Household | 54 (96.4%) | 2 (3.6%) |
| 4+ Person Household | 26 (81.2%) | 6 (18.8%) |
| Total Housing Units | 210 (84.0%) | 40 (16.0%) |
Occupancy by Educational Attainment in Launiupoko
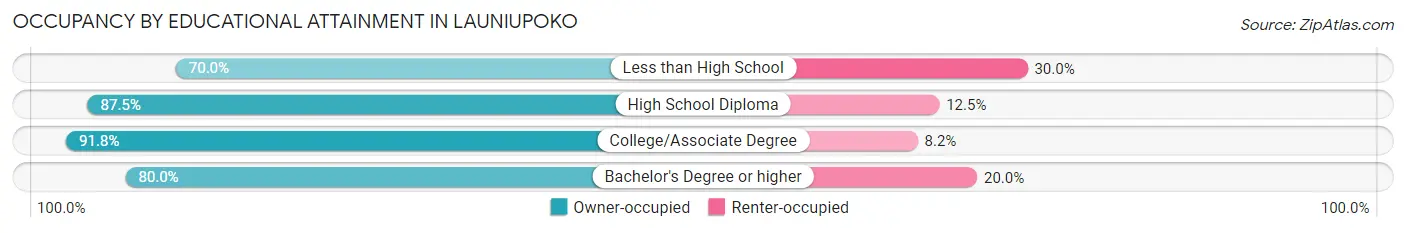
| Household Size | Owner-occupied | Renter-occupied |
| Less than High School | 7 (70.0%) | 3 (30.0%) |
| High School Diploma | 28 (87.5%) | 4 (12.5%) |
| College/Associate Degree | 67 (91.8%) | 6 (8.2%) |
| Bachelor's Degree or higher | 108 (80.0%) | 27 (20.0%) |
Occupancy by Age of Householder in Launiupoko
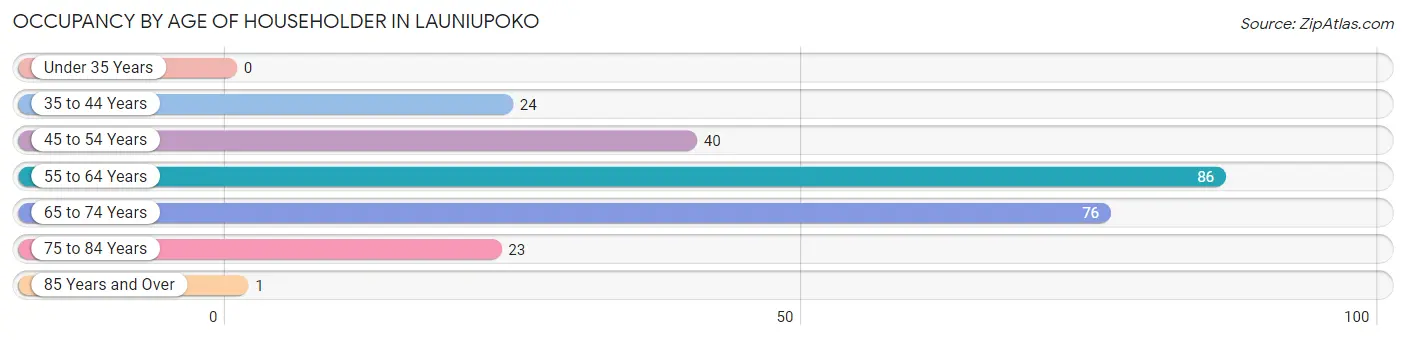
| Age Bracket | # Households | % Households |
| Under 35 Years | 0 | 0.0% |
| 35 to 44 Years | 24 | 9.6% |
| 45 to 54 Years | 40 | 16.0% |
| 55 to 64 Years | 86 | 34.4% |
| 65 to 74 Years | 76 | 30.4% |
| 75 to 84 Years | 23 | 9.2% |
| 85 Years and Over | 1 | 0.4% |
| Total | 250 | 100.0% |
Housing Finances in Launiupoko
Median Income by Occupancy in Launiupoko
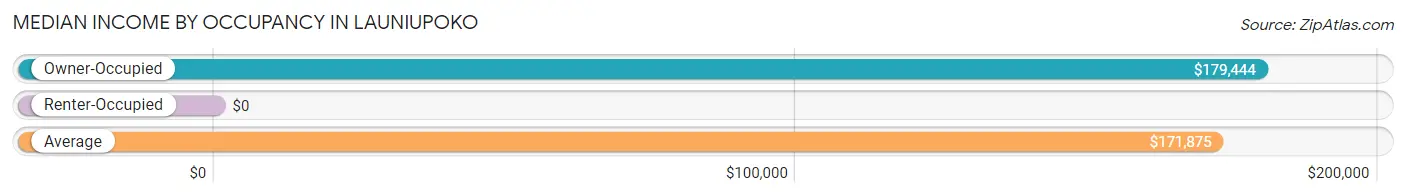
| Occupancy Type | # Households | Median Income |
| Owner-Occupied | 210 (84.0%) | $179,444 |
| Renter-Occupied | 40 (16.0%) | $0 |
| Average | 250 (100.0%) | $171,875 |
Occupancy by Householder Income Bracket in Launiupoko
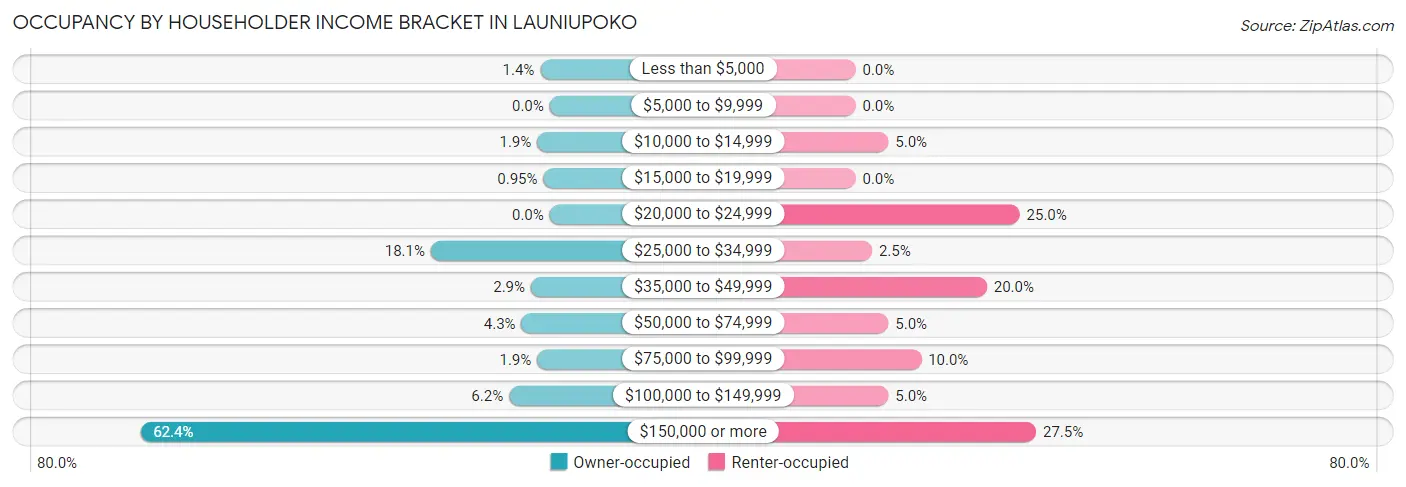
| Income Bracket | Owner-occupied | Renter-occupied |
| Less than $5,000 | 3 (1.4%) | 0 (0.0%) |
| $5,000 to $9,999 | 0 (0.0%) | 0 (0.0%) |
| $10,000 to $14,999 | 4 (1.9%) | 2 (5.0%) |
| $15,000 to $19,999 | 2 (0.9%) | 0 (0.0%) |
| $20,000 to $24,999 | 0 (0.0%) | 10 (25.0%) |
| $25,000 to $34,999 | 38 (18.1%) | 1 (2.5%) |
| $35,000 to $49,999 | 6 (2.9%) | 8 (20.0%) |
| $50,000 to $74,999 | 9 (4.3%) | 2 (5.0%) |
| $75,000 to $99,999 | 4 (1.9%) | 4 (10.0%) |
| $100,000 to $149,999 | 13 (6.2%) | 2 (5.0%) |
| $150,000 or more | 131 (62.4%) | 11 (27.5%) |
| Total | 210 (100.0%) | 40 (100.0%) |
Monthly Housing Cost Tiers in Launiupoko
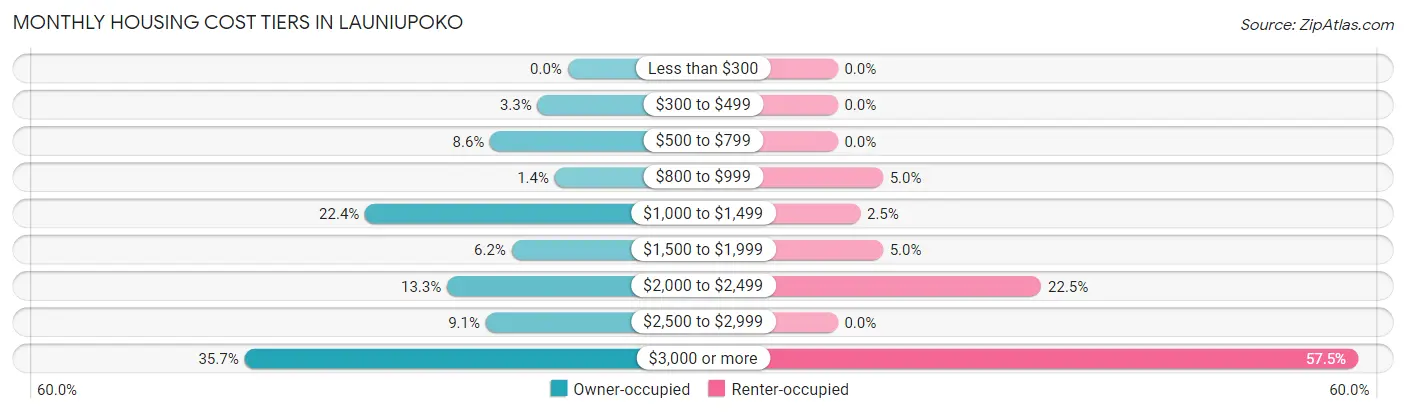
| Monthly Cost | Owner-occupied | Renter-occupied |
| Less than $300 | 0 (0.0%) | 0 (0.0%) |
| $300 to $499 | 7 (3.3%) | 0 (0.0%) |
| $500 to $799 | 18 (8.6%) | 0 (0.0%) |
| $800 to $999 | 3 (1.4%) | 2 (5.0%) |
| $1,000 to $1,499 | 47 (22.4%) | 1 (2.5%) |
| $1,500 to $1,999 | 13 (6.2%) | 2 (5.0%) |
| $2,000 to $2,499 | 28 (13.3%) | 9 (22.5%) |
| $2,500 to $2,999 | 19 (9.0%) | 0 (0.0%) |
| $3,000 or more | 75 (35.7%) | 23 (57.5%) |
| Total | 210 (100.0%) | 40 (100.0%) |
Physical Housing Characteristics in Launiupoko
Housing Structures in Launiupoko
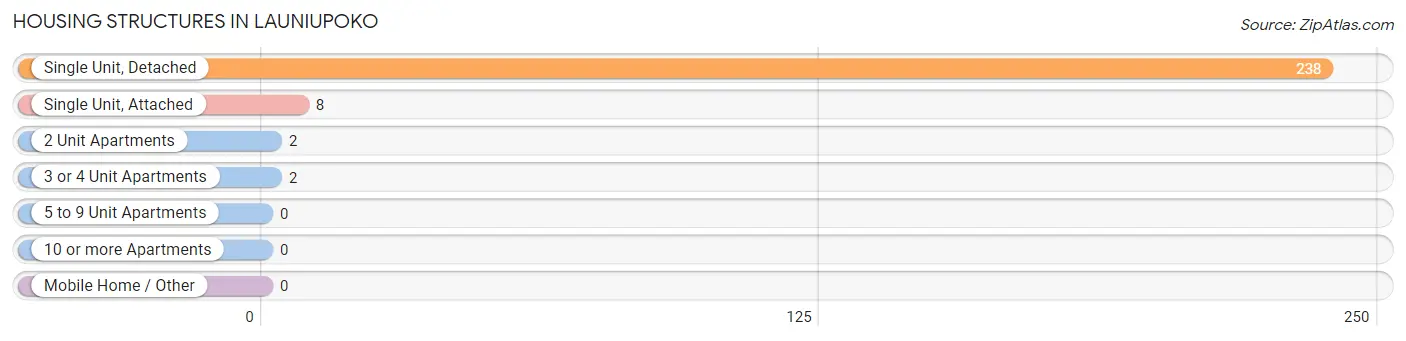
| Structure Type | # Housing Units | % Housing Units |
| Single Unit, Detached | 238 | 95.2% |
| Single Unit, Attached | 8 | 3.2% |
| 2 Unit Apartments | 2 | 0.8% |
| 3 or 4 Unit Apartments | 2 | 0.8% |
| 5 to 9 Unit Apartments | 0 | 0.0% |
| 10 or more Apartments | 0 | 0.0% |
| Mobile Home / Other | 0 | 0.0% |
| Total | 250 | 100.0% |
Housing Structures by Occupancy in Launiupoko
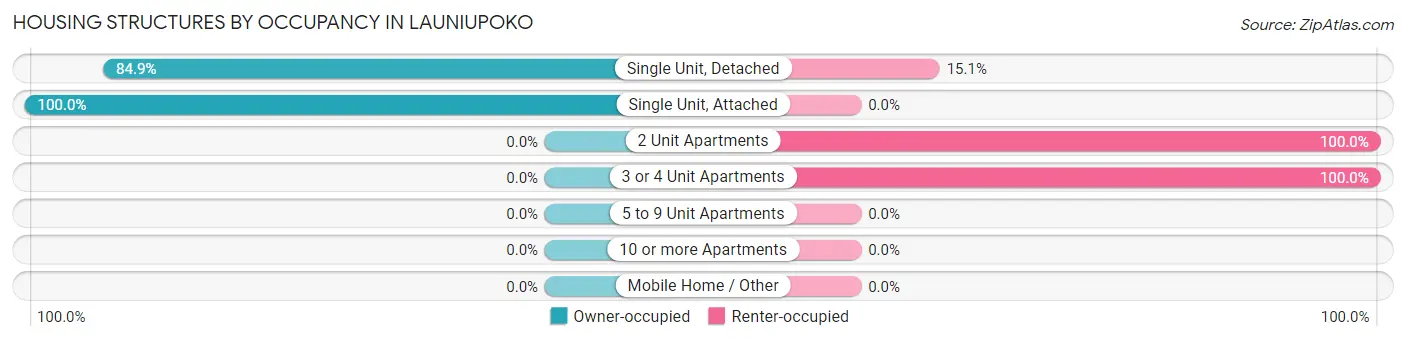
| Structure Type | Owner-occupied | Renter-occupied |
| Single Unit, Detached | 202 (84.9%) | 36 (15.1%) |
| Single Unit, Attached | 8 (100.0%) | 0 (0.0%) |
| 2 Unit Apartments | 0 (0.0%) | 2 (100.0%) |
| 3 or 4 Unit Apartments | 0 (0.0%) | 2 (100.0%) |
| 5 to 9 Unit Apartments | 0 (0.0%) | 0 (0.0%) |
| 10 or more Apartments | 0 (0.0%) | 0 (0.0%) |
| Mobile Home / Other | 0 (0.0%) | 0 (0.0%) |
| Total | 210 (84.0%) | 40 (16.0%) |
Housing Structures by Number of Rooms in Launiupoko
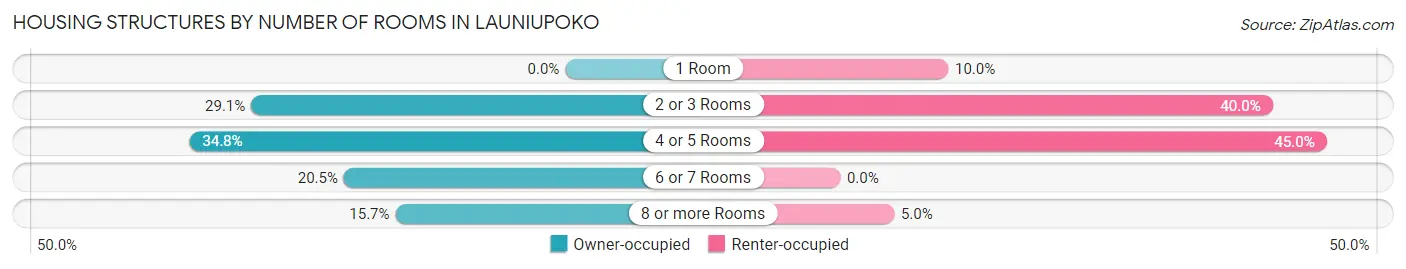
| Number of Rooms | Owner-occupied | Renter-occupied |
| 1 Room | 0 (0.0%) | 4 (10.0%) |
| 2 or 3 Rooms | 61 (29.0%) | 16 (40.0%) |
| 4 or 5 Rooms | 73 (34.8%) | 18 (45.0%) |
| 6 or 7 Rooms | 43 (20.5%) | 0 (0.0%) |
| 8 or more Rooms | 33 (15.7%) | 2 (5.0%) |
| Total | 210 (100.0%) | 40 (100.0%) |
Housing Structure by Heating Type in Launiupoko
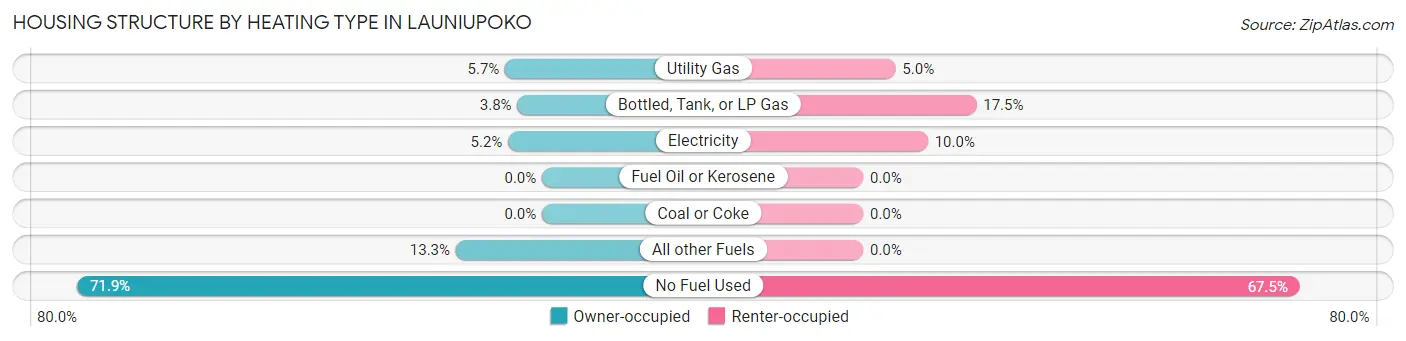
| Heating Type | Owner-occupied | Renter-occupied |
| Utility Gas | 12 (5.7%) | 2 (5.0%) |
| Bottled, Tank, or LP Gas | 8 (3.8%) | 7 (17.5%) |
| Electricity | 11 (5.2%) | 4 (10.0%) |
| Fuel Oil or Kerosene | 0 (0.0%) | 0 (0.0%) |
| Coal or Coke | 0 (0.0%) | 0 (0.0%) |
| All other Fuels | 28 (13.3%) | 0 (0.0%) |
| No Fuel Used | 151 (71.9%) | 27 (67.5%) |
| Total | 210 (100.0%) | 40 (100.0%) |
Household Vehicle Usage in Launiupoko
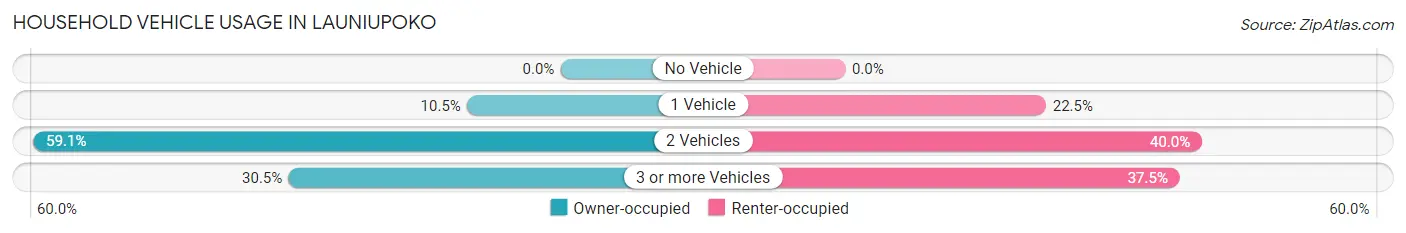
| Vehicles per Household | Owner-occupied | Renter-occupied |
| No Vehicle | 0 (0.0%) | 0 (0.0%) |
| 1 Vehicle | 22 (10.5%) | 9 (22.5%) |
| 2 Vehicles | 124 (59.1%) | 16 (40.0%) |
| 3 or more Vehicles | 64 (30.5%) | 15 (37.5%) |
| Total | 210 (100.0%) | 40 (100.0%) |
Real Estate & Mortgages in Launiupoko
Real Estate and Mortgage Overview in Launiupoko
| Characteristic | Without Mortgage | With Mortgage |
| Housing Units | 100 | 110 |
| Median Property Value | $2,000,001 | $2,000,001 |
| Median Household Income | - | - |
| Monthly Housing Costs | $1,079 | $68 |
| Real Estate Taxes | $3,727 | $0 |
Property Value by Mortgage Status in Launiupoko
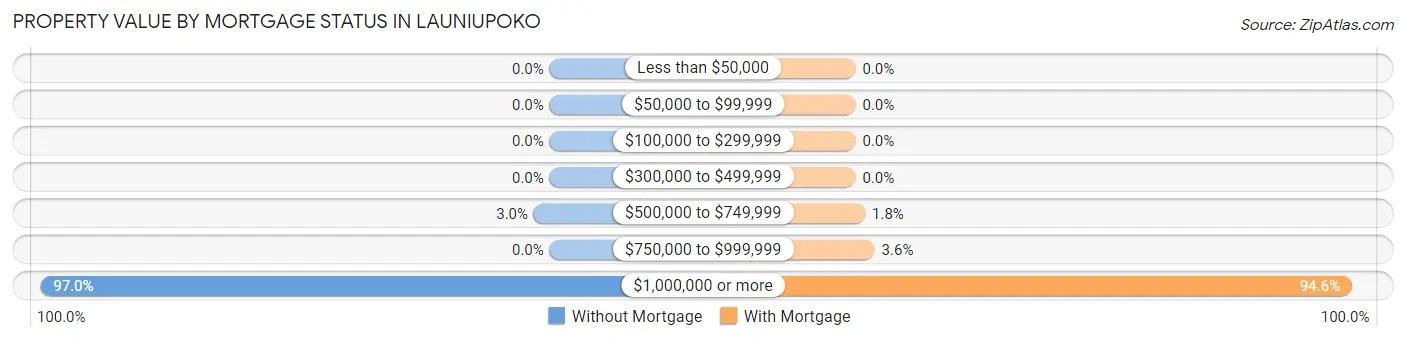
| Property Value | Without Mortgage | With Mortgage |
| Less than $50,000 | 0 (0.0%) | 0 (0.0%) |
| $50,000 to $99,999 | 0 (0.0%) | 0 (0.0%) |
| $100,000 to $299,999 | 0 (0.0%) | 0 (0.0%) |
| $300,000 to $499,999 | 0 (0.0%) | 0 (0.0%) |
| $500,000 to $749,999 | 3 (3.0%) | 2 (1.8%) |
| $750,000 to $999,999 | 0 (0.0%) | 4 (3.6%) |
| $1,000,000 or more | 97 (97.0%) | 104 (94.6%) |
| Total | 100 (100.0%) | 110 (100.0%) |
Household Income by Mortgage Status in Launiupoko
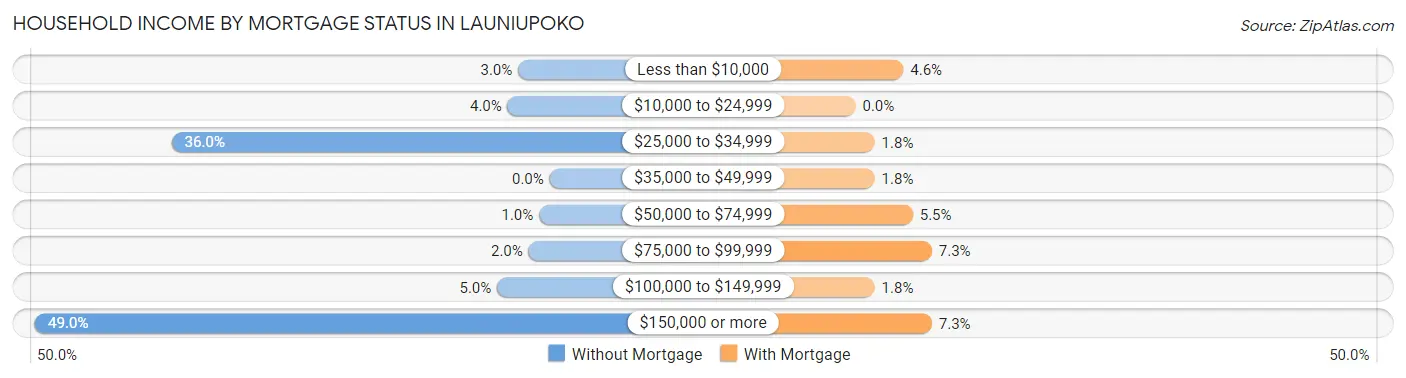
| Household Income | Without Mortgage | With Mortgage |
| Less than $10,000 | 3 (3.0%) | 5 (4.5%) |
| $10,000 to $24,999 | 4 (4.0%) | 0 (0.0%) |
| $25,000 to $34,999 | 36 (36.0%) | 2 (1.8%) |
| $35,000 to $49,999 | 0 (0.0%) | 2 (1.8%) |
| $50,000 to $74,999 | 1 (1.0%) | 6 (5.4%) |
| $75,000 to $99,999 | 2 (2.0%) | 8 (7.3%) |
| $100,000 to $149,999 | 5 (5.0%) | 2 (1.8%) |
| $150,000 or more | 49 (49.0%) | 8 (7.3%) |
| Total | 100 (100.0%) | 110 (100.0%) |
Property Value to Household Income Ratio in Launiupoko
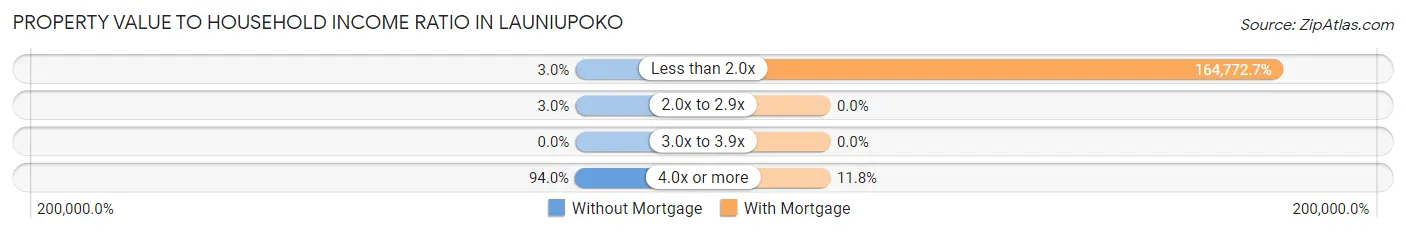
| Value-to-Income Ratio | Without Mortgage | With Mortgage |
| Less than 2.0x | 3 (3.0%) | 181,250 (164,772.7%) |
| 2.0x to 2.9x | 3 (3.0%) | 0 (0.0%) |
| 3.0x to 3.9x | 0 (0.0%) | 0 (0.0%) |
| 4.0x or more | 94 (94.0%) | 13 (11.8%) |
| Total | 100 (100.0%) | 110 (100.0%) |
Real Estate Taxes by Mortgage Status in Launiupoko
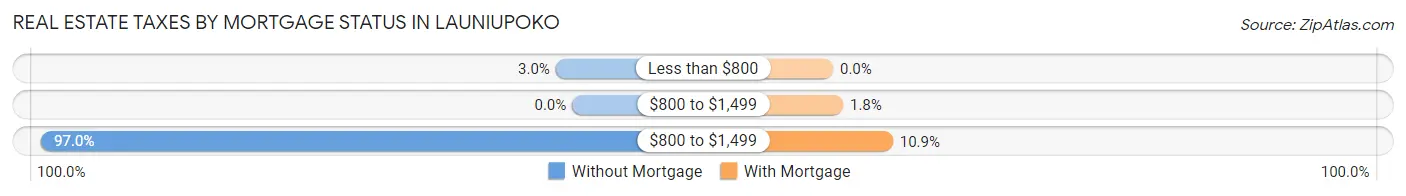
| Property Taxes | Without Mortgage | With Mortgage |
| Less than $800 | 3 (3.0%) | 0 (0.0%) |
| $800 to $1,499 | 0 (0.0%) | 2 (1.8%) |
| $800 to $1,499 | 97 (97.0%) | 12 (10.9%) |
| Total | 100 (100.0%) | 110 (100.0%) |
Health & Disability in Launiupoko
Health Insurance Coverage by Age in Launiupoko
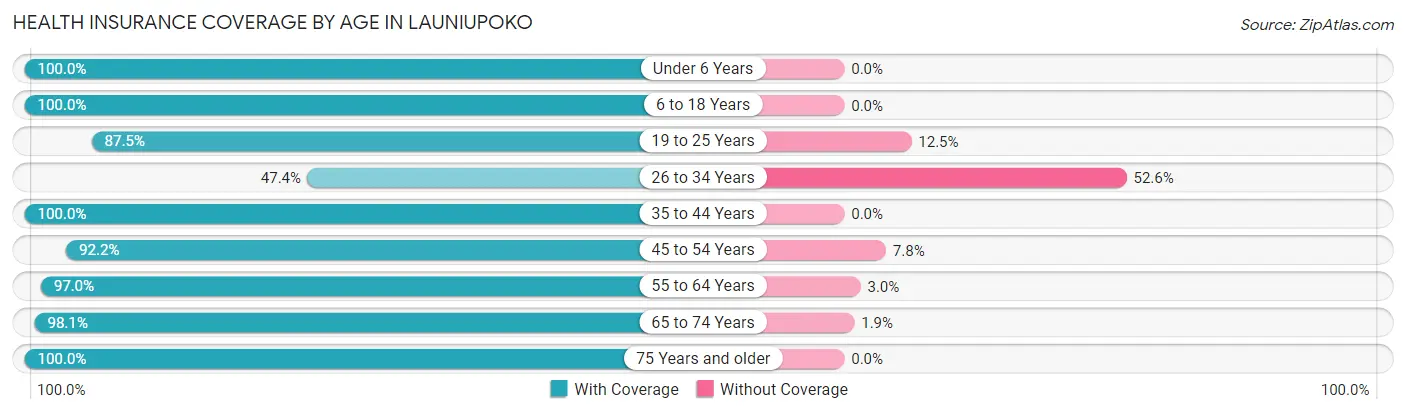
| Age Bracket | With Coverage | Without Coverage |
| Under 6 Years | 4 (100.0%) | 0 (0.0%) |
| 6 to 18 Years | 99 (100.0%) | 0 (0.0%) |
| 19 to 25 Years | 14 (87.5%) | 2 (12.5%) |
| 26 to 34 Years | 9 (47.4%) | 10 (52.6%) |
| 35 to 44 Years | 56 (100.0%) | 0 (0.0%) |
| 45 to 54 Years | 107 (92.2%) | 9 (7.8%) |
| 55 to 64 Years | 128 (97.0%) | 4 (3.0%) |
| 65 to 74 Years | 158 (98.1%) | 3 (1.9%) |
| 75 Years and older | 43 (100.0%) | 0 (0.0%) |
| Total | 618 (95.7%) | 28 (4.3%) |
Health Insurance Coverage by Citizenship Status in Launiupoko
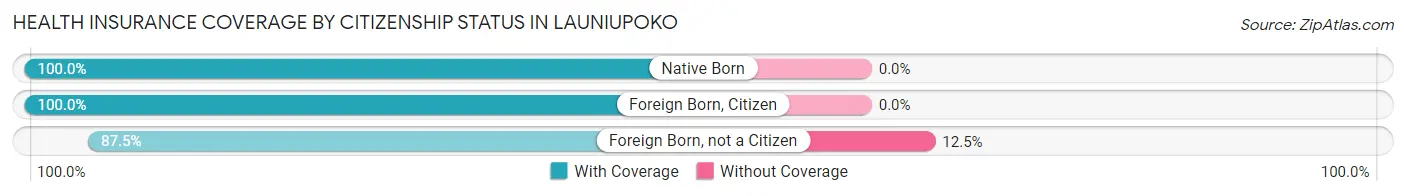
| Citizenship Status | With Coverage | Without Coverage |
| Native Born | 4 (100.0%) | 0 (0.0%) |
| Foreign Born, Citizen | 99 (100.0%) | 0 (0.0%) |
| Foreign Born, not a Citizen | 14 (87.5%) | 2 (12.5%) |
Health Insurance Coverage by Household Income in Launiupoko
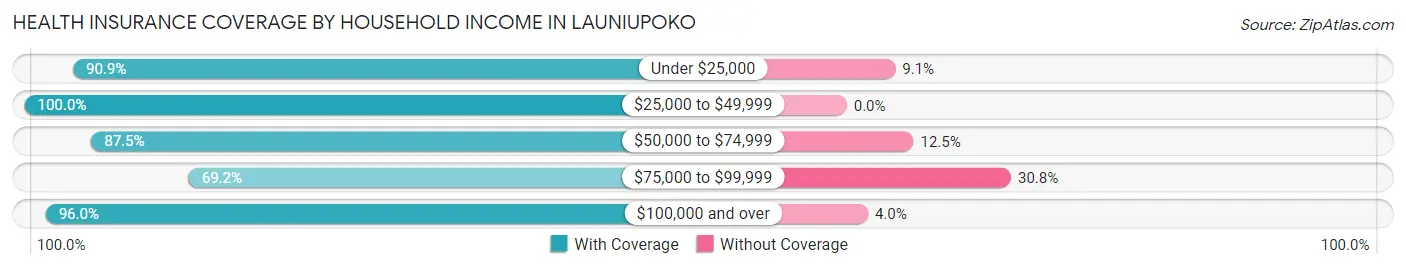
| Household Income | With Coverage | Without Coverage |
| Under $25,000 | 30 (90.9%) | 3 (9.1%) |
| $25,000 to $49,999 | 139 (100.0%) | 0 (0.0%) |
| $50,000 to $74,999 | 28 (87.5%) | 4 (12.5%) |
| $75,000 to $99,999 | 9 (69.2%) | 4 (30.8%) |
| $100,000 and over | 412 (96.0%) | 17 (4.0%) |
Public vs Private Health Insurance Coverage by Age in Launiupoko
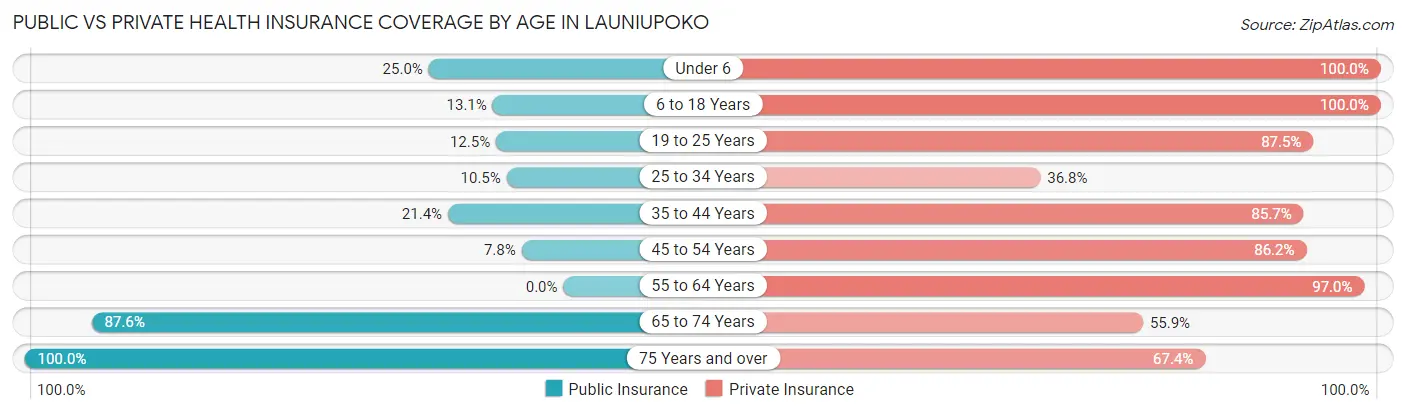
| Age Bracket | Public Insurance | Private Insurance |
| Under 6 | 1 (25.0%) | 4 (100.0%) |
| 6 to 18 Years | 13 (13.1%) | 99 (100.0%) |
| 19 to 25 Years | 2 (12.5%) | 14 (87.5%) |
| 25 to 34 Years | 2 (10.5%) | 7 (36.8%) |
| 35 to 44 Years | 12 (21.4%) | 48 (85.7%) |
| 45 to 54 Years | 9 (7.8%) | 100 (86.2%) |
| 55 to 64 Years | 0 (0.0%) | 128 (97.0%) |
| 65 to 74 Years | 141 (87.6%) | 90 (55.9%) |
| 75 Years and over | 43 (100.0%) | 29 (67.4%) |
| Total | 223 (34.5%) | 519 (80.3%) |
Disability Status by Sex by Age in Launiupoko
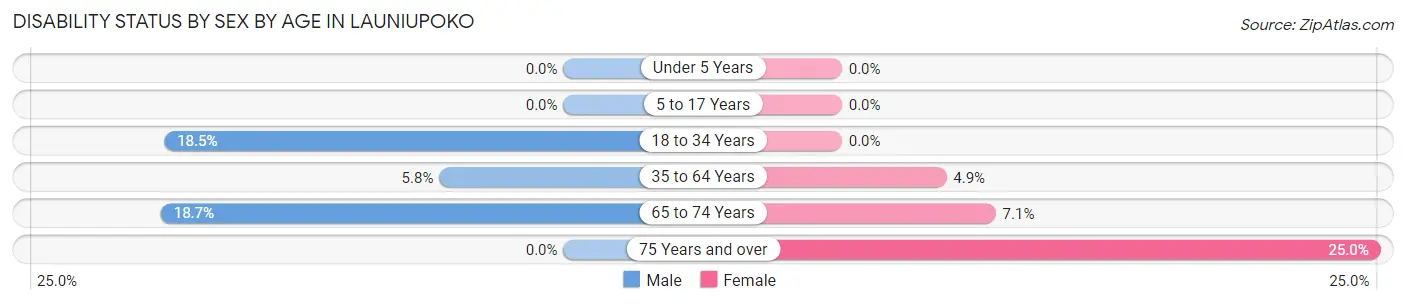
| Age Bracket | Male | Female |
| Under 5 Years | 0 (0.0%) | 0 (0.0%) |
| 5 to 17 Years | 0 (0.0%) | 0 (0.0%) |
| 18 to 34 Years | 5 (18.5%) | 0 (0.0%) |
| 35 to 64 Years | 8 (5.8%) | 8 (4.9%) |
| 65 to 74 Years | 17 (18.7%) | 5 (7.1%) |
| 75 Years and over | 0 (0.0%) | 6 (25.0%) |
Disability Class by Sex by Age in Launiupoko
Disability Class: Hearing Difficulty
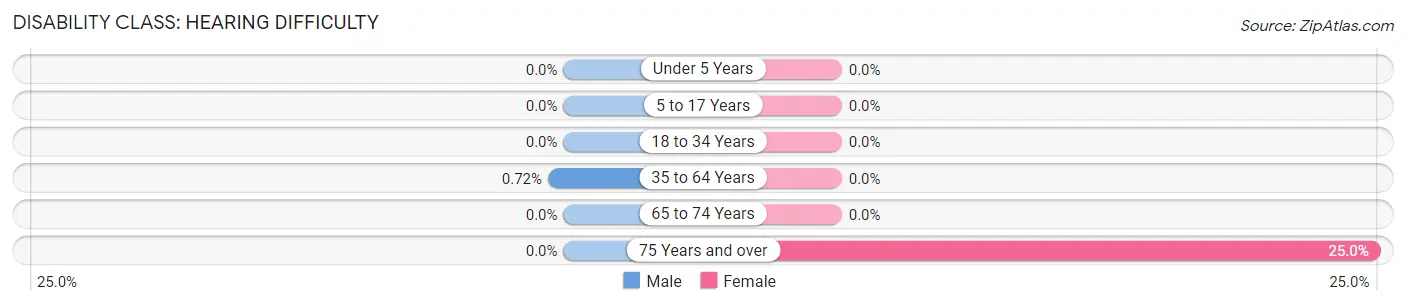
| Age Bracket | Male | Female |
| Under 5 Years | 0 (0.0%) | 0 (0.0%) |
| 5 to 17 Years | 0 (0.0%) | 0 (0.0%) |
| 18 to 34 Years | 0 (0.0%) | 0 (0.0%) |
| 35 to 64 Years | 1 (0.7%) | 0 (0.0%) |
| 65 to 74 Years | 0 (0.0%) | 0 (0.0%) |
| 75 Years and over | 0 (0.0%) | 6 (25.0%) |
Disability Class: Vision Difficulty
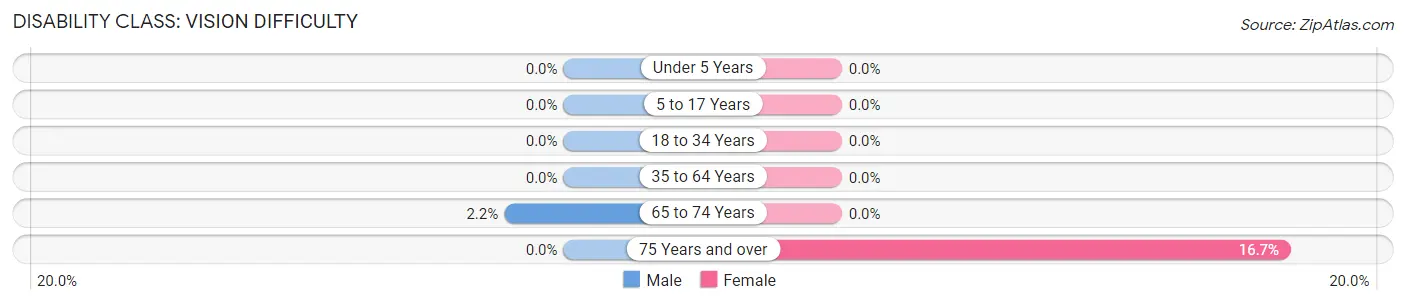
| Age Bracket | Male | Female |
| Under 5 Years | 0 (0.0%) | 0 (0.0%) |
| 5 to 17 Years | 0 (0.0%) | 0 (0.0%) |
| 18 to 34 Years | 0 (0.0%) | 0 (0.0%) |
| 35 to 64 Years | 0 (0.0%) | 0 (0.0%) |
| 65 to 74 Years | 2 (2.2%) | 0 (0.0%) |
| 75 Years and over | 0 (0.0%) | 4 (16.7%) |
Disability Class: Cognitive Difficulty
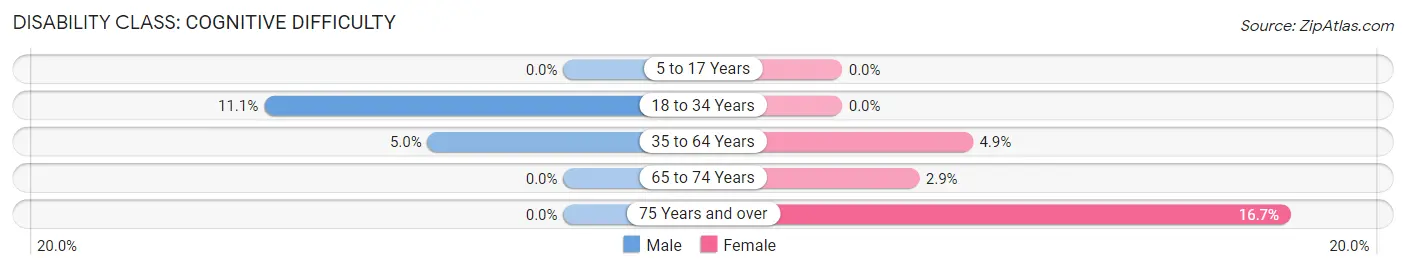
| Age Bracket | Male | Female |
| 5 to 17 Years | 0 (0.0%) | 0 (0.0%) |
| 18 to 34 Years | 3 (11.1%) | 0 (0.0%) |
| 35 to 64 Years | 7 (5.0%) | 8 (4.9%) |
| 65 to 74 Years | 0 (0.0%) | 2 (2.9%) |
| 75 Years and over | 0 (0.0%) | 4 (16.7%) |
Disability Class: Ambulatory Difficulty
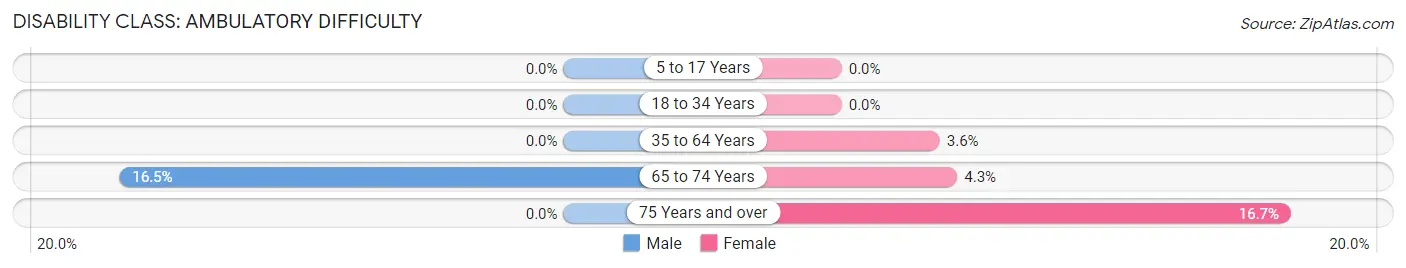
| Age Bracket | Male | Female |
| 5 to 17 Years | 0 (0.0%) | 0 (0.0%) |
| 18 to 34 Years | 0 (0.0%) | 0 (0.0%) |
| 35 to 64 Years | 0 (0.0%) | 6 (3.6%) |
| 65 to 74 Years | 15 (16.5%) | 3 (4.3%) |
| 75 Years and over | 0 (0.0%) | 4 (16.7%) |
Disability Class: Self-Care Difficulty
| Age Bracket | Male | Female |
| 5 to 17 Years | 0 (0.0%) | 0 (0.0%) |
| 18 to 34 Years | 0 (0.0%) | 0 (0.0%) |
| 35 to 64 Years | 0 (0.0%) | 0 (0.0%) |
| 65 to 74 Years | 0 (0.0%) | 0 (0.0%) |
| 75 Years and over | 0 (0.0%) | 0 (0.0%) |
Technology Access in Launiupoko
Computing Device Access in Launiupoko
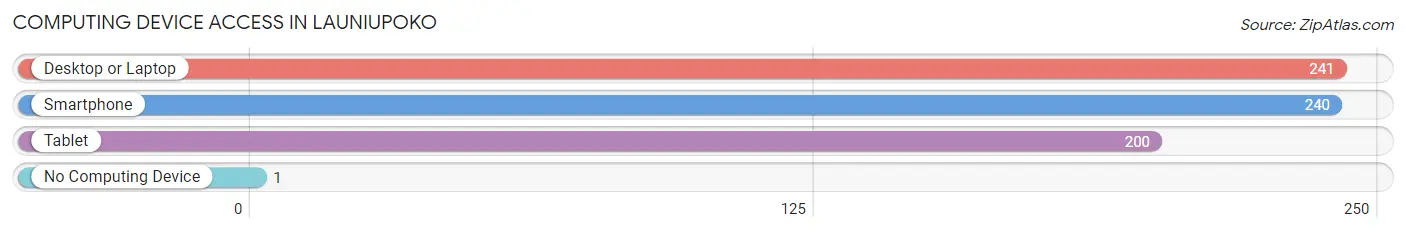
| Device Type | # Households | % Households |
| Desktop or Laptop | 241 | 96.4% |
| Smartphone | 240 | 96.0% |
| Tablet | 200 | 80.0% |
| No Computing Device | 1 | 0.4% |
| Total | 250 | 100.0% |
Internet Access in Launiupoko
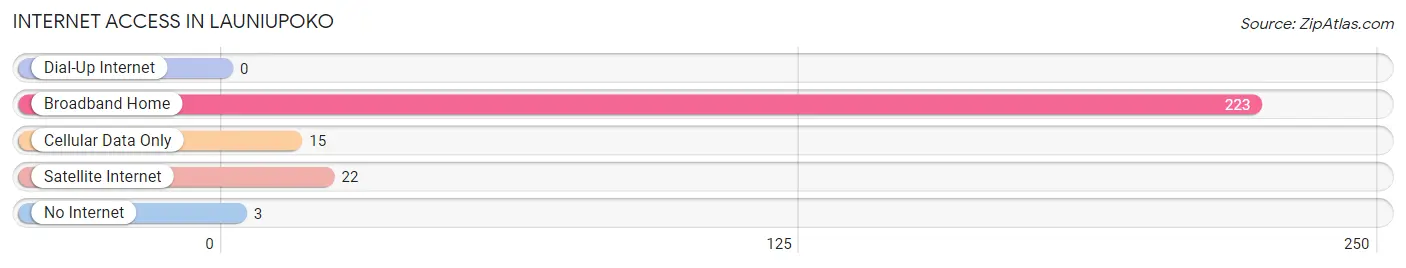
| Internet Type | # Households | % Households |
| Dial-Up Internet | 0 | 0.0% |
| Broadband Home | 223 | 89.2% |
| Cellular Data Only | 15 | 6.0% |
| Satellite Internet | 22 | 8.8% |
| No Internet | 3 | 1.2% |
| Total | 250 | 100.0% |
Launiupoko Summary
Laniupoko is a small, unincorporated community located on the western coast of the Hawaiian island of Maui. It is situated between the towns of Lahaina and Maalaea, and is part of the Lahaina-Kaanapali-Honokowai census-designated place. The community is home to a variety of businesses, including a small shopping center, a gas station, and a few restaurants.
Geography
Laniupoko is located on the western coast of Maui, between the towns of Lahaina and Maalaea. It is situated on a small peninsula, with the Pacific Ocean to the west and the Auau Channel to the east. The community is bordered by the Honokowai Stream to the north and the Honokahua Stream to the south. The area is characterized by rolling hills and lush vegetation, with a variety of native plants and trees.
The climate in Laniupoko is tropical, with temperatures ranging from the mid-70s to the mid-80s Fahrenheit throughout the year. The area receives an average of about 10 inches of rain per year, with most of the precipitation occurring during the winter months.
History
Laniupoko has a long and rich history. The area was first settled by Native Hawaiians in the late 1700s, and was used as a fishing and farming village. In the early 1800s, the area was home to a large sugar plantation, which was owned by the British. The plantation was eventually abandoned, and the area was used for cattle ranching.
In the late 1800s, the area was developed as a resort community, with a number of hotels and resorts being built. The area was also home to a number of small businesses, including a general store, a post office, and a gas station.
In the early 1900s, the area was home to a number of small farms, and the population of the area began to grow. In the mid-1900s, the area was developed as a residential community, and the population continued to grow.
Economy
The economy of Laniupoko is largely based on tourism. The area is home to a number of hotels and resorts, as well as a variety of restaurants and shops. The area is also home to a number of small businesses, including a gas station, a post office, and a general store.
The area is also home to a number of agricultural businesses, including a number of small farms and ranches. The area is also home to a number of fishing businesses, which provide fresh seafood to the local restaurants and markets.
Demographics
As of the 2010 census, the population of Laniupoko was 1,845. The population is largely composed of Native Hawaiians, with a small percentage of other ethnicities. The median age of the population is 44.7 years, and the median household income is $50,000.
The area is served by a number of public schools, including Laniupoko Elementary School and Laniupoko High School. The area is also home to a number of private schools, including the Laniupoko Academy of Arts and Sciences.
Conclusion
Laniupoko is a small, unincorporated community located on the western coast of the Hawaiian island of Maui. It is situated between the towns of Lahaina and Maalaea, and is part of the Lahaina-Kaanapali-Honokowai census-designated place. The community is home to a variety of businesses, including a small shopping center, a gas station, and a few restaurants. The economy of Laniupoko is largely based on tourism, and the population is largely composed of Native Hawaiians. The area is served by a number of public and private schools, and is home to a number of agricultural and fishing businesses.
Common Questions
What is Per Capita Income in Launiupoko?
Per Capita income in Launiupoko is $73,173.
What is the Median Family Income in Launiupoko?
Median Family Income in Launiupoko is $179,375.
What is the Median Household income in Launiupoko?
Median Household Income in Launiupoko is $171,875.
What is Income or Wage Gap in Launiupoko?
Income or Wage Gap in Launiupoko is 3.4%.
Women in Launiupoko earn 96.6 cents for every dollar earned by a man.
What is Inequality or Gini Index in Launiupoko?
Inequality or Gini Index in Launiupoko is 0.46.
What is the Total Population of Launiupoko?
Total Population of Launiupoko is 649.
What is the Total Male Population of Launiupoko?
Total Male Population of Launiupoko is 298.
What is the Total Female Population of Launiupoko?
Total Female Population of Launiupoko is 351.
What is the Ratio of Males per 100 Females in Launiupoko?
There are 84.90 Males per 100 Females in Launiupoko.
What is the Ratio of Females per 100 Males in Launiupoko?
There are 117.79 Females per 100 Males in Launiupoko.
What is the Median Population Age in Launiupoko?
Median Population Age in Launiupoko is 56.0 Years.
What is the Average Family Size in Launiupoko
Average Family Size in Launiupoko is 2.7 People.
What is the Average Household Size in Launiupoko
Average Household Size in Launiupoko is 2.6 People.
How Large is the Labor Force in Launiupoko?
There are 313 People in the Labor Forcein in Launiupoko.
What is the Percentage of People in the Labor Force in Launiupoko?
55.4% of People are in the Labor Force in Launiupoko.
What is the Unemployment Rate in Launiupoko?
Unemployment Rate in Launiupoko is 9.7%.