Vineyards, FL Map & Demographics
Vineyards Map
Vineyards Overview
$78,615
PER CAPITA INCOME
$147,528
AVG FAMILY INCOME
$120,287
AVG HOUSEHOLD INCOME
0.48
INEQUALITY / GINI INDEX
3,649
TOTAL POPULATION
1,675
MALE POPULATION
1,974
FEMALE POPULATION
84.85
MALES / 100 FEMALES
117.85
FEMALES / 100 MALES
67.1
MEDIAN AGE
2.3
AVG FAMILY SIZE
1.8
AVG HOUSEHOLD SIZE
1,392
LABOR FORCE [ PEOPLE ]
39.4%
PERCENT IN LABOR FORCE
1.4%
UNEMPLOYMENT RATE
Income in Vineyards
Income Overview in Vineyards
Per Capita Income in Vineyards is $78,615, while median incomes of families and households are $147,528 and $120,287 respectively.
| Characteristic | Number | Measure |
| Per Capita Income | 3,649 | $78,615 |
| Median Family Income | 1,183 | $147,528 |
| Mean Family Income | 1,183 | $180,872 |
| Median Household Income | 1,908 | $120,287 |
| Mean Household Income | 1,908 | $151,598 |
| Income Deficit | 1,183 | $0 |
| Wage / Income Gap (%) | 3,649 | 0.00% |
| Wage / Income Gap ($) | 3,649 | 100.00¢ per $1 |
| Gini / Inequality Index | 3,649 | 0.48 |
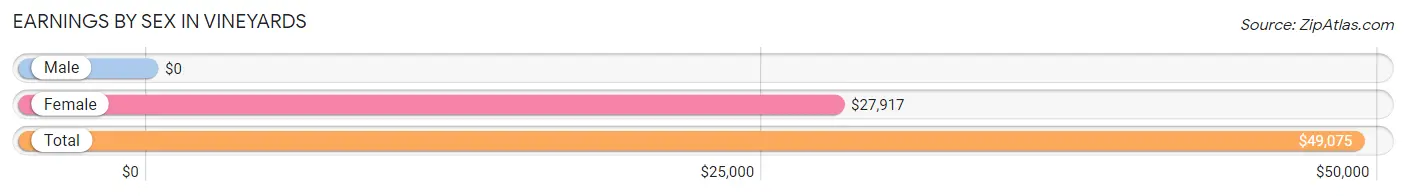
Earnings by Sex in Vineyards
| Sex | Number | Average Earnings |
| Male | 766 (45.3%) | $0 |
| Female | 925 (54.7%) | $27,917 |
| Total | 1,691 (100.0%) | $49,075 |
Earnings by Sex by Income Bracket in Vineyards
The most common earnings brackets in Vineyards are $100,000+ for men (342 | 44.7%) and $100,000+ for women (183 | 19.8%).
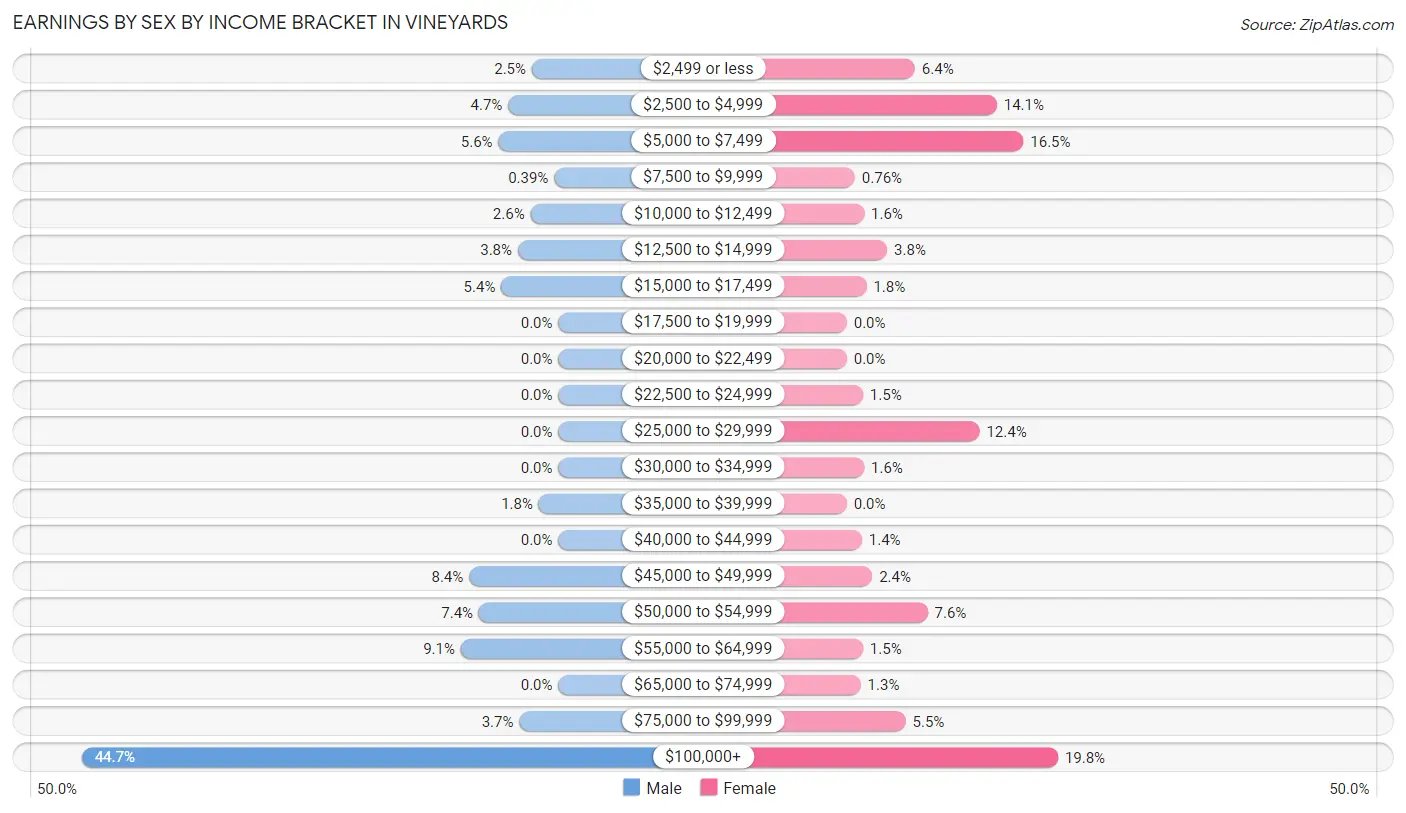
| Income | Male | Female |
| $2,499 or less | 19 (2.5%) | 59 (6.4%) |
| $2,500 to $4,999 | 36 (4.7%) | 130 (14.1%) |
| $5,000 to $7,499 | 43 (5.6%) | 153 (16.5%) |
| $7,500 to $9,999 | 3 (0.4%) | 7 (0.8%) |
| $10,000 to $12,499 | 20 (2.6%) | 15 (1.6%) |
| $12,500 to $14,999 | 29 (3.8%) | 35 (3.8%) |
| $15,000 to $17,499 | 41 (5.3%) | 17 (1.8%) |
| $17,500 to $19,999 | 0 (0.0%) | 0 (0.0%) |
| $20,000 to $22,499 | 0 (0.0%) | 0 (0.0%) |
| $22,500 to $24,999 | 0 (0.0%) | 14 (1.5%) |
| $25,000 to $29,999 | 0 (0.0%) | 115 (12.4%) |
| $30,000 to $34,999 | 0 (0.0%) | 15 (1.6%) |
| $35,000 to $39,999 | 14 (1.8%) | 0 (0.0%) |
| $40,000 to $44,999 | 0 (0.0%) | 13 (1.4%) |
| $45,000 to $49,999 | 64 (8.4%) | 22 (2.4%) |
| $50,000 to $54,999 | 57 (7.4%) | 70 (7.6%) |
| $55,000 to $64,999 | 70 (9.1%) | 14 (1.5%) |
| $65,000 to $74,999 | 0 (0.0%) | 12 (1.3%) |
| $75,000 to $99,999 | 28 (3.7%) | 51 (5.5%) |
| $100,000+ | 342 (44.7%) | 183 (19.8%) |
| Total | 766 (100.0%) | 925 (100.0%) |
Earnings by Sex by Educational Attainment in Vineyards
Average earnings in Vineyards are $92,813 for men and $42,019 for women, a difference of 54.7%. Men with an educational attainment of bachelor's degree enjoy the highest average annual earnings of $106,848, while those with college or associate's degree education earn the least with $58,839. Women with an educational attainment of graduate degree earn the most with the average annual earnings of $71,771, while those with high school diploma education have the smallest earnings of $26,484.
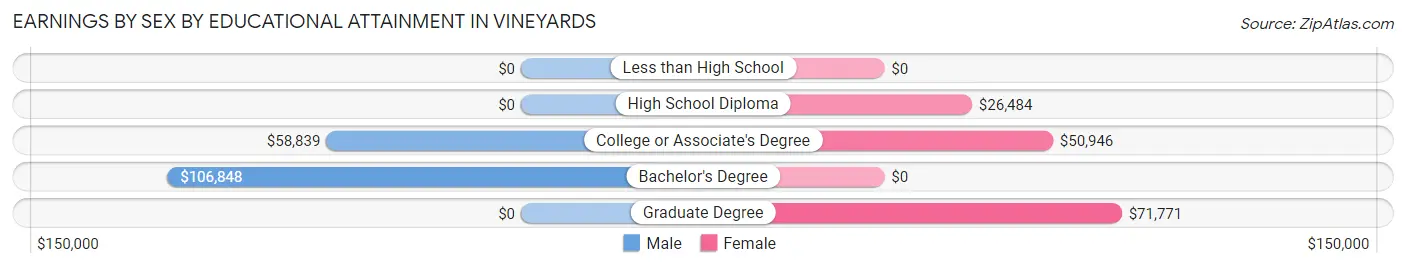
| Educational Attainment | Male Income | Female Income |
| Less than High School | - | - |
| High School Diploma | - | - |
| College or Associate's Degree | $58,839 | $50,946 |
| Bachelor's Degree | $106,848 | $0 |
| Graduate Degree | - | - |
| Total | $92,813 | $42,019 |
Family Income in Vineyards
Family Income Brackets in Vineyards
According to the Vineyards family income data, there are 400 families falling into the $200,000+ income range, which is the most common income bracket and makes up 33.8% of all families.
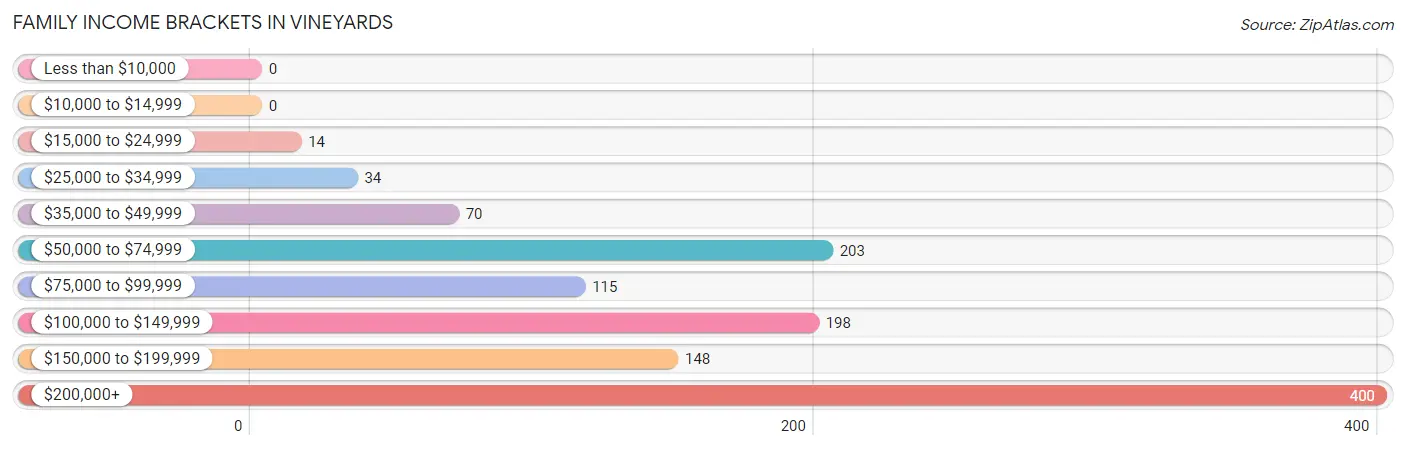
| Income Bracket | # Families | % Families |
| Less than $10,000 | 0 | 0.0% |
| $10,000 to $14,999 | 0 | 0.0% |
| $15,000 to $24,999 | 14 | 1.2% |
| $25,000 to $34,999 | 34 | 2.9% |
| $35,000 to $49,999 | 70 | 5.9% |
| $50,000 to $74,999 | 203 | 17.2% |
| $75,000 to $99,999 | 115 | 9.7% |
| $100,000 to $149,999 | 198 | 16.7% |
| $150,000 to $199,999 | 148 | 12.5% |
| $200,000+ | 400 | 33.8% |
Family Income by Famaliy Size in Vineyards
3-person families (236 | 20.0%) account for the highest median family income in Vineyards with $204,444 per family, while 3-person families (236 | 20.0%) have the highest median income of $68,148 per family member.
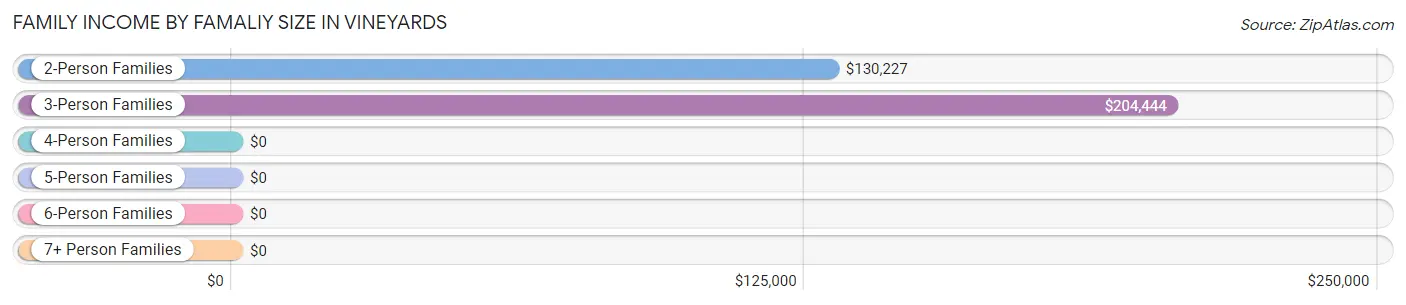
| Income Bracket | # Families | Median Income |
| 2-Person Families | 920 (77.8%) | $130,227 |
| 3-Person Families | 236 (20.0%) | $204,444 |
| 4-Person Families | 26 (2.2%) | $0 |
| 5-Person Families | 0 (0.0%) | $0 |
| 6-Person Families | 1 (0.1%) | $0 |
| 7+ Person Families | 0 (0.0%) | $0 |
| Total | 1,183 (100.0%) | $147,528 |
Family Income by Number of Earners in Vineyards
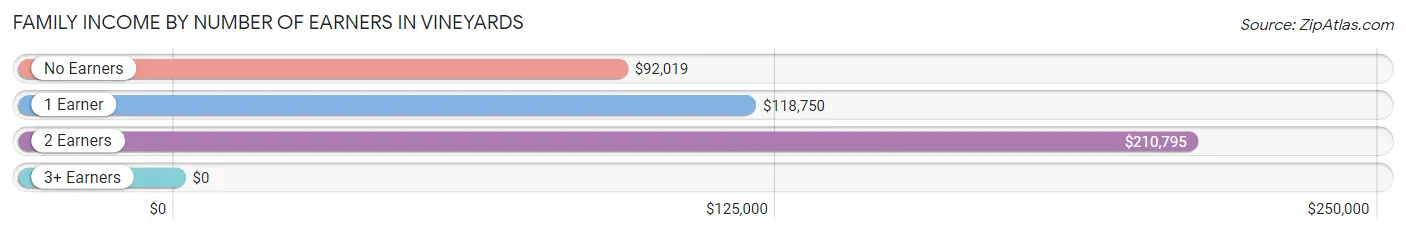
| Number of Earners | # Families | Median Income |
| No Earners | 489 (41.3%) | $92,019 |
| 1 Earner | 252 (21.3%) | $118,750 |
| 2 Earners | 350 (29.6%) | $210,795 |
| 3+ Earners | 92 (7.8%) | $0 |
| Total | 1,183 (100.0%) | $147,528 |
Household Income in Vineyards
Household Income Brackets in Vineyards
With 513 households falling in the category, the $200,000+ income range is the most frequent in Vineyards, accounting for 26.9% of all households. In contrast, only 36 households (1.9%) fall into the less than $10,000 income bracket, making it the least populous group.
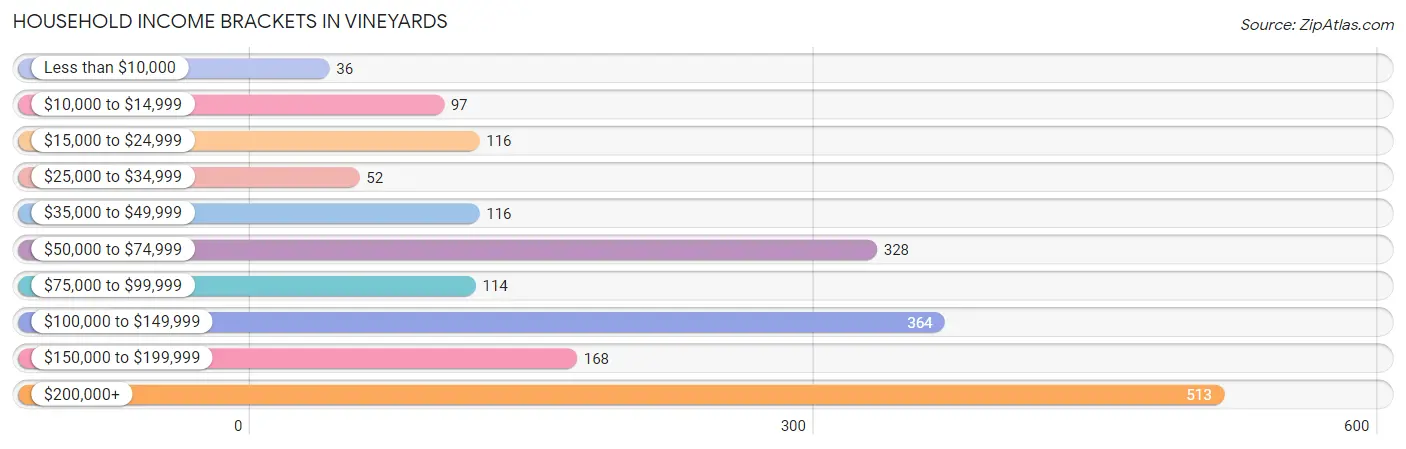
| Income Bracket | # Households | % Households |
| Less than $10,000 | 36 | 1.9% |
| $10,000 to $14,999 | 97 | 5.1% |
| $15,000 to $24,999 | 116 | 6.1% |
| $25,000 to $34,999 | 52 | 2.7% |
| $35,000 to $49,999 | 116 | 6.1% |
| $50,000 to $74,999 | 328 | 17.2% |
| $75,000 to $99,999 | 114 | 6.0% |
| $100,000 to $149,999 | 364 | 19.1% |
| $150,000 to $199,999 | 168 | 8.8% |
| $200,000+ | 513 | 26.9% |
Household Income by Householder Age in Vineyards
The median household income in Vineyards is $120,287, with the highest median household income of $202,622 found in the 45 to 64 years age bracket for the primary householder. A total of 533 households (27.9%) fall into this category. Meanwhile, the 15 to 24 years age bracket for the primary householder has the lowest median household income of $11,875, with 80 households (4.2%) in this group.
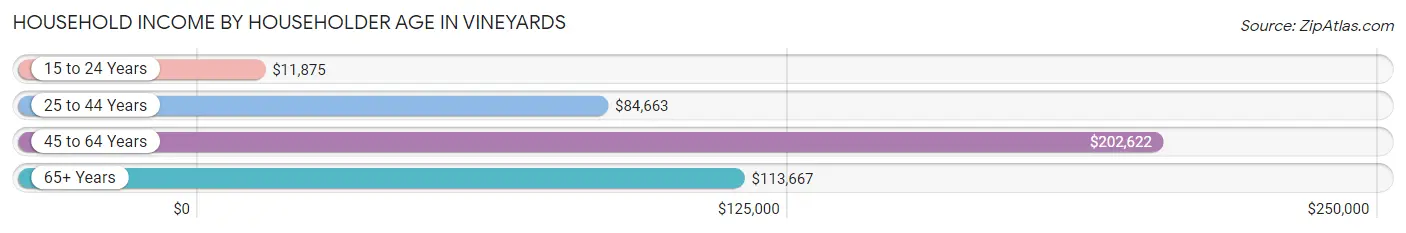
| Income Bracket | # Households | Median Income |
| 15 to 24 Years | 80 (4.2%) | $11,875 |
| 25 to 44 Years | 45 (2.4%) | $84,663 |
| 45 to 64 Years | 533 (27.9%) | $202,622 |
| 65+ Years | 1,250 (65.5%) | $113,667 |
| Total | 1,908 (100.0%) | $120,287 |
Poverty in Vineyards
Income Below Poverty by Sex and Age in Vineyards
With 8.5% poverty level for males and 2.5% for females among the residents of Vineyards, 18 to 24 year old males and 18 to 24 year old females are the most vulnerable to poverty, with 79 males (100.0%) and 35 females (16.0%) in their respective age groups living below the poverty level.
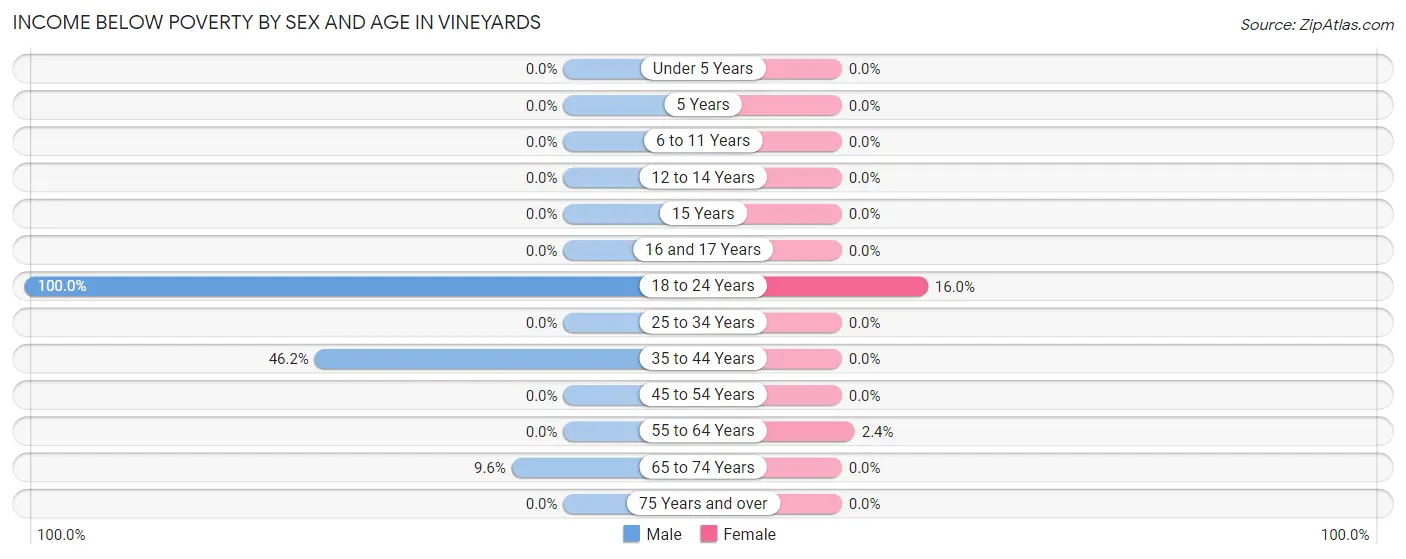
| Age Bracket | Male | Female |
| Under 5 Years | 0 (0.0%) | 0 (0.0%) |
| 5 Years | 0 (0.0%) | 0 (0.0%) |
| 6 to 11 Years | 0 (0.0%) | 0 (0.0%) |
| 12 to 14 Years | 0 (0.0%) | 0 (0.0%) |
| 15 Years | 0 (0.0%) | 0 (0.0%) |
| 16 and 17 Years | 0 (0.0%) | 0 (0.0%) |
| 18 to 24 Years | 79 (100.0%) | 35 (16.0%) |
| 25 to 34 Years | 0 (0.0%) | 0 (0.0%) |
| 35 to 44 Years | 18 (46.2%) | 0 (0.0%) |
| 45 to 54 Years | 0 (0.0%) | 0 (0.0%) |
| 55 to 64 Years | 0 (0.0%) | 12 (2.4%) |
| 65 to 74 Years | 43 (9.6%) | 0 (0.0%) |
| 75 Years and over | 0 (0.0%) | 0 (0.0%) |
| Total | 140 (8.5%) | 47 (2.5%) |
Income Above Poverty by Sex and Age in Vineyards
According to the poverty statistics in Vineyards, males aged under 5 years and females aged 12 to 14 years are the age groups that are most secure financially, with 100.0% of males and 100.0% of females in these age groups living above the poverty line.
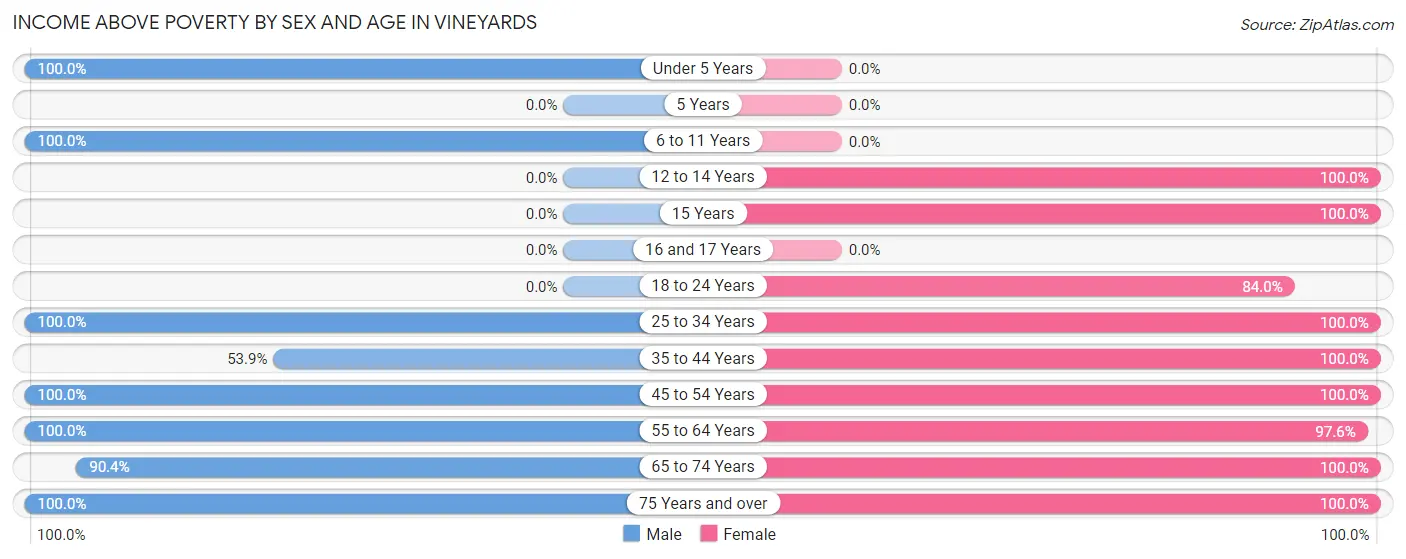
| Age Bracket | Male | Female |
| Under 5 Years | 2 (100.0%) | 0 (0.0%) |
| 5 Years | 0 (0.0%) | 0 (0.0%) |
| 6 to 11 Years | 32 (100.0%) | 0 (0.0%) |
| 12 to 14 Years | 0 (0.0%) | 55 (100.0%) |
| 15 Years | 0 (0.0%) | 28 (100.0%) |
| 16 and 17 Years | 0 (0.0%) | 0 (0.0%) |
| 18 to 24 Years | 0 (0.0%) | 184 (84.0%) |
| 25 to 34 Years | 28 (100.0%) | 15 (100.0%) |
| 35 to 44 Years | 21 (53.8%) | 44 (100.0%) |
| 45 to 54 Years | 121 (100.0%) | 111 (100.0%) |
| 55 to 64 Years | 271 (100.0%) | 485 (97.6%) |
| 65 to 74 Years | 405 (90.4%) | 459 (100.0%) |
| 75 Years and over | 622 (100.0%) | 447 (100.0%) |
| Total | 1,502 (91.5%) | 1,828 (97.5%) |
Income Below Poverty Among Married-Couple Families in Vineyards
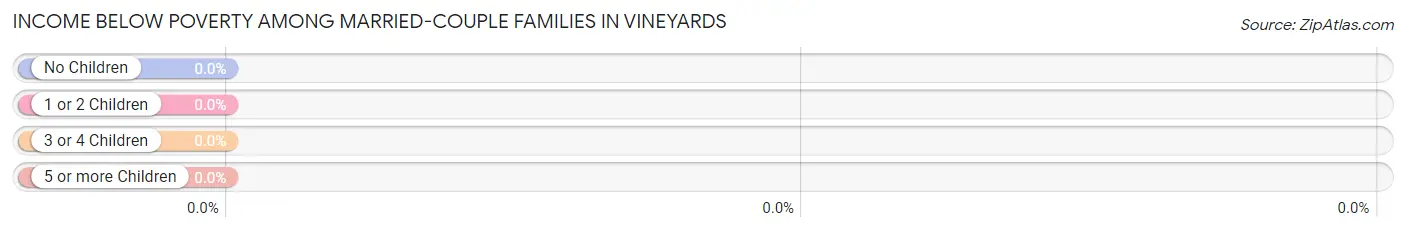
| Children | Above Poverty | Below Poverty |
| No Children | 1,054 (100.0%) | 0 (0.0%) |
| 1 or 2 Children | 82 (100.0%) | 0 (0.0%) |
| 3 or 4 Children | 1 (100.0%) | 0 (0.0%) |
| 5 or more Children | 0 (0.0%) | 0 (0.0%) |
| Total | 1,137 (100.0%) | 0 (0.0%) |
Income Below Poverty Among Single-Parent Households in Vineyards
| Children | Single Father | Single Mother |
| No Children | 0 (0.0%) | 0 (0.0%) |
| 1 or 2 Children | 0 (0.0%) | 0 (0.0%) |
| 3 or 4 Children | 0 (0.0%) | 0 (0.0%) |
| 5 or more Children | 0 (0.0%) | 0 (0.0%) |
| Total | 0 (0.0%) | 0 (0.0%) |
Income Below Poverty Among Married-Couple vs Single-Parent Households in Vineyards
| Children | Married-Couple Families | Single-Parent Households |
| No Children | 0 (0.0%) | 0 (0.0%) |
| 1 or 2 Children | 0 (0.0%) | 0 (0.0%) |
| 3 or 4 Children | 0 (0.0%) | 0 (0.0%) |
| 5 or more Children | 0 (0.0%) | 0 (0.0%) |
| Total | 0 (0.0%) | 0 (0.0%) |
Race in Vineyards
The most populous races in Vineyards are White / Caucasian (3,381 | 92.7%), Hispanic or Latino (225 | 6.2%), and Two or more Races (171 | 4.7%).
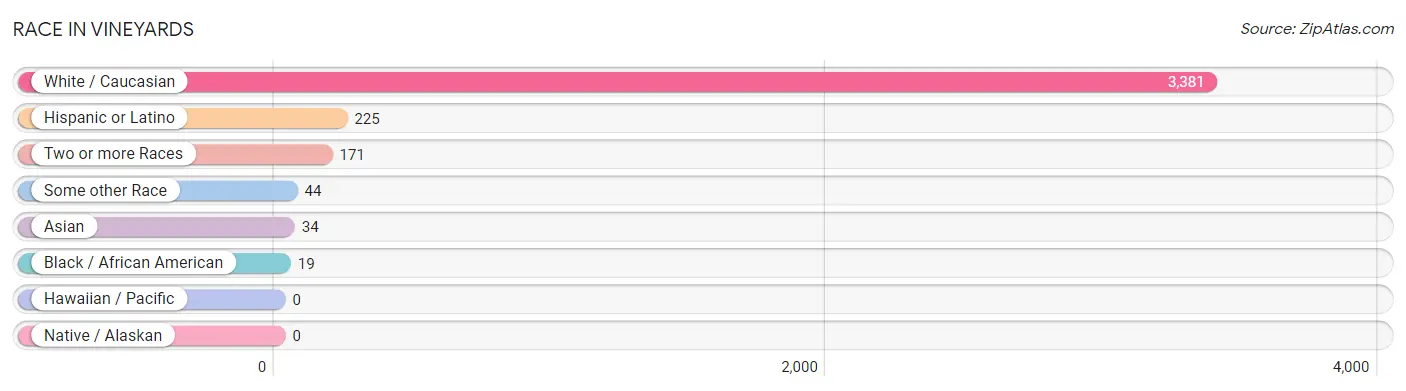
| Race | # Population | % Population |
| Asian | 34 | 0.9% |
| Black / African American | 19 | 0.5% |
| Hawaiian / Pacific | 0 | 0.0% |
| Hispanic or Latino | 225 | 6.2% |
| Native / Alaskan | 0 | 0.0% |
| White / Caucasian | 3,381 | 92.7% |
| Two or more Races | 171 | 4.7% |
| Some other Race | 44 | 1.2% |
| Total | 3,649 | 100.0% |
Ancestry in Vineyards
The most populous ancestries reported in Vineyards are Irish (850 | 23.3%), German (608 | 16.7%), American (515 | 14.1%), Italian (378 | 10.4%), and Polish (214 | 5.9%), together accounting for 70.3% of all Vineyards residents.
| Ancestry | # Population | % Population |
| Albanian | 114 | 3.1% |
| American | 515 | 14.1% |
| Arab | 27 | 0.7% |
| Belgian | 46 | 1.3% |
| Brazilian | 43 | 1.2% |
| British | 26 | 0.7% |
| Central American | 6 | 0.2% |
| Colombian | 14 | 0.4% |
| Croatian | 36 | 1.0% |
| Cuban | 73 | 2.0% |
| Danish | 25 | 0.7% |
| Dominican | 19 | 0.5% |
| Dutch | 60 | 1.6% |
| Eastern European | 71 | 1.9% |
| English | 198 | 5.4% |
| Estonian | 19 | 0.5% |
| European | 140 | 3.8% |
| French | 109 | 3.0% |
| French Canadian | 106 | 2.9% |
| German | 608 | 16.7% |
| Greek | 53 | 1.5% |
| Honduran | 6 | 0.2% |
| Iranian | 18 | 0.5% |
| Irish | 850 | 23.3% |
| Italian | 378 | 10.4% |
| Korean | 34 | 0.9% |
| Lebanese | 23 | 0.6% |
| Mexican | 60 | 1.6% |
| Northern European | 31 | 0.9% |
| Norwegian | 62 | 1.7% |
| Polish | 214 | 5.9% |
| Puerto Rican | 18 | 0.5% |
| Russian | 40 | 1.1% |
| Scandinavian | 13 | 0.4% |
| Scotch-Irish | 37 | 1.0% |
| Scottish | 121 | 3.3% |
| South American | 49 | 1.3% |
| Swedish | 34 | 0.9% |
| Ukrainian | 38 | 1.0% |
| Venezuelan | 35 | 1.0% | View All 40 Rows |
Immigrants in Vineyards
The most numerous immigrant groups reported in Vineyards came from Europe (229 | 6.3%), Western Europe (90 | 2.5%), Eastern Europe (86 | 2.4%), Latin America (76 | 2.1%), and Germany (57 | 1.6%), together accounting for 14.7% of all Vineyards residents.
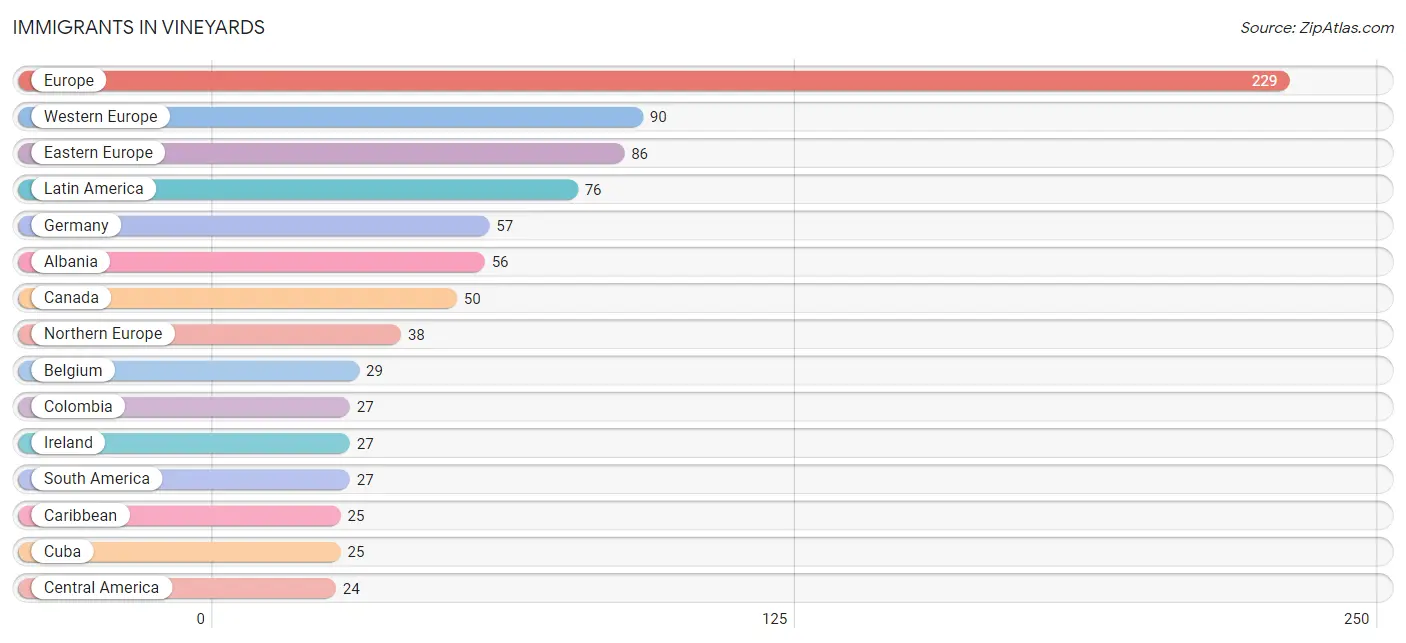
| Immigration Origin | # Population | % Population |
| Albania | 56 | 1.5% |
| Asia | 12 | 0.3% |
| Belgium | 29 | 0.8% |
| Canada | 50 | 1.4% |
| Caribbean | 25 | 0.7% |
| Central America | 24 | 0.7% |
| Colombia | 27 | 0.7% |
| Cuba | 25 | 0.7% |
| Eastern Europe | 86 | 2.4% |
| England | 11 | 0.3% |
| Europe | 229 | 6.3% |
| France | 4 | 0.1% |
| Germany | 57 | 1.6% |
| Greece | 15 | 0.4% |
| Ireland | 27 | 0.7% |
| Latin America | 76 | 2.1% |
| Lebanon | 12 | 0.3% |
| Mexico | 24 | 0.7% |
| Northern Europe | 38 | 1.0% |
| Poland | 11 | 0.3% |
| South America | 27 | 0.7% |
| Southern Europe | 15 | 0.4% |
| Western Asia | 12 | 0.3% |
| Western Europe | 90 | 2.5% | View All 24 Rows |
Sex and Age in Vineyards
Sex and Age in Vineyards
The most populous age groups in Vineyards are 70 to 74 Years (283 | 16.9%) for men and 60 to 64 Years (401 | 20.3%) for women.
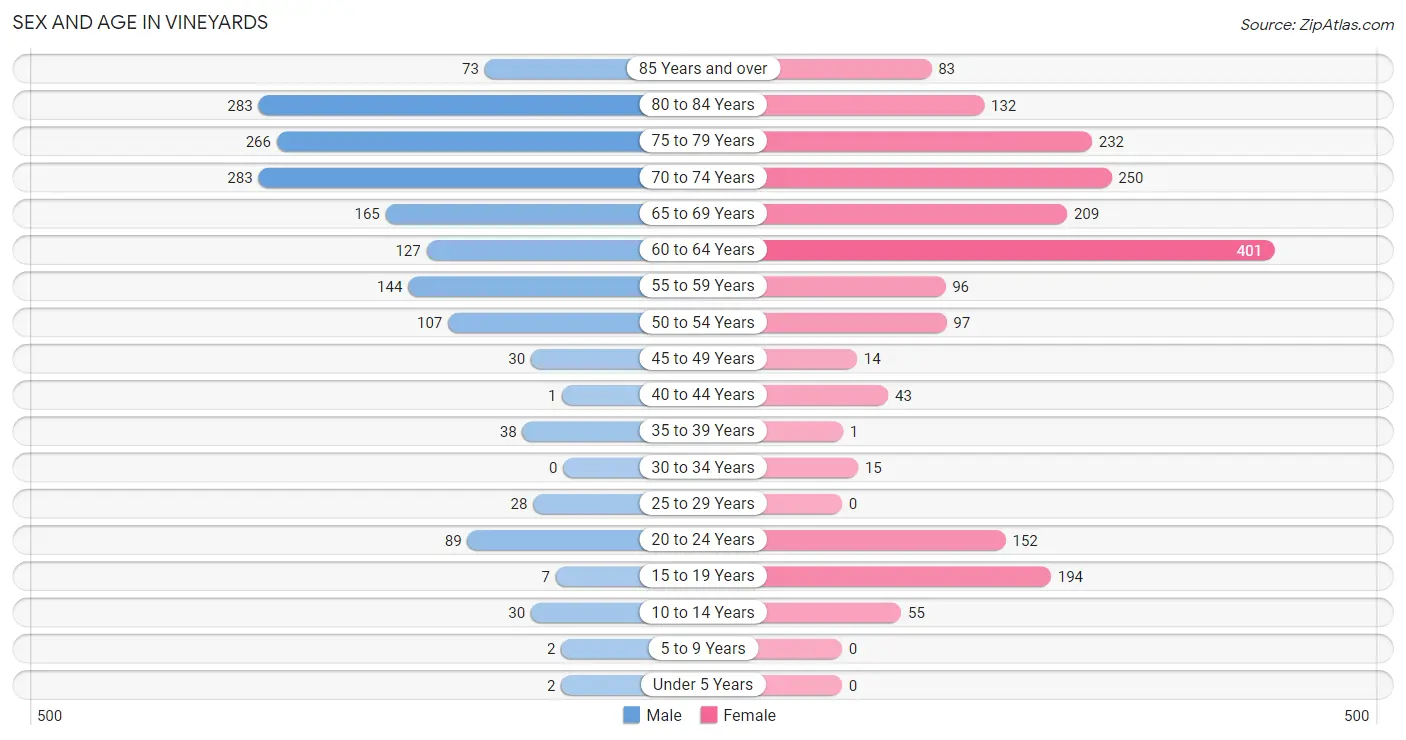
| Age Bracket | Male | Female |
| Under 5 Years | 2 (0.1%) | 0 (0.0%) |
| 5 to 9 Years | 2 (0.1%) | 0 (0.0%) |
| 10 to 14 Years | 30 (1.8%) | 55 (2.8%) |
| 15 to 19 Years | 7 (0.4%) | 194 (9.8%) |
| 20 to 24 Years | 89 (5.3%) | 152 (7.7%) |
| 25 to 29 Years | 28 (1.7%) | 0 (0.0%) |
| 30 to 34 Years | 0 (0.0%) | 15 (0.8%) |
| 35 to 39 Years | 38 (2.3%) | 1 (0.1%) |
| 40 to 44 Years | 1 (0.1%) | 43 (2.2%) |
| 45 to 49 Years | 30 (1.8%) | 14 (0.7%) |
| 50 to 54 Years | 107 (6.4%) | 97 (4.9%) |
| 55 to 59 Years | 144 (8.6%) | 96 (4.9%) |
| 60 to 64 Years | 127 (7.6%) | 401 (20.3%) |
| 65 to 69 Years | 165 (9.9%) | 209 (10.6%) |
| 70 to 74 Years | 283 (16.9%) | 250 (12.7%) |
| 75 to 79 Years | 266 (15.9%) | 232 (11.7%) |
| 80 to 84 Years | 283 (16.9%) | 132 (6.7%) |
| 85 Years and over | 73 (4.4%) | 83 (4.2%) |
| Total | 1,675 (100.0%) | 1,974 (100.0%) |
Families and Households in Vineyards
Median Family Size in Vineyards
The median family size in Vineyards is 2.28 persons per family, with single female/mother families (12 | 1.0%) accounting for the largest median family size of 2.5 persons per family. On the other hand, single male/father families (34 | 2.9%) represent the smallest median family size with 2.26 persons per family.
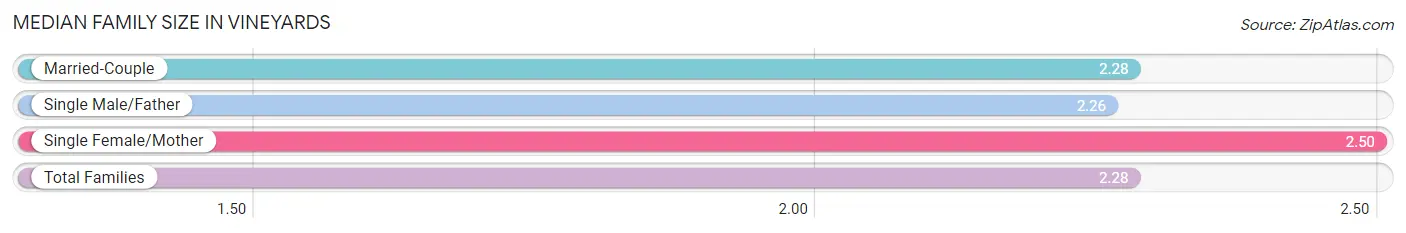
| Family Type | # Families | Family Size |
| Married-Couple | 1,137 (96.1%) | 2.28 |
| Single Male/Father | 34 (2.9%) | 2.26 |
| Single Female/Mother | 12 (1.0%) | 2.50 |
| Total Families | 1,183 (100.0%) | 2.28 |
Median Household Size in Vineyards
The median household size in Vineyards is 1.84 persons per household, with single female/mother households (12 | 0.6%) accounting for the largest median household size of 2.5 persons per household. non-family households (725 | 38.0%) represent the smallest median household size with 1.13 persons per household.
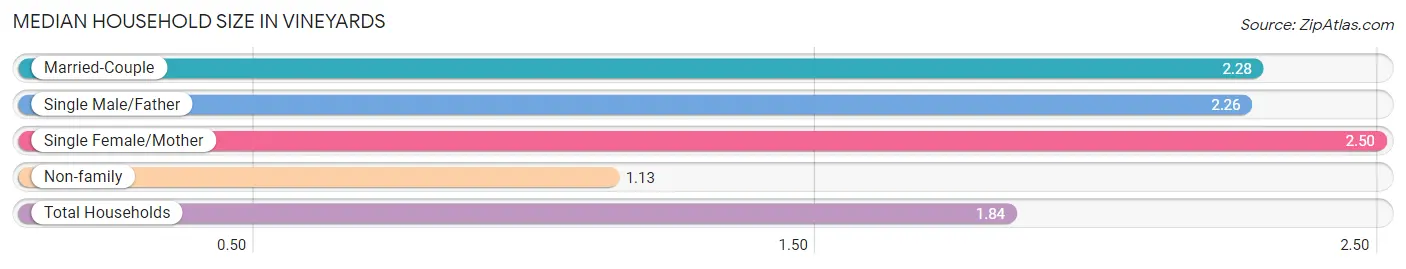
| Household Type | # Households | Household Size |
| Married-Couple | 1,137 (59.6%) | 2.28 |
| Single Male/Father | 34 (1.8%) | 2.26 |
| Single Female/Mother | 12 (0.6%) | 2.50 |
| Non-family | 725 (38.0%) | 1.13 |
| Total Households | 1,908 (100.0%) | 1.84 |
Household Size by Marriage Status in Vineyards
Out of a total of 1,908 households in Vineyards, 1,183 (62.0%) are family households, while 725 (38.0%) are nonfamily households. The most numerous type of family households are 2-person households, comprising 920, and the most common type of nonfamily households are 1-person households, comprising 633.
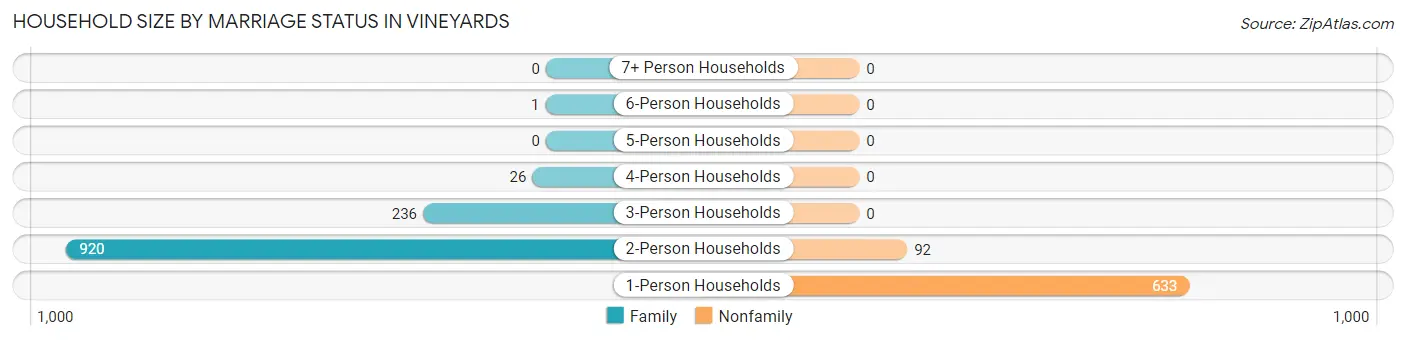
| Household Size | Family Households | Nonfamily Households |
| 1-Person Households | - | 633 (33.2%) |
| 2-Person Households | 920 (48.2%) | 92 (4.8%) |
| 3-Person Households | 236 (12.4%) | 0 (0.0%) |
| 4-Person Households | 26 (1.4%) | 0 (0.0%) |
| 5-Person Households | 0 (0.0%) | 0 (0.0%) |
| 6-Person Households | 1 (0.1%) | 0 (0.0%) |
| 7+ Person Households | 0 (0.0%) | 0 (0.0%) |
| Total | 1,183 (62.0%) | 725 (38.0%) |
Female Fertility in Vineyards
Fertility by Age in Vineyards
| Age Bracket | Women with Births | Births / 1,000 Women |
| 15 to 19 years | 0 (0.0%) | 0.0 |
| 20 to 34 years | 0 (0.0%) | 0.0 |
| 35 to 50 years | 0 (0.0%) | 0.0 |
| Total | 0 (0.0%) | 0.0 |
Fertility by Age by Marriage Status in Vineyards
| Age Bracket | Married | Unmarried |
| 15 to 19 years | 0 (0.0%) | 0 (0.0%) |
| 20 to 34 years | 0 (0.0%) | 0 (0.0%) |
| 35 to 50 years | 0 (0.0%) | 0 (0.0%) |
| Total | 0 (0.0%) | 0 (0.0%) |
Fertility by Education in Vineyards
| Educational Attainment | Women with Births | Births / 1,000 Women |
| Less than High School | 0 (0.0%) | 0.0 |
| High School Diploma | 0 (0.0%) | 0.0 |
| College or Associate's Degree | 0 (0.0%) | 0.0 |
| Bachelor's Degree | 0 (0.0%) | 0.0 |
| Graduate Degree | 0 (0.0%) | 0.0 |
| Total | 0 (0.0%) | 0.0 |
Fertility by Education by Marriage Status in Vineyards
| Educational Attainment | Married | Unmarried |
| Less than High School | 0 (0.0%) | 0 (0.0%) |
| High School Diploma | 0 (0.0%) | 0 (0.0%) |
| College or Associate's Degree | 0 (0.0%) | 0 (0.0%) |
| Bachelor's Degree | 0 (0.0%) | 0 (0.0%) |
| Graduate Degree | 0 (0.0%) | 0 (0.0%) |
| Total | 0 (0.0%) | 0 (0.0%) |
Employment Characteristics in Vineyards
Employment by Class of Employer in Vineyards
Among the 1,373 employed individuals in Vineyards, private company employees (740 | 53.9%), not-for-profit organizations (193 | 14.1%), and self-employed (incorporated) (147 | 10.7%) make up the most common classes of employment.
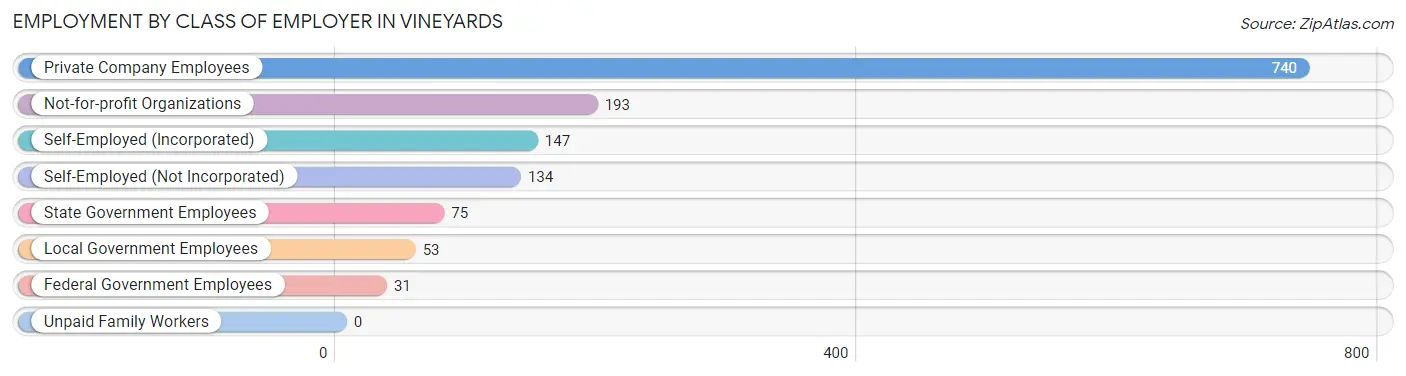
| Employer Class | # Employees | % Employees |
| Private Company Employees | 740 | 53.9% |
| Self-Employed (Incorporated) | 147 | 10.7% |
| Self-Employed (Not Incorporated) | 134 | 9.8% |
| Not-for-profit Organizations | 193 | 14.1% |
| Local Government Employees | 53 | 3.9% |
| State Government Employees | 75 | 5.5% |
| Federal Government Employees | 31 | 2.3% |
| Unpaid Family Workers | 0 | 0.0% |
| Total | 1,373 | 100.0% |
Employment Status by Age in Vineyards
According to the labor force statistics for Vineyards, out of the total population over 16 years of age (3,532), 39.4% or 1,392 individuals are in the labor force, with 1.4% or 19 of them unemployed. The age group with the highest labor force participation rate is 25 to 29 years, with 100.0% or 28 individuals in the labor force. Within the labor force, the 55 to 59 years age range has the highest percentage of unemployed individuals, with 11.4% or 15 of them being unemployed.
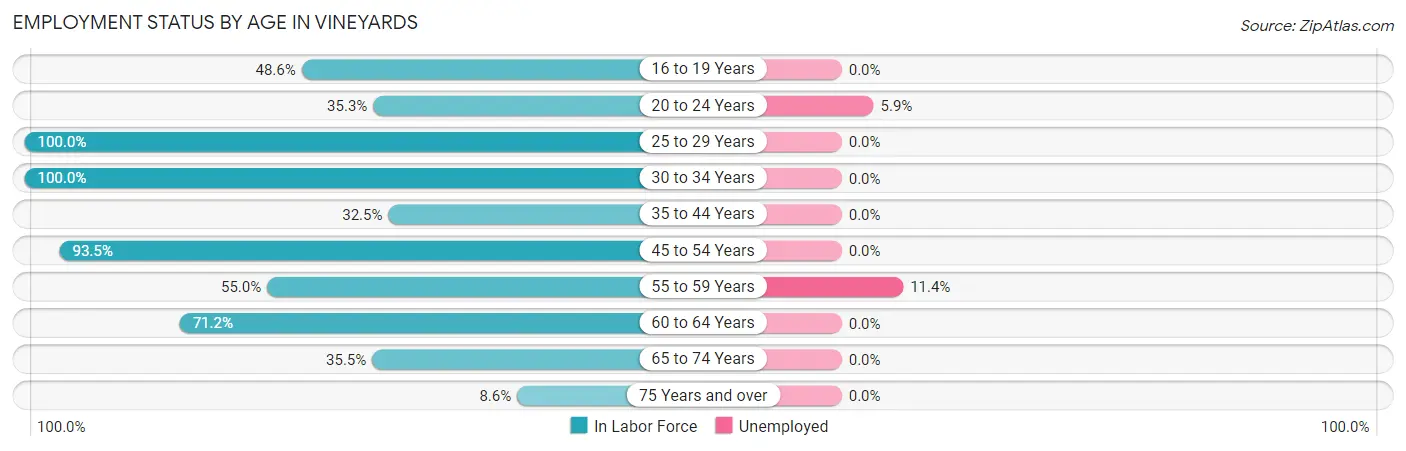
| Age Bracket | In Labor Force | Unemployed |
| 16 to 19 Years | 84 (48.6%) | 0 (0.0%) |
| 20 to 24 Years | 85 (35.3%) | 5 (5.9%) |
| 25 to 29 Years | 28 (100.0%) | 0 (0.0%) |
| 30 to 34 Years | 15 (100.0%) | 0 (0.0%) |
| 35 to 44 Years | 27 (32.5%) | 0 (0.0%) |
| 45 to 54 Years | 232 (93.5%) | 0 (0.0%) |
| 55 to 59 Years | 132 (55.0%) | 15 (11.4%) |
| 60 to 64 Years | 376 (71.2%) | 0 (0.0%) |
| 65 to 74 Years | 322 (35.5%) | 0 (0.0%) |
| 75 Years and over | 92 (8.6%) | 0 (0.0%) |
| Total | 1,392 (39.4%) | 19 (1.4%) |
Employment Status by Educational Attainment in Vineyards
According to labor force statistics for Vineyards, 70.9% of individuals (810) out of the total population between 25 and 64 years of age (1,142) are in the labor force, with 1.9% or 15 of them being unemployed. The group with the highest labor force participation rate are those with the educational attainment of less than high school, with 100.0% or 34 individuals in the labor force. Within the labor force, individuals with college / associate degree education have the highest percentage of unemployment, with 7.7% or 15 of them being unemployed.
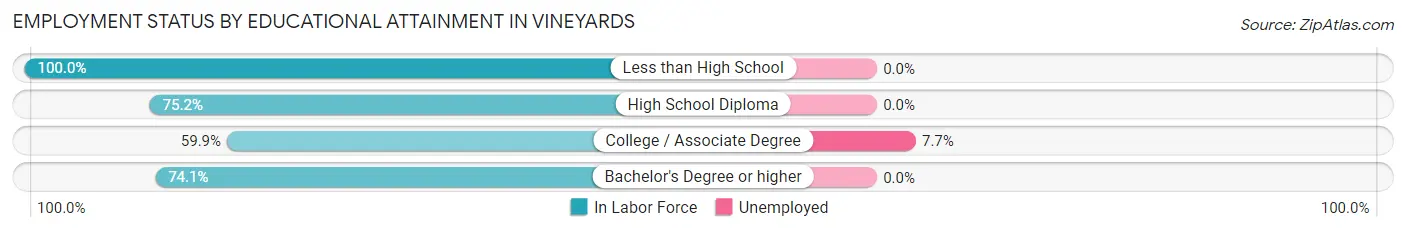
| Educational Attainment | In Labor Force | Unemployed |
| Less than High School | 34 (100.0%) | 0 (0.0%) |
| High School Diploma | 85 (75.2%) | 0 (0.0%) |
| College / Associate Degree | 196 (59.9%) | 25 (7.7%) |
| Bachelor's Degree or higher | 495 (74.1%) | 0 (0.0%) |
| Total | 810 (70.9%) | 22 (1.9%) |
Employment Occupations by Sex in Vineyards
Management, Business, Science and Arts Occupations
The most common Management, Business, Science and Arts occupations in Vineyards are Management (226 | 16.5%), Community & Social Service (182 | 13.3%), Legal Services & Support (157 | 11.4%), Business & Financial (99 | 7.2%), and Computers, Engineering & Science (33 | 2.4%).
Management, Business, Science and Arts Occupations by Sex
Within the Management, Business, Science and Arts occupations in Vineyards, the most male-oriented occupations are Architecture & Engineering (100.0%), Legal Services & Support (100.0%), and Community & Social Service (86.3%), while the most female-oriented occupations are Education Instruction & Library (100.0%), Arts, Media & Entertainment (100.0%), and Health Diagnosing & Treating (100.0%).
| Occupation | Male | Female |
| Management | 140 (62.0%) | 86 (38.1%) |
| Business & Financial | 47 (47.5%) | 52 (52.5%) |
| Computers, Engineering & Science | 25 (75.8%) | 8 (24.2%) |
| Computers & Mathematics | 12 (60.0%) | 8 (40.0%) |
| Architecture & Engineering | 13 (100.0%) | 0 (0.0%) |
| Life, Physical & Social Science | 0 (0.0%) | 0 (0.0%) |
| Community & Social Service | 157 (86.3%) | 25 (13.7%) |
| Education, Arts & Media | 0 (0.0%) | 0 (0.0%) |
| Legal Services & Support | 157 (100.0%) | 0 (0.0%) |
| Education Instruction & Library | 0 (0.0%) | 13 (100.0%) |
| Arts, Media & Entertainment | 0 (0.0%) | 12 (100.0%) |
| Health Diagnosing & Treating | 0 (0.0%) | 12 (100.0%) |
| Health Technologists | 0 (0.0%) | 12 (100.0%) |
| Total (Category) | 369 (66.8%) | 183 (33.2%) |
| Total (Overall) | 602 (43.9%) | 771 (56.1%) |
Services Occupations
The most common Services occupations in Vineyards are Food Preparation & Serving (85 | 6.2%), and Personal Care & Service (49 | 3.6%).
Services Occupations by Sex
Within the Services occupations in Vineyards, the most male-oriented occupations are Personal Care & Service (28.6%), and Food Preparation & Serving (1.2%), while the most female-oriented occupations are Food Preparation & Serving (98.8%), and Personal Care & Service (71.4%).
| Occupation | Male | Female |
| Healthcare Support | 0 (0.0%) | 0 (0.0%) |
| Security & Protection | 0 (0.0%) | 0 (0.0%) |
| Firefighting & Prevention | 0 (0.0%) | 0 (0.0%) |
| Law Enforcement | 0 (0.0%) | 0 (0.0%) |
| Food Preparation & Serving | 1 (1.2%) | 84 (98.8%) |
| Cleaning & Maintenance | 0 (0.0%) | 0 (0.0%) |
| Personal Care & Service | 14 (28.6%) | 35 (71.4%) |
| Total (Category) | 15 (11.2%) | 119 (88.8%) |
| Total (Overall) | 602 (43.9%) | 771 (56.1%) |
Sales and Office Occupations
The most common Sales and Office occupations in Vineyards are Sales & Related (401 | 29.2%), and Office & Administration (218 | 15.9%).
Sales and Office Occupations by Sex
| Occupation | Male | Female |
| Sales & Related | 122 (30.4%) | 279 (69.6%) |
| Office & Administration | 28 (12.8%) | 190 (87.2%) |
| Total (Category) | 150 (24.2%) | 469 (75.8%) |
| Total (Overall) | 602 (43.9%) | 771 (56.1%) |
Natural Resources, Construction and Maintenance Occupations
Natural Resources, Construction and Maintenance Occupations by Sex
| Occupation | Male | Female |
| Farming, Fishing & Forestry | 0 (0.0%) | 0 (0.0%) |
| Construction & Extraction | 0 (0.0%) | 0 (0.0%) |
| Installation, Maintenance & Repair | 0 (0.0%) | 0 (0.0%) |
| Total (Category) | 0 (0.0%) | 0 (0.0%) |
| Total (Overall) | 602 (43.9%) | 771 (56.1%) |
Production, Transportation and Moving Occupations
The most common Production, Transportation and Moving occupations in Vineyards are Production (43 | 3.1%), and Transportation (25 | 1.8%).
Production, Transportation and Moving Occupations by Sex
| Occupation | Male | Female |
| Production | 43 (100.0%) | 0 (0.0%) |
| Transportation | 25 (100.0%) | 0 (0.0%) |
| Material Moving | 0 (0.0%) | 0 (0.0%) |
| Total (Category) | 68 (100.0%) | 0 (0.0%) |
| Total (Overall) | 602 (43.9%) | 771 (56.1%) |
Employment Industries by Sex in Vineyards
Employment Industries in Vineyards
The major employment industries in Vineyards include Professional & Scientific (320 | 23.3%), Accommodation & Food Services (164 | 11.9%), Manufacturing (131 | 9.5%), Real Estate, Rental & Leasing (131 | 9.5%), and Construction (114 | 8.3%).
Employment Industries by Sex in Vineyards
The Vineyards industries that see more men than women are Wholesale Trade (100.0%), Transportation & Warehousing (100.0%), and Utilities (100.0%), whereas the industries that tend to have a higher number of women are Administrative & Support (100.0%), Educational Services (100.0%), and Real Estate, Rental & Leasing (93.9%).
| Industry | Male | Female |
| Agriculture, Fishing & Hunting | 16 (47.1%) | 18 (52.9%) |
| Mining, Quarrying, & Extraction | 0 (0.0%) | 0 (0.0%) |
| Construction | 29 (25.4%) | 85 (74.6%) |
| Manufacturing | 30 (22.9%) | 101 (77.1%) |
| Wholesale Trade | 34 (100.0%) | 0 (0.0%) |
| Retail Trade | 31 (36.5%) | 54 (63.5%) |
| Transportation & Warehousing | 14 (100.0%) | 0 (0.0%) |
| Utilities | 28 (100.0%) | 0 (0.0%) |
| Information | 0 (0.0%) | 0 (0.0%) |
| Finance & Insurance | 49 (100.0%) | 0 (0.0%) |
| Real Estate, Rental & Leasing | 8 (6.1%) | 123 (93.9%) |
| Professional & Scientific | 235 (73.4%) | 85 (26.6%) |
| Enterprise Management | 0 (0.0%) | 0 (0.0%) |
| Administrative & Support | 0 (0.0%) | 32 (100.0%) |
| Educational Services | 0 (0.0%) | 56 (100.0%) |
| Health Care & Social Assistance | 9 (42.9%) | 12 (57.1%) |
| Arts, Entertainment & Recreation | 1 (100.0%) | 0 (0.0%) |
| Accommodation & Food Services | 25 (15.2%) | 139 (84.8%) |
| Public Administration | 34 (66.7%) | 17 (33.3%) |
| Total | 602 (43.9%) | 771 (56.1%) |
Education in Vineyards
School Enrollment in Vineyards
The most common levels of schooling among the 516 students in Vineyards are college / undergraduate (321 | 62.2%), high school (83 | 16.1%), and graduate / professional (79 | 15.3%).
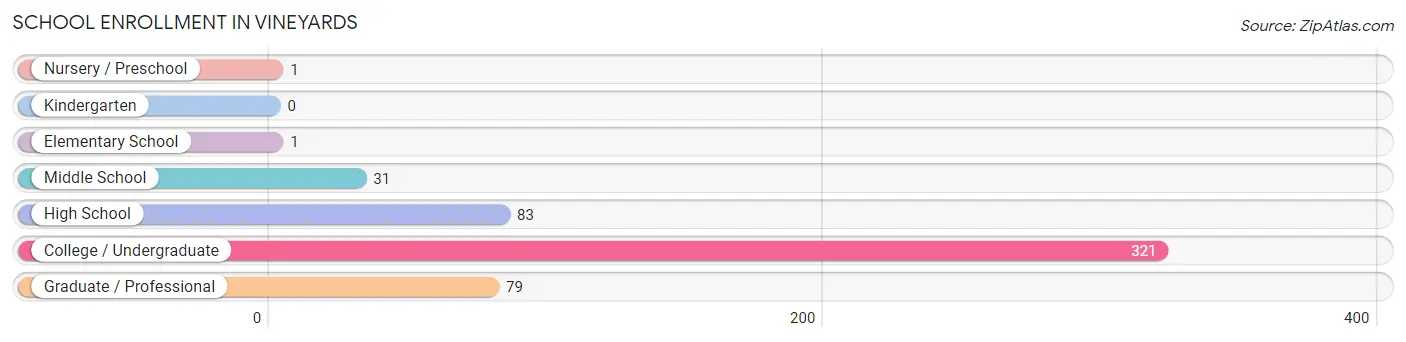
| School Level | # Students | % Students |
| Nursery / Preschool | 1 | 0.2% |
| Kindergarten | 0 | 0.0% |
| Elementary School | 1 | 0.2% |
| Middle School | 31 | 6.0% |
| High School | 83 | 16.1% |
| College / Undergraduate | 321 | 62.2% |
| Graduate / Professional | 79 | 15.3% |
| Total | 516 | 100.0% |
School Enrollment by Age by Funding Source in Vineyards
Out of a total of 516 students who are enrolled in schools in Vineyards, 322 (62.4%) attend a private institution, while the remaining 194 (37.6%) are enrolled in public schools. The age group of 3 to 4 year olds has the highest likelihood of being enrolled in private schools, with 1 (100.0% in the age bracket) enrolled. Conversely, the age group of 10 to 14 year olds has the lowest likelihood of being enrolled in a private school, with 85 (100.0% in the age bracket) attending a public institution.
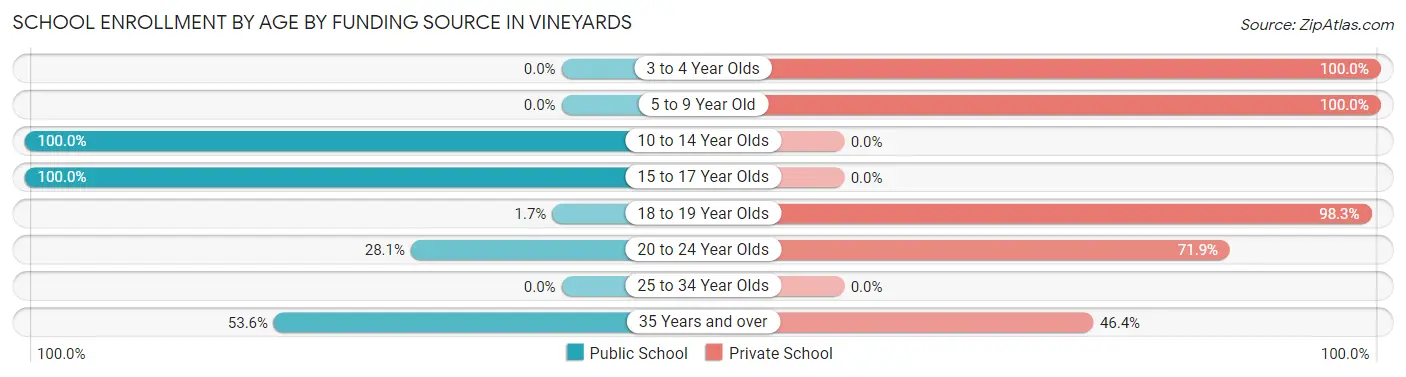
| Age Bracket | Public School | Private School |
| 3 to 4 Year Olds | 0 (0.0%) | 1 (100.0%) |
| 5 to 9 Year Old | 0 (0.0%) | 2 (100.0%) |
| 10 to 14 Year Olds | 85 (100.0%) | 0 (0.0%) |
| 15 to 17 Year Olds | 28 (100.0%) | 0 (0.0%) |
| 18 to 19 Year Olds | 3 (1.7%) | 170 (98.3%) |
| 20 to 24 Year Olds | 48 (28.1%) | 123 (71.9%) |
| 25 to 34 Year Olds | 0 (0.0%) | 0 (0.0%) |
| 35 Years and over | 30 (53.6%) | 26 (46.4%) |
| Total | 194 (37.6%) | 322 (62.4%) |
Educational Attainment by Field of Study in Vineyards
Business (654 | 32.2%), social sciences (301 | 14.8%), education (289 | 14.2%), engineering (165 | 8.1%), and psychology (131 | 6.4%) are the most common fields of study among 2,034 individuals in Vineyards who have obtained a bachelor's degree or higher.
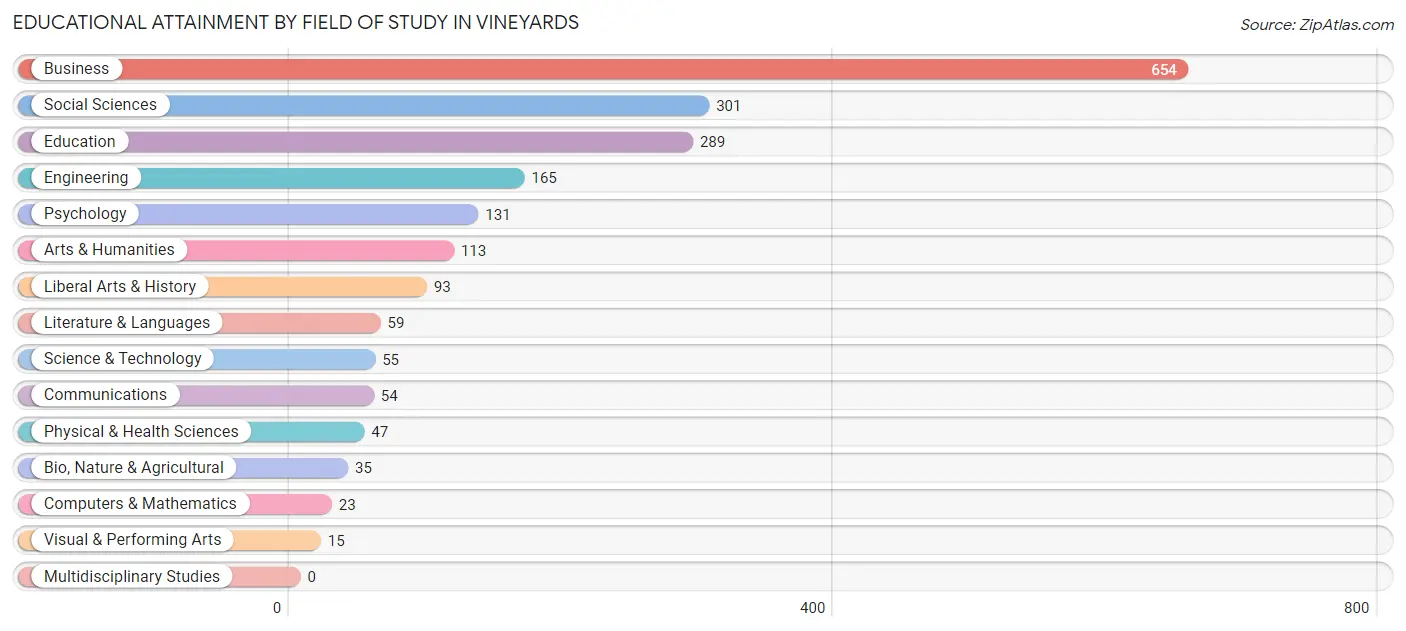
| Field of Study | # Graduates | % Graduates |
| Computers & Mathematics | 23 | 1.1% |
| Bio, Nature & Agricultural | 35 | 1.7% |
| Physical & Health Sciences | 47 | 2.3% |
| Psychology | 131 | 6.4% |
| Social Sciences | 301 | 14.8% |
| Engineering | 165 | 8.1% |
| Multidisciplinary Studies | 0 | 0.0% |
| Science & Technology | 55 | 2.7% |
| Business | 654 | 32.2% |
| Education | 289 | 14.2% |
| Literature & Languages | 59 | 2.9% |
| Liberal Arts & History | 93 | 4.6% |
| Visual & Performing Arts | 15 | 0.7% |
| Communications | 54 | 2.6% |
| Arts & Humanities | 113 | 5.6% |
| Total | 2,034 | 100.0% |
Transportation & Commute in Vineyards
Vehicle Availability by Sex in Vineyards
The most prevalent vehicle ownership categories in Vineyards are males with 2 vehicles (323, accounting for 53.6%) and females with 2 vehicles (331, making up 41.9%).
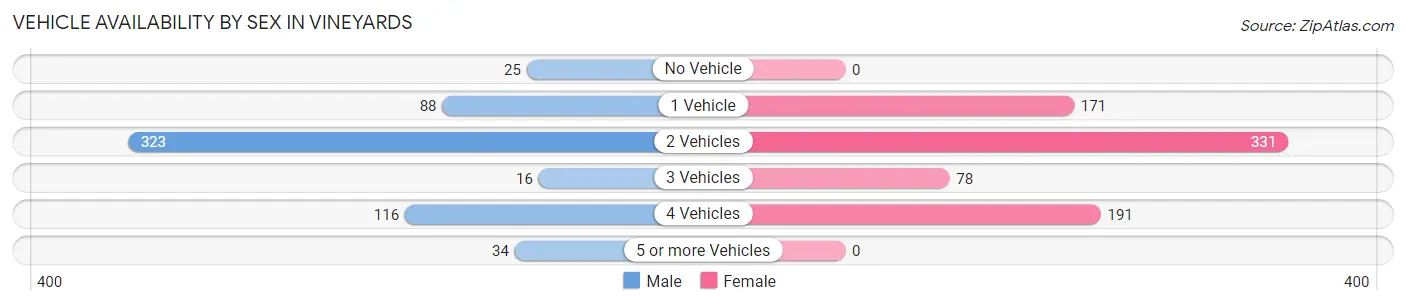
| Vehicles Available | Male | Female |
| No Vehicle | 25 (4.2%) | 0 (0.0%) |
| 1 Vehicle | 88 (14.6%) | 171 (22.2%) |
| 2 Vehicles | 323 (53.6%) | 331 (42.9%) |
| 3 Vehicles | 16 (2.7%) | 78 (10.1%) |
| 4 Vehicles | 116 (19.3%) | 191 (24.8%) |
| 5 or more Vehicles | 34 (5.7%) | 0 (0.0%) |
| Total | 602 (100.0%) | 771 (100.0%) |
Commute Time in Vineyards
The most frequently occuring commute durations in Vineyards are 20 to 24 minutes (453 commuters, 39.0%), 15 to 19 minutes (278 commuters, 23.9%), and 25 to 29 minutes (125 commuters, 10.8%).
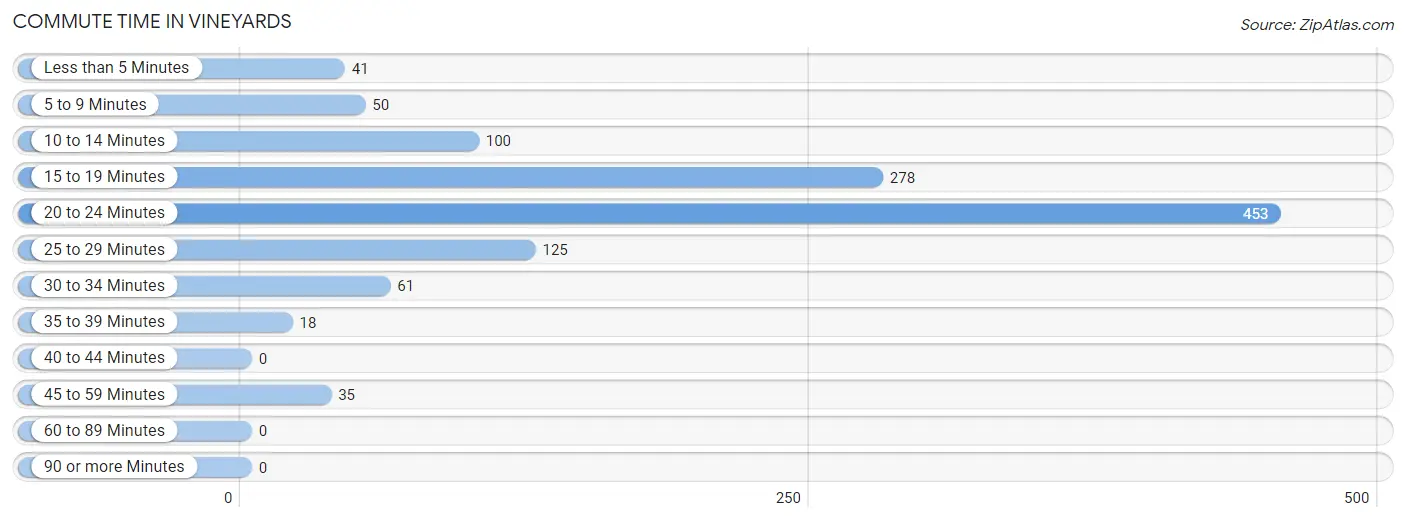
| Commute Time | # Commuters | % Commuters |
| Less than 5 Minutes | 41 | 3.5% |
| 5 to 9 Minutes | 50 | 4.3% |
| 10 to 14 Minutes | 100 | 8.6% |
| 15 to 19 Minutes | 278 | 23.9% |
| 20 to 24 Minutes | 453 | 39.0% |
| 25 to 29 Minutes | 125 | 10.8% |
| 30 to 34 Minutes | 61 | 5.2% |
| 35 to 39 Minutes | 18 | 1.5% |
| 40 to 44 Minutes | 0 | 0.0% |
| 45 to 59 Minutes | 35 | 3.0% |
| 60 to 89 Minutes | 0 | 0.0% |
| 90 or more Minutes | 0 | 0.0% |
Commute Time by Sex in Vineyards
The most common commute times in Vineyards are 20 to 24 minutes (158 commuters, 32.0%) for males and 20 to 24 minutes (295 commuters, 44.2%) for females.
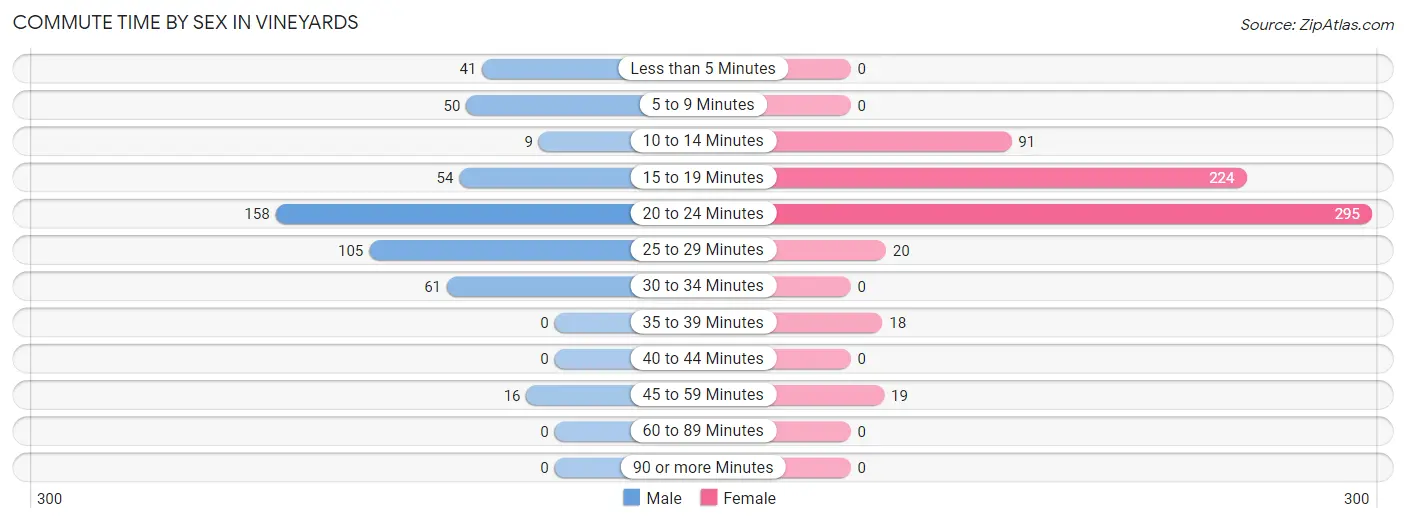
| Commute Time | Male | Female |
| Less than 5 Minutes | 41 (8.3%) | 0 (0.0%) |
| 5 to 9 Minutes | 50 (10.1%) | 0 (0.0%) |
| 10 to 14 Minutes | 9 (1.8%) | 91 (13.6%) |
| 15 to 19 Minutes | 54 (10.9%) | 224 (33.6%) |
| 20 to 24 Minutes | 158 (32.0%) | 295 (44.2%) |
| 25 to 29 Minutes | 105 (21.3%) | 20 (3.0%) |
| 30 to 34 Minutes | 61 (12.3%) | 0 (0.0%) |
| 35 to 39 Minutes | 0 (0.0%) | 18 (2.7%) |
| 40 to 44 Minutes | 0 (0.0%) | 0 (0.0%) |
| 45 to 59 Minutes | 16 (3.2%) | 19 (2.9%) |
| 60 to 89 Minutes | 0 (0.0%) | 0 (0.0%) |
| 90 or more Minutes | 0 (0.0%) | 0 (0.0%) |
Time of Departure to Work by Sex in Vineyards
The most frequent times of departure to work in Vineyards are 8:00 AM to 8:29 AM (148, 30.0%) for males and 4:00 PM to 11:59 PM (156, 23.4%) for females.
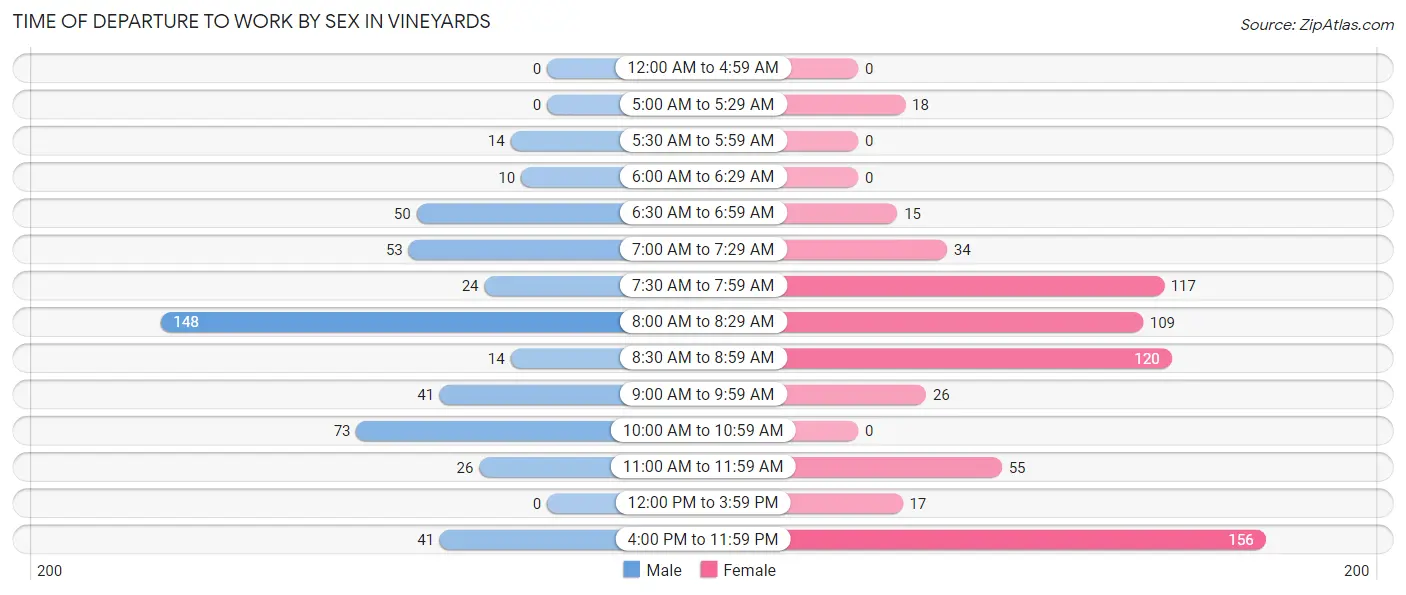
| Time of Departure | Male | Female |
| 12:00 AM to 4:59 AM | 0 (0.0%) | 0 (0.0%) |
| 5:00 AM to 5:29 AM | 0 (0.0%) | 18 (2.7%) |
| 5:30 AM to 5:59 AM | 14 (2.8%) | 0 (0.0%) |
| 6:00 AM to 6:29 AM | 10 (2.0%) | 0 (0.0%) |
| 6:30 AM to 6:59 AM | 50 (10.1%) | 15 (2.2%) |
| 7:00 AM to 7:29 AM | 53 (10.7%) | 34 (5.1%) |
| 7:30 AM to 7:59 AM | 24 (4.9%) | 117 (17.5%) |
| 8:00 AM to 8:29 AM | 148 (30.0%) | 109 (16.3%) |
| 8:30 AM to 8:59 AM | 14 (2.8%) | 120 (18.0%) |
| 9:00 AM to 9:59 AM | 41 (8.3%) | 26 (3.9%) |
| 10:00 AM to 10:59 AM | 73 (14.8%) | 0 (0.0%) |
| 11:00 AM to 11:59 AM | 26 (5.3%) | 55 (8.3%) |
| 12:00 PM to 3:59 PM | 0 (0.0%) | 17 (2.5%) |
| 4:00 PM to 11:59 PM | 41 (8.3%) | 156 (23.4%) |
| Total | 494 (100.0%) | 667 (100.0%) |
Housing Occupancy in Vineyards
Occupancy by Ownership in Vineyards
Of the total 1,908 dwellings in Vineyards, owner-occupied units account for 1,680 (88.0%), while renter-occupied units make up 228 (11.9%).
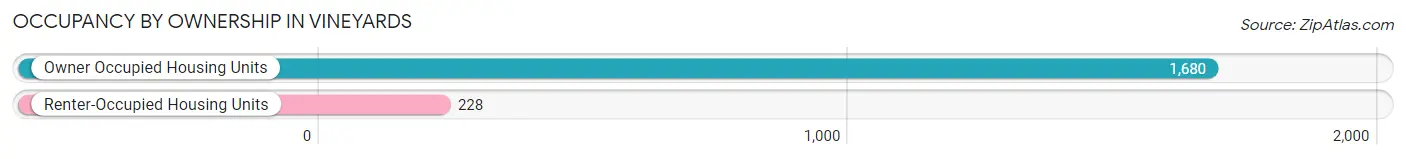
| Occupancy | # Housing Units | % Housing Units |
| Owner Occupied Housing Units | 1,680 | 88.0% |
| Renter-Occupied Housing Units | 228 | 11.9% |
| Total Occupied Housing Units | 1,908 | 100.0% |
Occupancy by Household Size in Vineyards
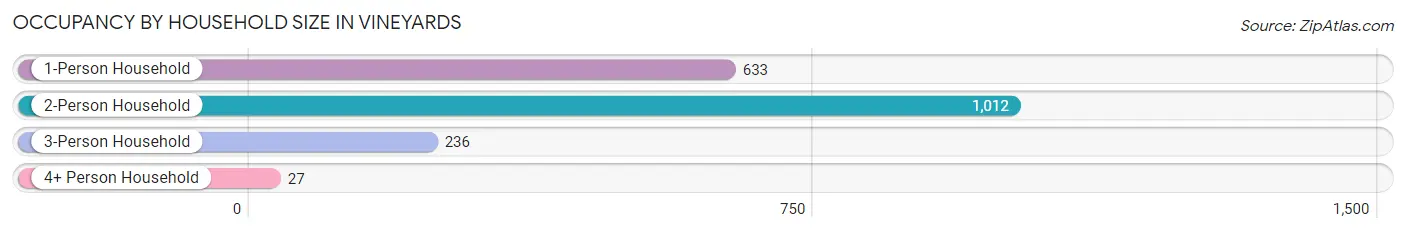
| Household Size | # Housing Units | % Housing Units |
| 1-Person Household | 633 | 33.2% |
| 2-Person Household | 1,012 | 53.0% |
| 3-Person Household | 236 | 12.4% |
| 4+ Person Household | 27 | 1.4% |
| Total Housing Units | 1,908 | 100.0% |
Occupancy by Ownership by Household Size in Vineyards
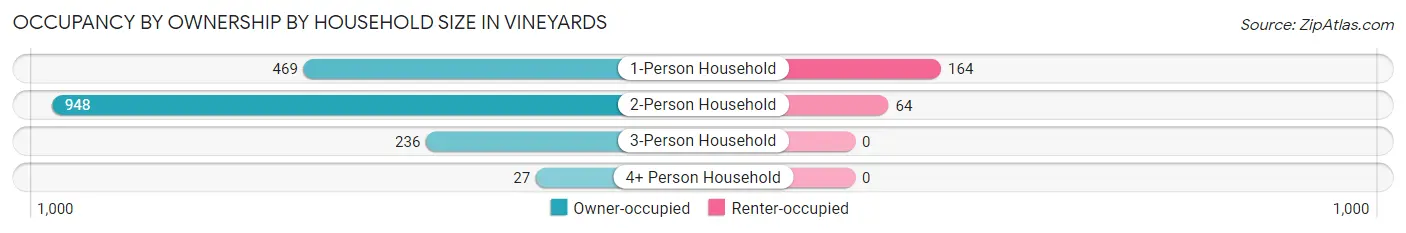
| Household Size | Owner-occupied | Renter-occupied |
| 1-Person Household | 469 (74.1%) | 164 (25.9%) |
| 2-Person Household | 948 (93.7%) | 64 (6.3%) |
| 3-Person Household | 236 (100.0%) | 0 (0.0%) |
| 4+ Person Household | 27 (100.0%) | 0 (0.0%) |
| Total Housing Units | 1,680 (88.0%) | 228 (11.9%) |
Occupancy by Educational Attainment in Vineyards
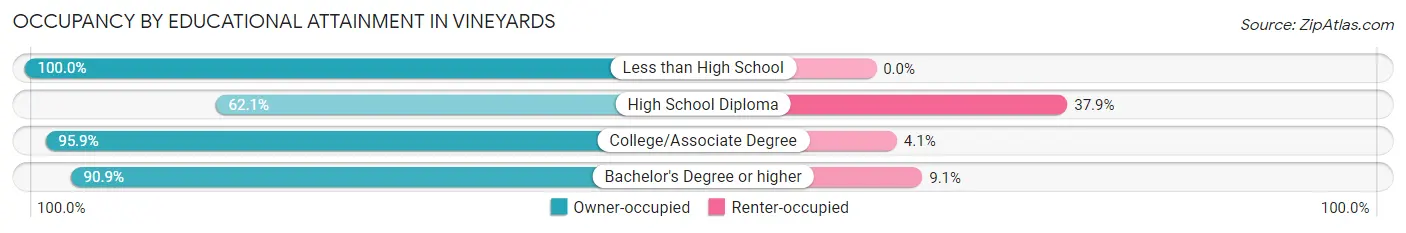
| Household Size | Owner-occupied | Renter-occupied |
| Less than High School | 18 (100.0%) | 0 (0.0%) |
| High School Diploma | 159 (62.1%) | 97 (37.9%) |
| College/Associate Degree | 350 (95.9%) | 15 (4.1%) |
| Bachelor's Degree or higher | 1,153 (90.9%) | 116 (9.1%) |
Occupancy by Age of Householder in Vineyards
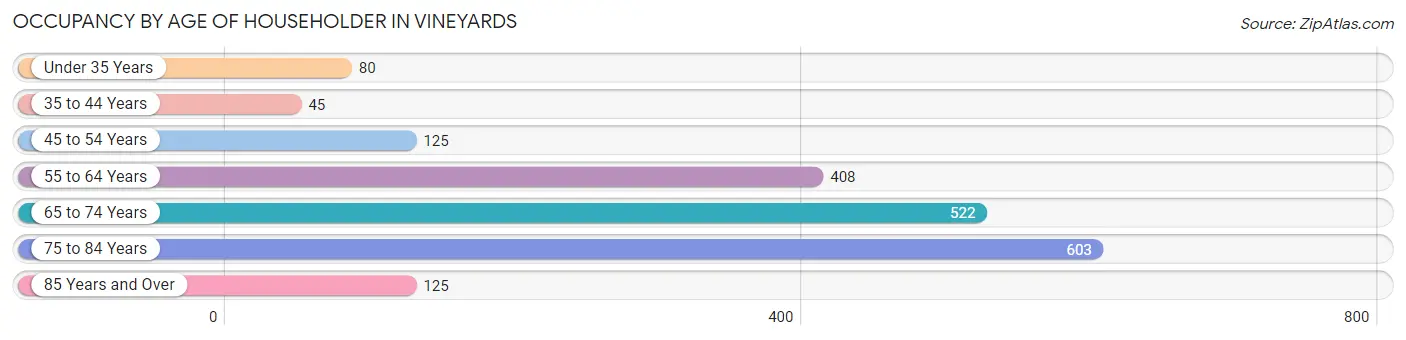
| Age Bracket | # Households | % Households |
| Under 35 Years | 80 | 4.2% |
| 35 to 44 Years | 45 | 2.4% |
| 45 to 54 Years | 125 | 6.6% |
| 55 to 64 Years | 408 | 21.4% |
| 65 to 74 Years | 522 | 27.4% |
| 75 to 84 Years | 603 | 31.6% |
| 85 Years and Over | 125 | 6.6% |
| Total | 1,908 | 100.0% |
Housing Finances in Vineyards
Median Income by Occupancy in Vineyards
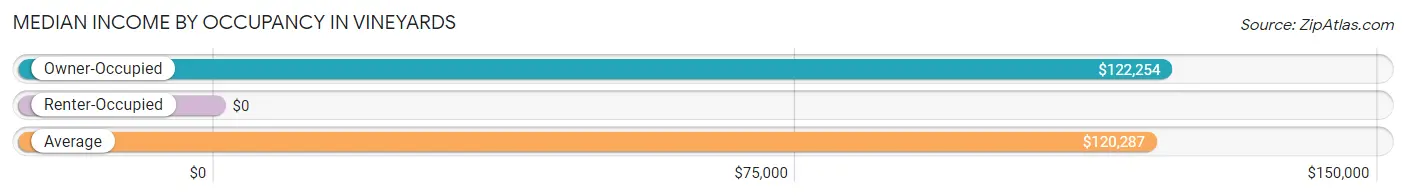
| Occupancy Type | # Households | Median Income |
| Owner-Occupied | 1,680 (88.0%) | $122,254 |
| Renter-Occupied | 228 (11.9%) | $0 |
| Average | 1,908 (100.0%) | $120,287 |
Occupancy by Householder Income Bracket in Vineyards
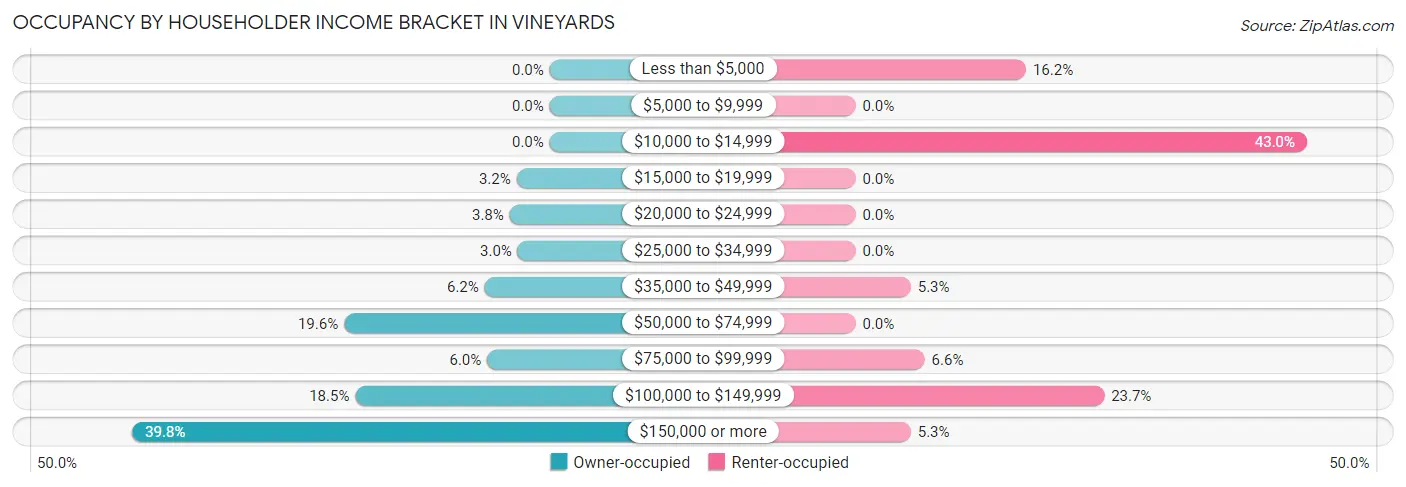
| Income Bracket | Owner-occupied | Renter-occupied |
| Less than $5,000 | 0 (0.0%) | 37 (16.2%) |
| $5,000 to $9,999 | 0 (0.0%) | 0 (0.0%) |
| $10,000 to $14,999 | 0 (0.0%) | 98 (43.0%) |
| $15,000 to $19,999 | 53 (3.2%) | 0 (0.0%) |
| $20,000 to $24,999 | 64 (3.8%) | 0 (0.0%) |
| $25,000 to $34,999 | 51 (3.0%) | 0 (0.0%) |
| $35,000 to $49,999 | 104 (6.2%) | 12 (5.3%) |
| $50,000 to $74,999 | 329 (19.6%) | 0 (0.0%) |
| $75,000 to $99,999 | 100 (5.9%) | 15 (6.6%) |
| $100,000 to $149,999 | 311 (18.5%) | 54 (23.7%) |
| $150,000 or more | 668 (39.8%) | 12 (5.3%) |
| Total | 1,680 (100.0%) | 228 (100.0%) |
Monthly Housing Cost Tiers in Vineyards
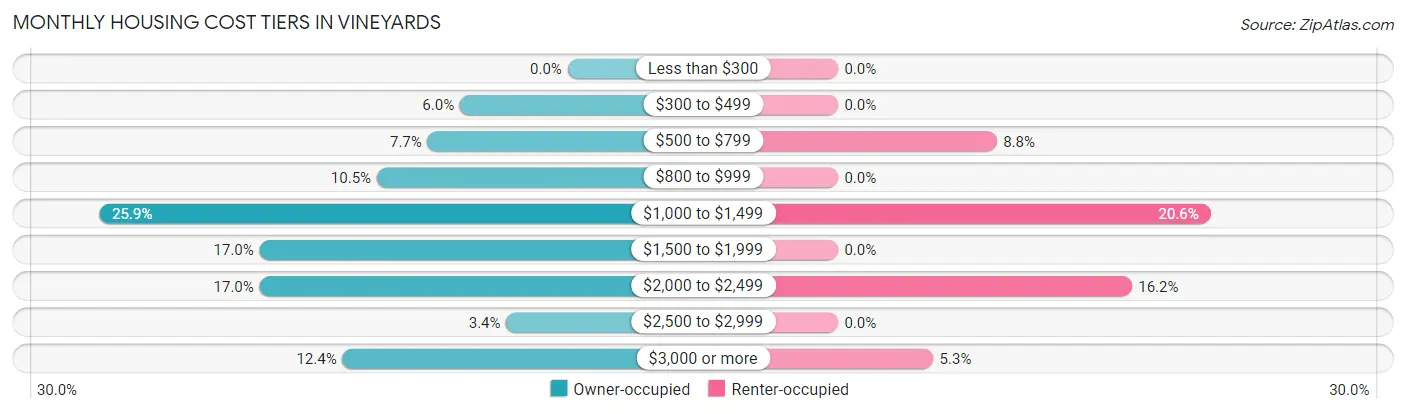
| Monthly Cost | Owner-occupied | Renter-occupied |
| Less than $300 | 0 (0.0%) | 0 (0.0%) |
| $300 to $499 | 100 (5.9%) | 0 (0.0%) |
| $500 to $799 | 130 (7.7%) | 20 (8.8%) |
| $800 to $999 | 177 (10.5%) | 0 (0.0%) |
| $1,000 to $1,499 | 435 (25.9%) | 47 (20.6%) |
| $1,500 to $1,999 | 286 (17.0%) | 0 (0.0%) |
| $2,000 to $2,499 | 286 (17.0%) | 37 (16.2%) |
| $2,500 to $2,999 | 57 (3.4%) | 0 (0.0%) |
| $3,000 or more | 209 (12.4%) | 12 (5.3%) |
| Total | 1,680 (100.0%) | 228 (100.0%) |
Physical Housing Characteristics in Vineyards
Housing Structures in Vineyards
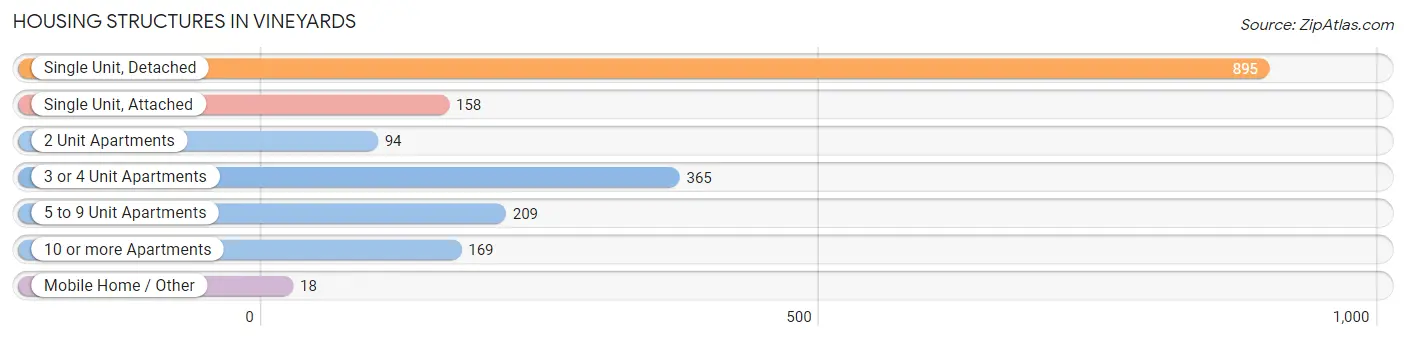
| Structure Type | # Housing Units | % Housing Units |
| Single Unit, Detached | 895 | 46.9% |
| Single Unit, Attached | 158 | 8.3% |
| 2 Unit Apartments | 94 | 4.9% |
| 3 or 4 Unit Apartments | 365 | 19.1% |
| 5 to 9 Unit Apartments | 209 | 11.0% |
| 10 or more Apartments | 169 | 8.9% |
| Mobile Home / Other | 18 | 0.9% |
| Total | 1,908 | 100.0% |
Housing Structures by Occupancy in Vineyards
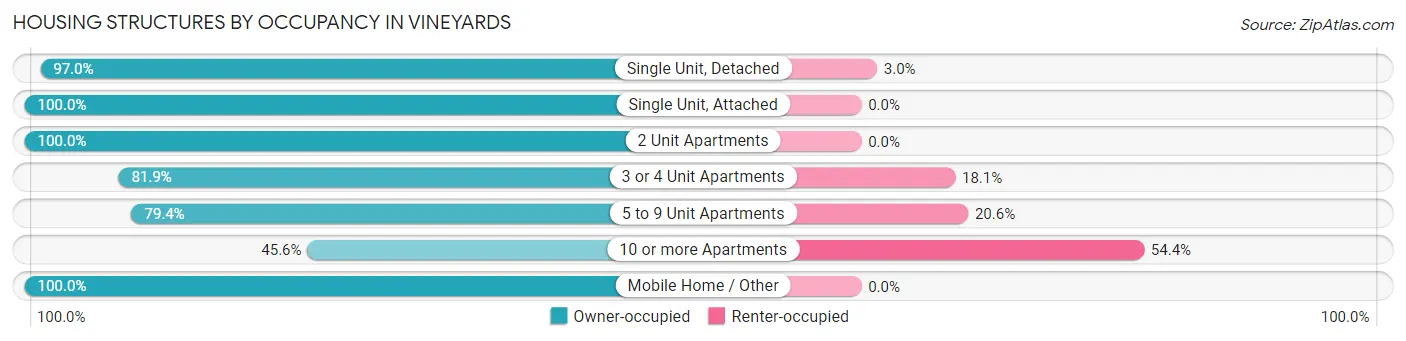
| Structure Type | Owner-occupied | Renter-occupied |
| Single Unit, Detached | 868 (97.0%) | 27 (3.0%) |
| Single Unit, Attached | 158 (100.0%) | 0 (0.0%) |
| 2 Unit Apartments | 94 (100.0%) | 0 (0.0%) |
| 3 or 4 Unit Apartments | 299 (81.9%) | 66 (18.1%) |
| 5 to 9 Unit Apartments | 166 (79.4%) | 43 (20.6%) |
| 10 or more Apartments | 77 (45.6%) | 92 (54.4%) |
| Mobile Home / Other | 18 (100.0%) | 0 (0.0%) |
| Total | 1,680 (88.0%) | 228 (11.9%) |
Housing Structures by Number of Rooms in Vineyards
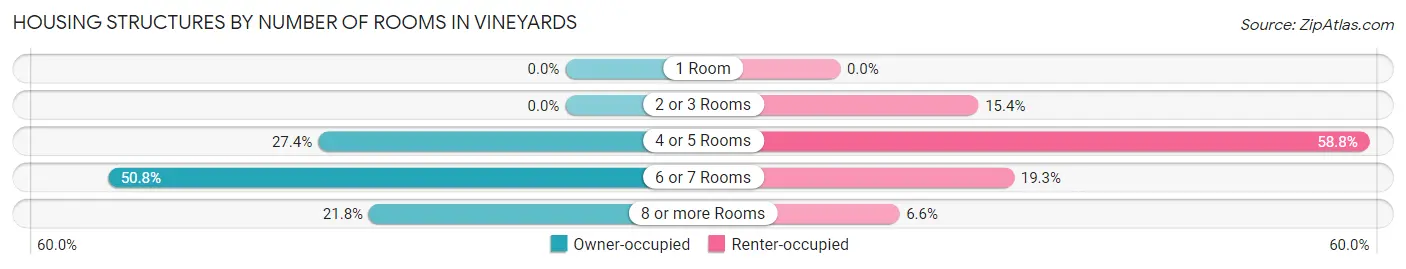
| Number of Rooms | Owner-occupied | Renter-occupied |
| 1 Room | 0 (0.0%) | 0 (0.0%) |
| 2 or 3 Rooms | 0 (0.0%) | 35 (15.3%) |
| 4 or 5 Rooms | 461 (27.4%) | 134 (58.8%) |
| 6 or 7 Rooms | 853 (50.8%) | 44 (19.3%) |
| 8 or more Rooms | 366 (21.8%) | 15 (6.6%) |
| Total | 1,680 (100.0%) | 228 (100.0%) |
Housing Structure by Heating Type in Vineyards
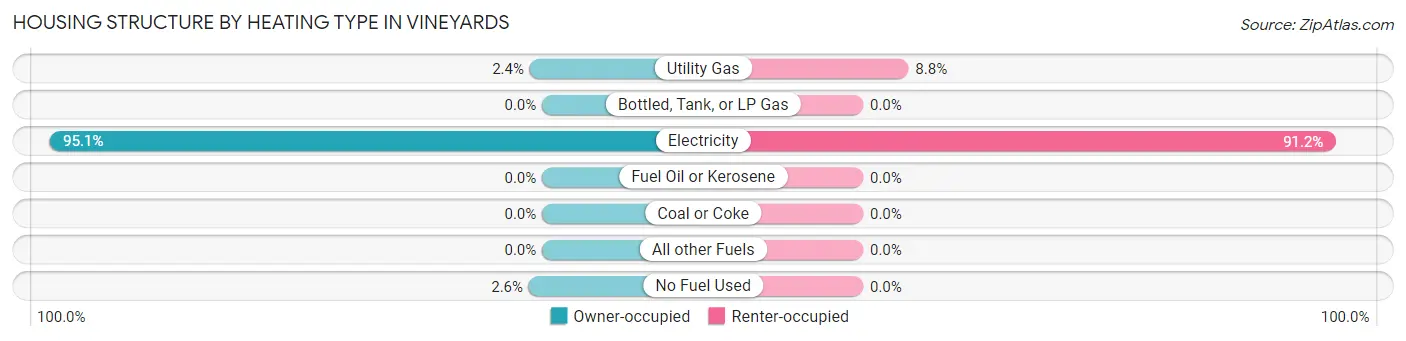
| Heating Type | Owner-occupied | Renter-occupied |
| Utility Gas | 40 (2.4%) | 20 (8.8%) |
| Bottled, Tank, or LP Gas | 0 (0.0%) | 0 (0.0%) |
| Electricity | 1,597 (95.1%) | 208 (91.2%) |
| Fuel Oil or Kerosene | 0 (0.0%) | 0 (0.0%) |
| Coal or Coke | 0 (0.0%) | 0 (0.0%) |
| All other Fuels | 0 (0.0%) | 0 (0.0%) |
| No Fuel Used | 43 (2.6%) | 0 (0.0%) |
| Total | 1,680 (100.0%) | 228 (100.0%) |
Household Vehicle Usage in Vineyards
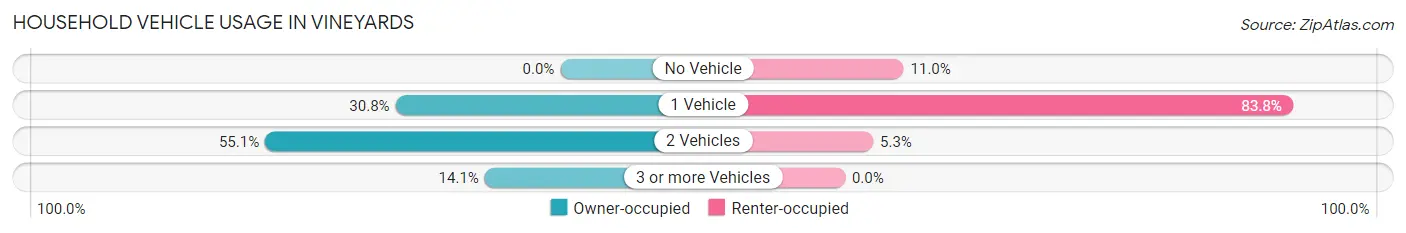
| Vehicles per Household | Owner-occupied | Renter-occupied |
| No Vehicle | 0 (0.0%) | 25 (11.0%) |
| 1 Vehicle | 517 (30.8%) | 191 (83.8%) |
| 2 Vehicles | 926 (55.1%) | 12 (5.3%) |
| 3 or more Vehicles | 237 (14.1%) | 0 (0.0%) |
| Total | 1,680 (100.0%) | 228 (100.0%) |
Real Estate & Mortgages in Vineyards
Real Estate and Mortgage Overview in Vineyards
| Characteristic | Without Mortgage | With Mortgage |
| Housing Units | 849 | 831 |
| Median Property Value | $593,600 | $559,200 |
| Median Household Income | $117,050 | $343 |
| Monthly Housing Costs | $1,207 | $209 |
| Real Estate Taxes | $4,141 | $24 |
Property Value by Mortgage Status in Vineyards
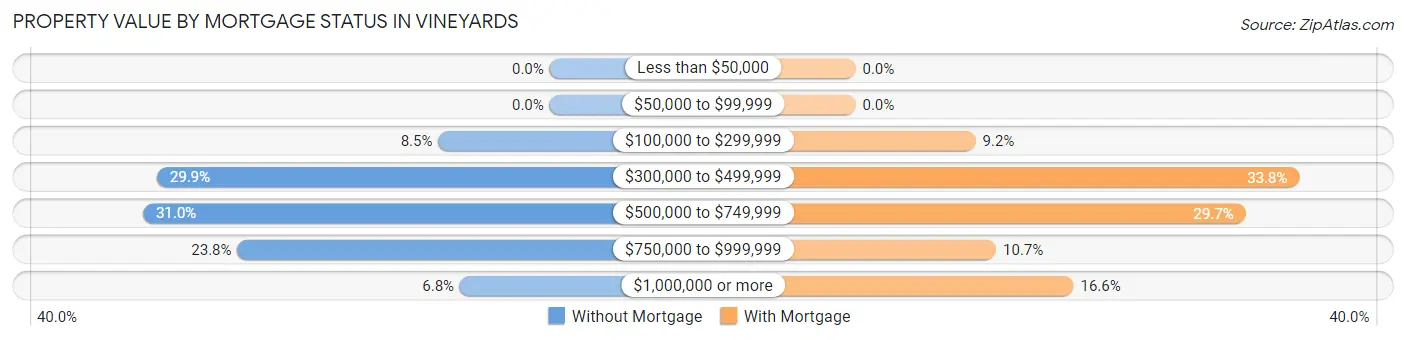
| Property Value | Without Mortgage | With Mortgage |
| Less than $50,000 | 0 (0.0%) | 0 (0.0%) |
| $50,000 to $99,999 | 0 (0.0%) | 0 (0.0%) |
| $100,000 to $299,999 | 72 (8.5%) | 76 (9.1%) |
| $300,000 to $499,999 | 254 (29.9%) | 281 (33.8%) |
| $500,000 to $749,999 | 263 (31.0%) | 247 (29.7%) |
| $750,000 to $999,999 | 202 (23.8%) | 89 (10.7%) |
| $1,000,000 or more | 58 (6.8%) | 138 (16.6%) |
| Total | 849 (100.0%) | 831 (100.0%) |
Household Income by Mortgage Status in Vineyards
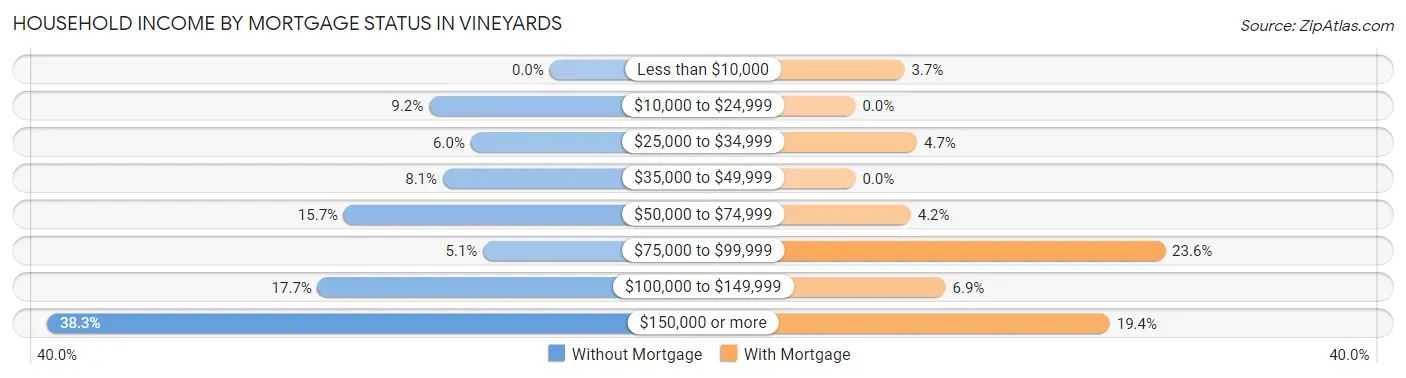
| Household Income | Without Mortgage | With Mortgage |
| Less than $10,000 | 0 (0.0%) | 31 (3.7%) |
| $10,000 to $24,999 | 78 (9.2%) | 0 (0.0%) |
| $25,000 to $34,999 | 51 (6.0%) | 39 (4.7%) |
| $35,000 to $49,999 | 69 (8.1%) | 0 (0.0%) |
| $50,000 to $74,999 | 133 (15.7%) | 35 (4.2%) |
| $75,000 to $99,999 | 43 (5.1%) | 196 (23.6%) |
| $100,000 to $149,999 | 150 (17.7%) | 57 (6.9%) |
| $150,000 or more | 325 (38.3%) | 161 (19.4%) |
| Total | 849 (100.0%) | 831 (100.0%) |
Property Value to Household Income Ratio in Vineyards
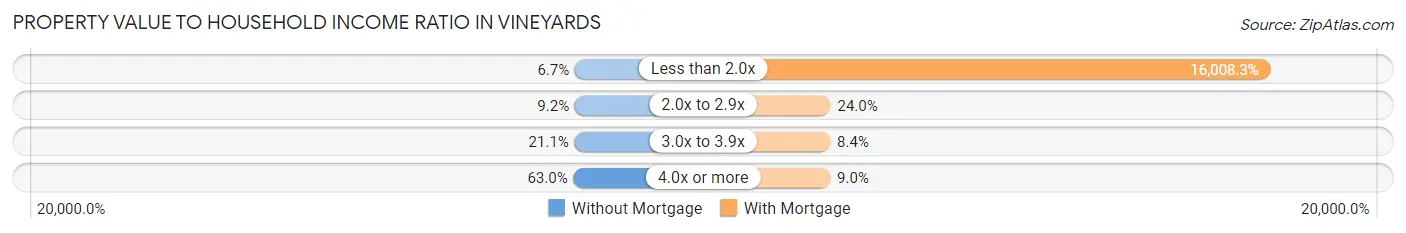
| Value-to-Income Ratio | Without Mortgage | With Mortgage |
| Less than 2.0x | 57 (6.7%) | 133,029 (16,008.3%) |
| 2.0x to 2.9x | 78 (9.2%) | 199 (23.9%) |
| 3.0x to 3.9x | 179 (21.1%) | 70 (8.4%) |
| 4.0x or more | 535 (63.0%) | 75 (9.0%) |
| Total | 849 (100.0%) | 831 (100.0%) |
Real Estate Taxes by Mortgage Status in Vineyards
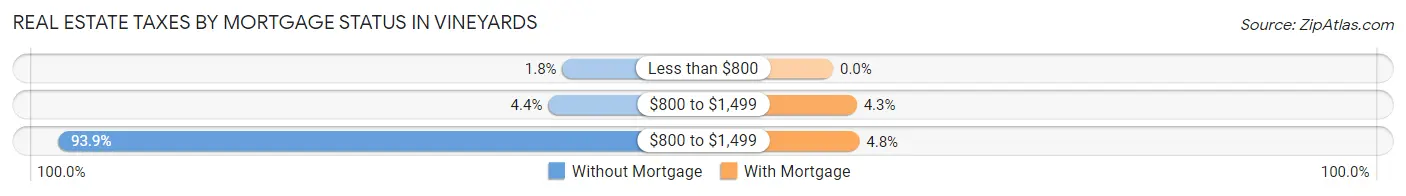
| Property Taxes | Without Mortgage | With Mortgage |
| Less than $800 | 15 (1.8%) | 0 (0.0%) |
| $800 to $1,499 | 37 (4.4%) | 36 (4.3%) |
| $800 to $1,499 | 797 (93.9%) | 40 (4.8%) |
| Total | 849 (100.0%) | 831 (100.0%) |
Health & Disability in Vineyards
Health Insurance Coverage by Age in Vineyards
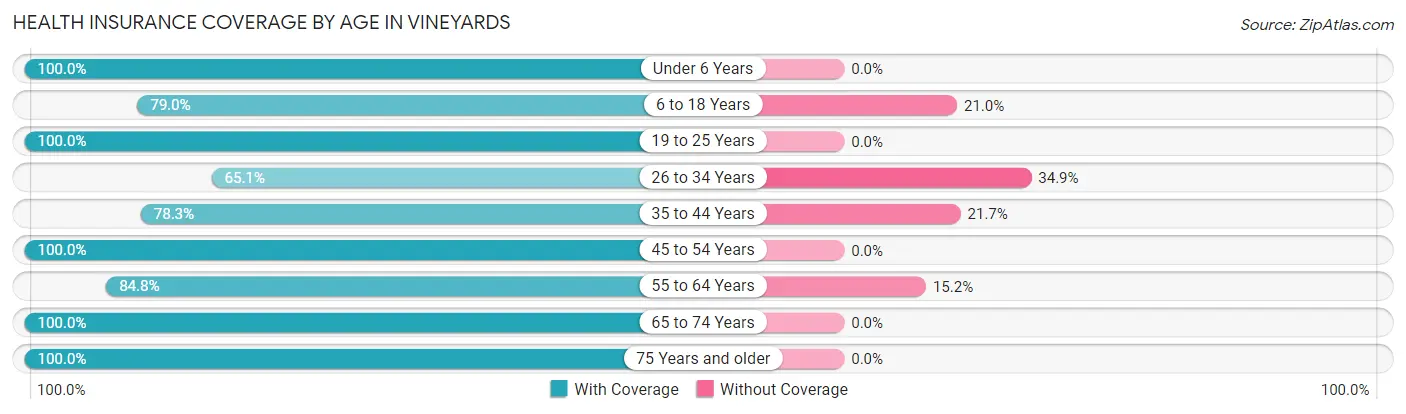
| Age Bracket | With Coverage | Without Coverage |
| Under 6 Years | 2 (100.0%) | 0 (0.0%) |
| 6 to 18 Years | 124 (79.0%) | 33 (21.0%) |
| 19 to 25 Years | 372 (100.0%) | 0 (0.0%) |
| 26 to 34 Years | 28 (65.1%) | 15 (34.9%) |
| 35 to 44 Years | 65 (78.3%) | 18 (21.7%) |
| 45 to 54 Years | 232 (100.0%) | 0 (0.0%) |
| 55 to 64 Years | 651 (84.8%) | 117 (15.2%) |
| 65 to 74 Years | 907 (100.0%) | 0 (0.0%) |
| 75 Years and older | 1,069 (100.0%) | 0 (0.0%) |
| Total | 3,450 (95.0%) | 183 (5.0%) |
Health Insurance Coverage by Citizenship Status in Vineyards
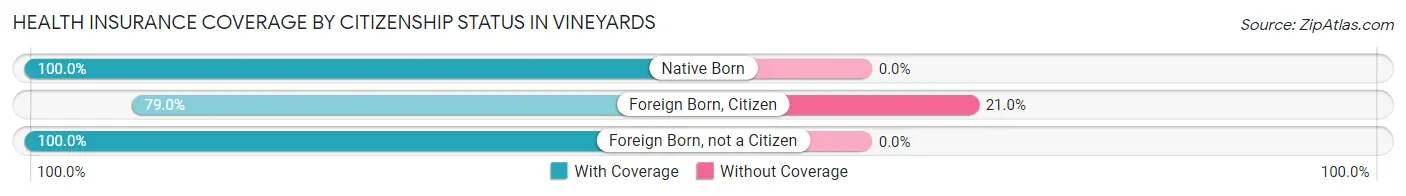
| Citizenship Status | With Coverage | Without Coverage |
| Native Born | 2 (100.0%) | 0 (0.0%) |
| Foreign Born, Citizen | 124 (79.0%) | 33 (21.0%) |
| Foreign Born, not a Citizen | 372 (100.0%) | 0 (0.0%) |
Health Insurance Coverage by Household Income in Vineyards
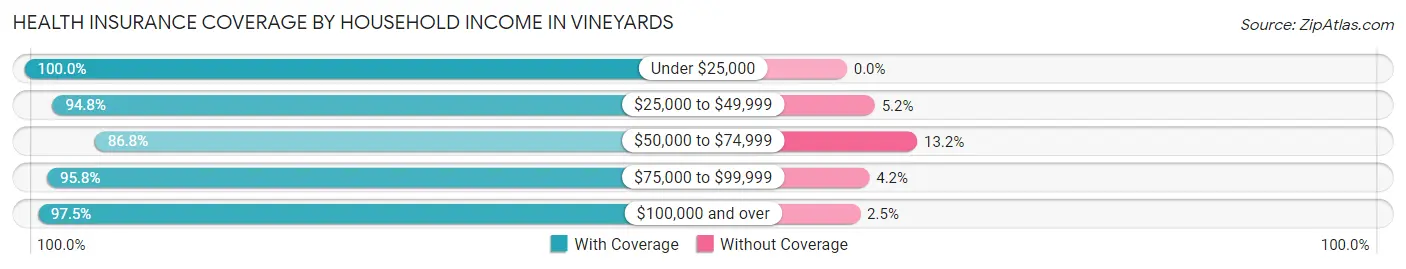
| Household Income | With Coverage | Without Coverage |
| Under $25,000 | 297 (100.0%) | 0 (0.0%) |
| $25,000 to $49,999 | 271 (94.8%) | 15 (5.2%) |
| $50,000 to $74,999 | 462 (86.8%) | 70 (13.2%) |
| $75,000 to $99,999 | 273 (95.8%) | 12 (4.2%) |
| $100,000 and over | 2,064 (97.5%) | 53 (2.5%) |
Public vs Private Health Insurance Coverage by Age in Vineyards
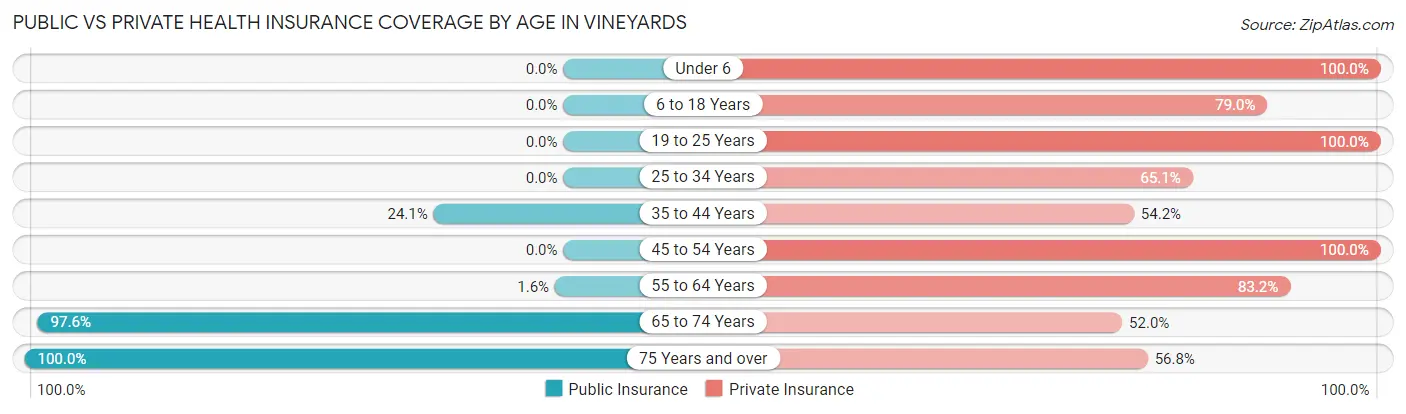
| Age Bracket | Public Insurance | Private Insurance |
| Under 6 | 0 (0.0%) | 2 (100.0%) |
| 6 to 18 Years | 0 (0.0%) | 124 (79.0%) |
| 19 to 25 Years | 0 (0.0%) | 372 (100.0%) |
| 25 to 34 Years | 0 (0.0%) | 28 (65.1%) |
| 35 to 44 Years | 20 (24.1%) | 45 (54.2%) |
| 45 to 54 Years | 0 (0.0%) | 232 (100.0%) |
| 55 to 64 Years | 12 (1.6%) | 639 (83.2%) |
| 65 to 74 Years | 885 (97.6%) | 472 (52.0%) |
| 75 Years and over | 1,069 (100.0%) | 607 (56.8%) |
| Total | 1,986 (54.7%) | 2,521 (69.4%) |
Disability Status by Sex by Age in Vineyards
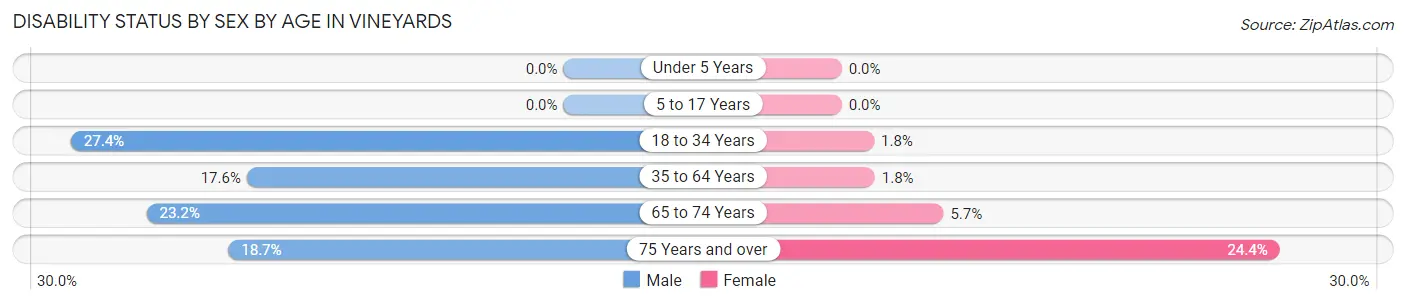
| Age Bracket | Male | Female |
| Under 5 Years | 0 (0.0%) | 0 (0.0%) |
| 5 to 17 Years | 0 (0.0%) | 0 (0.0%) |
| 18 to 34 Years | 34 (27.4%) | 6 (1.8%) |
| 35 to 64 Years | 76 (17.6%) | 12 (1.8%) |
| 65 to 74 Years | 104 (23.2%) | 26 (5.7%) |
| 75 Years and over | 116 (18.6%) | 109 (24.4%) |
Disability Class by Sex by Age in Vineyards
Disability Class: Hearing Difficulty
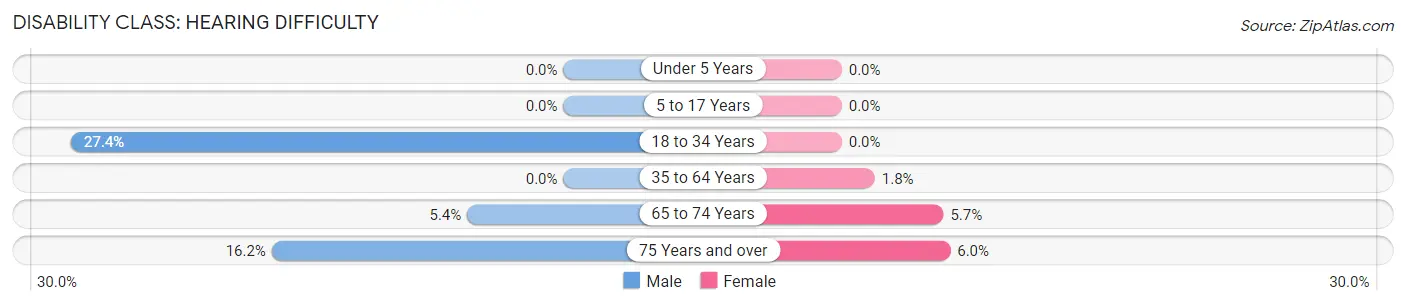
| Age Bracket | Male | Female |
| Under 5 Years | 0 (0.0%) | 0 (0.0%) |
| 5 to 17 Years | 0 (0.0%) | 0 (0.0%) |
| 18 to 34 Years | 34 (27.4%) | 0 (0.0%) |
| 35 to 64 Years | 0 (0.0%) | 12 (1.8%) |
| 65 to 74 Years | 24 (5.4%) | 26 (5.7%) |
| 75 Years and over | 101 (16.2%) | 27 (6.0%) |
Disability Class: Vision Difficulty
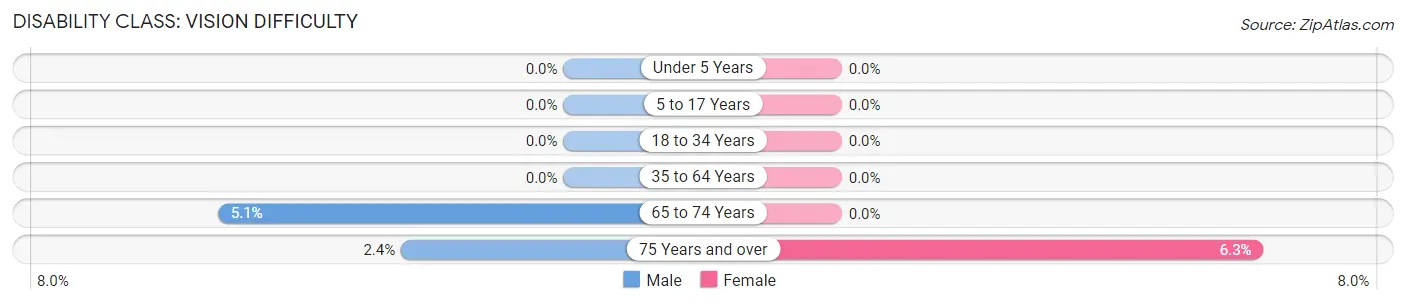
| Age Bracket | Male | Female |
| Under 5 Years | 0 (0.0%) | 0 (0.0%) |
| 5 to 17 Years | 0 (0.0%) | 0 (0.0%) |
| 18 to 34 Years | 0 (0.0%) | 0 (0.0%) |
| 35 to 64 Years | 0 (0.0%) | 0 (0.0%) |
| 65 to 74 Years | 23 (5.1%) | 0 (0.0%) |
| 75 Years and over | 15 (2.4%) | 28 (6.3%) |
Disability Class: Cognitive Difficulty
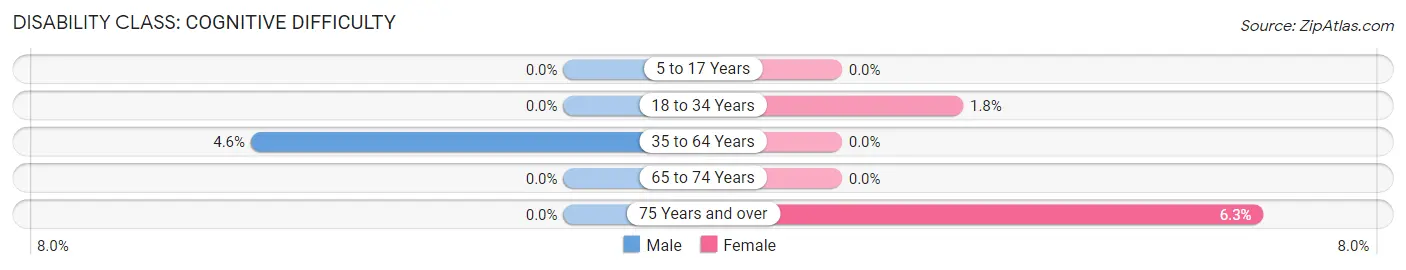
| Age Bracket | Male | Female |
| 5 to 17 Years | 0 (0.0%) | 0 (0.0%) |
| 18 to 34 Years | 0 (0.0%) | 6 (1.8%) |
| 35 to 64 Years | 20 (4.6%) | 0 (0.0%) |
| 65 to 74 Years | 0 (0.0%) | 0 (0.0%) |
| 75 Years and over | 0 (0.0%) | 28 (6.3%) |
Disability Class: Ambulatory Difficulty
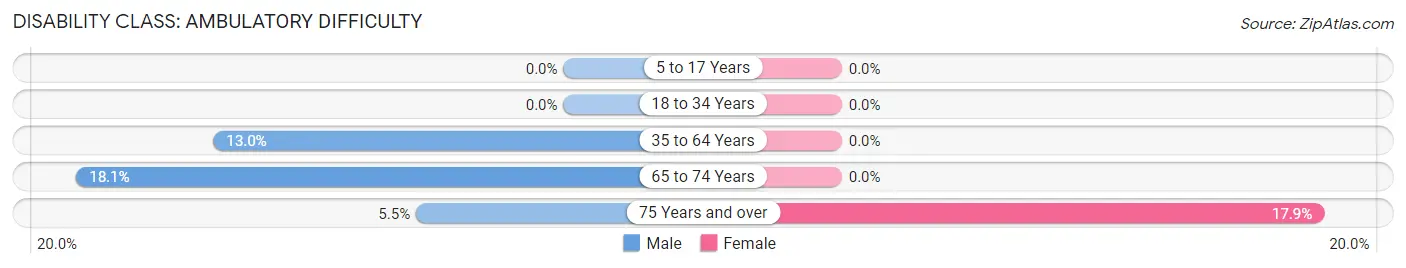
| Age Bracket | Male | Female |
| 5 to 17 Years | 0 (0.0%) | 0 (0.0%) |
| 18 to 34 Years | 0 (0.0%) | 0 (0.0%) |
| 35 to 64 Years | 56 (13.0%) | 0 (0.0%) |
| 65 to 74 Years | 81 (18.1%) | 0 (0.0%) |
| 75 Years and over | 34 (5.5%) | 80 (17.9%) |
Disability Class: Self-Care Difficulty
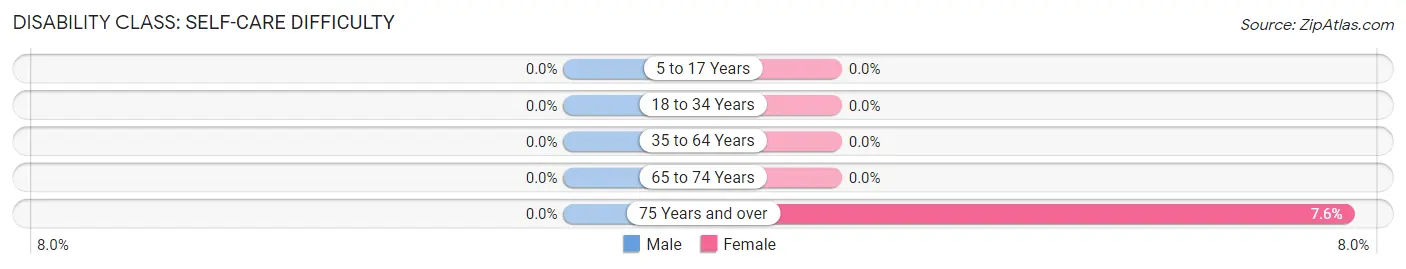
| Age Bracket | Male | Female |
| 5 to 17 Years | 0 (0.0%) | 0 (0.0%) |
| 18 to 34 Years | 0 (0.0%) | 0 (0.0%) |
| 35 to 64 Years | 0 (0.0%) | 0 (0.0%) |
| 65 to 74 Years | 0 (0.0%) | 0 (0.0%) |
| 75 Years and over | 0 (0.0%) | 34 (7.6%) |
Technology Access in Vineyards
Computing Device Access in Vineyards
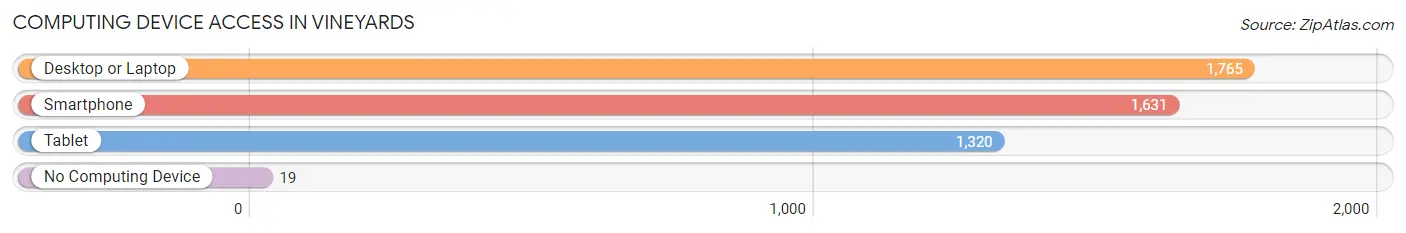
| Device Type | # Households | % Households |
| Desktop or Laptop | 1,765 | 92.5% |
| Smartphone | 1,631 | 85.5% |
| Tablet | 1,320 | 69.2% |
| No Computing Device | 19 | 1.0% |
| Total | 1,908 | 100.0% |
Internet Access in Vineyards
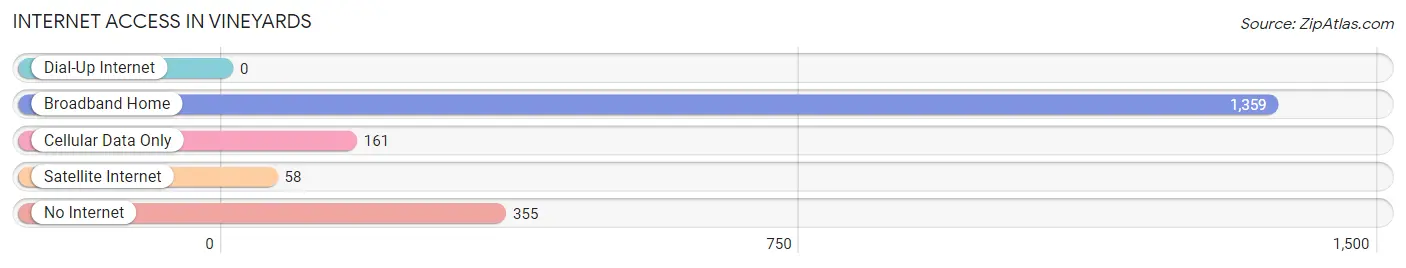
| Internet Type | # Households | % Households |
| Dial-Up Internet | 0 | 0.0% |
| Broadband Home | 1,359 | 71.2% |
| Cellular Data Only | 161 | 8.4% |
| Satellite Internet | 58 | 3.0% |
| No Internet | 355 | 18.6% |
| Total | 1,908 | 100.0% |
Vineyards Summary
Vineyards is a census-designated place (CDP) located in Collier County, Florida, United States. It is part of the Naples–Marco Island Metropolitan Statistical Area. As of the 2010 census, the population of Vineyards was 2,945.
Geography
Vineyards is located at 26°10'25" North, 81°44'17" West (26.173611, -81.737917). It is situated in the western part of Collier County, approximately 8 miles east of Naples and 4 miles west of Marco Island. The CDP has a total area of 2.2 square miles, all of which is land.
History
The area that is now Vineyards was originally inhabited by the Calusa Indians. The first European settlers arrived in the area in the late 19th century. The area was originally known as "Vineyard Grove" and was home to a number of citrus groves. In the early 20th century, the area was developed as a residential community. The first homes were built in the 1950s and the community was officially incorporated as the Town of Vineyards in 1971.
Economy
The economy of Vineyards is largely based on tourism and real estate. The area is home to a number of resorts, hotels, and golf courses, which attract visitors from around the world. The real estate market in Vineyards is also strong, with a number of luxury homes and condominiums available for purchase.
Demographics
As of the 2010 census, there were 2,945 people, 1,093 households, and 845 families residing in the CDP. The population density was 1,323.3 people per square mile. The racial makeup of the CDP was 94.2% White, 2.2% African American, 0.3% Native American, 1.2% Asian, 0.1% Pacific Islander, 0.9% from other races, and 1.1% from two or more races. Hispanic or Latino of any race were 5.2% of the population.
The median income for a household in the CDP was $68,958, and the median income for a family was $76,958. Males had a median income of $50,000 versus $37,500 for females. The per capita income for the CDP was $35,958. About 4.2% of families and 5.2% of the population were below the poverty line, including 6.2% of those under age 18 and 4.2% of those age 65 or over.
Conclusion
Vineyards is a census-designated place located in Collier County, Florida. It is part of the Naples–Marco Island Metropolitan Statistical Area and has a population of 2,945 as of the 2010 census. The economy of Vineyards is largely based on tourism and real estate, and the area is home to a number of resorts, hotels, and golf courses. The racial makeup of the CDP is 94.2% White, 2.2% African American, 0.3% Native American, 1.2% Asian, 0.1% Pacific Islander, 0.9% from other races, and 1.1% from two or more races. The median income for a household in the CDP was $68,958, and the median income for a family was $76,958.
Common Questions
What is Per Capita Income in Vineyards?
Per Capita income in Vineyards is $78,615.
What is the Median Family Income in Vineyards?
Median Family Income in Vineyards is $147,528.
What is the Median Household income in Vineyards?
Median Household Income in Vineyards is $120,287.
What is Inequality or Gini Index in Vineyards?
Inequality or Gini Index in Vineyards is 0.48.
What is the Total Population of Vineyards?
Total Population of Vineyards is 3,649.
What is the Total Male Population of Vineyards?
Total Male Population of Vineyards is 1,675.
What is the Total Female Population of Vineyards?
Total Female Population of Vineyards is 1,974.
What is the Ratio of Males per 100 Females in Vineyards?
There are 84.85 Males per 100 Females in Vineyards.
What is the Ratio of Females per 100 Males in Vineyards?
There are 117.85 Females per 100 Males in Vineyards.
What is the Median Population Age in Vineyards?
Median Population Age in Vineyards is 67.1 Years.
What is the Average Family Size in Vineyards
Average Family Size in Vineyards is 2.3 People.
What is the Average Household Size in Vineyards
Average Household Size in Vineyards is 1.8 People.
How Large is the Labor Force in Vineyards?
There are 1,392 People in the Labor Forcein in Vineyards.
What is the Percentage of People in the Labor Force in Vineyards?
39.4% of People are in the Labor Force in Vineyards.
What is the Unemployment Rate in Vineyards?
Unemployment Rate in Vineyards is 1.4%.