Redington Shores, FL Map & Demographics
Redington Shores Map
Redington Shores Overview
$78,670
PER CAPITA INCOME
$112,679
AVG FAMILY INCOME
$96,250
AVG HOUSEHOLD INCOME
20.6%
WAGE / INCOME GAP [ % ]
79.4¢/ $1
WAGE / INCOME GAP [ $ ]
$6,762
FAMILY INCOME DEFICIT
0.49
INEQUALITY / GINI INDEX
2,078
TOTAL POPULATION
1,023
MALE POPULATION
1,055
FEMALE POPULATION
96.97
MALES / 100 FEMALES
103.13
FEMALES / 100 MALES
63.0
MEDIAN AGE
2.4
AVG FAMILY SIZE
1.8
AVG HOUSEHOLD SIZE
903
LABOR FORCE [ PEOPLE ]
45.6%
PERCENT IN LABOR FORCE
1.9%
UNEMPLOYMENT RATE
Redington Shores Area Codes
Income in Redington Shores
Income Overview in Redington Shores
Per Capita Income in Redington Shores is $78,670, while median incomes of families and households are $112,679 and $96,250 respectively.
| Characteristic | Number | Measure |
| Per Capita Income | 2,078 | $78,670 |
| Median Family Income | 578 | $112,679 |
| Mean Family Income | 578 | $171,875 |
| Median Household Income | 1,158 | $96,250 |
| Mean Household Income | 1,158 | $138,376 |
| Income Deficit | 578 | $6,762 |
| Wage / Income Gap (%) | 2,078 | 20.65% |
| Wage / Income Gap ($) | 2,078 | 79.35¢ per $1 |
| Gini / Inequality Index | 2,078 | 0.49 |
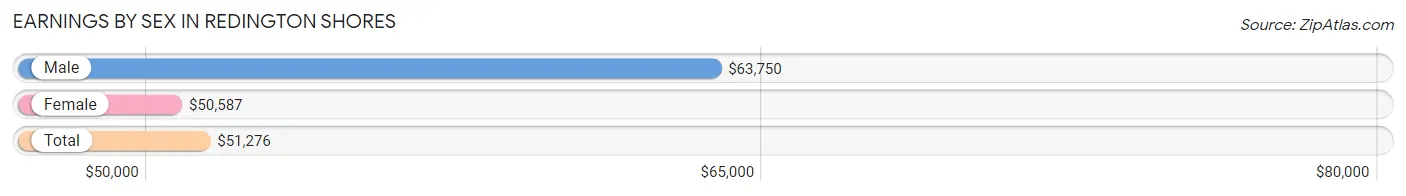
Earnings by Sex in Redington Shores
Average Earnings in Redington Shores are $51,276, $63,750 for men and $50,587 for women, a difference of 20.6%.
| Sex | Number | Average Earnings |
| Male | 471 (49.2%) | $63,750 |
| Female | 487 (50.8%) | $50,587 |
| Total | 958 (100.0%) | $51,276 |
Earnings by Sex by Income Bracket in Redington Shores
The most common earnings brackets in Redington Shores are $100,000+ for men (164 | 34.8%) and $100,000+ for women (98 | 20.1%).
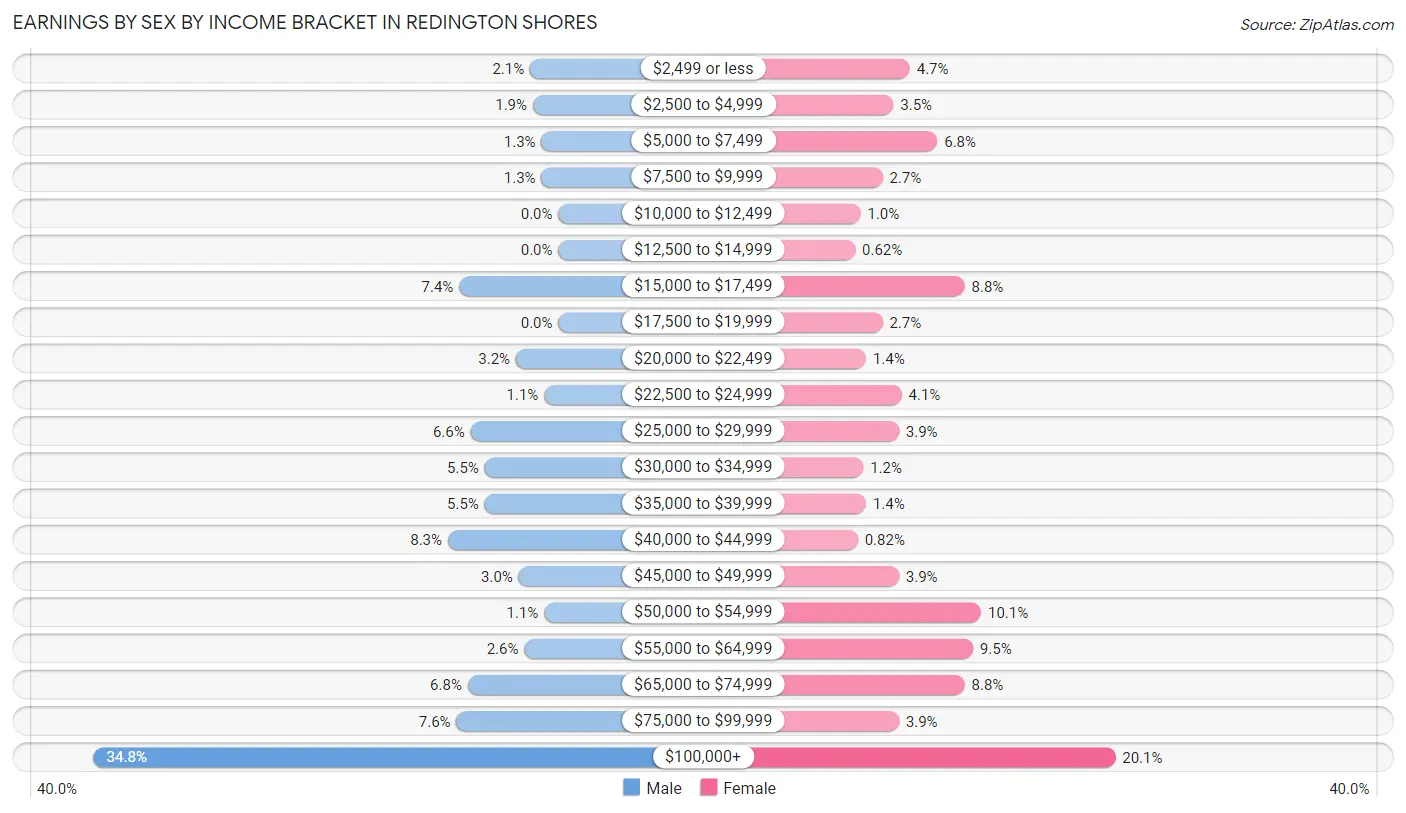
| Income | Male | Female |
| $2,499 or less | 10 (2.1%) | 23 (4.7%) |
| $2,500 to $4,999 | 9 (1.9%) | 17 (3.5%) |
| $5,000 to $7,499 | 6 (1.3%) | 33 (6.8%) |
| $7,500 to $9,999 | 6 (1.3%) | 13 (2.7%) |
| $10,000 to $12,499 | 0 (0.0%) | 5 (1.0%) |
| $12,500 to $14,999 | 0 (0.0%) | 3 (0.6%) |
| $15,000 to $17,499 | 35 (7.4%) | 43 (8.8%) |
| $17,500 to $19,999 | 0 (0.0%) | 13 (2.7%) |
| $20,000 to $22,499 | 15 (3.2%) | 7 (1.4%) |
| $22,500 to $24,999 | 5 (1.1%) | 20 (4.1%) |
| $25,000 to $29,999 | 31 (6.6%) | 19 (3.9%) |
| $30,000 to $34,999 | 26 (5.5%) | 6 (1.2%) |
| $35,000 to $39,999 | 26 (5.5%) | 7 (1.4%) |
| $40,000 to $44,999 | 39 (8.3%) | 4 (0.8%) |
| $45,000 to $49,999 | 14 (3.0%) | 19 (3.9%) |
| $50,000 to $54,999 | 5 (1.1%) | 49 (10.1%) |
| $55,000 to $64,999 | 12 (2.5%) | 46 (9.5%) |
| $65,000 to $74,999 | 32 (6.8%) | 43 (8.8%) |
| $75,000 to $99,999 | 36 (7.6%) | 19 (3.9%) |
| $100,000+ | 164 (34.8%) | 98 (20.1%) |
| Total | 471 (100.0%) | 487 (100.0%) |
Earnings by Sex by Educational Attainment in Redington Shores
Average earnings in Redington Shores are $69,250 for men and $50,944 for women, a difference of 26.4%. Men with an educational attainment of graduate degree enjoy the highest average annual earnings of $190,250, while those with high school diploma education earn the least with $42,949. Women with an educational attainment of graduate degree earn the most with the average annual earnings of $117,188, while those with high school diploma education have the smallest earnings of $19,231.
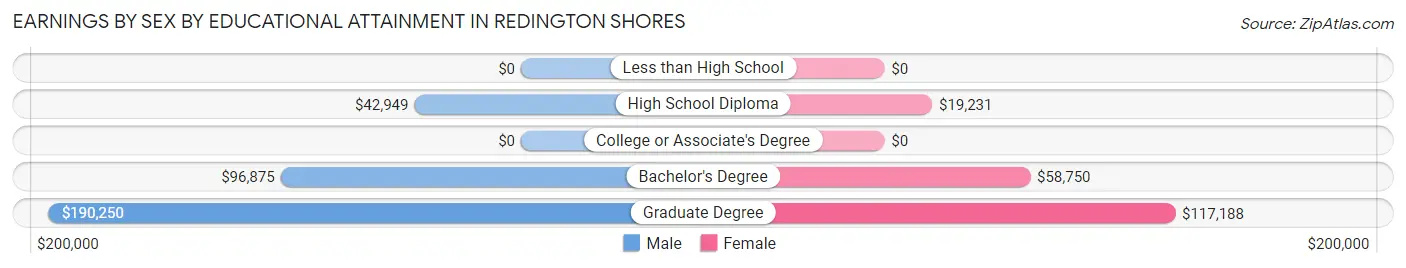
| Educational Attainment | Male Income | Female Income |
| Less than High School | - | - |
| High School Diploma | $42,949 | $19,231 |
| College or Associate's Degree | - | - |
| Bachelor's Degree | $96,875 | $58,750 |
| Graduate Degree | $190,250 | $117,188 |
| Total | $69,250 | $50,944 |
Family Income in Redington Shores
Family Income Brackets in Redington Shores
According to the Redington Shores family income data, there are 140 families falling into the $100,000 to $149,999 income range, which is the most common income bracket and makes up 24.2% of all families. Conversely, the $10,000 to $14,999 income bracket is the least frequent group with only 4 families (0.7%) belonging to this category.
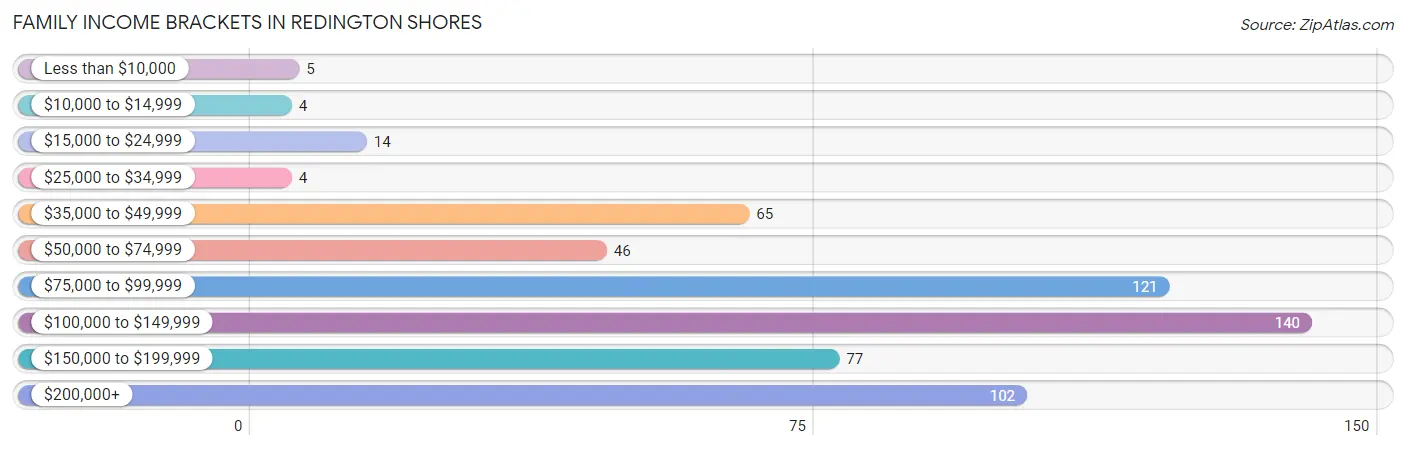
| Income Bracket | # Families | % Families |
| Less than $10,000 | 5 | 0.9% |
| $10,000 to $14,999 | 4 | 0.7% |
| $15,000 to $24,999 | 14 | 2.4% |
| $25,000 to $34,999 | 4 | 0.7% |
| $35,000 to $49,999 | 65 | 11.2% |
| $50,000 to $74,999 | 46 | 8.0% |
| $75,000 to $99,999 | 121 | 20.9% |
| $100,000 to $149,999 | 140 | 24.2% |
| $150,000 to $199,999 | 77 | 13.3% |
| $200,000+ | 102 | 17.6% |
Family Income by Famaliy Size in Redington Shores
3-person families (89 | 15.4%) account for the highest median family income in Redington Shores with $134,063 per family, while 2-person families (457 | 79.1%) have the highest median income of $54,375 per family member.
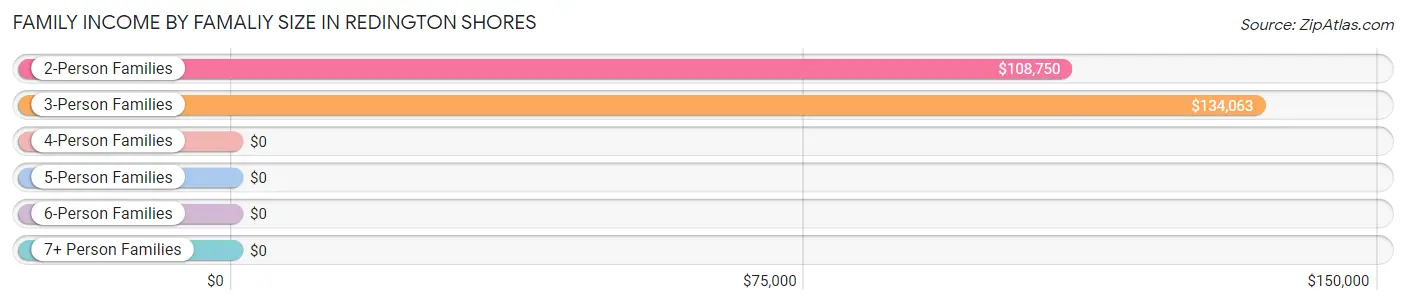
| Income Bracket | # Families | Median Income |
| 2-Person Families | 457 (79.1%) | $108,750 |
| 3-Person Families | 89 (15.4%) | $134,063 |
| 4-Person Families | 21 (3.6%) | $0 |
| 5-Person Families | 11 (1.9%) | $0 |
| 6-Person Families | 0 (0.0%) | $0 |
| 7+ Person Families | 0 (0.0%) | $0 |
| Total | 578 (100.0%) | $112,679 |
Family Income by Number of Earners in Redington Shores
The median family income in Redington Shores is $112,679, with families comprising 3+ earners (18) having the highest median family income of $250,001, while families with no earners (219) have the lowest median family income of $87,841, accounting for 3.1% and 37.9% of families, respectively.
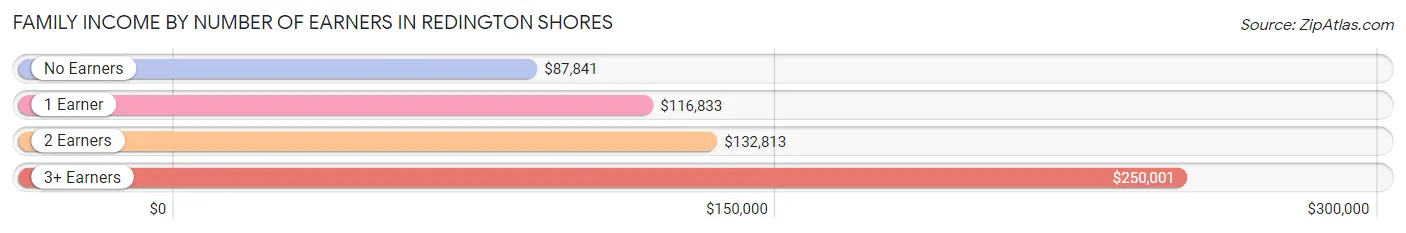
| Number of Earners | # Families | Median Income |
| No Earners | 219 (37.9%) | $87,841 |
| 1 Earner | 190 (32.9%) | $116,833 |
| 2 Earners | 151 (26.1%) | $132,813 |
| 3+ Earners | 18 (3.1%) | $250,001 |
| Total | 578 (100.0%) | $112,679 |
Household Income in Redington Shores
Household Income Brackets in Redington Shores
With 277 households falling in the category, the $100,000 to $149,999 income range is the most frequent in Redington Shores, accounting for 23.9% of all households. In contrast, only 3 households (0.3%) fall into the $10,000 to $14,999 income bracket, making it the least populous group.
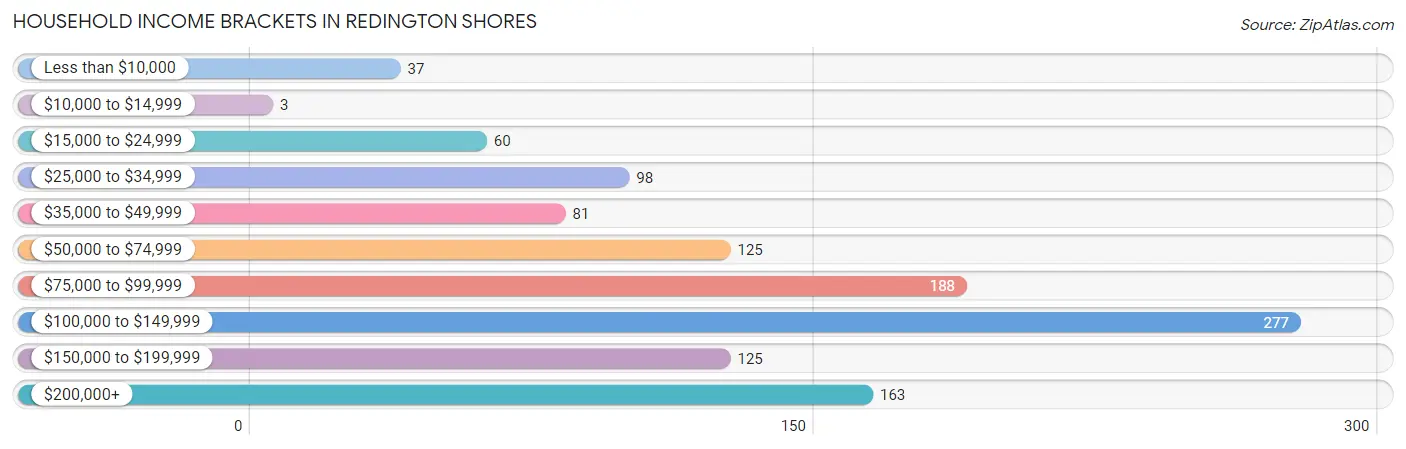
| Income Bracket | # Households | % Households |
| Less than $10,000 | 37 | 3.2% |
| $10,000 to $14,999 | 3 | 0.3% |
| $15,000 to $24,999 | 60 | 5.2% |
| $25,000 to $34,999 | 98 | 8.5% |
| $35,000 to $49,999 | 81 | 7.0% |
| $50,000 to $74,999 | 125 | 10.8% |
| $75,000 to $99,999 | 188 | 16.2% |
| $100,000 to $149,999 | 277 | 23.9% |
| $150,000 to $199,999 | 125 | 10.8% |
| $200,000+ | 163 | 14.1% |
Household Income by Householder Age in Redington Shores
The median household income in Redington Shores is $96,250, with the highest median household income of $146,000 found in the 25 to 44 years age bracket for the primary householder. A total of 68 households (5.9%) fall into this category.
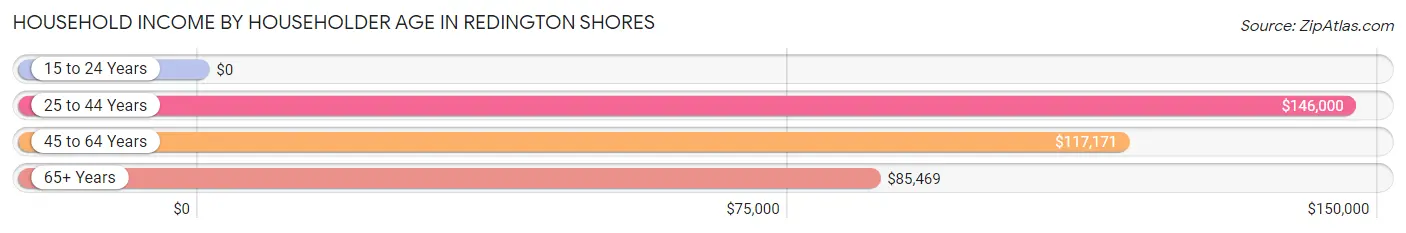
| Income Bracket | # Households | Median Income |
| 15 to 24 Years | 0 (0.0%) | $0 |
| 25 to 44 Years | 68 (5.9%) | $146,000 |
| 45 to 64 Years | 391 (33.8%) | $117,171 |
| 65+ Years | 699 (60.4%) | $85,469 |
| Total | 1,158 (100.0%) | $96,250 |
Poverty in Redington Shores
Income Below Poverty by Sex and Age in Redington Shores
With 1.8% poverty level for males and 5.8% for females among the residents of Redington Shores, 55 to 64 year old males and 12 to 14 year old females are the most vulnerable to poverty, with 9 males (4.9%) and 4 females (33.3%) in their respective age groups living below the poverty level.
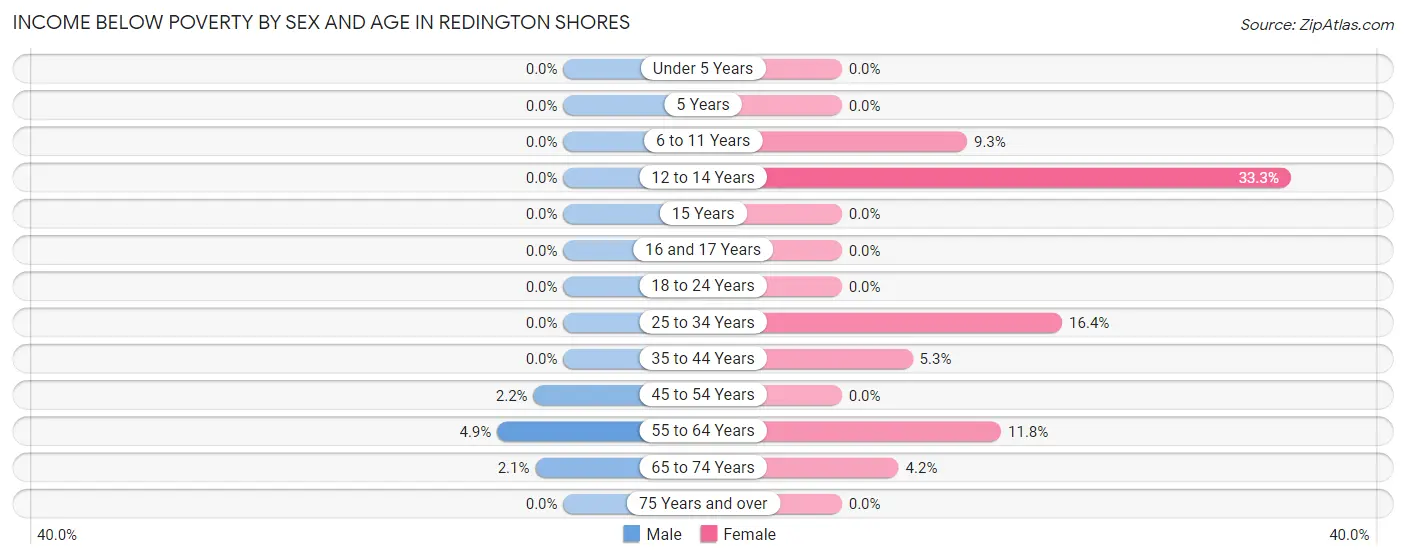
| Age Bracket | Male | Female |
| Under 5 Years | 0 (0.0%) | 0 (0.0%) |
| 5 Years | 0 (0.0%) | 0 (0.0%) |
| 6 to 11 Years | 0 (0.0%) | 4 (9.3%) |
| 12 to 14 Years | 0 (0.0%) | 4 (33.3%) |
| 15 Years | 0 (0.0%) | 0 (0.0%) |
| 16 and 17 Years | 0 (0.0%) | 0 (0.0%) |
| 18 to 24 Years | 0 (0.0%) | 0 (0.0%) |
| 25 to 34 Years | 0 (0.0%) | 9 (16.4%) |
| 35 to 44 Years | 0 (0.0%) | 3 (5.3%) |
| 45 to 54 Years | 4 (2.2%) | 0 (0.0%) |
| 55 to 64 Years | 9 (4.9%) | 31 (11.8%) |
| 65 to 74 Years | 5 (2.1%) | 10 (4.2%) |
| 75 Years and over | 0 (0.0%) | 0 (0.0%) |
| Total | 18 (1.8%) | 61 (5.8%) |
Income Above Poverty by Sex and Age in Redington Shores
According to the poverty statistics in Redington Shores, males aged under 5 years and females aged under 5 years are the age groups that are most secure financially, with 100.0% of males and 100.0% of females in these age groups living above the poverty line.
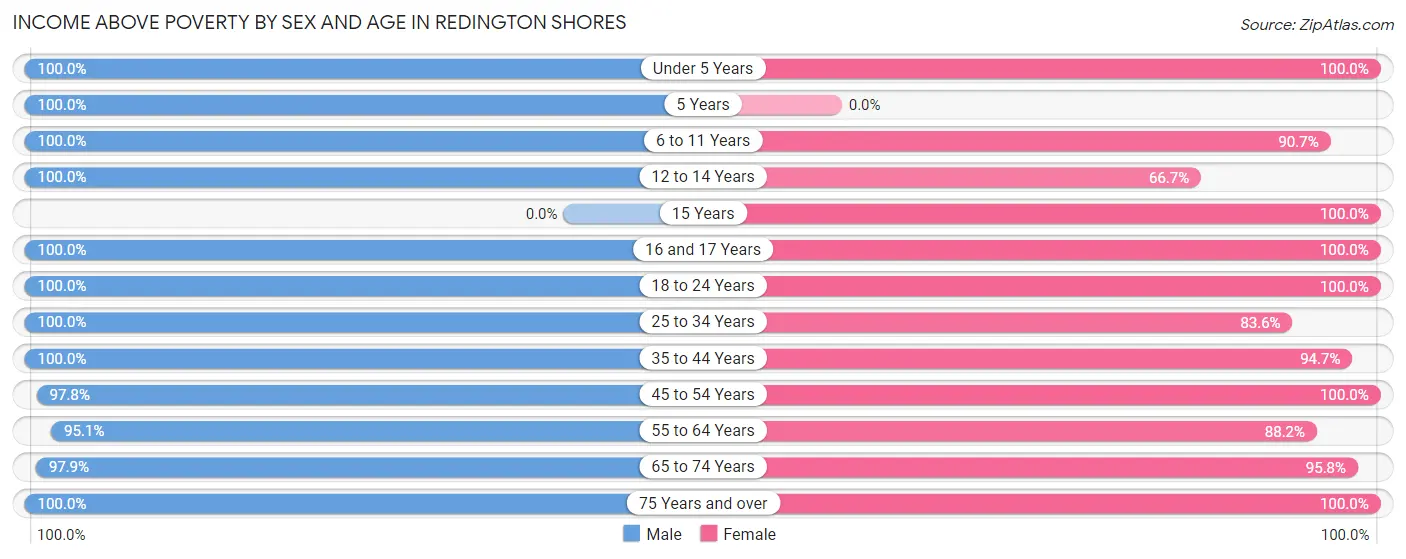
| Age Bracket | Male | Female |
| Under 5 Years | 4 (100.0%) | 16 (100.0%) |
| 5 Years | 4 (100.0%) | 0 (0.0%) |
| 6 to 11 Years | 5 (100.0%) | 39 (90.7%) |
| 12 to 14 Years | 9 (100.0%) | 8 (66.7%) |
| 15 Years | 0 (0.0%) | 4 (100.0%) |
| 16 and 17 Years | 5 (100.0%) | 9 (100.0%) |
| 18 to 24 Years | 46 (100.0%) | 5 (100.0%) |
| 25 to 34 Years | 26 (100.0%) | 46 (83.6%) |
| 35 to 44 Years | 73 (100.0%) | 54 (94.7%) |
| 45 to 54 Years | 176 (97.8%) | 131 (100.0%) |
| 55 to 64 Years | 174 (95.1%) | 231 (88.2%) |
| 65 to 74 Years | 235 (97.9%) | 227 (95.8%) |
| 75 Years and over | 248 (100.0%) | 224 (100.0%) |
| Total | 1,005 (98.2%) | 994 (94.2%) |
Income Below Poverty Among Married-Couple Families in Redington Shores
The poverty statistics for married-couple families in Redington Shores show that 2.6% or 13 of the total 494 families live below the poverty line. Families with 1 or 2 children have the highest poverty rate of 8.2%, comprising of 4 families. On the other hand, families with 3 or 4 children have the lowest poverty rate of 0.0%, which includes 0 families.
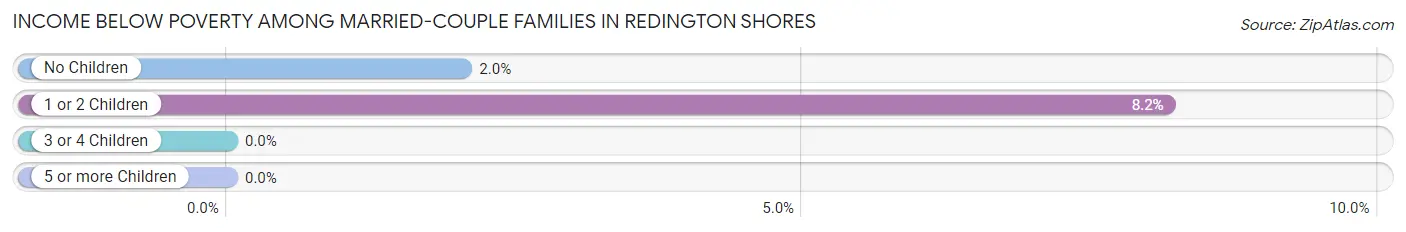
| Children | Above Poverty | Below Poverty |
| No Children | 432 (98.0%) | 9 (2.0%) |
| 1 or 2 Children | 45 (91.8%) | 4 (8.2%) |
| 3 or 4 Children | 4 (100.0%) | 0 (0.0%) |
| 5 or more Children | 0 (0.0%) | 0 (0.0%) |
| Total | 481 (97.4%) | 13 (2.6%) |
Income Below Poverty Among Single-Parent Households in Redington Shores
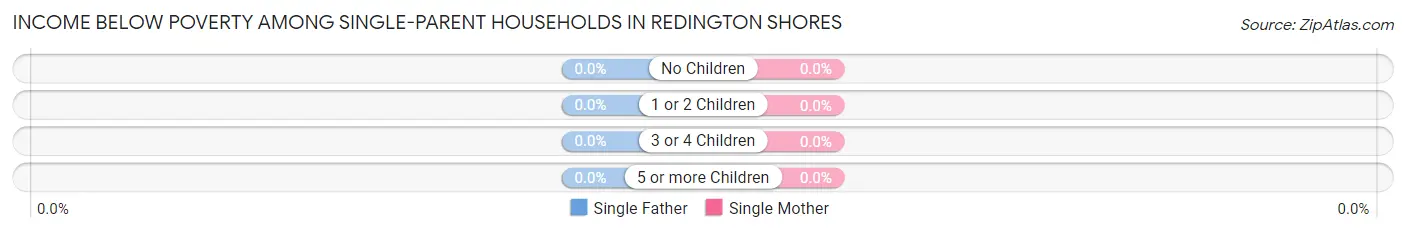
| Children | Single Father | Single Mother |
| No Children | 0 (0.0%) | 0 (0.0%) |
| 1 or 2 Children | 0 (0.0%) | 0 (0.0%) |
| 3 or 4 Children | 0 (0.0%) | 0 (0.0%) |
| 5 or more Children | 0 (0.0%) | 0 (0.0%) |
| Total | 0 (0.0%) | 0 (0.0%) |
Income Below Poverty Among Married-Couple vs Single-Parent Households in Redington Shores
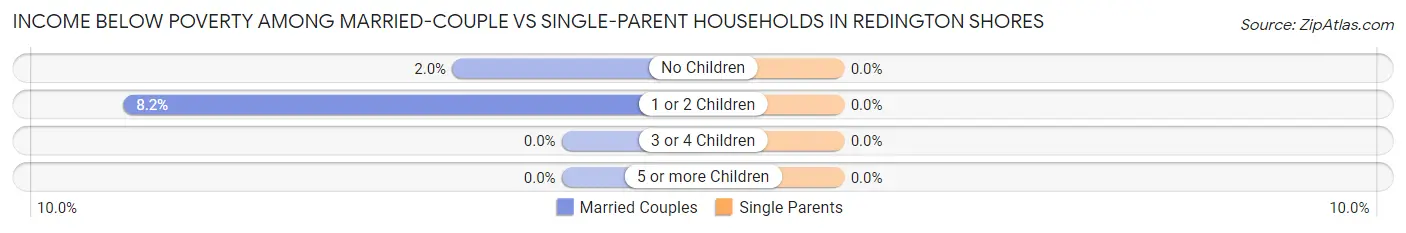
| Children | Married-Couple Families | Single-Parent Households |
| No Children | 9 (2.0%) | 0 (0.0%) |
| 1 or 2 Children | 4 (8.2%) | 0 (0.0%) |
| 3 or 4 Children | 0 (0.0%) | 0 (0.0%) |
| 5 or more Children | 0 (0.0%) | 0 (0.0%) |
| Total | 13 (2.6%) | 0 (0.0%) |
Race in Redington Shores
The most populous races in Redington Shores are White / Caucasian (1,902 | 91.5%), Hispanic or Latino (113 | 5.4%), and Asian (66 | 3.2%).
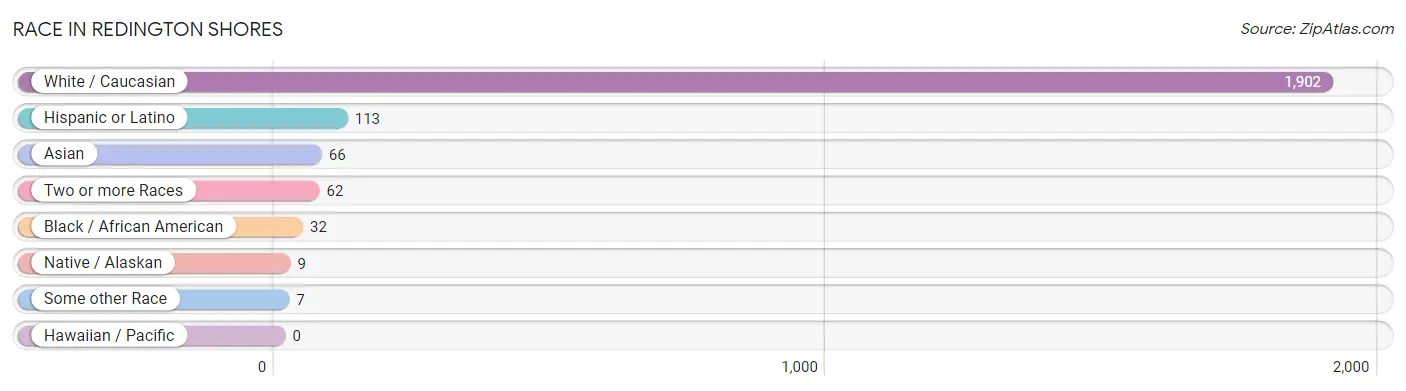
| Race | # Population | % Population |
| Asian | 66 | 3.2% |
| Black / African American | 32 | 1.5% |
| Hawaiian / Pacific | 0 | 0.0% |
| Hispanic or Latino | 113 | 5.4% |
| Native / Alaskan | 9 | 0.4% |
| White / Caucasian | 1,902 | 91.5% |
| Two or more Races | 62 | 3.0% |
| Some other Race | 7 | 0.3% |
| Total | 2,078 | 100.0% |
Ancestry in Redington Shores
The most populous ancestries reported in Redington Shores are German (461 | 22.2%), English (445 | 21.4%), Irish (298 | 14.3%), American (195 | 9.4%), and Italian (155 | 7.5%), together accounting for 74.8% of all Redington Shores residents.
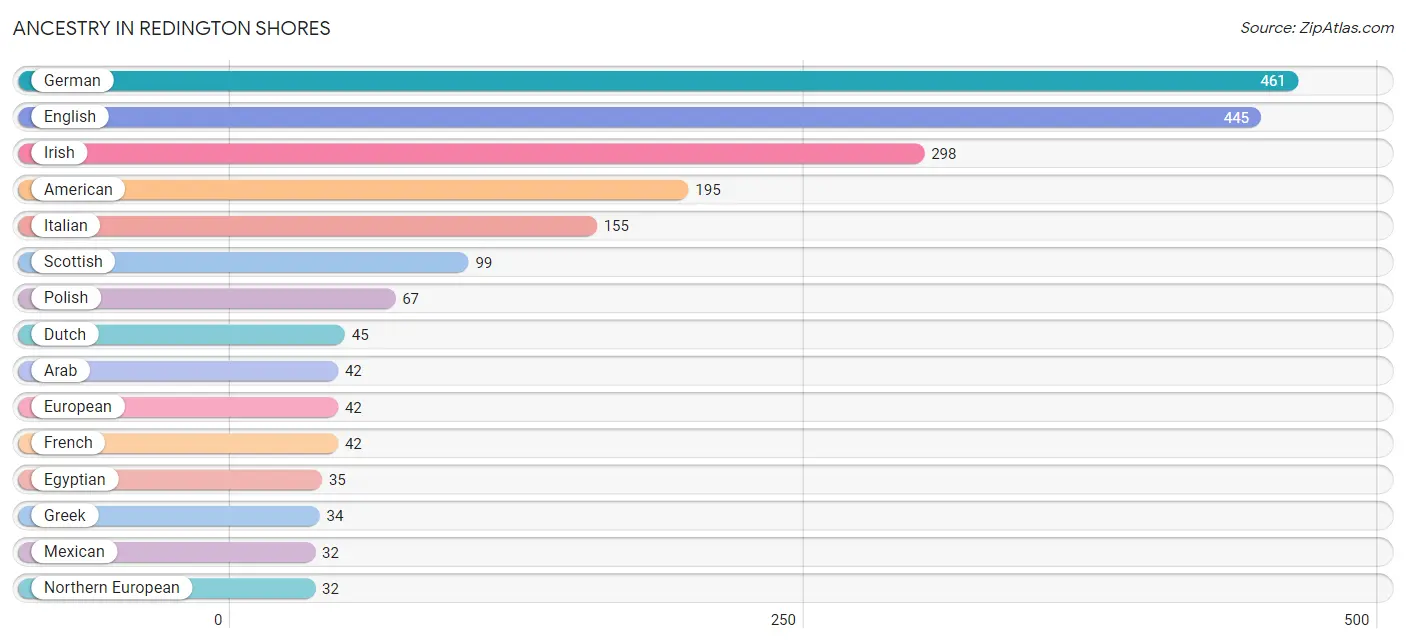
| Ancestry | # Population | % Population |
| Aleut | 9 | 0.4% |
| American | 195 | 9.4% |
| Arab | 42 | 2.0% |
| Armenian | 8 | 0.4% |
| Austrian | 8 | 0.4% |
| British | 19 | 0.9% |
| Bulgarian | 4 | 0.2% |
| Canadian | 10 | 0.5% |
| Central American | 18 | 0.9% |
| Croatian | 4 | 0.2% |
| Cuban | 31 | 1.5% |
| Cypriot | 4 | 0.2% |
| Czechoslovakian | 4 | 0.2% |
| Danish | 15 | 0.7% |
| Dutch | 45 | 2.2% |
| Eastern European | 18 | 0.9% |
| Egyptian | 35 | 1.7% |
| English | 445 | 21.4% |
| European | 42 | 2.0% |
| French | 42 | 2.0% |
| French Canadian | 11 | 0.5% |
| German | 461 | 22.2% |
| Greek | 34 | 1.6% |
| Hungarian | 20 | 1.0% |
| Indian (Asian) | 11 | 0.5% |
| Irish | 298 | 14.3% |
| Italian | 155 | 7.5% |
| Korean | 11 | 0.5% |
| Lithuanian | 8 | 0.4% |
| Mexican | 32 | 1.5% |
| Northern European | 32 | 1.5% |
| Norwegian | 18 | 0.9% |
| Pakistani | 11 | 0.5% |
| Panamanian | 18 | 0.9% |
| Peruvian | 21 | 1.0% |
| Polish | 67 | 3.2% |
| Portuguese | 5 | 0.2% |
| Puerto Rican | 11 | 0.5% |
| Russian | 17 | 0.8% |
| Scandinavian | 14 | 0.7% |
| Scotch-Irish | 16 | 0.8% |
| Scottish | 99 | 4.8% |
| Slovak | 3 | 0.1% |
| South African | 8 | 0.4% |
| South American | 21 | 1.0% |
| Sri Lankan | 23 | 1.1% |
| Subsaharan African | 8 | 0.4% |
| Swedish | 30 | 1.4% |
| Swiss | 6 | 0.3% |
| Thai | 12 | 0.6% |
| Welsh | 32 | 1.5% | View All 51 Rows |
Immigrants in Redington Shores
The most numerous immigrant groups reported in Redington Shores came from Latin America (61 | 2.9%), Europe (57 | 2.7%), Asia (52 | 2.5%), Africa (41 | 2.0%), and Eastern Europe (30 | 1.4%), together accounting for 11.6% of all Redington Shores residents.
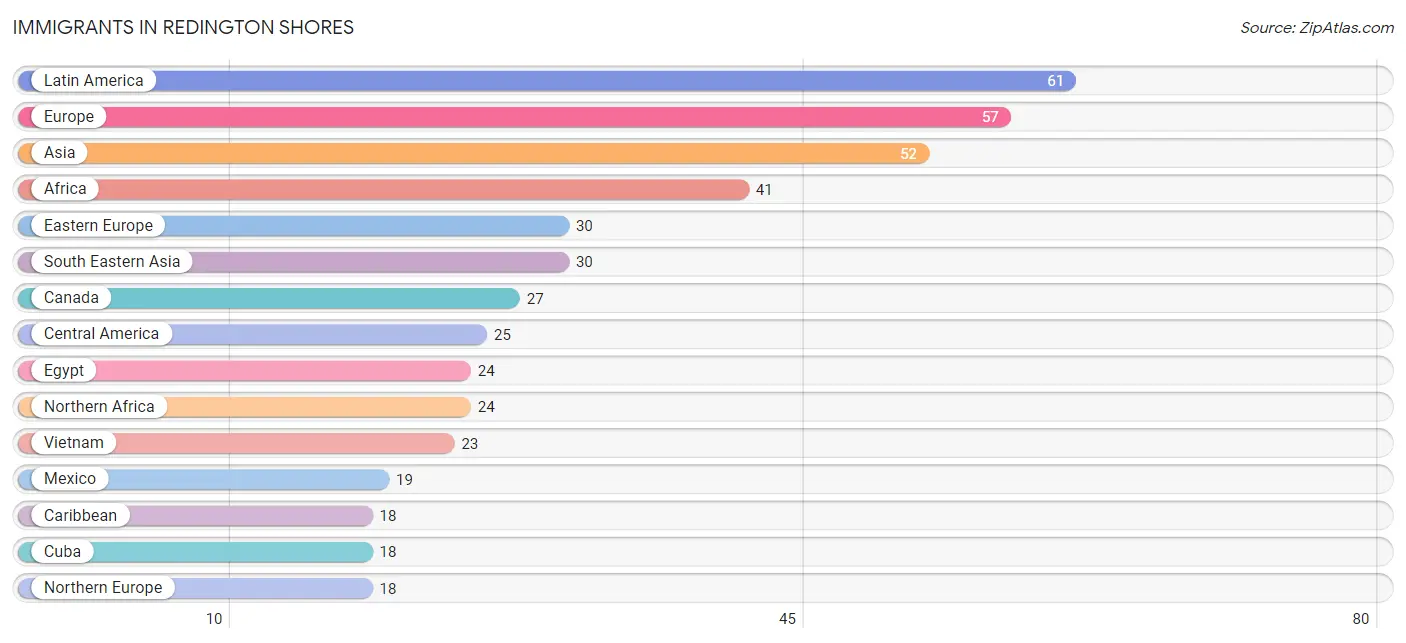
| Immigration Origin | # Population | % Population |
| Africa | 41 | 2.0% |
| Asia | 52 | 2.5% |
| Austria | 4 | 0.2% |
| Brazil | 10 | 0.5% |
| Bulgaria | 8 | 0.4% |
| Canada | 27 | 1.3% |
| Caribbean | 18 | 0.9% |
| Central America | 25 | 1.2% |
| China | 11 | 0.5% |
| Cuba | 18 | 0.9% |
| Czechoslovakia | 4 | 0.2% |
| Eastern Asia | 11 | 0.5% |
| Eastern Europe | 30 | 1.4% |
| Egypt | 24 | 1.1% |
| England | 14 | 0.7% |
| Europe | 57 | 2.7% |
| Germany | 5 | 0.2% |
| Latin America | 61 | 2.9% |
| Mexico | 19 | 0.9% |
| Northern Africa | 24 | 1.1% |
| Northern Europe | 18 | 0.9% |
| Pakistan | 11 | 0.5% |
| Panama | 6 | 0.3% |
| Peru | 8 | 0.4% |
| Philippines | 4 | 0.2% |
| Poland | 9 | 0.4% |
| South Africa | 17 | 0.8% |
| South America | 18 | 0.9% |
| South Central Asia | 11 | 0.5% |
| South Eastern Asia | 30 | 1.4% |
| Thailand | 3 | 0.1% |
| Ukraine | 9 | 0.4% |
| Vietnam | 23 | 1.1% |
| Western Europe | 9 | 0.4% | View All 34 Rows |
Sex and Age in Redington Shores
Sex and Age in Redington Shores
The most populous age groups in Redington Shores are 65 to 69 Years (150 | 14.7%) for men and 55 to 59 Years (160 | 15.2%) for women.
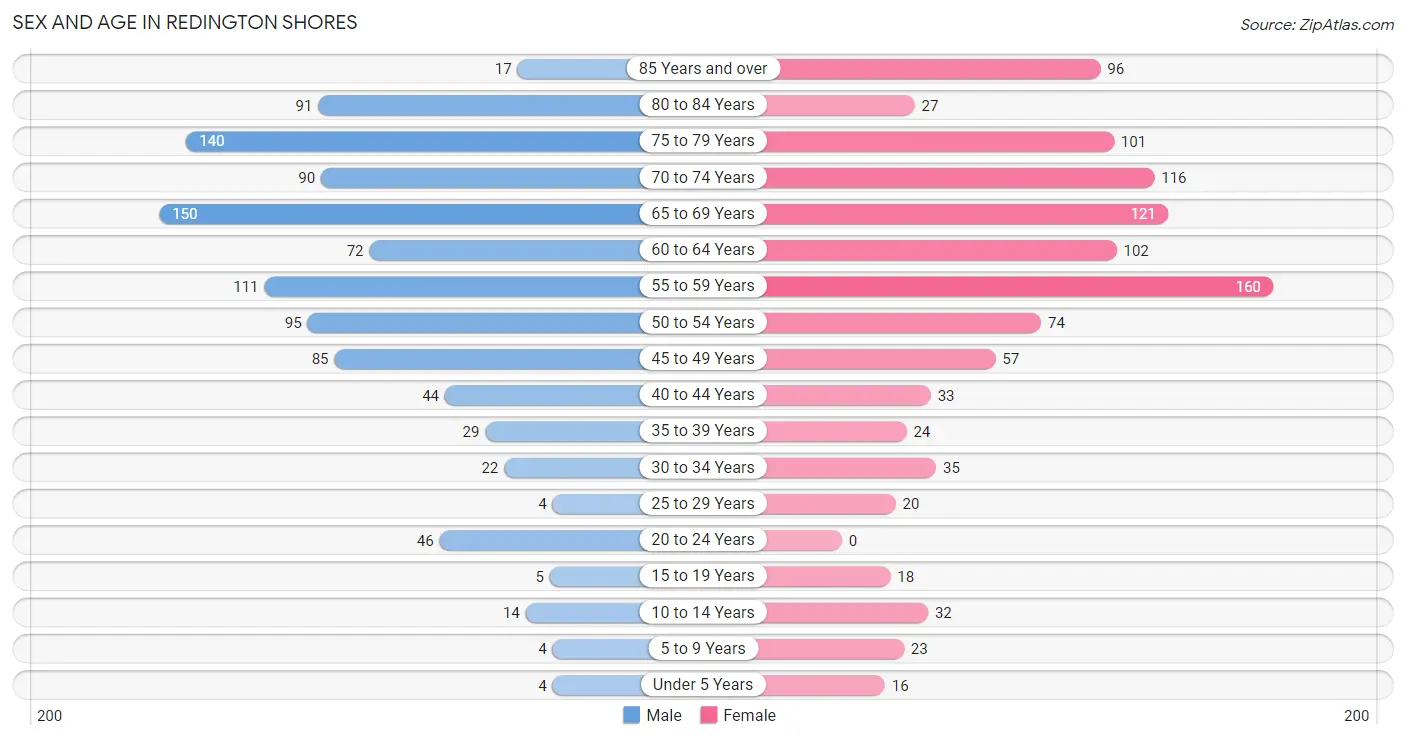
| Age Bracket | Male | Female |
| Under 5 Years | 4 (0.4%) | 16 (1.5%) |
| 5 to 9 Years | 4 (0.4%) | 23 (2.2%) |
| 10 to 14 Years | 14 (1.4%) | 32 (3.0%) |
| 15 to 19 Years | 5 (0.5%) | 18 (1.7%) |
| 20 to 24 Years | 46 (4.5%) | 0 (0.0%) |
| 25 to 29 Years | 4 (0.4%) | 20 (1.9%) |
| 30 to 34 Years | 22 (2.1%) | 35 (3.3%) |
| 35 to 39 Years | 29 (2.8%) | 24 (2.3%) |
| 40 to 44 Years | 44 (4.3%) | 33 (3.1%) |
| 45 to 49 Years | 85 (8.3%) | 57 (5.4%) |
| 50 to 54 Years | 95 (9.3%) | 74 (7.0%) |
| 55 to 59 Years | 111 (10.8%) | 160 (15.2%) |
| 60 to 64 Years | 72 (7.0%) | 102 (9.7%) |
| 65 to 69 Years | 150 (14.7%) | 121 (11.5%) |
| 70 to 74 Years | 90 (8.8%) | 116 (11.0%) |
| 75 to 79 Years | 140 (13.7%) | 101 (9.6%) |
| 80 to 84 Years | 91 (8.9%) | 27 (2.6%) |
| 85 Years and over | 17 (1.7%) | 96 (9.1%) |
| Total | 1,023 (100.0%) | 1,055 (100.0%) |
Families and Households in Redington Shores
Median Family Size in Redington Shores
The median family size in Redington Shores is 2.41 persons per family, with single male/father families (23 | 4.0%) accounting for the largest median family size of 2.74 persons per family. On the other hand, married-couple families (494 | 85.5%) represent the smallest median family size with 2.37 persons per family.
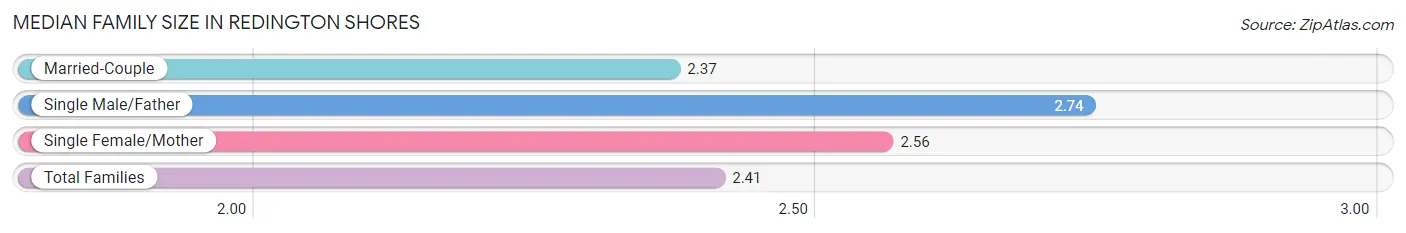
| Family Type | # Families | Family Size |
| Married-Couple | 494 (85.5%) | 2.37 |
| Single Male/Father | 23 (4.0%) | 2.74 |
| Single Female/Mother | 61 (10.5%) | 2.56 |
| Total Families | 578 (100.0%) | 2.41 |
Median Household Size in Redington Shores
The median household size in Redington Shores is 1.79 persons per household, with single male/father households (23 | 2.0%) accounting for the largest median household size of 2.91 persons per household. non-family households (580 | 50.1%) represent the smallest median household size with 1.18 persons per household.
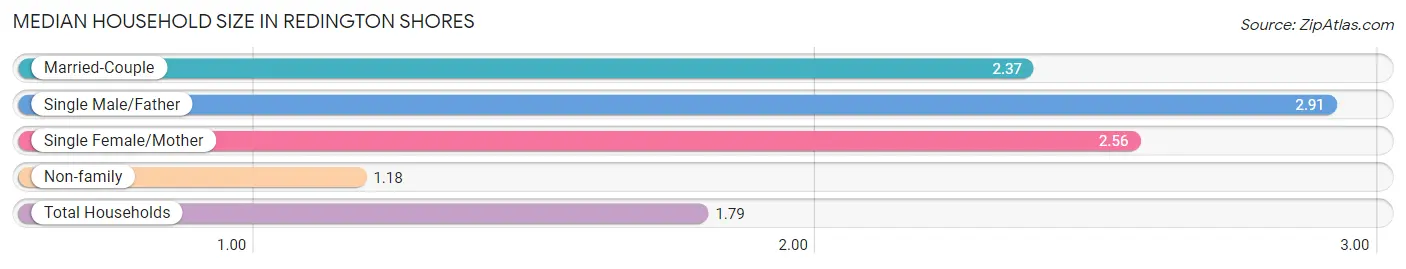
| Household Type | # Households | Household Size |
| Married-Couple | 494 (42.7%) | 2.37 |
| Single Male/Father | 23 (2.0%) | 2.91 |
| Single Female/Mother | 61 (5.3%) | 2.56 |
| Non-family | 580 (50.1%) | 1.18 |
| Total Households | 1,158 (100.0%) | 1.79 |
Household Size by Marriage Status in Redington Shores
Out of a total of 1,158 households in Redington Shores, 578 (49.9%) are family households, while 580 (50.1%) are nonfamily households. The most numerous type of family households are 2-person households, comprising 454, and the most common type of nonfamily households are 1-person households, comprising 484.
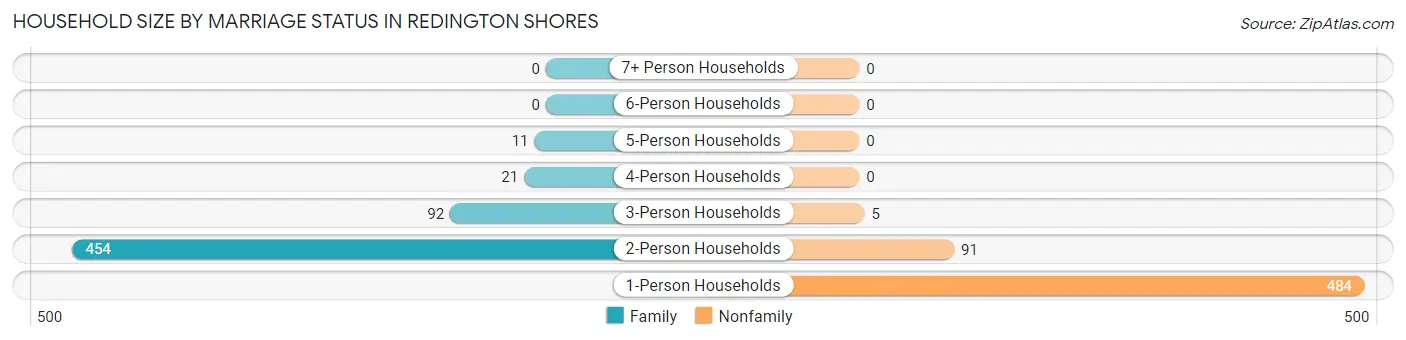
| Household Size | Family Households | Nonfamily Households |
| 1-Person Households | - | 484 (41.8%) |
| 2-Person Households | 454 (39.2%) | 91 (7.9%) |
| 3-Person Households | 92 (7.9%) | 5 (0.4%) |
| 4-Person Households | 21 (1.8%) | 0 (0.0%) |
| 5-Person Households | 11 (0.9%) | 0 (0.0%) |
| 6-Person Households | 0 (0.0%) | 0 (0.0%) |
| 7+ Person Households | 0 (0.0%) | 0 (0.0%) |
| Total | 578 (49.9%) | 580 (50.1%) |
Female Fertility in Redington Shores
Fertility by Age in Redington Shores
Average fertility rate in Redington Shores is 15.0 births per 1,000 women. Women in the age bracket of 35 to 50 years have the highest fertility rate with 24.0 births per 1,000 women. Women in the age bracket of 35 to 50 years acount for 100.0% of all women with births.
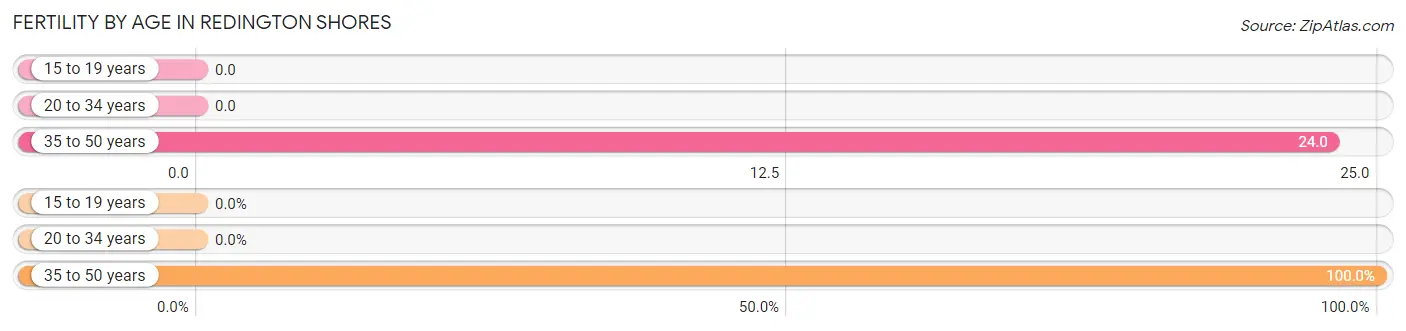
| Age Bracket | Women with Births | Births / 1,000 Women |
| 15 to 19 years | 0 (0.0%) | 0.0 |
| 20 to 34 years | 0 (0.0%) | 0.0 |
| 35 to 50 years | 3 (100.0%) | 24.0 |
| Total | 3 (100.0%) | 15.0 |
Fertility by Age by Marriage Status in Redington Shores
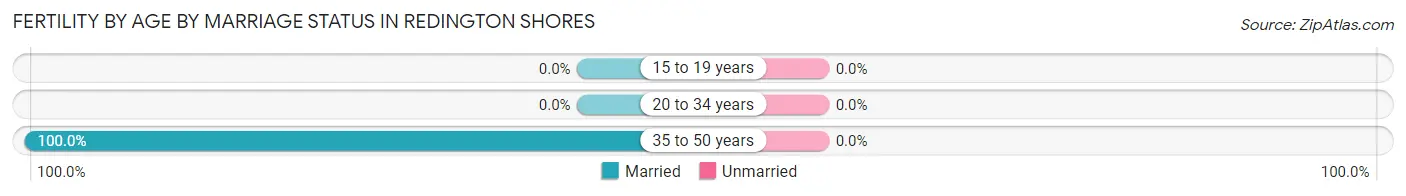
| Age Bracket | Married | Unmarried |
| 15 to 19 years | 0 (0.0%) | 0 (0.0%) |
| 20 to 34 years | 0 (0.0%) | 0 (0.0%) |
| 35 to 50 years | 3 (100.0%) | 0 (0.0%) |
| Total | 3 (100.0%) | 0 (0.0%) |
Fertility by Education in Redington Shores
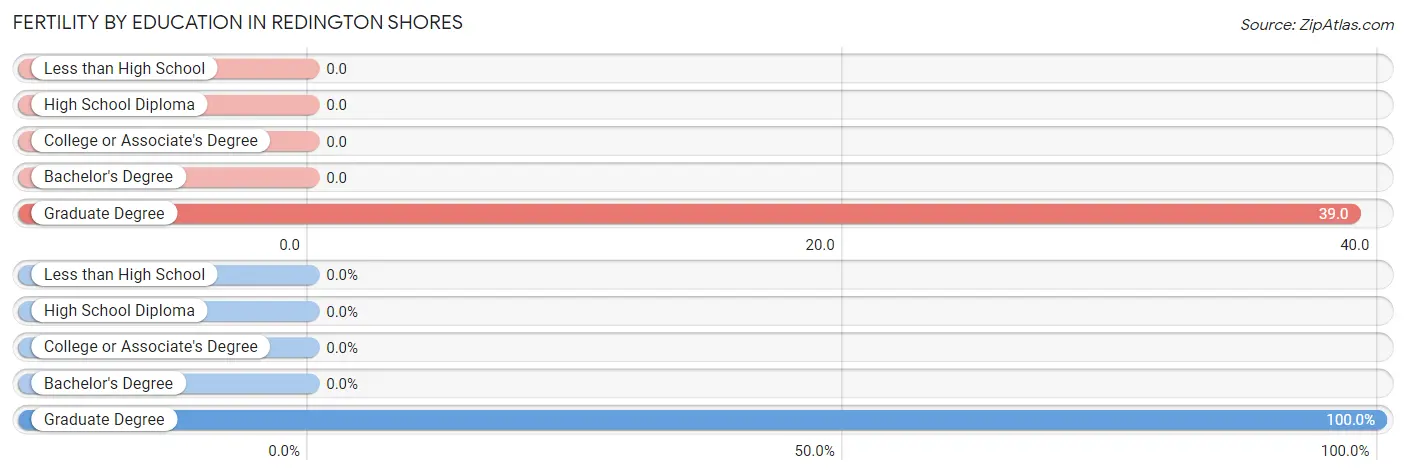
| Educational Attainment | Women with Births | Births / 1,000 Women |
| Less than High School | 0 (0.0%) | 0.0 |
| High School Diploma | 0 (0.0%) | 0.0 |
| College or Associate's Degree | 0 (0.0%) | 0.0 |
| Bachelor's Degree | 0 (0.0%) | 0.0 |
| Graduate Degree | 3 (100.0%) | 39.0 |
| Total | 3 (100.0%) | 15.0 |
Fertility by Education by Marriage Status in Redington Shores
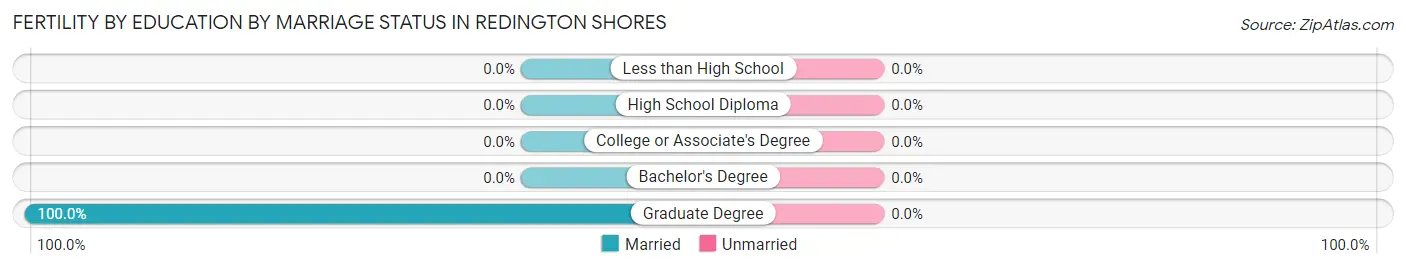
| Educational Attainment | Married | Unmarried |
| Less than High School | 0 (0.0%) | 0 (0.0%) |
| High School Diploma | 0 (0.0%) | 0 (0.0%) |
| College or Associate's Degree | 0 (0.0%) | 0 (0.0%) |
| Bachelor's Degree | 0 (0.0%) | 0 (0.0%) |
| Graduate Degree | 3 (100.0%) | 0 (0.0%) |
| Total | 3 (100.0%) | 0 (0.0%) |
Employment Characteristics in Redington Shores
Employment by Class of Employer in Redington Shores
Among the 855 employed individuals in Redington Shores, private company employees (528 | 61.8%), self-employed (incorporated) (101 | 11.8%), and self-employed (not incorporated) (81 | 9.5%) make up the most common classes of employment.
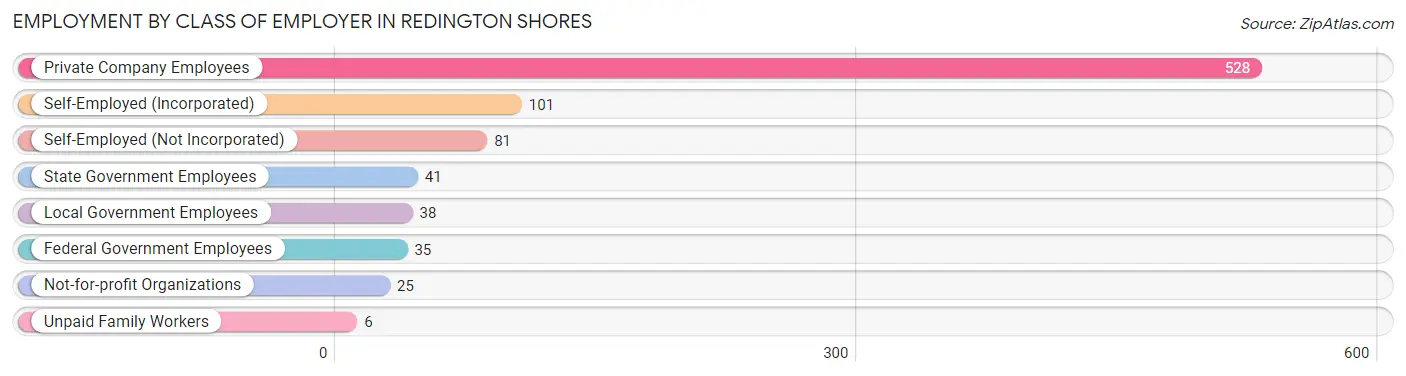
| Employer Class | # Employees | % Employees |
| Private Company Employees | 528 | 61.8% |
| Self-Employed (Incorporated) | 101 | 11.8% |
| Self-Employed (Not Incorporated) | 81 | 9.5% |
| Not-for-profit Organizations | 25 | 2.9% |
| Local Government Employees | 38 | 4.4% |
| State Government Employees | 41 | 4.8% |
| Federal Government Employees | 35 | 4.1% |
| Unpaid Family Workers | 6 | 0.7% |
| Total | 855 | 100.0% |
Employment Status by Age in Redington Shores
According to the labor force statistics for Redington Shores, out of the total population over 16 years of age (1,981), 45.6% or 903 individuals are in the labor force, with 1.9% or 17 of them unemployed. The age group with the highest labor force participation rate is 25 to 29 years, with 83.3% or 20 individuals in the labor force. Within the labor force, the 45 to 54 years age range has the highest percentage of unemployed individuals, with 7.5% or 17 of them being unemployed.
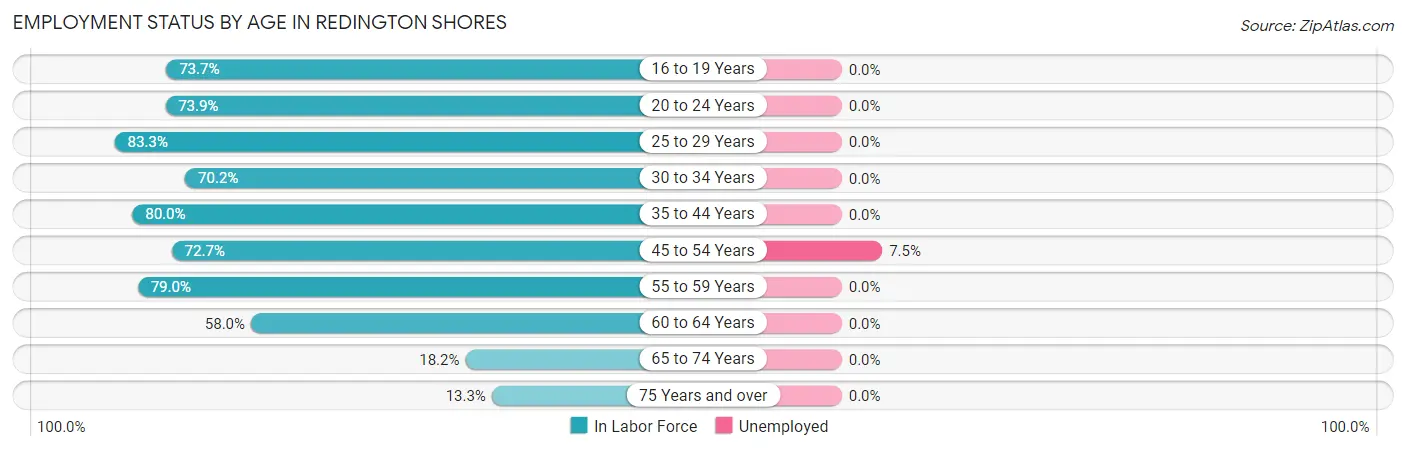
| Age Bracket | In Labor Force | Unemployed |
| 16 to 19 Years | 14 (73.7%) | 0 (0.0%) |
| 20 to 24 Years | 34 (73.9%) | 0 (0.0%) |
| 25 to 29 Years | 20 (83.3%) | 0 (0.0%) |
| 30 to 34 Years | 40 (70.2%) | 0 (0.0%) |
| 35 to 44 Years | 104 (80.0%) | 0 (0.0%) |
| 45 to 54 Years | 226 (72.7%) | 17 (7.5%) |
| 55 to 59 Years | 214 (79.0%) | 0 (0.0%) |
| 60 to 64 Years | 101 (58.0%) | 0 (0.0%) |
| 65 to 74 Years | 87 (18.2%) | 0 (0.0%) |
| 75 Years and over | 63 (13.3%) | 0 (0.0%) |
| Total | 903 (45.6%) | 17 (1.9%) |
Employment Status by Educational Attainment in Redington Shores
According to labor force statistics for Redington Shores, 72.9% of individuals (705) out of the total population between 25 and 64 years of age (967) are in the labor force, with 2.4% or 17 of them being unemployed. The group with the highest labor force participation rate are those with the educational attainment of less than high school, with 85.2% or 23 individuals in the labor force. Within the labor force, individuals with college / associate degree education have the highest percentage of unemployment, with 3.3% or 4 of them being unemployed.
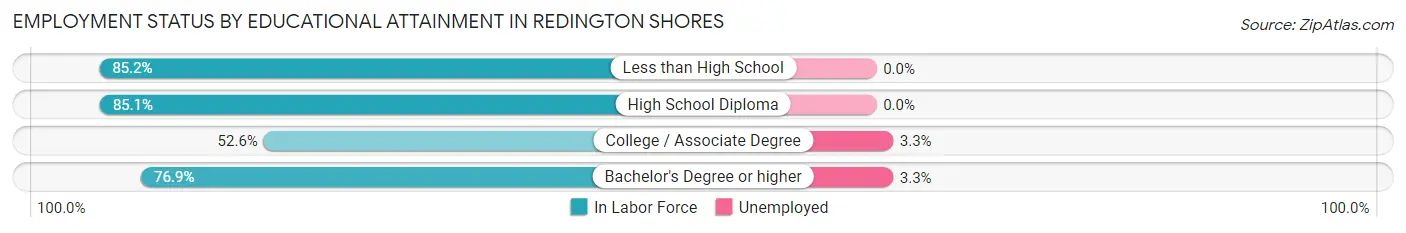
| Educational Attainment | In Labor Force | Unemployed |
| Less than High School | 23 (85.2%) | 0 (0.0%) |
| High School Diploma | 166 (85.1%) | 0 (0.0%) |
| College / Associate Degree | 123 (52.6%) | 8 (3.3%) |
| Bachelor's Degree or higher | 393 (76.9%) | 17 (3.3%) |
| Total | 705 (72.9%) | 23 (2.4%) |
Employment Occupations by Sex in Redington Shores
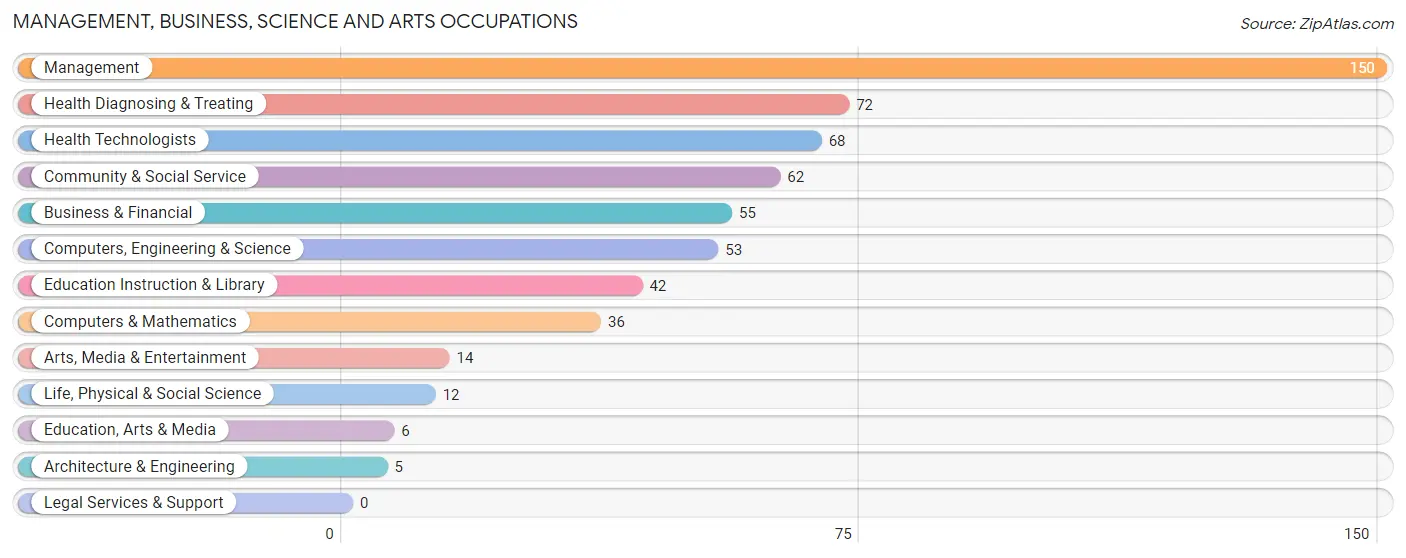
Management, Business, Science and Arts Occupations
The most common Management, Business, Science and Arts occupations in Redington Shores are Management (150 | 16.9%), Health Diagnosing & Treating (72 | 8.1%), Health Technologists (68 | 7.7%), Community & Social Service (62 | 7.0%), and Business & Financial (55 | 6.2%).
Management, Business, Science and Arts Occupations by Sex
Within the Management, Business, Science and Arts occupations in Redington Shores, the most male-oriented occupations are Architecture & Engineering (100.0%), Business & Financial (83.6%), and Management (60.7%), while the most female-oriented occupations are Community & Social Service (100.0%), Education, Arts & Media (100.0%), and Education Instruction & Library (100.0%).
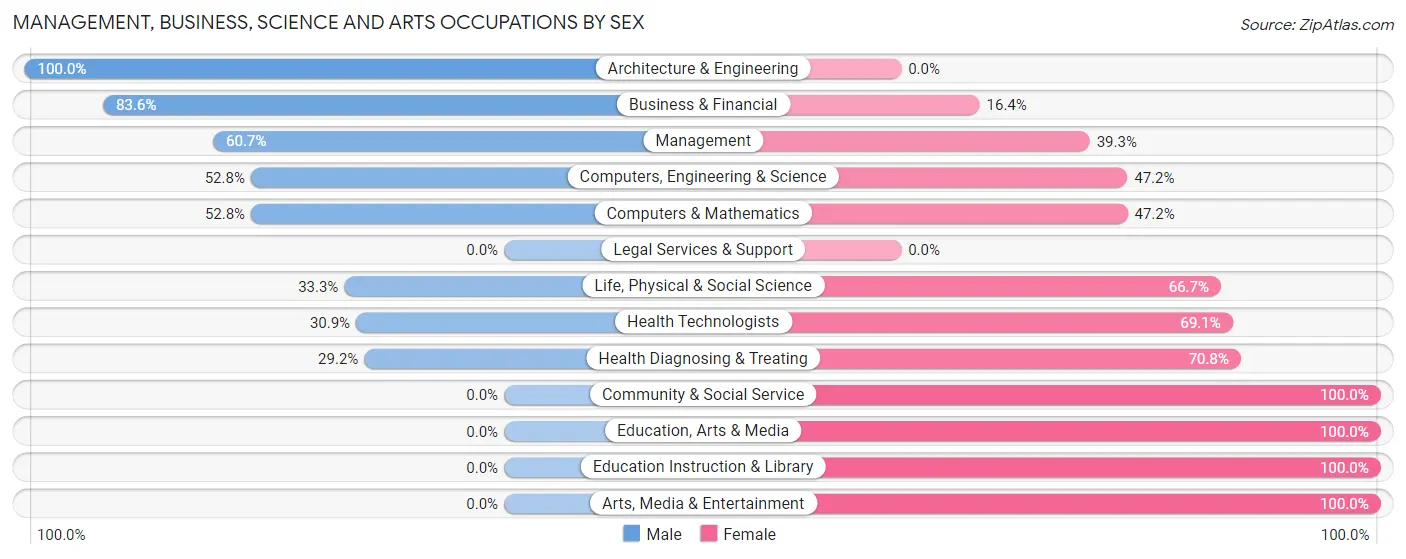
| Occupation | Male | Female |
| Management | 91 (60.7%) | 59 (39.3%) |
| Business & Financial | 46 (83.6%) | 9 (16.4%) |
| Computers, Engineering & Science | 28 (52.8%) | 25 (47.2%) |
| Computers & Mathematics | 19 (52.8%) | 17 (47.2%) |
| Architecture & Engineering | 5 (100.0%) | 0 (0.0%) |
| Life, Physical & Social Science | 4 (33.3%) | 8 (66.7%) |
| Community & Social Service | 0 (0.0%) | 62 (100.0%) |
| Education, Arts & Media | 0 (0.0%) | 6 (100.0%) |
| Legal Services & Support | 0 (0.0%) | 0 (0.0%) |
| Education Instruction & Library | 0 (0.0%) | 42 (100.0%) |
| Arts, Media & Entertainment | 0 (0.0%) | 14 (100.0%) |
| Health Diagnosing & Treating | 21 (29.2%) | 51 (70.8%) |
| Health Technologists | 21 (30.9%) | 47 (69.1%) |
| Total (Category) | 186 (47.4%) | 206 (52.5%) |
| Total (Overall) | 445 (50.2%) | 441 (49.8%) |
Services Occupations
The most common Services occupations in Redington Shores are Cleaning & Maintenance (41 | 4.6%), Food Preparation & Serving (28 | 3.2%), Healthcare Support (8 | 0.9%), and Personal Care & Service (8 | 0.9%).
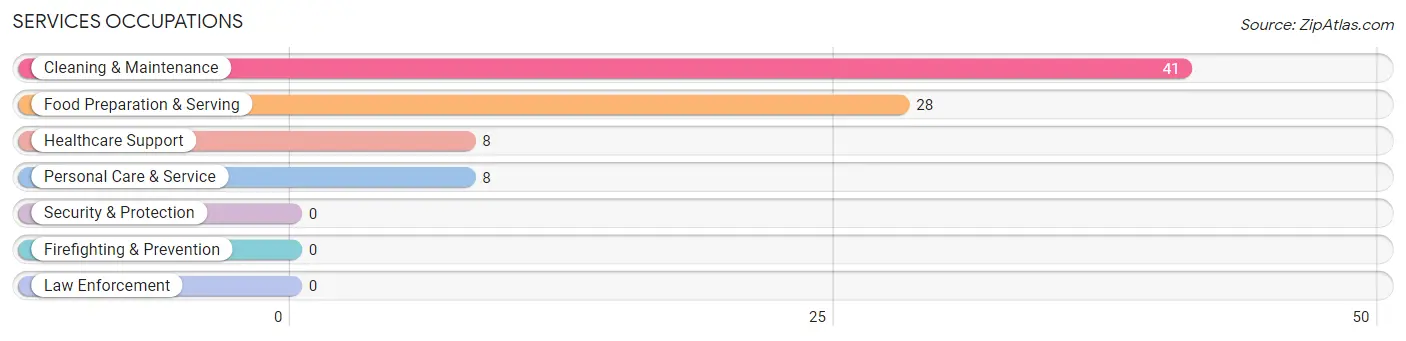
Services Occupations by Sex
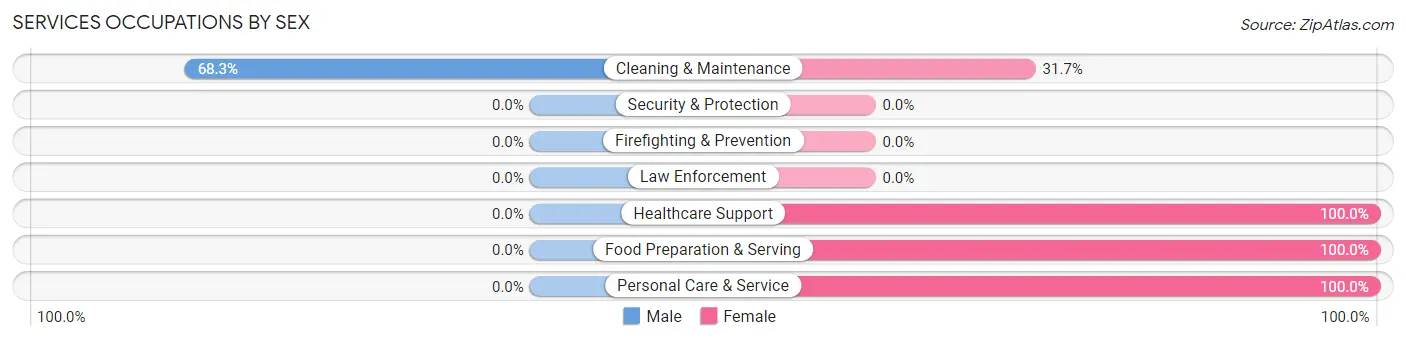
| Occupation | Male | Female |
| Healthcare Support | 0 (0.0%) | 8 (100.0%) |
| Security & Protection | 0 (0.0%) | 0 (0.0%) |
| Firefighting & Prevention | 0 (0.0%) | 0 (0.0%) |
| Law Enforcement | 0 (0.0%) | 0 (0.0%) |
| Food Preparation & Serving | 0 (0.0%) | 28 (100.0%) |
| Cleaning & Maintenance | 28 (68.3%) | 13 (31.7%) |
| Personal Care & Service | 0 (0.0%) | 8 (100.0%) |
| Total (Category) | 28 (32.9%) | 57 (67.1%) |
| Total (Overall) | 445 (50.2%) | 441 (49.8%) |
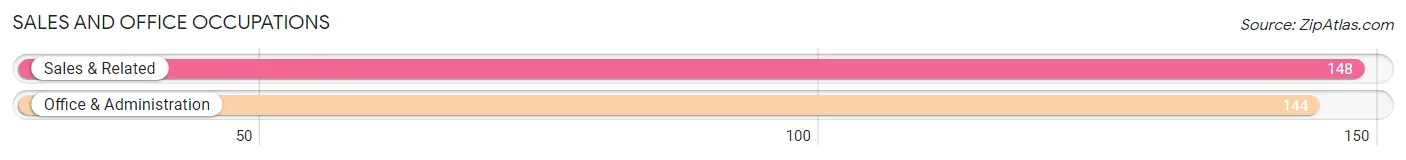
Sales and Office Occupations
The most common Sales and Office occupations in Redington Shores are Sales & Related (148 | 16.7%), and Office & Administration (144 | 16.3%).
Sales and Office Occupations by Sex
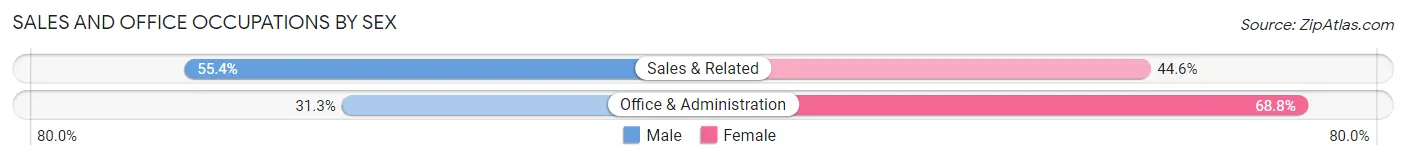
| Occupation | Male | Female |
| Sales & Related | 82 (55.4%) | 66 (44.6%) |
| Office & Administration | 45 (31.2%) | 99 (68.8%) |
| Total (Category) | 127 (43.5%) | 165 (56.5%) |
| Total (Overall) | 445 (50.2%) | 441 (49.8%) |
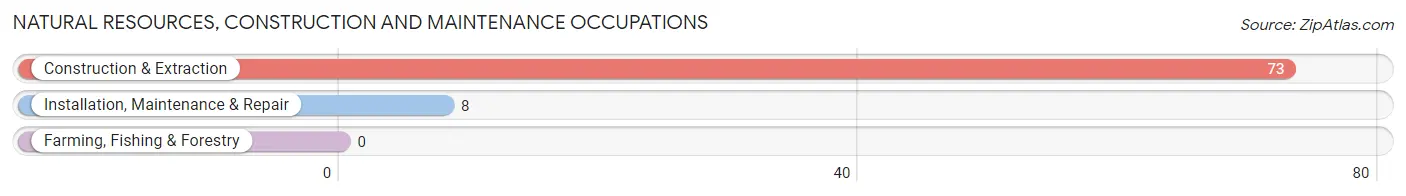
Natural Resources, Construction and Maintenance Occupations
The most common Natural Resources, Construction and Maintenance occupations in Redington Shores are Construction & Extraction (73 | 8.2%), and Installation, Maintenance & Repair (8 | 0.9%).
Natural Resources, Construction and Maintenance Occupations by Sex
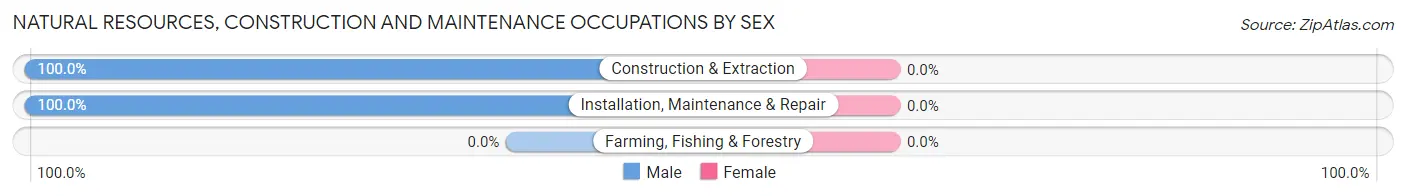
| Occupation | Male | Female |
| Farming, Fishing & Forestry | 0 (0.0%) | 0 (0.0%) |
| Construction & Extraction | 73 (100.0%) | 0 (0.0%) |
| Installation, Maintenance & Repair | 8 (100.0%) | 0 (0.0%) |
| Total (Category) | 81 (100.0%) | 0 (0.0%) |
| Total (Overall) | 445 (50.2%) | 441 (49.8%) |
Production, Transportation and Moving Occupations
The most common Production, Transportation and Moving occupations in Redington Shores are Transportation (23 | 2.6%), and Production (13 | 1.5%).
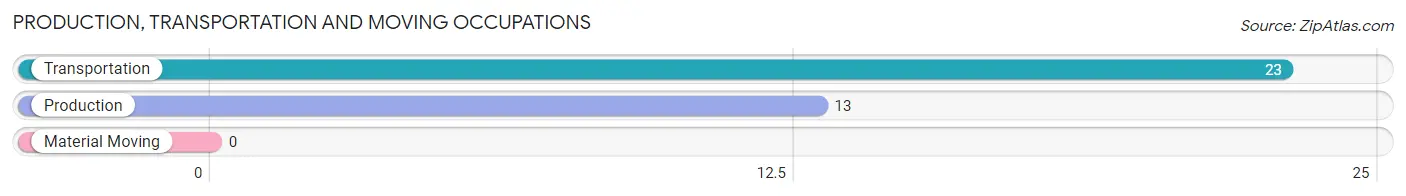
Production, Transportation and Moving Occupations by Sex
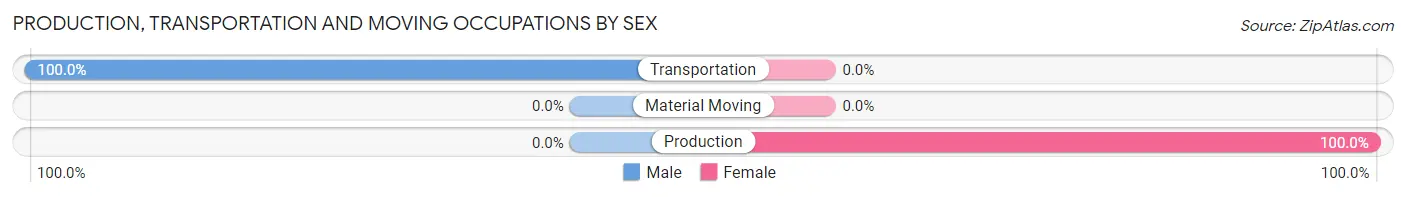
| Occupation | Male | Female |
| Production | 0 (0.0%) | 13 (100.0%) |
| Transportation | 23 (100.0%) | 0 (0.0%) |
| Material Moving | 0 (0.0%) | 0 (0.0%) |
| Total (Category) | 23 (63.9%) | 13 (36.1%) |
| Total (Overall) | 445 (50.2%) | 441 (49.8%) |
Employment Industries by Sex in Redington Shores
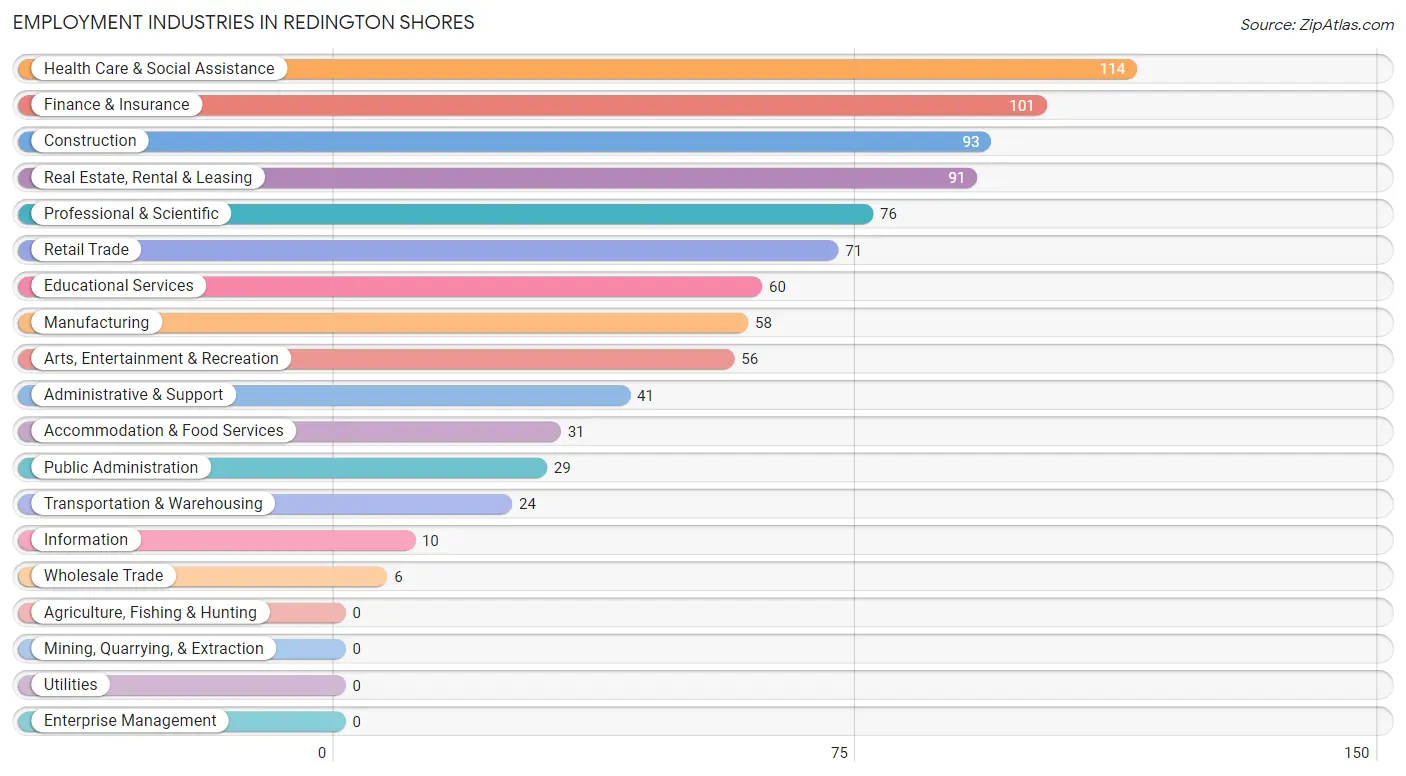
Employment Industries in Redington Shores
The major employment industries in Redington Shores include Health Care & Social Assistance (114 | 12.9%), Finance & Insurance (101 | 11.4%), Construction (93 | 10.5%), Real Estate, Rental & Leasing (91 | 10.3%), and Professional & Scientific (76 | 8.6%).
Employment Industries by Sex in Redington Shores
The Redington Shores industries that see more men than women are Construction (91.4%), Arts, Entertainment & Recreation (69.6%), and Administrative & Support (68.3%), whereas the industries that tend to have a higher number of women are Wholesale Trade (100.0%), Educational Services (88.3%), and Health Care & Social Assistance (75.4%).
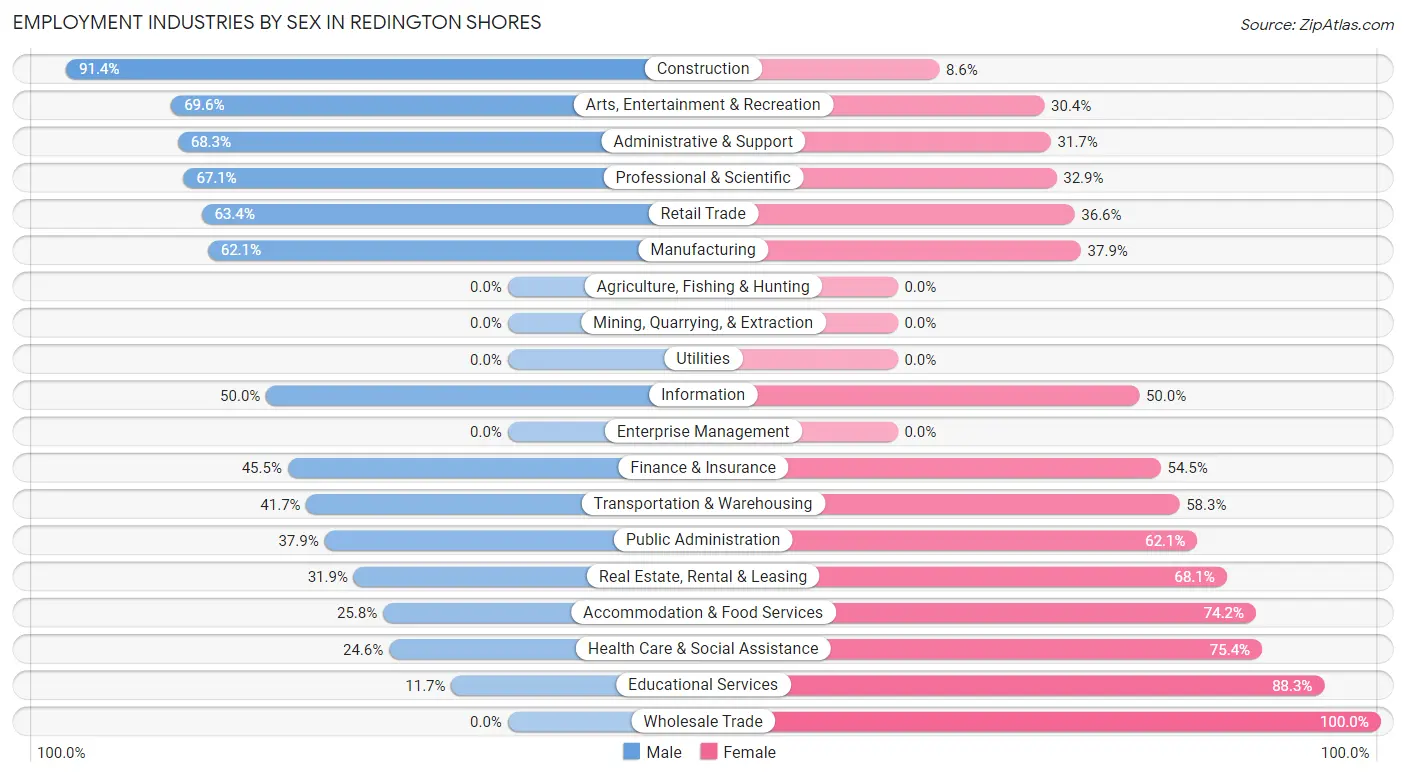
| Industry | Male | Female |
| Agriculture, Fishing & Hunting | 0 (0.0%) | 0 (0.0%) |
| Mining, Quarrying, & Extraction | 0 (0.0%) | 0 (0.0%) |
| Construction | 85 (91.4%) | 8 (8.6%) |
| Manufacturing | 36 (62.1%) | 22 (37.9%) |
| Wholesale Trade | 0 (0.0%) | 6 (100.0%) |
| Retail Trade | 45 (63.4%) | 26 (36.6%) |
| Transportation & Warehousing | 10 (41.7%) | 14 (58.3%) |
| Utilities | 0 (0.0%) | 0 (0.0%) |
| Information | 5 (50.0%) | 5 (50.0%) |
| Finance & Insurance | 46 (45.5%) | 55 (54.5%) |
| Real Estate, Rental & Leasing | 29 (31.9%) | 62 (68.1%) |
| Professional & Scientific | 51 (67.1%) | 25 (32.9%) |
| Enterprise Management | 0 (0.0%) | 0 (0.0%) |
| Administrative & Support | 28 (68.3%) | 13 (31.7%) |
| Educational Services | 7 (11.7%) | 53 (88.3%) |
| Health Care & Social Assistance | 28 (24.6%) | 86 (75.4%) |
| Arts, Entertainment & Recreation | 39 (69.6%) | 17 (30.4%) |
| Accommodation & Food Services | 8 (25.8%) | 23 (74.2%) |
| Public Administration | 11 (37.9%) | 18 (62.1%) |
| Total | 445 (50.2%) | 441 (49.8%) |
Education in Redington Shores
School Enrollment in Redington Shores
The most common levels of schooling among the 137 students in Redington Shores are elementary school (40 | 29.2%), college / undergraduate (29 | 21.2%), and middle school (25 | 18.2%).
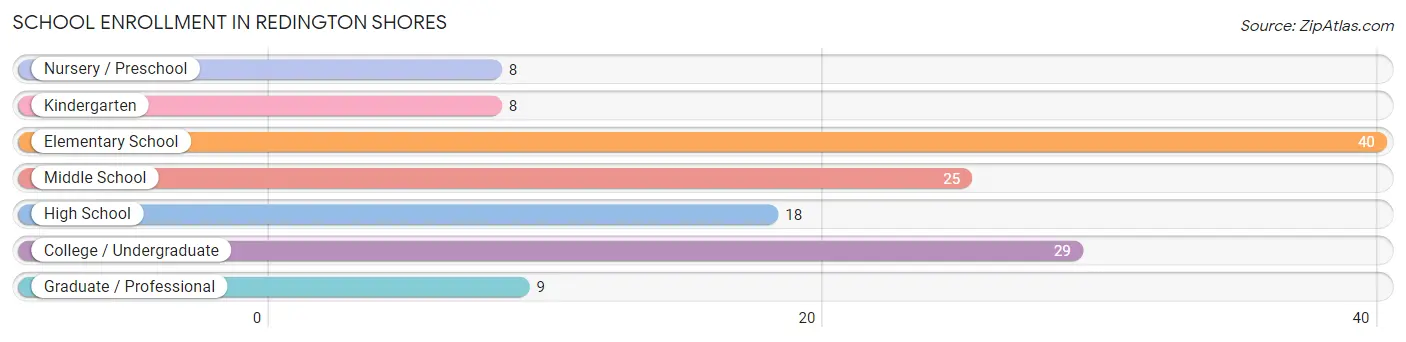
| School Level | # Students | % Students |
| Nursery / Preschool | 8 | 5.8% |
| Kindergarten | 8 | 5.8% |
| Elementary School | 40 | 29.2% |
| Middle School | 25 | 18.2% |
| High School | 18 | 13.1% |
| College / Undergraduate | 29 | 21.2% |
| Graduate / Professional | 9 | 6.6% |
| Total | 137 | 100.0% |
School Enrollment by Age by Funding Source in Redington Shores
Out of a total of 137 students who are enrolled in schools in Redington Shores, 52 (38.0%) attend a private institution, while the remaining 85 (62.0%) are enrolled in public schools. The age group of 3 to 4 year olds has the highest likelihood of being enrolled in private schools, with 8 (100.0% in the age bracket) enrolled. Conversely, the age group of 15 to 17 year olds has the lowest likelihood of being enrolled in a private school, with 18 (100.0% in the age bracket) attending a public institution.
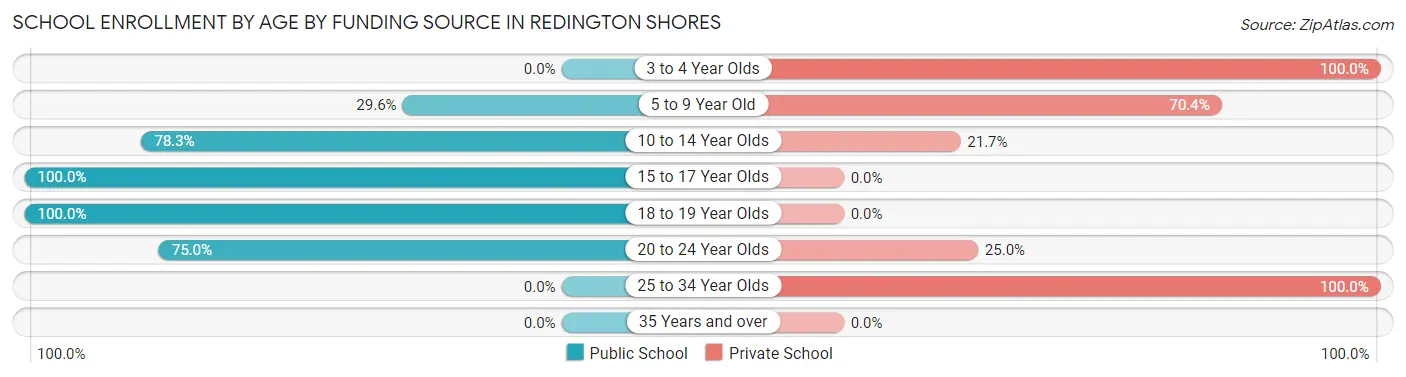
| Age Bracket | Public School | Private School |
| 3 to 4 Year Olds | 0 (0.0%) | 8 (100.0%) |
| 5 to 9 Year Old | 8 (29.6%) | 19 (70.4%) |
| 10 to 14 Year Olds | 36 (78.3%) | 10 (21.7%) |
| 15 to 17 Year Olds | 18 (100.0%) | 0 (0.0%) |
| 18 to 19 Year Olds | 5 (100.0%) | 0 (0.0%) |
| 20 to 24 Year Olds | 18 (75.0%) | 6 (25.0%) |
| 25 to 34 Year Olds | 0 (0.0%) | 9 (100.0%) |
| 35 Years and over | 0 (0.0%) | 0 (0.0%) |
| Total | 85 (62.0%) | 52 (38.0%) |
Educational Attainment by Field of Study in Redington Shores
Business (303 | 28.3%), education (139 | 13.0%), social sciences (124 | 11.6%), science & technology (109 | 10.2%), and engineering (71 | 6.6%) are the most common fields of study among 1,072 individuals in Redington Shores who have obtained a bachelor's degree or higher.
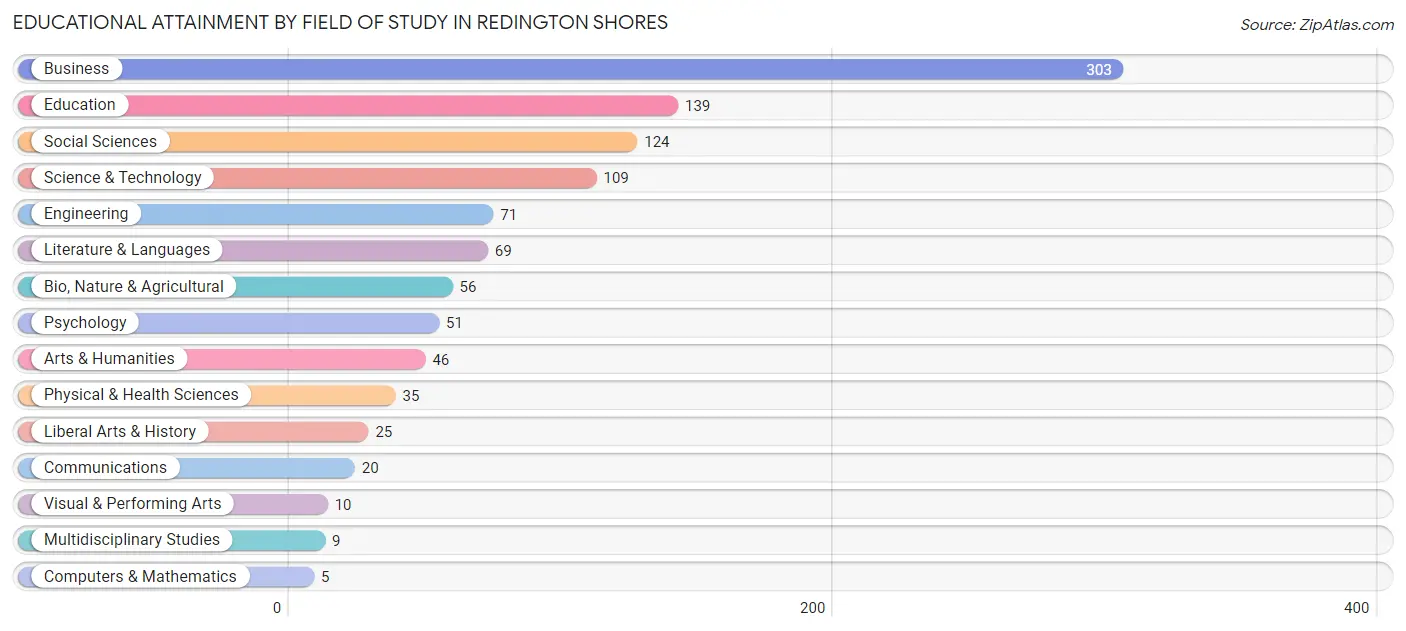
| Field of Study | # Graduates | % Graduates |
| Computers & Mathematics | 5 | 0.5% |
| Bio, Nature & Agricultural | 56 | 5.2% |
| Physical & Health Sciences | 35 | 3.3% |
| Psychology | 51 | 4.8% |
| Social Sciences | 124 | 11.6% |
| Engineering | 71 | 6.6% |
| Multidisciplinary Studies | 9 | 0.8% |
| Science & Technology | 109 | 10.2% |
| Business | 303 | 28.3% |
| Education | 139 | 13.0% |
| Literature & Languages | 69 | 6.4% |
| Liberal Arts & History | 25 | 2.3% |
| Visual & Performing Arts | 10 | 0.9% |
| Communications | 20 | 1.9% |
| Arts & Humanities | 46 | 4.3% |
| Total | 1,072 | 100.0% |
Transportation & Commute in Redington Shores
Vehicle Availability by Sex in Redington Shores
The most prevalent vehicle ownership categories in Redington Shores are males with 2 vehicles (228, accounting for 54.0%) and females with 2 vehicles (177, making up 52.7%).
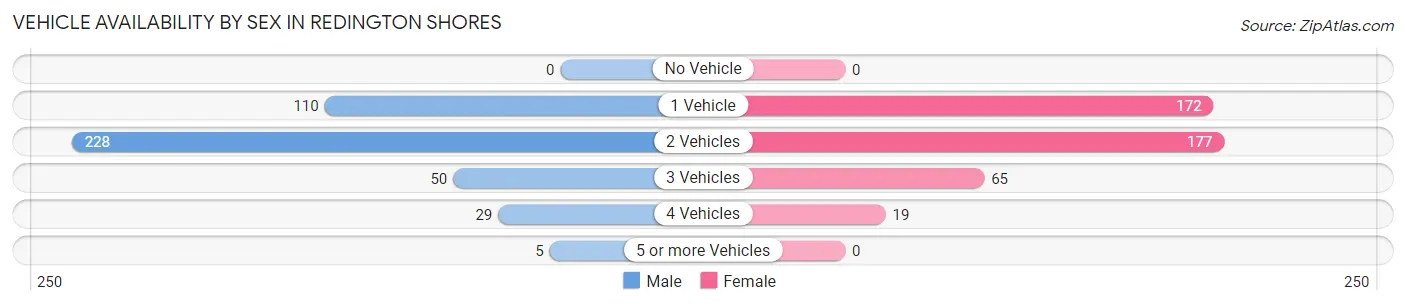
| Vehicles Available | Male | Female |
| No Vehicle | 0 (0.0%) | 0 (0.0%) |
| 1 Vehicle | 110 (26.1%) | 172 (39.7%) |
| 2 Vehicles | 228 (54.0%) | 177 (40.9%) |
| 3 Vehicles | 50 (11.8%) | 65 (15.0%) |
| 4 Vehicles | 29 (6.9%) | 19 (4.4%) |
| 5 or more Vehicles | 5 (1.2%) | 0 (0.0%) |
| Total | 422 (100.0%) | 433 (100.0%) |
Commute Time in Redington Shores
The most frequently occuring commute durations in Redington Shores are 20 to 24 minutes (94 commuters, 14.4%), 15 to 19 minutes (92 commuters, 14.1%), and 45 to 59 minutes (92 commuters, 14.1%).
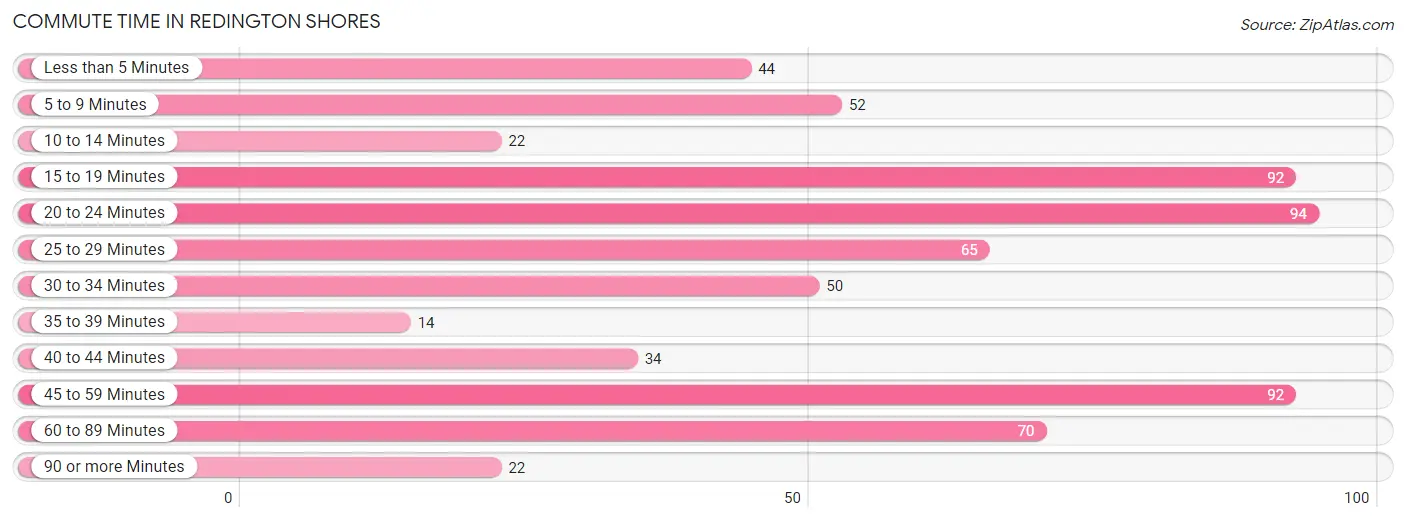
| Commute Time | # Commuters | % Commuters |
| Less than 5 Minutes | 44 | 6.8% |
| 5 to 9 Minutes | 52 | 8.0% |
| 10 to 14 Minutes | 22 | 3.4% |
| 15 to 19 Minutes | 92 | 14.1% |
| 20 to 24 Minutes | 94 | 14.4% |
| 25 to 29 Minutes | 65 | 10.0% |
| 30 to 34 Minutes | 50 | 7.7% |
| 35 to 39 Minutes | 14 | 2.1% |
| 40 to 44 Minutes | 34 | 5.2% |
| 45 to 59 Minutes | 92 | 14.1% |
| 60 to 89 Minutes | 70 | 10.7% |
| 90 or more Minutes | 22 | 3.4% |
Commute Time by Sex in Redington Shores
The most common commute times in Redington Shores are 60 to 89 minutes (66 commuters, 20.4%) for males and 20 to 24 minutes (64 commuters, 19.6%) for females.
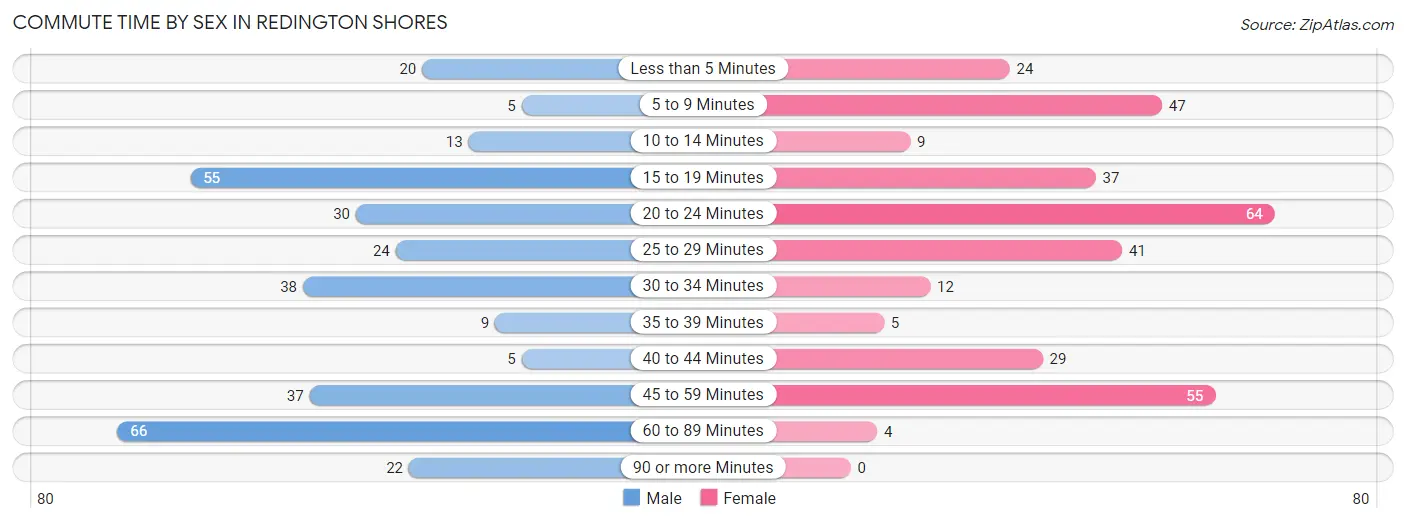
| Commute Time | Male | Female |
| Less than 5 Minutes | 20 (6.2%) | 24 (7.3%) |
| 5 to 9 Minutes | 5 (1.5%) | 47 (14.4%) |
| 10 to 14 Minutes | 13 (4.0%) | 9 (2.8%) |
| 15 to 19 Minutes | 55 (17.0%) | 37 (11.3%) |
| 20 to 24 Minutes | 30 (9.3%) | 64 (19.6%) |
| 25 to 29 Minutes | 24 (7.4%) | 41 (12.5%) |
| 30 to 34 Minutes | 38 (11.7%) | 12 (3.7%) |
| 35 to 39 Minutes | 9 (2.8%) | 5 (1.5%) |
| 40 to 44 Minutes | 5 (1.5%) | 29 (8.9%) |
| 45 to 59 Minutes | 37 (11.4%) | 55 (16.8%) |
| 60 to 89 Minutes | 66 (20.4%) | 4 (1.2%) |
| 90 or more Minutes | 22 (6.8%) | 0 (0.0%) |
Time of Departure to Work by Sex in Redington Shores
The most frequent times of departure to work in Redington Shores are 7:30 AM to 7:59 AM (91, 28.1%) for males and 7:30 AM to 7:59 AM (79, 24.2%) for females.
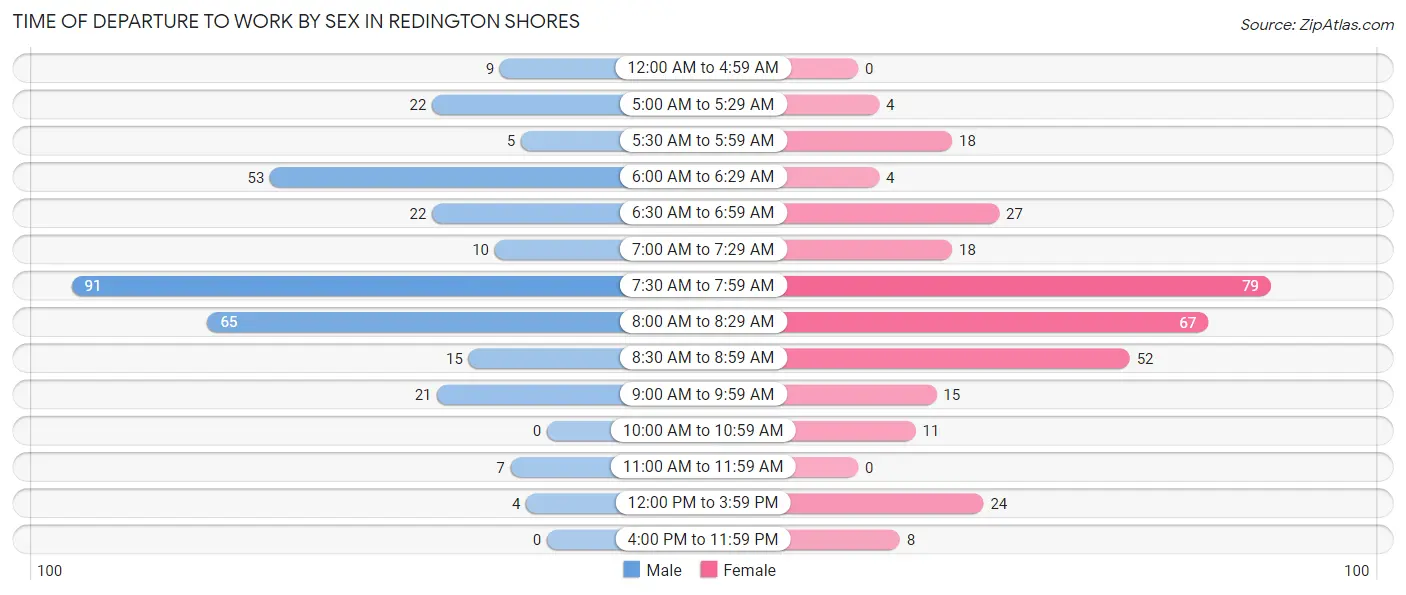
| Time of Departure | Male | Female |
| 12:00 AM to 4:59 AM | 9 (2.8%) | 0 (0.0%) |
| 5:00 AM to 5:29 AM | 22 (6.8%) | 4 (1.2%) |
| 5:30 AM to 5:59 AM | 5 (1.5%) | 18 (5.5%) |
| 6:00 AM to 6:29 AM | 53 (16.4%) | 4 (1.2%) |
| 6:30 AM to 6:59 AM | 22 (6.8%) | 27 (8.3%) |
| 7:00 AM to 7:29 AM | 10 (3.1%) | 18 (5.5%) |
| 7:30 AM to 7:59 AM | 91 (28.1%) | 79 (24.2%) |
| 8:00 AM to 8:29 AM | 65 (20.1%) | 67 (20.5%) |
| 8:30 AM to 8:59 AM | 15 (4.6%) | 52 (15.9%) |
| 9:00 AM to 9:59 AM | 21 (6.5%) | 15 (4.6%) |
| 10:00 AM to 10:59 AM | 0 (0.0%) | 11 (3.4%) |
| 11:00 AM to 11:59 AM | 7 (2.2%) | 0 (0.0%) |
| 12:00 PM to 3:59 PM | 4 (1.2%) | 24 (7.3%) |
| 4:00 PM to 11:59 PM | 0 (0.0%) | 8 (2.5%) |
| Total | 324 (100.0%) | 327 (100.0%) |
Housing Occupancy in Redington Shores
Occupancy by Ownership in Redington Shores
Of the total 1,158 dwellings in Redington Shores, owner-occupied units account for 982 (84.8%), while renter-occupied units make up 176 (15.2%).
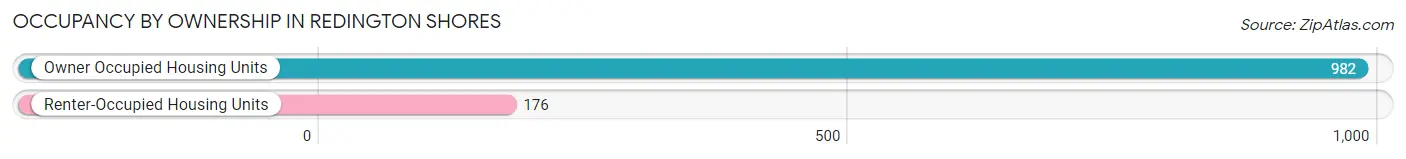
| Occupancy | # Housing Units | % Housing Units |
| Owner Occupied Housing Units | 982 | 84.8% |
| Renter-Occupied Housing Units | 176 | 15.2% |
| Total Occupied Housing Units | 1,158 | 100.0% |
Occupancy by Household Size in Redington Shores
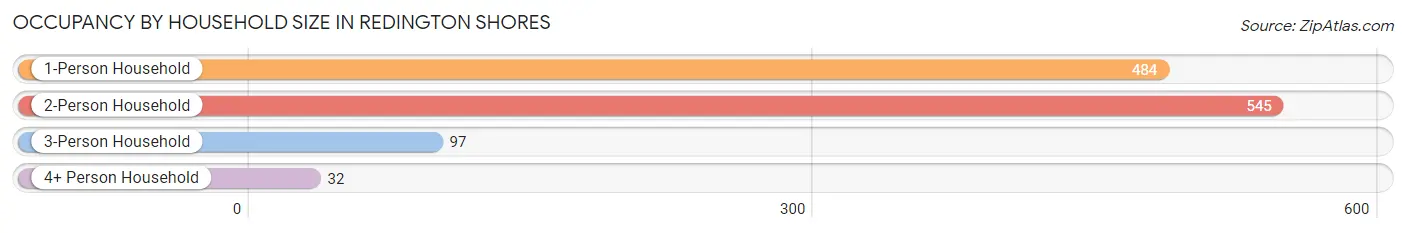
| Household Size | # Housing Units | % Housing Units |
| 1-Person Household | 484 | 41.8% |
| 2-Person Household | 545 | 47.1% |
| 3-Person Household | 97 | 8.4% |
| 4+ Person Household | 32 | 2.8% |
| Total Housing Units | 1,158 | 100.0% |
Occupancy by Ownership by Household Size in Redington Shores
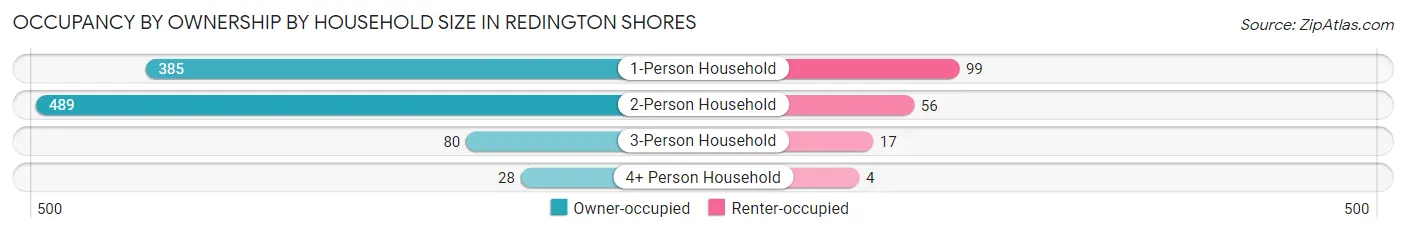
| Household Size | Owner-occupied | Renter-occupied |
| 1-Person Household | 385 (79.5%) | 99 (20.4%) |
| 2-Person Household | 489 (89.7%) | 56 (10.3%) |
| 3-Person Household | 80 (82.5%) | 17 (17.5%) |
| 4+ Person Household | 28 (87.5%) | 4 (12.5%) |
| Total Housing Units | 982 (84.8%) | 176 (15.2%) |
Occupancy by Educational Attainment in Redington Shores
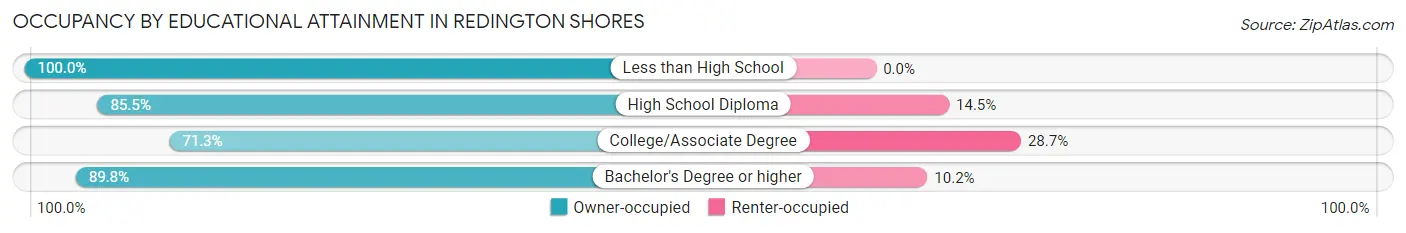
| Household Size | Owner-occupied | Renter-occupied |
| Less than High School | 49 (100.0%) | 0 (0.0%) |
| High School Diploma | 142 (85.5%) | 24 (14.5%) |
| College/Associate Degree | 216 (71.3%) | 87 (28.7%) |
| Bachelor's Degree or higher | 575 (89.8%) | 65 (10.2%) |
Occupancy by Age of Householder in Redington Shores
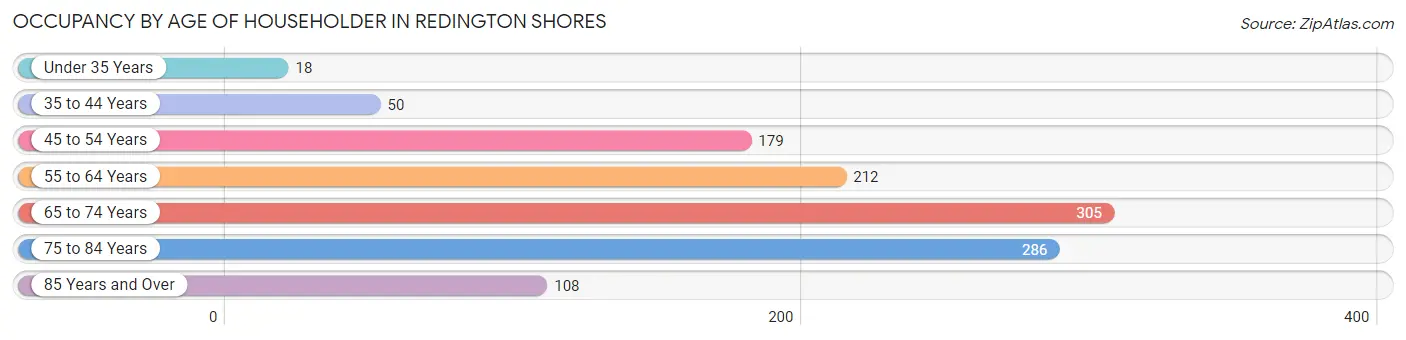
| Age Bracket | # Households | % Households |
| Under 35 Years | 18 | 1.5% |
| 35 to 44 Years | 50 | 4.3% |
| 45 to 54 Years | 179 | 15.5% |
| 55 to 64 Years | 212 | 18.3% |
| 65 to 74 Years | 305 | 26.3% |
| 75 to 84 Years | 286 | 24.7% |
| 85 Years and Over | 108 | 9.3% |
| Total | 1,158 | 100.0% |
Housing Finances in Redington Shores
Median Income by Occupancy in Redington Shores
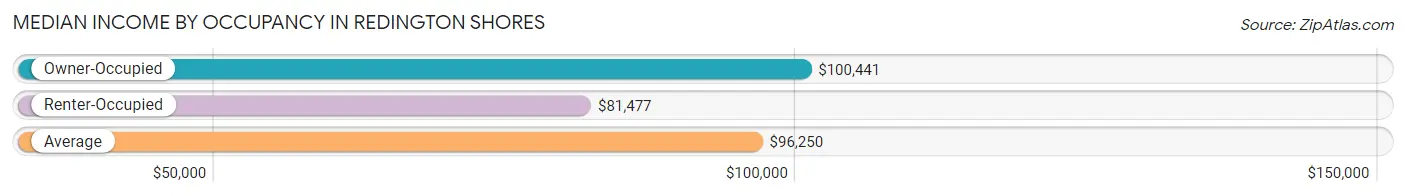
| Occupancy Type | # Households | Median Income |
| Owner-Occupied | 982 (84.8%) | $100,441 |
| Renter-Occupied | 176 (15.2%) | $81,477 |
| Average | 1,158 (100.0%) | $96,250 |
Occupancy by Householder Income Bracket in Redington Shores
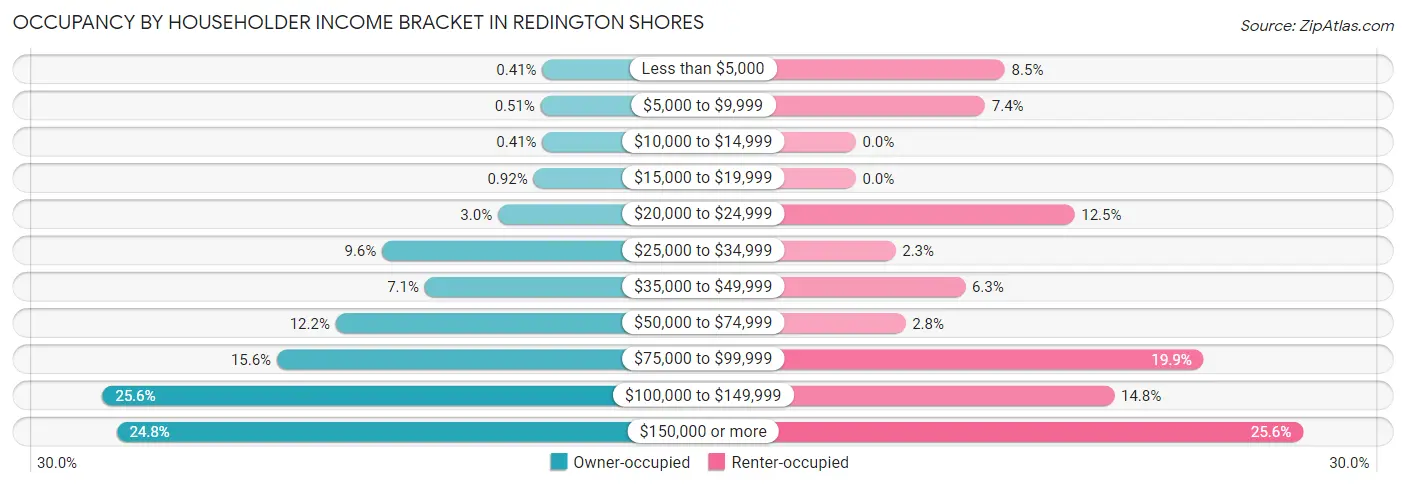
| Income Bracket | Owner-occupied | Renter-occupied |
| Less than $5,000 | 4 (0.4%) | 15 (8.5%) |
| $5,000 to $9,999 | 5 (0.5%) | 13 (7.4%) |
| $10,000 to $14,999 | 4 (0.4%) | 0 (0.0%) |
| $15,000 to $19,999 | 9 (0.9%) | 0 (0.0%) |
| $20,000 to $24,999 | 29 (2.9%) | 22 (12.5%) |
| $25,000 to $34,999 | 94 (9.6%) | 4 (2.3%) |
| $35,000 to $49,999 | 70 (7.1%) | 11 (6.2%) |
| $50,000 to $74,999 | 120 (12.2%) | 5 (2.8%) |
| $75,000 to $99,999 | 153 (15.6%) | 35 (19.9%) |
| $100,000 to $149,999 | 251 (25.6%) | 26 (14.8%) |
| $150,000 or more | 243 (24.7%) | 45 (25.6%) |
| Total | 982 (100.0%) | 176 (100.0%) |
Monthly Housing Cost Tiers in Redington Shores
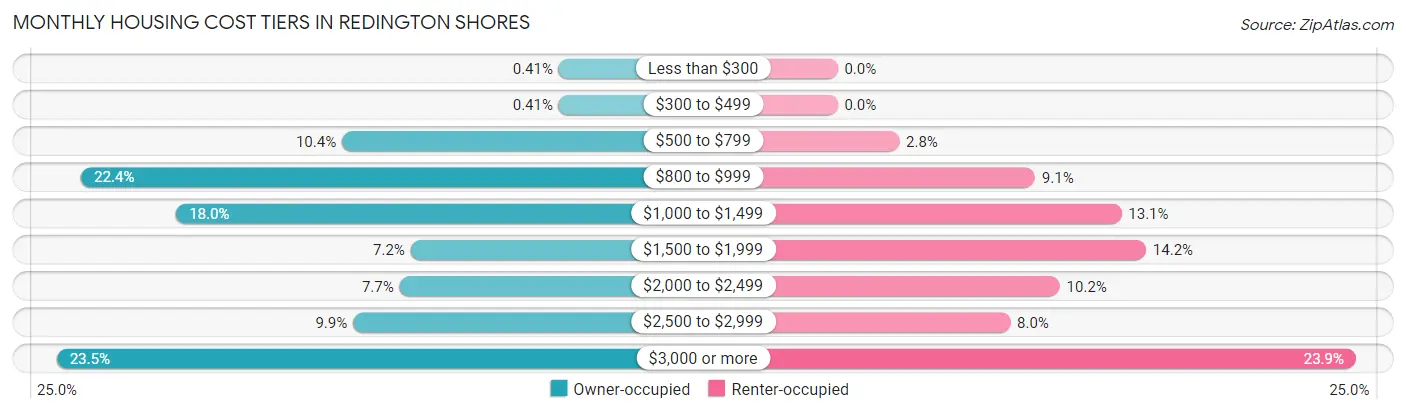
| Monthly Cost | Owner-occupied | Renter-occupied |
| Less than $300 | 4 (0.4%) | 0 (0.0%) |
| $300 to $499 | 4 (0.4%) | 0 (0.0%) |
| $500 to $799 | 102 (10.4%) | 5 (2.8%) |
| $800 to $999 | 220 (22.4%) | 16 (9.1%) |
| $1,000 to $1,499 | 177 (18.0%) | 23 (13.1%) |
| $1,500 to $1,999 | 71 (7.2%) | 25 (14.2%) |
| $2,000 to $2,499 | 76 (7.7%) | 18 (10.2%) |
| $2,500 to $2,999 | 97 (9.9%) | 14 (8.0%) |
| $3,000 or more | 231 (23.5%) | 42 (23.9%) |
| Total | 982 (100.0%) | 176 (100.0%) |
Physical Housing Characteristics in Redington Shores
Housing Structures in Redington Shores
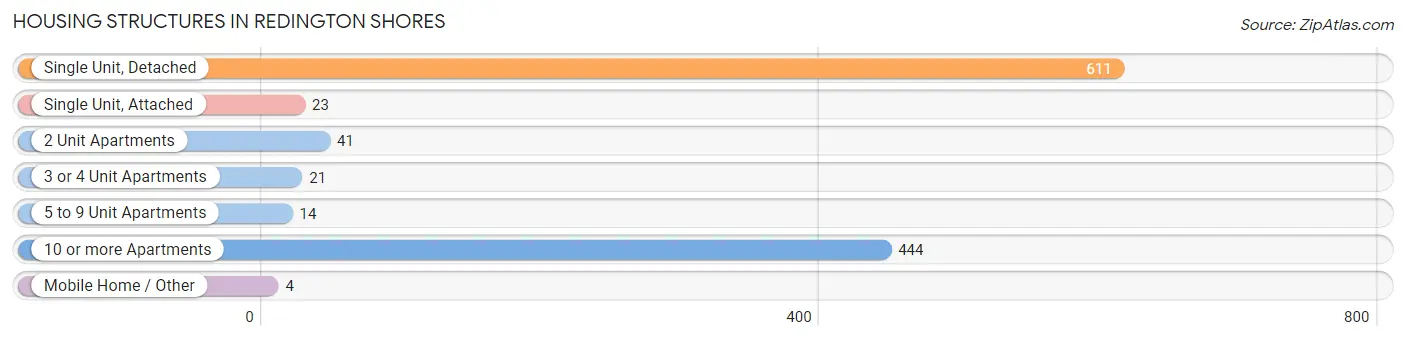
| Structure Type | # Housing Units | % Housing Units |
| Single Unit, Detached | 611 | 52.8% |
| Single Unit, Attached | 23 | 2.0% |
| 2 Unit Apartments | 41 | 3.5% |
| 3 or 4 Unit Apartments | 21 | 1.8% |
| 5 to 9 Unit Apartments | 14 | 1.2% |
| 10 or more Apartments | 444 | 38.3% |
| Mobile Home / Other | 4 | 0.4% |
| Total | 1,158 | 100.0% |
Housing Structures by Occupancy in Redington Shores
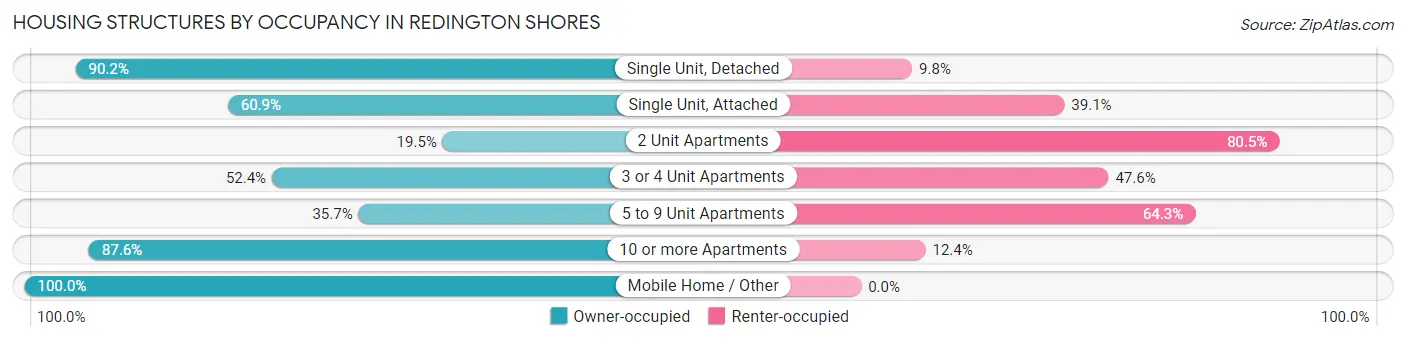
| Structure Type | Owner-occupied | Renter-occupied |
| Single Unit, Detached | 551 (90.2%) | 60 (9.8%) |
| Single Unit, Attached | 14 (60.9%) | 9 (39.1%) |
| 2 Unit Apartments | 8 (19.5%) | 33 (80.5%) |
| 3 or 4 Unit Apartments | 11 (52.4%) | 10 (47.6%) |
| 5 to 9 Unit Apartments | 5 (35.7%) | 9 (64.3%) |
| 10 or more Apartments | 389 (87.6%) | 55 (12.4%) |
| Mobile Home / Other | 4 (100.0%) | 0 (0.0%) |
| Total | 982 (84.8%) | 176 (15.2%) |
Housing Structures by Number of Rooms in Redington Shores
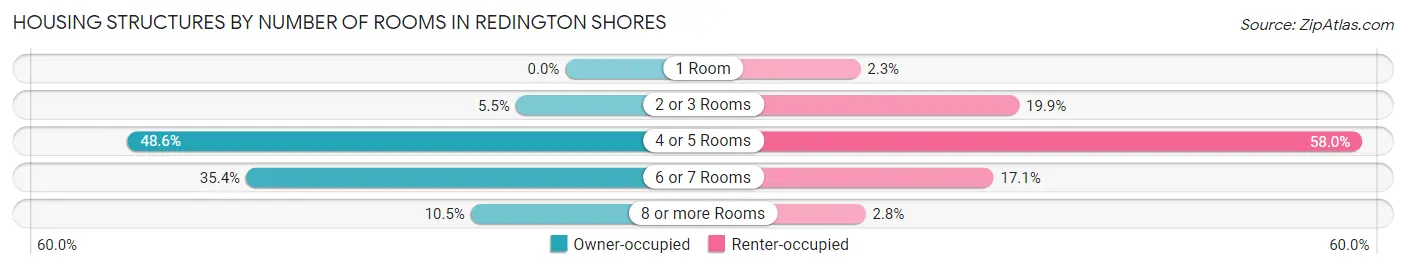
| Number of Rooms | Owner-occupied | Renter-occupied |
| 1 Room | 0 (0.0%) | 4 (2.3%) |
| 2 or 3 Rooms | 54 (5.5%) | 35 (19.9%) |
| 4 or 5 Rooms | 477 (48.6%) | 102 (58.0%) |
| 6 or 7 Rooms | 348 (35.4%) | 30 (17.1%) |
| 8 or more Rooms | 103 (10.5%) | 5 (2.8%) |
| Total | 982 (100.0%) | 176 (100.0%) |
Housing Structure by Heating Type in Redington Shores
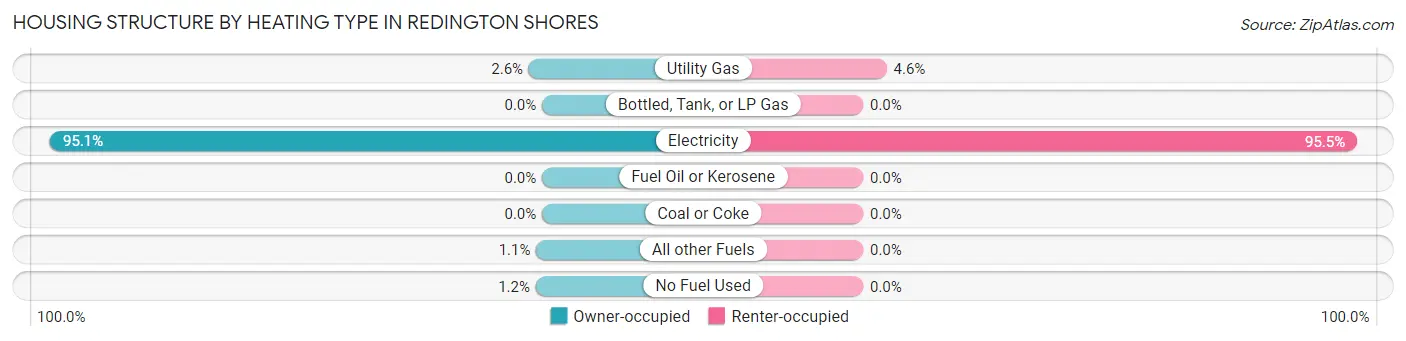
| Heating Type | Owner-occupied | Renter-occupied |
| Utility Gas | 25 (2.5%) | 8 (4.5%) |
| Bottled, Tank, or LP Gas | 0 (0.0%) | 0 (0.0%) |
| Electricity | 934 (95.1%) | 168 (95.5%) |
| Fuel Oil or Kerosene | 0 (0.0%) | 0 (0.0%) |
| Coal or Coke | 0 (0.0%) | 0 (0.0%) |
| All other Fuels | 11 (1.1%) | 0 (0.0%) |
| No Fuel Used | 12 (1.2%) | 0 (0.0%) |
| Total | 982 (100.0%) | 176 (100.0%) |
Household Vehicle Usage in Redington Shores
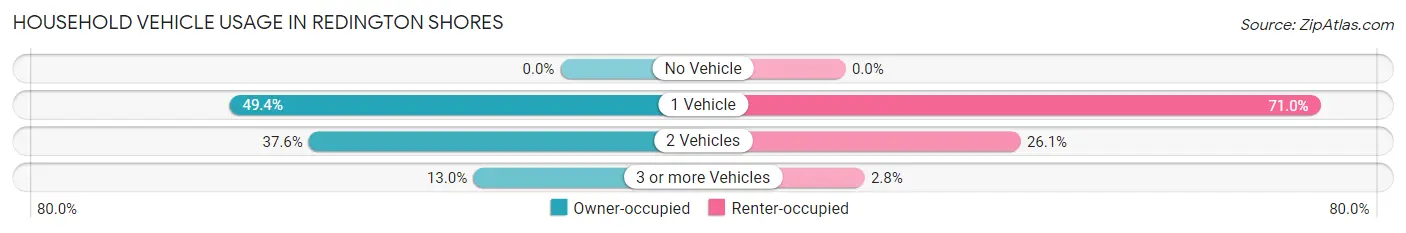
| Vehicles per Household | Owner-occupied | Renter-occupied |
| No Vehicle | 0 (0.0%) | 0 (0.0%) |
| 1 Vehicle | 485 (49.4%) | 125 (71.0%) |
| 2 Vehicles | 369 (37.6%) | 46 (26.1%) |
| 3 or more Vehicles | 128 (13.0%) | 5 (2.8%) |
| Total | 982 (100.0%) | 176 (100.0%) |
Real Estate & Mortgages in Redington Shores
Real Estate and Mortgage Overview in Redington Shores
| Characteristic | Without Mortgage | With Mortgage |
| Housing Units | 515 | 467 |
| Median Property Value | $696,700 | $633,600 |
| Median Household Income | $93,558 | $139 |
| Monthly Housing Costs | $950 | $231 |
| Real Estate Taxes | $4,176 | $13 |
Property Value by Mortgage Status in Redington Shores
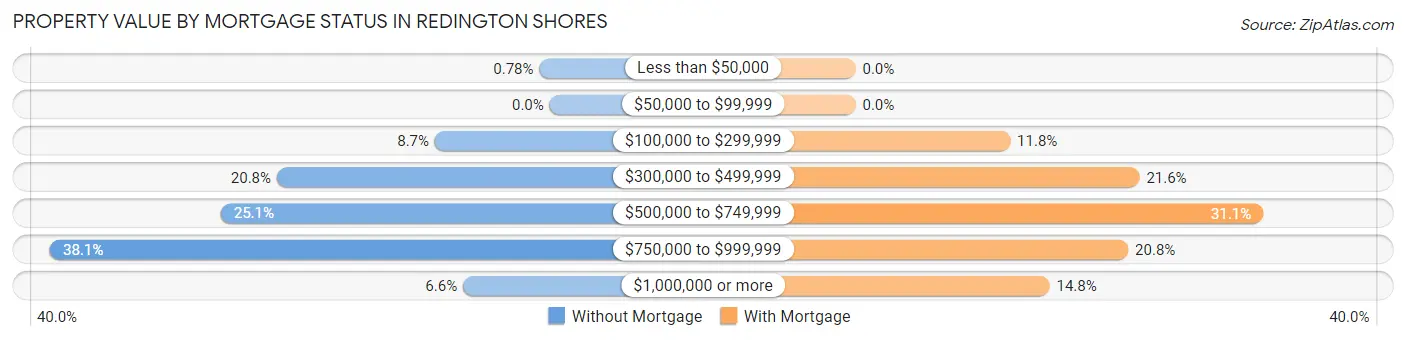
| Property Value | Without Mortgage | With Mortgage |
| Less than $50,000 | 4 (0.8%) | 0 (0.0%) |
| $50,000 to $99,999 | 0 (0.0%) | 0 (0.0%) |
| $100,000 to $299,999 | 45 (8.7%) | 55 (11.8%) |
| $300,000 to $499,999 | 107 (20.8%) | 101 (21.6%) |
| $500,000 to $749,999 | 129 (25.1%) | 145 (31.0%) |
| $750,000 to $999,999 | 196 (38.1%) | 97 (20.8%) |
| $1,000,000 or more | 34 (6.6%) | 69 (14.8%) |
| Total | 515 (100.0%) | 467 (100.0%) |
Household Income by Mortgage Status in Redington Shores
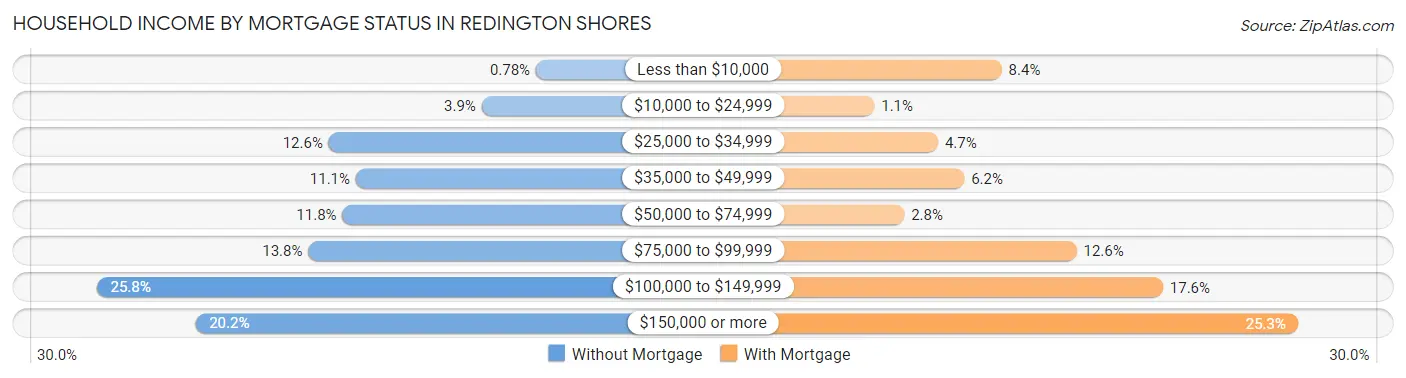
| Household Income | Without Mortgage | With Mortgage |
| Less than $10,000 | 4 (0.8%) | 39 (8.4%) |
| $10,000 to $24,999 | 20 (3.9%) | 5 (1.1%) |
| $25,000 to $34,999 | 65 (12.6%) | 22 (4.7%) |
| $35,000 to $49,999 | 57 (11.1%) | 29 (6.2%) |
| $50,000 to $74,999 | 61 (11.8%) | 13 (2.8%) |
| $75,000 to $99,999 | 71 (13.8%) | 59 (12.6%) |
| $100,000 to $149,999 | 133 (25.8%) | 82 (17.6%) |
| $150,000 or more | 104 (20.2%) | 118 (25.3%) |
| Total | 515 (100.0%) | 467 (100.0%) |
Property Value to Household Income Ratio in Redington Shores
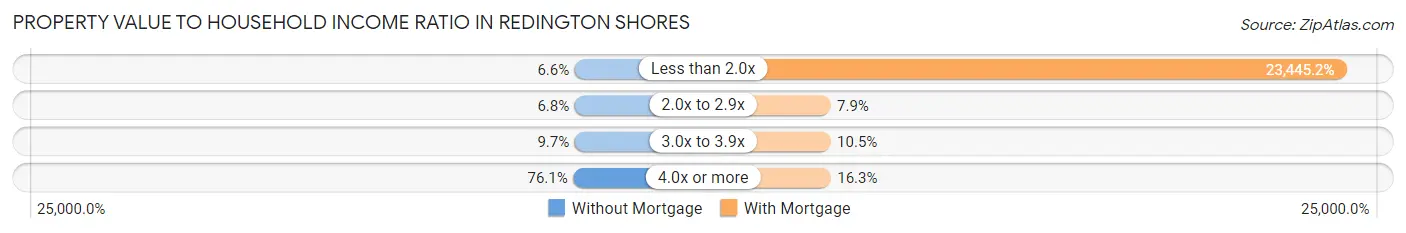
| Value-to-Income Ratio | Without Mortgage | With Mortgage |
| Less than 2.0x | 34 (6.6%) | 109,489 (23,445.2%) |
| 2.0x to 2.9x | 35 (6.8%) | 37 (7.9%) |
| 3.0x to 3.9x | 50 (9.7%) | 49 (10.5%) |
| 4.0x or more | 392 (76.1%) | 76 (16.3%) |
| Total | 515 (100.0%) | 467 (100.0%) |
Real Estate Taxes by Mortgage Status in Redington Shores
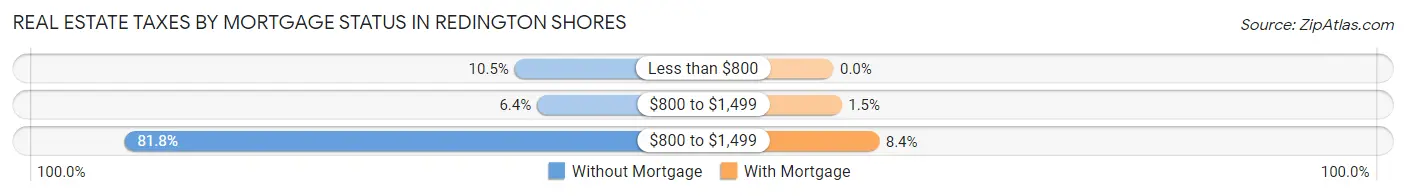
| Property Taxes | Without Mortgage | With Mortgage |
| Less than $800 | 54 (10.5%) | 0 (0.0%) |
| $800 to $1,499 | 33 (6.4%) | 7 (1.5%) |
| $800 to $1,499 | 421 (81.8%) | 39 (8.4%) |
| Total | 515 (100.0%) | 467 (100.0%) |
Health & Disability in Redington Shores
Health Insurance Coverage by Age in Redington Shores
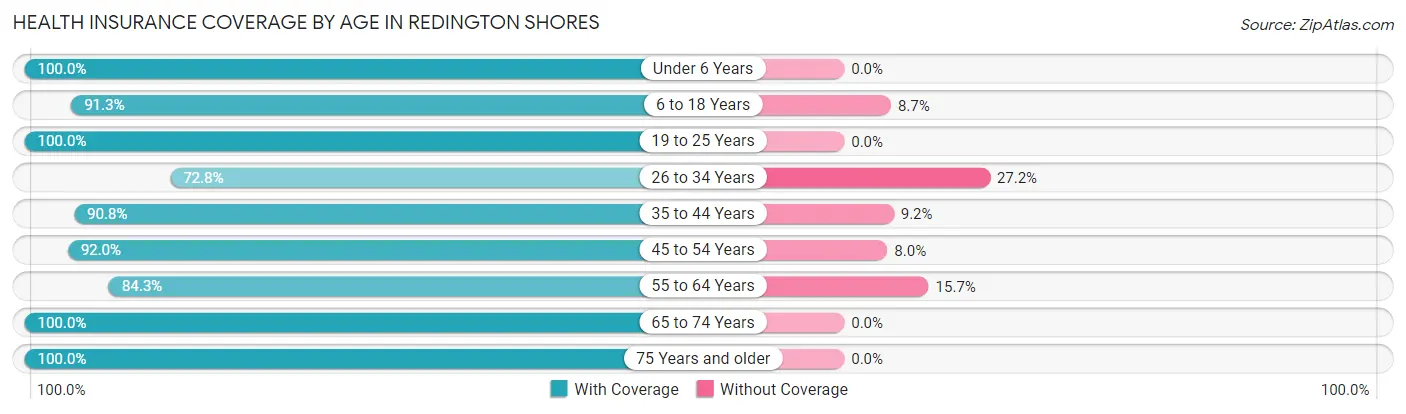
| Age Bracket | With Coverage | Without Coverage |
| Under 6 Years | 24 (100.0%) | 0 (0.0%) |
| 6 to 18 Years | 84 (91.3%) | 8 (8.7%) |
| 19 to 25 Years | 46 (100.0%) | 0 (0.0%) |
| 26 to 34 Years | 59 (72.8%) | 22 (27.2%) |
| 35 to 44 Years | 118 (90.8%) | 12 (9.2%) |
| 45 to 54 Years | 286 (92.0%) | 25 (8.0%) |
| 55 to 64 Years | 375 (84.3%) | 70 (15.7%) |
| 65 to 74 Years | 477 (100.0%) | 0 (0.0%) |
| 75 Years and older | 472 (100.0%) | 0 (0.0%) |
| Total | 1,941 (93.4%) | 137 (6.6%) |
Health Insurance Coverage by Citizenship Status in Redington Shores
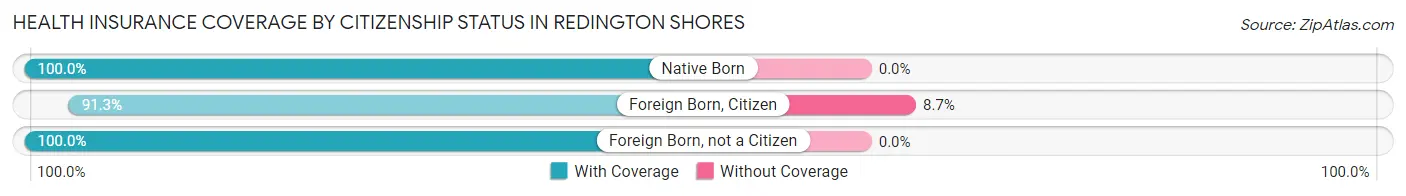
| Citizenship Status | With Coverage | Without Coverage |
| Native Born | 24 (100.0%) | 0 (0.0%) |
| Foreign Born, Citizen | 84 (91.3%) | 8 (8.7%) |
| Foreign Born, not a Citizen | 46 (100.0%) | 0 (0.0%) |
Health Insurance Coverage by Household Income in Redington Shores
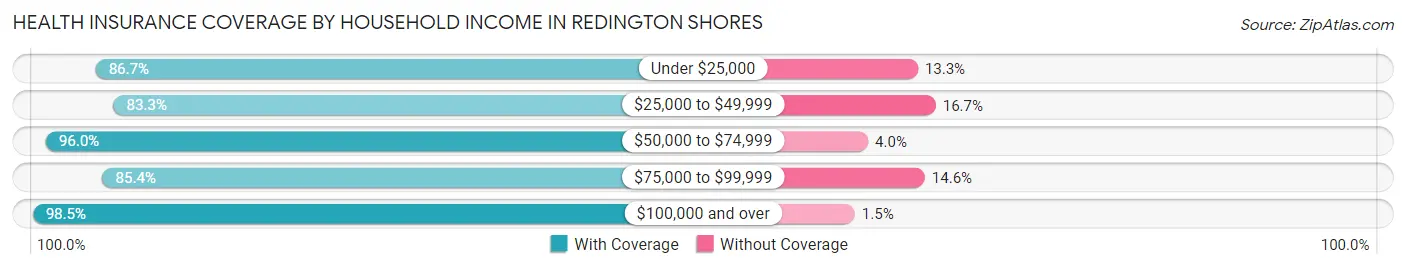
| Household Income | With Coverage | Without Coverage |
| Under $25,000 | 117 (86.7%) | 18 (13.3%) |
| $25,000 to $49,999 | 220 (83.3%) | 44 (16.7%) |
| $50,000 to $74,999 | 216 (96.0%) | 9 (4.0%) |
| $75,000 to $99,999 | 286 (85.4%) | 49 (14.6%) |
| $100,000 and over | 1,102 (98.5%) | 17 (1.5%) |
Public vs Private Health Insurance Coverage by Age in Redington Shores
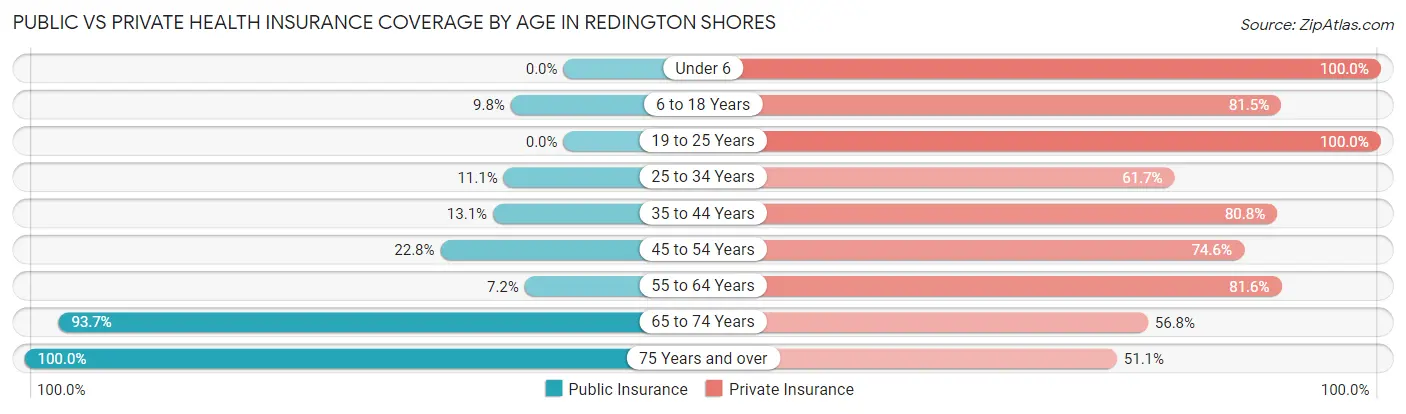
| Age Bracket | Public Insurance | Private Insurance |
| Under 6 | 0 (0.0%) | 24 (100.0%) |
| 6 to 18 Years | 9 (9.8%) | 75 (81.5%) |
| 19 to 25 Years | 0 (0.0%) | 46 (100.0%) |
| 25 to 34 Years | 9 (11.1%) | 50 (61.7%) |
| 35 to 44 Years | 17 (13.1%) | 105 (80.8%) |
| 45 to 54 Years | 71 (22.8%) | 232 (74.6%) |
| 55 to 64 Years | 32 (7.2%) | 363 (81.6%) |
| 65 to 74 Years | 447 (93.7%) | 271 (56.8%) |
| 75 Years and over | 472 (100.0%) | 241 (51.1%) |
| Total | 1,057 (50.9%) | 1,407 (67.7%) |
Disability Status by Sex by Age in Redington Shores
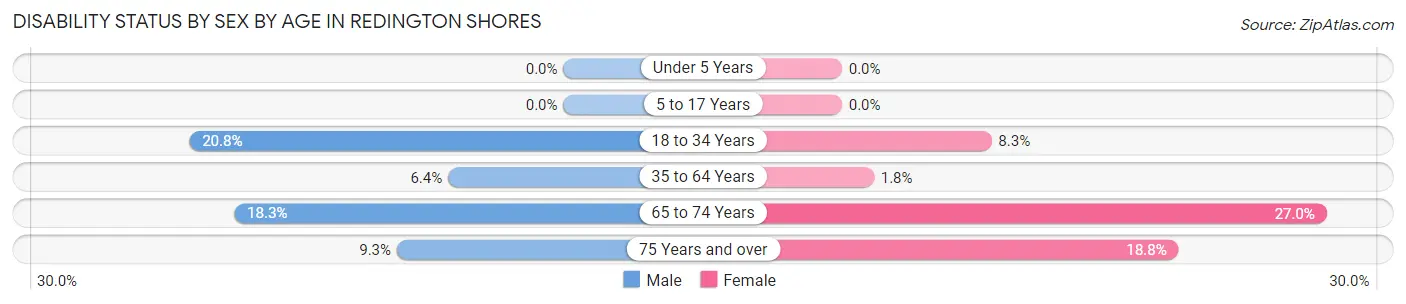
| Age Bracket | Male | Female |
| Under 5 Years | 0 (0.0%) | 0 (0.0%) |
| 5 to 17 Years | 0 (0.0%) | 0 (0.0%) |
| 18 to 34 Years | 15 (20.8%) | 5 (8.3%) |
| 35 to 64 Years | 28 (6.4%) | 8 (1.8%) |
| 65 to 74 Years | 44 (18.3%) | 64 (27.0%) |
| 75 Years and over | 23 (9.3%) | 42 (18.8%) |
Disability Class by Sex by Age in Redington Shores
Disability Class: Hearing Difficulty
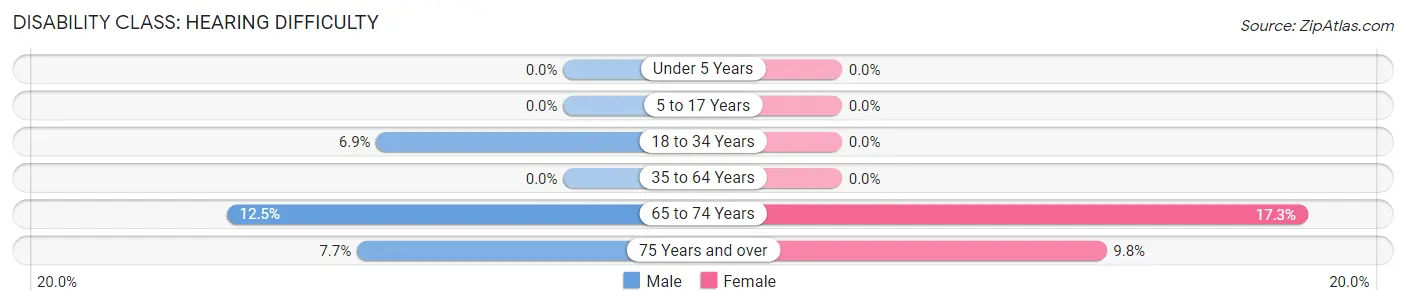
| Age Bracket | Male | Female |
| Under 5 Years | 0 (0.0%) | 0 (0.0%) |
| 5 to 17 Years | 0 (0.0%) | 0 (0.0%) |
| 18 to 34 Years | 5 (6.9%) | 0 (0.0%) |
| 35 to 64 Years | 0 (0.0%) | 0 (0.0%) |
| 65 to 74 Years | 30 (12.5%) | 41 (17.3%) |
| 75 Years and over | 19 (7.7%) | 22 (9.8%) |
Disability Class: Vision Difficulty
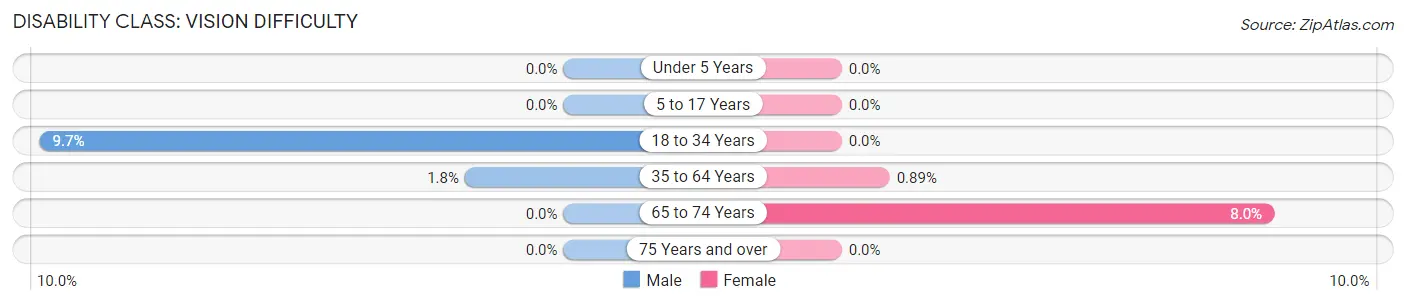
| Age Bracket | Male | Female |
| Under 5 Years | 0 (0.0%) | 0 (0.0%) |
| 5 to 17 Years | 0 (0.0%) | 0 (0.0%) |
| 18 to 34 Years | 7 (9.7%) | 0 (0.0%) |
| 35 to 64 Years | 8 (1.8%) | 4 (0.9%) |
| 65 to 74 Years | 0 (0.0%) | 19 (8.0%) |
| 75 Years and over | 0 (0.0%) | 0 (0.0%) |
Disability Class: Cognitive Difficulty
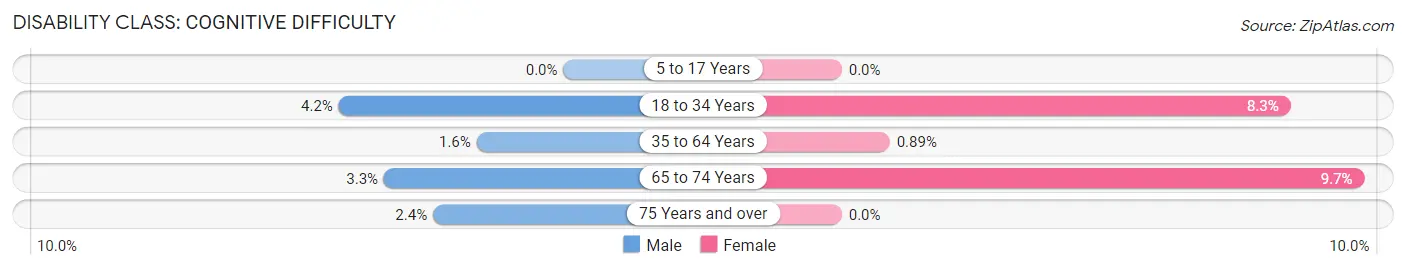
| Age Bracket | Male | Female |
| 5 to 17 Years | 0 (0.0%) | 0 (0.0%) |
| 18 to 34 Years | 3 (4.2%) | 5 (8.3%) |
| 35 to 64 Years | 7 (1.6%) | 4 (0.9%) |
| 65 to 74 Years | 8 (3.3%) | 23 (9.7%) |
| 75 Years and over | 6 (2.4%) | 0 (0.0%) |
Disability Class: Ambulatory Difficulty
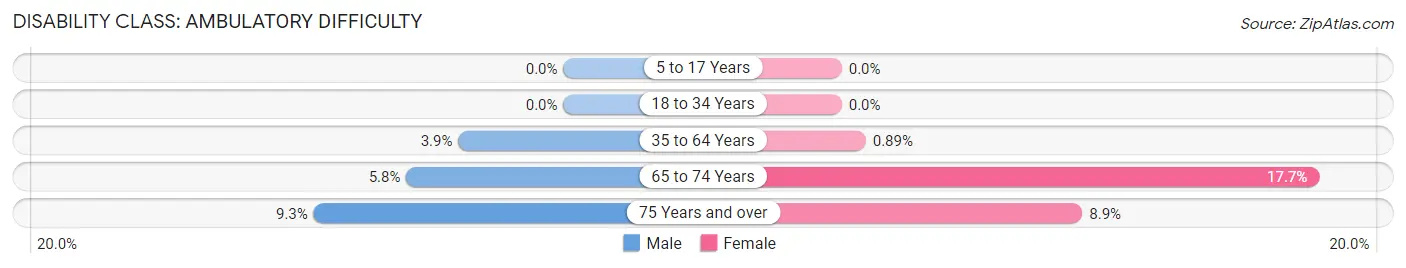
| Age Bracket | Male | Female |
| 5 to 17 Years | 0 (0.0%) | 0 (0.0%) |
| 18 to 34 Years | 0 (0.0%) | 0 (0.0%) |
| 35 to 64 Years | 17 (3.9%) | 4 (0.9%) |
| 65 to 74 Years | 14 (5.8%) | 42 (17.7%) |
| 75 Years and over | 23 (9.3%) | 20 (8.9%) |
Disability Class: Self-Care Difficulty
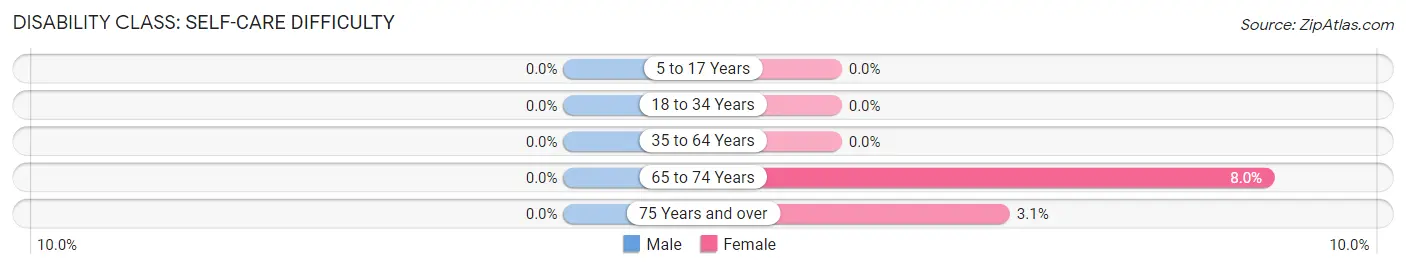
| Age Bracket | Male | Female |
| 5 to 17 Years | 0 (0.0%) | 0 (0.0%) |
| 18 to 34 Years | 0 (0.0%) | 0 (0.0%) |
| 35 to 64 Years | 0 (0.0%) | 0 (0.0%) |
| 65 to 74 Years | 0 (0.0%) | 19 (8.0%) |
| 75 Years and over | 0 (0.0%) | 7 (3.1%) |
Technology Access in Redington Shores
Computing Device Access in Redington Shores
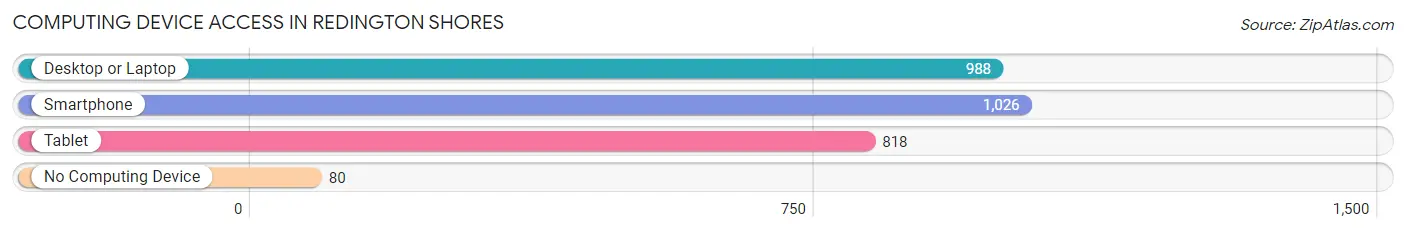
| Device Type | # Households | % Households |
| Desktop or Laptop | 988 | 85.3% |
| Smartphone | 1,026 | 88.6% |
| Tablet | 818 | 70.6% |
| No Computing Device | 80 | 6.9% |
| Total | 1,158 | 100.0% |
Internet Access in Redington Shores
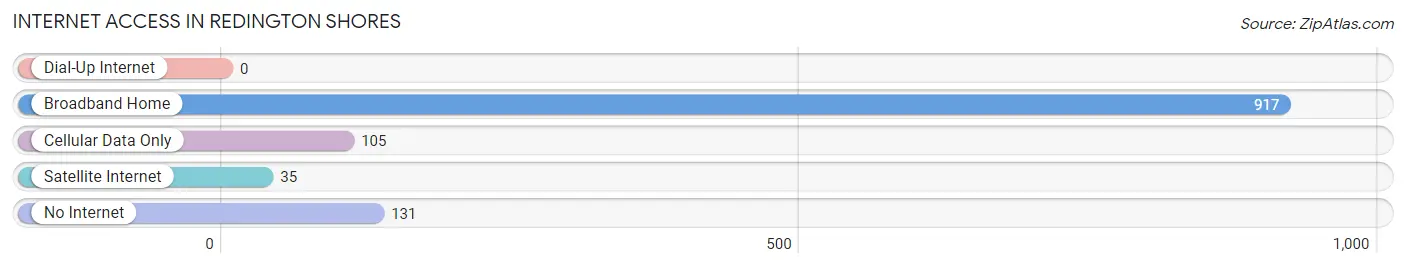
| Internet Type | # Households | % Households |
| Dial-Up Internet | 0 | 0.0% |
| Broadband Home | 917 | 79.2% |
| Cellular Data Only | 105 | 9.1% |
| Satellite Internet | 35 | 3.0% |
| No Internet | 131 | 11.3% |
| Total | 1,158 | 100.0% |
Redington Shores Summary
Redington Shores is a small town located in Pinellas County, Florida. It is situated on the Gulf of Mexico, just north of St. Petersburg and south of Clearwater. The town has a population of approximately 2,500 people and is a popular tourist destination due to its beautiful beaches and close proximity to Tampa Bay.
Geography
Redington Shores is located on the Gulf of Mexico, just north of St. Petersburg and south of Clearwater. The town is situated on a barrier island, which is bordered by the Intracoastal Waterway to the east and the Gulf of Mexico to the west. The town is approximately 2.5 miles long and 0.5 miles wide. The terrain is mostly flat, with some areas of low-lying marshland. The town is home to several parks, including Redington Shores Beach Park, which offers a variety of recreational activities such as swimming, fishing, and sunbathing.
History
Redington Shores was first settled in the late 1800s by a group of fishermen from the Bahamas. The town was originally known as Redington Beach, and was later renamed Redington Shores in the early 1900s. The town was incorporated in 1925 and has since grown to become a popular tourist destination.
Economy
Redington Shores is primarily a tourist destination, with many visitors coming to enjoy the town’s beautiful beaches and close proximity to Tampa Bay. The town is also home to several businesses, including restaurants, hotels, and retail stores. The town’s economy is largely dependent on tourism, and the town’s population increases significantly during the summer months.
Demographics
As of the 2010 census, Redington Shores had a population of 2,500 people. The town is predominantly white, with approximately 75% of the population identifying as such. The town also has a significant Hispanic population, with approximately 15% of the population identifying as Hispanic or Latino. The median household income in Redington Shores is $50,000, and the median age is 45.
Conclusion
Redington Shores is a small town located in Pinellas County, Florida. It is situated on the Gulf of Mexico, just north of St. Petersburg and south of Clearwater. The town has a population of approximately 2,500 people and is a popular tourist destination due to its beautiful beaches and close proximity to Tampa Bay. The town’s economy is largely dependent on tourism, and the town’s population increases significantly during the summer months. Redington Shores is predominantly white, with approximately 75% of the population identifying as such. The town also has a significant Hispanic population, with approximately 15% of the population identifying as Hispanic or Latino.
Common Questions
What is Per Capita Income in Redington Shores?
Per Capita income in Redington Shores is $78,670.
What is the Median Family Income in Redington Shores?
Median Family Income in Redington Shores is $112,679.
What is the Median Household income in Redington Shores?
Median Household Income in Redington Shores is $96,250.
What is Income or Wage Gap in Redington Shores?
Income or Wage Gap in Redington Shores is 20.6%.
Women in Redington Shores earn 79.4 cents for every dollar earned by a man.
What is Family Income Deficit in Redington Shores?
Family Income Deficit in Redington Shores is $6,762.
Families that are below poverty line in Redington Shores earn $6,762 less on average than the poverty threshold level.
What is Inequality or Gini Index in Redington Shores?
Inequality or Gini Index in Redington Shores is 0.49.
What is the Total Population of Redington Shores?
Total Population of Redington Shores is 2,078.
What is the Total Male Population of Redington Shores?
Total Male Population of Redington Shores is 1,023.
What is the Total Female Population of Redington Shores?
Total Female Population of Redington Shores is 1,055.
What is the Ratio of Males per 100 Females in Redington Shores?
There are 96.97 Males per 100 Females in Redington Shores.
What is the Ratio of Females per 100 Males in Redington Shores?
There are 103.13 Females per 100 Males in Redington Shores.
What is the Median Population Age in Redington Shores?
Median Population Age in Redington Shores is 63.0 Years.
What is the Average Family Size in Redington Shores
Average Family Size in Redington Shores is 2.4 People.
What is the Average Household Size in Redington Shores
Average Household Size in Redington Shores is 1.8 People.
How Large is the Labor Force in Redington Shores?
There are 903 People in the Labor Forcein in Redington Shores.
What is the Percentage of People in the Labor Force in Redington Shores?
45.6% of People are in the Labor Force in Redington Shores.
What is the Unemployment Rate in Redington Shores?
Unemployment Rate in Redington Shores is 1.9%.