St Pete Beach, FL Map & Demographics
St Pete Beach Map
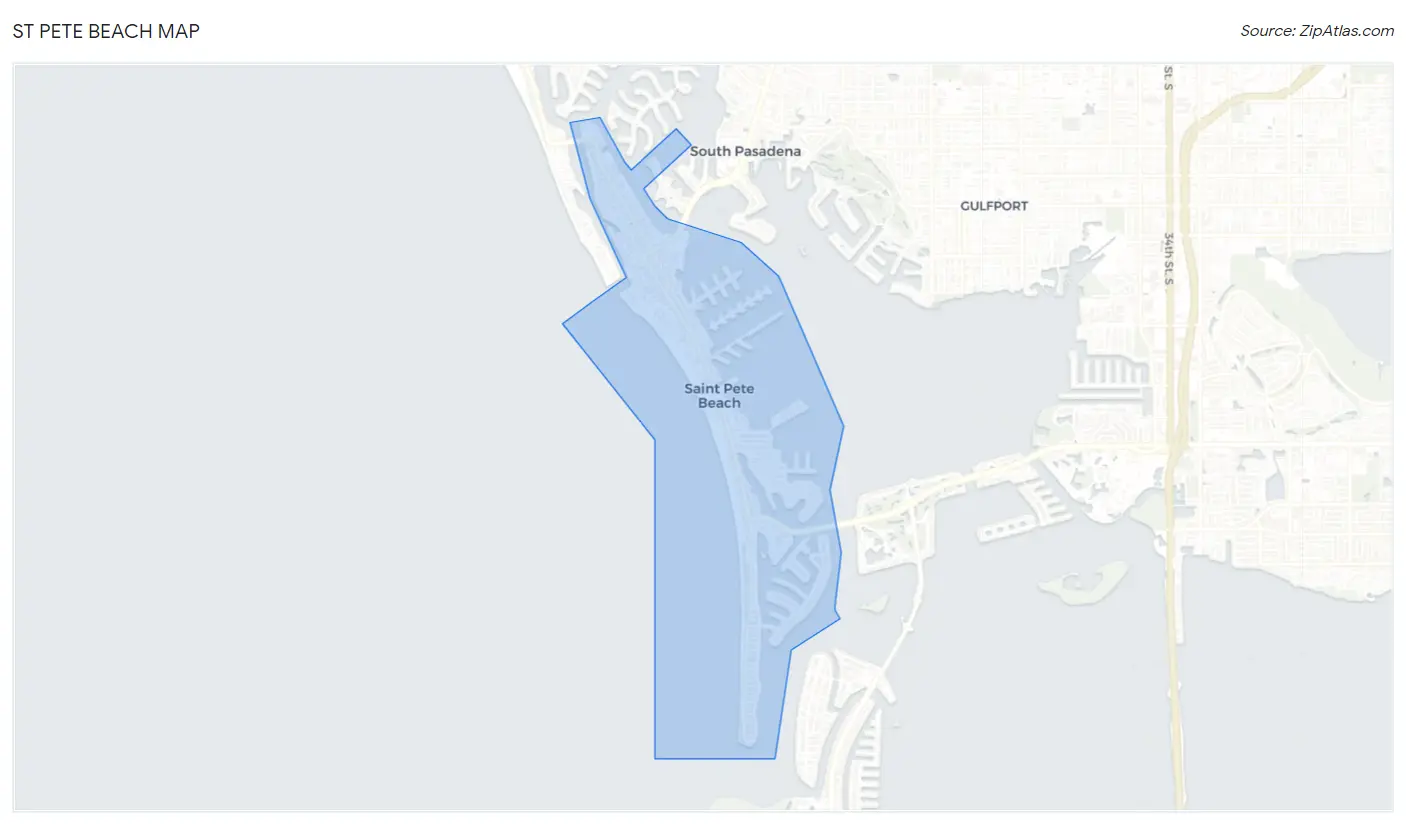
St Pete Beach Overview
$89,826
PER CAPITA INCOME
$167,383
AVG FAMILY INCOME
$112,578
AVG HOUSEHOLD INCOME
49.1%
WAGE / INCOME GAP [ % ]
50.9¢/ $1
WAGE / INCOME GAP [ $ ]
$13,132
FAMILY INCOME DEFICIT
0.53
INEQUALITY / GINI INDEX
8,905
TOTAL POPULATION
4,650
MALE POPULATION
4,255
FEMALE POPULATION
109.28
MALES / 100 FEMALES
91.51
FEMALES / 100 MALES
61.5
MEDIAN AGE
2.4
AVG FAMILY SIZE
1.9
AVG HOUSEHOLD SIZE
4,145
LABOR FORCE [ PEOPLE ]
49.2%
PERCENT IN LABOR FORCE
5.7%
UNEMPLOYMENT RATE
St Pete Beach Area Codes
Income in St Pete Beach
Income Overview in St Pete Beach
Per Capita Income in St Pete Beach is $89,826, while median incomes of families and households are $167,383 and $112,578 respectively.
| Characteristic | Number | Measure |
| Per Capita Income | 8,905 | $89,826 |
| Median Family Income | 2,793 | $167,383 |
| Mean Family Income | 2,793 | $230,247 |
| Median Household Income | 4,552 | $112,578 |
| Mean Household Income | 4,552 | $176,549 |
| Income Deficit | 2,793 | $13,132 |
| Wage / Income Gap (%) | 8,905 | 49.08% |
| Wage / Income Gap ($) | 8,905 | 50.92¢ per $1 |
| Gini / Inequality Index | 8,905 | 0.53 |
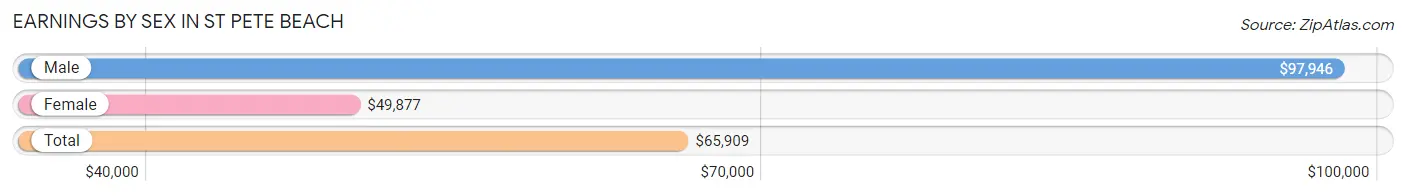
Earnings by Sex in St Pete Beach
Average Earnings in St Pete Beach are $65,909, $97,946 for men and $49,877 for women, a difference of 49.1%.
| Sex | Number | Average Earnings |
| Male | 2,460 (57.1%) | $97,946 |
| Female | 1,852 (42.9%) | $49,877 |
| Total | 4,312 (100.0%) | $65,909 |
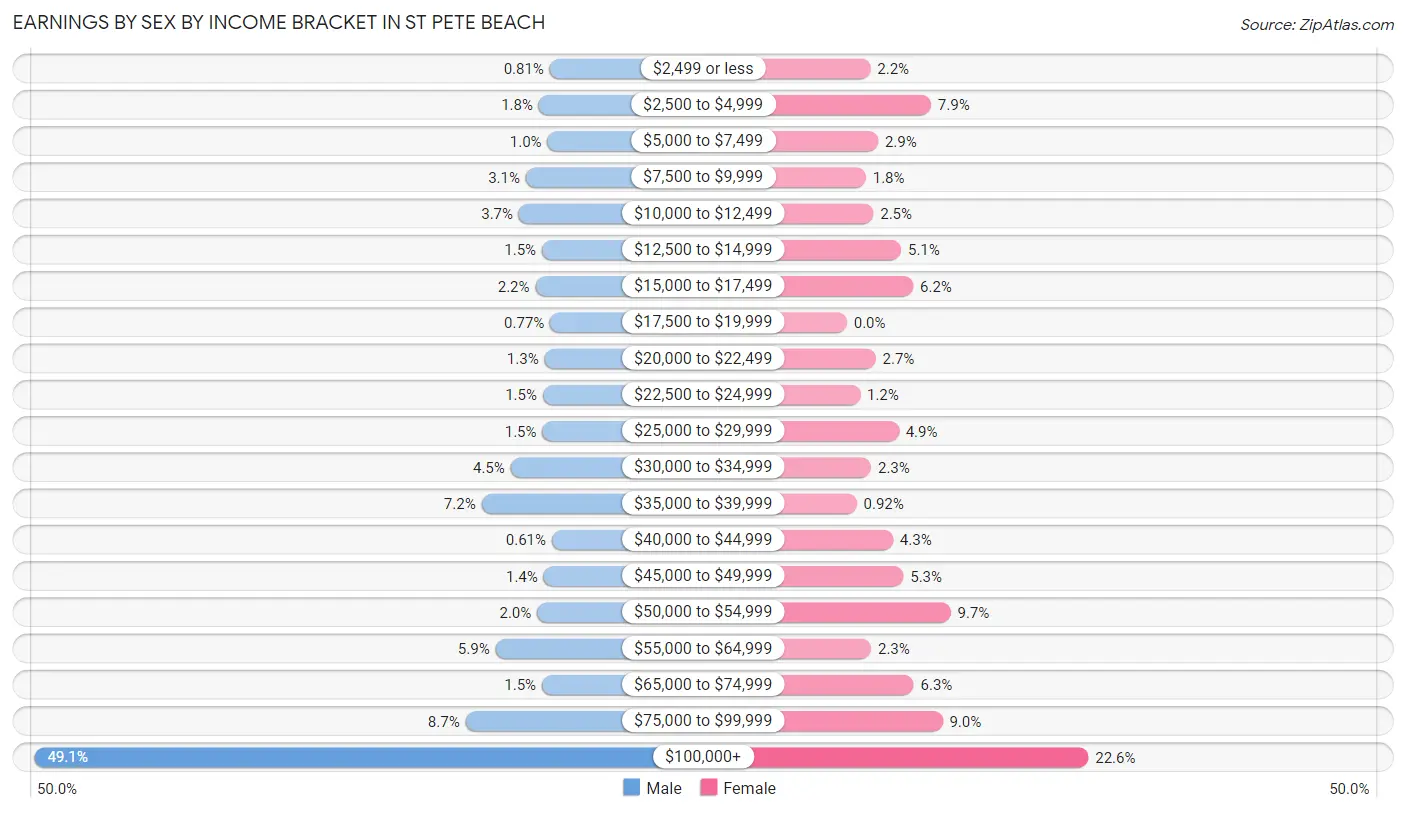
Earnings by Sex by Income Bracket in St Pete Beach
The most common earnings brackets in St Pete Beach are $100,000+ for men (1,207 | 49.1%) and $100,000+ for women (419 | 22.6%).
| Income | Male | Female |
| $2,499 or less | 20 (0.8%) | 41 (2.2%) |
| $2,500 to $4,999 | 45 (1.8%) | 146 (7.9%) |
| $5,000 to $7,499 | 25 (1.0%) | 54 (2.9%) |
| $7,500 to $9,999 | 75 (3.0%) | 33 (1.8%) |
| $10,000 to $12,499 | 91 (3.7%) | 46 (2.5%) |
| $12,500 to $14,999 | 38 (1.5%) | 94 (5.1%) |
| $15,000 to $17,499 | 53 (2.1%) | 115 (6.2%) |
| $17,500 to $19,999 | 19 (0.8%) | 0 (0.0%) |
| $20,000 to $22,499 | 32 (1.3%) | 50 (2.7%) |
| $22,500 to $24,999 | 36 (1.5%) | 23 (1.2%) |
| $25,000 to $29,999 | 37 (1.5%) | 90 (4.9%) |
| $30,000 to $34,999 | 110 (4.5%) | 42 (2.3%) |
| $35,000 to $39,999 | 177 (7.2%) | 17 (0.9%) |
| $40,000 to $44,999 | 15 (0.6%) | 80 (4.3%) |
| $45,000 to $49,999 | 34 (1.4%) | 98 (5.3%) |
| $50,000 to $54,999 | 49 (2.0%) | 180 (9.7%) |
| $55,000 to $64,999 | 145 (5.9%) | 42 (2.3%) |
| $65,000 to $74,999 | 38 (1.5%) | 116 (6.3%) |
| $75,000 to $99,999 | 214 (8.7%) | 166 (9.0%) |
| $100,000+ | 1,207 (49.1%) | 419 (22.6%) |
| Total | 2,460 (100.0%) | 1,852 (100.0%) |
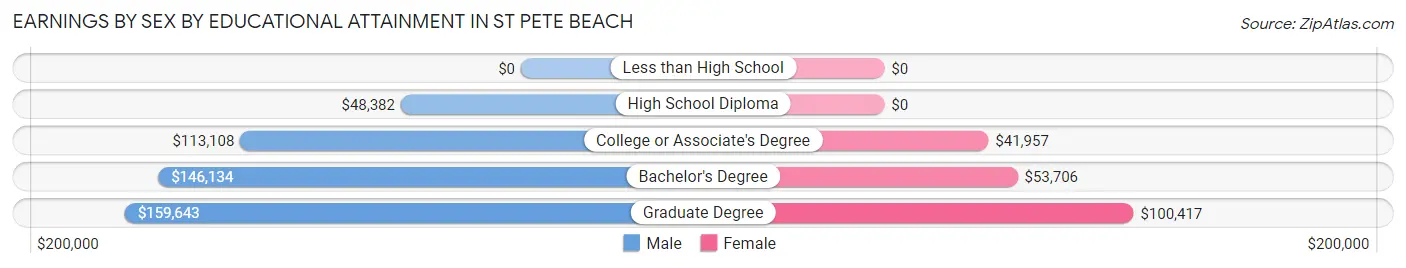
Earnings by Sex by Educational Attainment in St Pete Beach
Average earnings in St Pete Beach are $112,552 for men and $51,733 for women, a difference of 54.0%. Men with an educational attainment of graduate degree enjoy the highest average annual earnings of $159,643, while those with high school diploma education earn the least with $48,382. Women with an educational attainment of graduate degree earn the most with the average annual earnings of $100,417, while those with college or associate's degree education have the smallest earnings of $41,957.
| Educational Attainment | Male Income | Female Income |
| Less than High School | - | - |
| High School Diploma | $48,382 | $0 |
| College or Associate's Degree | $113,108 | $41,957 |
| Bachelor's Degree | $146,134 | $53,706 |
| Graduate Degree | $159,643 | $100,417 |
| Total | $112,552 | $51,733 |
Family Income in St Pete Beach
Family Income Brackets in St Pete Beach
According to the St Pete Beach family income data, there are 978 families falling into the $200,000+ income range, which is the most common income bracket and makes up 35.0% of all families.
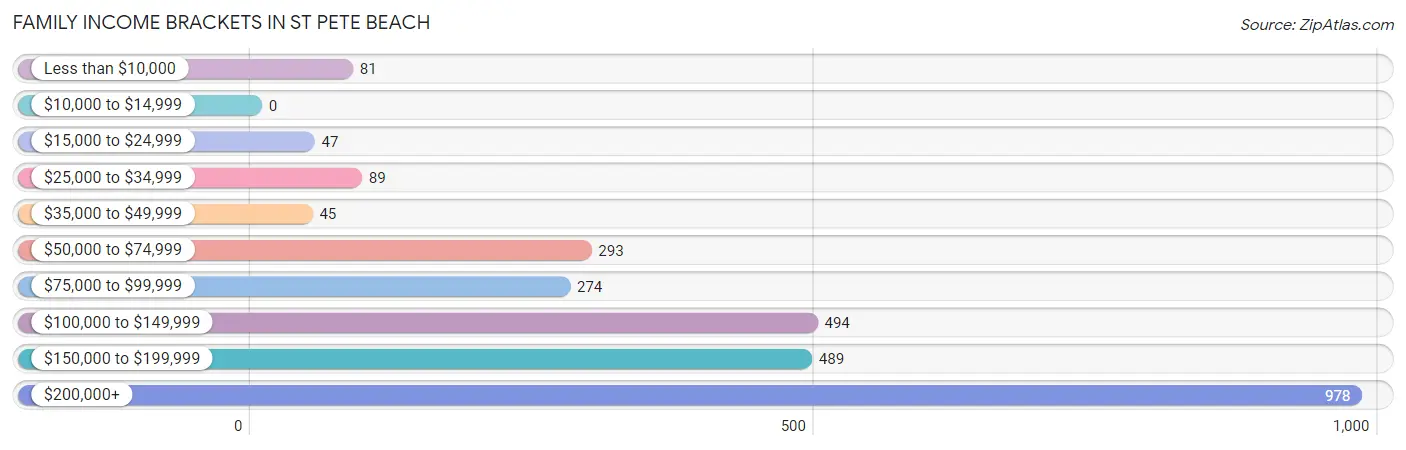
| Income Bracket | # Families | % Families |
| Less than $10,000 | 81 | 2.9% |
| $10,000 to $14,999 | 0 | 0.0% |
| $15,000 to $24,999 | 47 | 1.7% |
| $25,000 to $34,999 | 89 | 3.2% |
| $35,000 to $49,999 | 45 | 1.6% |
| $50,000 to $74,999 | 293 | 10.5% |
| $75,000 to $99,999 | 274 | 9.8% |
| $100,000 to $149,999 | 494 | 17.7% |
| $150,000 to $199,999 | 489 | 17.5% |
| $200,000+ | 978 | 35.0% |
Family Income by Famaliy Size in St Pete Beach
5-person families (65 | 2.3%) account for the highest median family income in St Pete Beach with $250,001 per family, while 2-person families (2,217 | 79.4%) have the highest median income of $73,902 per family member.
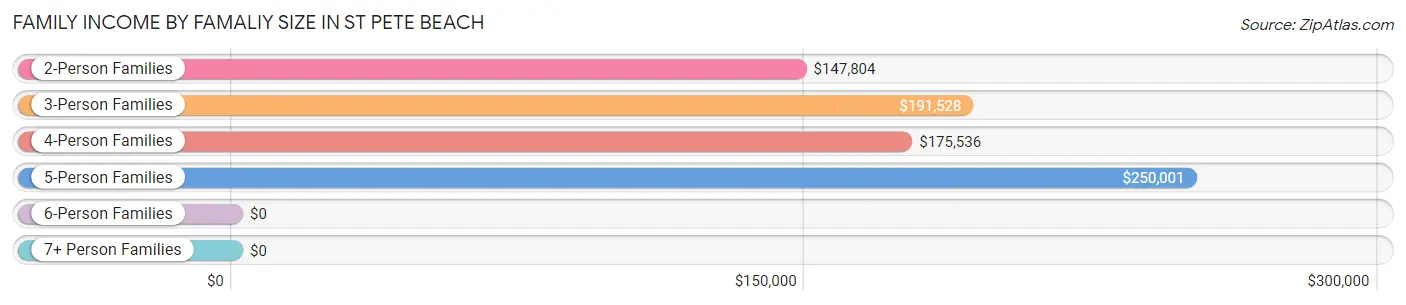
| Income Bracket | # Families | Median Income |
| 2-Person Families | 2,217 (79.4%) | $147,804 |
| 3-Person Families | 295 (10.6%) | $191,528 |
| 4-Person Families | 216 (7.7%) | $175,536 |
| 5-Person Families | 65 (2.3%) | $250,001 |
| 6-Person Families | 0 (0.0%) | $0 |
| 7+ Person Families | 0 (0.0%) | $0 |
| Total | 2,793 (100.0%) | $167,383 |
Family Income by Number of Earners in St Pete Beach
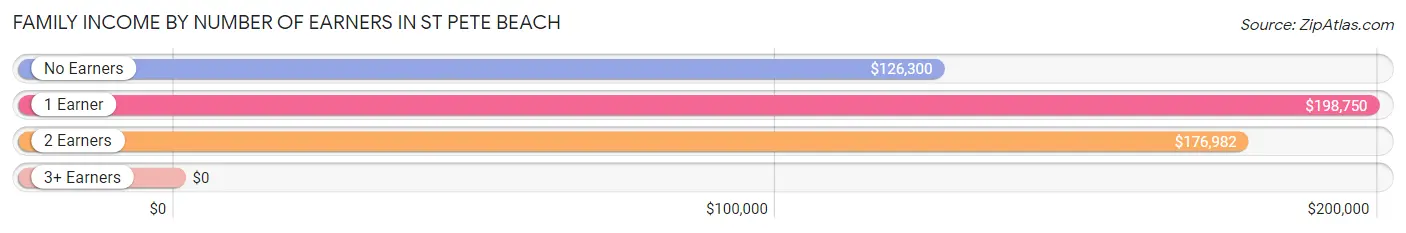
| Number of Earners | # Families | Median Income |
| No Earners | 1,134 (40.6%) | $126,300 |
| 1 Earner | 548 (19.6%) | $198,750 |
| 2 Earners | 937 (33.6%) | $176,982 |
| 3+ Earners | 174 (6.2%) | $0 |
| Total | 2,793 (100.0%) | $167,383 |
Household Income in St Pete Beach
Household Income Brackets in St Pete Beach
With 1,138 households falling in the category, the $200,000+ income range is the most frequent in St Pete Beach, accounting for 25.0% of all households. In contrast, only 46 households (1.0%) fall into the $10,000 to $14,999 income bracket, making it the least populous group.
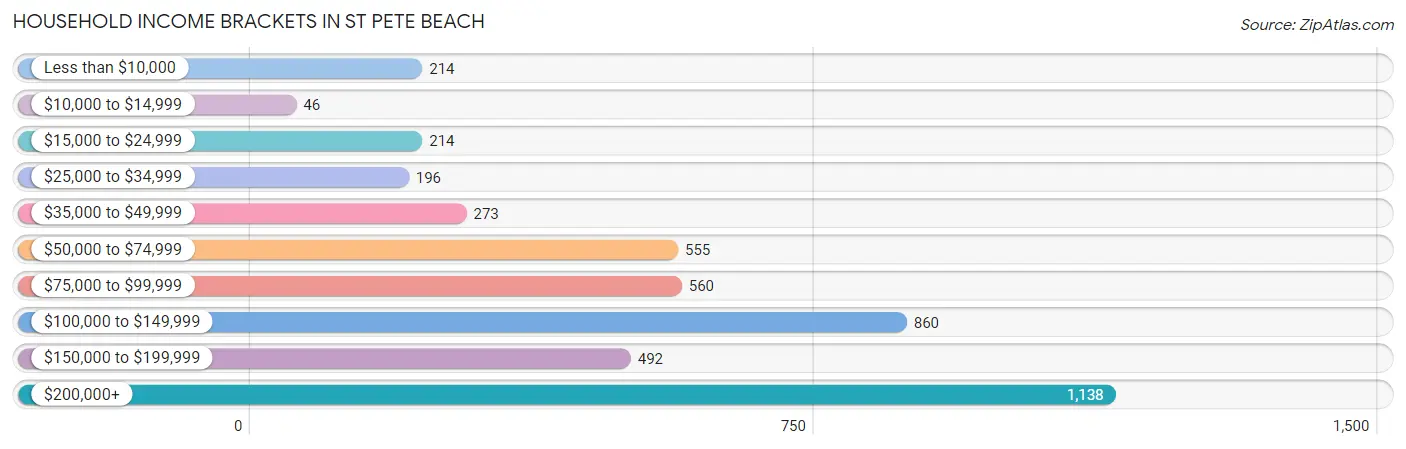
| Income Bracket | # Households | % Households |
| Less than $10,000 | 214 | 4.7% |
| $10,000 to $14,999 | 46 | 1.0% |
| $15,000 to $24,999 | 214 | 4.7% |
| $25,000 to $34,999 | 196 | 4.3% |
| $35,000 to $49,999 | 273 | 6.0% |
| $50,000 to $74,999 | 555 | 12.2% |
| $75,000 to $99,999 | 560 | 12.3% |
| $100,000 to $149,999 | 860 | 18.9% |
| $150,000 to $199,999 | 492 | 10.8% |
| $200,000+ | 1,138 | 25.0% |
Household Income by Householder Age in St Pete Beach
The median household income in St Pete Beach is $112,578, with the highest median household income of $132,816 found in the 45 to 64 years age bracket for the primary householder. A total of 1,918 households (42.1%) fall into this category. Meanwhile, the 15 to 24 years age bracket for the primary householder has the lowest median household income of $0, with 6 households (0.1%) in this group.
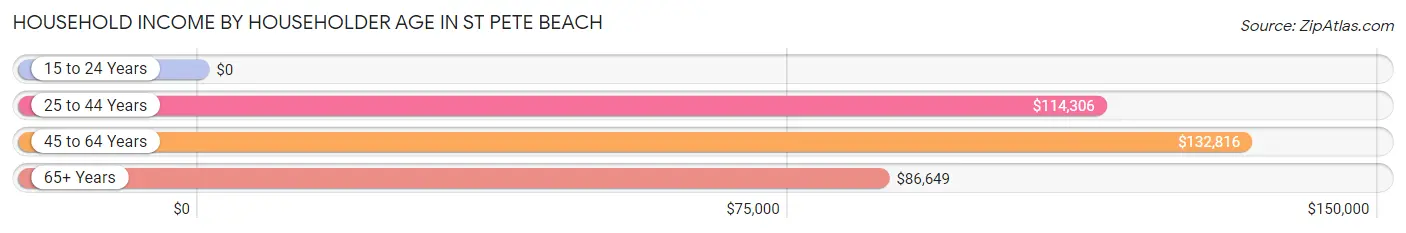
| Income Bracket | # Households | Median Income |
| 15 to 24 Years | 6 (0.1%) | $0 |
| 25 to 44 Years | 404 (8.9%) | $114,306 |
| 45 to 64 Years | 1,918 (42.1%) | $132,816 |
| 65+ Years | 2,224 (48.9%) | $86,649 |
| Total | 4,552 (100.0%) | $112,578 |
Poverty in St Pete Beach
Income Below Poverty by Sex and Age in St Pete Beach
With 5.9% poverty level for males and 6.4% for females among the residents of St Pete Beach, 65 to 74 year old males and 65 to 74 year old females are the most vulnerable to poverty, with 111 males (15.8%) and 99 females (11.4%) in their respective age groups living below the poverty level.
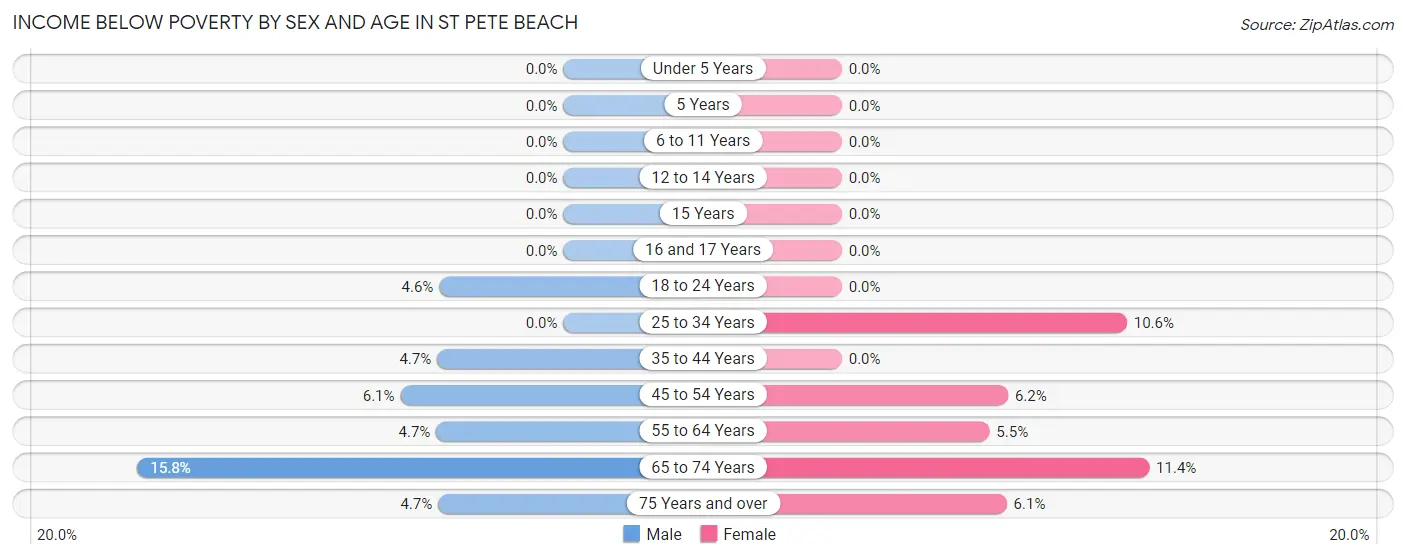
| Age Bracket | Male | Female |
| Under 5 Years | 0 (0.0%) | 0 (0.0%) |
| 5 Years | 0 (0.0%) | 0 (0.0%) |
| 6 to 11 Years | 0 (0.0%) | 0 (0.0%) |
| 12 to 14 Years | 0 (0.0%) | 0 (0.0%) |
| 15 Years | 0 (0.0%) | 0 (0.0%) |
| 16 and 17 Years | 0 (0.0%) | 0 (0.0%) |
| 18 to 24 Years | 14 (4.6%) | 0 (0.0%) |
| 25 to 34 Years | 0 (0.0%) | 20 (10.6%) |
| 35 to 44 Years | 13 (4.7%) | 0 (0.0%) |
| 45 to 54 Years | 32 (6.0%) | 41 (6.2%) |
| 55 to 64 Years | 54 (4.7%) | 57 (5.5%) |
| 65 to 74 Years | 111 (15.8%) | 99 (11.4%) |
| 75 Years and over | 52 (4.6%) | 54 (6.1%) |
| Total | 276 (5.9%) | 271 (6.4%) |
Income Above Poverty by Sex and Age in St Pete Beach
According to the poverty statistics in St Pete Beach, males aged under 5 years and females aged under 5 years are the age groups that are most secure financially, with 100.0% of males and 100.0% of females in these age groups living above the poverty line.
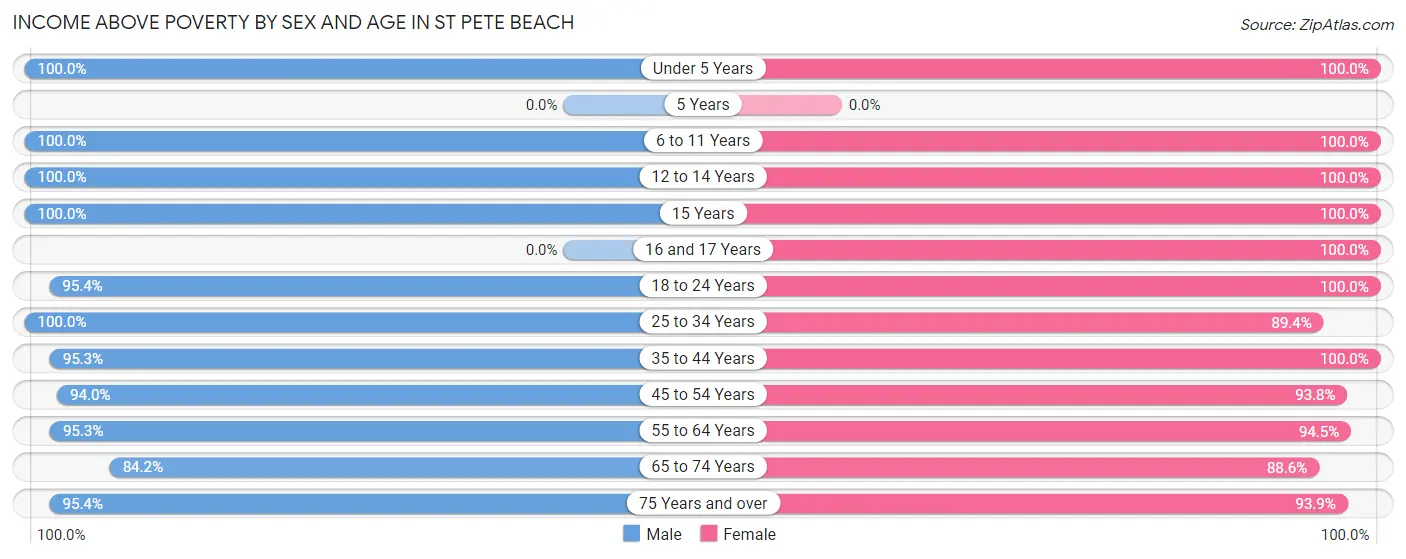
| Age Bracket | Male | Female |
| Under 5 Years | 22 (100.0%) | 25 (100.0%) |
| 5 Years | 0 (0.0%) | 0 (0.0%) |
| 6 to 11 Years | 69 (100.0%) | 129 (100.0%) |
| 12 to 14 Years | 101 (100.0%) | 41 (100.0%) |
| 15 Years | 34 (100.0%) | 56 (100.0%) |
| 16 and 17 Years | 0 (0.0%) | 42 (100.0%) |
| 18 to 24 Years | 290 (95.4%) | 104 (100.0%) |
| 25 to 34 Years | 345 (100.0%) | 169 (89.4%) |
| 35 to 44 Years | 264 (95.3%) | 215 (100.0%) |
| 45 to 54 Years | 497 (94.0%) | 623 (93.8%) |
| 55 to 64 Years | 1,091 (95.3%) | 983 (94.5%) |
| 65 to 74 Years | 591 (84.2%) | 769 (88.6%) |
| 75 Years and over | 1,066 (95.4%) | 828 (93.9%) |
| Total | 4,370 (94.1%) | 3,984 (93.6%) |
Income Below Poverty Among Married-Couple Families in St Pete Beach
The poverty statistics for married-couple families in St Pete Beach show that 3.7% or 96 of the total 2,574 families live below the poverty line. Families with no children have the highest poverty rate of 4.2%, comprising of 96 families. On the other hand, families with 1 or 2 children have the lowest poverty rate of 0.0%, which includes 0 families.
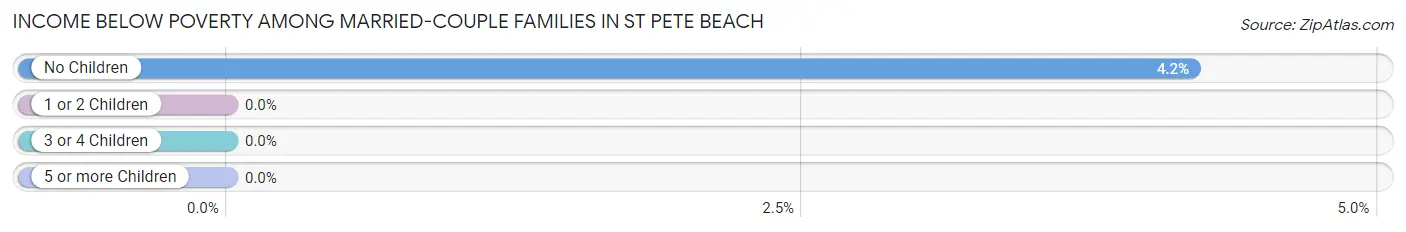
| Children | Above Poverty | Below Poverty |
| No Children | 2,194 (95.8%) | 96 (4.2%) |
| 1 or 2 Children | 273 (100.0%) | 0 (0.0%) |
| 3 or 4 Children | 11 (100.0%) | 0 (0.0%) |
| 5 or more Children | 0 (0.0%) | 0 (0.0%) |
| Total | 2,478 (96.3%) | 96 (3.7%) |
Income Below Poverty Among Single-Parent Households in St Pete Beach
| Children | Single Father | Single Mother |
| No Children | 0 (0.0%) | 0 (0.0%) |
| 1 or 2 Children | 0 (0.0%) | 0 (0.0%) |
| 3 or 4 Children | 0 (0.0%) | 0 (0.0%) |
| 5 or more Children | 0 (0.0%) | 0 (0.0%) |
| Total | 0 (0.0%) | 0 (0.0%) |
Income Below Poverty Among Married-Couple vs Single-Parent Households in St Pete Beach
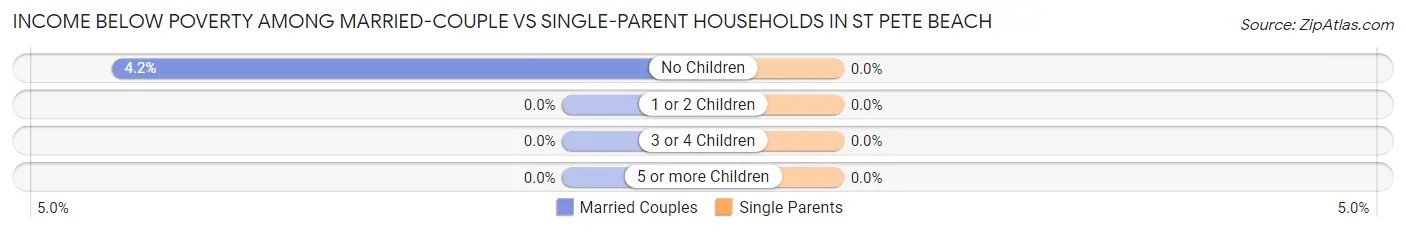
| Children | Married-Couple Families | Single-Parent Households |
| No Children | 96 (4.2%) | 0 (0.0%) |
| 1 or 2 Children | 0 (0.0%) | 0 (0.0%) |
| 3 or 4 Children | 0 (0.0%) | 0 (0.0%) |
| 5 or more Children | 0 (0.0%) | 0 (0.0%) |
| Total | 96 (3.7%) | 0 (0.0%) |
Race in St Pete Beach
The most populous races in St Pete Beach are White / Caucasian (8,097 | 90.9%), Hispanic or Latino (452 | 5.1%), and Two or more Races (392 | 4.4%).
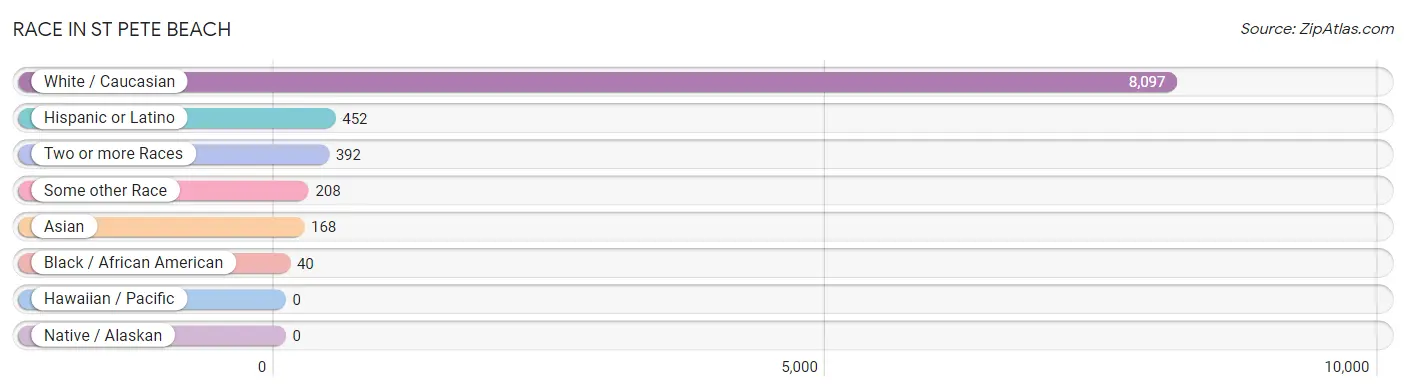
| Race | # Population | % Population |
| Asian | 168 | 1.9% |
| Black / African American | 40 | 0.4% |
| Hawaiian / Pacific | 0 | 0.0% |
| Hispanic or Latino | 452 | 5.1% |
| Native / Alaskan | 0 | 0.0% |
| White / Caucasian | 8,097 | 90.9% |
| Two or more Races | 392 | 4.4% |
| Some other Race | 208 | 2.3% |
| Total | 8,905 | 100.0% |
Ancestry in St Pete Beach
The most populous ancestries reported in St Pete Beach are English (1,582 | 17.8%), German (1,348 | 15.1%), Irish (1,253 | 14.1%), American (966 | 10.8%), and Italian (877 | 9.9%), together accounting for 67.7% of all St Pete Beach residents.
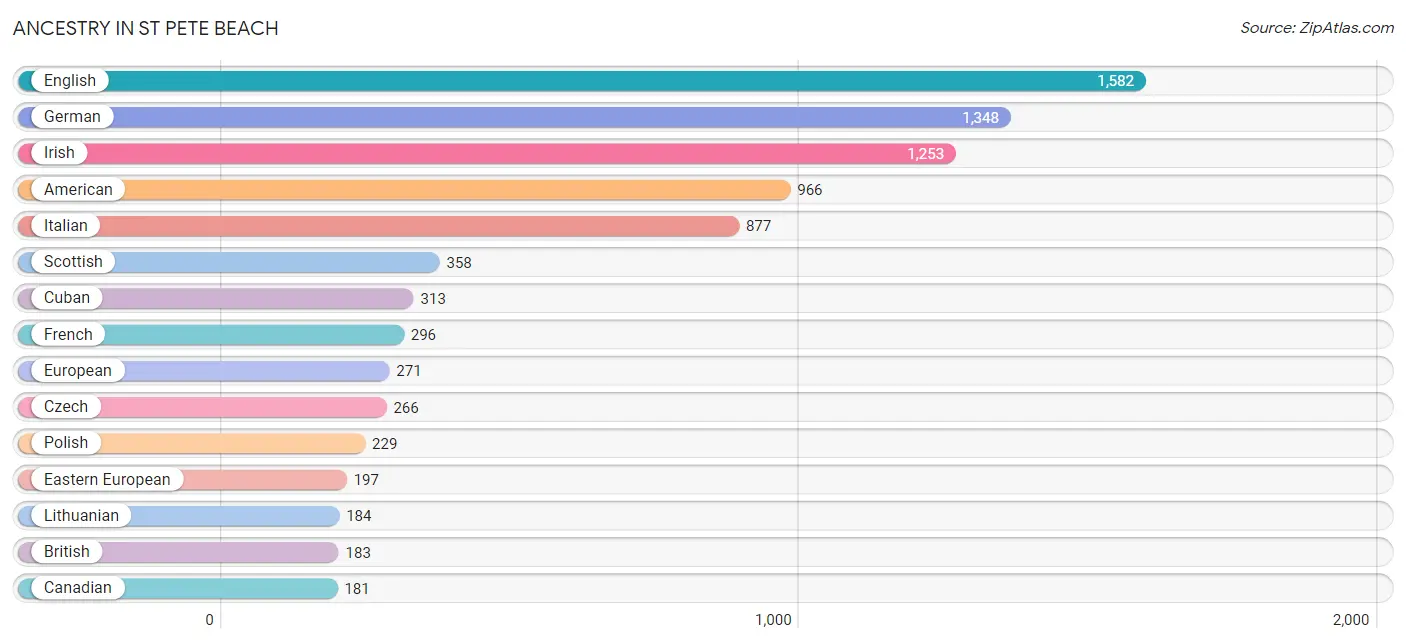
| Ancestry | # Population | % Population |
| American | 966 | 10.8% |
| Apache | 5 | 0.1% |
| Arab | 28 | 0.3% |
| Austrian | 7 | 0.1% |
| British | 183 | 2.1% |
| Burmese | 80 | 0.9% |
| Cajun | 21 | 0.2% |
| Canadian | 181 | 2.0% |
| Celtic | 8 | 0.1% |
| Cherokee | 1 | 0.0% |
| Cuban | 313 | 3.5% |
| Czech | 266 | 3.0% |
| Dutch | 60 | 0.7% |
| Eastern European | 197 | 2.2% |
| English | 1,582 | 17.8% |
| Ethiopian | 25 | 0.3% |
| European | 271 | 3.0% |
| Finnish | 41 | 0.5% |
| French | 296 | 3.3% |
| French Canadian | 145 | 1.6% |
| German | 1,348 | 15.1% |
| Greek | 73 | 0.8% |
| Hungarian | 35 | 0.4% |
| Indian (Asian) | 74 | 0.8% |
| Irish | 1,253 | 14.1% |
| Israeli | 59 | 0.7% |
| Italian | 877 | 9.9% |
| Korean | 15 | 0.2% |
| Lebanese | 28 | 0.3% |
| Lithuanian | 184 | 2.1% |
| Mexican | 40 | 0.4% |
| Northern European | 37 | 0.4% |
| Norwegian | 96 | 1.1% |
| Pennsylvania German | 9 | 0.1% |
| Peruvian | 30 | 0.3% |
| Polish | 229 | 2.6% |
| Portuguese | 12 | 0.1% |
| Puerto Rican | 25 | 0.3% |
| Romanian | 55 | 0.6% |
| Russian | 85 | 0.9% |
| Scandinavian | 25 | 0.3% |
| Scotch-Irish | 148 | 1.7% |
| Scottish | 358 | 4.0% |
| Slovak | 11 | 0.1% |
| Slovene | 18 | 0.2% |
| South American | 30 | 0.3% |
| Spaniard | 8 | 0.1% |
| Spanish | 36 | 0.4% |
| Sri Lankan | 107 | 1.2% |
| Subsaharan African | 42 | 0.5% |
| Swedish | 83 | 0.9% |
| Swiss | 38 | 0.4% |
| Syrian | 5 | 0.1% |
| Thai | 17 | 0.2% |
| Ukrainian | 29 | 0.3% |
| Welsh | 65 | 0.7% |
| Yugoslavian | 13 | 0.2% |
| Zimbabwean | 17 | 0.2% | View All 58 Rows |
Immigrants in St Pete Beach
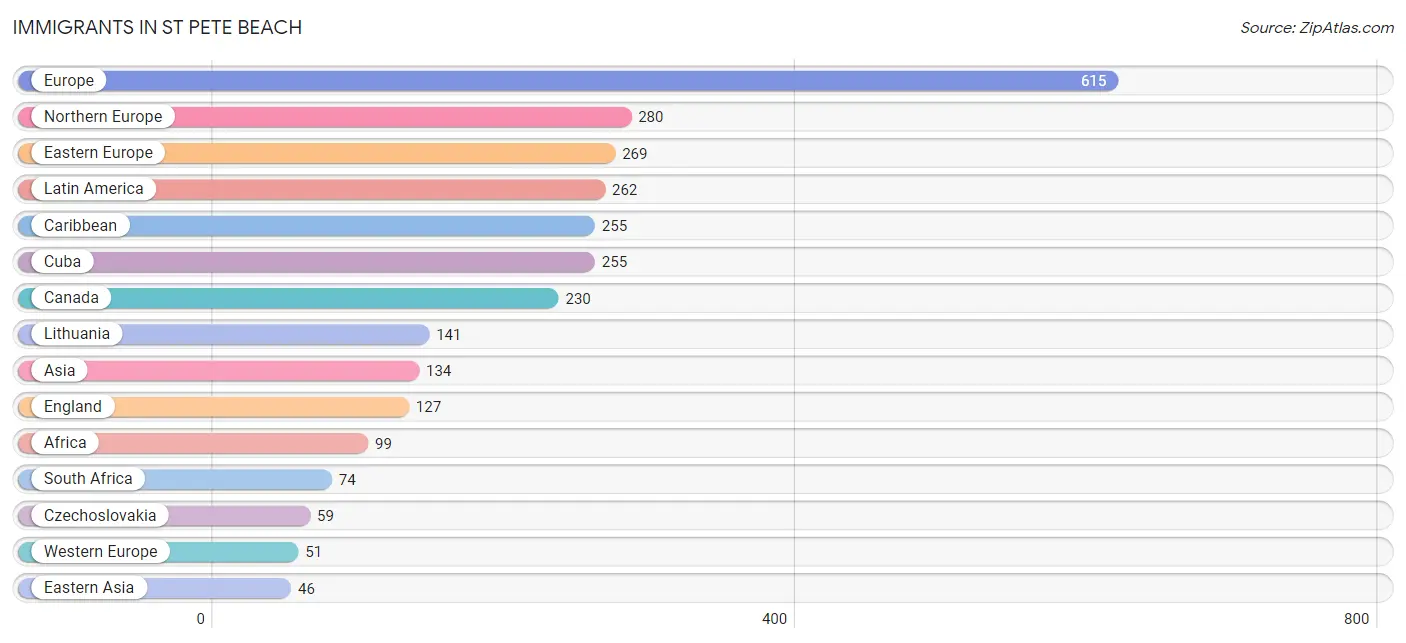
The most numerous immigrant groups reported in St Pete Beach came from Europe (615 | 6.9%), Northern Europe (280 | 3.1%), Eastern Europe (269 | 3.0%), Latin America (262 | 2.9%), and Caribbean (255 | 2.9%), together accounting for 18.9% of all St Pete Beach residents.
| Immigration Origin | # Population | % Population |
| Africa | 99 | 1.1% |
| Asia | 134 | 1.5% |
| Austria | 7 | 0.1% |
| Canada | 230 | 2.6% |
| Caribbean | 255 | 2.9% |
| China | 14 | 0.2% |
| Cuba | 255 | 2.9% |
| Czechoslovakia | 59 | 0.7% |
| Eastern Africa | 25 | 0.3% |
| Eastern Asia | 46 | 0.5% |
| Eastern Europe | 269 | 3.0% |
| England | 127 | 1.4% |
| Ethiopia | 25 | 0.3% |
| Europe | 615 | 6.9% |
| France | 21 | 0.2% |
| Germany | 23 | 0.3% |
| Greece | 11 | 0.1% |
| Hungary | 14 | 0.2% |
| Israel | 21 | 0.2% |
| Korea | 32 | 0.4% |
| Latin America | 262 | 2.9% |
| Lebanon | 23 | 0.3% |
| Lithuania | 141 | 1.6% |
| Northern Europe | 280 | 3.1% |
| Peru | 7 | 0.1% |
| Philippines | 27 | 0.3% |
| Poland | 27 | 0.3% |
| Romania | 23 | 0.3% |
| Scotland | 20 | 0.2% |
| Serbia | 5 | 0.1% |
| South Africa | 74 | 0.8% |
| South America | 7 | 0.1% |
| South Eastern Asia | 44 | 0.5% |
| Southern Europe | 15 | 0.2% |
| Spain | 4 | 0.0% |
| Vietnam | 17 | 0.2% |
| Western Asia | 44 | 0.5% |
| Western Europe | 51 | 0.6% | View All 38 Rows |
Sex and Age in St Pete Beach
Sex and Age in St Pete Beach
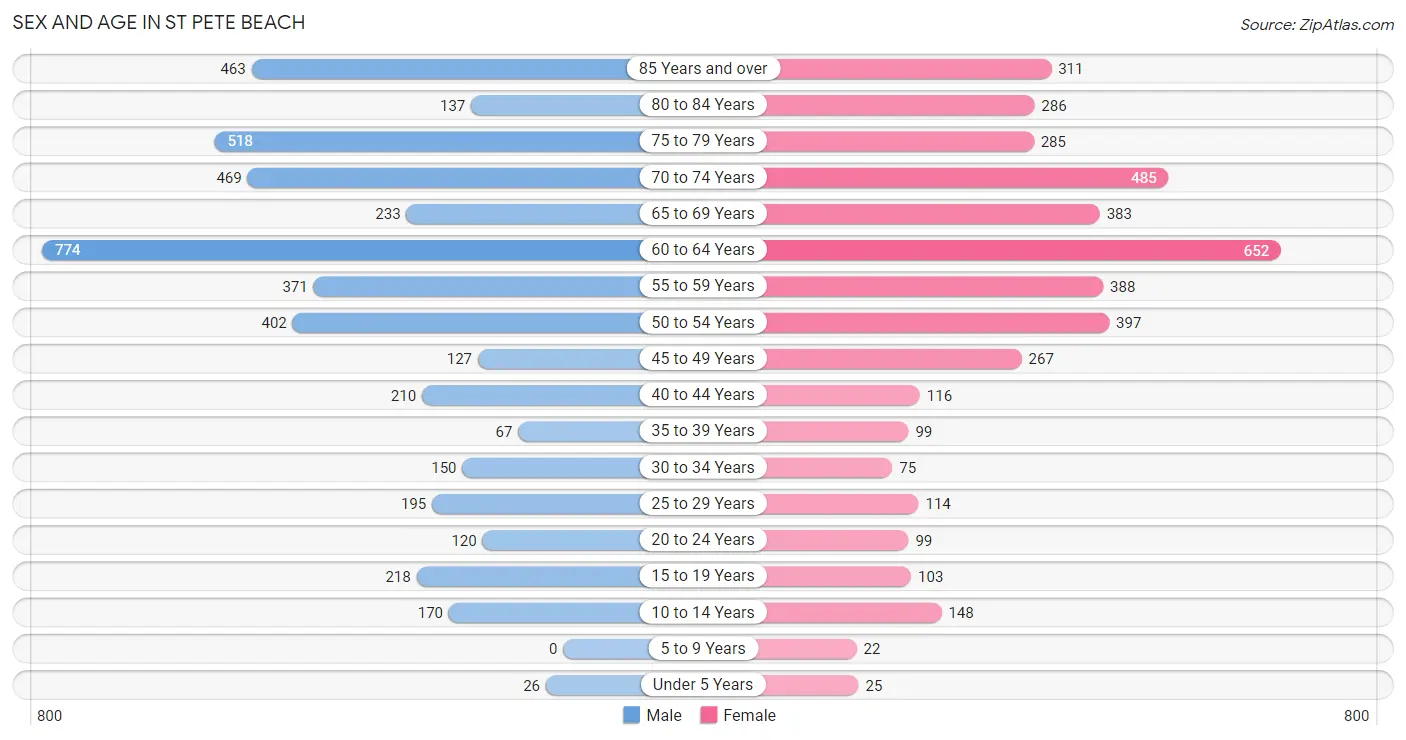
The most populous age groups in St Pete Beach are 60 to 64 Years (774 | 16.7%) for men and 60 to 64 Years (652 | 15.3%) for women.
| Age Bracket | Male | Female |
| Under 5 Years | 26 (0.6%) | 25 (0.6%) |
| 5 to 9 Years | 0 (0.0%) | 22 (0.5%) |
| 10 to 14 Years | 170 (3.7%) | 148 (3.5%) |
| 15 to 19 Years | 218 (4.7%) | 103 (2.4%) |
| 20 to 24 Years | 120 (2.6%) | 99 (2.3%) |
| 25 to 29 Years | 195 (4.2%) | 114 (2.7%) |
| 30 to 34 Years | 150 (3.2%) | 75 (1.8%) |
| 35 to 39 Years | 67 (1.4%) | 99 (2.3%) |
| 40 to 44 Years | 210 (4.5%) | 116 (2.7%) |
| 45 to 49 Years | 127 (2.7%) | 267 (6.3%) |
| 50 to 54 Years | 402 (8.6%) | 397 (9.3%) |
| 55 to 59 Years | 371 (8.0%) | 388 (9.1%) |
| 60 to 64 Years | 774 (16.7%) | 652 (15.3%) |
| 65 to 69 Years | 233 (5.0%) | 383 (9.0%) |
| 70 to 74 Years | 469 (10.1%) | 485 (11.4%) |
| 75 to 79 Years | 518 (11.1%) | 285 (6.7%) |
| 80 to 84 Years | 137 (2.9%) | 286 (6.7%) |
| 85 Years and over | 463 (10.0%) | 311 (7.3%) |
| Total | 4,650 (100.0%) | 4,255 (100.0%) |
Families and Households in St Pete Beach
Median Family Size in St Pete Beach
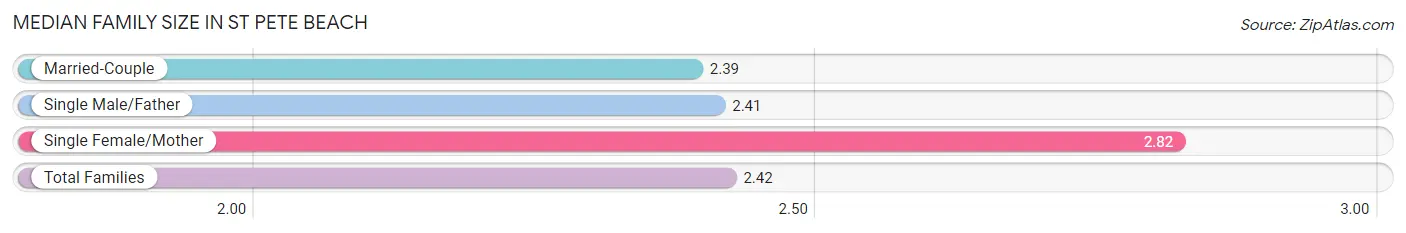
The median family size in St Pete Beach is 2.42 persons per family, with single female/mother families (170 | 6.1%) accounting for the largest median family size of 2.82 persons per family. On the other hand, married-couple families (2,574 | 92.2%) represent the smallest median family size with 2.39 persons per family.
| Family Type | # Families | Family Size |
| Married-Couple | 2,574 (92.2%) | 2.39 |
| Single Male/Father | 49 (1.8%) | 2.41 |
| Single Female/Mother | 170 (6.1%) | 2.82 |
| Total Families | 2,793 (100.0%) | 2.42 |
Median Household Size in St Pete Beach
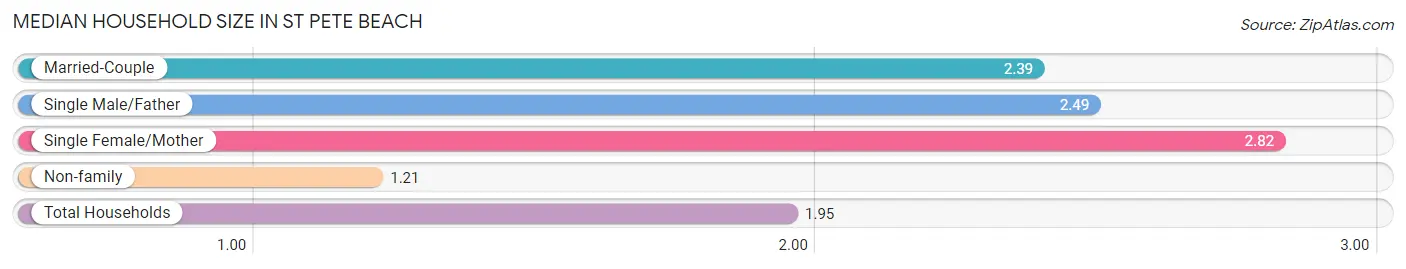
The median household size in St Pete Beach is 1.95 persons per household, with single female/mother households (170 | 3.7%) accounting for the largest median household size of 2.82 persons per household. non-family households (1,759 | 38.6%) represent the smallest median household size with 1.21 persons per household.
| Household Type | # Households | Household Size |
| Married-Couple | 2,574 (56.6%) | 2.39 |
| Single Male/Father | 49 (1.1%) | 2.49 |
| Single Female/Mother | 170 (3.7%) | 2.82 |
| Non-family | 1,759 (38.6%) | 1.21 |
| Total Households | 4,552 (100.0%) | 1.95 |
Household Size by Marriage Status in St Pete Beach
Out of a total of 4,552 households in St Pete Beach, 2,793 (61.4%) are family households, while 1,759 (38.6%) are nonfamily households. The most numerous type of family households are 2-person households, comprising 2,198, and the most common type of nonfamily households are 1-person households, comprising 1,421.
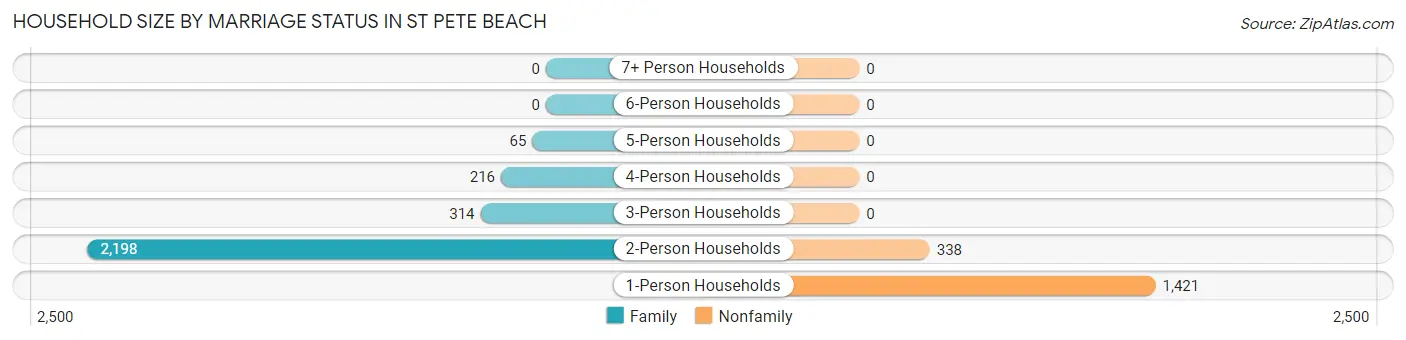
| Household Size | Family Households | Nonfamily Households |
| 1-Person Households | - | 1,421 (31.2%) |
| 2-Person Households | 2,198 (48.3%) | 338 (7.4%) |
| 3-Person Households | 314 (6.9%) | 0 (0.0%) |
| 4-Person Households | 216 (4.8%) | 0 (0.0%) |
| 5-Person Households | 65 (1.4%) | 0 (0.0%) |
| 6-Person Households | 0 (0.0%) | 0 (0.0%) |
| 7+ Person Households | 0 (0.0%) | 0 (0.0%) |
| Total | 2,793 (61.4%) | 1,759 (38.6%) |
Female Fertility in St Pete Beach
Fertility by Age in St Pete Beach
Average fertility rate in St Pete Beach is 13.0 births per 1,000 women. Women in the age bracket of 35 to 50 years have the highest fertility rate with 23.0 births per 1,000 women. Women in the age bracket of 35 to 50 years acount for 100.0% of all women with births.
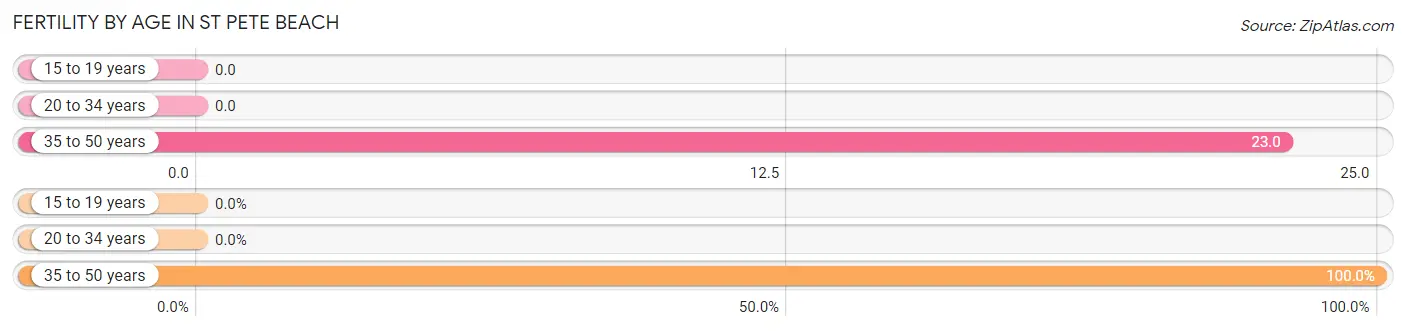
| Age Bracket | Women with Births | Births / 1,000 Women |
| 15 to 19 years | 0 (0.0%) | 0.0 |
| 20 to 34 years | 0 (0.0%) | 0.0 |
| 35 to 50 years | 12 (100.0%) | 23.0 |
| Total | 12 (100.0%) | 13.0 |
Fertility by Age by Marriage Status in St Pete Beach
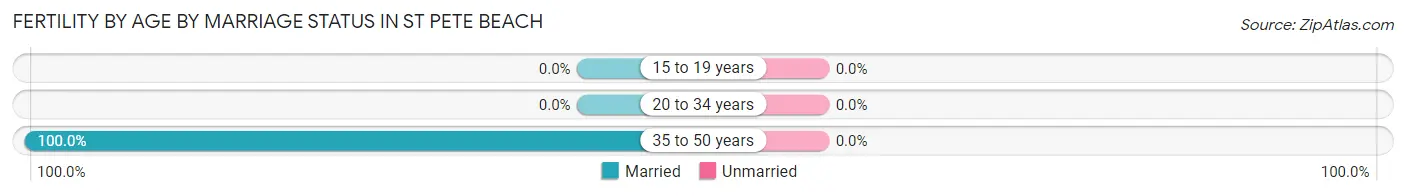
| Age Bracket | Married | Unmarried |
| 15 to 19 years | 0 (0.0%) | 0 (0.0%) |
| 20 to 34 years | 0 (0.0%) | 0 (0.0%) |
| 35 to 50 years | 12 (100.0%) | 0 (0.0%) |
| Total | 12 (100.0%) | 0 (0.0%) |
Fertility by Education in St Pete Beach
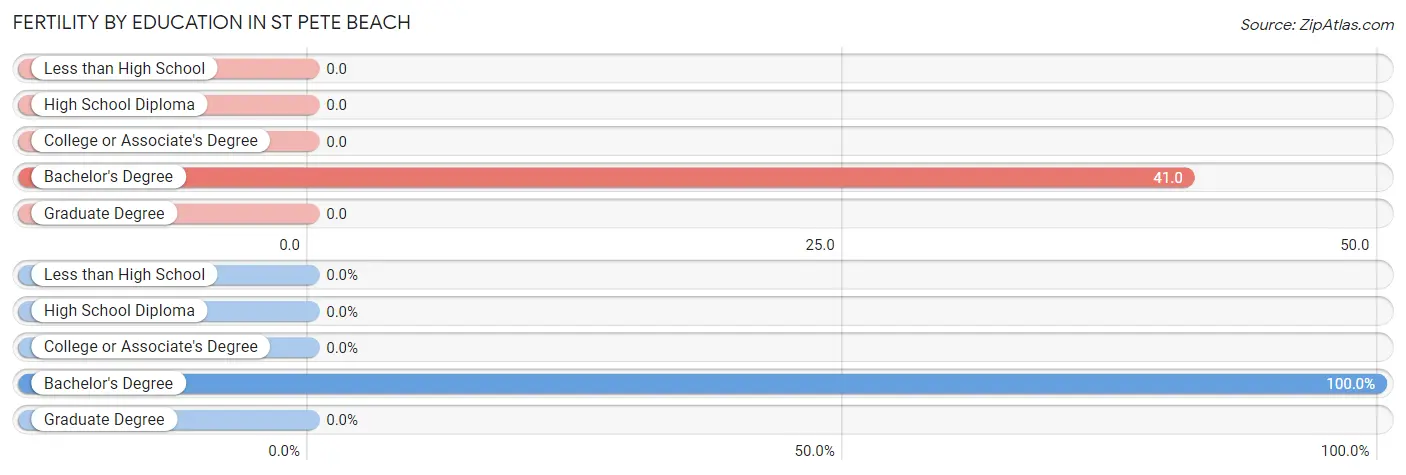
| Educational Attainment | Women with Births | Births / 1,000 Women |
| Less than High School | 0 (0.0%) | 0.0 |
| High School Diploma | 0 (0.0%) | 0.0 |
| College or Associate's Degree | 0 (0.0%) | 0.0 |
| Bachelor's Degree | 12 (100.0%) | 41.0 |
| Graduate Degree | 0 (0.0%) | 0.0 |
| Total | 12 (100.0%) | 13.0 |
Fertility by Education by Marriage Status in St Pete Beach
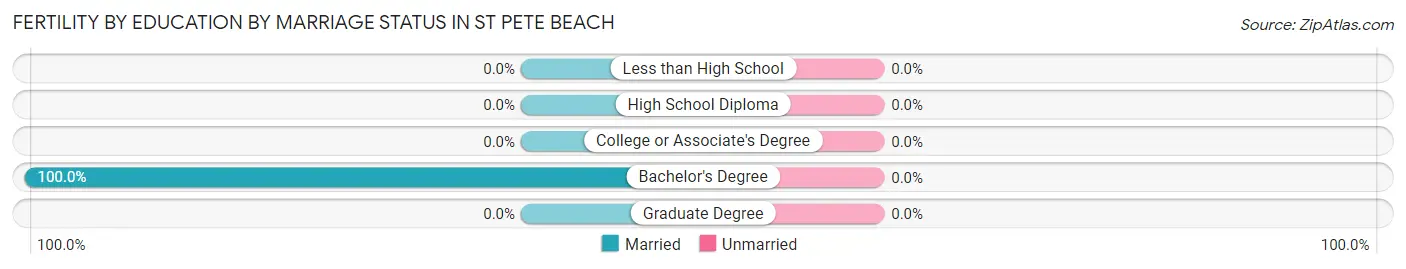
| Educational Attainment | Married | Unmarried |
| Less than High School | 0 (0.0%) | 0 (0.0%) |
| High School Diploma | 0 (0.0%) | 0 (0.0%) |
| College or Associate's Degree | 0 (0.0%) | 0 (0.0%) |
| Bachelor's Degree | 12 (100.0%) | 0 (0.0%) |
| Graduate Degree | 0 (0.0%) | 0 (0.0%) |
| Total | 12 (100.0%) | 0 (0.0%) |
Employment Characteristics in St Pete Beach
Employment by Class of Employer in St Pete Beach
Among the 3,886 employed individuals in St Pete Beach, private company employees (2,454 | 63.1%), self-employed (incorporated) (582 | 15.0%), and self-employed (not incorporated) (275 | 7.1%) make up the most common classes of employment.
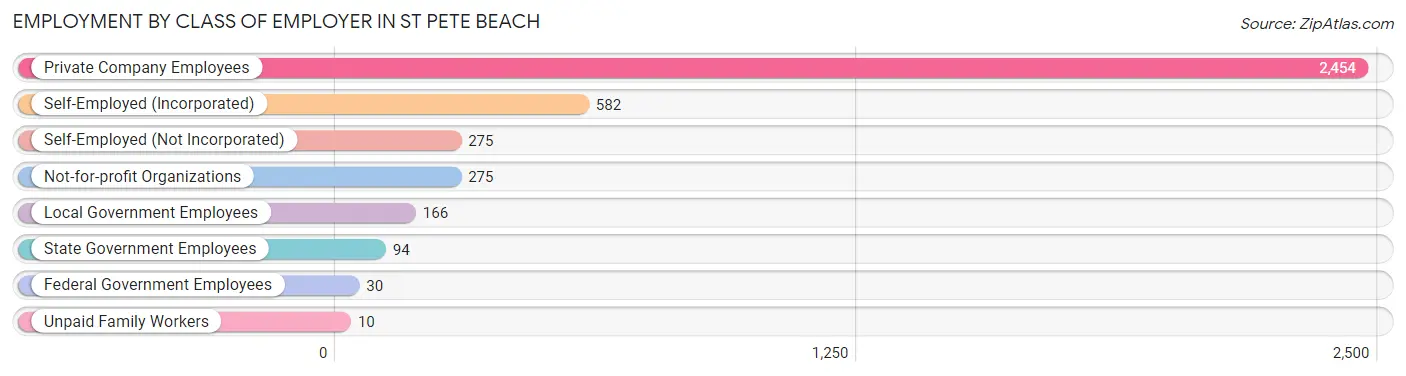
| Employer Class | # Employees | % Employees |
| Private Company Employees | 2,454 | 63.1% |
| Self-Employed (Incorporated) | 582 | 15.0% |
| Self-Employed (Not Incorporated) | 275 | 7.1% |
| Not-for-profit Organizations | 275 | 7.1% |
| Local Government Employees | 166 | 4.3% |
| State Government Employees | 94 | 2.4% |
| Federal Government Employees | 30 | 0.8% |
| Unpaid Family Workers | 10 | 0.3% |
| Total | 3,886 | 100.0% |
Employment Status by Age in St Pete Beach
According to the labor force statistics for St Pete Beach, out of the total population over 16 years of age (8,424), 49.2% or 4,145 individuals are in the labor force, with 5.7% or 236 of them unemployed. The age group with the highest labor force participation rate is 25 to 29 years, with 100.0% or 309 individuals in the labor force. Within the labor force, the 20 to 24 years age range has the highest percentage of unemployed individuals, with 32.5% or 39 of them being unemployed.
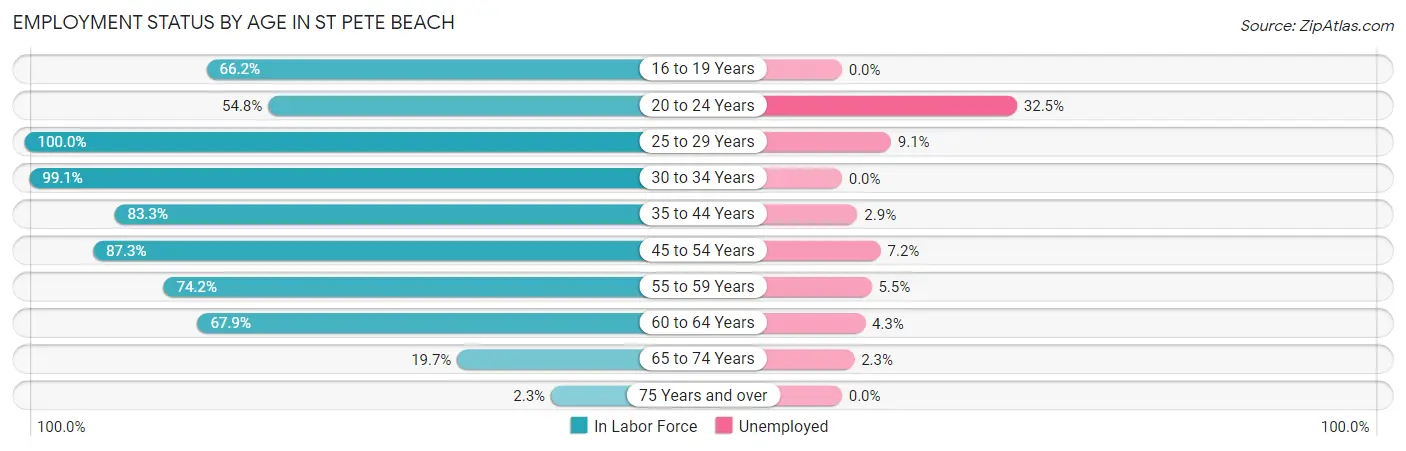
| Age Bracket | In Labor Force | Unemployed |
| 16 to 19 Years | 153 (66.2%) | 0 (0.0%) |
| 20 to 24 Years | 120 (54.8%) | 39 (32.5%) |
| 25 to 29 Years | 309 (100.0%) | 28 (9.1%) |
| 30 to 34 Years | 223 (99.1%) | 0 (0.0%) |
| 35 to 44 Years | 410 (83.3%) | 12 (2.9%) |
| 45 to 54 Years | 1,041 (87.3%) | 75 (7.2%) |
| 55 to 59 Years | 563 (74.2%) | 31 (5.5%) |
| 60 to 64 Years | 968 (67.9%) | 42 (4.3%) |
| 65 to 74 Years | 309 (19.7%) | 7 (2.3%) |
| 75 Years and over | 46 (2.3%) | 0 (0.0%) |
| Total | 4,145 (49.2%) | 236 (5.7%) |
Employment Status by Educational Attainment in St Pete Beach
According to labor force statistics for St Pete Beach, 79.8% of individuals (3,514) out of the total population between 25 and 64 years of age (4,404) are in the labor force, with 5.4% or 190 of them being unemployed. The group with the highest labor force participation rate are those with the educational attainment of bachelor's degree or higher, with 82.1% or 1,985 individuals in the labor force. Within the labor force, individuals with less than high school education have the highest percentage of unemployment, with 58.1% or 43 of them being unemployed.
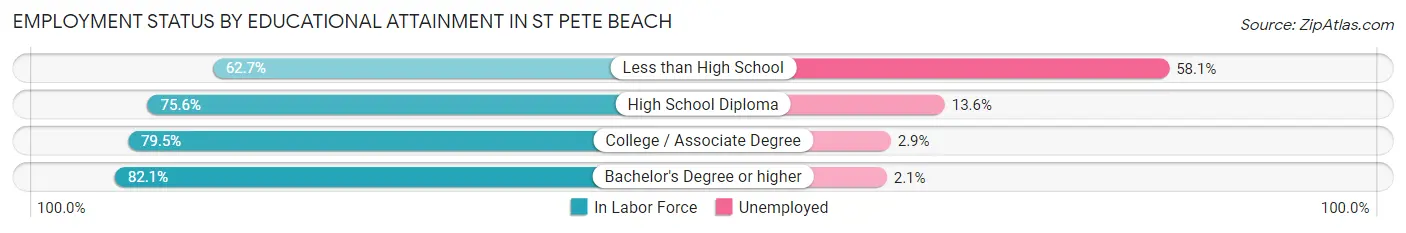
| Educational Attainment | In Labor Force | Unemployed |
| Less than High School | 74 (62.7%) | 69 (58.1%) |
| High School Diploma | 574 (75.6%) | 103 (13.6%) |
| College / Associate Degree | 882 (79.5%) | 32 (2.9%) |
| Bachelor's Degree or higher | 1,985 (82.1%) | 51 (2.1%) |
| Total | 3,514 (79.8%) | 238 (5.4%) |
Employment Occupations by Sex in St Pete Beach
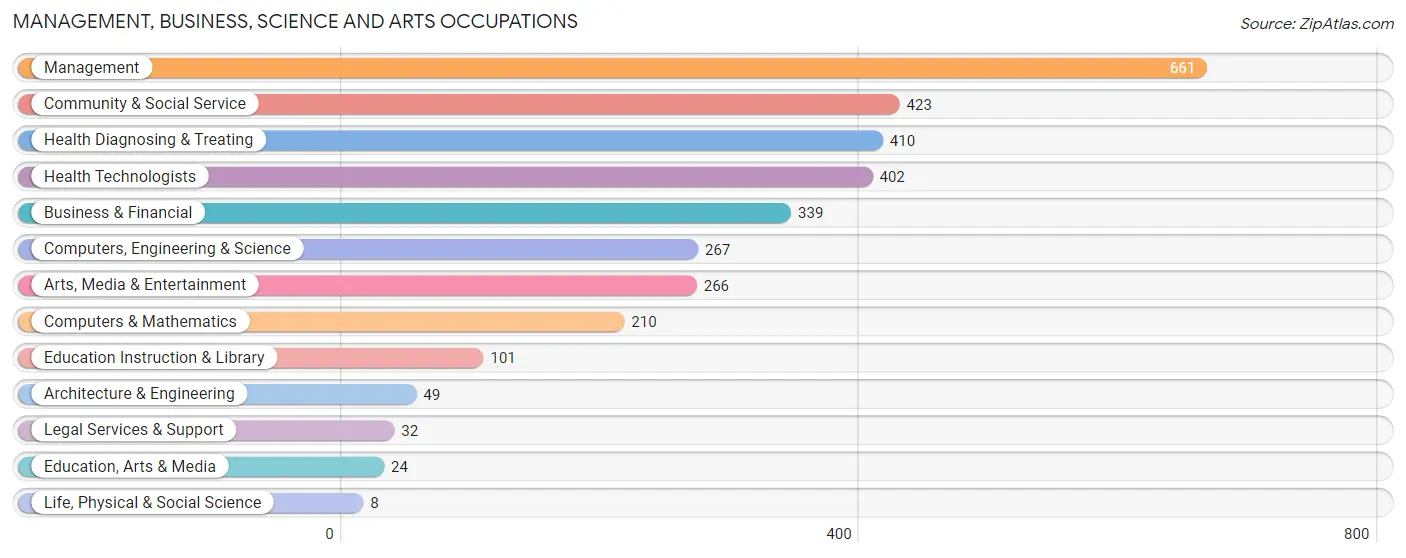
Management, Business, Science and Arts Occupations
The most common Management, Business, Science and Arts occupations in St Pete Beach are Management (661 | 17.0%), Community & Social Service (423 | 10.8%), Health Diagnosing & Treating (410 | 10.5%), Health Technologists (402 | 10.3%), and Business & Financial (339 | 8.7%).
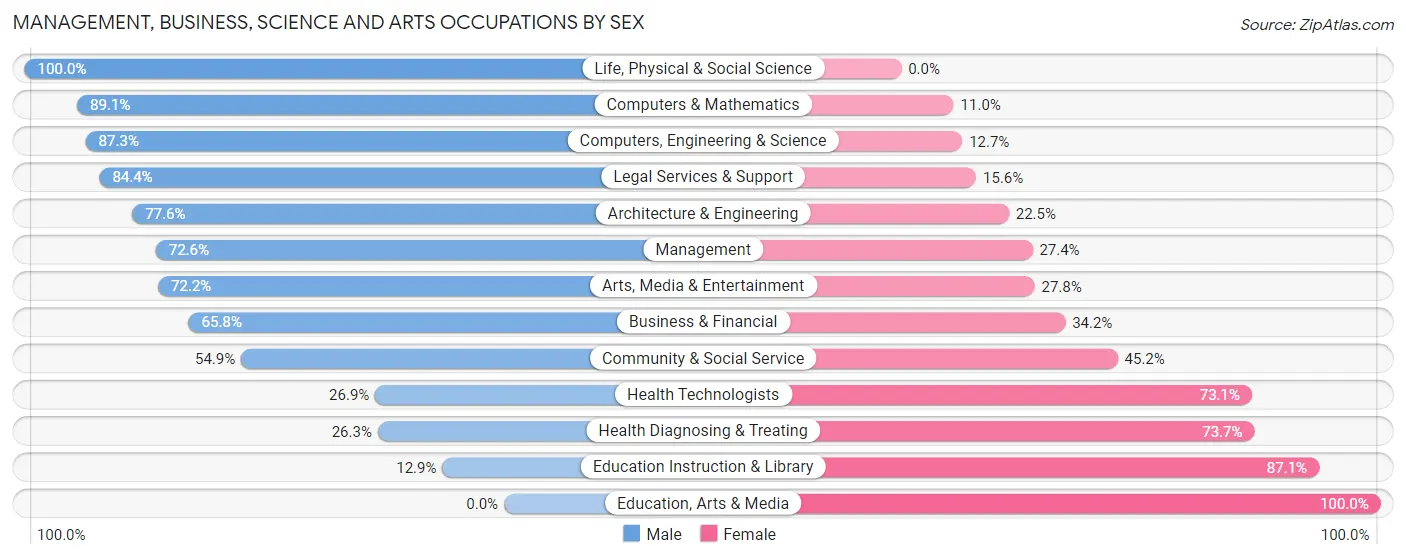
Management, Business, Science and Arts Occupations by Sex
Within the Management, Business, Science and Arts occupations in St Pete Beach, the most male-oriented occupations are Life, Physical & Social Science (100.0%), Computers & Mathematics (89.0%), and Computers, Engineering & Science (87.3%), while the most female-oriented occupations are Education, Arts & Media (100.0%), Education Instruction & Library (87.1%), and Health Diagnosing & Treating (73.7%).
| Occupation | Male | Female |
| Management | 480 (72.6%) | 181 (27.4%) |
| Business & Financial | 223 (65.8%) | 116 (34.2%) |
| Computers, Engineering & Science | 233 (87.3%) | 34 (12.7%) |
| Computers & Mathematics | 187 (89.0%) | 23 (11.0%) |
| Architecture & Engineering | 38 (77.5%) | 11 (22.5%) |
| Life, Physical & Social Science | 8 (100.0%) | 0 (0.0%) |
| Community & Social Service | 232 (54.8%) | 191 (45.2%) |
| Education, Arts & Media | 0 (0.0%) | 24 (100.0%) |
| Legal Services & Support | 27 (84.4%) | 5 (15.6%) |
| Education Instruction & Library | 13 (12.9%) | 88 (87.1%) |
| Arts, Media & Entertainment | 192 (72.2%) | 74 (27.8%) |
| Health Diagnosing & Treating | 108 (26.3%) | 302 (73.7%) |
| Health Technologists | 108 (26.9%) | 294 (73.1%) |
| Total (Category) | 1,276 (60.8%) | 824 (39.2%) |
| Total (Overall) | 2,297 (58.9%) | 1,602 (41.1%) |
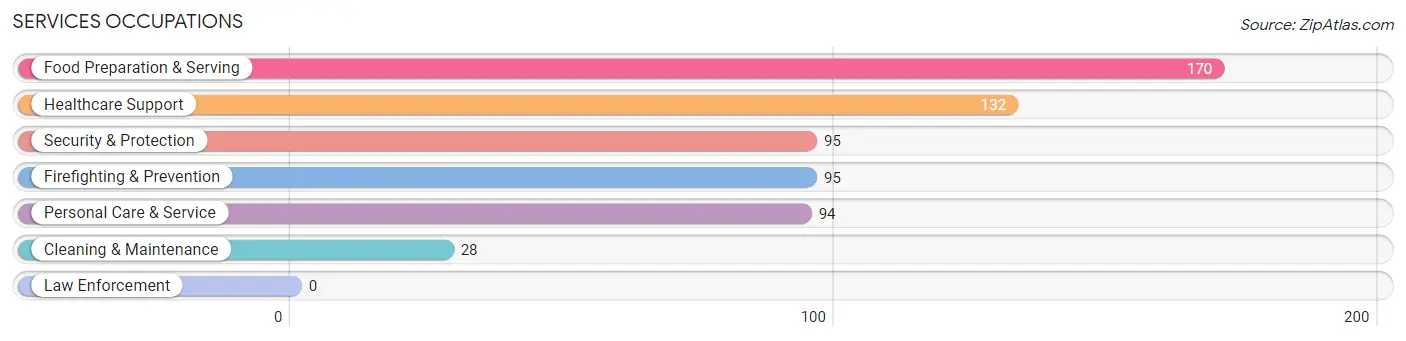
Services Occupations
The most common Services occupations in St Pete Beach are Food Preparation & Serving (170 | 4.4%), Healthcare Support (132 | 3.4%), Security & Protection (95 | 2.4%), Firefighting & Prevention (95 | 2.4%), and Personal Care & Service (94 | 2.4%).
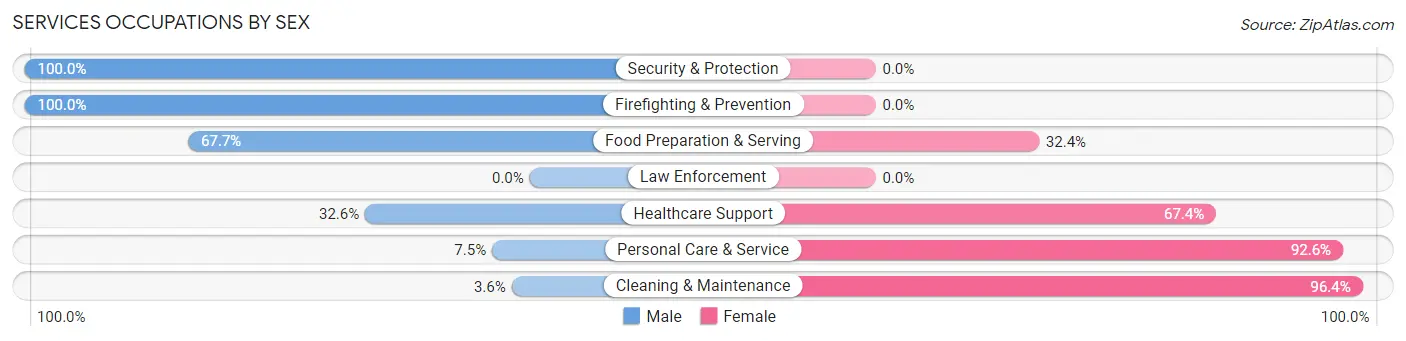
Services Occupations by Sex
Within the Services occupations in St Pete Beach, the most male-oriented occupations are Security & Protection (100.0%), Firefighting & Prevention (100.0%), and Food Preparation & Serving (67.6%), while the most female-oriented occupations are Cleaning & Maintenance (96.4%), Personal Care & Service (92.5%), and Healthcare Support (67.4%).
| Occupation | Male | Female |
| Healthcare Support | 43 (32.6%) | 89 (67.4%) |
| Security & Protection | 95 (100.0%) | 0 (0.0%) |
| Firefighting & Prevention | 95 (100.0%) | 0 (0.0%) |
| Law Enforcement | 0 (0.0%) | 0 (0.0%) |
| Food Preparation & Serving | 115 (67.6%) | 55 (32.4%) |
| Cleaning & Maintenance | 1 (3.6%) | 27 (96.4%) |
| Personal Care & Service | 7 (7.4%) | 87 (92.5%) |
| Total (Category) | 261 (50.3%) | 258 (49.7%) |
| Total (Overall) | 2,297 (58.9%) | 1,602 (41.1%) |
Sales and Office Occupations
The most common Sales and Office occupations in St Pete Beach are Sales & Related (647 | 16.6%), and Office & Administration (195 | 5.0%).
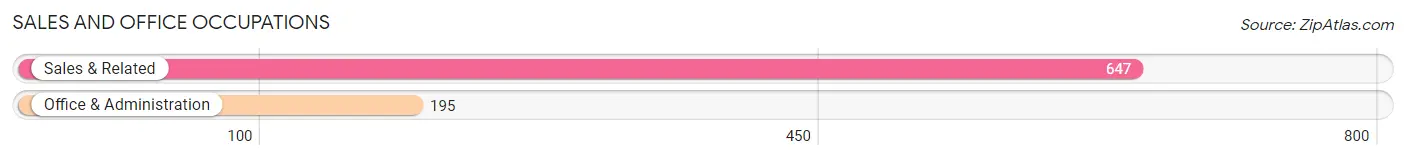
Sales and Office Occupations by Sex

| Occupation | Male | Female |
| Sales & Related | 428 (66.1%) | 219 (33.9%) |
| Office & Administration | 12 (6.1%) | 183 (93.9%) |
| Total (Category) | 440 (52.3%) | 402 (47.7%) |
| Total (Overall) | 2,297 (58.9%) | 1,602 (41.1%) |
Natural Resources, Construction and Maintenance Occupations
The most common Natural Resources, Construction and Maintenance occupations in St Pete Beach are Installation, Maintenance & Repair (81 | 2.1%), Construction & Extraction (75 | 1.9%), and Farming, Fishing & Forestry (6 | 0.2%).
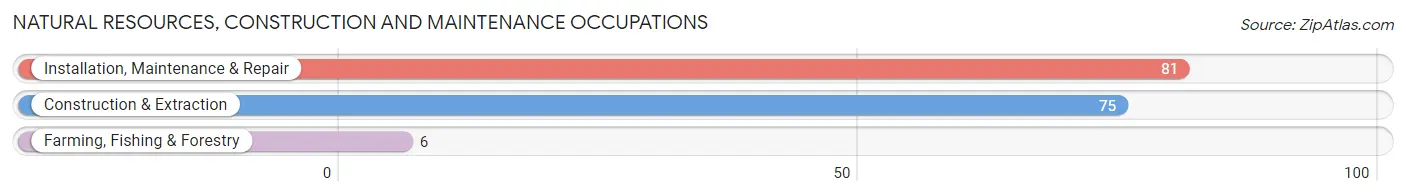
Natural Resources, Construction and Maintenance Occupations by Sex
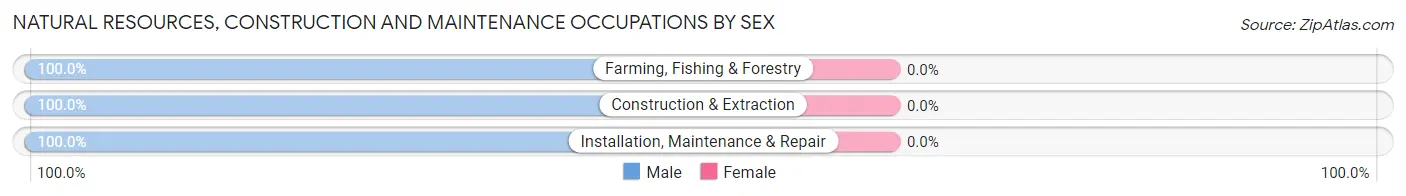
| Occupation | Male | Female |
| Farming, Fishing & Forestry | 6 (100.0%) | 0 (0.0%) |
| Construction & Extraction | 75 (100.0%) | 0 (0.0%) |
| Installation, Maintenance & Repair | 81 (100.0%) | 0 (0.0%) |
| Total (Category) | 162 (100.0%) | 0 (0.0%) |
| Total (Overall) | 2,297 (58.9%) | 1,602 (41.1%) |
Production, Transportation and Moving Occupations
The most common Production, Transportation and Moving occupations in St Pete Beach are Transportation (108 | 2.8%), Production (90 | 2.3%), and Material Moving (78 | 2.0%).
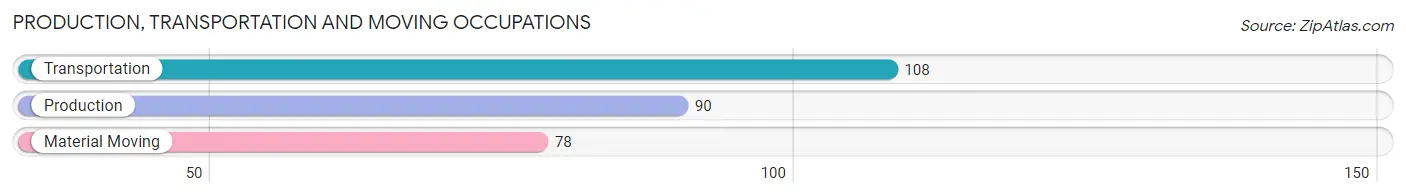
Production, Transportation and Moving Occupations by Sex
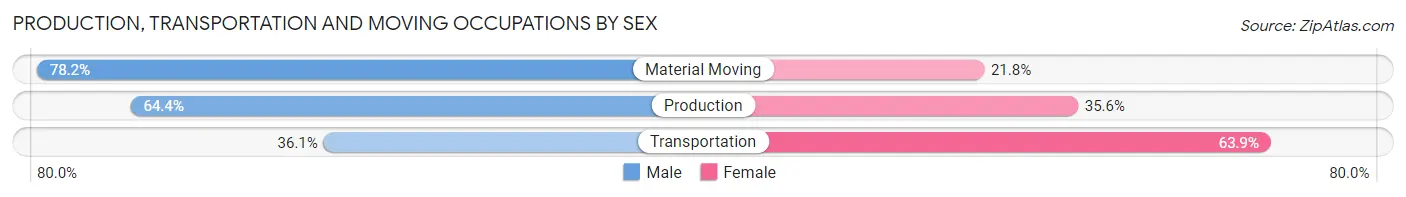
| Occupation | Male | Female |
| Production | 58 (64.4%) | 32 (35.6%) |
| Transportation | 39 (36.1%) | 69 (63.9%) |
| Material Moving | 61 (78.2%) | 17 (21.8%) |
| Total (Category) | 158 (57.3%) | 118 (42.7%) |
| Total (Overall) | 2,297 (58.9%) | 1,602 (41.1%) |
Employment Industries by Sex in St Pete Beach
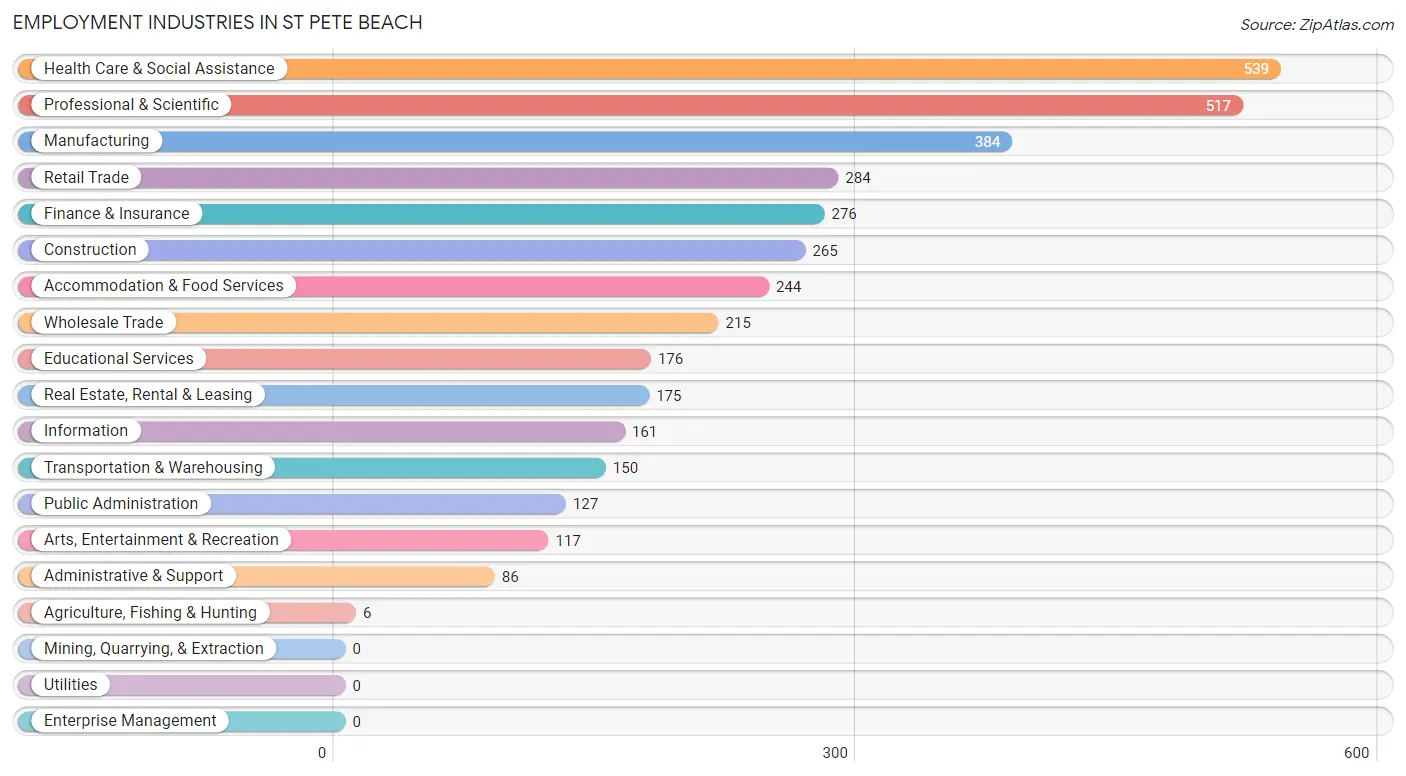
Employment Industries in St Pete Beach
The major employment industries in St Pete Beach include Health Care & Social Assistance (539 | 13.8%), Professional & Scientific (517 | 13.3%), Manufacturing (384 | 9.9%), Retail Trade (284 | 7.3%), and Finance & Insurance (276 | 7.1%).
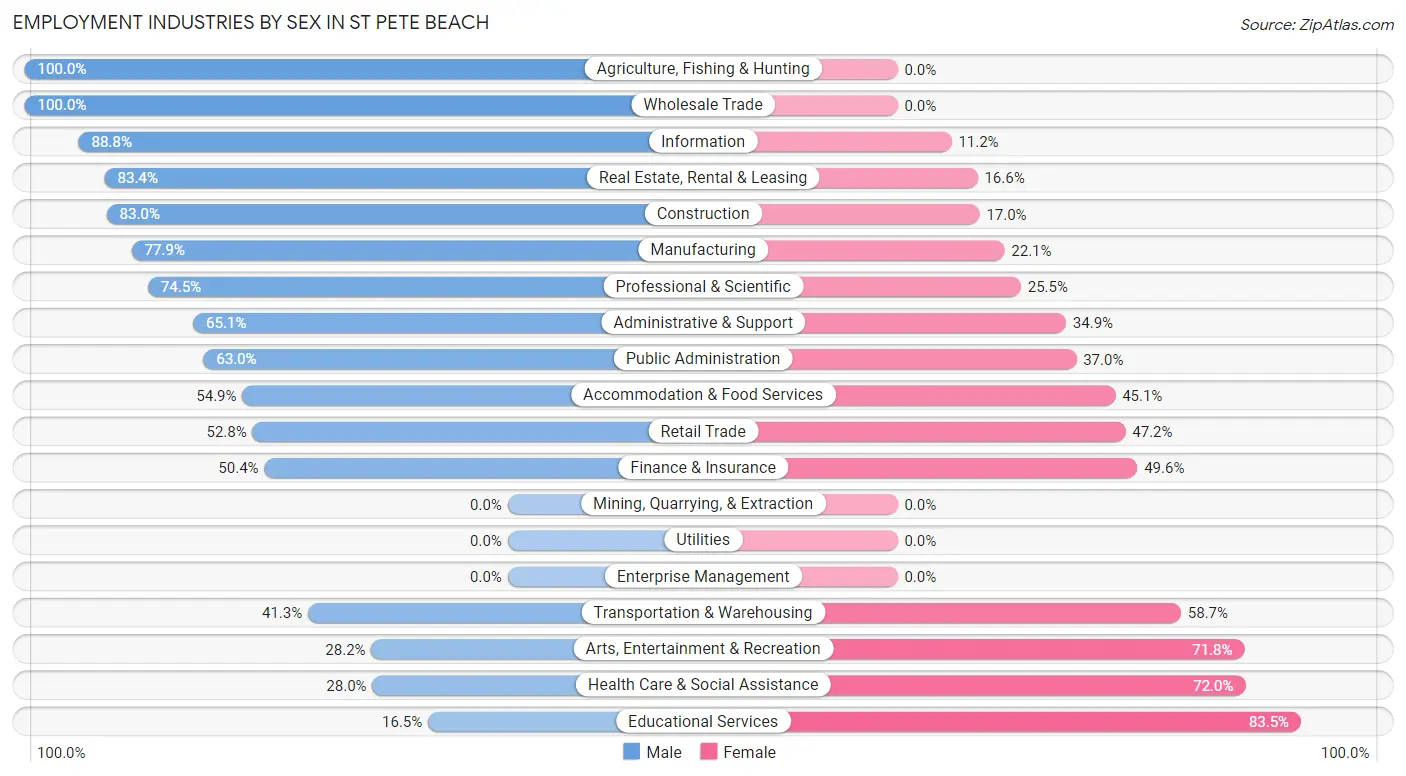
Employment Industries by Sex in St Pete Beach
The St Pete Beach industries that see more men than women are Agriculture, Fishing & Hunting (100.0%), Wholesale Trade (100.0%), and Information (88.8%), whereas the industries that tend to have a higher number of women are Educational Services (83.5%), Health Care & Social Assistance (72.0%), and Arts, Entertainment & Recreation (71.8%).
| Industry | Male | Female |
| Agriculture, Fishing & Hunting | 6 (100.0%) | 0 (0.0%) |
| Mining, Quarrying, & Extraction | 0 (0.0%) | 0 (0.0%) |
| Construction | 220 (83.0%) | 45 (17.0%) |
| Manufacturing | 299 (77.9%) | 85 (22.1%) |
| Wholesale Trade | 215 (100.0%) | 0 (0.0%) |
| Retail Trade | 150 (52.8%) | 134 (47.2%) |
| Transportation & Warehousing | 62 (41.3%) | 88 (58.7%) |
| Utilities | 0 (0.0%) | 0 (0.0%) |
| Information | 143 (88.8%) | 18 (11.2%) |
| Finance & Insurance | 139 (50.4%) | 137 (49.6%) |
| Real Estate, Rental & Leasing | 146 (83.4%) | 29 (16.6%) |
| Professional & Scientific | 385 (74.5%) | 132 (25.5%) |
| Enterprise Management | 0 (0.0%) | 0 (0.0%) |
| Administrative & Support | 56 (65.1%) | 30 (34.9%) |
| Educational Services | 29 (16.5%) | 147 (83.5%) |
| Health Care & Social Assistance | 151 (28.0%) | 388 (72.0%) |
| Arts, Entertainment & Recreation | 33 (28.2%) | 84 (71.8%) |
| Accommodation & Food Services | 134 (54.9%) | 110 (45.1%) |
| Public Administration | 80 (63.0%) | 47 (37.0%) |
| Total | 2,297 (58.9%) | 1,602 (41.1%) |
Education in St Pete Beach
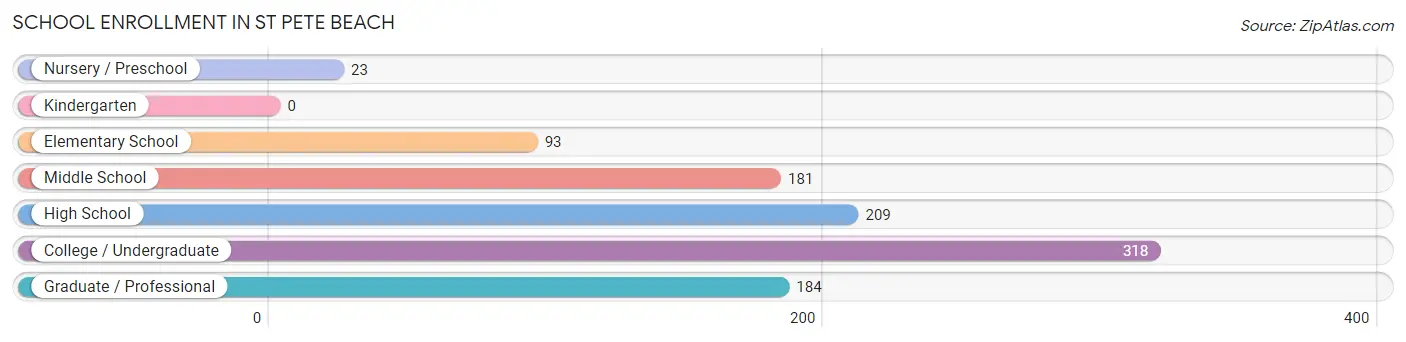
School Enrollment in St Pete Beach
The most common levels of schooling among the 1,008 students in St Pete Beach are college / undergraduate (318 | 31.6%), high school (209 | 20.7%), and graduate / professional (184 | 18.2%).
| School Level | # Students | % Students |
| Nursery / Preschool | 23 | 2.3% |
| Kindergarten | 0 | 0.0% |
| Elementary School | 93 | 9.2% |
| Middle School | 181 | 18.0% |
| High School | 209 | 20.7% |
| College / Undergraduate | 318 | 31.6% |
| Graduate / Professional | 184 | 18.2% |
| Total | 1,008 | 100.0% |
School Enrollment by Age by Funding Source in St Pete Beach
Out of a total of 1,008 students who are enrolled in schools in St Pete Beach, 533 (52.9%) attend a private institution, while the remaining 475 (47.1%) are enrolled in public schools. The age group of 3 to 4 year olds has the highest likelihood of being enrolled in private schools, with 23 (100.0% in the age bracket) enrolled. Conversely, the age group of 18 to 19 year olds has the lowest likelihood of being enrolled in a private school, with 104 (90.4% in the age bracket) attending a public institution.
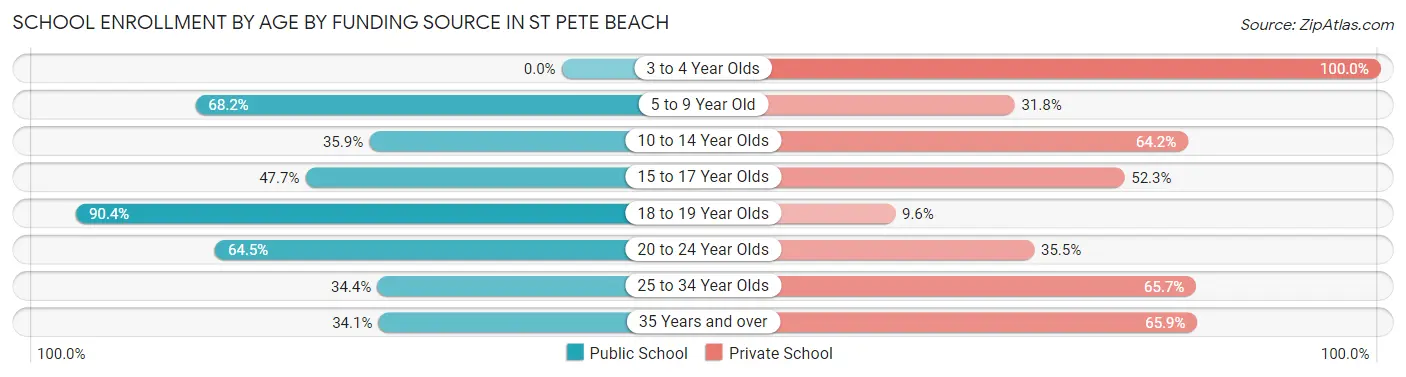
| Age Bracket | Public School | Private School |
| 3 to 4 Year Olds | 0 (0.0%) | 23 (100.0%) |
| 5 to 9 Year Old | 15 (68.2%) | 7 (31.8%) |
| 10 to 14 Year Olds | 114 (35.8%) | 204 (64.1%) |
| 15 to 17 Year Olds | 63 (47.7%) | 69 (52.3%) |
| 18 to 19 Year Olds | 104 (90.4%) | 11 (9.6%) |
| 20 to 24 Year Olds | 91 (64.5%) | 50 (35.5%) |
| 25 to 34 Year Olds | 45 (34.4%) | 86 (65.6%) |
| 35 Years and over | 43 (34.1%) | 83 (65.9%) |
| Total | 475 (47.1%) | 533 (52.9%) |
Educational Attainment by Field of Study in St Pete Beach
Business (1,019 | 20.9%), education (625 | 12.8%), science & technology (470 | 9.6%), social sciences (426 | 8.7%), and engineering (330 | 6.8%) are the most common fields of study among 4,881 individuals in St Pete Beach who have obtained a bachelor's degree or higher.
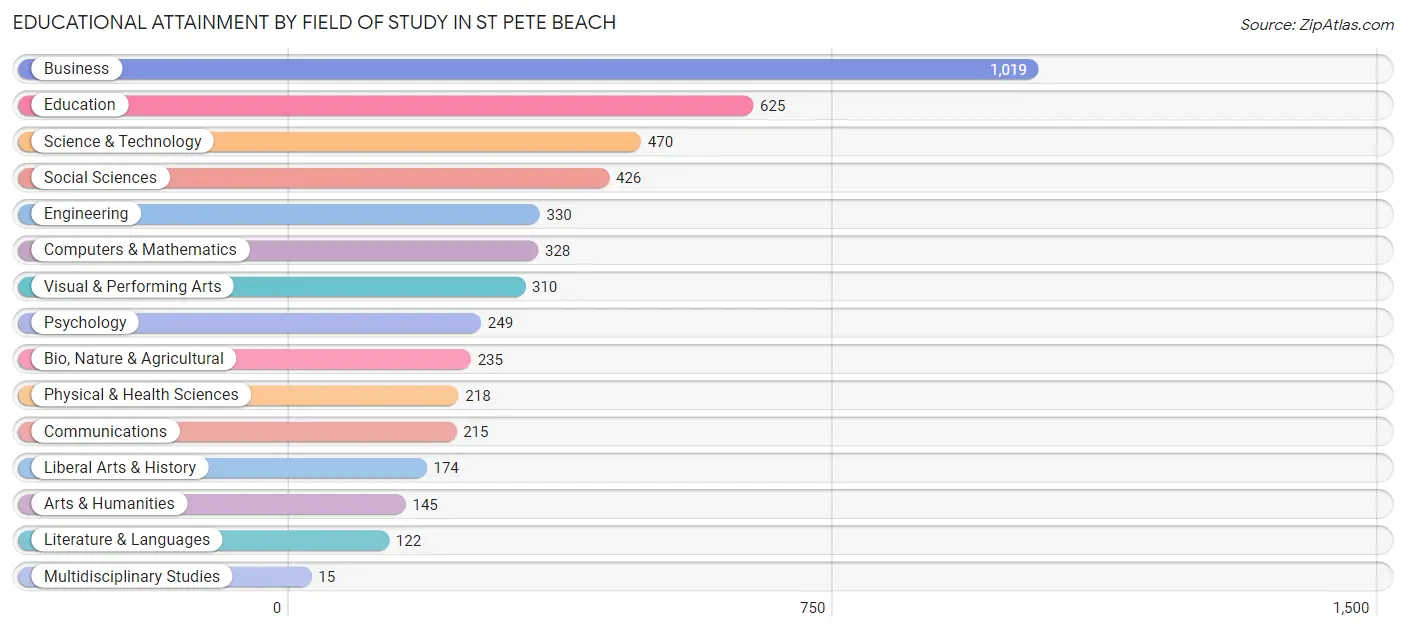
| Field of Study | # Graduates | % Graduates |
| Computers & Mathematics | 328 | 6.7% |
| Bio, Nature & Agricultural | 235 | 4.8% |
| Physical & Health Sciences | 218 | 4.5% |
| Psychology | 249 | 5.1% |
| Social Sciences | 426 | 8.7% |
| Engineering | 330 | 6.8% |
| Multidisciplinary Studies | 15 | 0.3% |
| Science & Technology | 470 | 9.6% |
| Business | 1,019 | 20.9% |
| Education | 625 | 12.8% |
| Literature & Languages | 122 | 2.5% |
| Liberal Arts & History | 174 | 3.6% |
| Visual & Performing Arts | 310 | 6.4% |
| Communications | 215 | 4.4% |
| Arts & Humanities | 145 | 3.0% |
| Total | 4,881 | 100.0% |
Transportation & Commute in St Pete Beach
Vehicle Availability by Sex in St Pete Beach
The most prevalent vehicle ownership categories in St Pete Beach are males with 2 vehicles (1,082, accounting for 47.4%) and females with 2 vehicles (859, making up 67.6%).
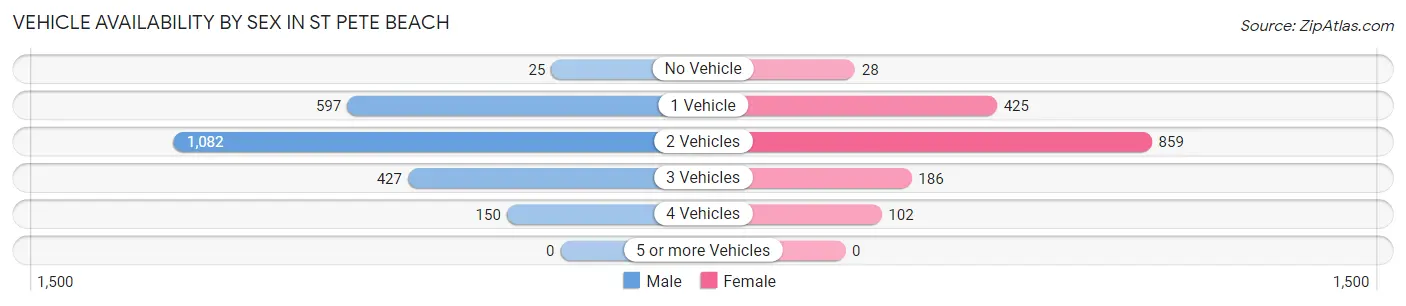
| Vehicles Available | Male | Female |
| No Vehicle | 25 (1.1%) | 28 (1.8%) |
| 1 Vehicle | 597 (26.2%) | 425 (26.6%) |
| 2 Vehicles | 1,082 (47.4%) | 859 (53.7%) |
| 3 Vehicles | 427 (18.7%) | 186 (11.6%) |
| 4 Vehicles | 150 (6.6%) | 102 (6.4%) |
| 5 or more Vehicles | 0 (0.0%) | 0 (0.0%) |
| Total | 2,281 (100.0%) | 1,600 (100.0%) |
Commute Time in St Pete Beach
The most frequently occuring commute durations in St Pete Beach are 30 to 34 minutes (587 commuters, 19.1%), 20 to 24 minutes (413 commuters, 13.4%), and 5 to 9 minutes (360 commuters, 11.7%).
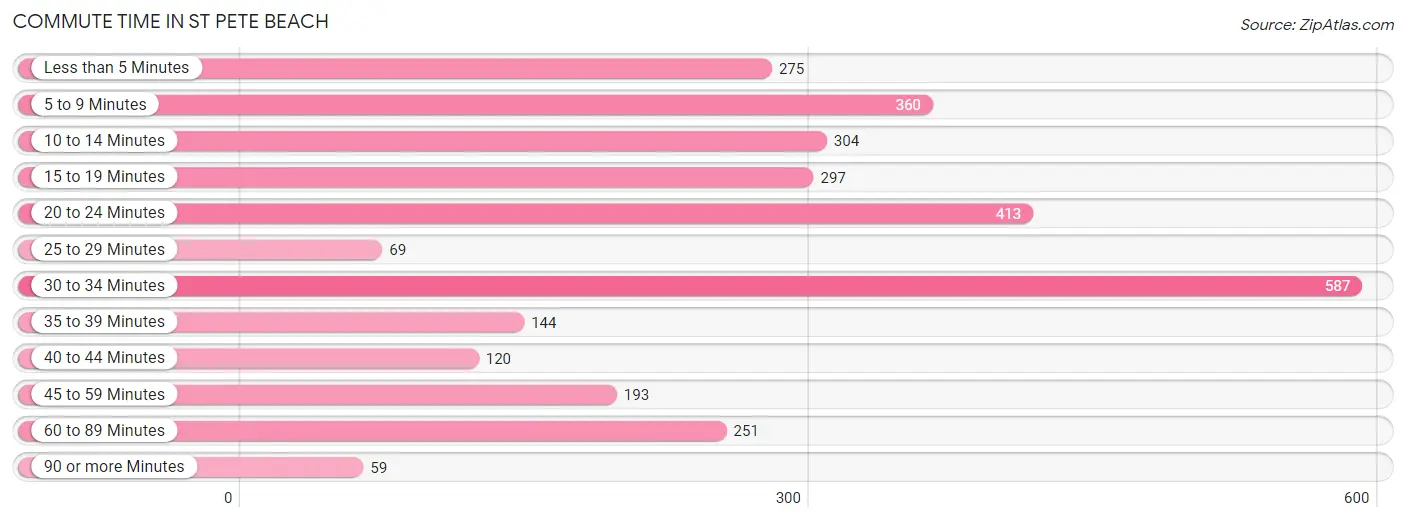
| Commute Time | # Commuters | % Commuters |
| Less than 5 Minutes | 275 | 8.9% |
| 5 to 9 Minutes | 360 | 11.7% |
| 10 to 14 Minutes | 304 | 9.9% |
| 15 to 19 Minutes | 297 | 9.7% |
| 20 to 24 Minutes | 413 | 13.4% |
| 25 to 29 Minutes | 69 | 2.2% |
| 30 to 34 Minutes | 587 | 19.1% |
| 35 to 39 Minutes | 144 | 4.7% |
| 40 to 44 Minutes | 120 | 3.9% |
| 45 to 59 Minutes | 193 | 6.3% |
| 60 to 89 Minutes | 251 | 8.2% |
| 90 or more Minutes | 59 | 1.9% |
Commute Time by Sex in St Pete Beach
The most common commute times in St Pete Beach are 30 to 34 minutes (367 commuters, 20.4%) for males and 20 to 24 minutes (247 commuters, 19.4%) for females.
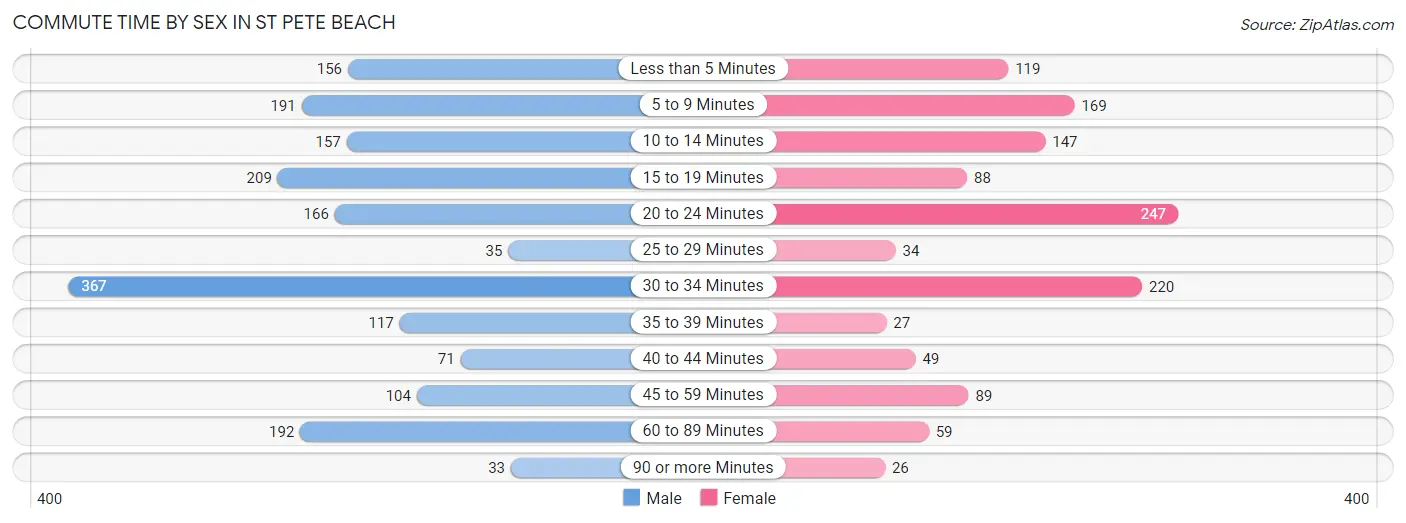
| Commute Time | Male | Female |
| Less than 5 Minutes | 156 (8.7%) | 119 (9.3%) |
| 5 to 9 Minutes | 191 (10.6%) | 169 (13.3%) |
| 10 to 14 Minutes | 157 (8.7%) | 147 (11.5%) |
| 15 to 19 Minutes | 209 (11.6%) | 88 (6.9%) |
| 20 to 24 Minutes | 166 (9.2%) | 247 (19.4%) |
| 25 to 29 Minutes | 35 (1.9%) | 34 (2.7%) |
| 30 to 34 Minutes | 367 (20.4%) | 220 (17.3%) |
| 35 to 39 Minutes | 117 (6.5%) | 27 (2.1%) |
| 40 to 44 Minutes | 71 (4.0%) | 49 (3.8%) |
| 45 to 59 Minutes | 104 (5.8%) | 89 (7.0%) |
| 60 to 89 Minutes | 192 (10.7%) | 59 (4.6%) |
| 90 or more Minutes | 33 (1.8%) | 26 (2.0%) |
Time of Departure to Work by Sex in St Pete Beach
The most frequent times of departure to work in St Pete Beach are 7:00 AM to 7:29 AM (639, 35.5%) for males and 7:00 AM to 7:29 AM (245, 19.2%) for females.
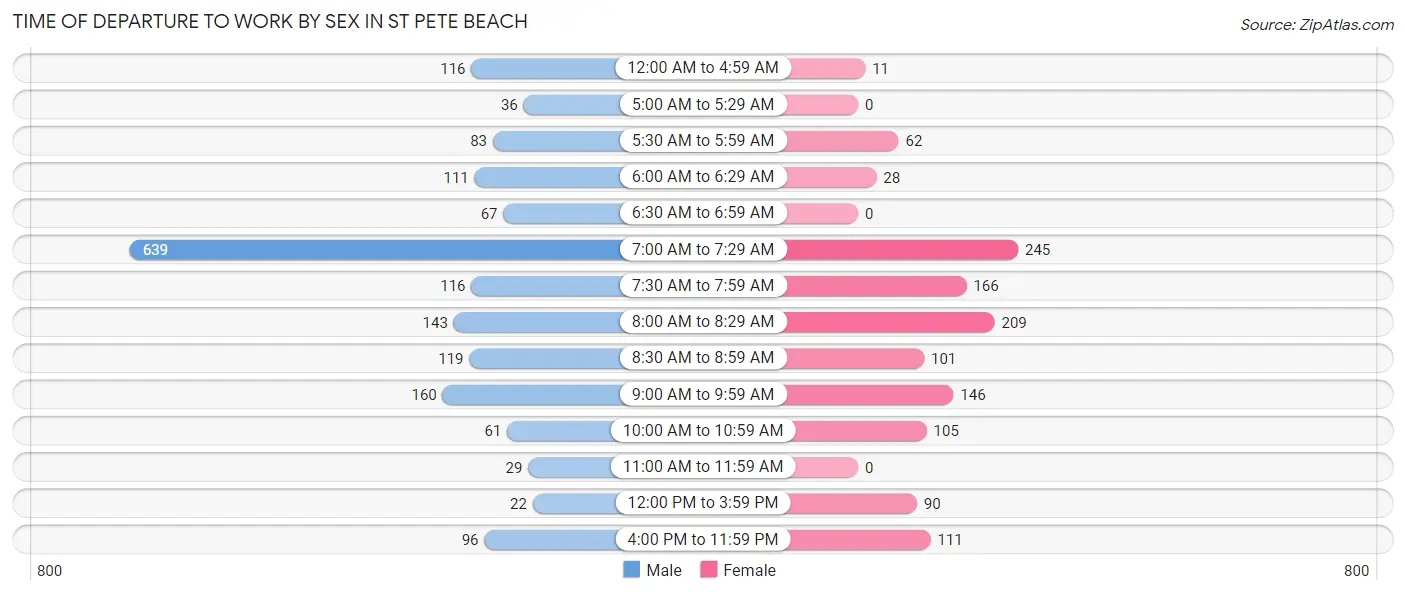
| Time of Departure | Male | Female |
| 12:00 AM to 4:59 AM | 116 (6.5%) | 11 (0.9%) |
| 5:00 AM to 5:29 AM | 36 (2.0%) | 0 (0.0%) |
| 5:30 AM to 5:59 AM | 83 (4.6%) | 62 (4.9%) |
| 6:00 AM to 6:29 AM | 111 (6.2%) | 28 (2.2%) |
| 6:30 AM to 6:59 AM | 67 (3.7%) | 0 (0.0%) |
| 7:00 AM to 7:29 AM | 639 (35.5%) | 245 (19.2%) |
| 7:30 AM to 7:59 AM | 116 (6.5%) | 166 (13.0%) |
| 8:00 AM to 8:29 AM | 143 (8.0%) | 209 (16.4%) |
| 8:30 AM to 8:59 AM | 119 (6.6%) | 101 (7.9%) |
| 9:00 AM to 9:59 AM | 160 (8.9%) | 146 (11.5%) |
| 10:00 AM to 10:59 AM | 61 (3.4%) | 105 (8.2%) |
| 11:00 AM to 11:59 AM | 29 (1.6%) | 0 (0.0%) |
| 12:00 PM to 3:59 PM | 22 (1.2%) | 90 (7.1%) |
| 4:00 PM to 11:59 PM | 96 (5.3%) | 111 (8.7%) |
| Total | 1,798 (100.0%) | 1,274 (100.0%) |
Housing Occupancy in St Pete Beach
Occupancy by Ownership in St Pete Beach
Of the total 4,552 dwellings in St Pete Beach, owner-occupied units account for 3,382 (74.3%), while renter-occupied units make up 1,170 (25.7%).
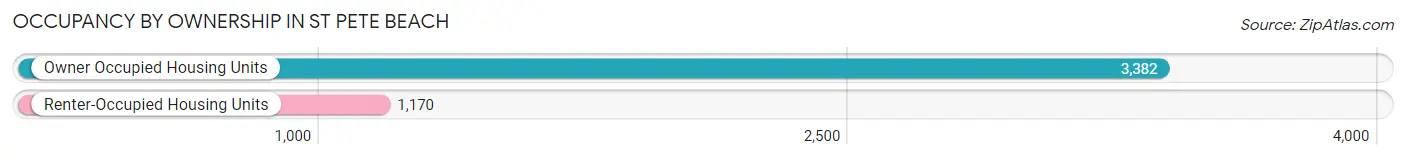
| Occupancy | # Housing Units | % Housing Units |
| Owner Occupied Housing Units | 3,382 | 74.3% |
| Renter-Occupied Housing Units | 1,170 | 25.7% |
| Total Occupied Housing Units | 4,552 | 100.0% |
Occupancy by Household Size in St Pete Beach
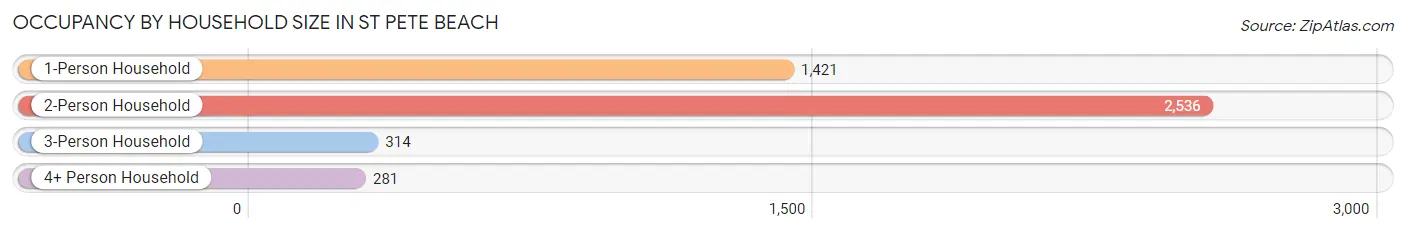
| Household Size | # Housing Units | % Housing Units |
| 1-Person Household | 1,421 | 31.2% |
| 2-Person Household | 2,536 | 55.7% |
| 3-Person Household | 314 | 6.9% |
| 4+ Person Household | 281 | 6.2% |
| Total Housing Units | 4,552 | 100.0% |
Occupancy by Ownership by Household Size in St Pete Beach
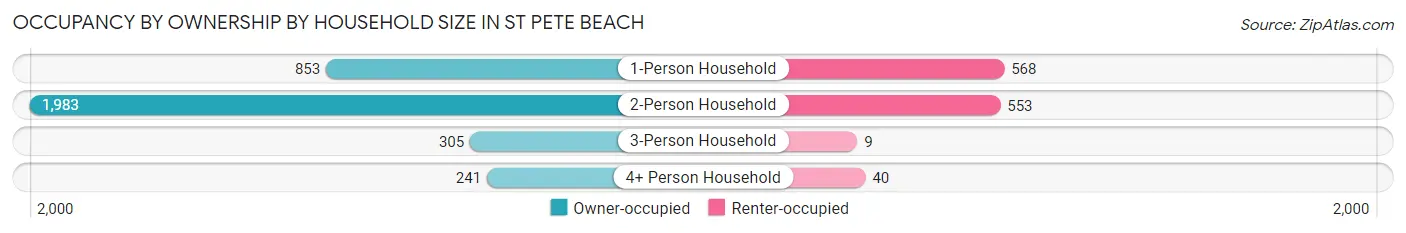
| Household Size | Owner-occupied | Renter-occupied |
| 1-Person Household | 853 (60.0%) | 568 (40.0%) |
| 2-Person Household | 1,983 (78.2%) | 553 (21.8%) |
| 3-Person Household | 305 (97.1%) | 9 (2.9%) |
| 4+ Person Household | 241 (85.8%) | 40 (14.2%) |
| Total Housing Units | 3,382 (74.3%) | 1,170 (25.7%) |
Occupancy by Educational Attainment in St Pete Beach
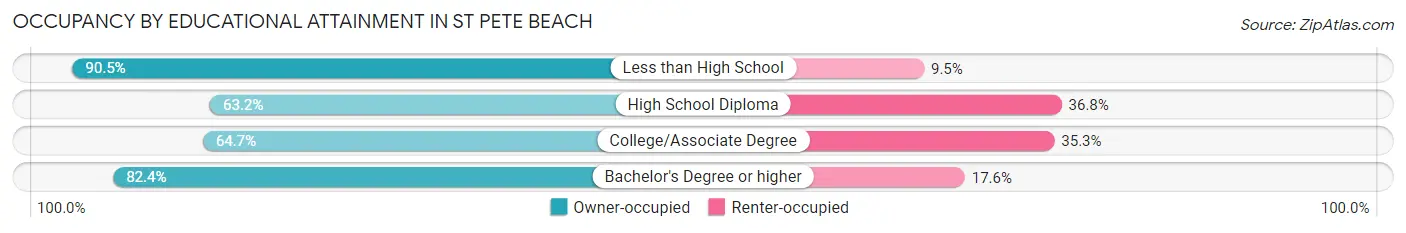
| Household Size | Owner-occupied | Renter-occupied |
| Less than High School | 124 (90.5%) | 13 (9.5%) |
| High School Diploma | 485 (63.2%) | 282 (36.8%) |
| College/Associate Degree | 851 (64.7%) | 465 (35.3%) |
| Bachelor's Degree or higher | 1,922 (82.4%) | 410 (17.6%) |
Occupancy by Age of Householder in St Pete Beach
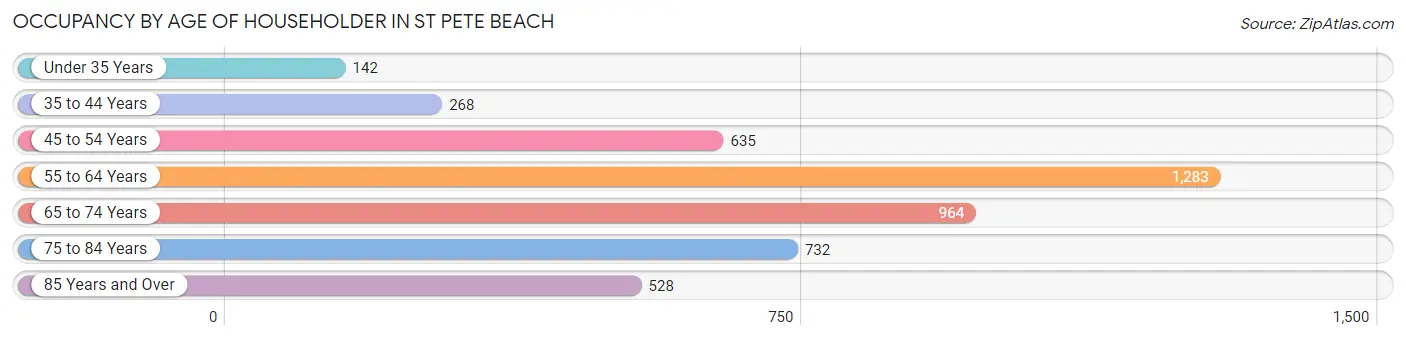
| Age Bracket | # Households | % Households |
| Under 35 Years | 142 | 3.1% |
| 35 to 44 Years | 268 | 5.9% |
| 45 to 54 Years | 635 | 14.0% |
| 55 to 64 Years | 1,283 | 28.2% |
| 65 to 74 Years | 964 | 21.2% |
| 75 to 84 Years | 732 | 16.1% |
| 85 Years and Over | 528 | 11.6% |
| Total | 4,552 | 100.0% |
Housing Finances in St Pete Beach
Median Income by Occupancy in St Pete Beach
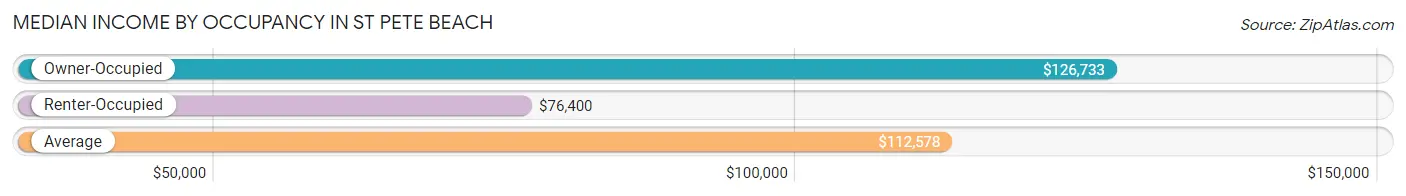
| Occupancy Type | # Households | Median Income |
| Owner-Occupied | 3,382 (74.3%) | $126,733 |
| Renter-Occupied | 1,170 (25.7%) | $76,400 |
| Average | 4,552 (100.0%) | $112,578 |
Occupancy by Householder Income Bracket in St Pete Beach
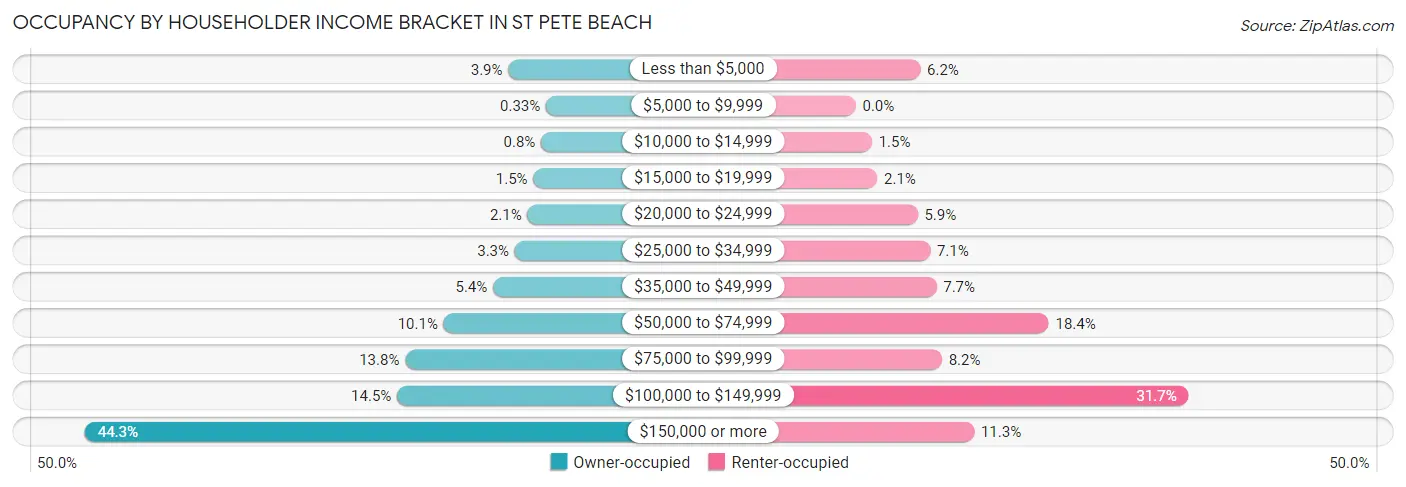
| Income Bracket | Owner-occupied | Renter-occupied |
| Less than $5,000 | 133 (3.9%) | 72 (6.1%) |
| $5,000 to $9,999 | 11 (0.3%) | 0 (0.0%) |
| $10,000 to $14,999 | 27 (0.8%) | 18 (1.5%) |
| $15,000 to $19,999 | 52 (1.5%) | 24 (2.1%) |
| $20,000 to $24,999 | 71 (2.1%) | 69 (5.9%) |
| $25,000 to $34,999 | 112 (3.3%) | 83 (7.1%) |
| $35,000 to $49,999 | 182 (5.4%) | 90 (7.7%) |
| $50,000 to $74,999 | 341 (10.1%) | 215 (18.4%) |
| $75,000 to $99,999 | 465 (13.8%) | 96 (8.2%) |
| $100,000 to $149,999 | 491 (14.5%) | 371 (31.7%) |
| $150,000 or more | 1,497 (44.3%) | 132 (11.3%) |
| Total | 3,382 (100.0%) | 1,170 (100.0%) |
Monthly Housing Cost Tiers in St Pete Beach
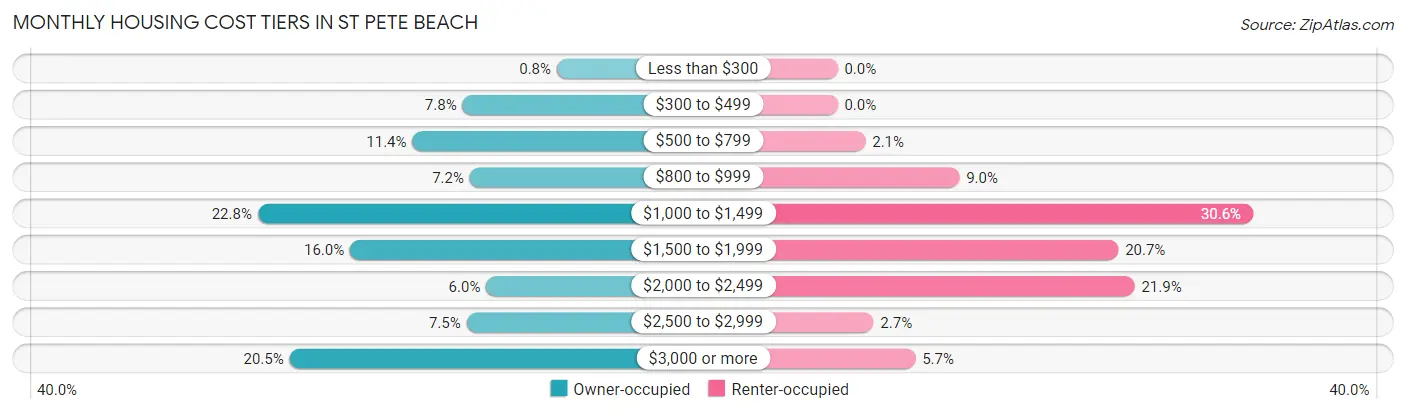
| Monthly Cost | Owner-occupied | Renter-occupied |
| Less than $300 | 27 (0.8%) | 0 (0.0%) |
| $300 to $499 | 262 (7.7%) | 0 (0.0%) |
| $500 to $799 | 387 (11.4%) | 24 (2.1%) |
| $800 to $999 | 244 (7.2%) | 105 (9.0%) |
| $1,000 to $1,499 | 772 (22.8%) | 358 (30.6%) |
| $1,500 to $1,999 | 542 (16.0%) | 242 (20.7%) |
| $2,000 to $2,499 | 203 (6.0%) | 256 (21.9%) |
| $2,500 to $2,999 | 252 (7.4%) | 31 (2.6%) |
| $3,000 or more | 693 (20.5%) | 67 (5.7%) |
| Total | 3,382 (100.0%) | 1,170 (100.0%) |
Physical Housing Characteristics in St Pete Beach
Housing Structures in St Pete Beach
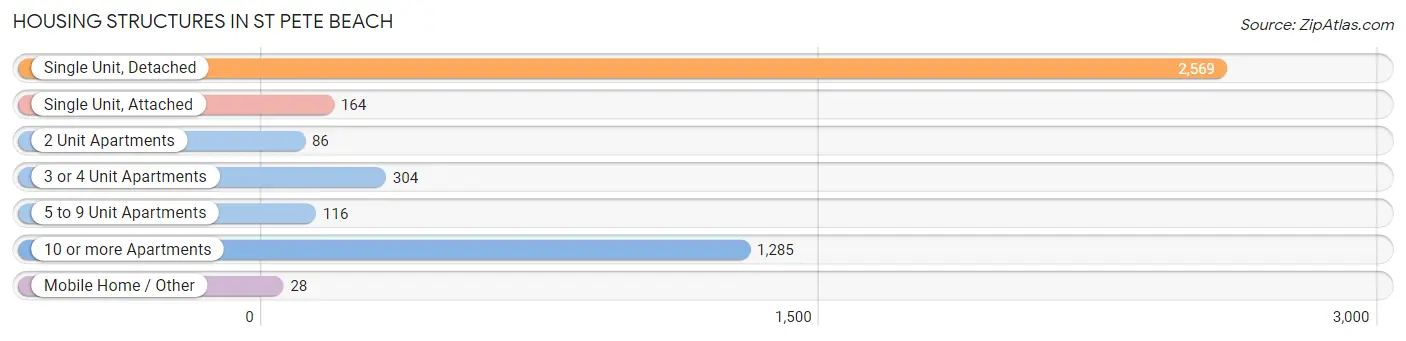
| Structure Type | # Housing Units | % Housing Units |
| Single Unit, Detached | 2,569 | 56.4% |
| Single Unit, Attached | 164 | 3.6% |
| 2 Unit Apartments | 86 | 1.9% |
| 3 or 4 Unit Apartments | 304 | 6.7% |
| 5 to 9 Unit Apartments | 116 | 2.5% |
| 10 or more Apartments | 1,285 | 28.2% |
| Mobile Home / Other | 28 | 0.6% |
| Total | 4,552 | 100.0% |
Housing Structures by Occupancy in St Pete Beach
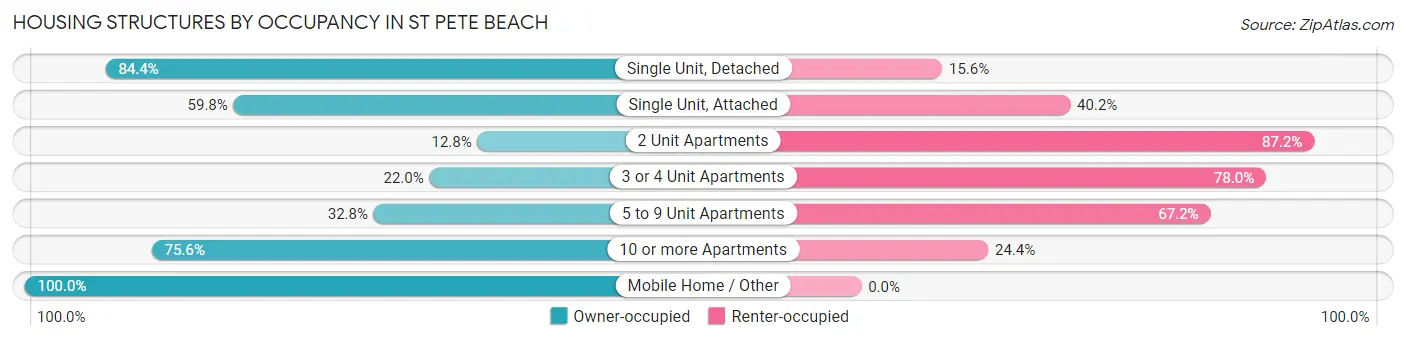
| Structure Type | Owner-occupied | Renter-occupied |
| Single Unit, Detached | 2,169 (84.4%) | 400 (15.6%) |
| Single Unit, Attached | 98 (59.8%) | 66 (40.2%) |
| 2 Unit Apartments | 11 (12.8%) | 75 (87.2%) |
| 3 or 4 Unit Apartments | 67 (22.0%) | 237 (78.0%) |
| 5 to 9 Unit Apartments | 38 (32.8%) | 78 (67.2%) |
| 10 or more Apartments | 971 (75.6%) | 314 (24.4%) |
| Mobile Home / Other | 28 (100.0%) | 0 (0.0%) |
| Total | 3,382 (74.3%) | 1,170 (25.7%) |
Housing Structures by Number of Rooms in St Pete Beach
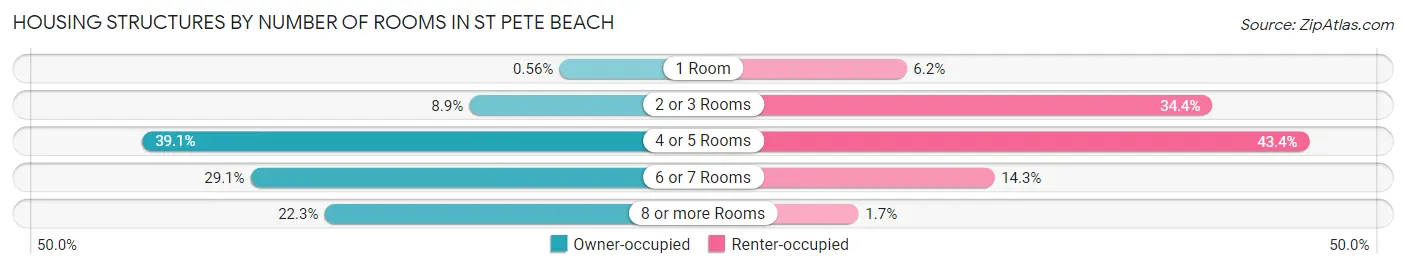
| Number of Rooms | Owner-occupied | Renter-occupied |
| 1 Room | 19 (0.6%) | 72 (6.1%) |
| 2 or 3 Rooms | 301 (8.9%) | 403 (34.4%) |
| 4 or 5 Rooms | 1,323 (39.1%) | 508 (43.4%) |
| 6 or 7 Rooms | 985 (29.1%) | 167 (14.3%) |
| 8 or more Rooms | 754 (22.3%) | 20 (1.7%) |
| Total | 3,382 (100.0%) | 1,170 (100.0%) |
Housing Structure by Heating Type in St Pete Beach
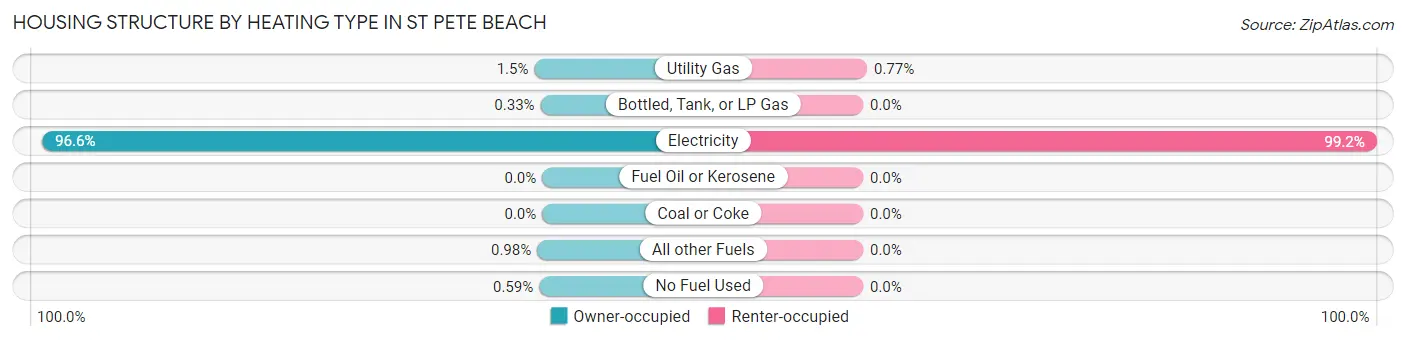
| Heating Type | Owner-occupied | Renter-occupied |
| Utility Gas | 51 (1.5%) | 9 (0.8%) |
| Bottled, Tank, or LP Gas | 11 (0.3%) | 0 (0.0%) |
| Electricity | 3,267 (96.6%) | 1,161 (99.2%) |
| Fuel Oil or Kerosene | 0 (0.0%) | 0 (0.0%) |
| Coal or Coke | 0 (0.0%) | 0 (0.0%) |
| All other Fuels | 33 (1.0%) | 0 (0.0%) |
| No Fuel Used | 20 (0.6%) | 0 (0.0%) |
| Total | 3,382 (100.0%) | 1,170 (100.0%) |
Household Vehicle Usage in St Pete Beach
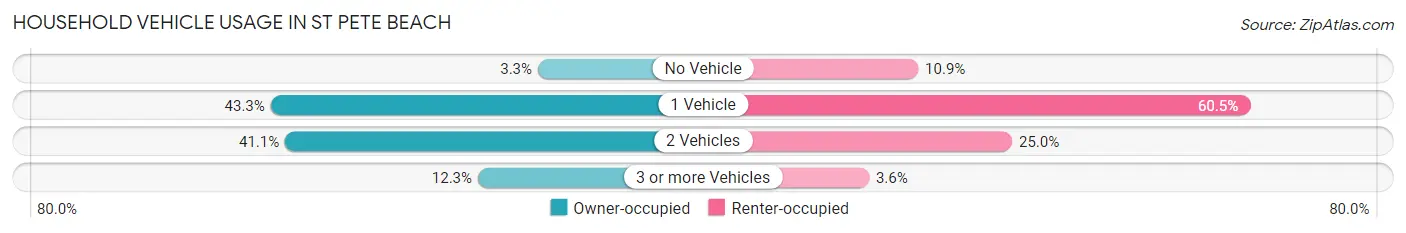
| Vehicles per Household | Owner-occupied | Renter-occupied |
| No Vehicle | 113 (3.3%) | 128 (10.9%) |
| 1 Vehicle | 1,463 (43.3%) | 708 (60.5%) |
| 2 Vehicles | 1,390 (41.1%) | 292 (25.0%) |
| 3 or more Vehicles | 416 (12.3%) | 42 (3.6%) |
| Total | 3,382 (100.0%) | 1,170 (100.0%) |
Real Estate & Mortgages in St Pete Beach
Real Estate and Mortgage Overview in St Pete Beach
| Characteristic | Without Mortgage | With Mortgage |
| Housing Units | 2,058 | 1,324 |
| Median Property Value | $558,000 | $687,300 |
| Median Household Income | $100,132 | $790 |
| Monthly Housing Costs | $1,062 | $638 |
| Real Estate Taxes | $4,522 | $39 |
Property Value by Mortgage Status in St Pete Beach
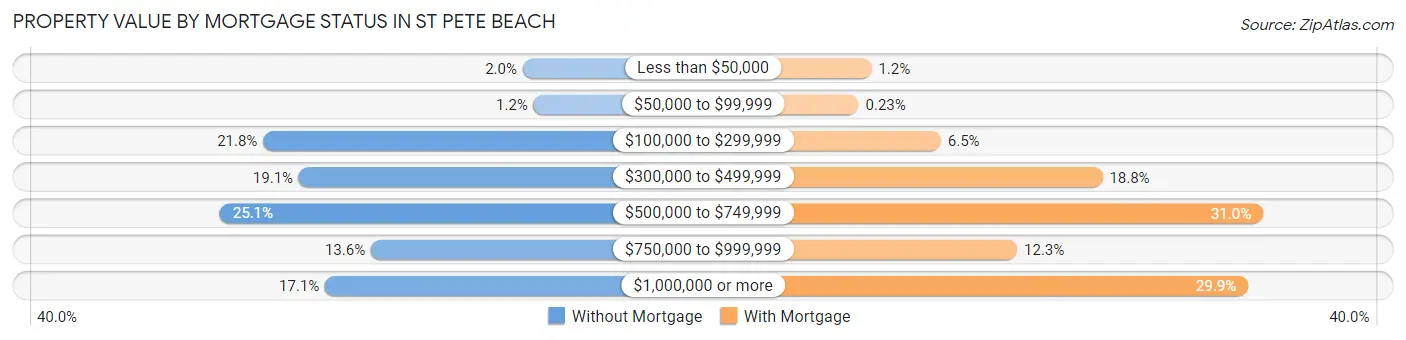
| Property Value | Without Mortgage | With Mortgage |
| Less than $50,000 | 42 (2.0%) | 16 (1.2%) |
| $50,000 to $99,999 | 25 (1.2%) | 3 (0.2%) |
| $100,000 to $299,999 | 449 (21.8%) | 86 (6.5%) |
| $300,000 to $499,999 | 393 (19.1%) | 249 (18.8%) |
| $500,000 to $749,999 | 517 (25.1%) | 411 (31.0%) |
| $750,000 to $999,999 | 280 (13.6%) | 163 (12.3%) |
| $1,000,000 or more | 352 (17.1%) | 396 (29.9%) |
| Total | 2,058 (100.0%) | 1,324 (100.0%) |
Household Income by Mortgage Status in St Pete Beach
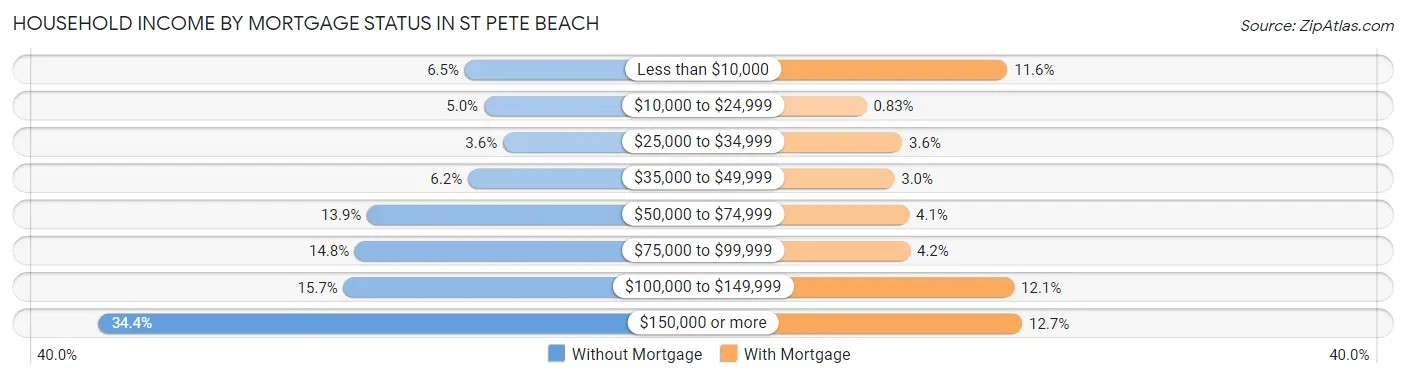
| Household Income | Without Mortgage | With Mortgage |
| Less than $10,000 | 133 (6.5%) | 153 (11.6%) |
| $10,000 to $24,999 | 103 (5.0%) | 11 (0.8%) |
| $25,000 to $34,999 | 73 (3.5%) | 47 (3.5%) |
| $35,000 to $49,999 | 128 (6.2%) | 39 (2.9%) |
| $50,000 to $74,999 | 286 (13.9%) | 54 (4.1%) |
| $75,000 to $99,999 | 305 (14.8%) | 55 (4.2%) |
| $100,000 to $149,999 | 323 (15.7%) | 160 (12.1%) |
| $150,000 or more | 707 (34.4%) | 168 (12.7%) |
| Total | 2,058 (100.0%) | 1,324 (100.0%) |
Property Value to Household Income Ratio in St Pete Beach
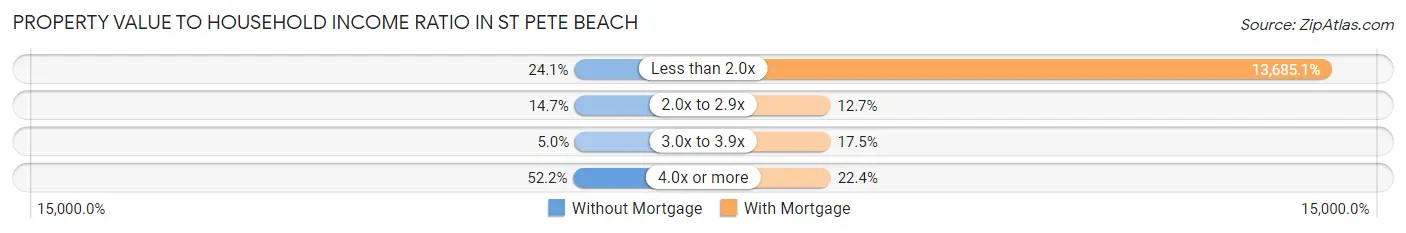
| Value-to-Income Ratio | Without Mortgage | With Mortgage |
| Less than 2.0x | 496 (24.1%) | 181,190 (13,685.1%) |
| 2.0x to 2.9x | 302 (14.7%) | 168 (12.7%) |
| 3.0x to 3.9x | 102 (5.0%) | 231 (17.4%) |
| 4.0x or more | 1,074 (52.2%) | 297 (22.4%) |
| Total | 2,058 (100.0%) | 1,324 (100.0%) |
Real Estate Taxes by Mortgage Status in St Pete Beach
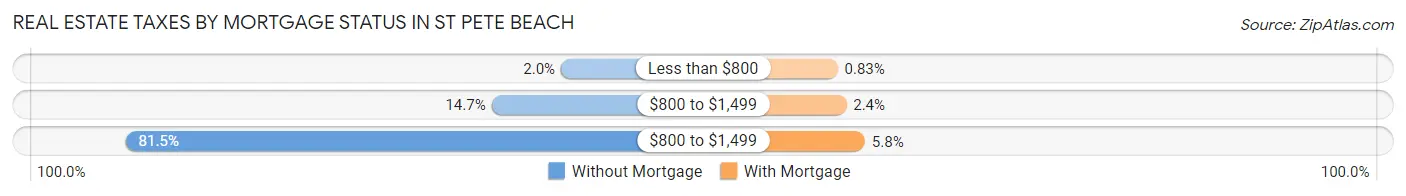
| Property Taxes | Without Mortgage | With Mortgage |
| Less than $800 | 42 (2.0%) | 11 (0.8%) |
| $800 to $1,499 | 303 (14.7%) | 32 (2.4%) |
| $800 to $1,499 | 1,678 (81.5%) | 77 (5.8%) |
| Total | 2,058 (100.0%) | 1,324 (100.0%) |
Health & Disability in St Pete Beach
Health Insurance Coverage by Age in St Pete Beach
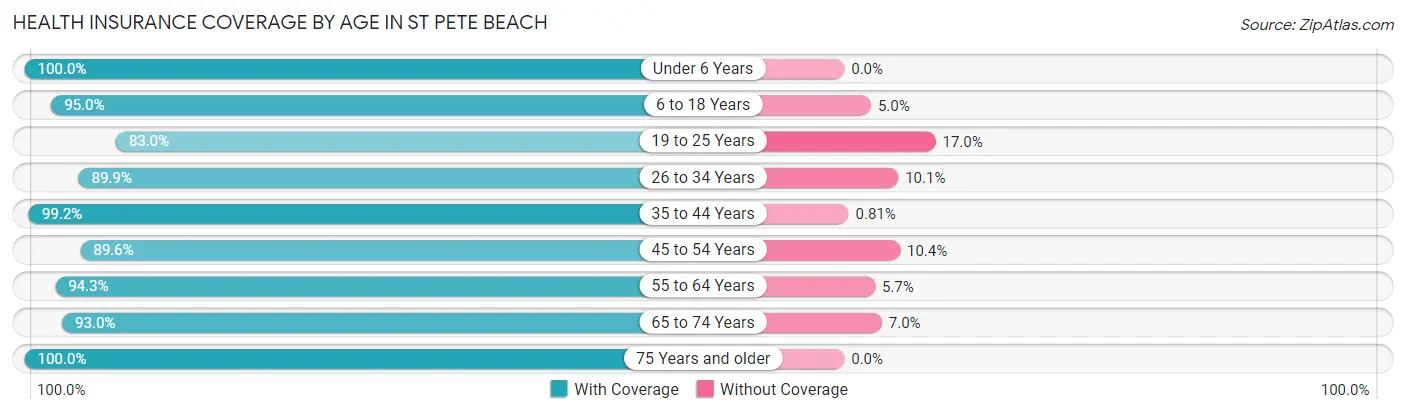
| Age Bracket | With Coverage | Without Coverage |
| Under 6 Years | 51 (100.0%) | 0 (0.0%) |
| 6 to 18 Years | 478 (95.0%) | 25 (5.0%) |
| 19 to 25 Years | 327 (83.0%) | 67 (17.0%) |
| 26 to 34 Years | 456 (89.9%) | 51 (10.1%) |
| 35 to 44 Years | 488 (99.2%) | 4 (0.8%) |
| 45 to 54 Years | 1,069 (89.6%) | 124 (10.4%) |
| 55 to 64 Years | 2,060 (94.3%) | 125 (5.7%) |
| 65 to 74 Years | 1,460 (93.0%) | 110 (7.0%) |
| 75 Years and older | 2,000 (100.0%) | 0 (0.0%) |
| Total | 8,389 (94.3%) | 506 (5.7%) |
Health Insurance Coverage by Citizenship Status in St Pete Beach
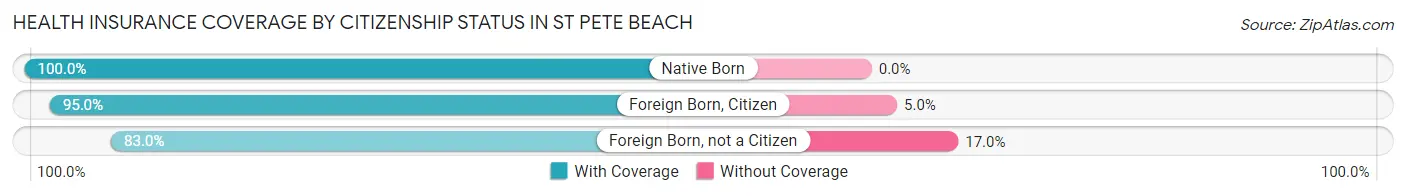
| Citizenship Status | With Coverage | Without Coverage |
| Native Born | 51 (100.0%) | 0 (0.0%) |
| Foreign Born, Citizen | 478 (95.0%) | 25 (5.0%) |
| Foreign Born, not a Citizen | 327 (83.0%) | 67 (17.0%) |
Health Insurance Coverage by Household Income in St Pete Beach
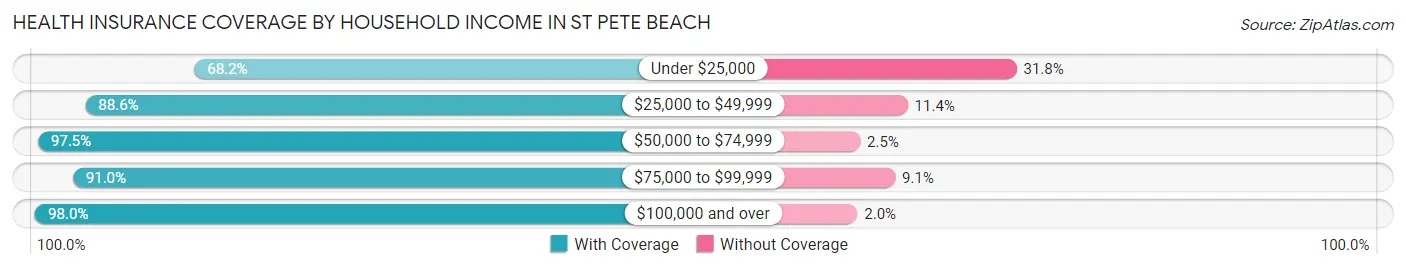
| Household Income | With Coverage | Without Coverage |
| Under $25,000 | 416 (68.2%) | 194 (31.8%) |
| $25,000 to $49,999 | 622 (88.6%) | 80 (11.4%) |
| $50,000 to $74,999 | 901 (97.5%) | 23 (2.5%) |
| $75,000 to $99,999 | 985 (90.9%) | 98 (9.0%) |
| $100,000 and over | 5,452 (98.0%) | 110 (2.0%) |
Public vs Private Health Insurance Coverage by Age in St Pete Beach
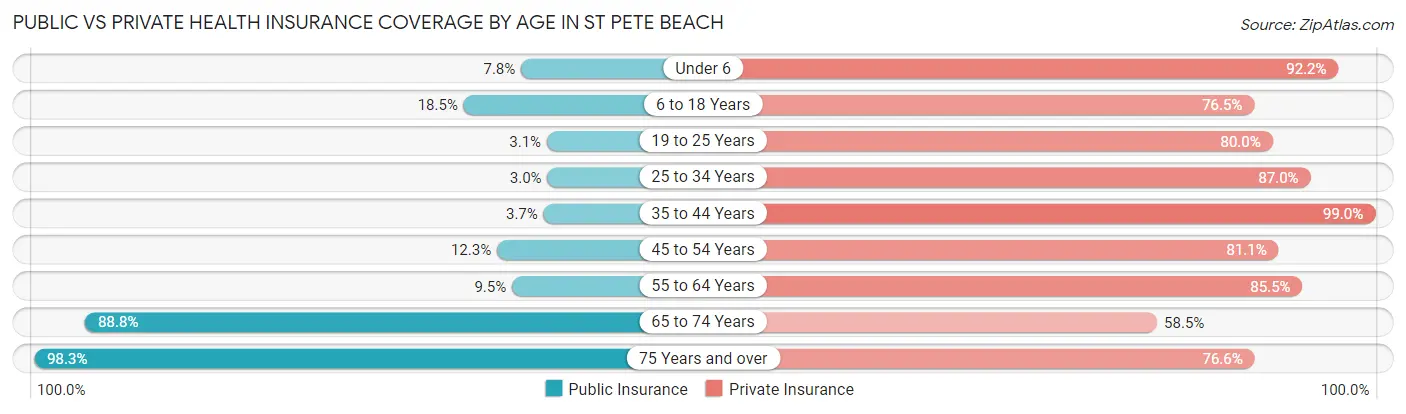
| Age Bracket | Public Insurance | Private Insurance |
| Under 6 | 4 (7.8%) | 47 (92.2%) |
| 6 to 18 Years | 93 (18.5%) | 385 (76.5%) |
| 19 to 25 Years | 12 (3.0%) | 315 (79.9%) |
| 25 to 34 Years | 15 (3.0%) | 441 (87.0%) |
| 35 to 44 Years | 18 (3.7%) | 487 (99.0%) |
| 45 to 54 Years | 147 (12.3%) | 967 (81.1%) |
| 55 to 64 Years | 208 (9.5%) | 1,868 (85.5%) |
| 65 to 74 Years | 1,394 (88.8%) | 919 (58.5%) |
| 75 Years and over | 1,965 (98.3%) | 1,532 (76.6%) |
| Total | 3,856 (43.3%) | 6,961 (78.3%) |
Disability Status by Sex by Age in St Pete Beach
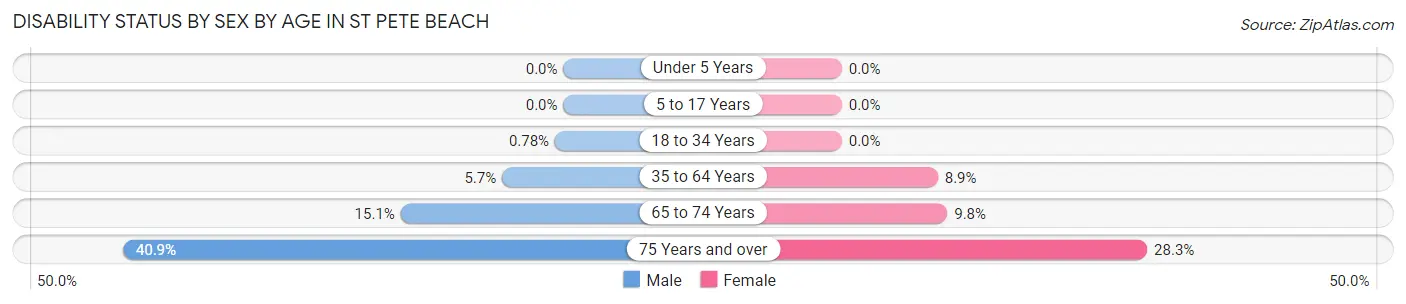
| Age Bracket | Male | Female |
| Under 5 Years | 0 (0.0%) | 0 (0.0%) |
| 5 to 17 Years | 0 (0.0%) | 0 (0.0%) |
| 18 to 34 Years | 5 (0.8%) | 0 (0.0%) |
| 35 to 64 Years | 111 (5.7%) | 171 (8.9%) |
| 65 to 74 Years | 106 (15.1%) | 85 (9.8%) |
| 75 Years and over | 457 (40.9%) | 250 (28.3%) |
Disability Class by Sex by Age in St Pete Beach
Disability Class: Hearing Difficulty
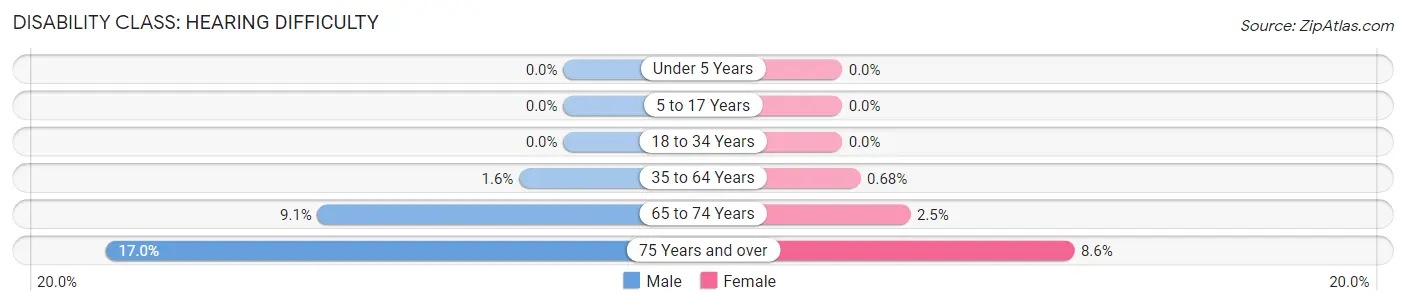
| Age Bracket | Male | Female |
| Under 5 Years | 0 (0.0%) | 0 (0.0%) |
| 5 to 17 Years | 0 (0.0%) | 0 (0.0%) |
| 18 to 34 Years | 0 (0.0%) | 0 (0.0%) |
| 35 to 64 Years | 32 (1.6%) | 13 (0.7%) |
| 65 to 74 Years | 64 (9.1%) | 22 (2.5%) |
| 75 Years and over | 190 (17.0%) | 76 (8.6%) |
Disability Class: Vision Difficulty
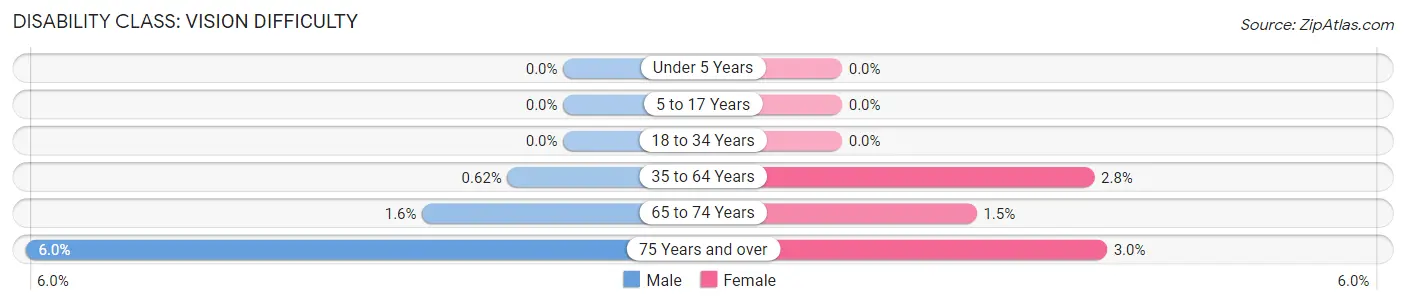
| Age Bracket | Male | Female |
| Under 5 Years | 0 (0.0%) | 0 (0.0%) |
| 5 to 17 Years | 0 (0.0%) | 0 (0.0%) |
| 18 to 34 Years | 0 (0.0%) | 0 (0.0%) |
| 35 to 64 Years | 12 (0.6%) | 54 (2.8%) |
| 65 to 74 Years | 11 (1.6%) | 13 (1.5%) |
| 75 Years and over | 67 (6.0%) | 26 (2.9%) |
Disability Class: Cognitive Difficulty
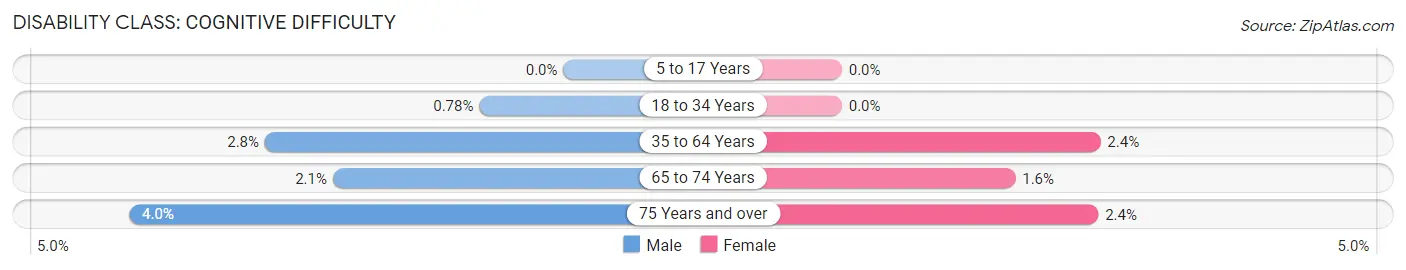
| Age Bracket | Male | Female |
| 5 to 17 Years | 0 (0.0%) | 0 (0.0%) |
| 18 to 34 Years | 5 (0.8%) | 0 (0.0%) |
| 35 to 64 Years | 54 (2.8%) | 46 (2.4%) |
| 65 to 74 Years | 15 (2.1%) | 14 (1.6%) |
| 75 Years and over | 45 (4.0%) | 21 (2.4%) |
Disability Class: Ambulatory Difficulty
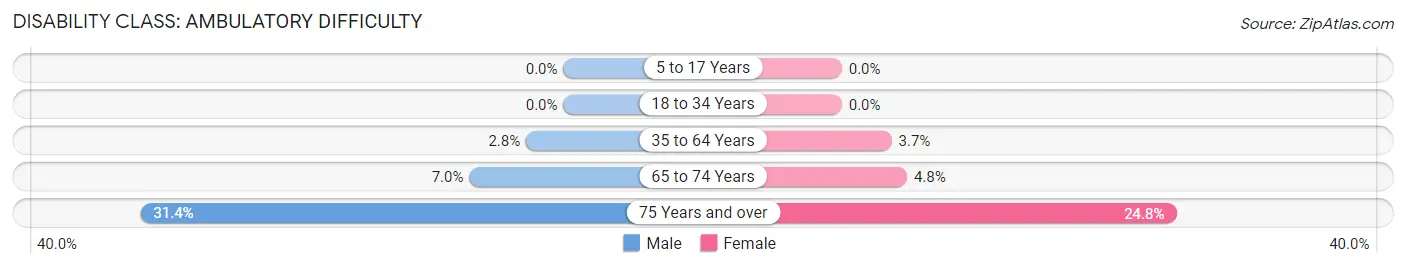
| Age Bracket | Male | Female |
| 5 to 17 Years | 0 (0.0%) | 0 (0.0%) |
| 18 to 34 Years | 0 (0.0%) | 0 (0.0%) |
| 35 to 64 Years | 54 (2.8%) | 71 (3.7%) |
| 65 to 74 Years | 49 (7.0%) | 42 (4.8%) |
| 75 Years and over | 351 (31.4%) | 219 (24.8%) |
Disability Class: Self-Care Difficulty
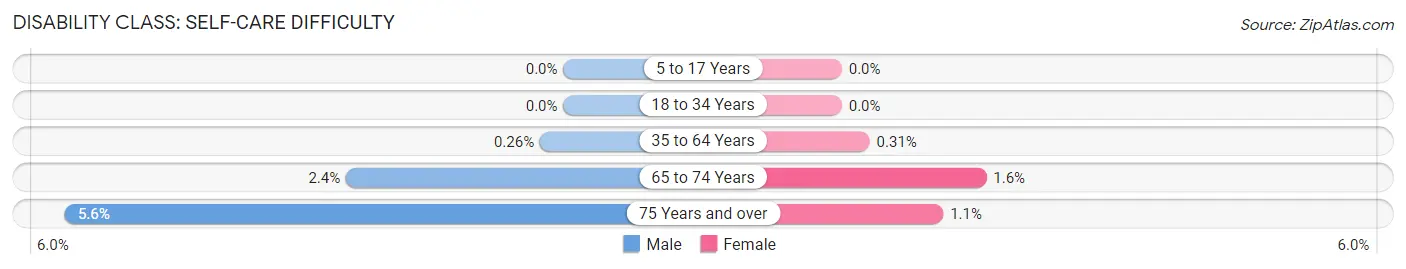
| Age Bracket | Male | Female |
| 5 to 17 Years | 0 (0.0%) | 0 (0.0%) |
| 18 to 34 Years | 0 (0.0%) | 0 (0.0%) |
| 35 to 64 Years | 5 (0.3%) | 6 (0.3%) |
| 65 to 74 Years | 17 (2.4%) | 14 (1.6%) |
| 75 Years and over | 62 (5.6%) | 10 (1.1%) |
Technology Access in St Pete Beach
Computing Device Access in St Pete Beach
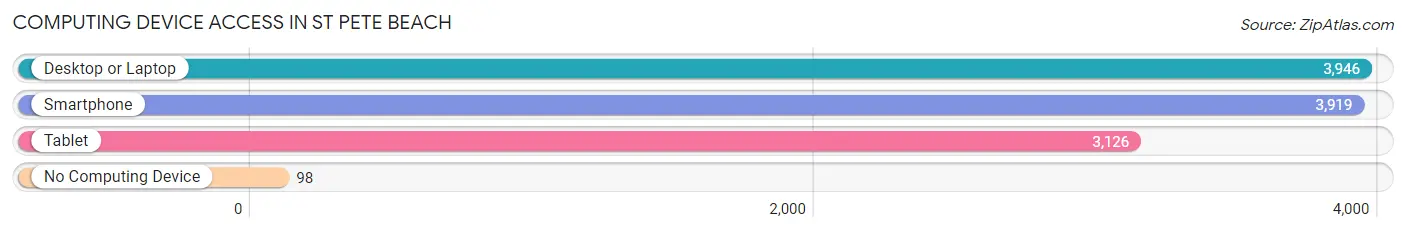
| Device Type | # Households | % Households |
| Desktop or Laptop | 3,946 | 86.7% |
| Smartphone | 3,919 | 86.1% |
| Tablet | 3,126 | 68.7% |
| No Computing Device | 98 | 2.1% |
| Total | 4,552 | 100.0% |
Internet Access in St Pete Beach
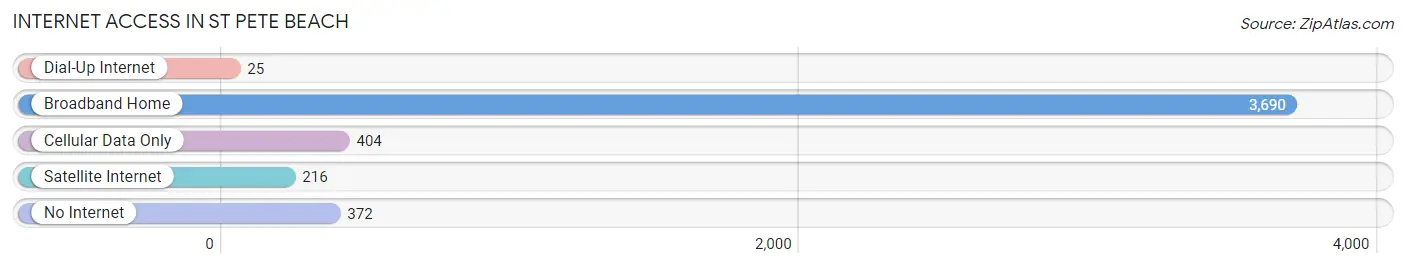
| Internet Type | # Households | % Households |
| Dial-Up Internet | 25 | 0.5% |
| Broadband Home | 3,690 | 81.1% |
| Cellular Data Only | 404 | 8.9% |
| Satellite Internet | 216 | 4.8% |
| No Internet | 372 | 8.2% |
| Total | 4,552 | 100.0% |
St Pete Beach Summary
St. Pete Beach is a city located in Pinellas County, Florida, United States, on the Gulf of Mexico. It is part of the Tampa Bay Area metropolitan area. The population was 9,346 at the 2010 census.
Geography
St. Pete Beach is located at 27°45′N 82°47′W (27.75, -82.78). According to the United States Census Bureau, the city has a total area of 5.4 square miles (14.0 km2), of which 4.2 square miles (10.9 km2) is land and 1.2 square miles (3.1 km2) (22.22%) is water.
History
St. Pete Beach was originally inhabited by the Tocobaga people. The area was explored by Spanish explorers in the 16th century, who named it La Florida. The area was later settled by pioneers in the late 19th century. The city was incorporated in 1957.
Economy
St. Pete Beach is a popular tourist destination, with many hotels, restaurants, and attractions. The city is also home to several corporate headquarters, including the headquarters of the Raymond James Financial Corporation.
Demographics
As of the census of 2000, there were 9,346 people, 4,817 households, and 2,717 families residing in the city. The population density was 2,220.3 people per square mile (857.2/km2). There were 6,845 housing units at an average density of 1,637.2 per square mile (631.3/km2). The racial makeup of the city was 97.17% White, 0.50% African American, 0.17% Native American, 0.90% Asian, 0.02% Pacific Islander, 0.37% from other races, and 0.87% from two or more races. Hispanic or Latino of any race were 2.09% of the population.
There were 4,817 households, out of which 14.2% had children under the age of 18 living with them, 49.2% were married couples living together, 7.2% had a female householder with no husband present, and 40.7% were non-families. 33.2% of all households were made up of individuals, and 16.2% had someone living alone who was 65 years of age or older. The average household size was 1.93 and the average family size was 2.39.
In the city, the population was spread out, with 12.3% under the age of 18, 4.2% from 18 to 24, 22.2% from 25 to 44, 28.2% from 45 to 64, and 33.1% who were 65 years of age or older. The median age was 54 years. For every 100 females, there were 91.2 males. For every 100 females age 18 and over, there were 89.2 males.
The median income for a household in the city was $45,876, and the median income for a family was $54,845. Males had a median income of $41,890 versus $30,890 for females. The per capita income for the city was $32,945. About 4.2% of families and 6.7% of the population were below the poverty line, including 8.2% of those under age 18 and 4.2% of those age 65 or over.
Common Questions
What is Per Capita Income in St Pete Beach?
Per Capita income in St Pete Beach is $89,826.
What is the Median Family Income in St Pete Beach?
Median Family Income in St Pete Beach is $167,383.
What is the Median Household income in St Pete Beach?
Median Household Income in St Pete Beach is $112,578.
What is Income or Wage Gap in St Pete Beach?
Income or Wage Gap in St Pete Beach is 49.1%.
Women in St Pete Beach earn 50.9 cents for every dollar earned by a man.
What is Family Income Deficit in St Pete Beach?
Family Income Deficit in St Pete Beach is $13,132.
Families that are below poverty line in St Pete Beach earn $13,132 less on average than the poverty threshold level.
What is Inequality or Gini Index in St Pete Beach?
Inequality or Gini Index in St Pete Beach is 0.53.
What is the Total Population of St Pete Beach?
Total Population of St Pete Beach is 8,905.
What is the Total Male Population of St Pete Beach?
Total Male Population of St Pete Beach is 4,650.
What is the Total Female Population of St Pete Beach?
Total Female Population of St Pete Beach is 4,255.
What is the Ratio of Males per 100 Females in St Pete Beach?
There are 109.28 Males per 100 Females in St Pete Beach.
What is the Ratio of Females per 100 Males in St Pete Beach?
There are 91.51 Females per 100 Males in St Pete Beach.
What is the Median Population Age in St Pete Beach?
Median Population Age in St Pete Beach is 61.5 Years.
What is the Average Family Size in St Pete Beach
Average Family Size in St Pete Beach is 2.4 People.
What is the Average Household Size in St Pete Beach
Average Household Size in St Pete Beach is 1.9 People.
How Large is the Labor Force in St Pete Beach?
There are 4,145 People in the Labor Forcein in St Pete Beach.
What is the Percentage of People in the Labor Force in St Pete Beach?
49.2% of People are in the Labor Force in St Pete Beach.
What is the Unemployment Rate in St Pete Beach?
Unemployment Rate in St Pete Beach is 5.7%.