North Redington Beach, FL Map & Demographics
North Redington Beach Map
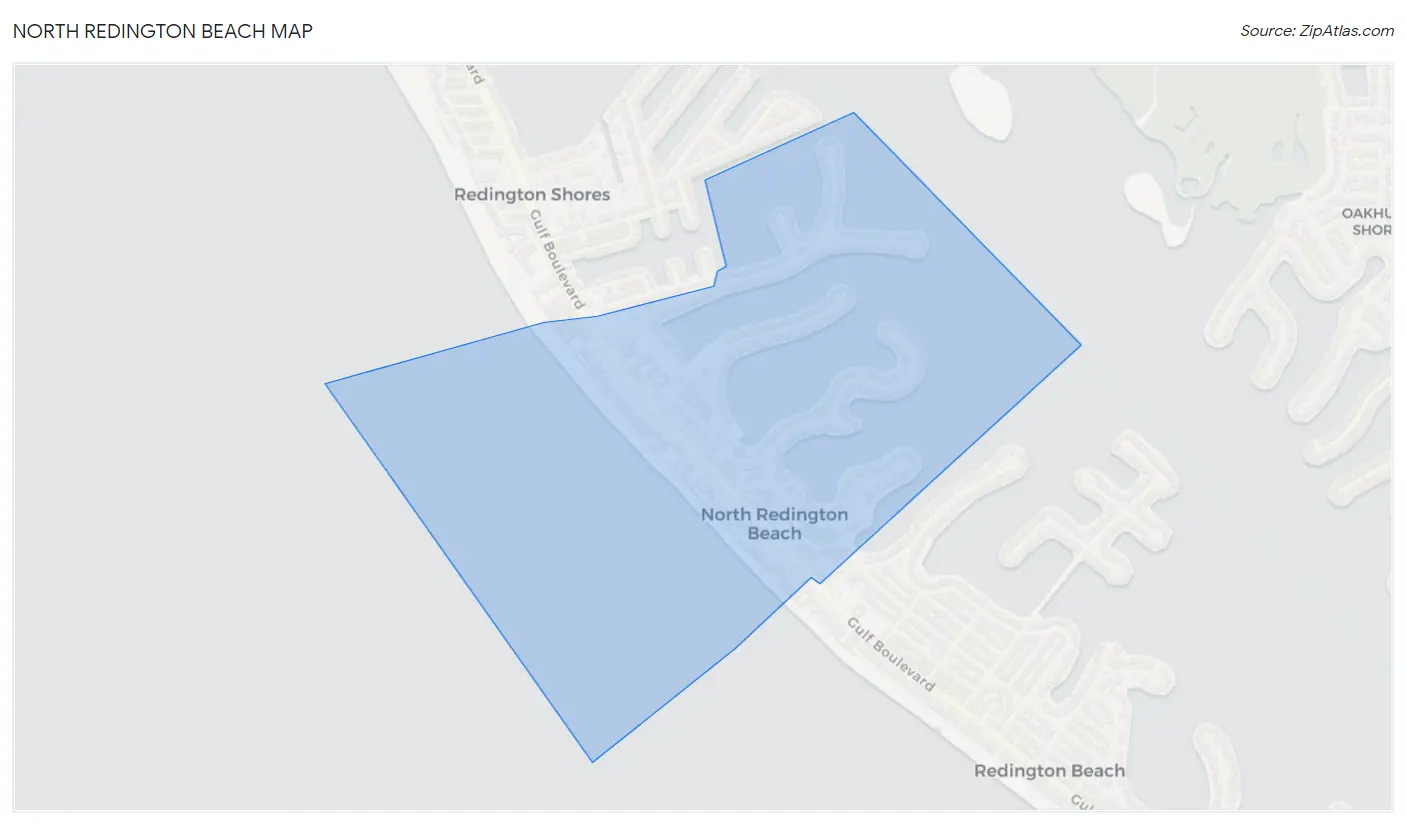
North Redington Beach Overview
$63,449
PER CAPITA INCOME
$99,063
AVG FAMILY INCOME
$83,750
AVG HOUSEHOLD INCOME
65.5%
WAGE / INCOME GAP [ % ]
34.5¢/ $1
WAGE / INCOME GAP [ $ ]
0.51
INEQUALITY / GINI INDEX
1,349
TOTAL POPULATION
575
MALE POPULATION
774
FEMALE POPULATION
74.29
MALES / 100 FEMALES
134.61
FEMALES / 100 MALES
61.5
MEDIAN AGE
2.6
AVG FAMILY SIZE
2.1
AVG HOUSEHOLD SIZE
565
LABOR FORCE [ PEOPLE ]
45.9%
PERCENT IN LABOR FORCE
12.0%
UNEMPLOYMENT RATE
North Redington Beach Area Codes
Income in North Redington Beach
Income Overview in North Redington Beach
Per Capita Income in North Redington Beach is $63,449, while median incomes of families and households are $99,063 and $83,750 respectively.
| Characteristic | Number | Measure |
| Per Capita Income | 1,349 | $63,449 |
| Median Family Income | 422 | $99,063 |
| Mean Family Income | 422 | $154,162 |
| Median Household Income | 635 | $83,750 |
| Mean Household Income | 635 | $130,780 |
| Income Deficit | 422 | $0 |
| Wage / Income Gap (%) | 1,349 | 65.51% |
| Wage / Income Gap ($) | 1,349 | 34.49¢ per $1 |
| Gini / Inequality Index | 1,349 | 0.51 |
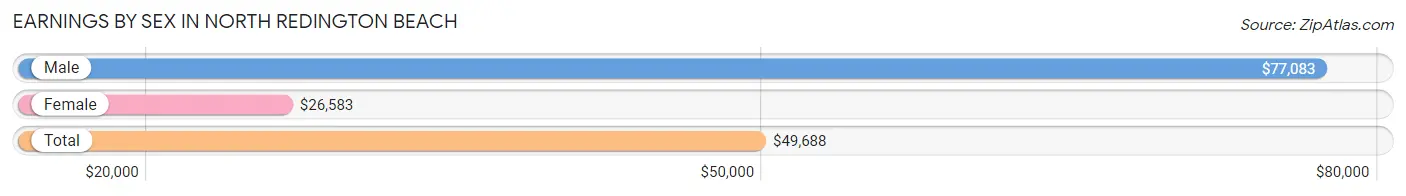
Earnings by Sex in North Redington Beach
Average Earnings in North Redington Beach are $49,688, $77,083 for men and $26,583 for women, a difference of 65.5%.
| Sex | Number | Average Earnings |
| Male | 248 (46.4%) | $77,083 |
| Female | 287 (53.6%) | $26,583 |
| Total | 535 (100.0%) | $49,688 |
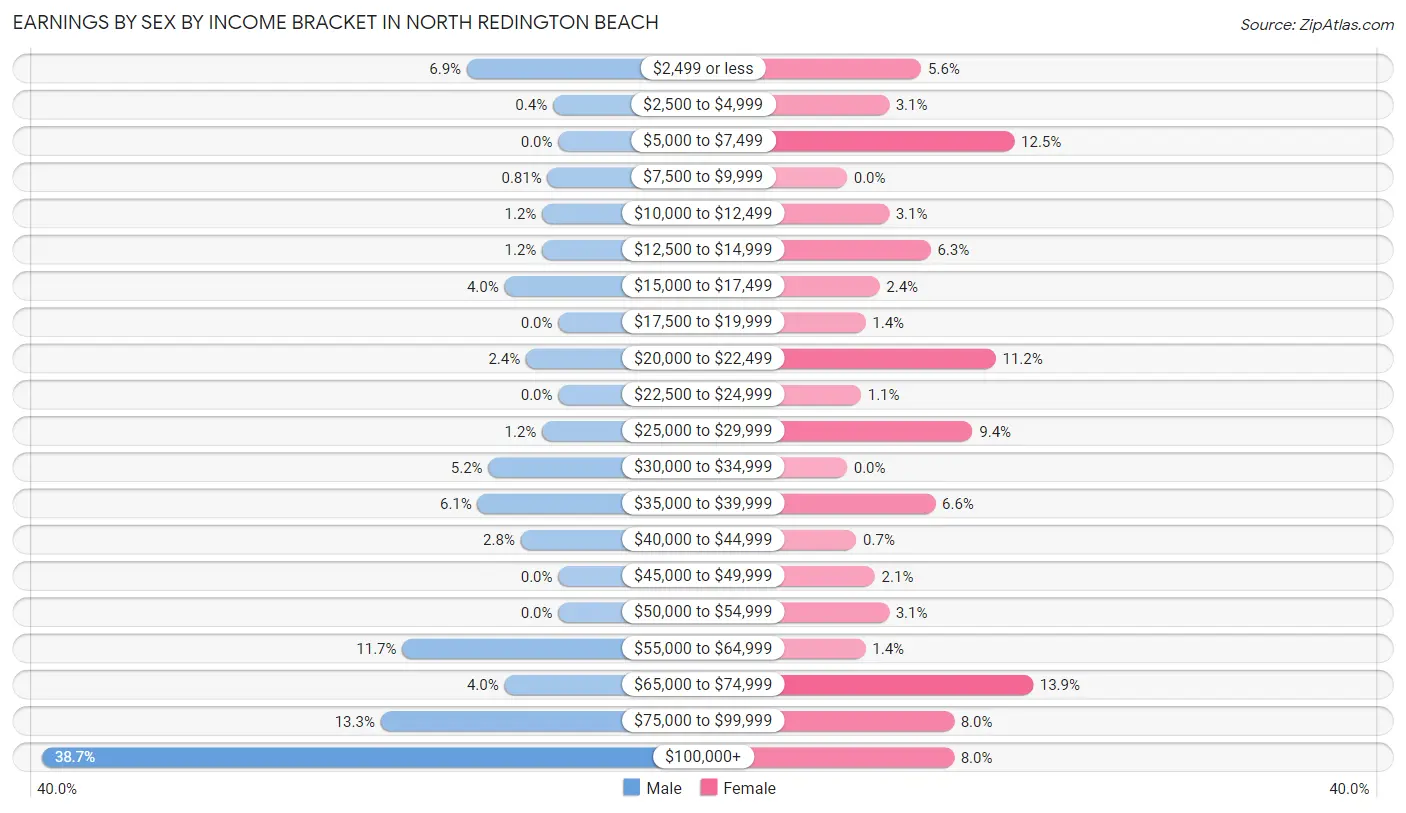
Earnings by Sex by Income Bracket in North Redington Beach
The most common earnings brackets in North Redington Beach are $100,000+ for men (96 | 38.7%) and $65,000 to $74,999 for women (40 | 13.9%).
| Income | Male | Female |
| $2,499 or less | 17 (6.9%) | 16 (5.6%) |
| $2,500 to $4,999 | 1 (0.4%) | 9 (3.1%) |
| $5,000 to $7,499 | 0 (0.0%) | 36 (12.5%) |
| $7,500 to $9,999 | 2 (0.8%) | 0 (0.0%) |
| $10,000 to $12,499 | 3 (1.2%) | 9 (3.1%) |
| $12,500 to $14,999 | 3 (1.2%) | 18 (6.3%) |
| $15,000 to $17,499 | 10 (4.0%) | 7 (2.4%) |
| $17,500 to $19,999 | 0 (0.0%) | 4 (1.4%) |
| $20,000 to $22,499 | 6 (2.4%) | 32 (11.2%) |
| $22,500 to $24,999 | 0 (0.0%) | 3 (1.1%) |
| $25,000 to $29,999 | 3 (1.2%) | 27 (9.4%) |
| $30,000 to $34,999 | 13 (5.2%) | 0 (0.0%) |
| $35,000 to $39,999 | 15 (6.0%) | 19 (6.6%) |
| $40,000 to $44,999 | 7 (2.8%) | 2 (0.7%) |
| $45,000 to $49,999 | 0 (0.0%) | 6 (2.1%) |
| $50,000 to $54,999 | 0 (0.0%) | 9 (3.1%) |
| $55,000 to $64,999 | 29 (11.7%) | 4 (1.4%) |
| $65,000 to $74,999 | 10 (4.0%) | 40 (13.9%) |
| $75,000 to $99,999 | 33 (13.3%) | 23 (8.0%) |
| $100,000+ | 96 (38.7%) | 23 (8.0%) |
| Total | 248 (100.0%) | 287 (100.0%) |
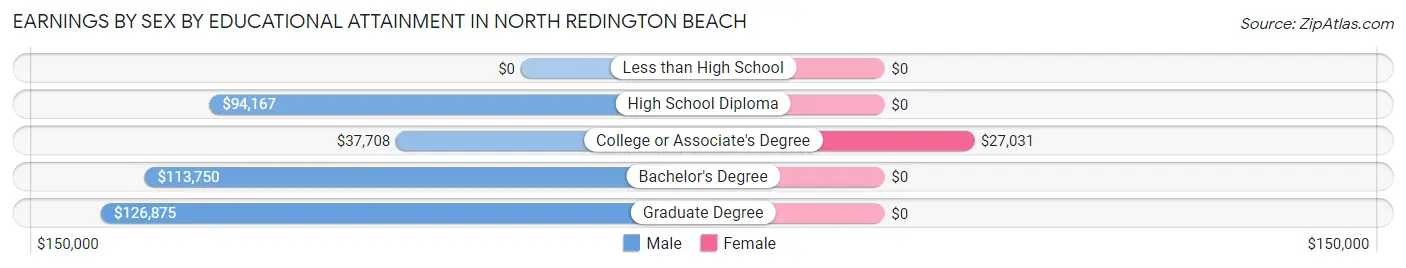
Earnings by Sex by Educational Attainment in North Redington Beach
Average earnings in North Redington Beach are $78,750 for men and $28,125 for women, a difference of 64.3%. Men with an educational attainment of graduate degree enjoy the highest average annual earnings of $126,875, while those with college or associate's degree education earn the least with $37,708. Women with an educational attainment of college or associate's degree earn the most with the average annual earnings of $27,031, while those with college or associate's degree education have the smallest earnings of $27,031.
| Educational Attainment | Male Income | Female Income |
| Less than High School | - | - |
| High School Diploma | $94,167 | $0 |
| College or Associate's Degree | $37,708 | $27,031 |
| Bachelor's Degree | $113,750 | $0 |
| Graduate Degree | $126,875 | $0 |
| Total | $78,750 | $28,125 |
Family Income in North Redington Beach
Family Income Brackets in North Redington Beach
According to the North Redington Beach family income data, there are 105 families falling into the $200,000+ income range, which is the most common income bracket and makes up 24.9% of all families. Conversely, the $15,000 to $24,999 income bracket is the least frequent group with only 5 families (1.2%) belonging to this category.
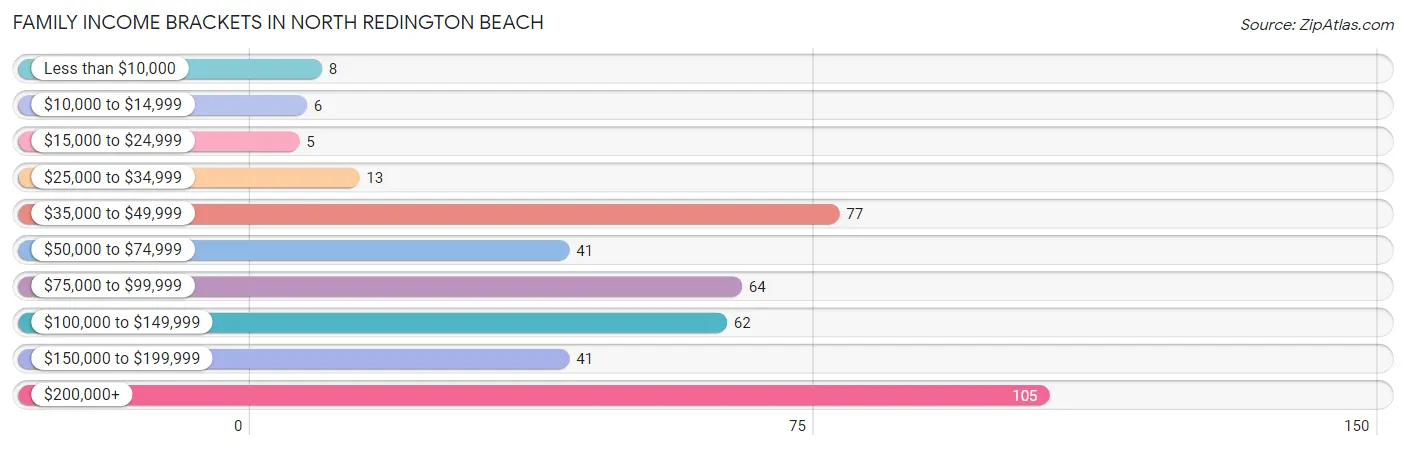
| Income Bracket | # Families | % Families |
| Less than $10,000 | 8 | 1.9% |
| $10,000 to $14,999 | 6 | 1.4% |
| $15,000 to $24,999 | 5 | 1.2% |
| $25,000 to $34,999 | 13 | 3.1% |
| $35,000 to $49,999 | 77 | 18.2% |
| $50,000 to $74,999 | 41 | 9.7% |
| $75,000 to $99,999 | 64 | 15.2% |
| $100,000 to $149,999 | 62 | 14.7% |
| $150,000 to $199,999 | 41 | 9.7% |
| $200,000+ | 105 | 24.9% |
Family Income by Famaliy Size in North Redington Beach
4-person families (36 | 8.5%) account for the highest median family income in North Redington Beach with $208,472 per family, while 4-person families (36 | 8.5%) have the highest median income of $52,118 per family member.
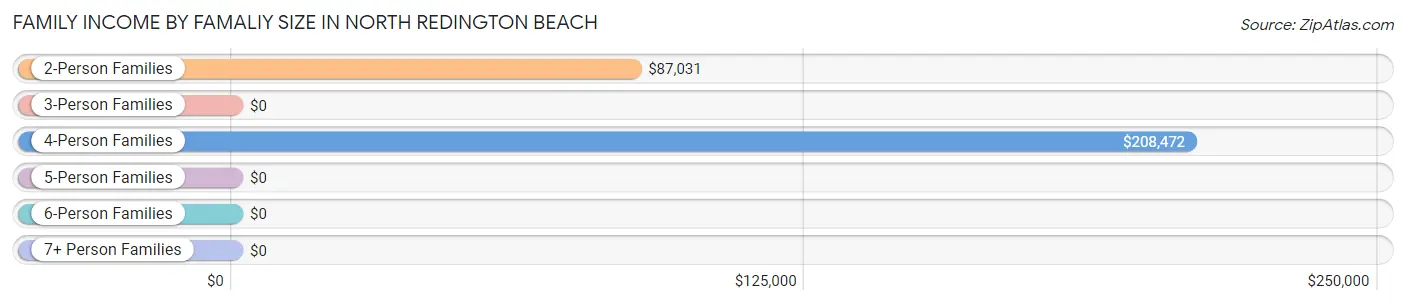
| Income Bracket | # Families | Median Income |
| 2-Person Families | 335 (79.4%) | $87,031 |
| 3-Person Families | 35 (8.3%) | $0 |
| 4-Person Families | 36 (8.5%) | $208,472 |
| 5-Person Families | 0 (0.0%) | $0 |
| 6-Person Families | 16 (3.8%) | $0 |
| 7+ Person Families | 0 (0.0%) | $0 |
| Total | 422 (100.0%) | $99,063 |
Family Income by Number of Earners in North Redington Beach
The median family income in North Redington Beach is $99,063, with families comprising 3+ earners (31) having the highest median family income of $250,001, while families with no earners (199) have the lowest median family income of $70,625, accounting for 7.3% and 47.2% of families, respectively.
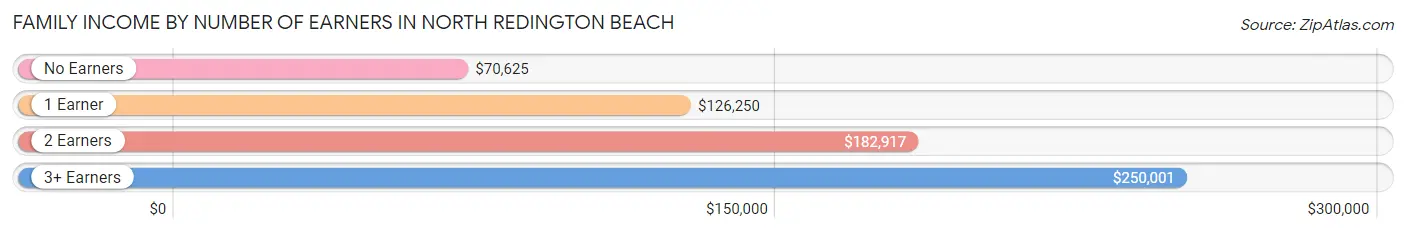
| Number of Earners | # Families | Median Income |
| No Earners | 199 (47.2%) | $70,625 |
| 1 Earner | 107 (25.4%) | $126,250 |
| 2 Earners | 85 (20.1%) | $182,917 |
| 3+ Earners | 31 (7.3%) | $250,001 |
| Total | 422 (100.0%) | $99,063 |
Household Income in North Redington Beach
Household Income Brackets in North Redington Beach
With 127 households falling in the category, the $200,000+ income range is the most frequent in North Redington Beach, accounting for 20.0% of all households. In contrast, only 18 households (2.8%) fall into the less than $10,000 income bracket, making it the least populous group.
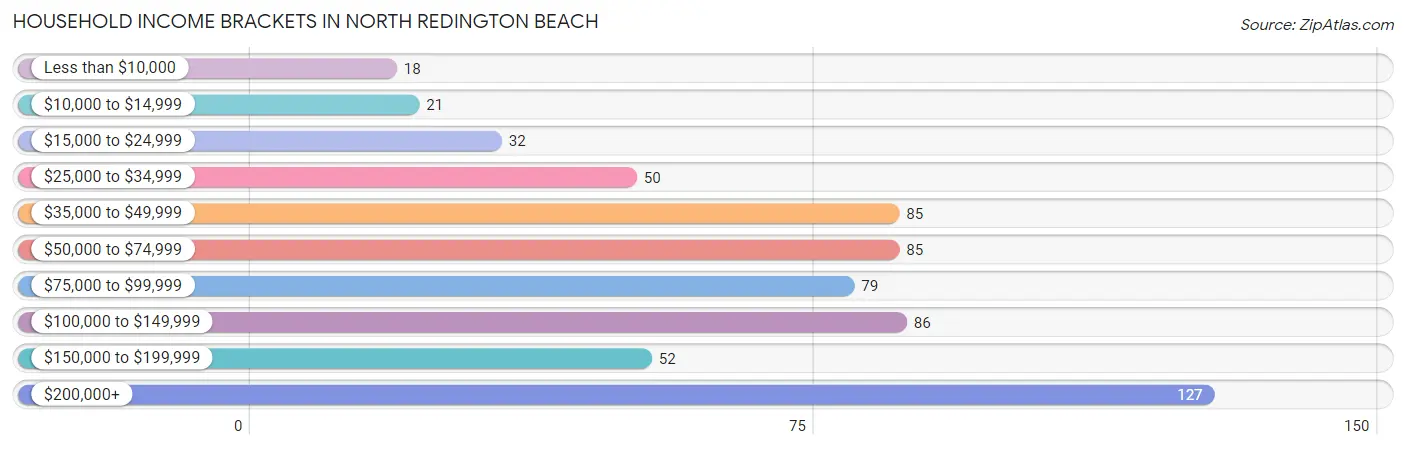
| Income Bracket | # Households | % Households |
| Less than $10,000 | 18 | 2.8% |
| $10,000 to $14,999 | 21 | 3.3% |
| $15,000 to $24,999 | 32 | 5.0% |
| $25,000 to $34,999 | 50 | 7.9% |
| $35,000 to $49,999 | 85 | 13.4% |
| $50,000 to $74,999 | 85 | 13.4% |
| $75,000 to $99,999 | 79 | 12.4% |
| $100,000 to $149,999 | 86 | 13.5% |
| $150,000 to $199,999 | 52 | 8.2% |
| $200,000+ | 127 | 20.0% |
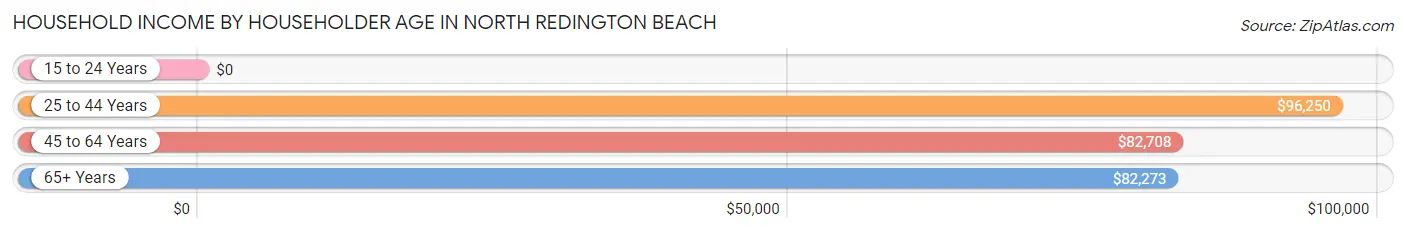
Household Income by Householder Age in North Redington Beach
The median household income in North Redington Beach is $83,750, with the highest median household income of $96,250 found in the 25 to 44 years age bracket for the primary householder. A total of 35 households (5.5%) fall into this category. Meanwhile, the 15 to 24 years age bracket for the primary householder has the lowest median household income of $0, with 3 households (0.5%) in this group.
| Income Bracket | # Households | Median Income |
| 15 to 24 Years | 3 (0.5%) | $0 |
| 25 to 44 Years | 35 (5.5%) | $96,250 |
| 45 to 64 Years | 253 (39.8%) | $82,708 |
| 65+ Years | 344 (54.2%) | $82,273 |
| Total | 635 (100.0%) | $83,750 |
Poverty in North Redington Beach
Income Below Poverty by Sex and Age in North Redington Beach
With 2.6% poverty level for males and 8.3% for females among the residents of North Redington Beach, 12 to 14 year old males and 25 to 34 year old females are the most vulnerable to poverty, with 3 males (30.0%) and 8 females (30.8%) in their respective age groups living below the poverty level.
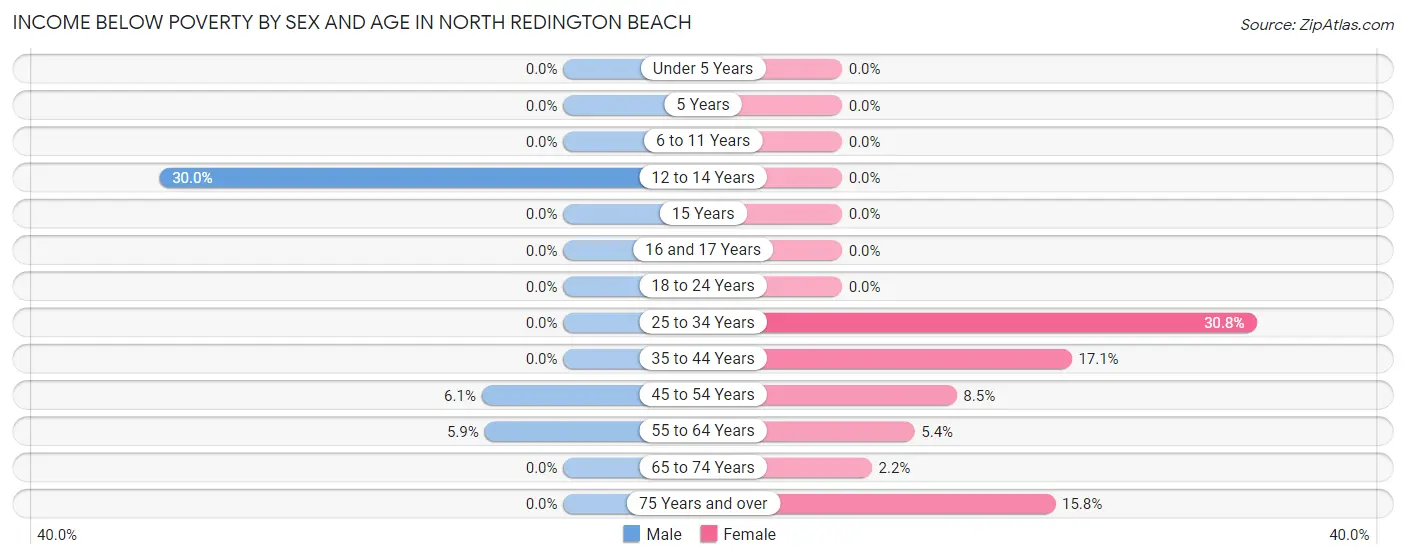
| Age Bracket | Male | Female |
| Under 5 Years | 0 (0.0%) | 0 (0.0%) |
| 5 Years | 0 (0.0%) | 0 (0.0%) |
| 6 to 11 Years | 0 (0.0%) | 0 (0.0%) |
| 12 to 14 Years | 3 (30.0%) | 0 (0.0%) |
| 15 Years | 0 (0.0%) | 0 (0.0%) |
| 16 and 17 Years | 0 (0.0%) | 0 (0.0%) |
| 18 to 24 Years | 0 (0.0%) | 0 (0.0%) |
| 25 to 34 Years | 0 (0.0%) | 8 (30.8%) |
| 35 to 44 Years | 0 (0.0%) | 15 (17.1%) |
| 45 to 54 Years | 2 (6.1%) | 8 (8.5%) |
| 55 to 64 Years | 10 (5.9%) | 11 (5.4%) |
| 65 to 74 Years | 0 (0.0%) | 3 (2.2%) |
| 75 Years and over | 0 (0.0%) | 19 (15.8%) |
| Total | 15 (2.6%) | 64 (8.3%) |
Income Above Poverty by Sex and Age in North Redington Beach
According to the poverty statistics in North Redington Beach, males aged 6 to 11 years and females aged under 5 years are the age groups that are most secure financially, with 100.0% of males and 100.0% of females in these age groups living above the poverty line.
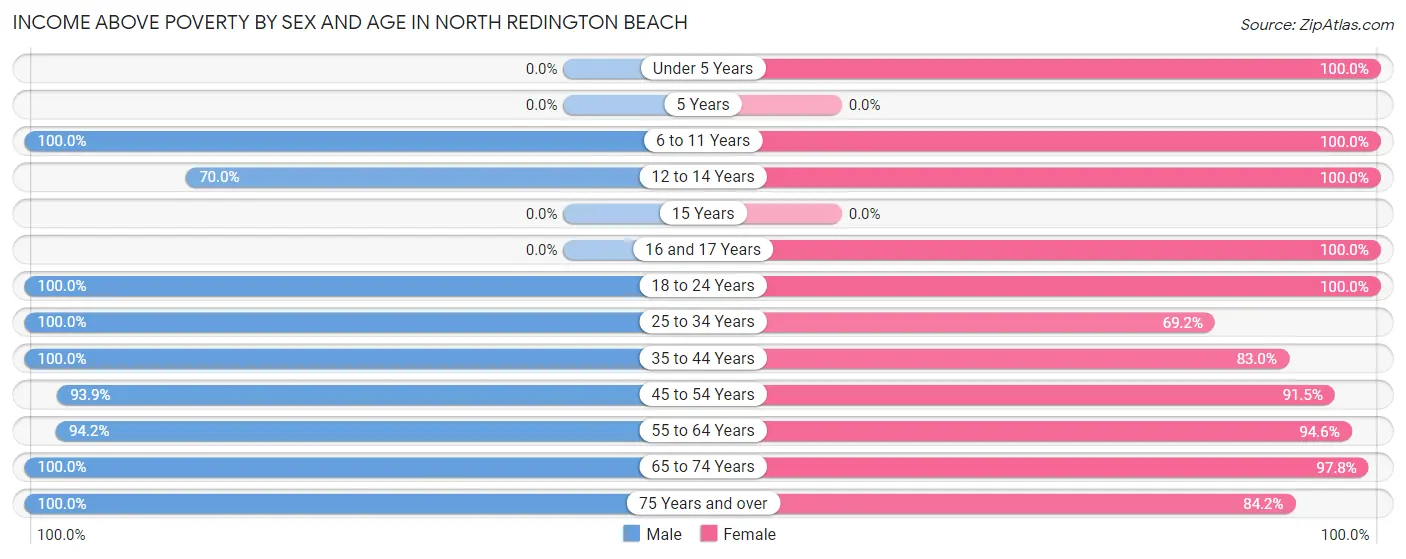
| Age Bracket | Male | Female |
| Under 5 Years | 0 (0.0%) | 18 (100.0%) |
| 5 Years | 0 (0.0%) | 0 (0.0%) |
| 6 to 11 Years | 21 (100.0%) | 60 (100.0%) |
| 12 to 14 Years | 7 (70.0%) | 7 (100.0%) |
| 15 Years | 0 (0.0%) | 0 (0.0%) |
| 16 and 17 Years | 0 (0.0%) | 9 (100.0%) |
| 18 to 24 Years | 24 (100.0%) | 11 (100.0%) |
| 25 to 34 Years | 33 (100.0%) | 18 (69.2%) |
| 35 to 44 Years | 45 (100.0%) | 73 (83.0%) |
| 45 to 54 Years | 31 (93.9%) | 86 (91.5%) |
| 55 to 64 Years | 161 (94.2%) | 193 (94.6%) |
| 65 to 74 Years | 163 (100.0%) | 133 (97.8%) |
| 75 Years and over | 75 (100.0%) | 101 (84.2%) |
| Total | 560 (97.4%) | 709 (91.7%) |
Income Below Poverty Among Married-Couple Families in North Redington Beach
The poverty statistics for married-couple families in North Redington Beach show that 1.9% or 7 of the total 375 families live below the poverty line. Families with no children have the highest poverty rate of 2.1%, comprising of 7 families. On the other hand, families with 1 or 2 children have the lowest poverty rate of 0.0%, which includes 0 families.
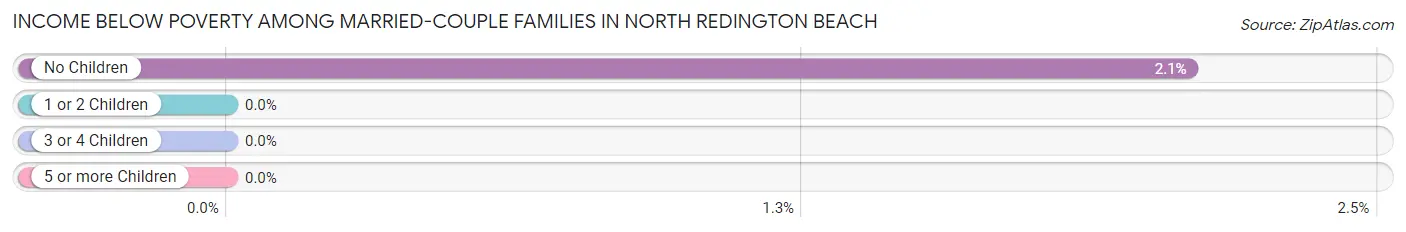
| Children | Above Poverty | Below Poverty |
| No Children | 328 (97.9%) | 7 (2.1%) |
| 1 or 2 Children | 40 (100.0%) | 0 (0.0%) |
| 3 or 4 Children | 0 (0.0%) | 0 (0.0%) |
| 5 or more Children | 0 (0.0%) | 0 (0.0%) |
| Total | 368 (98.1%) | 7 (1.9%) |
Income Below Poverty Among Single-Parent Households in North Redington Beach
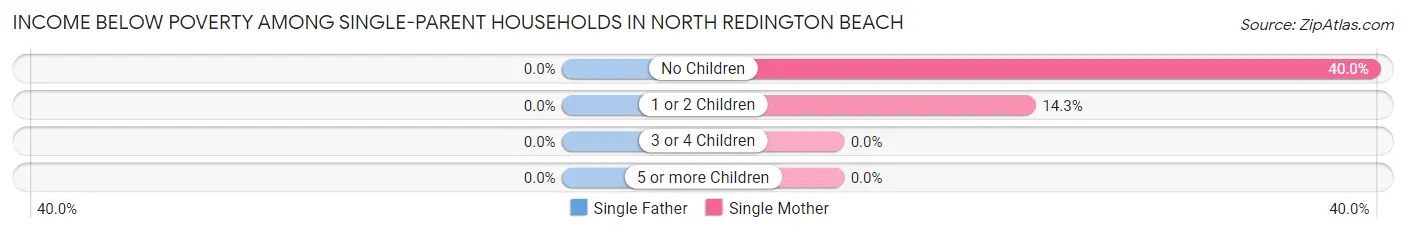
| Children | Single Father | Single Mother |
| No Children | 0 (0.0%) | 4 (40.0%) |
| 1 or 2 Children | 0 (0.0%) | 3 (14.3%) |
| 3 or 4 Children | 0 (0.0%) | 0 (0.0%) |
| 5 or more Children | 0 (0.0%) | 0 (0.0%) |
| Total | 0 (0.0%) | 7 (22.6%) |
Income Below Poverty Among Married-Couple vs Single-Parent Households in North Redington Beach
The poverty data for North Redington Beach shows that 7 of the married-couple family households (1.9%) and 7 of the single-parent households (14.9%) are living below the poverty level. Within the married-couple family households, those with no children have the highest poverty rate, with 7 households (2.1%) falling below the poverty line. Among the single-parent households, those with no children have the highest poverty rate, with 4 household (40.0%) living below poverty.
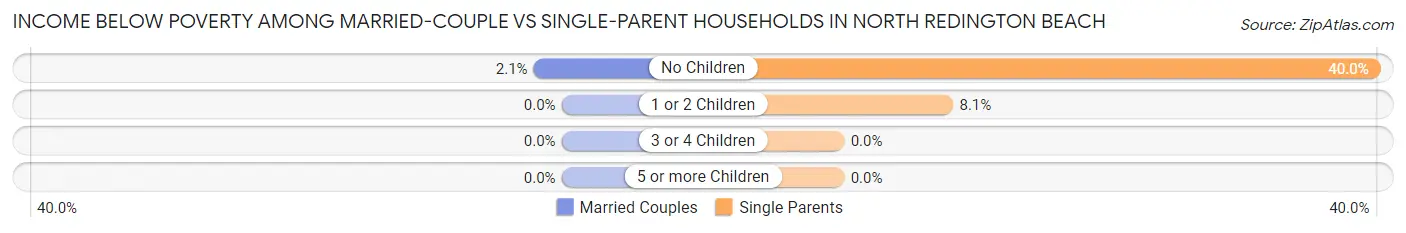
| Children | Married-Couple Families | Single-Parent Households |
| No Children | 7 (2.1%) | 4 (40.0%) |
| 1 or 2 Children | 0 (0.0%) | 3 (8.1%) |
| 3 or 4 Children | 0 (0.0%) | 0 (0.0%) |
| 5 or more Children | 0 (0.0%) | 0 (0.0%) |
| Total | 7 (1.9%) | 7 (14.9%) |
Race in North Redington Beach
The most populous races in North Redington Beach are White / Caucasian (1,273 | 94.4%), Hispanic or Latino (51 | 3.8%), and Two or more Races (48 | 3.6%).
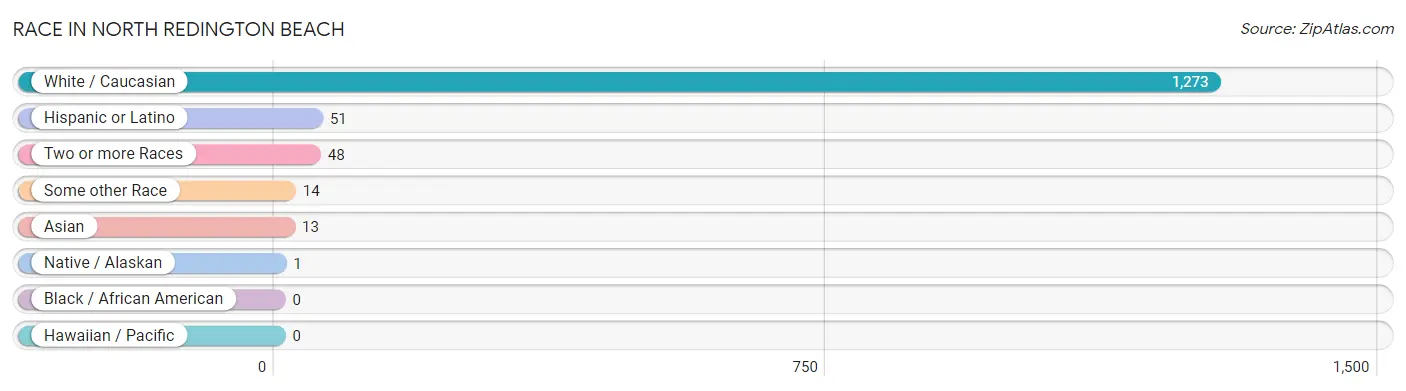
| Race | # Population | % Population |
| Asian | 13 | 1.0% |
| Black / African American | 0 | 0.0% |
| Hawaiian / Pacific | 0 | 0.0% |
| Hispanic or Latino | 51 | 3.8% |
| Native / Alaskan | 1 | 0.1% |
| White / Caucasian | 1,273 | 94.4% |
| Two or more Races | 48 | 3.6% |
| Some other Race | 14 | 1.0% |
| Total | 1,349 | 100.0% |
Ancestry in North Redington Beach
The most populous ancestries reported in North Redington Beach are English (231 | 17.1%), Irish (169 | 12.5%), German (159 | 11.8%), European (149 | 11.1%), and American (123 | 9.1%), together accounting for 61.6% of all North Redington Beach residents.
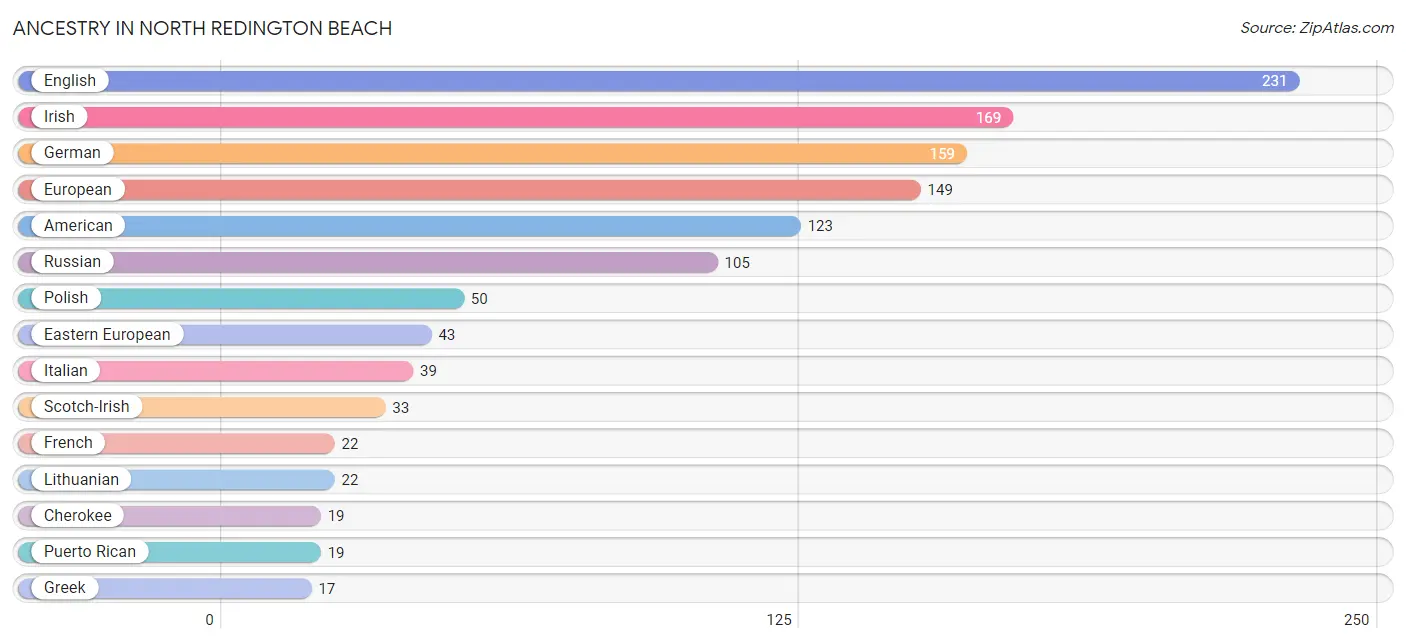
| Ancestry | # Population | % Population |
| American | 123 | 9.1% |
| Arab | 9 | 0.7% |
| Austrian | 2 | 0.2% |
| British | 14 | 1.0% |
| British West Indian | 1 | 0.1% |
| Bulgarian | 2 | 0.2% |
| Cherokee | 19 | 1.4% |
| Colombian | 11 | 0.8% |
| Cuban | 5 | 0.4% |
| Czech | 6 | 0.4% |
| Danish | 2 | 0.2% |
| Dutch | 11 | 0.8% |
| Eastern European | 43 | 3.2% |
| Egyptian | 3 | 0.2% |
| English | 231 | 17.1% |
| European | 149 | 11.1% |
| French | 22 | 1.6% |
| French Canadian | 6 | 0.4% |
| German | 159 | 11.8% |
| Greek | 17 | 1.3% |
| Indian (Asian) | 17 | 1.3% |
| Iranian | 3 | 0.2% |
| Irish | 169 | 12.5% |
| Italian | 39 | 2.9% |
| Jamaican | 1 | 0.1% |
| Lebanese | 2 | 0.2% |
| Lithuanian | 22 | 1.6% |
| Mexican | 9 | 0.7% |
| Northern European | 6 | 0.4% |
| Pakistani | 4 | 0.3% |
| Polish | 50 | 3.7% |
| Portuguese | 6 | 0.4% |
| Puerto Rican | 19 | 1.4% |
| Romanian | 2 | 0.2% |
| Russian | 105 | 7.8% |
| Scotch-Irish | 33 | 2.5% |
| Scottish | 8 | 0.6% |
| South American | 11 | 0.8% |
| Spanish | 7 | 0.5% |
| Swedish | 10 | 0.7% |
| Swiss | 2 | 0.2% |
| Thai | 8 | 0.6% |
| Ukrainian | 8 | 0.6% |
| Welsh | 12 | 0.9% | View All 44 Rows |
Immigrants in North Redington Beach
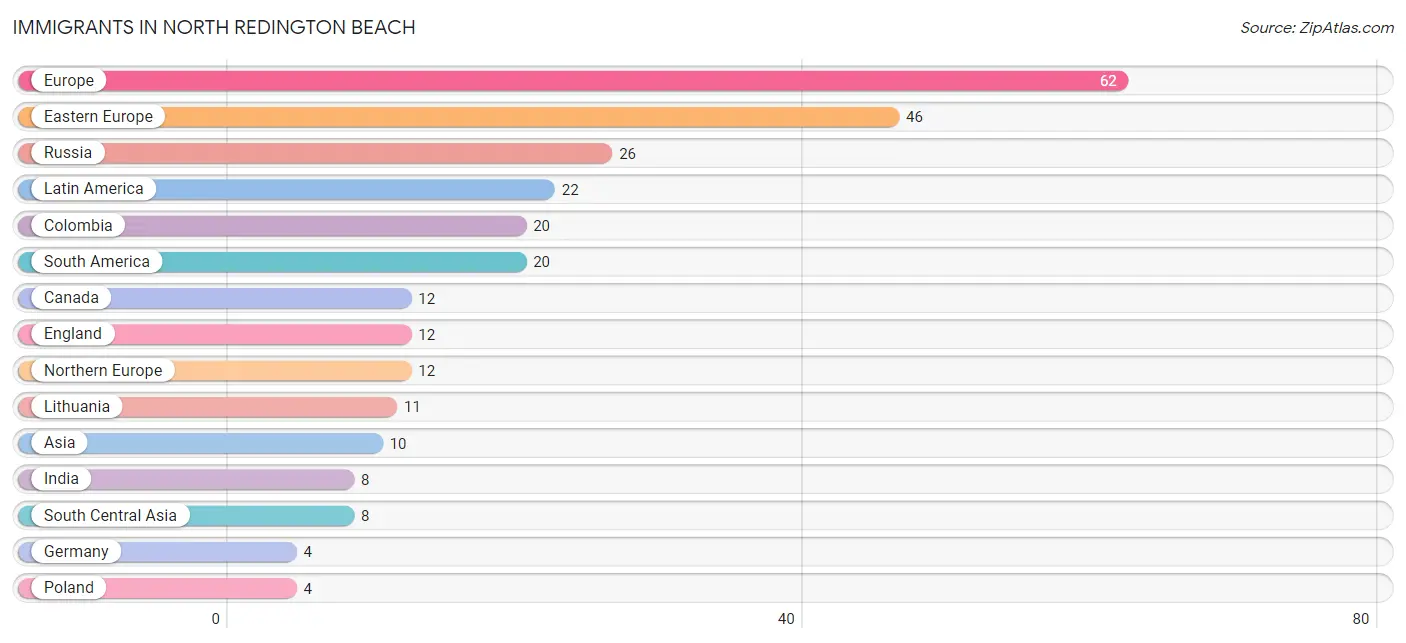
The most numerous immigrant groups reported in North Redington Beach came from Europe (62 | 4.6%), Eastern Europe (46 | 3.4%), Russia (26 | 1.9%), Latin America (22 | 1.6%), and Colombia (20 | 1.5%), together accounting for 13.1% of all North Redington Beach residents.
| Immigration Origin | # Population | % Population |
| Africa | 3 | 0.2% |
| Asia | 10 | 0.7% |
| Canada | 12 | 0.9% |
| Caribbean | 2 | 0.2% |
| Colombia | 20 | 1.5% |
| Cuba | 2 | 0.2% |
| Eastern Europe | 46 | 3.4% |
| Egypt | 3 | 0.2% |
| England | 12 | 0.9% |
| Europe | 62 | 4.6% |
| Germany | 4 | 0.3% |
| India | 8 | 0.6% |
| Latin America | 22 | 1.6% |
| Lithuania | 11 | 0.8% |
| Northern Africa | 3 | 0.2% |
| Northern Europe | 12 | 0.9% |
| Poland | 4 | 0.3% |
| Russia | 26 | 1.9% |
| Singapore | 2 | 0.2% |
| South America | 20 | 1.5% |
| South Central Asia | 8 | 0.6% |
| South Eastern Asia | 2 | 0.2% |
| Western Europe | 4 | 0.3% | View All 23 Rows |
Sex and Age in North Redington Beach
Sex and Age in North Redington Beach
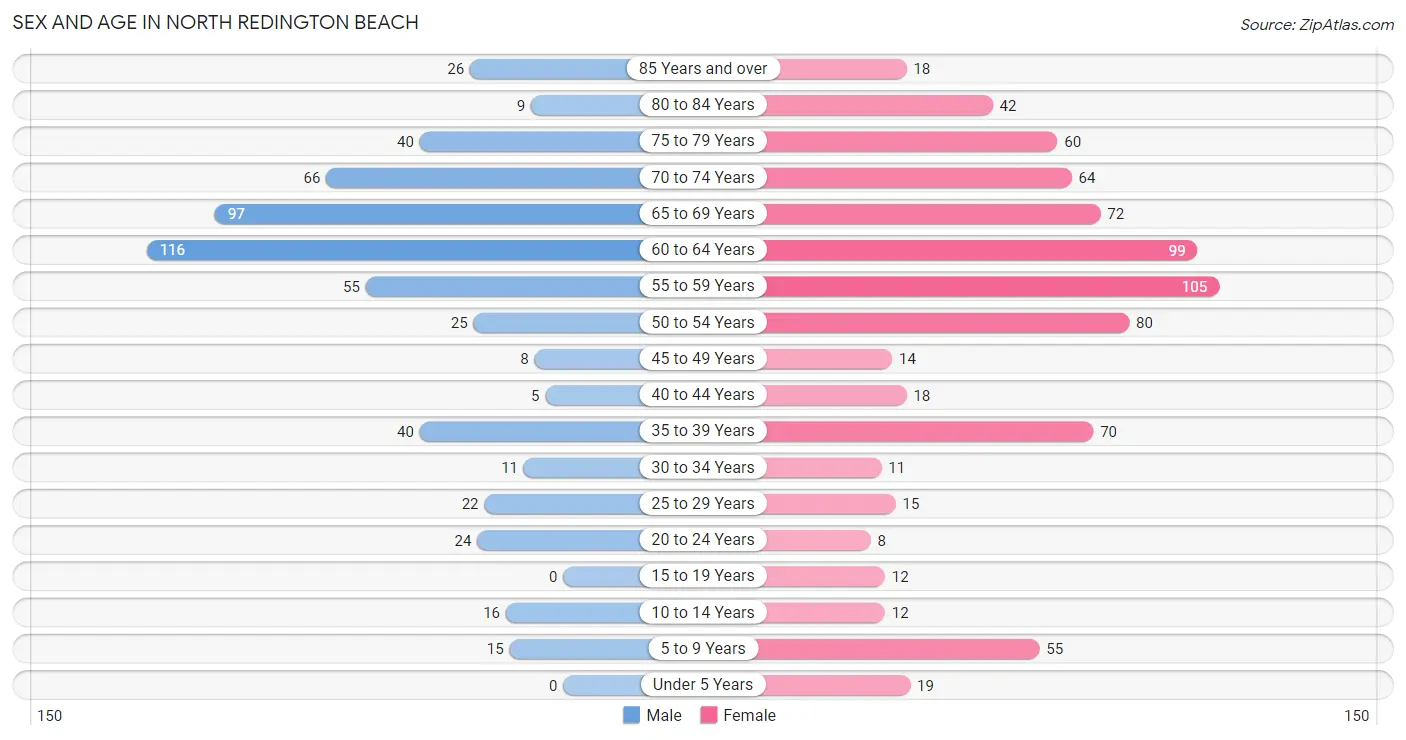
The most populous age groups in North Redington Beach are 60 to 64 Years (116 | 20.2%) for men and 55 to 59 Years (105 | 13.6%) for women.
| Age Bracket | Male | Female |
| Under 5 Years | 0 (0.0%) | 19 (2.5%) |
| 5 to 9 Years | 15 (2.6%) | 55 (7.1%) |
| 10 to 14 Years | 16 (2.8%) | 12 (1.5%) |
| 15 to 19 Years | 0 (0.0%) | 12 (1.5%) |
| 20 to 24 Years | 24 (4.2%) | 8 (1.0%) |
| 25 to 29 Years | 22 (3.8%) | 15 (1.9%) |
| 30 to 34 Years | 11 (1.9%) | 11 (1.4%) |
| 35 to 39 Years | 40 (7.0%) | 70 (9.0%) |
| 40 to 44 Years | 5 (0.9%) | 18 (2.3%) |
| 45 to 49 Years | 8 (1.4%) | 14 (1.8%) |
| 50 to 54 Years | 25 (4.3%) | 80 (10.3%) |
| 55 to 59 Years | 55 (9.6%) | 105 (13.6%) |
| 60 to 64 Years | 116 (20.2%) | 99 (12.8%) |
| 65 to 69 Years | 97 (16.9%) | 72 (9.3%) |
| 70 to 74 Years | 66 (11.5%) | 64 (8.3%) |
| 75 to 79 Years | 40 (7.0%) | 60 (7.7%) |
| 80 to 84 Years | 9 (1.6%) | 42 (5.4%) |
| 85 Years and over | 26 (4.5%) | 18 (2.3%) |
| Total | 575 (100.0%) | 774 (100.0%) |
Families and Households in North Redington Beach
Median Family Size in North Redington Beach
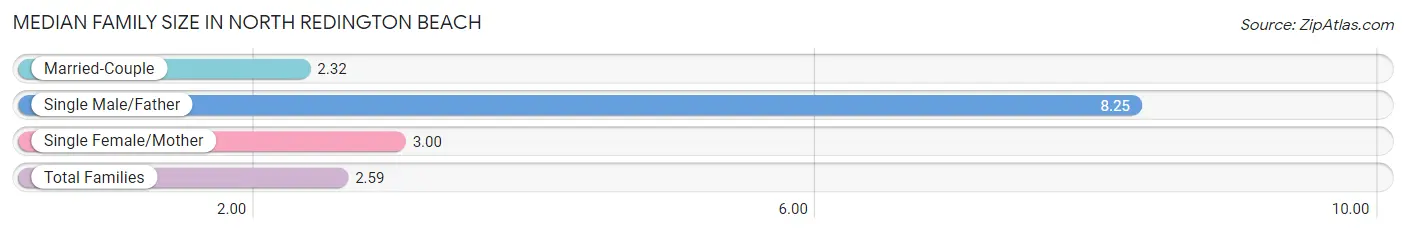
The median family size in North Redington Beach is 2.59 persons per family, with single male/father families (16 | 3.8%) accounting for the largest median family size of 8.25 persons per family. On the other hand, married-couple families (375 | 88.9%) represent the smallest median family size with 2.32 persons per family.
| Family Type | # Families | Family Size |
| Married-Couple | 375 (88.9%) | 2.32 |
| Single Male/Father | 16 (3.8%) | 8.25 |
| Single Female/Mother | 31 (7.3%) | 3.00 |
| Total Families | 422 (100.0%) | 2.59 |
Median Household Size in North Redington Beach
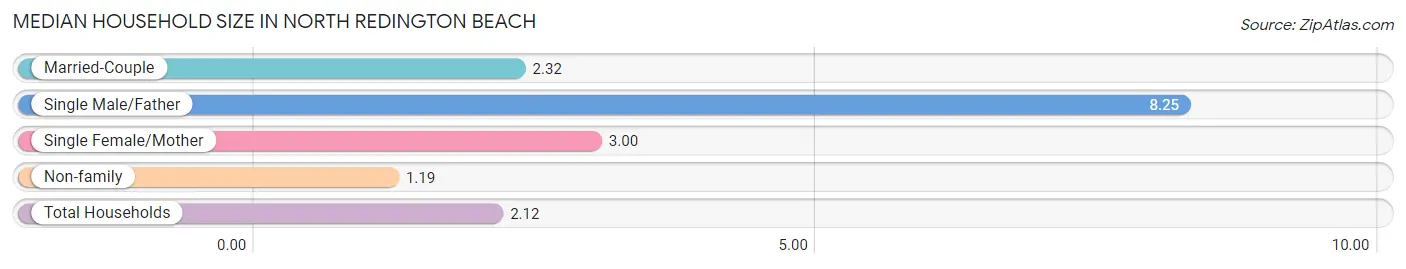
The median household size in North Redington Beach is 2.12 persons per household, with single male/father households (16 | 2.5%) accounting for the largest median household size of 8.25 persons per household. non-family households (213 | 33.5%) represent the smallest median household size with 1.19 persons per household.
| Household Type | # Households | Household Size |
| Married-Couple | 375 (59.1%) | 2.32 |
| Single Male/Father | 16 (2.5%) | 8.25 |
| Single Female/Mother | 31 (4.9%) | 3.00 |
| Non-family | 213 (33.5%) | 1.19 |
| Total Households | 635 (100.0%) | 2.12 |
Household Size by Marriage Status in North Redington Beach
Out of a total of 635 households in North Redington Beach, 422 (66.5%) are family households, while 213 (33.5%) are nonfamily households. The most numerous type of family households are 2-person households, comprising 333, and the most common type of nonfamily households are 1-person households, comprising 183.
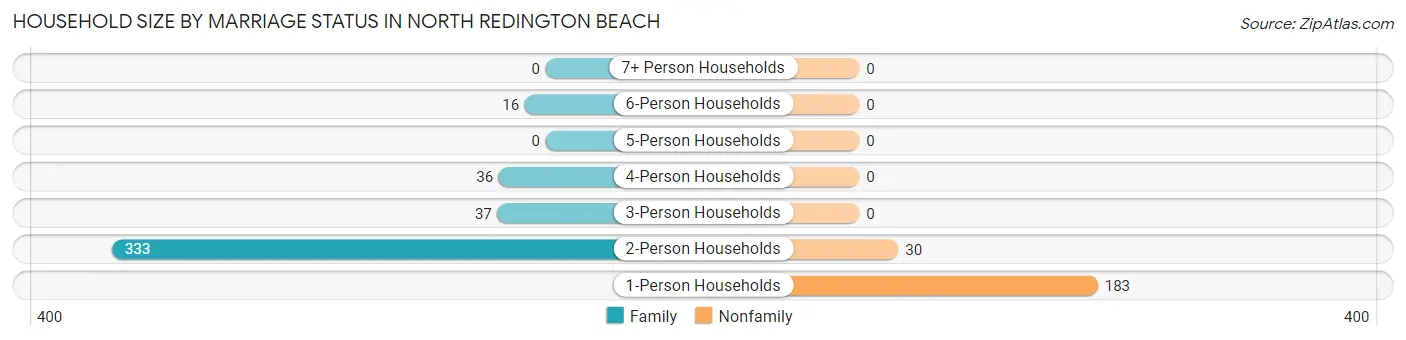
| Household Size | Family Households | Nonfamily Households |
| 1-Person Households | - | 183 (28.8%) |
| 2-Person Households | 333 (52.4%) | 30 (4.7%) |
| 3-Person Households | 37 (5.8%) | 0 (0.0%) |
| 4-Person Households | 36 (5.7%) | 0 (0.0%) |
| 5-Person Households | 0 (0.0%) | 0 (0.0%) |
| 6-Person Households | 16 (2.5%) | 0 (0.0%) |
| 7+ Person Households | 0 (0.0%) | 0 (0.0%) |
| Total | 422 (66.5%) | 213 (33.5%) |
Female Fertility in North Redington Beach
Fertility by Age in North Redington Beach
| Age Bracket | Women with Births | Births / 1,000 Women |
| 15 to 19 years | 0 (0.0%) | 0.0 |
| 20 to 34 years | 0 (0.0%) | 0.0 |
| 35 to 50 years | 0 (0.0%) | 0.0 |
| Total | 0 (0.0%) | 0.0 |
Fertility by Age by Marriage Status in North Redington Beach
| Age Bracket | Married | Unmarried |
| 15 to 19 years | 0 (0.0%) | 0 (0.0%) |
| 20 to 34 years | 0 (0.0%) | 0 (0.0%) |
| 35 to 50 years | 0 (0.0%) | 0 (0.0%) |
| Total | 0 (0.0%) | 0 (0.0%) |
Fertility by Education in North Redington Beach
| Educational Attainment | Women with Births | Births / 1,000 Women |
| Less than High School | 0 (0.0%) | 0.0 |
| High School Diploma | 0 (0.0%) | 0.0 |
| College or Associate's Degree | 0 (0.0%) | 0.0 |
| Bachelor's Degree | 0 (0.0%) | 0.0 |
| Graduate Degree | 0 (0.0%) | 0.0 |
| Total | 0 (0.0%) | 0.0 |
Fertility by Education by Marriage Status in North Redington Beach
| Educational Attainment | Married | Unmarried |
| Less than High School | 0 (0.0%) | 0 (0.0%) |
| High School Diploma | 0 (0.0%) | 0 (0.0%) |
| College or Associate's Degree | 0 (0.0%) | 0 (0.0%) |
| Bachelor's Degree | 0 (0.0%) | 0 (0.0%) |
| Graduate Degree | 0 (0.0%) | 0 (0.0%) |
| Total | 0 (0.0%) | 0 (0.0%) |
Employment Characteristics in North Redington Beach
Employment by Class of Employer in North Redington Beach
Among the 493 employed individuals in North Redington Beach, private company employees (264 | 53.5%), self-employed (incorporated) (84 | 17.0%), and self-employed (not incorporated) (63 | 12.8%) make up the most common classes of employment.
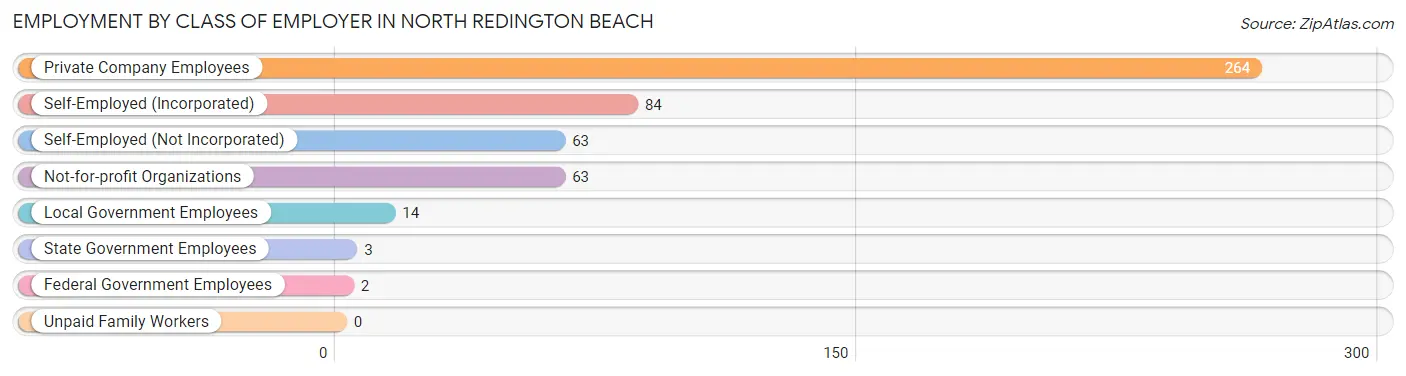
| Employer Class | # Employees | % Employees |
| Private Company Employees | 264 | 53.5% |
| Self-Employed (Incorporated) | 84 | 17.0% |
| Self-Employed (Not Incorporated) | 63 | 12.8% |
| Not-for-profit Organizations | 63 | 12.8% |
| Local Government Employees | 14 | 2.8% |
| State Government Employees | 3 | 0.6% |
| Federal Government Employees | 2 | 0.4% |
| Unpaid Family Workers | 0 | 0.0% |
| Total | 493 | 100.0% |
Employment Status by Age in North Redington Beach
According to the labor force statistics for North Redington Beach, out of the total population over 16 years of age (1,232), 45.9% or 565 individuals are in the labor force, with 12.0% or 68 of them unemployed. The age group with the highest labor force participation rate is 30 to 34 years, with 100.0% or 22 individuals in the labor force. Within the labor force, the 35 to 44 years age range has the highest percentage of unemployed individuals, with 40.2% or 41 of them being unemployed.
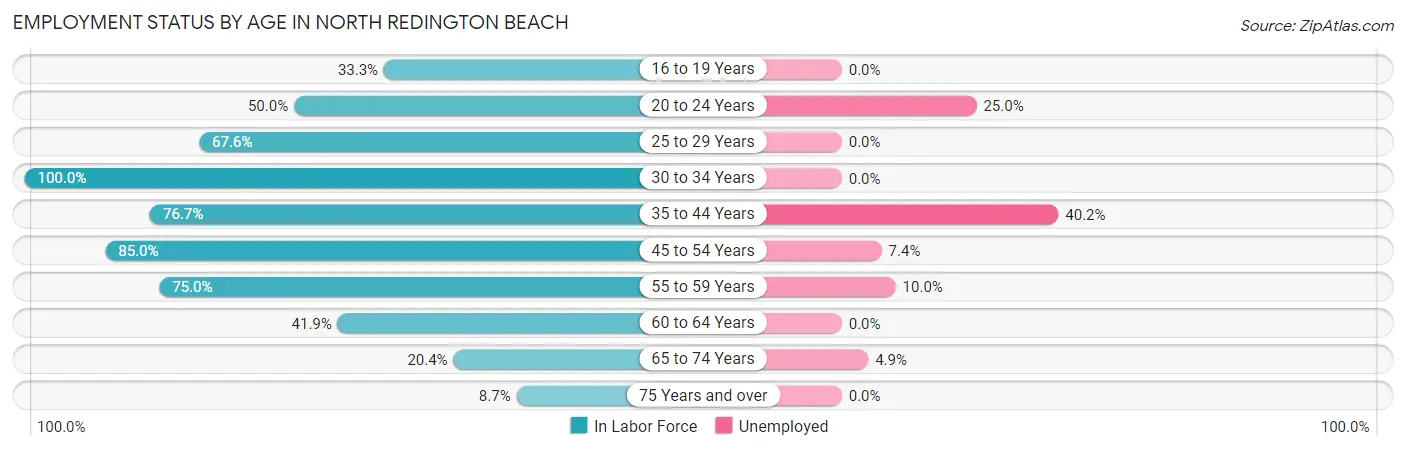
| Age Bracket | In Labor Force | Unemployed |
| 16 to 19 Years | 4 (33.3%) | 0 (0.0%) |
| 20 to 24 Years | 16 (50.0%) | 4 (25.0%) |
| 25 to 29 Years | 25 (67.6%) | 0 (0.0%) |
| 30 to 34 Years | 22 (100.0%) | 0 (0.0%) |
| 35 to 44 Years | 102 (76.7%) | 41 (40.2%) |
| 45 to 54 Years | 108 (85.0%) | 8 (7.4%) |
| 55 to 59 Years | 120 (75.0%) | 12 (10.0%) |
| 60 to 64 Years | 90 (41.9%) | 0 (0.0%) |
| 65 to 74 Years | 61 (20.4%) | 3 (4.9%) |
| 75 Years and over | 17 (8.7%) | 0 (0.0%) |
| Total | 565 (45.9%) | 68 (12.0%) |
Employment Status by Educational Attainment in North Redington Beach
According to labor force statistics for North Redington Beach, 67.3% of individuals (467) out of the total population between 25 and 64 years of age (694) are in the labor force, with 13.1% or 61 of them being unemployed. The group with the highest labor force participation rate are those with the educational attainment of bachelor's degree or higher, with 70.1% or 258 individuals in the labor force. Within the labor force, individuals with bachelor's degree or higher education have the highest percentage of unemployment, with 17.1% or 44 of them being unemployed.
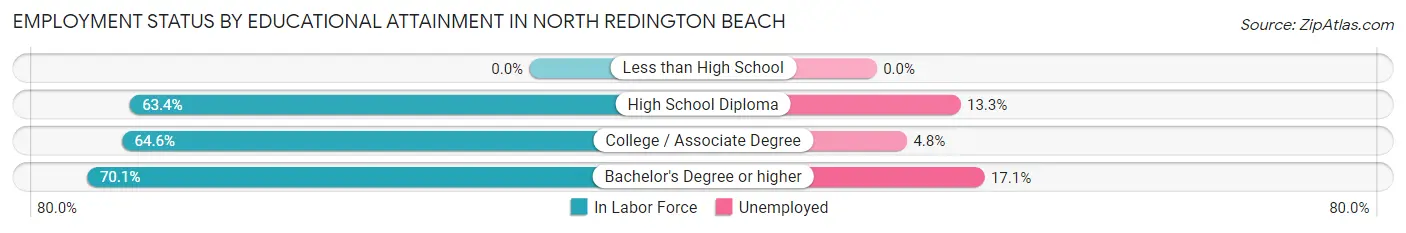
| Educational Attainment | In Labor Force | Unemployed |
| Less than High School | 0 (0.0%) | 0 (0.0%) |
| High School Diploma | 83 (63.4%) | 17 (13.3%) |
| College / Associate Degree | 126 (64.6%) | 9 (4.8%) |
| Bachelor's Degree or higher | 258 (70.1%) | 63 (17.1%) |
| Total | 467 (67.3%) | 91 (13.1%) |
Employment Occupations by Sex in North Redington Beach
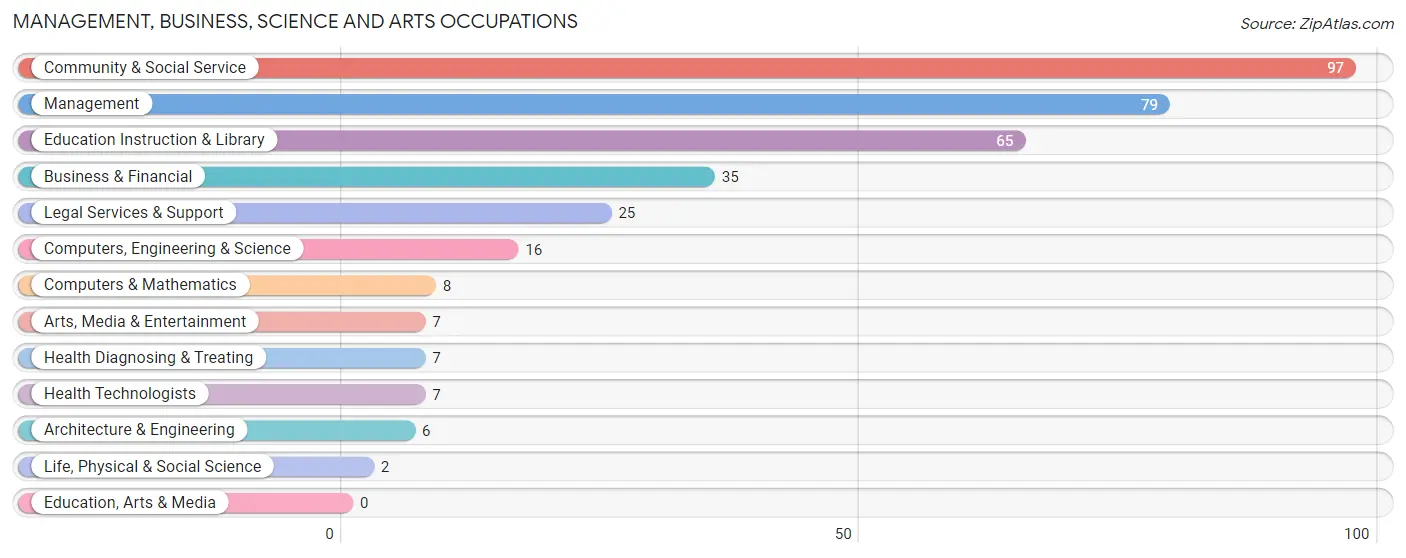
Management, Business, Science and Arts Occupations
The most common Management, Business, Science and Arts occupations in North Redington Beach are Community & Social Service (97 | 19.5%), Management (79 | 15.9%), Education Instruction & Library (65 | 13.1%), Business & Financial (35 | 7.0%), and Legal Services & Support (25 | 5.0%).
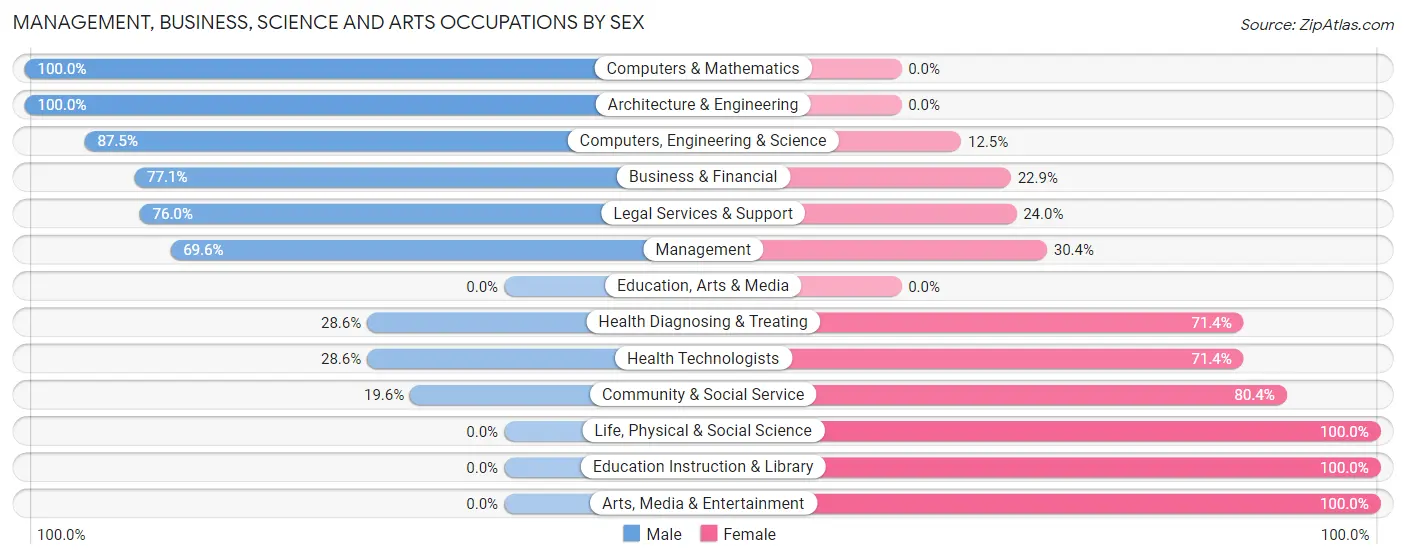
Management, Business, Science and Arts Occupations by Sex
Within the Management, Business, Science and Arts occupations in North Redington Beach, the most male-oriented occupations are Computers & Mathematics (100.0%), Architecture & Engineering (100.0%), and Computers, Engineering & Science (87.5%), while the most female-oriented occupations are Life, Physical & Social Science (100.0%), Education Instruction & Library (100.0%), and Arts, Media & Entertainment (100.0%).
| Occupation | Male | Female |
| Management | 55 (69.6%) | 24 (30.4%) |
| Business & Financial | 27 (77.1%) | 8 (22.9%) |
| Computers, Engineering & Science | 14 (87.5%) | 2 (12.5%) |
| Computers & Mathematics | 8 (100.0%) | 0 (0.0%) |
| Architecture & Engineering | 6 (100.0%) | 0 (0.0%) |
| Life, Physical & Social Science | 0 (0.0%) | 2 (100.0%) |
| Community & Social Service | 19 (19.6%) | 78 (80.4%) |
| Education, Arts & Media | 0 (0.0%) | 0 (0.0%) |
| Legal Services & Support | 19 (76.0%) | 6 (24.0%) |
| Education Instruction & Library | 0 (0.0%) | 65 (100.0%) |
| Arts, Media & Entertainment | 0 (0.0%) | 7 (100.0%) |
| Health Diagnosing & Treating | 2 (28.6%) | 5 (71.4%) |
| Health Technologists | 2 (28.6%) | 5 (71.4%) |
| Total (Category) | 117 (50.0%) | 117 (50.0%) |
| Total (Overall) | 241 (48.5%) | 256 (51.5%) |
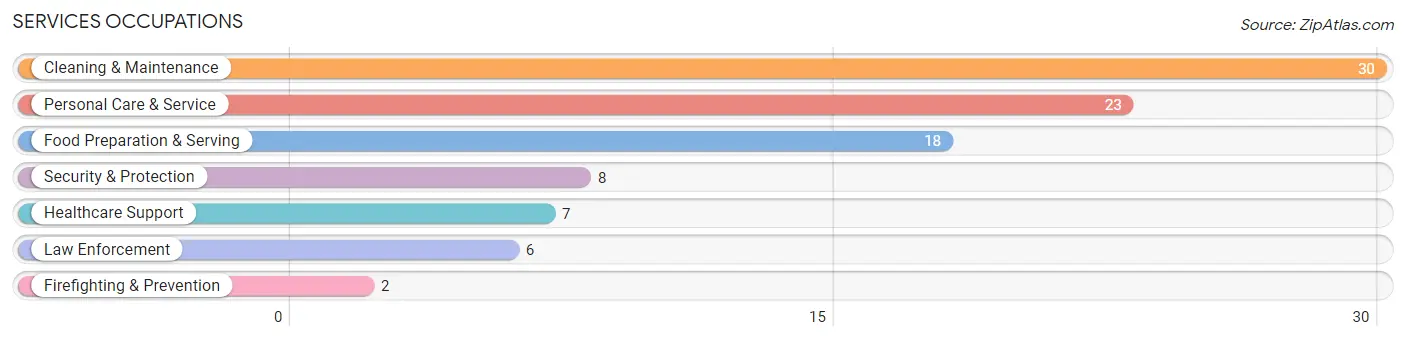
Services Occupations
The most common Services occupations in North Redington Beach are Cleaning & Maintenance (30 | 6.0%), Personal Care & Service (23 | 4.6%), Food Preparation & Serving (18 | 3.6%), Security & Protection (8 | 1.6%), and Healthcare Support (7 | 1.4%).
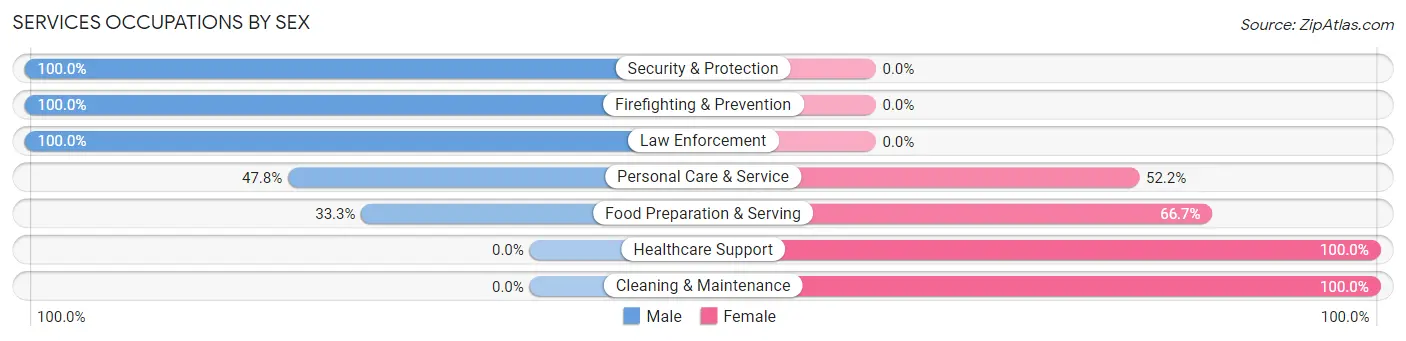
Services Occupations by Sex
Within the Services occupations in North Redington Beach, the most male-oriented occupations are Security & Protection (100.0%), Firefighting & Prevention (100.0%), and Law Enforcement (100.0%), while the most female-oriented occupations are Healthcare Support (100.0%), Cleaning & Maintenance (100.0%), and Food Preparation & Serving (66.7%).
| Occupation | Male | Female |
| Healthcare Support | 0 (0.0%) | 7 (100.0%) |
| Security & Protection | 8 (100.0%) | 0 (0.0%) |
| Firefighting & Prevention | 2 (100.0%) | 0 (0.0%) |
| Law Enforcement | 6 (100.0%) | 0 (0.0%) |
| Food Preparation & Serving | 6 (33.3%) | 12 (66.7%) |
| Cleaning & Maintenance | 0 (0.0%) | 30 (100.0%) |
| Personal Care & Service | 11 (47.8%) | 12 (52.2%) |
| Total (Category) | 25 (29.1%) | 61 (70.9%) |
| Total (Overall) | 241 (48.5%) | 256 (51.5%) |
Sales and Office Occupations
The most common Sales and Office occupations in North Redington Beach are Sales & Related (67 | 13.5%), and Office & Administration (60 | 12.1%).
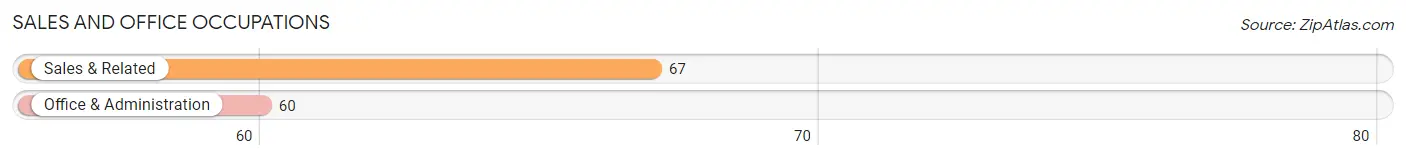
Sales and Office Occupations by Sex
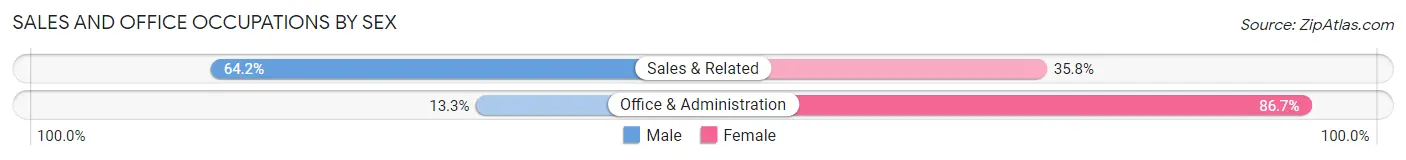
| Occupation | Male | Female |
| Sales & Related | 43 (64.2%) | 24 (35.8%) |
| Office & Administration | 8 (13.3%) | 52 (86.7%) |
| Total (Category) | 51 (40.2%) | 76 (59.8%) |
| Total (Overall) | 241 (48.5%) | 256 (51.5%) |
Natural Resources, Construction and Maintenance Occupations
The most common Natural Resources, Construction and Maintenance occupations in North Redington Beach are Installation, Maintenance & Repair (21 | 4.2%), and Construction & Extraction (11 | 2.2%).
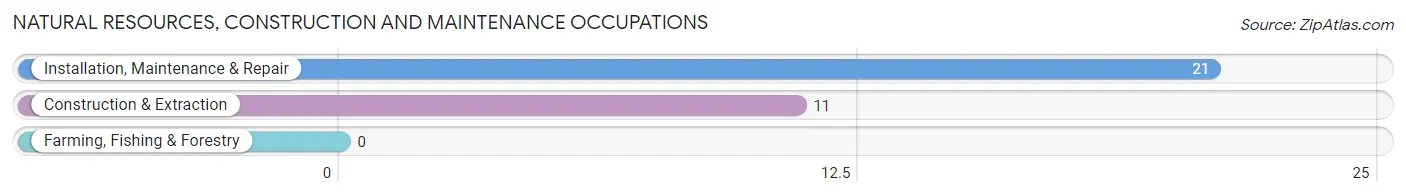
Natural Resources, Construction and Maintenance Occupations by Sex
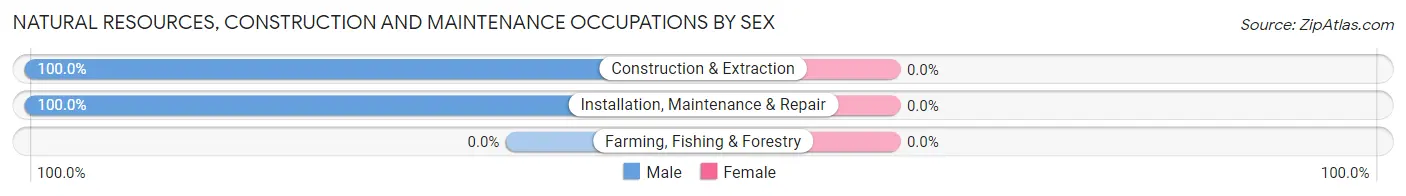
| Occupation | Male | Female |
| Farming, Fishing & Forestry | 0 (0.0%) | 0 (0.0%) |
| Construction & Extraction | 11 (100.0%) | 0 (0.0%) |
| Installation, Maintenance & Repair | 21 (100.0%) | 0 (0.0%) |
| Total (Category) | 32 (100.0%) | 0 (0.0%) |
| Total (Overall) | 241 (48.5%) | 256 (51.5%) |
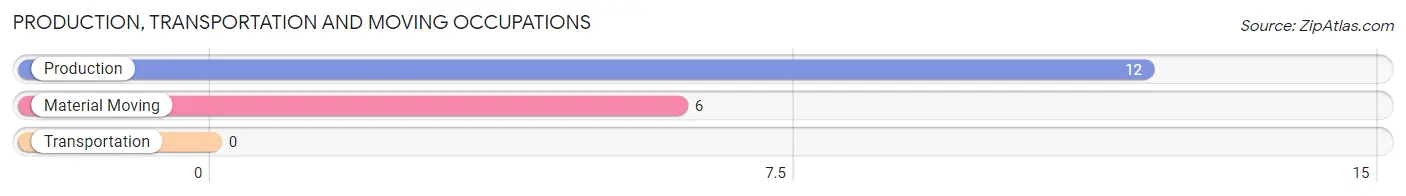
Production, Transportation and Moving Occupations
The most common Production, Transportation and Moving occupations in North Redington Beach are Production (12 | 2.4%), and Material Moving (6 | 1.2%).
Production, Transportation and Moving Occupations by Sex
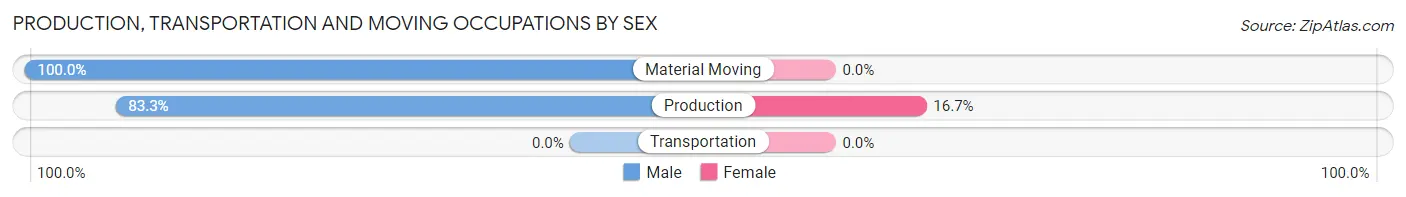
| Occupation | Male | Female |
| Production | 10 (83.3%) | 2 (16.7%) |
| Transportation | 0 (0.0%) | 0 (0.0%) |
| Material Moving | 6 (100.0%) | 0 (0.0%) |
| Total (Category) | 16 (88.9%) | 2 (11.1%) |
| Total (Overall) | 241 (48.5%) | 256 (51.5%) |
Employment Industries by Sex in North Redington Beach
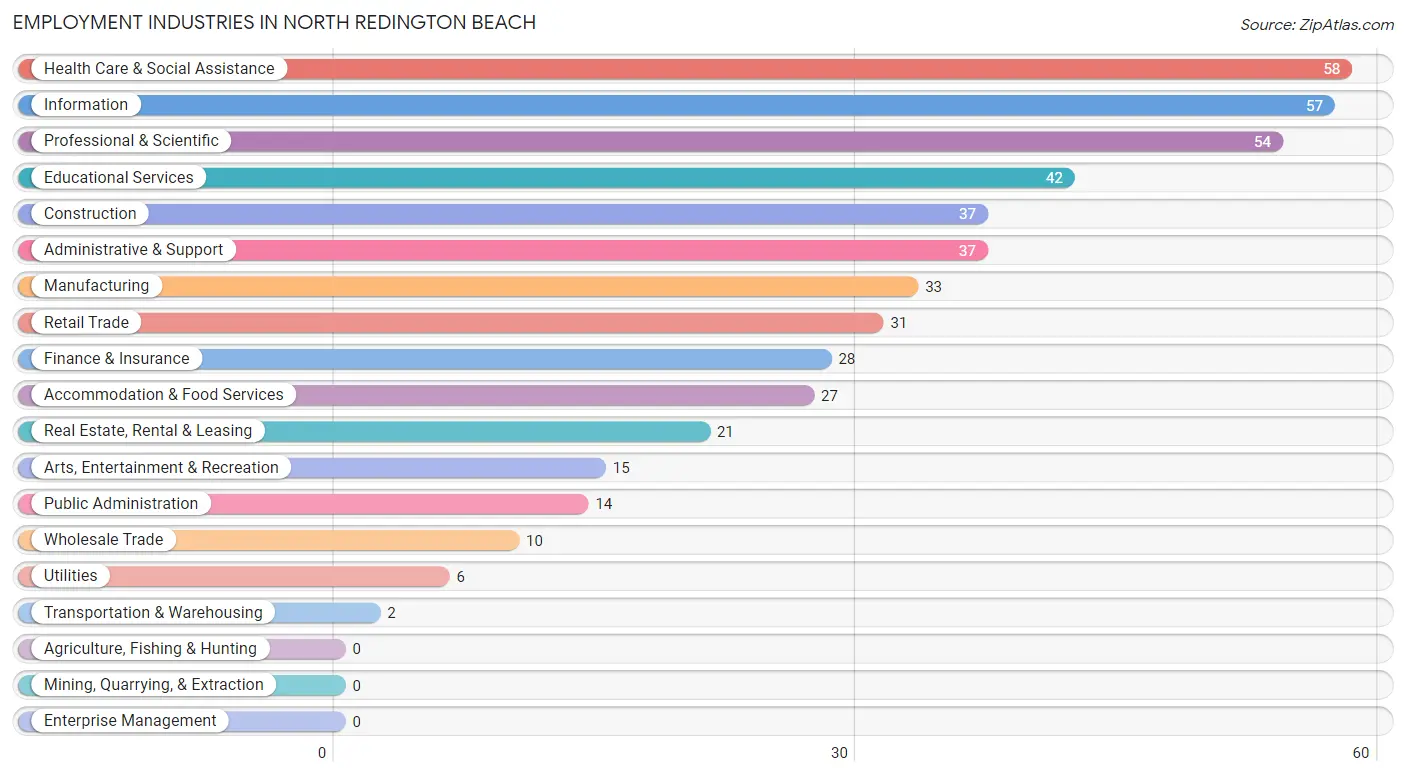
Employment Industries in North Redington Beach
The major employment industries in North Redington Beach include Health Care & Social Assistance (58 | 11.7%), Information (57 | 11.5%), Professional & Scientific (54 | 10.9%), Educational Services (42 | 8.5%), and Construction (37 | 7.4%).
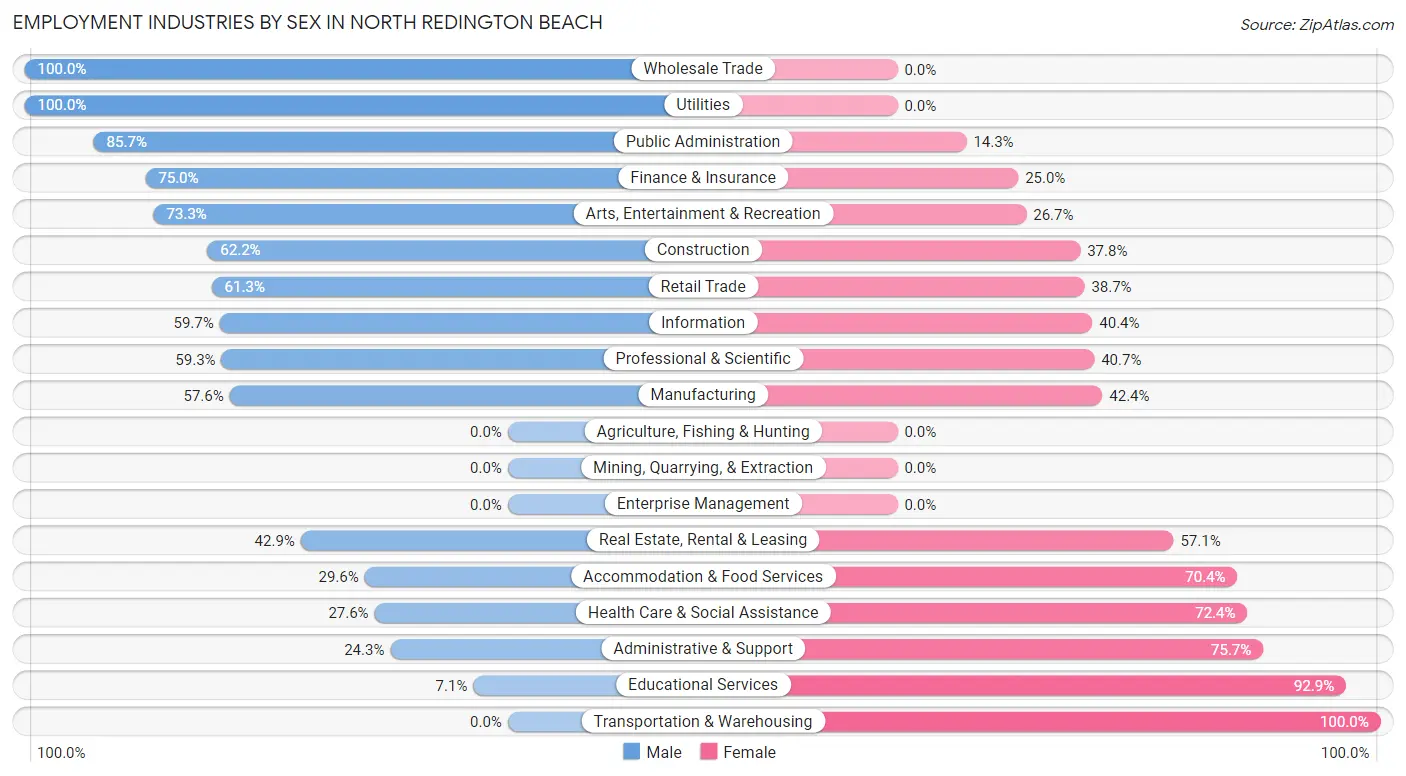
Employment Industries by Sex in North Redington Beach
The North Redington Beach industries that see more men than women are Wholesale Trade (100.0%), Utilities (100.0%), and Public Administration (85.7%), whereas the industries that tend to have a higher number of women are Transportation & Warehousing (100.0%), Educational Services (92.9%), and Administrative & Support (75.7%).
| Industry | Male | Female |
| Agriculture, Fishing & Hunting | 0 (0.0%) | 0 (0.0%) |
| Mining, Quarrying, & Extraction | 0 (0.0%) | 0 (0.0%) |
| Construction | 23 (62.2%) | 14 (37.8%) |
| Manufacturing | 19 (57.6%) | 14 (42.4%) |
| Wholesale Trade | 10 (100.0%) | 0 (0.0%) |
| Retail Trade | 19 (61.3%) | 12 (38.7%) |
| Transportation & Warehousing | 0 (0.0%) | 2 (100.0%) |
| Utilities | 6 (100.0%) | 0 (0.0%) |
| Information | 34 (59.7%) | 23 (40.4%) |
| Finance & Insurance | 21 (75.0%) | 7 (25.0%) |
| Real Estate, Rental & Leasing | 9 (42.9%) | 12 (57.1%) |
| Professional & Scientific | 32 (59.3%) | 22 (40.7%) |
| Enterprise Management | 0 (0.0%) | 0 (0.0%) |
| Administrative & Support | 9 (24.3%) | 28 (75.7%) |
| Educational Services | 3 (7.1%) | 39 (92.9%) |
| Health Care & Social Assistance | 16 (27.6%) | 42 (72.4%) |
| Arts, Entertainment & Recreation | 11 (73.3%) | 4 (26.7%) |
| Accommodation & Food Services | 8 (29.6%) | 19 (70.4%) |
| Public Administration | 12 (85.7%) | 2 (14.3%) |
| Total | 241 (48.5%) | 256 (51.5%) |
Education in North Redington Beach
School Enrollment in North Redington Beach
The most common levels of schooling among the 193 students in North Redington Beach are elementary school (70 | 36.3%), college / undergraduate (41 | 21.2%), and graduate / professional (29 | 15.0%).
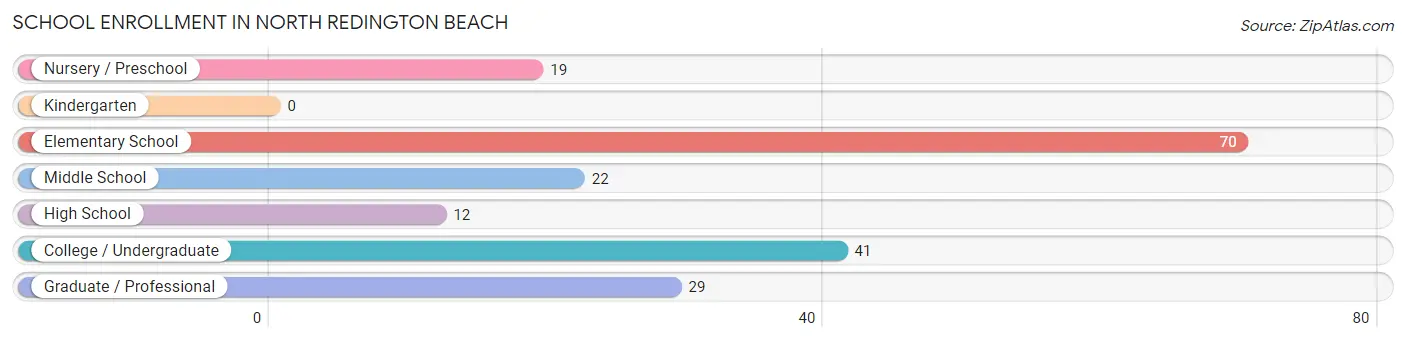
| School Level | # Students | % Students |
| Nursery / Preschool | 19 | 9.8% |
| Kindergarten | 0 | 0.0% |
| Elementary School | 70 | 36.3% |
| Middle School | 22 | 11.4% |
| High School | 12 | 6.2% |
| College / Undergraduate | 41 | 21.2% |
| Graduate / Professional | 29 | 15.0% |
| Total | 193 | 100.0% |
School Enrollment by Age by Funding Source in North Redington Beach
Out of a total of 193 students who are enrolled in schools in North Redington Beach, 51 (26.4%) attend a private institution, while the remaining 142 (73.6%) are enrolled in public schools. The age group of 3 to 4 year olds has the highest likelihood of being enrolled in private schools, with 19 (100.0% in the age bracket) enrolled. Conversely, the age group of 18 to 19 year olds has the lowest likelihood of being enrolled in a private school, with 3 (100.0% in the age bracket) attending a public institution.
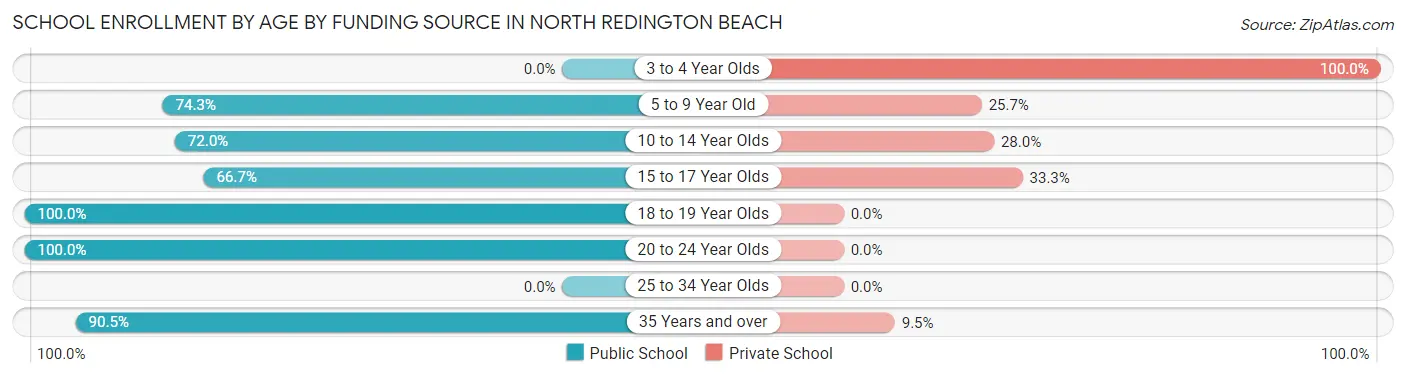
| Age Bracket | Public School | Private School |
| 3 to 4 Year Olds | 0 (0.0%) | 19 (100.0%) |
| 5 to 9 Year Old | 52 (74.3%) | 18 (25.7%) |
| 10 to 14 Year Olds | 18 (72.0%) | 7 (28.0%) |
| 15 to 17 Year Olds | 6 (66.7%) | 3 (33.3%) |
| 18 to 19 Year Olds | 3 (100.0%) | 0 (0.0%) |
| 20 to 24 Year Olds | 25 (100.0%) | 0 (0.0%) |
| 25 to 34 Year Olds | 0 (0.0%) | 0 (0.0%) |
| 35 Years and over | 38 (90.5%) | 4 (9.5%) |
| Total | 142 (73.6%) | 51 (26.4%) |
Educational Attainment by Field of Study in North Redington Beach
Business (162 | 23.5%), education (123 | 17.9%), science & technology (102 | 14.8%), social sciences (54 | 7.9%), and psychology (48 | 7.0%) are the most common fields of study among 688 individuals in North Redington Beach who have obtained a bachelor's degree or higher.
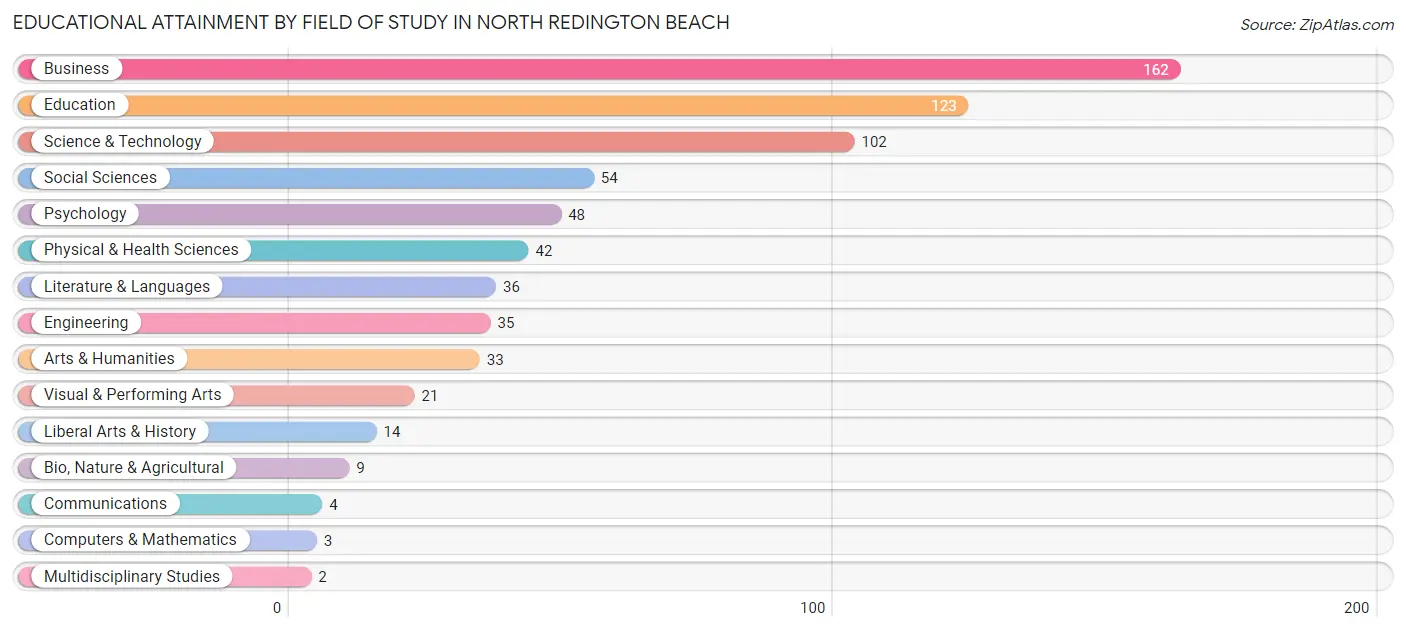
| Field of Study | # Graduates | % Graduates |
| Computers & Mathematics | 3 | 0.4% |
| Bio, Nature & Agricultural | 9 | 1.3% |
| Physical & Health Sciences | 42 | 6.1% |
| Psychology | 48 | 7.0% |
| Social Sciences | 54 | 7.9% |
| Engineering | 35 | 5.1% |
| Multidisciplinary Studies | 2 | 0.3% |
| Science & Technology | 102 | 14.8% |
| Business | 162 | 23.5% |
| Education | 123 | 17.9% |
| Literature & Languages | 36 | 5.2% |
| Liberal Arts & History | 14 | 2.0% |
| Visual & Performing Arts | 21 | 3.0% |
| Communications | 4 | 0.6% |
| Arts & Humanities | 33 | 4.8% |
| Total | 688 | 100.0% |
Transportation & Commute in North Redington Beach
Vehicle Availability by Sex in North Redington Beach
The most prevalent vehicle ownership categories in North Redington Beach are males with 2 vehicles (127, accounting for 53.1%) and females with 2 vehicles (147, making up 50.0%).
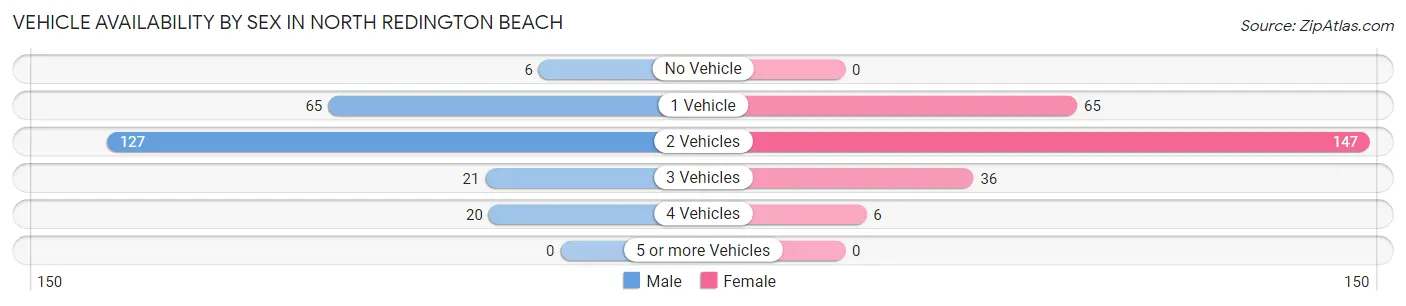
| Vehicles Available | Male | Female |
| No Vehicle | 6 (2.5%) | 0 (0.0%) |
| 1 Vehicle | 65 (27.2%) | 65 (25.6%) |
| 2 Vehicles | 127 (53.1%) | 147 (57.9%) |
| 3 Vehicles | 21 (8.8%) | 36 (14.2%) |
| 4 Vehicles | 20 (8.4%) | 6 (2.4%) |
| 5 or more Vehicles | 0 (0.0%) | 0 (0.0%) |
| Total | 239 (100.0%) | 254 (100.0%) |
Commute Time in North Redington Beach
The most frequently occuring commute durations in North Redington Beach are 45 to 59 minutes (74 commuters, 19.4%), 30 to 34 minutes (73 commuters, 19.1%), and 15 to 19 minutes (53 commuters, 13.9%).
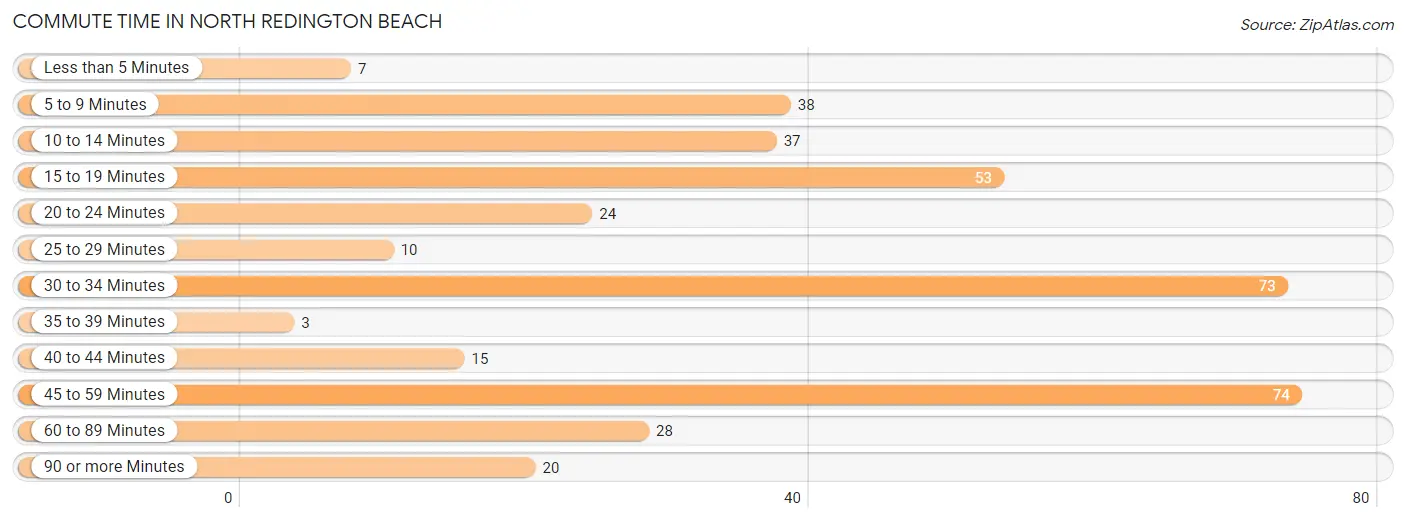
| Commute Time | # Commuters | % Commuters |
| Less than 5 Minutes | 7 | 1.8% |
| 5 to 9 Minutes | 38 | 10.0% |
| 10 to 14 Minutes | 37 | 9.7% |
| 15 to 19 Minutes | 53 | 13.9% |
| 20 to 24 Minutes | 24 | 6.3% |
| 25 to 29 Minutes | 10 | 2.6% |
| 30 to 34 Minutes | 73 | 19.1% |
| 35 to 39 Minutes | 3 | 0.8% |
| 40 to 44 Minutes | 15 | 3.9% |
| 45 to 59 Minutes | 74 | 19.4% |
| 60 to 89 Minutes | 28 | 7.3% |
| 90 or more Minutes | 20 | 5.2% |
Commute Time by Sex in North Redington Beach
The most common commute times in North Redington Beach are 30 to 34 minutes (53 commuters, 28.6%) for males and 45 to 59 minutes (62 commuters, 31.5%) for females.
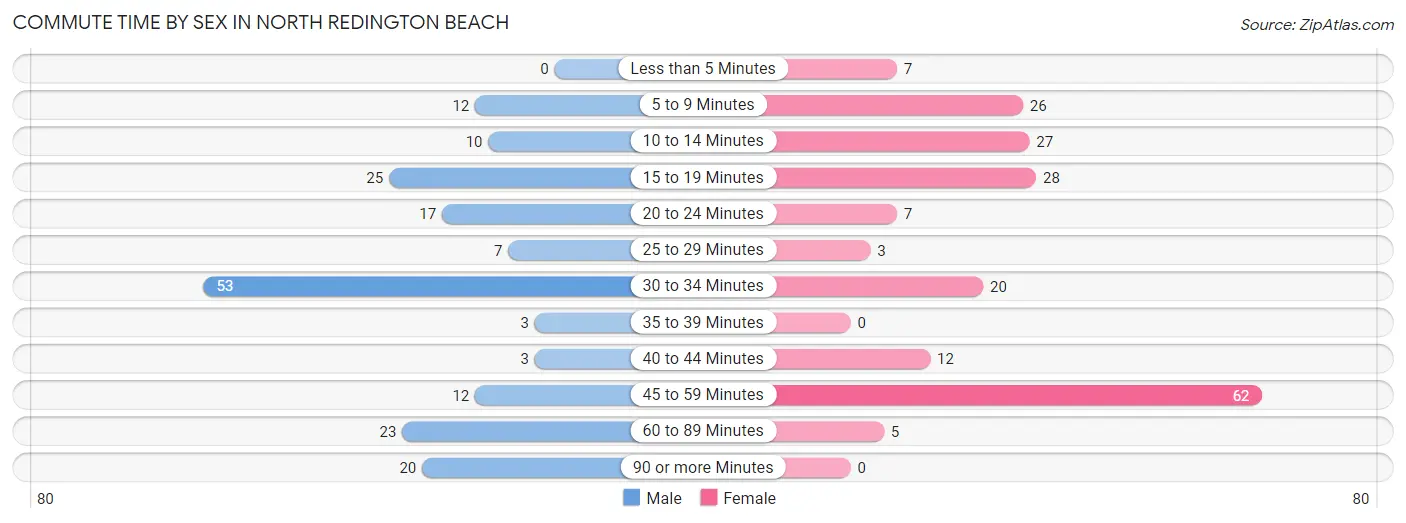
| Commute Time | Male | Female |
| Less than 5 Minutes | 0 (0.0%) | 7 (3.5%) |
| 5 to 9 Minutes | 12 (6.5%) | 26 (13.2%) |
| 10 to 14 Minutes | 10 (5.4%) | 27 (13.7%) |
| 15 to 19 Minutes | 25 (13.5%) | 28 (14.2%) |
| 20 to 24 Minutes | 17 (9.2%) | 7 (3.5%) |
| 25 to 29 Minutes | 7 (3.8%) | 3 (1.5%) |
| 30 to 34 Minutes | 53 (28.6%) | 20 (10.2%) |
| 35 to 39 Minutes | 3 (1.6%) | 0 (0.0%) |
| 40 to 44 Minutes | 3 (1.6%) | 12 (6.1%) |
| 45 to 59 Minutes | 12 (6.5%) | 62 (31.5%) |
| 60 to 89 Minutes | 23 (12.4%) | 5 (2.5%) |
| 90 or more Minutes | 20 (10.8%) | 0 (0.0%) |
Time of Departure to Work by Sex in North Redington Beach
The most frequent times of departure to work in North Redington Beach are 9:00 AM to 9:59 AM (39, 21.1%) for males and 7:00 AM to 7:29 AM (83, 42.1%) for females.
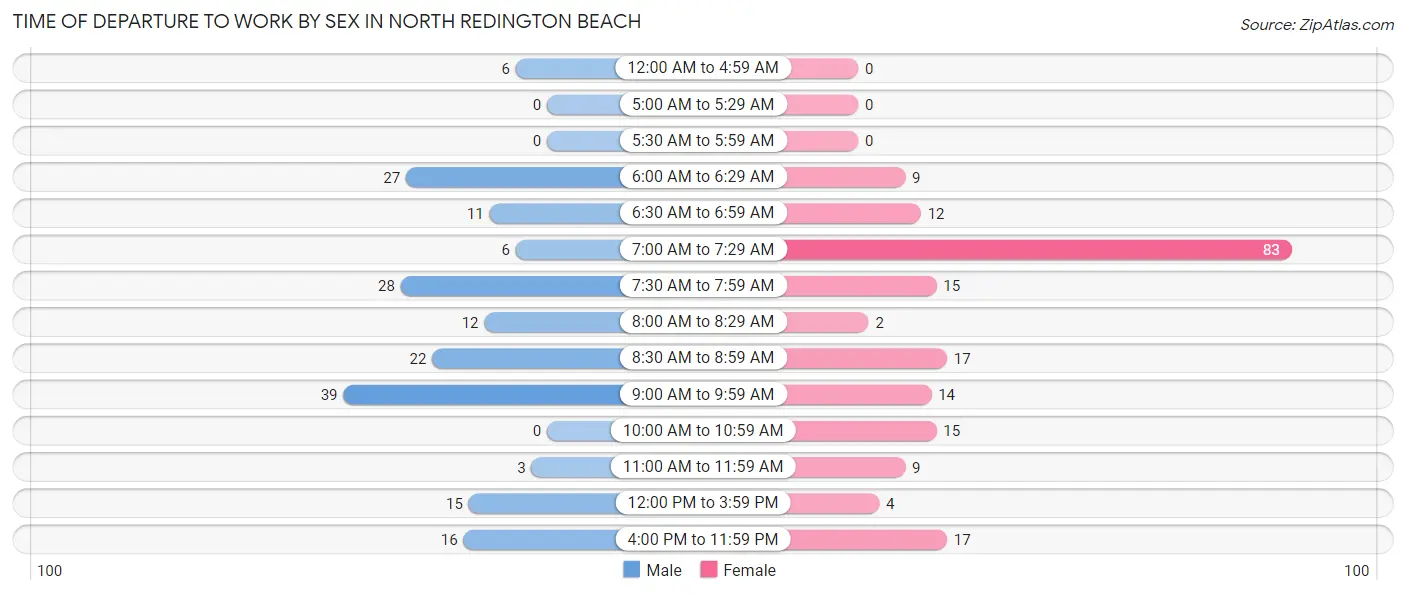
| Time of Departure | Male | Female |
| 12:00 AM to 4:59 AM | 6 (3.2%) | 0 (0.0%) |
| 5:00 AM to 5:29 AM | 0 (0.0%) | 0 (0.0%) |
| 5:30 AM to 5:59 AM | 0 (0.0%) | 0 (0.0%) |
| 6:00 AM to 6:29 AM | 27 (14.6%) | 9 (4.6%) |
| 6:30 AM to 6:59 AM | 11 (5.9%) | 12 (6.1%) |
| 7:00 AM to 7:29 AM | 6 (3.2%) | 83 (42.1%) |
| 7:30 AM to 7:59 AM | 28 (15.1%) | 15 (7.6%) |
| 8:00 AM to 8:29 AM | 12 (6.5%) | 2 (1.0%) |
| 8:30 AM to 8:59 AM | 22 (11.9%) | 17 (8.6%) |
| 9:00 AM to 9:59 AM | 39 (21.1%) | 14 (7.1%) |
| 10:00 AM to 10:59 AM | 0 (0.0%) | 15 (7.6%) |
| 11:00 AM to 11:59 AM | 3 (1.6%) | 9 (4.6%) |
| 12:00 PM to 3:59 PM | 15 (8.1%) | 4 (2.0%) |
| 4:00 PM to 11:59 PM | 16 (8.6%) | 17 (8.6%) |
| Total | 185 (100.0%) | 197 (100.0%) |
Housing Occupancy in North Redington Beach
Occupancy by Ownership in North Redington Beach
Of the total 635 dwellings in North Redington Beach, owner-occupied units account for 420 (66.1%), while renter-occupied units make up 215 (33.9%).
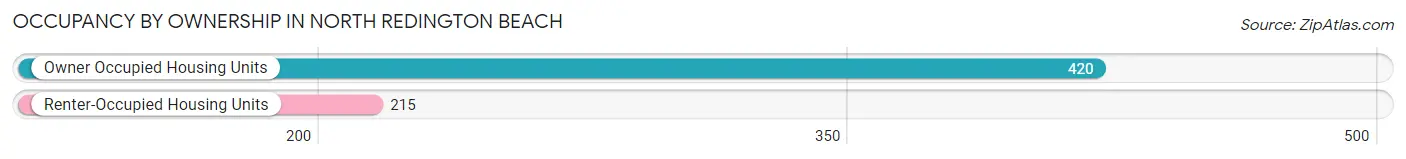
| Occupancy | # Housing Units | % Housing Units |
| Owner Occupied Housing Units | 420 | 66.1% |
| Renter-Occupied Housing Units | 215 | 33.9% |
| Total Occupied Housing Units | 635 | 100.0% |
Occupancy by Household Size in North Redington Beach
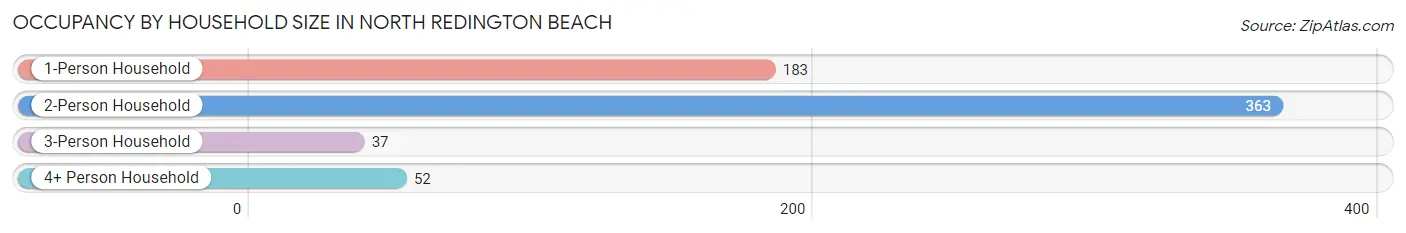
| Household Size | # Housing Units | % Housing Units |
| 1-Person Household | 183 | 28.8% |
| 2-Person Household | 363 | 57.2% |
| 3-Person Household | 37 | 5.8% |
| 4+ Person Household | 52 | 8.2% |
| Total Housing Units | 635 | 100.0% |
Occupancy by Ownership by Household Size in North Redington Beach
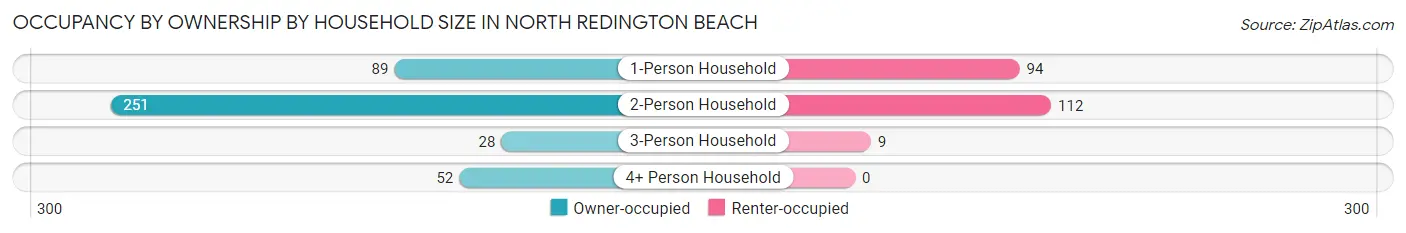
| Household Size | Owner-occupied | Renter-occupied |
| 1-Person Household | 89 (48.6%) | 94 (51.4%) |
| 2-Person Household | 251 (69.2%) | 112 (30.8%) |
| 3-Person Household | 28 (75.7%) | 9 (24.3%) |
| 4+ Person Household | 52 (100.0%) | 0 (0.0%) |
| Total Housing Units | 420 (66.1%) | 215 (33.9%) |
Occupancy by Educational Attainment in North Redington Beach
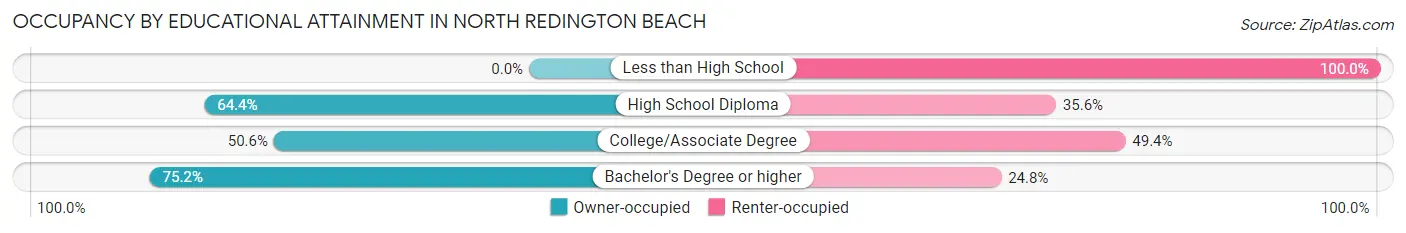
| Household Size | Owner-occupied | Renter-occupied |
| Less than High School | 0 (0.0%) | 7 (100.0%) |
| High School Diploma | 65 (64.4%) | 36 (35.6%) |
| College/Associate Degree | 85 (50.6%) | 83 (49.4%) |
| Bachelor's Degree or higher | 270 (75.2%) | 89 (24.8%) |
Occupancy by Age of Householder in North Redington Beach
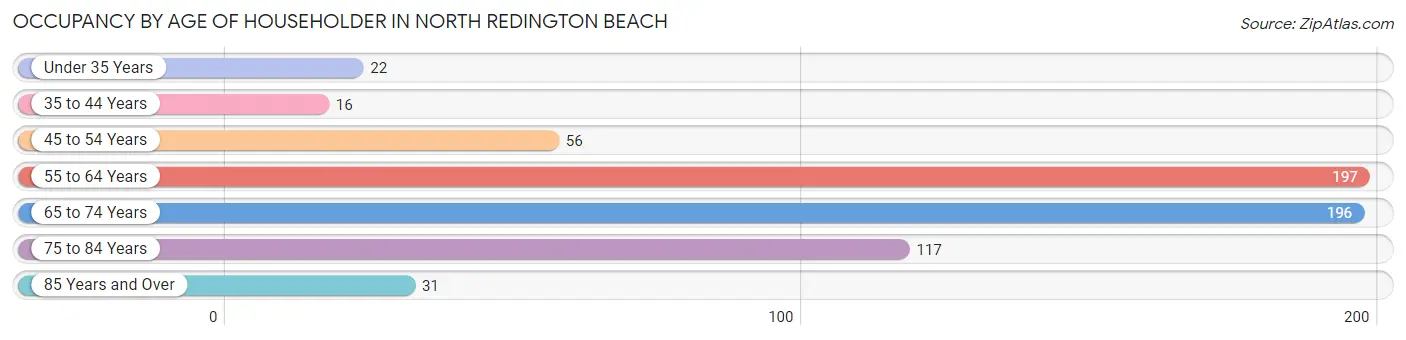
| Age Bracket | # Households | % Households |
| Under 35 Years | 22 | 3.5% |
| 35 to 44 Years | 16 | 2.5% |
| 45 to 54 Years | 56 | 8.8% |
| 55 to 64 Years | 197 | 31.0% |
| 65 to 74 Years | 196 | 30.9% |
| 75 to 84 Years | 117 | 18.4% |
| 85 Years and Over | 31 | 4.9% |
| Total | 635 | 100.0% |
Housing Finances in North Redington Beach
Median Income by Occupancy in North Redington Beach
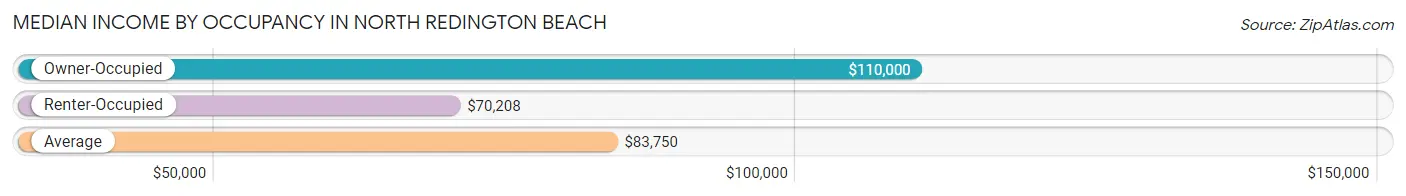
| Occupancy Type | # Households | Median Income |
| Owner-Occupied | 420 (66.1%) | $110,000 |
| Renter-Occupied | 215 (33.9%) | $70,208 |
| Average | 635 (100.0%) | $83,750 |
Occupancy by Householder Income Bracket in North Redington Beach
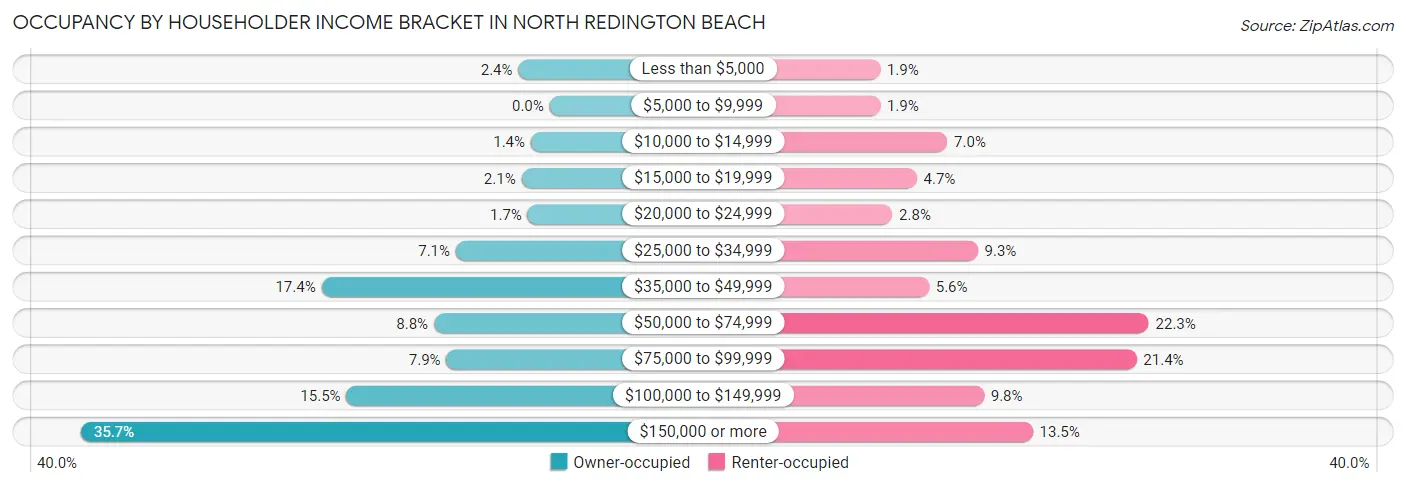
| Income Bracket | Owner-occupied | Renter-occupied |
| Less than $5,000 | 10 (2.4%) | 4 (1.9%) |
| $5,000 to $9,999 | 0 (0.0%) | 4 (1.9%) |
| $10,000 to $14,999 | 6 (1.4%) | 15 (7.0%) |
| $15,000 to $19,999 | 9 (2.1%) | 10 (4.6%) |
| $20,000 to $24,999 | 7 (1.7%) | 6 (2.8%) |
| $25,000 to $34,999 | 30 (7.1%) | 20 (9.3%) |
| $35,000 to $49,999 | 73 (17.4%) | 12 (5.6%) |
| $50,000 to $74,999 | 37 (8.8%) | 48 (22.3%) |
| $75,000 to $99,999 | 33 (7.9%) | 46 (21.4%) |
| $100,000 to $149,999 | 65 (15.5%) | 21 (9.8%) |
| $150,000 or more | 150 (35.7%) | 29 (13.5%) |
| Total | 420 (100.0%) | 215 (100.0%) |
Monthly Housing Cost Tiers in North Redington Beach
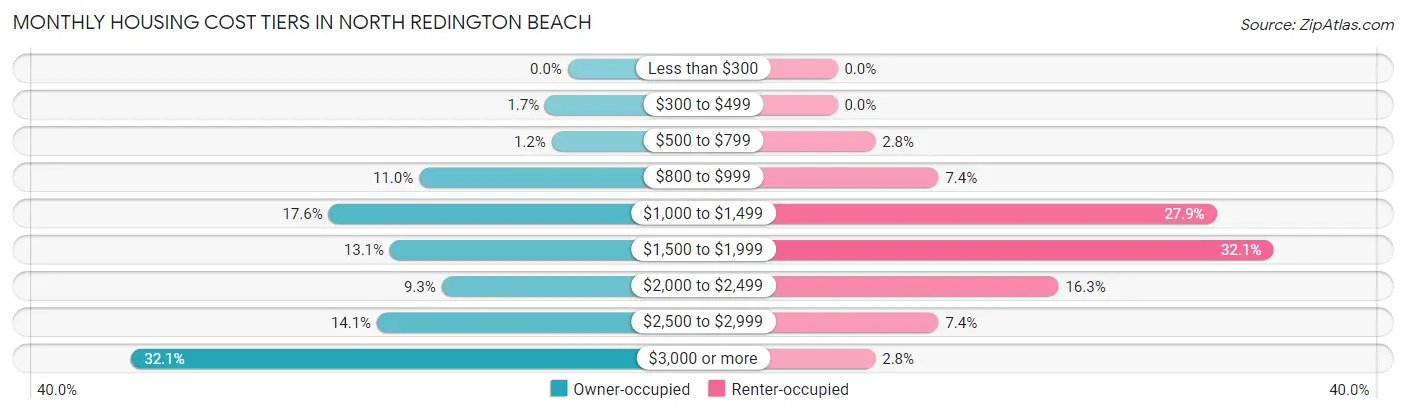
| Monthly Cost | Owner-occupied | Renter-occupied |
| Less than $300 | 0 (0.0%) | 0 (0.0%) |
| $300 to $499 | 7 (1.7%) | 0 (0.0%) |
| $500 to $799 | 5 (1.2%) | 6 (2.8%) |
| $800 to $999 | 46 (11.0%) | 16 (7.4%) |
| $1,000 to $1,499 | 74 (17.6%) | 60 (27.9%) |
| $1,500 to $1,999 | 55 (13.1%) | 69 (32.1%) |
| $2,000 to $2,499 | 39 (9.3%) | 35 (16.3%) |
| $2,500 to $2,999 | 59 (14.1%) | 16 (7.4%) |
| $3,000 or more | 135 (32.1%) | 6 (2.8%) |
| Total | 420 (100.0%) | 215 (100.0%) |
Physical Housing Characteristics in North Redington Beach
Housing Structures in North Redington Beach
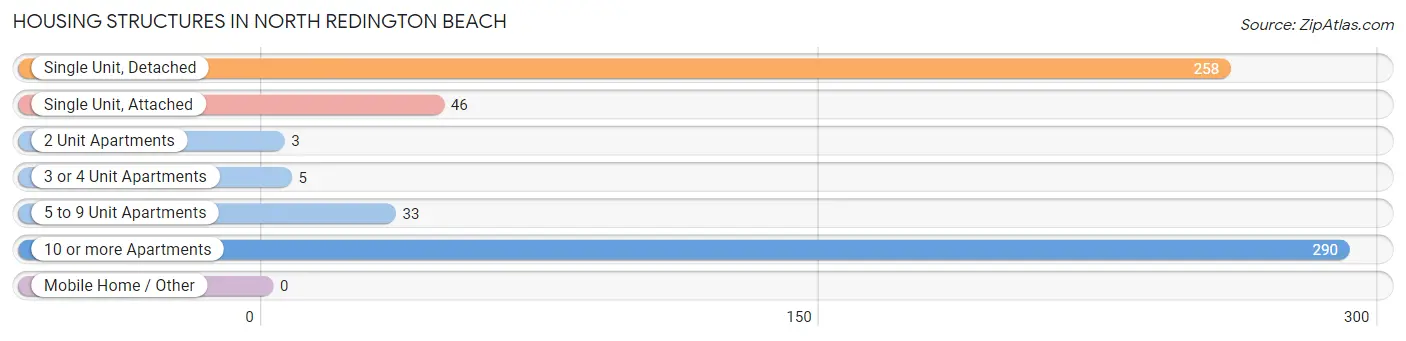
| Structure Type | # Housing Units | % Housing Units |
| Single Unit, Detached | 258 | 40.6% |
| Single Unit, Attached | 46 | 7.2% |
| 2 Unit Apartments | 3 | 0.5% |
| 3 or 4 Unit Apartments | 5 | 0.8% |
| 5 to 9 Unit Apartments | 33 | 5.2% |
| 10 or more Apartments | 290 | 45.7% |
| Mobile Home / Other | 0 | 0.0% |
| Total | 635 | 100.0% |
Housing Structures by Occupancy in North Redington Beach
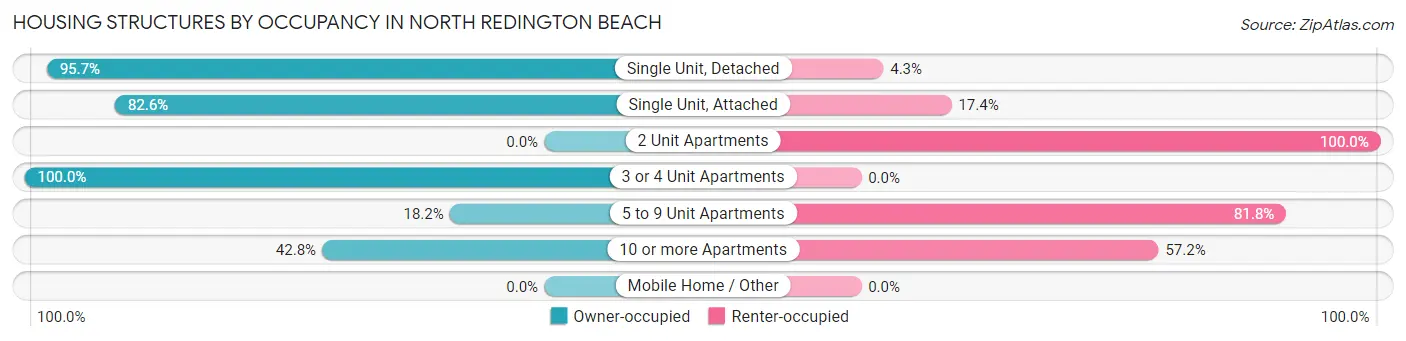
| Structure Type | Owner-occupied | Renter-occupied |
| Single Unit, Detached | 247 (95.7%) | 11 (4.3%) |
| Single Unit, Attached | 38 (82.6%) | 8 (17.4%) |
| 2 Unit Apartments | 0 (0.0%) | 3 (100.0%) |
| 3 or 4 Unit Apartments | 5 (100.0%) | 0 (0.0%) |
| 5 to 9 Unit Apartments | 6 (18.2%) | 27 (81.8%) |
| 10 or more Apartments | 124 (42.8%) | 166 (57.2%) |
| Mobile Home / Other | 0 (0.0%) | 0 (0.0%) |
| Total | 420 (66.1%) | 215 (33.9%) |
Housing Structures by Number of Rooms in North Redington Beach
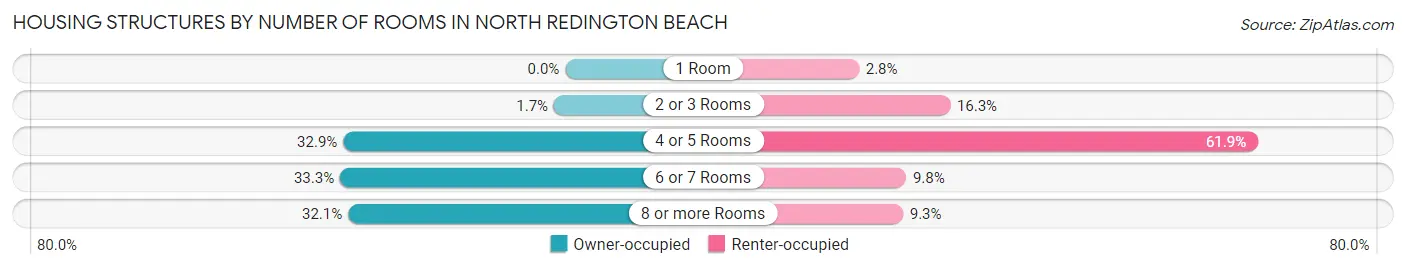
| Number of Rooms | Owner-occupied | Renter-occupied |
| 1 Room | 0 (0.0%) | 6 (2.8%) |
| 2 or 3 Rooms | 7 (1.7%) | 35 (16.3%) |
| 4 or 5 Rooms | 138 (32.9%) | 133 (61.9%) |
| 6 or 7 Rooms | 140 (33.3%) | 21 (9.8%) |
| 8 or more Rooms | 135 (32.1%) | 20 (9.3%) |
| Total | 420 (100.0%) | 215 (100.0%) |
Housing Structure by Heating Type in North Redington Beach
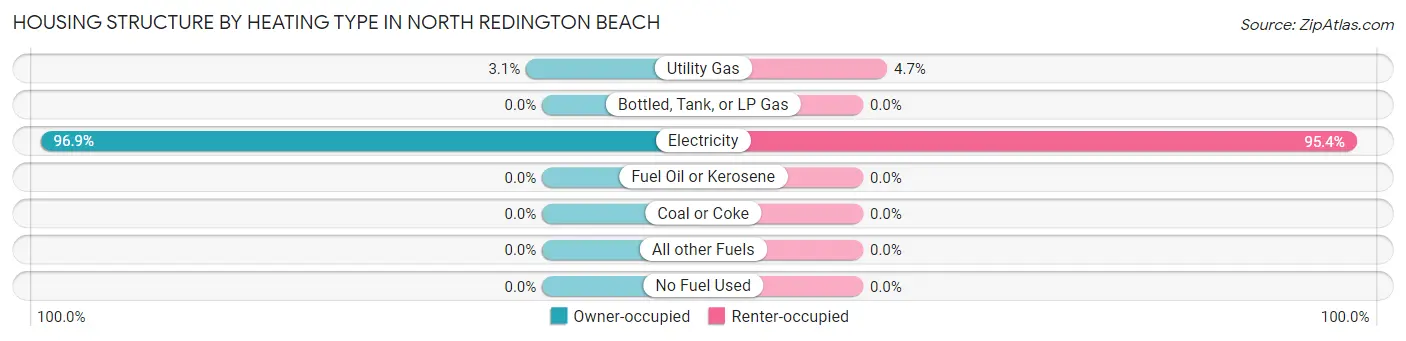
| Heating Type | Owner-occupied | Renter-occupied |
| Utility Gas | 13 (3.1%) | 10 (4.6%) |
| Bottled, Tank, or LP Gas | 0 (0.0%) | 0 (0.0%) |
| Electricity | 407 (96.9%) | 205 (95.4%) |
| Fuel Oil or Kerosene | 0 (0.0%) | 0 (0.0%) |
| Coal or Coke | 0 (0.0%) | 0 (0.0%) |
| All other Fuels | 0 (0.0%) | 0 (0.0%) |
| No Fuel Used | 0 (0.0%) | 0 (0.0%) |
| Total | 420 (100.0%) | 215 (100.0%) |
Household Vehicle Usage in North Redington Beach
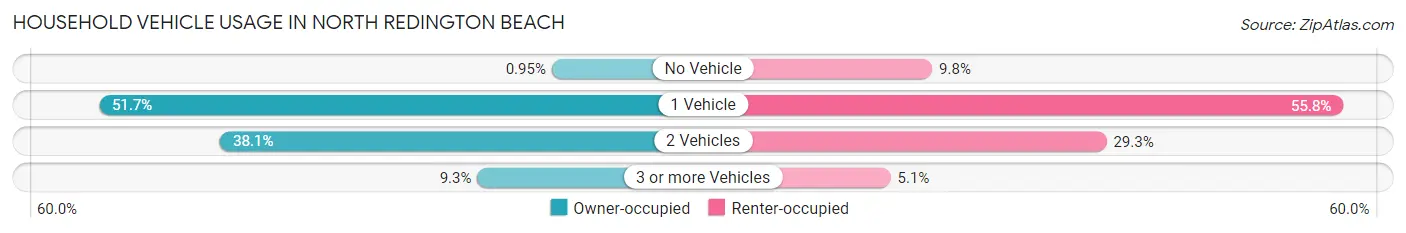
| Vehicles per Household | Owner-occupied | Renter-occupied |
| No Vehicle | 4 (0.9%) | 21 (9.8%) |
| 1 Vehicle | 217 (51.7%) | 120 (55.8%) |
| 2 Vehicles | 160 (38.1%) | 63 (29.3%) |
| 3 or more Vehicles | 39 (9.3%) | 11 (5.1%) |
| Total | 420 (100.0%) | 215 (100.0%) |
Real Estate & Mortgages in North Redington Beach
Real Estate and Mortgage Overview in North Redington Beach
| Characteristic | Without Mortgage | With Mortgage |
| Housing Units | 221 | 199 |
| Median Property Value | $822,500 | $722,600 |
| Median Household Income | $118,750 | $76 |
| Monthly Housing Costs | $1,326 | $135 |
| Real Estate Taxes | $7,282 | $6 |
Property Value by Mortgage Status in North Redington Beach
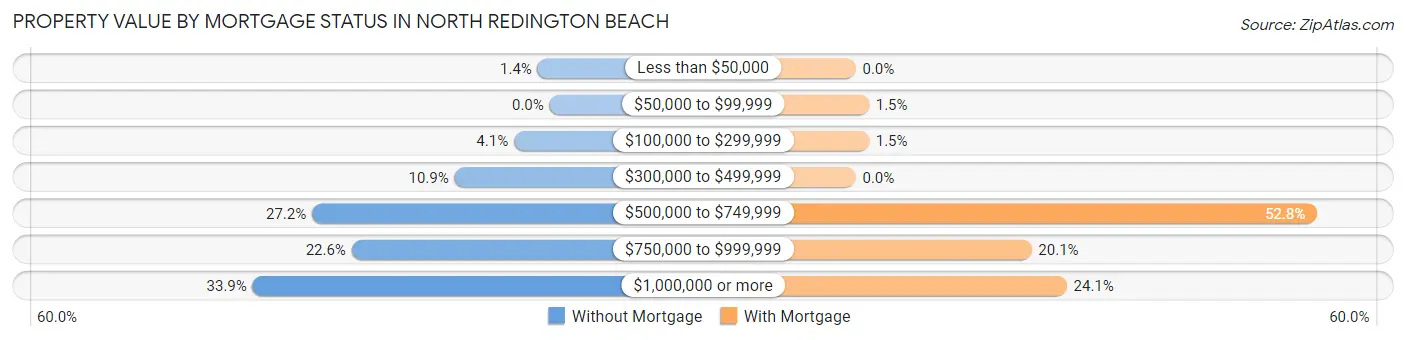
| Property Value | Without Mortgage | With Mortgage |
| Less than $50,000 | 3 (1.4%) | 0 (0.0%) |
| $50,000 to $99,999 | 0 (0.0%) | 3 (1.5%) |
| $100,000 to $299,999 | 9 (4.1%) | 3 (1.5%) |
| $300,000 to $499,999 | 24 (10.9%) | 0 (0.0%) |
| $500,000 to $749,999 | 60 (27.2%) | 105 (52.8%) |
| $750,000 to $999,999 | 50 (22.6%) | 40 (20.1%) |
| $1,000,000 or more | 75 (33.9%) | 48 (24.1%) |
| Total | 221 (100.0%) | 199 (100.0%) |
Household Income by Mortgage Status in North Redington Beach
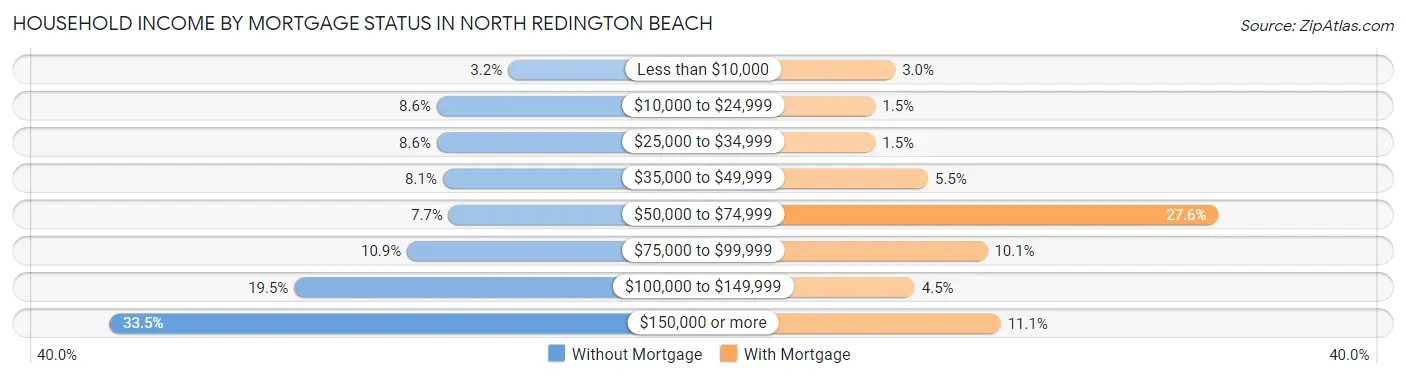
| Household Income | Without Mortgage | With Mortgage |
| Less than $10,000 | 7 (3.2%) | 6 (3.0%) |
| $10,000 to $24,999 | 19 (8.6%) | 3 (1.5%) |
| $25,000 to $34,999 | 19 (8.6%) | 3 (1.5%) |
| $35,000 to $49,999 | 18 (8.1%) | 11 (5.5%) |
| $50,000 to $74,999 | 17 (7.7%) | 55 (27.6%) |
| $75,000 to $99,999 | 24 (10.9%) | 20 (10.1%) |
| $100,000 to $149,999 | 43 (19.5%) | 9 (4.5%) |
| $150,000 or more | 74 (33.5%) | 22 (11.1%) |
| Total | 221 (100.0%) | 199 (100.0%) |
Property Value to Household Income Ratio in North Redington Beach
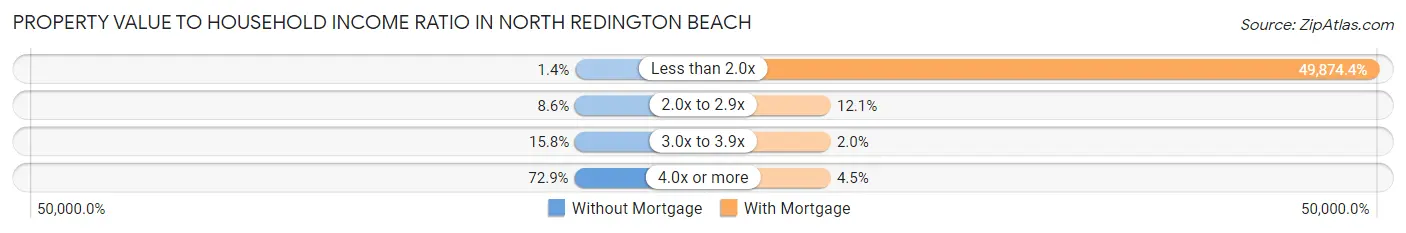
| Value-to-Income Ratio | Without Mortgage | With Mortgage |
| Less than 2.0x | 3 (1.4%) | 99,250 (49,874.4%) |
| 2.0x to 2.9x | 19 (8.6%) | 24 (12.1%) |
| 3.0x to 3.9x | 35 (15.8%) | 4 (2.0%) |
| 4.0x or more | 161 (72.9%) | 9 (4.5%) |
| Total | 221 (100.0%) | 199 (100.0%) |
Real Estate Taxes by Mortgage Status in North Redington Beach
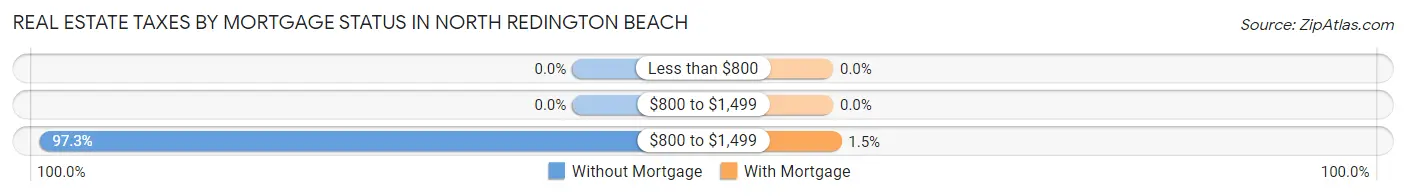
| Property Taxes | Without Mortgage | With Mortgage |
| Less than $800 | 0 (0.0%) | 0 (0.0%) |
| $800 to $1,499 | 0 (0.0%) | 0 (0.0%) |
| $800 to $1,499 | 215 (97.3%) | 3 (1.5%) |
| Total | 221 (100.0%) | 199 (100.0%) |
Health & Disability in North Redington Beach
Health Insurance Coverage by Age in North Redington Beach
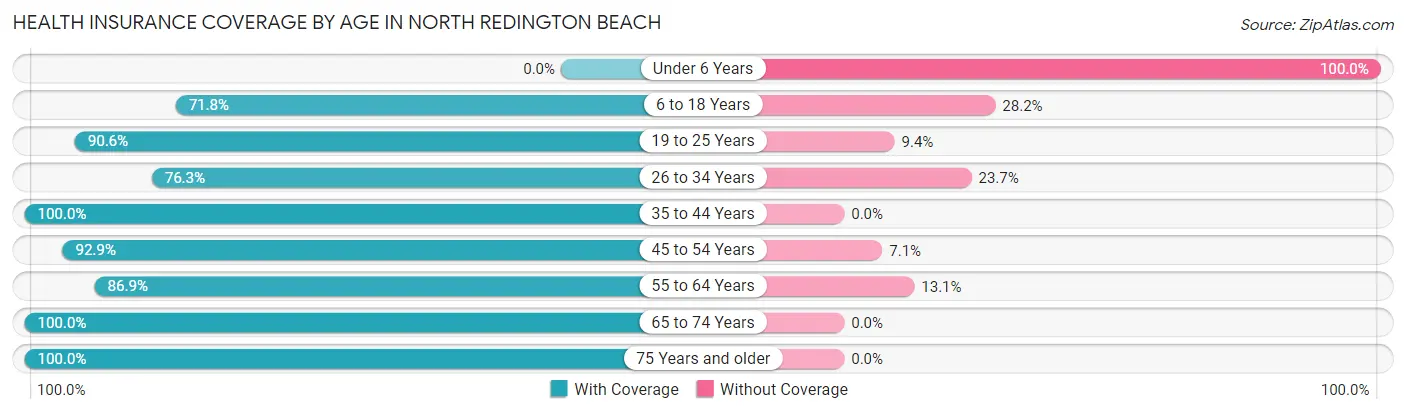
| Age Bracket | With Coverage | Without Coverage |
| Under 6 Years | 0 (0.0%) | 19 (100.0%) |
| 6 to 18 Years | 79 (71.8%) | 31 (28.2%) |
| 19 to 25 Years | 29 (90.6%) | 3 (9.4%) |
| 26 to 34 Years | 45 (76.3%) | 14 (23.7%) |
| 35 to 44 Years | 133 (100.0%) | 0 (0.0%) |
| 45 to 54 Years | 118 (92.9%) | 9 (7.1%) |
| 55 to 64 Years | 326 (86.9%) | 49 (13.1%) |
| 65 to 74 Years | 299 (100.0%) | 0 (0.0%) |
| 75 Years and older | 195 (100.0%) | 0 (0.0%) |
| Total | 1,224 (90.7%) | 125 (9.3%) |
Health Insurance Coverage by Citizenship Status in North Redington Beach
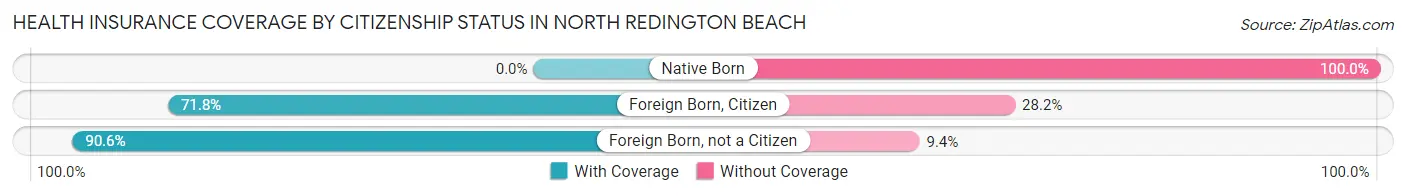
| Citizenship Status | With Coverage | Without Coverage |
| Native Born | 0 (0.0%) | 19 (100.0%) |
| Foreign Born, Citizen | 79 (71.8%) | 31 (28.2%) |
| Foreign Born, not a Citizen | 29 (90.6%) | 3 (9.4%) |
Health Insurance Coverage by Household Income in North Redington Beach
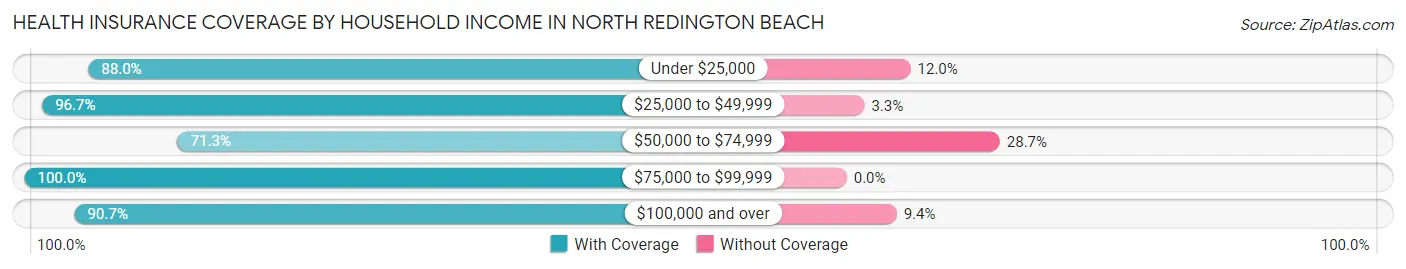
| Household Income | With Coverage | Without Coverage |
| Under $25,000 | 81 (88.0%) | 11 (12.0%) |
| $25,000 to $49,999 | 234 (96.7%) | 8 (3.3%) |
| $50,000 to $74,999 | 92 (71.3%) | 37 (28.7%) |
| $75,000 to $99,999 | 148 (100.0%) | 0 (0.0%) |
| $100,000 and over | 669 (90.6%) | 69 (9.3%) |
Public vs Private Health Insurance Coverage by Age in North Redington Beach
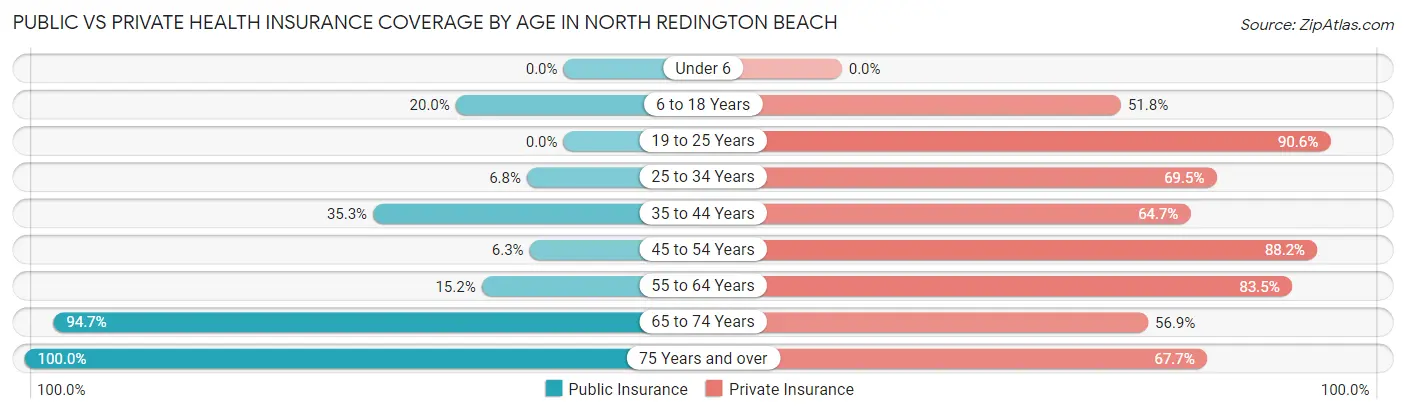
| Age Bracket | Public Insurance | Private Insurance |
| Under 6 | 0 (0.0%) | 0 (0.0%) |
| 6 to 18 Years | 22 (20.0%) | 57 (51.8%) |
| 19 to 25 Years | 0 (0.0%) | 29 (90.6%) |
| 25 to 34 Years | 4 (6.8%) | 41 (69.5%) |
| 35 to 44 Years | 47 (35.3%) | 86 (64.7%) |
| 45 to 54 Years | 8 (6.3%) | 112 (88.2%) |
| 55 to 64 Years | 57 (15.2%) | 313 (83.5%) |
| 65 to 74 Years | 283 (94.7%) | 170 (56.9%) |
| 75 Years and over | 195 (100.0%) | 132 (67.7%) |
| Total | 616 (45.7%) | 940 (69.7%) |
Disability Status by Sex by Age in North Redington Beach
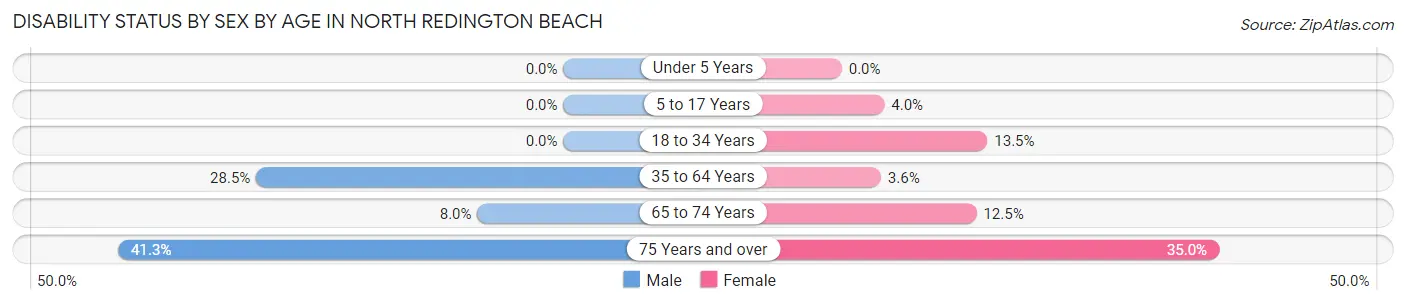
| Age Bracket | Male | Female |
| Under 5 Years | 0 (0.0%) | 0 (0.0%) |
| 5 to 17 Years | 0 (0.0%) | 3 (4.0%) |
| 18 to 34 Years | 0 (0.0%) | 5 (13.5%) |
| 35 to 64 Years | 71 (28.5%) | 14 (3.6%) |
| 65 to 74 Years | 13 (8.0%) | 17 (12.5%) |
| 75 Years and over | 31 (41.3%) | 42 (35.0%) |
Disability Class by Sex by Age in North Redington Beach
Disability Class: Hearing Difficulty
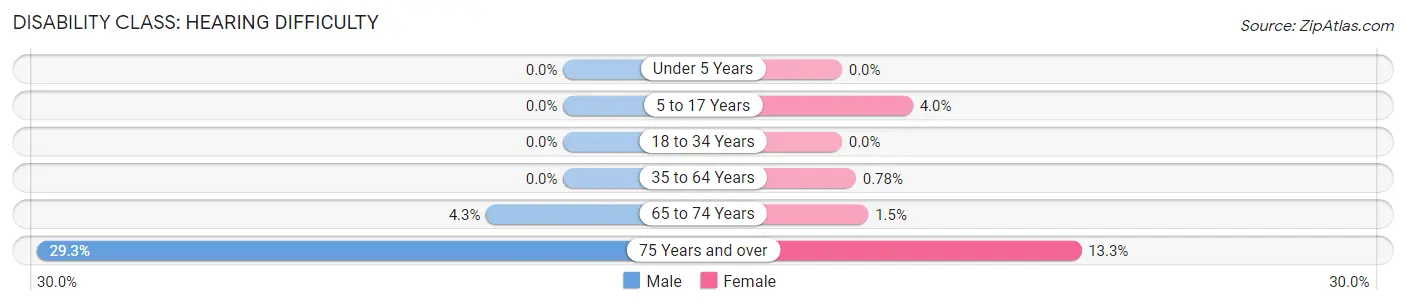
| Age Bracket | Male | Female |
| Under 5 Years | 0 (0.0%) | 0 (0.0%) |
| 5 to 17 Years | 0 (0.0%) | 3 (4.0%) |
| 18 to 34 Years | 0 (0.0%) | 0 (0.0%) |
| 35 to 64 Years | 0 (0.0%) | 3 (0.8%) |
| 65 to 74 Years | 7 (4.3%) | 2 (1.5%) |
| 75 Years and over | 22 (29.3%) | 16 (13.3%) |
Disability Class: Vision Difficulty
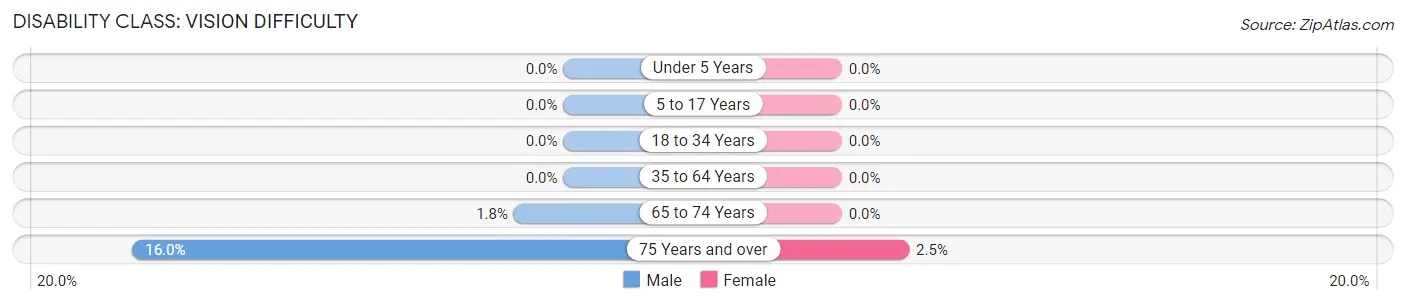
| Age Bracket | Male | Female |
| Under 5 Years | 0 (0.0%) | 0 (0.0%) |
| 5 to 17 Years | 0 (0.0%) | 0 (0.0%) |
| 18 to 34 Years | 0 (0.0%) | 0 (0.0%) |
| 35 to 64 Years | 0 (0.0%) | 0 (0.0%) |
| 65 to 74 Years | 3 (1.8%) | 0 (0.0%) |
| 75 Years and over | 12 (16.0%) | 3 (2.5%) |
Disability Class: Cognitive Difficulty
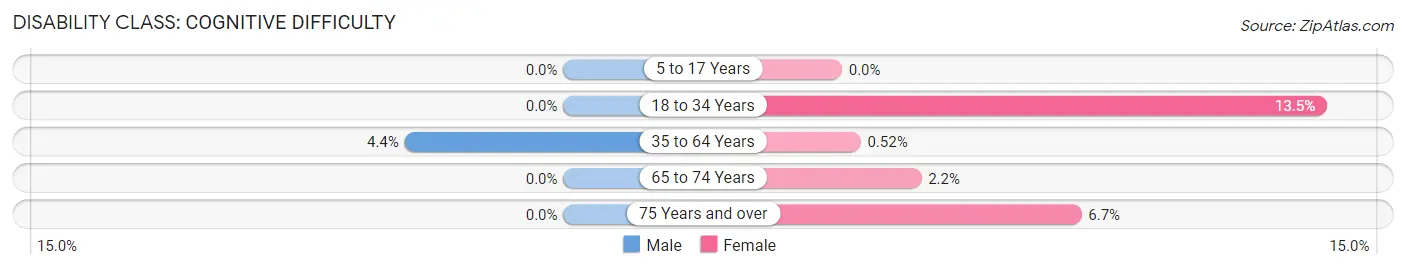
| Age Bracket | Male | Female |
| 5 to 17 Years | 0 (0.0%) | 0 (0.0%) |
| 18 to 34 Years | 0 (0.0%) | 5 (13.5%) |
| 35 to 64 Years | 11 (4.4%) | 2 (0.5%) |
| 65 to 74 Years | 0 (0.0%) | 3 (2.2%) |
| 75 Years and over | 0 (0.0%) | 8 (6.7%) |
Disability Class: Ambulatory Difficulty
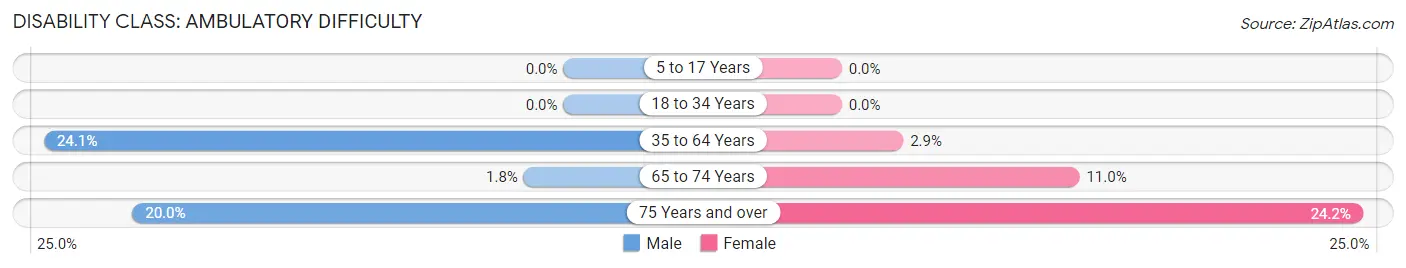
| Age Bracket | Male | Female |
| 5 to 17 Years | 0 (0.0%) | 0 (0.0%) |
| 18 to 34 Years | 0 (0.0%) | 0 (0.0%) |
| 35 to 64 Years | 60 (24.1%) | 11 (2.9%) |
| 65 to 74 Years | 3 (1.8%) | 15 (11.0%) |
| 75 Years and over | 15 (20.0%) | 29 (24.2%) |
Disability Class: Self-Care Difficulty
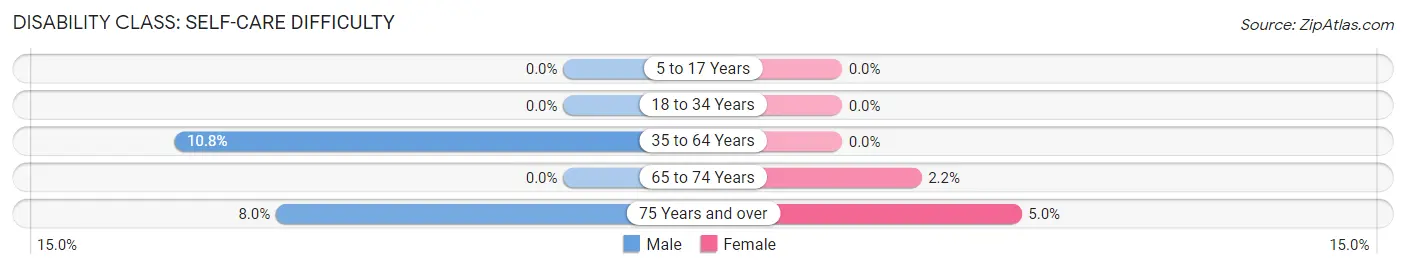
| Age Bracket | Male | Female |
| 5 to 17 Years | 0 (0.0%) | 0 (0.0%) |
| 18 to 34 Years | 0 (0.0%) | 0 (0.0%) |
| 35 to 64 Years | 27 (10.8%) | 0 (0.0%) |
| 65 to 74 Years | 0 (0.0%) | 3 (2.2%) |
| 75 Years and over | 6 (8.0%) | 6 (5.0%) |
Technology Access in North Redington Beach
Computing Device Access in North Redington Beach
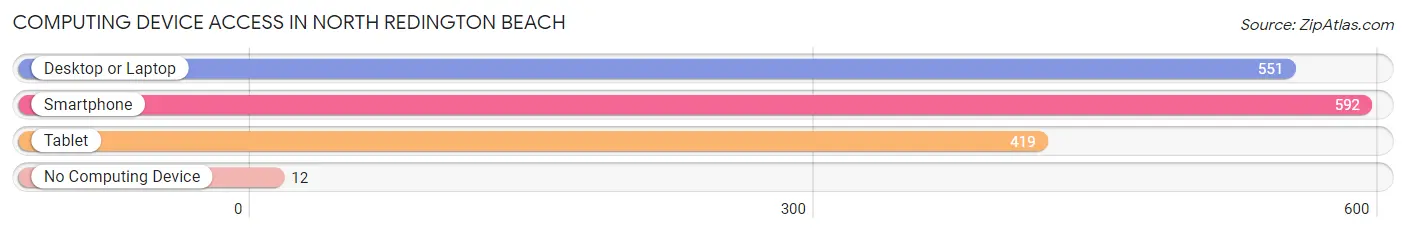
| Device Type | # Households | % Households |
| Desktop or Laptop | 551 | 86.8% |
| Smartphone | 592 | 93.2% |
| Tablet | 419 | 66.0% |
| No Computing Device | 12 | 1.9% |
| Total | 635 | 100.0% |
Internet Access in North Redington Beach
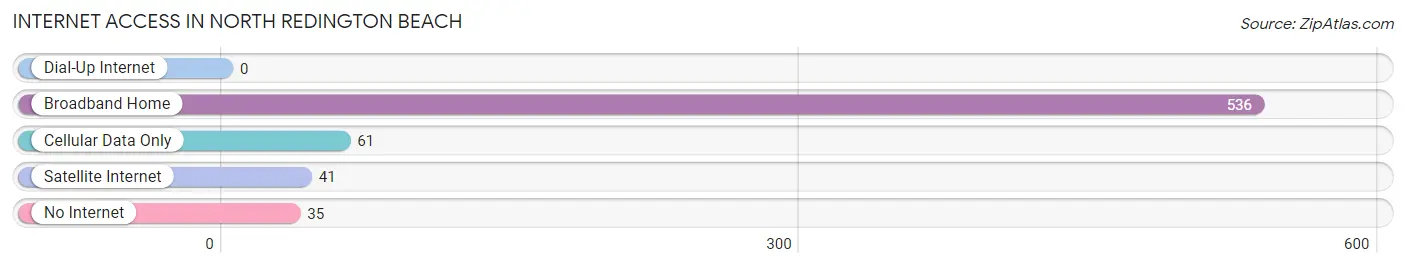
| Internet Type | # Households | % Households |
| Dial-Up Internet | 0 | 0.0% |
| Broadband Home | 536 | 84.4% |
| Cellular Data Only | 61 | 9.6% |
| Satellite Internet | 41 | 6.5% |
| No Internet | 35 | 5.5% |
| Total | 635 | 100.0% |
North Redington Beach Summary
Redington Beach is a small town located in Pinellas County, Florida. It is situated on the Gulf of Mexico, just north of St. Petersburg and south of Clearwater. The town is part of the Tampa Bay Area and is known for its beautiful beaches and relaxed atmosphere.
History
Redington Beach was first settled in the late 1800s by a group of fishermen from the Bahamas. The town was originally called Redington Shores, but the name was changed to Redington Beach in 1925. The town was incorporated in 1950 and has since grown to a population of over 2,000 people.
Geography
Redington Beach is located on the Gulf of Mexico, just north of St. Petersburg and south of Clearwater. The town is situated on a barrier island, which is separated from the mainland by the Intracoastal Waterway. The town is bordered by the Gulf of Mexico to the west and the Intracoastal Waterway to the east. The town is approximately 2.5 miles long and 0.5 miles wide.
Economy
Redington Beach is a popular tourist destination, and the town’s economy is largely based on tourism. The town is home to several hotels, restaurants, and shops, as well as a marina and a public beach. The town also has a number of small businesses, including a grocery store, a pharmacy, and a hardware store.
Demographics
As of the 2010 census, Redington Beach had a population of 2,073 people. The population is predominantly white (90.2%), with a small percentage of African Americans (3.2%) and Hispanics (2.7%). The median household income is $50,945, and the median age is 47.
Redington Beach is a small town with a relaxed atmosphere and a strong sense of community. The town is known for its beautiful beaches and is a popular tourist destination. The town’s economy is largely based on tourism, and the town is home to a number of small businesses. Redington Beach is a great place to live, work, and play.
Common Questions
What is Per Capita Income in North Redington Beach?
Per Capita income in North Redington Beach is $63,449.
What is the Median Family Income in North Redington Beach?
Median Family Income in North Redington Beach is $99,063.
What is the Median Household income in North Redington Beach?
Median Household Income in North Redington Beach is $83,750.
What is Income or Wage Gap in North Redington Beach?
Income or Wage Gap in North Redington Beach is 65.5%.
Women in North Redington Beach earn 34.5 cents for every dollar earned by a man.
What is Inequality or Gini Index in North Redington Beach?
Inequality or Gini Index in North Redington Beach is 0.51.
What is the Total Population of North Redington Beach?
Total Population of North Redington Beach is 1,349.
What is the Total Male Population of North Redington Beach?
Total Male Population of North Redington Beach is 575.
What is the Total Female Population of North Redington Beach?
Total Female Population of North Redington Beach is 774.
What is the Ratio of Males per 100 Females in North Redington Beach?
There are 74.29 Males per 100 Females in North Redington Beach.
What is the Ratio of Females per 100 Males in North Redington Beach?
There are 134.61 Females per 100 Males in North Redington Beach.
What is the Median Population Age in North Redington Beach?
Median Population Age in North Redington Beach is 61.5 Years.
What is the Average Family Size in North Redington Beach
Average Family Size in North Redington Beach is 2.6 People.
What is the Average Household Size in North Redington Beach
Average Household Size in North Redington Beach is 2.1 People.
How Large is the Labor Force in North Redington Beach?
There are 565 People in the Labor Forcein in North Redington Beach.
What is the Percentage of People in the Labor Force in North Redington Beach?
45.9% of People are in the Labor Force in North Redington Beach.
What is the Unemployment Rate in North Redington Beach?
Unemployment Rate in North Redington Beach is 12.0%.