Juno Beach, FL Map & Demographics
Juno Beach Map
Juno Beach Overview
$85,768
PER CAPITA INCOME
$151,458
AVG FAMILY INCOME
$62,566
AVG HOUSEHOLD INCOME
54.1%
WAGE / INCOME GAP [ % ]
45.9¢/ $1
WAGE / INCOME GAP [ $ ]
0.57
INEQUALITY / GINI INDEX
3,818
TOTAL POPULATION
1,443
MALE POPULATION
2,375
FEMALE POPULATION
60.76
MALES / 100 FEMALES
164.59
FEMALES / 100 MALES
69.2
MEDIAN AGE
2.2
AVG FAMILY SIZE
1.6
AVG HOUSEHOLD SIZE
1,412
LABOR FORCE [ PEOPLE ]
37.4%
PERCENT IN LABOR FORCE
8.8%
UNEMPLOYMENT RATE
Juno Beach Area Codes
Income in Juno Beach
Income Overview in Juno Beach
Per Capita Income in Juno Beach is $85,768, while median incomes of families and households are $151,458 and $62,566 respectively.
| Characteristic | Number | Measure |
| Per Capita Income | 3,818 | $85,768 |
| Median Family Income | 1,030 | $151,458 |
| Mean Family Income | 1,030 | $217,144 |
| Median Household Income | 2,332 | $62,566 |
| Mean Household Income | 2,332 | $138,004 |
| Income Deficit | 1,030 | $0 |
| Wage / Income Gap (%) | 3,818 | 54.14% |
| Wage / Income Gap ($) | 3,818 | 45.86¢ per $1 |
| Gini / Inequality Index | 3,818 | 0.57 |
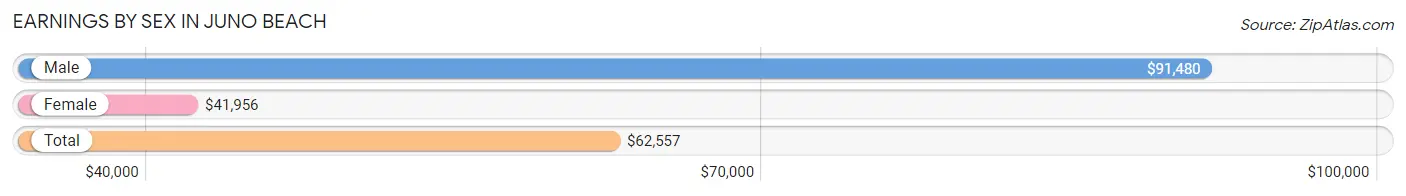
Earnings by Sex in Juno Beach
Average Earnings in Juno Beach are $62,557, $91,480 for men and $41,956 for women, a difference of 54.1%.
| Sex | Number | Average Earnings |
| Male | 603 (42.0%) | $91,480 |
| Female | 833 (58.0%) | $41,956 |
| Total | 1,436 (100.0%) | $62,557 |
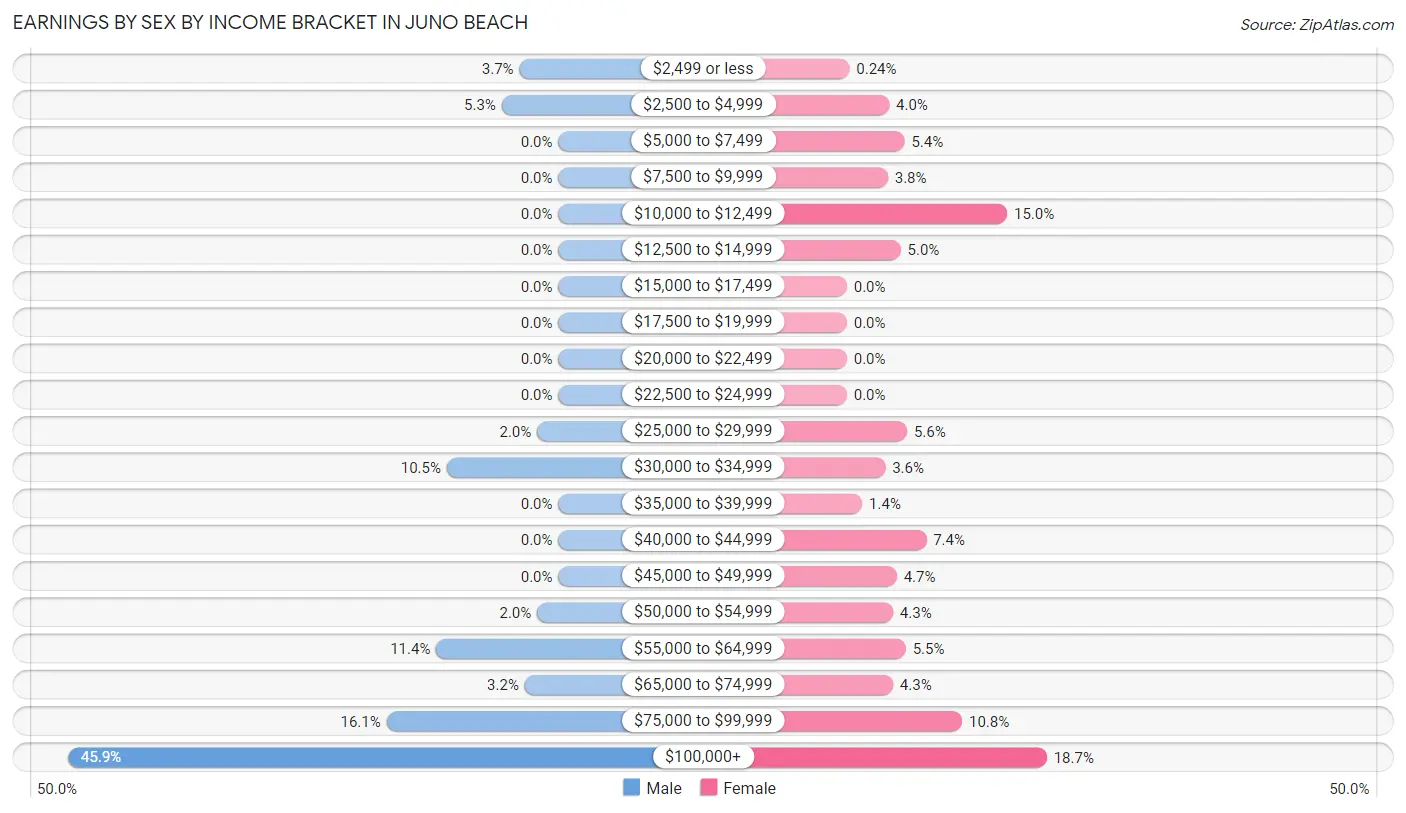
Earnings by Sex by Income Bracket in Juno Beach
The most common earnings brackets in Juno Beach are $100,000+ for men (277 | 45.9%) and $100,000+ for women (156 | 18.7%).
| Income | Male | Female |
| $2,499 or less | 22 (3.6%) | 2 (0.2%) |
| $2,500 to $4,999 | 32 (5.3%) | 33 (4.0%) |
| $5,000 to $7,499 | 0 (0.0%) | 45 (5.4%) |
| $7,500 to $9,999 | 0 (0.0%) | 32 (3.8%) |
| $10,000 to $12,499 | 0 (0.0%) | 125 (15.0%) |
| $12,500 to $14,999 | 0 (0.0%) | 42 (5.0%) |
| $15,000 to $17,499 | 0 (0.0%) | 0 (0.0%) |
| $17,500 to $19,999 | 0 (0.0%) | 0 (0.0%) |
| $20,000 to $22,499 | 0 (0.0%) | 0 (0.0%) |
| $22,500 to $24,999 | 0 (0.0%) | 0 (0.0%) |
| $25,000 to $29,999 | 12 (2.0%) | 47 (5.6%) |
| $30,000 to $34,999 | 63 (10.4%) | 30 (3.6%) |
| $35,000 to $39,999 | 0 (0.0%) | 12 (1.4%) |
| $40,000 to $44,999 | 0 (0.0%) | 62 (7.4%) |
| $45,000 to $49,999 | 0 (0.0%) | 39 (4.7%) |
| $50,000 to $54,999 | 12 (2.0%) | 36 (4.3%) |
| $55,000 to $64,999 | 69 (11.4%) | 46 (5.5%) |
| $65,000 to $74,999 | 19 (3.2%) | 36 (4.3%) |
| $75,000 to $99,999 | 97 (16.1%) | 90 (10.8%) |
| $100,000+ | 277 (45.9%) | 156 (18.7%) |
| Total | 603 (100.0%) | 833 (100.0%) |
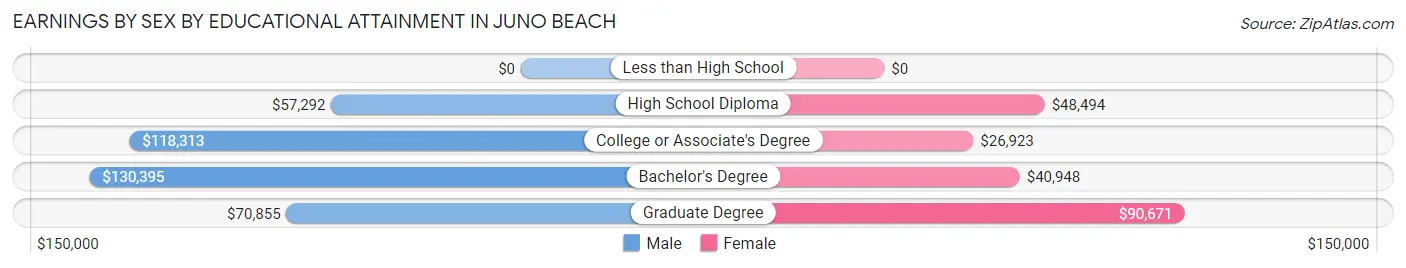
Earnings by Sex by Educational Attainment in Juno Beach
Average earnings in Juno Beach are $91,842 for men and $42,379 for women, a difference of 53.9%. Men with an educational attainment of bachelor's degree enjoy the highest average annual earnings of $130,395, while those with high school diploma education earn the least with $57,292. Women with an educational attainment of graduate degree earn the most with the average annual earnings of $90,671, while those with college or associate's degree education have the smallest earnings of $26,923.
| Educational Attainment | Male Income | Female Income |
| Less than High School | - | - |
| High School Diploma | $57,292 | $48,494 |
| College or Associate's Degree | $118,313 | $26,923 |
| Bachelor's Degree | $130,395 | $40,948 |
| Graduate Degree | $70,855 | $90,671 |
| Total | $91,842 | $42,379 |
Family Income in Juno Beach
Family Income Brackets in Juno Beach
According to the Juno Beach family income data, there are 341 families falling into the $200,000+ income range, which is the most common income bracket and makes up 33.1% of all families.
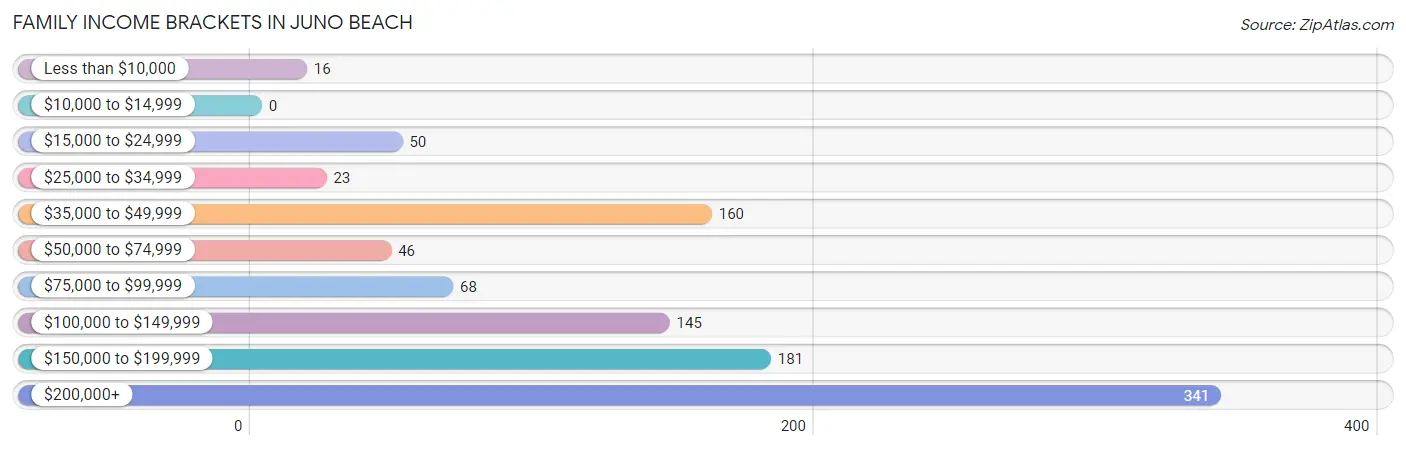
| Income Bracket | # Families | % Families |
| Less than $10,000 | 16 | 1.6% |
| $10,000 to $14,999 | 0 | 0.0% |
| $15,000 to $24,999 | 50 | 4.9% |
| $25,000 to $34,999 | 23 | 2.2% |
| $35,000 to $49,999 | 160 | 15.5% |
| $50,000 to $74,999 | 46 | 4.5% |
| $75,000 to $99,999 | 68 | 6.6% |
| $100,000 to $149,999 | 145 | 14.1% |
| $150,000 to $199,999 | 181 | 17.6% |
| $200,000+ | 341 | 33.1% |
Family Income by Famaliy Size in Juno Beach
3-person families (105 | 10.2%) account for the highest median family income in Juno Beach with $250,001 per family, while 3-person families (105 | 10.2%) have the highest median income of $83,334 per family member.
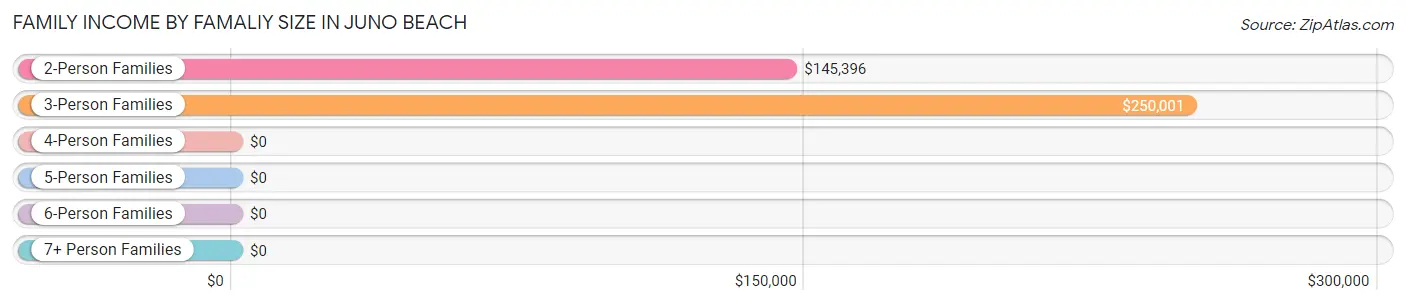
| Income Bracket | # Families | Median Income |
| 2-Person Families | 895 (86.9%) | $145,396 |
| 3-Person Families | 105 (10.2%) | $250,001 |
| 4-Person Families | 30 (2.9%) | $0 |
| 5-Person Families | 0 (0.0%) | $0 |
| 6-Person Families | 0 (0.0%) | $0 |
| 7+ Person Families | 0 (0.0%) | $0 |
| Total | 1,030 (100.0%) | $151,458 |
Family Income by Number of Earners in Juno Beach
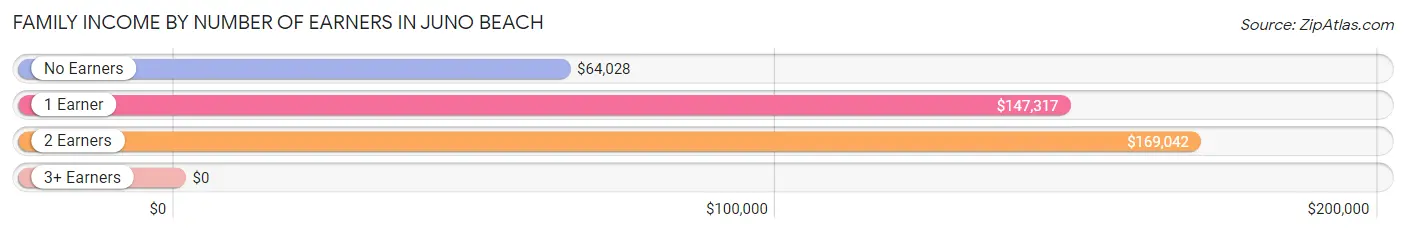
| Number of Earners | # Families | Median Income |
| No Earners | 421 (40.9%) | $64,028 |
| 1 Earner | 314 (30.5%) | $147,317 |
| 2 Earners | 283 (27.5%) | $169,042 |
| 3+ Earners | 12 (1.2%) | $0 |
| Total | 1,030 (100.0%) | $151,458 |
Household Income in Juno Beach
Household Income Brackets in Juno Beach
With 583 households falling in the category, the $35,000 to $49,999 income range is the most frequent in Juno Beach, accounting for 25.0% of all households. In contrast, only 54 households (2.3%) fall into the $10,000 to $14,999 income bracket, making it the least populous group.
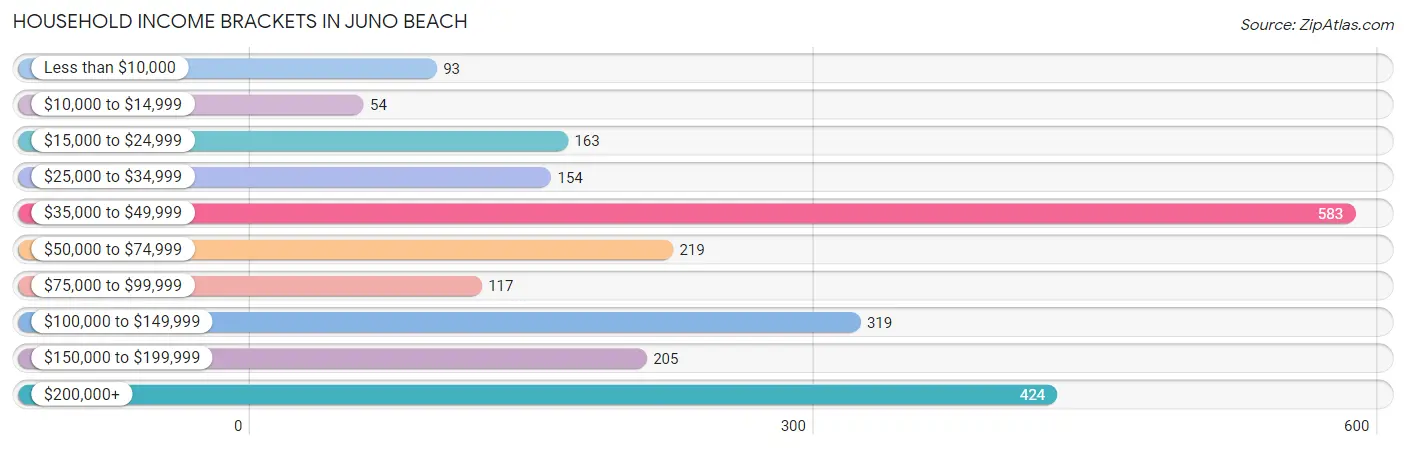
| Income Bracket | # Households | % Households |
| Less than $10,000 | 93 | 4.0% |
| $10,000 to $14,999 | 54 | 2.3% |
| $15,000 to $24,999 | 163 | 7.0% |
| $25,000 to $34,999 | 154 | 6.6% |
| $35,000 to $49,999 | 583 | 25.0% |
| $50,000 to $74,999 | 219 | 9.4% |
| $75,000 to $99,999 | 117 | 5.0% |
| $100,000 to $149,999 | 319 | 13.7% |
| $150,000 to $199,999 | 205 | 8.8% |
| $200,000+ | 424 | 18.2% |
Household Income by Householder Age in Juno Beach
The median household income in Juno Beach is $62,566, with the highest median household income of $143,424 found in the 45 to 64 years age bracket for the primary householder. A total of 597 households (25.6%) fall into this category.
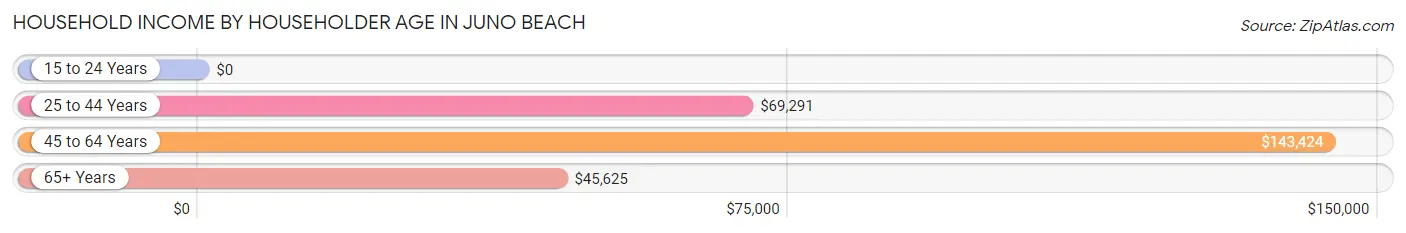
| Income Bracket | # Households | Median Income |
| 15 to 24 Years | 0 (0.0%) | $0 |
| 25 to 44 Years | 103 (4.4%) | $69,291 |
| 45 to 64 Years | 597 (25.6%) | $143,424 |
| 65+ Years | 1,632 (70.0%) | $45,625 |
| Total | 2,332 (100.0%) | $62,566 |
Poverty in Juno Beach
Income Below Poverty by Sex and Age in Juno Beach
With 4.2% poverty level for males and 6.8% for females among the residents of Juno Beach, 55 to 64 year old males and 45 to 54 year old females are the most vulnerable to poverty, with 27 males (9.3%) and 22 females (11.3%) in their respective age groups living below the poverty level.
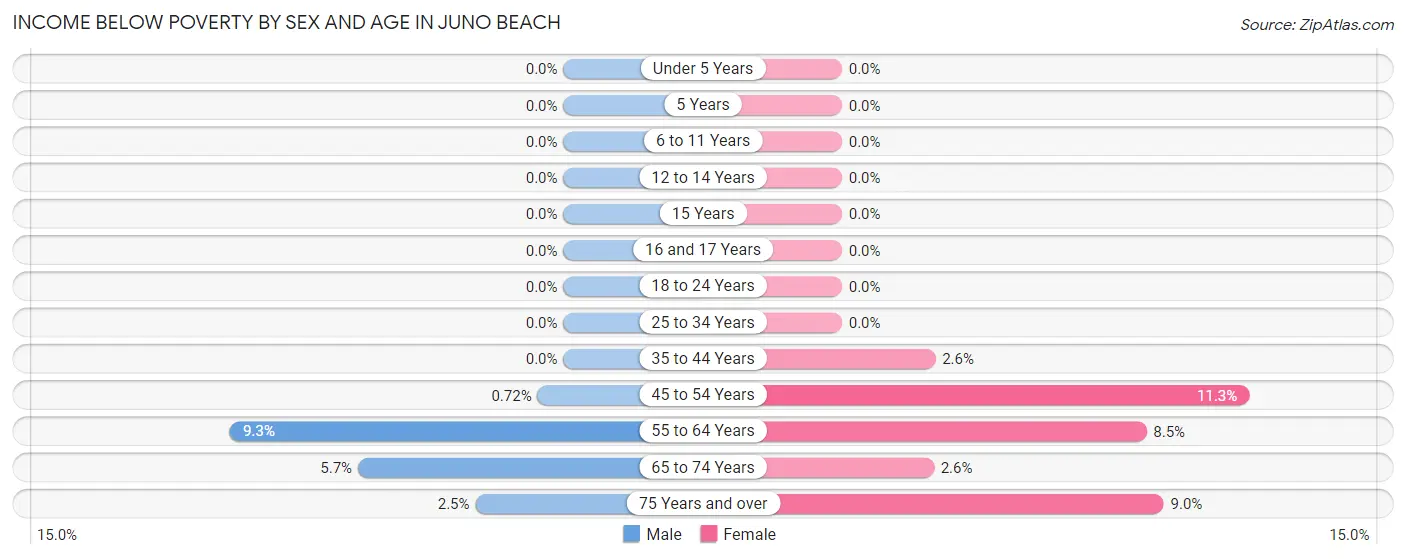
| Age Bracket | Male | Female |
| Under 5 Years | 0 (0.0%) | 0 (0.0%) |
| 5 Years | 0 (0.0%) | 0 (0.0%) |
| 6 to 11 Years | 0 (0.0%) | 0 (0.0%) |
| 12 to 14 Years | 0 (0.0%) | 0 (0.0%) |
| 15 Years | 0 (0.0%) | 0 (0.0%) |
| 16 and 17 Years | 0 (0.0%) | 0 (0.0%) |
| 18 to 24 Years | 0 (0.0%) | 0 (0.0%) |
| 25 to 34 Years | 0 (0.0%) | 0 (0.0%) |
| 35 to 44 Years | 0 (0.0%) | 2 (2.6%) |
| 45 to 54 Years | 1 (0.7%) | 22 (11.3%) |
| 55 to 64 Years | 27 (9.3%) | 39 (8.5%) |
| 65 to 74 Years | 19 (5.7%) | 12 (2.6%) |
| 75 Years and over | 13 (2.5%) | 84 (9.0%) |
| Total | 60 (4.2%) | 159 (6.8%) |
Income Above Poverty by Sex and Age in Juno Beach
According to the poverty statistics in Juno Beach, males aged 16 and 17 years and females aged 6 to 11 years are the age groups that are most secure financially, with 100.0% of males and 100.0% of females in these age groups living above the poverty line.
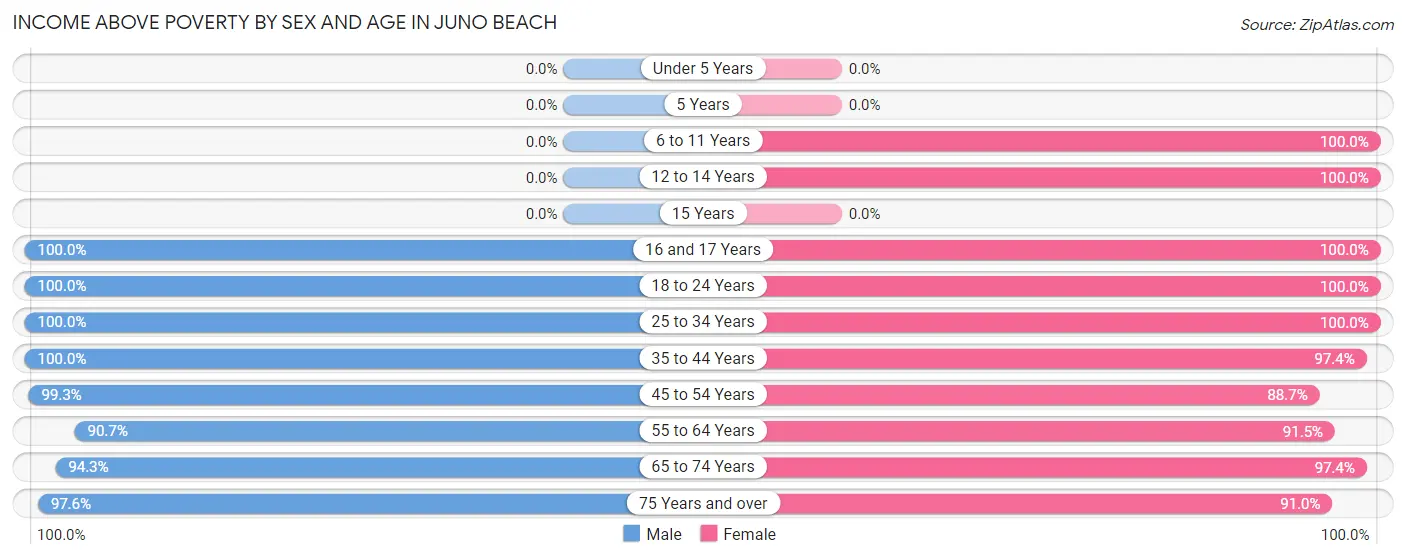
| Age Bracket | Male | Female |
| Under 5 Years | 0 (0.0%) | 0 (0.0%) |
| 5 Years | 0 (0.0%) | 0 (0.0%) |
| 6 to 11 Years | 0 (0.0%) | 13 (100.0%) |
| 12 to 14 Years | 0 (0.0%) | 29 (100.0%) |
| 15 Years | 0 (0.0%) | 0 (0.0%) |
| 16 and 17 Years | 11 (100.0%) | 21 (100.0%) |
| 18 to 24 Years | 29 (100.0%) | 34 (100.0%) |
| 25 to 34 Years | 13 (100.0%) | 94 (100.0%) |
| 35 to 44 Years | 84 (100.0%) | 75 (97.4%) |
| 45 to 54 Years | 138 (99.3%) | 172 (88.7%) |
| 55 to 64 Years | 264 (90.7%) | 421 (91.5%) |
| 65 to 74 Years | 313 (94.3%) | 457 (97.4%) |
| 75 Years and over | 517 (97.6%) | 853 (91.0%) |
| Total | 1,369 (95.8%) | 2,169 (93.2%) |
Income Below Poverty Among Married-Couple Families in Juno Beach
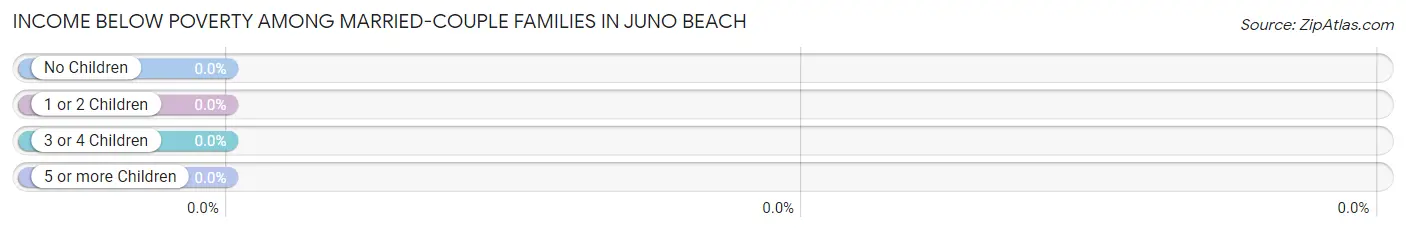
| Children | Above Poverty | Below Poverty |
| No Children | 807 (100.0%) | 0 (0.0%) |
| 1 or 2 Children | 56 (100.0%) | 0 (0.0%) |
| 3 or 4 Children | 0 (0.0%) | 0 (0.0%) |
| 5 or more Children | 0 (0.0%) | 0 (0.0%) |
| Total | 863 (100.0%) | 0 (0.0%) |
Income Below Poverty Among Single-Parent Households in Juno Beach
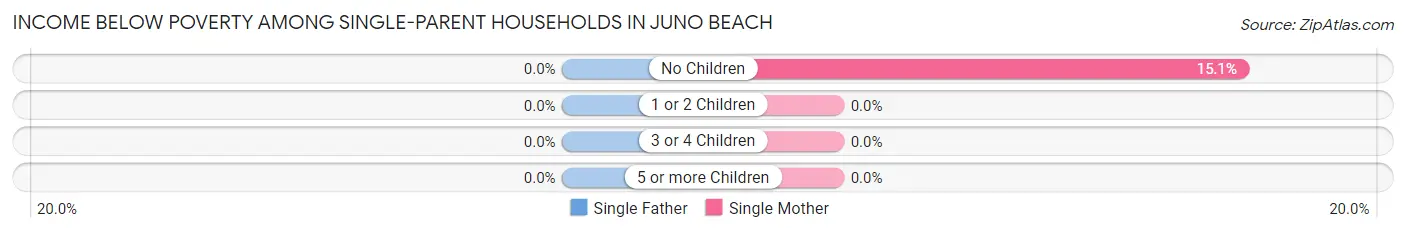
| Children | Single Father | Single Mother |
| No Children | 0 (0.0%) | 16 (15.1%) |
| 1 or 2 Children | 0 (0.0%) | 0 (0.0%) |
| 3 or 4 Children | 0 (0.0%) | 0 (0.0%) |
| 5 or more Children | 0 (0.0%) | 0 (0.0%) |
| Total | 0 (0.0%) | 16 (12.9%) |
Income Below Poverty Among Married-Couple vs Single-Parent Households in Juno Beach
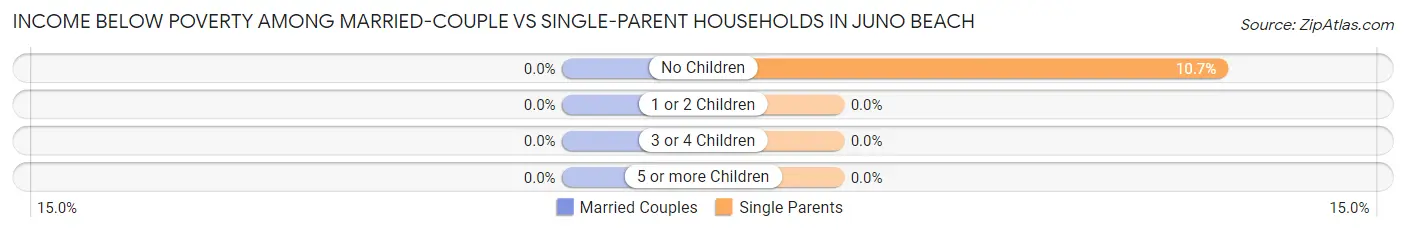
| Children | Married-Couple Families | Single-Parent Households |
| No Children | 0 (0.0%) | 16 (10.7%) |
| 1 or 2 Children | 0 (0.0%) | 0 (0.0%) |
| 3 or 4 Children | 0 (0.0%) | 0 (0.0%) |
| 5 or more Children | 0 (0.0%) | 0 (0.0%) |
| Total | 0 (0.0%) | 16 (9.6%) |
Race in Juno Beach
The most populous races in Juno Beach are White / Caucasian (3,524 | 92.3%), Hispanic or Latino (407 | 10.7%), and Two or more Races (224 | 5.9%).
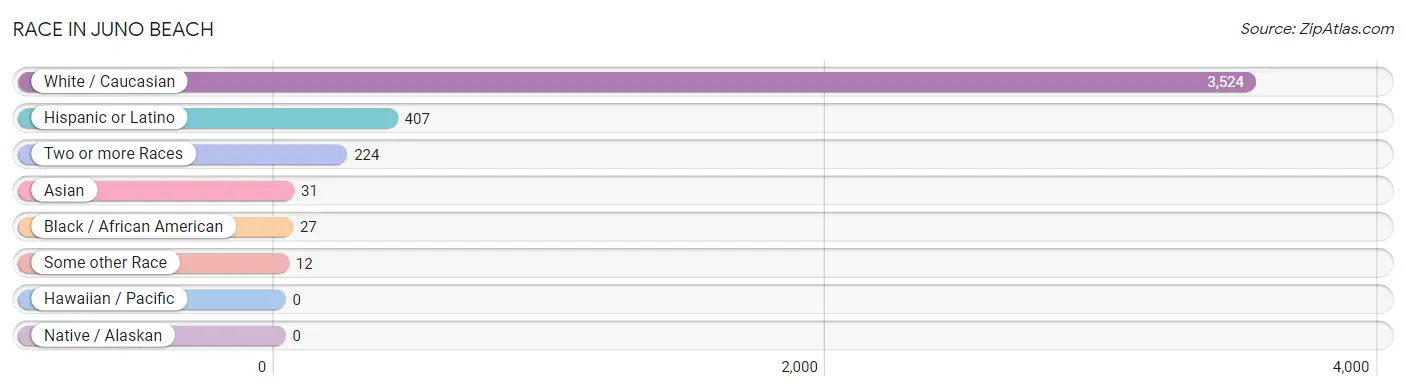
| Race | # Population | % Population |
| Asian | 31 | 0.8% |
| Black / African American | 27 | 0.7% |
| Hawaiian / Pacific | 0 | 0.0% |
| Hispanic or Latino | 407 | 10.7% |
| Native / Alaskan | 0 | 0.0% |
| White / Caucasian | 3,524 | 92.3% |
| Two or more Races | 224 | 5.9% |
| Some other Race | 12 | 0.3% |
| Total | 3,818 | 100.0% |
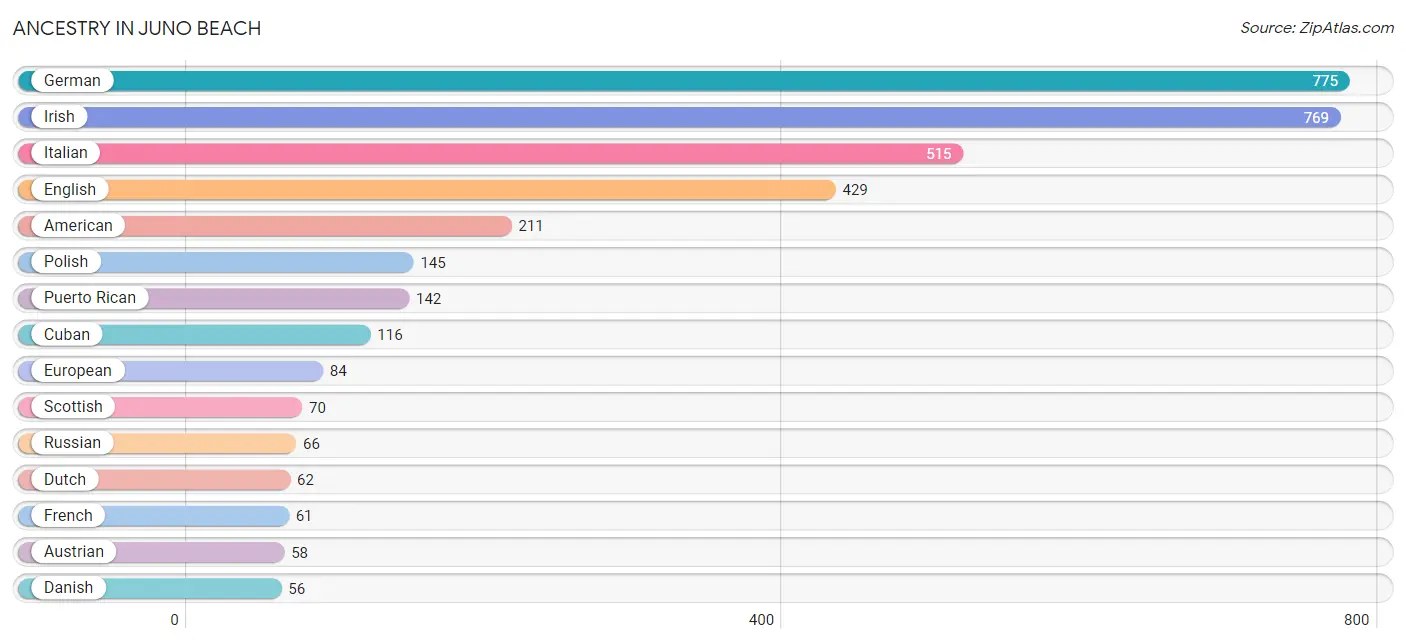
Ancestry in Juno Beach
The most populous ancestries reported in Juno Beach are German (775 | 20.3%), Irish (769 | 20.1%), Italian (515 | 13.5%), English (429 | 11.2%), and American (211 | 5.5%), together accounting for 70.7% of all Juno Beach residents.
| Ancestry | # Population | % Population |
| African | 26 | 0.7% |
| American | 211 | 5.5% |
| Arab | 43 | 1.1% |
| Austrian | 58 | 1.5% |
| British | 29 | 0.8% |
| Canadian | 13 | 0.3% |
| Central American | 27 | 0.7% |
| Colombian | 26 | 0.7% |
| Cree | 13 | 0.3% |
| Cuban | 116 | 3.0% |
| Danish | 56 | 1.5% |
| Dominican | 43 | 1.1% |
| Dutch | 62 | 1.6% |
| Eastern European | 54 | 1.4% |
| Egyptian | 10 | 0.3% |
| English | 429 | 11.2% |
| European | 84 | 2.2% |
| Finnish | 13 | 0.3% |
| French | 61 | 1.6% |
| French Canadian | 25 | 0.6% |
| German | 775 | 20.3% |
| Greek | 13 | 0.3% |
| Guatemalan | 14 | 0.4% |
| Haitian | 13 | 0.3% |
| Hungarian | 25 | 0.6% |
| Irish | 769 | 20.1% |
| Italian | 515 | 13.5% |
| Korean | 26 | 0.7% |
| Lebanese | 19 | 0.5% |
| Lithuanian | 37 | 1.0% |
| Mexican | 41 | 1.1% |
| Nicaraguan | 13 | 0.3% |
| Norwegian | 28 | 0.7% |
| Polish | 145 | 3.8% |
| Portuguese | 35 | 0.9% |
| Puerto Rican | 142 | 3.7% |
| Russian | 66 | 1.7% |
| Scotch-Irish | 12 | 0.3% |
| Scottish | 70 | 1.8% |
| South American | 26 | 0.7% |
| Spaniard | 11 | 0.3% |
| Subsaharan African | 26 | 0.7% |
| Swedish | 17 | 0.4% |
| Swiss | 12 | 0.3% |
| Syrian | 25 | 0.6% |
| Thai | 5 | 0.1% |
| Ukrainian | 19 | 0.5% |
| Welsh | 14 | 0.4% | View All 48 Rows |
Immigrants in Juno Beach
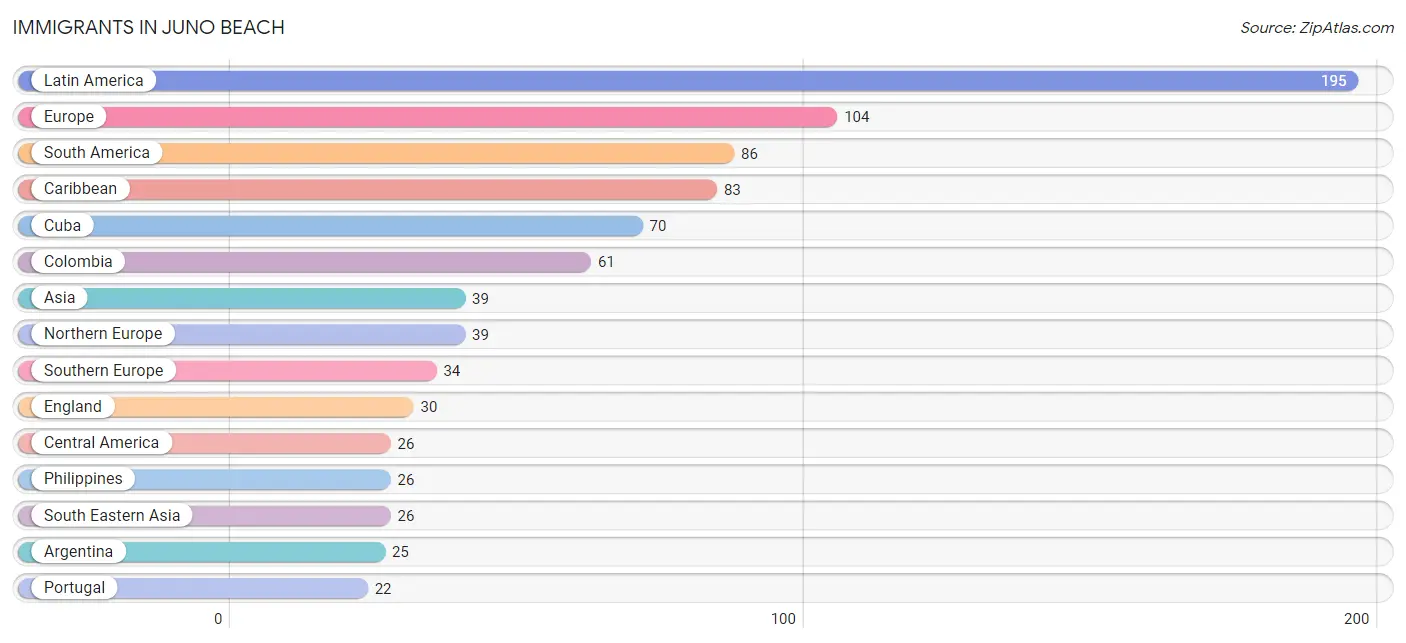
The most numerous immigrant groups reported in Juno Beach came from Latin America (195 | 5.1%), Europe (104 | 2.7%), South America (86 | 2.2%), Caribbean (83 | 2.2%), and Cuba (70 | 1.8%), together accounting for 14.1% of all Juno Beach residents.
| Immigration Origin | # Population | % Population |
| Africa | 10 | 0.3% |
| Argentina | 25 | 0.6% |
| Asia | 39 | 1.0% |
| Canada | 14 | 0.4% |
| Caribbean | 83 | 2.2% |
| Central America | 26 | 0.7% |
| Colombia | 61 | 1.6% |
| Cuba | 70 | 1.8% |
| Czechoslovakia | 12 | 0.3% |
| Dominican Republic | 13 | 0.3% |
| Eastern Europe | 19 | 0.5% |
| Egypt | 10 | 0.3% |
| England | 30 | 0.8% |
| Europe | 104 | 2.7% |
| Guatemala | 14 | 0.4% |
| India | 5 | 0.1% |
| Italy | 12 | 0.3% |
| Latin America | 195 | 5.1% |
| Lebanon | 8 | 0.2% |
| Mexico | 12 | 0.3% |
| Netherlands | 12 | 0.3% |
| Northern Africa | 10 | 0.3% |
| Northern Europe | 39 | 1.0% |
| Philippines | 26 | 0.7% |
| Portugal | 22 | 0.6% |
| Romania | 7 | 0.2% |
| South America | 86 | 2.2% |
| South Central Asia | 5 | 0.1% |
| South Eastern Asia | 26 | 0.7% |
| Southern Europe | 34 | 0.9% |
| Western Asia | 8 | 0.2% |
| Western Europe | 12 | 0.3% | View All 32 Rows |
Sex and Age in Juno Beach
Sex and Age in Juno Beach
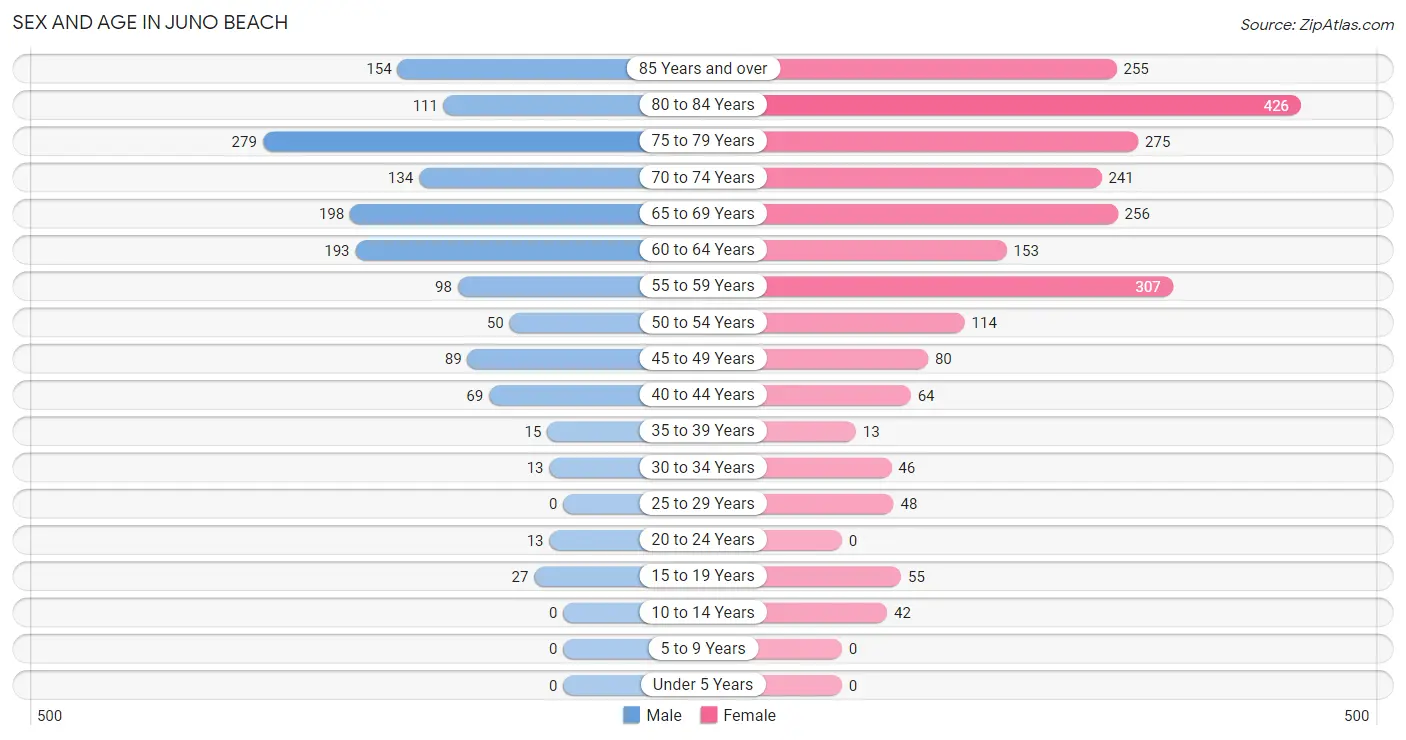
The most populous age groups in Juno Beach are 75 to 79 Years (279 | 19.3%) for men and 80 to 84 Years (426 | 17.9%) for women.
| Age Bracket | Male | Female |
| Under 5 Years | 0 (0.0%) | 0 (0.0%) |
| 5 to 9 Years | 0 (0.0%) | 0 (0.0%) |
| 10 to 14 Years | 0 (0.0%) | 42 (1.8%) |
| 15 to 19 Years | 27 (1.9%) | 55 (2.3%) |
| 20 to 24 Years | 13 (0.9%) | 0 (0.0%) |
| 25 to 29 Years | 0 (0.0%) | 48 (2.0%) |
| 30 to 34 Years | 13 (0.9%) | 46 (1.9%) |
| 35 to 39 Years | 15 (1.0%) | 13 (0.5%) |
| 40 to 44 Years | 69 (4.8%) | 64 (2.7%) |
| 45 to 49 Years | 89 (6.2%) | 80 (3.4%) |
| 50 to 54 Years | 50 (3.5%) | 114 (4.8%) |
| 55 to 59 Years | 98 (6.8%) | 307 (12.9%) |
| 60 to 64 Years | 193 (13.4%) | 153 (6.4%) |
| 65 to 69 Years | 198 (13.7%) | 256 (10.8%) |
| 70 to 74 Years | 134 (9.3%) | 241 (10.2%) |
| 75 to 79 Years | 279 (19.3%) | 275 (11.6%) |
| 80 to 84 Years | 111 (7.7%) | 426 (17.9%) |
| 85 Years and over | 154 (10.7%) | 255 (10.7%) |
| Total | 1,443 (100.0%) | 2,375 (100.0%) |
Families and Households in Juno Beach
Median Family Size in Juno Beach
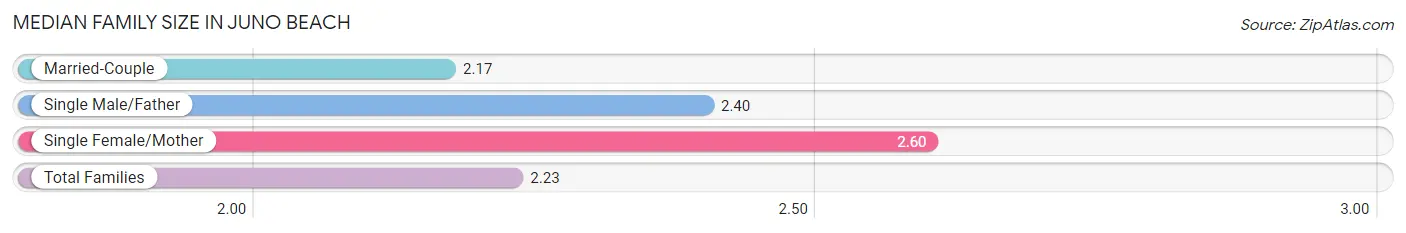
The median family size in Juno Beach is 2.23 persons per family, with single female/mother families (124 | 12.0%) accounting for the largest median family size of 2.6 persons per family. On the other hand, married-couple families (863 | 83.8%) represent the smallest median family size with 2.17 persons per family.
| Family Type | # Families | Family Size |
| Married-Couple | 863 (83.8%) | 2.17 |
| Single Male/Father | 43 (4.2%) | 2.40 |
| Single Female/Mother | 124 (12.0%) | 2.60 |
| Total Families | 1,030 (100.0%) | 2.23 |
Median Household Size in Juno Beach
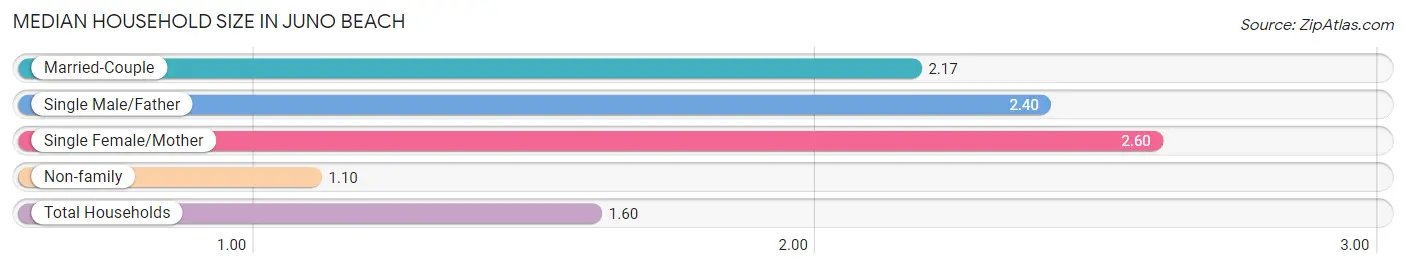
The median household size in Juno Beach is 1.60 persons per household, with single female/mother households (124 | 5.3%) accounting for the largest median household size of 2.6 persons per household. non-family households (1,302 | 55.8%) represent the smallest median household size with 1.10 persons per household.
| Household Type | # Households | Household Size |
| Married-Couple | 863 (37.0%) | 2.17 |
| Single Male/Father | 43 (1.8%) | 2.40 |
| Single Female/Mother | 124 (5.3%) | 2.60 |
| Non-family | 1,302 (55.8%) | 1.10 |
| Total Households | 2,332 (100.0%) | 1.60 |
Household Size by Marriage Status in Juno Beach
Out of a total of 2,332 households in Juno Beach, 1,030 (44.2%) are family households, while 1,302 (55.8%) are nonfamily households. The most numerous type of family households are 2-person households, comprising 895, and the most common type of nonfamily households are 1-person households, comprising 1,169.
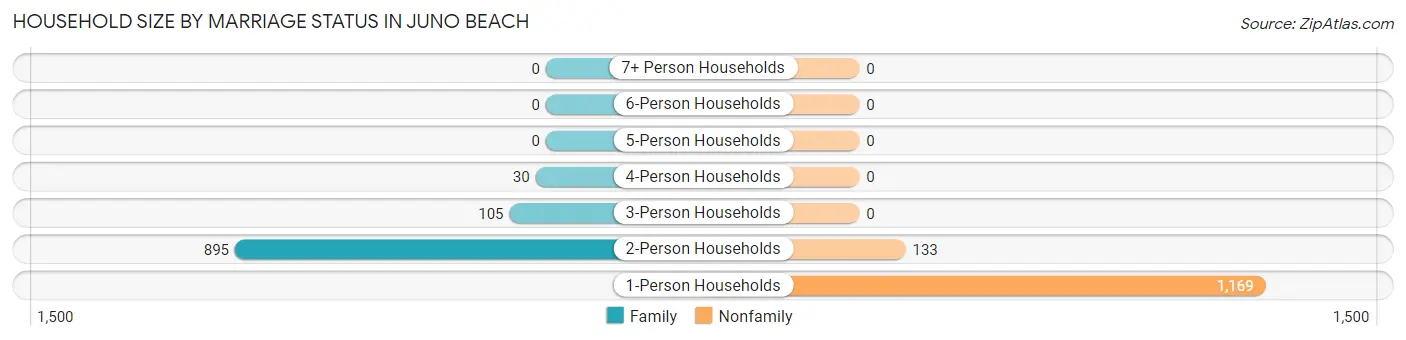
| Household Size | Family Households | Nonfamily Households |
| 1-Person Households | - | 1,169 (50.1%) |
| 2-Person Households | 895 (38.4%) | 133 (5.7%) |
| 3-Person Households | 105 (4.5%) | 0 (0.0%) |
| 4-Person Households | 30 (1.3%) | 0 (0.0%) |
| 5-Person Households | 0 (0.0%) | 0 (0.0%) |
| 6-Person Households | 0 (0.0%) | 0 (0.0%) |
| 7+ Person Households | 0 (0.0%) | 0 (0.0%) |
| Total | 1,030 (44.2%) | 1,302 (55.8%) |
Female Fertility in Juno Beach
Fertility by Age in Juno Beach
| Age Bracket | Women with Births | Births / 1,000 Women |
| 15 to 19 years | 0 (0.0%) | 0.0 |
| 20 to 34 years | 0 (0.0%) | 0.0 |
| 35 to 50 years | 0 (0.0%) | 0.0 |
| Total | 0 (0.0%) | 0.0 |
Fertility by Age by Marriage Status in Juno Beach
| Age Bracket | Married | Unmarried |
| 15 to 19 years | 0 (0.0%) | 0 (0.0%) |
| 20 to 34 years | 0 (0.0%) | 0 (0.0%) |
| 35 to 50 years | 0 (0.0%) | 0 (0.0%) |
| Total | 0 (0.0%) | 0 (0.0%) |
Fertility by Education in Juno Beach
| Educational Attainment | Women with Births | Births / 1,000 Women |
| Less than High School | 0 (0.0%) | 0.0 |
| High School Diploma | 0 (0.0%) | 0.0 |
| College or Associate's Degree | 0 (0.0%) | 0.0 |
| Bachelor's Degree | 0 (0.0%) | 0.0 |
| Graduate Degree | 0 (0.0%) | 0.0 |
| Total | 0 (0.0%) | 0.0 |
Fertility by Education by Marriage Status in Juno Beach
| Educational Attainment | Married | Unmarried |
| Less than High School | 0 (0.0%) | 0 (0.0%) |
| High School Diploma | 0 (0.0%) | 0 (0.0%) |
| College or Associate's Degree | 0 (0.0%) | 0 (0.0%) |
| Bachelor's Degree | 0 (0.0%) | 0 (0.0%) |
| Graduate Degree | 0 (0.0%) | 0 (0.0%) |
| Total | 0 (0.0%) | 0 (0.0%) |
Employment Characteristics in Juno Beach
Employment by Class of Employer in Juno Beach
Among the 1,260 employed individuals in Juno Beach, private company employees (782 | 62.1%), self-employed (not incorporated) (142 | 11.3%), and self-employed (incorporated) (121 | 9.6%) make up the most common classes of employment.
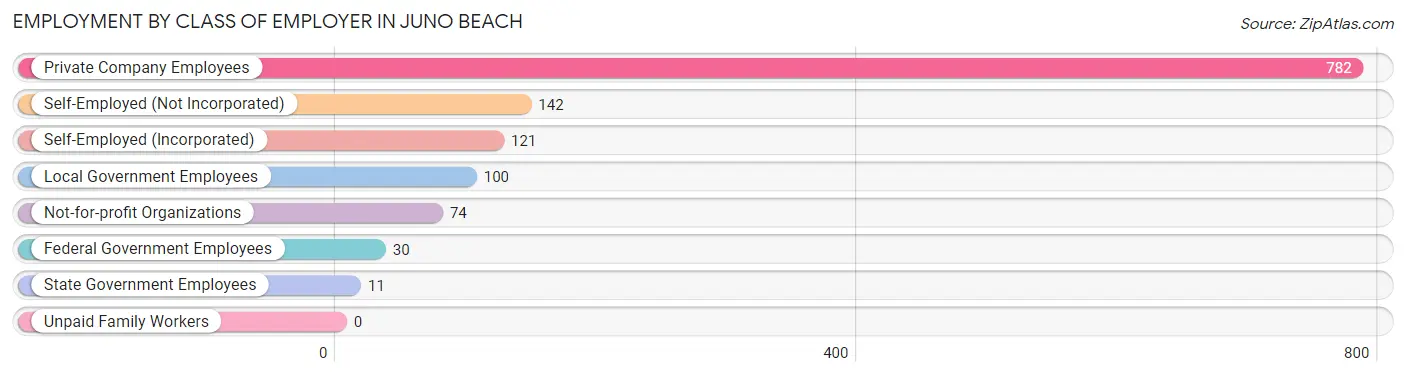
| Employer Class | # Employees | % Employees |
| Private Company Employees | 782 | 62.1% |
| Self-Employed (Incorporated) | 121 | 9.6% |
| Self-Employed (Not Incorporated) | 142 | 11.3% |
| Not-for-profit Organizations | 74 | 5.9% |
| Local Government Employees | 100 | 7.9% |
| State Government Employees | 11 | 0.9% |
| Federal Government Employees | 30 | 2.4% |
| Unpaid Family Workers | 0 | 0.0% |
| Total | 1,260 | 100.0% |
Employment Status by Age in Juno Beach
According to the labor force statistics for Juno Beach, out of the total population over 16 years of age (3,776), 37.4% or 1,412 individuals are in the labor force, with 8.8% or 124 of them unemployed. The age group with the highest labor force participation rate is 25 to 29 years, with 100.0% or 48 individuals in the labor force. Within the labor force, the 25 to 29 years age range has the highest percentage of unemployed individuals, with 66.7% or 32 of them being unemployed.
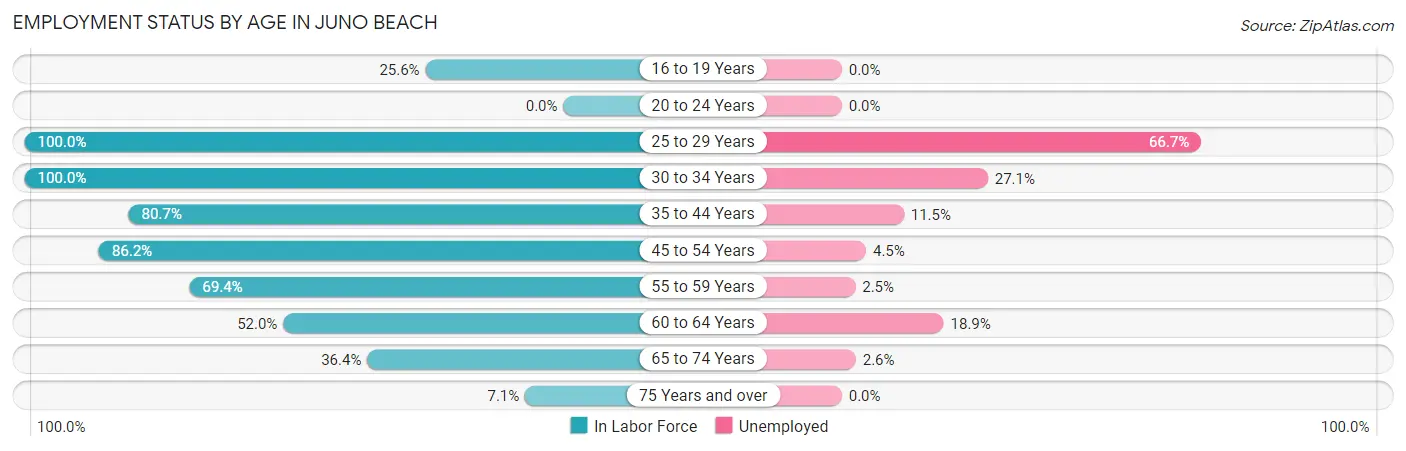
| Age Bracket | In Labor Force | Unemployed |
| 16 to 19 Years | 21 (25.6%) | 0 (0.0%) |
| 20 to 24 Years | 0 (0.0%) | 0 (0.0%) |
| 25 to 29 Years | 48 (100.0%) | 32 (66.7%) |
| 30 to 34 Years | 59 (100.0%) | 16 (27.1%) |
| 35 to 44 Years | 130 (80.7%) | 15 (11.5%) |
| 45 to 54 Years | 287 (86.2%) | 13 (4.5%) |
| 55 to 59 Years | 281 (69.4%) | 7 (2.5%) |
| 60 to 64 Years | 180 (52.0%) | 34 (18.9%) |
| 65 to 74 Years | 302 (36.4%) | 8 (2.6%) |
| 75 Years and over | 106 (7.1%) | 0 (0.0%) |
| Total | 1,412 (37.4%) | 124 (8.8%) |
Employment Status by Educational Attainment in Juno Beach
According to labor force statistics for Juno Beach, 72.9% of individuals (986) out of the total population between 25 and 64 years of age (1,352) are in the labor force, with 11.9% or 117 of them being unemployed. The group with the highest labor force participation rate are those with the educational attainment of high school diploma, with 78.8% or 175 individuals in the labor force. Within the labor force, individuals with college / associate degree education have the highest percentage of unemployment, with 30.3% or 61 of them being unemployed.
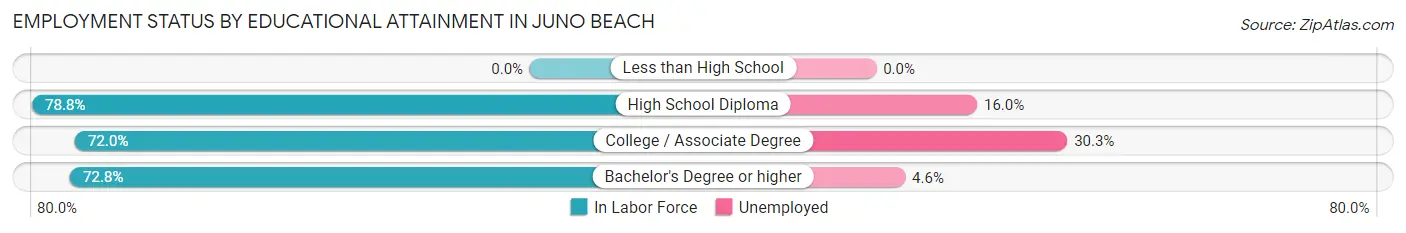
| Educational Attainment | In Labor Force | Unemployed |
| Less than High School | 0 (0.0%) | 0 (0.0%) |
| High School Diploma | 175 (78.8%) | 36 (16.0%) |
| College / Associate Degree | 201 (72.0%) | 85 (30.3%) |
| Bachelor's Degree or higher | 609 (72.8%) | 38 (4.6%) |
| Total | 986 (72.9%) | 161 (11.9%) |
Employment Occupations by Sex in Juno Beach
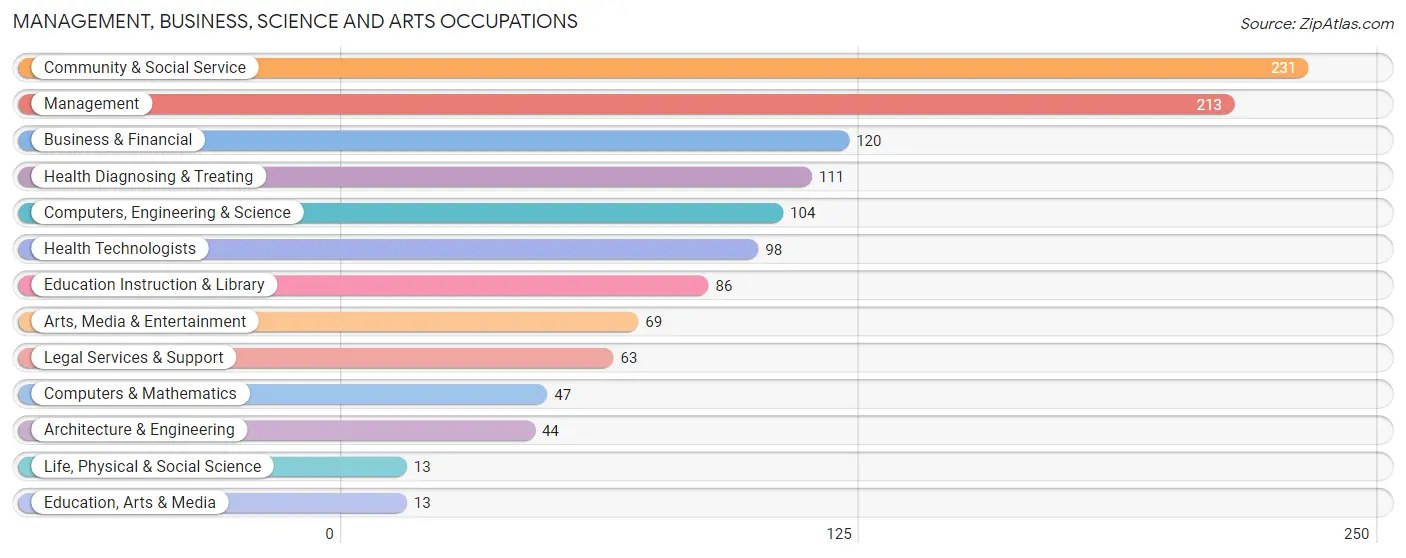
Management, Business, Science and Arts Occupations
The most common Management, Business, Science and Arts occupations in Juno Beach are Community & Social Service (231 | 17.9%), Management (213 | 16.5%), Business & Financial (120 | 9.3%), Health Diagnosing & Treating (111 | 8.6%), and Computers, Engineering & Science (104 | 8.1%).
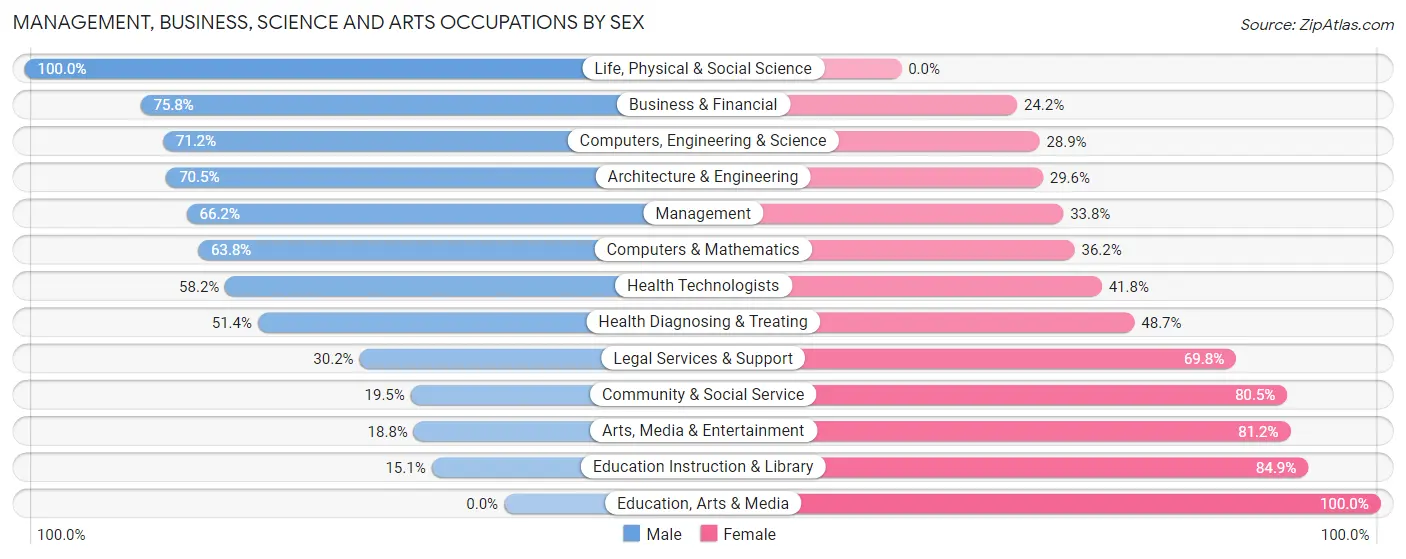
Management, Business, Science and Arts Occupations by Sex
Within the Management, Business, Science and Arts occupations in Juno Beach, the most male-oriented occupations are Life, Physical & Social Science (100.0%), Business & Financial (75.8%), and Computers, Engineering & Science (71.2%), while the most female-oriented occupations are Education, Arts & Media (100.0%), Education Instruction & Library (84.9%), and Arts, Media & Entertainment (81.2%).
| Occupation | Male | Female |
| Management | 141 (66.2%) | 72 (33.8%) |
| Business & Financial | 91 (75.8%) | 29 (24.2%) |
| Computers, Engineering & Science | 74 (71.2%) | 30 (28.8%) |
| Computers & Mathematics | 30 (63.8%) | 17 (36.2%) |
| Architecture & Engineering | 31 (70.5%) | 13 (29.5%) |
| Life, Physical & Social Science | 13 (100.0%) | 0 (0.0%) |
| Community & Social Service | 45 (19.5%) | 186 (80.5%) |
| Education, Arts & Media | 0 (0.0%) | 13 (100.0%) |
| Legal Services & Support | 19 (30.2%) | 44 (69.8%) |
| Education Instruction & Library | 13 (15.1%) | 73 (84.9%) |
| Arts, Media & Entertainment | 13 (18.8%) | 56 (81.2%) |
| Health Diagnosing & Treating | 57 (51.3%) | 54 (48.6%) |
| Health Technologists | 57 (58.2%) | 41 (41.8%) |
| Total (Category) | 408 (52.4%) | 371 (47.6%) |
| Total (Overall) | 551 (42.7%) | 738 (57.3%) |
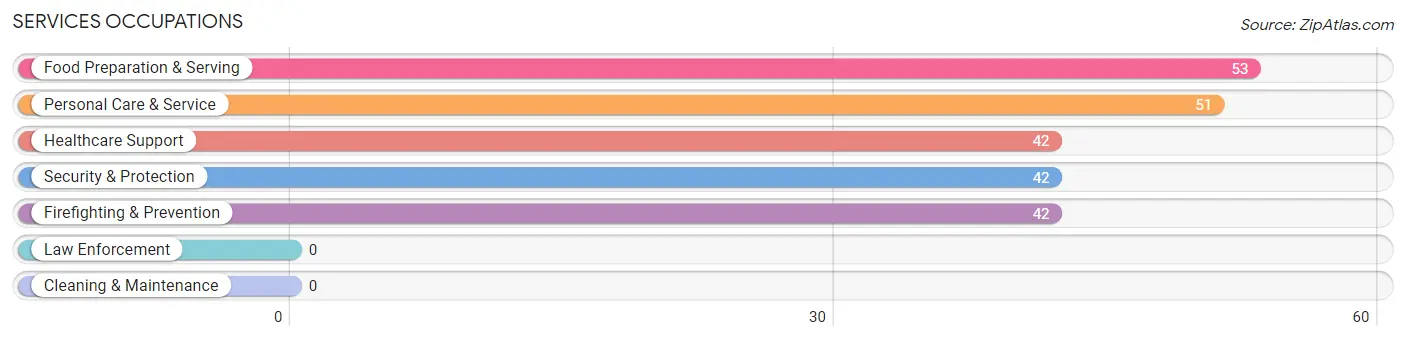
Services Occupations
The most common Services occupations in Juno Beach are Food Preparation & Serving (53 | 4.1%), Personal Care & Service (51 | 4.0%), Healthcare Support (42 | 3.3%), Security & Protection (42 | 3.3%), and Firefighting & Prevention (42 | 3.3%).
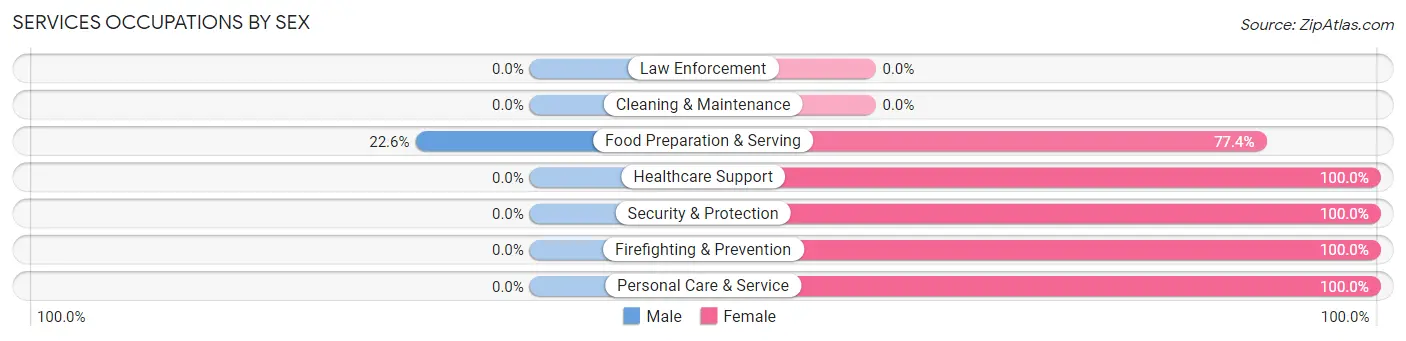
Services Occupations by Sex
| Occupation | Male | Female |
| Healthcare Support | 0 (0.0%) | 42 (100.0%) |
| Security & Protection | 0 (0.0%) | 42 (100.0%) |
| Firefighting & Prevention | 0 (0.0%) | 42 (100.0%) |
| Law Enforcement | 0 (0.0%) | 0 (0.0%) |
| Food Preparation & Serving | 12 (22.6%) | 41 (77.4%) |
| Cleaning & Maintenance | 0 (0.0%) | 0 (0.0%) |
| Personal Care & Service | 0 (0.0%) | 51 (100.0%) |
| Total (Category) | 12 (6.4%) | 176 (93.6%) |
| Total (Overall) | 551 (42.7%) | 738 (57.3%) |
Sales and Office Occupations
The most common Sales and Office occupations in Juno Beach are Sales & Related (147 | 11.4%), and Office & Administration (82 | 6.4%).
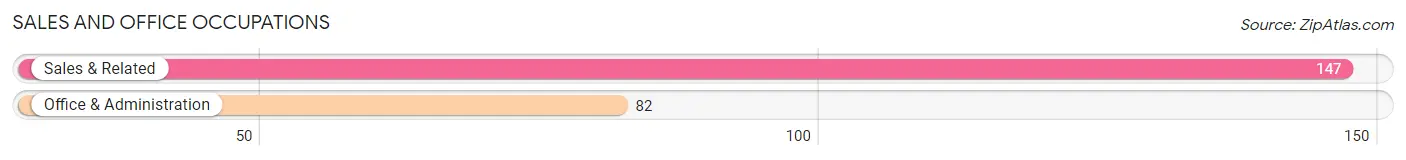
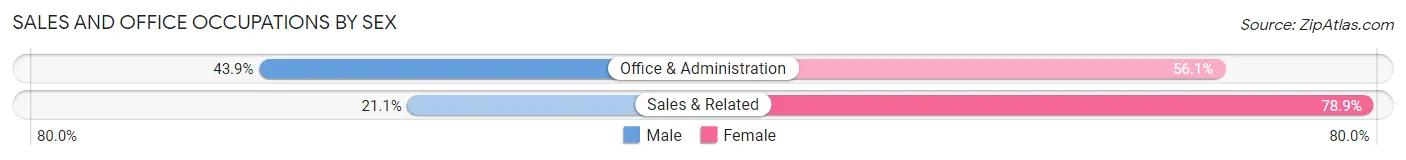
Sales and Office Occupations by Sex
| Occupation | Male | Female |
| Sales & Related | 31 (21.1%) | 116 (78.9%) |
| Office & Administration | 36 (43.9%) | 46 (56.1%) |
| Total (Category) | 67 (29.3%) | 162 (70.7%) |
| Total (Overall) | 551 (42.7%) | 738 (57.3%) |
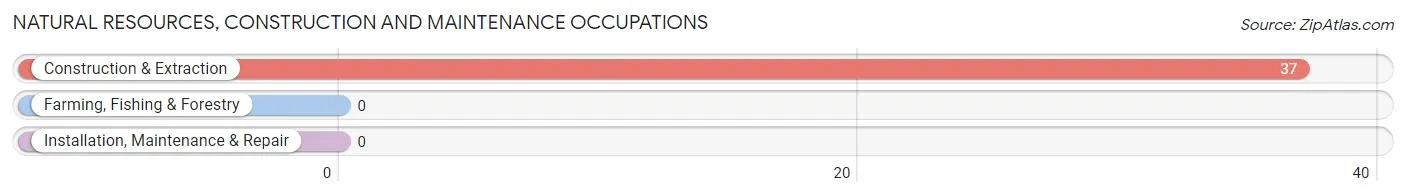
Natural Resources, Construction and Maintenance Occupations
The most common Natural Resources, Construction and Maintenance occupations in Juno Beach are , and Construction & Extraction (37 | 2.9%).
Natural Resources, Construction and Maintenance Occupations by Sex
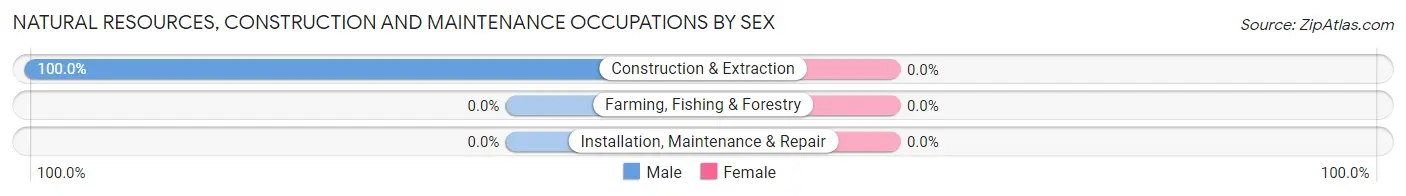
| Occupation | Male | Female |
| Farming, Fishing & Forestry | 0 (0.0%) | 0 (0.0%) |
| Construction & Extraction | 37 (100.0%) | 0 (0.0%) |
| Installation, Maintenance & Repair | 0 (0.0%) | 0 (0.0%) |
| Total (Category) | 37 (100.0%) | 0 (0.0%) |
| Total (Overall) | 551 (42.7%) | 738 (57.3%) |
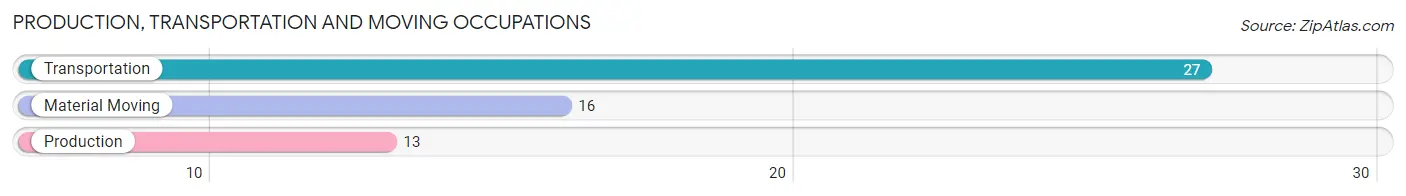
Production, Transportation and Moving Occupations
The most common Production, Transportation and Moving occupations in Juno Beach are Transportation (27 | 2.1%), Material Moving (16 | 1.2%), and Production (13 | 1.0%).
Production, Transportation and Moving Occupations by Sex
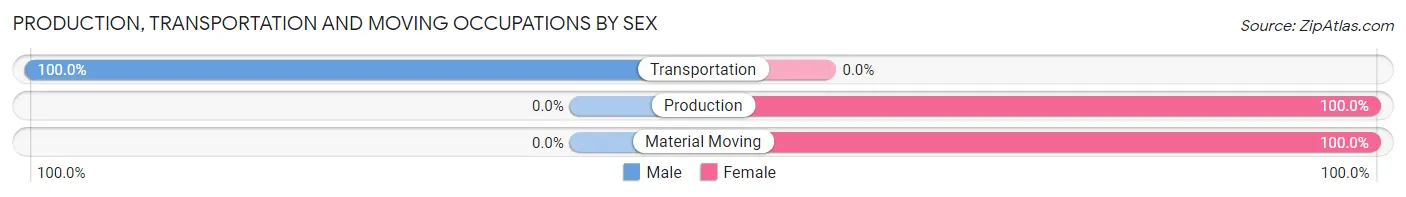
| Occupation | Male | Female |
| Production | 0 (0.0%) | 13 (100.0%) |
| Transportation | 27 (100.0%) | 0 (0.0%) |
| Material Moving | 0 (0.0%) | 16 (100.0%) |
| Total (Category) | 27 (48.2%) | 29 (51.8%) |
| Total (Overall) | 551 (42.7%) | 738 (57.3%) |
Employment Industries by Sex in Juno Beach
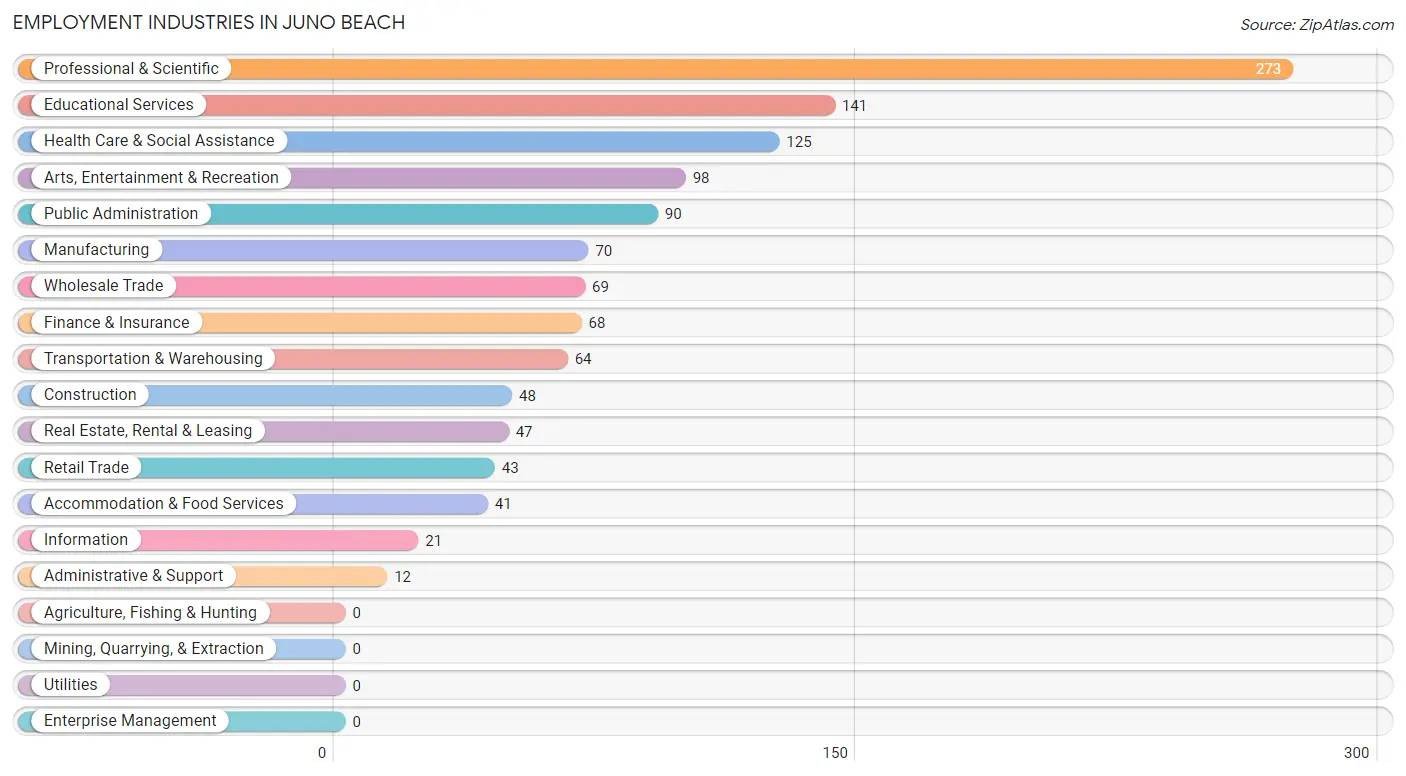
Employment Industries in Juno Beach
The major employment industries in Juno Beach include Professional & Scientific (273 | 21.2%), Educational Services (141 | 10.9%), Health Care & Social Assistance (125 | 9.7%), Arts, Entertainment & Recreation (98 | 7.6%), and Public Administration (90 | 7.0%).
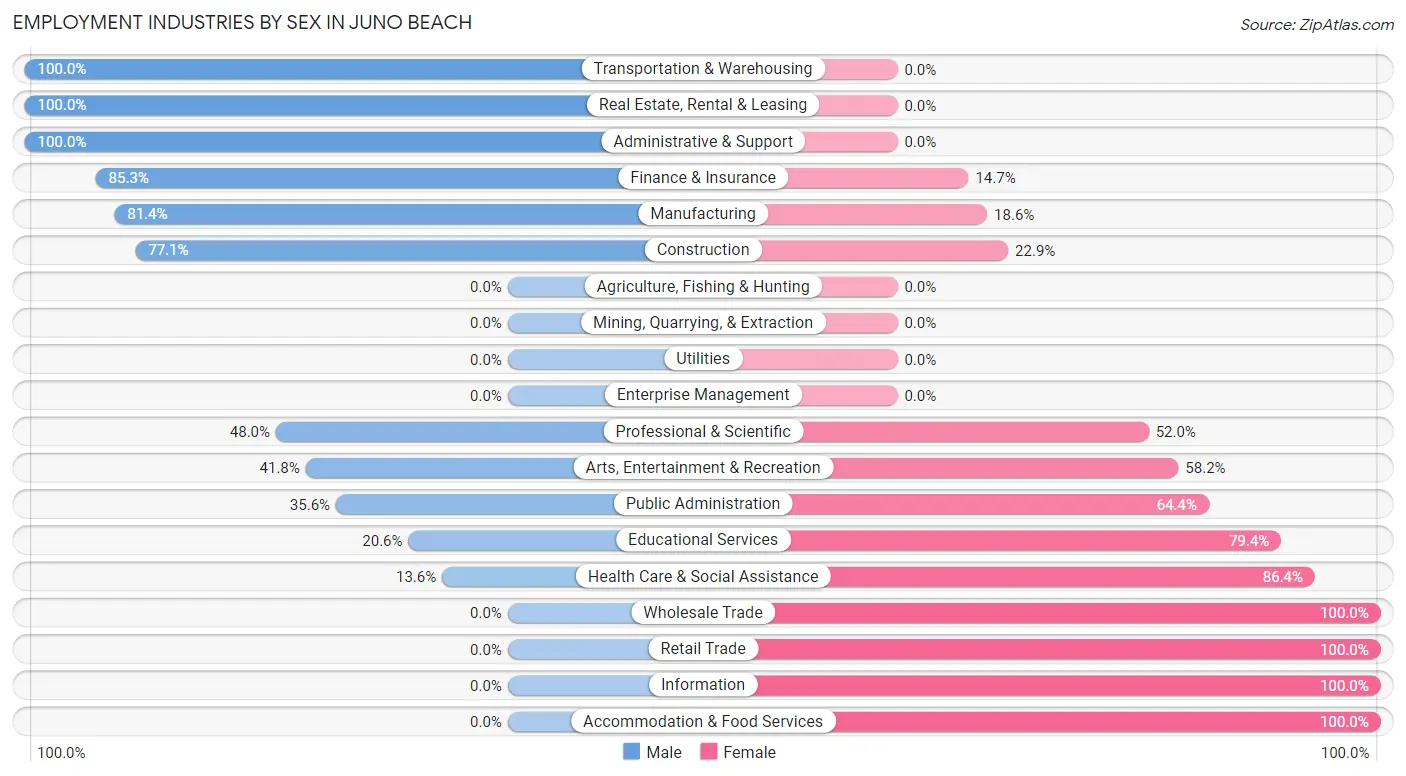
Employment Industries by Sex in Juno Beach
The Juno Beach industries that see more men than women are Transportation & Warehousing (100.0%), Real Estate, Rental & Leasing (100.0%), and Administrative & Support (100.0%), whereas the industries that tend to have a higher number of women are Wholesale Trade (100.0%), Retail Trade (100.0%), and Information (100.0%).
| Industry | Male | Female |
| Agriculture, Fishing & Hunting | 0 (0.0%) | 0 (0.0%) |
| Mining, Quarrying, & Extraction | 0 (0.0%) | 0 (0.0%) |
| Construction | 37 (77.1%) | 11 (22.9%) |
| Manufacturing | 57 (81.4%) | 13 (18.6%) |
| Wholesale Trade | 0 (0.0%) | 69 (100.0%) |
| Retail Trade | 0 (0.0%) | 43 (100.0%) |
| Transportation & Warehousing | 64 (100.0%) | 0 (0.0%) |
| Utilities | 0 (0.0%) | 0 (0.0%) |
| Information | 0 (0.0%) | 21 (100.0%) |
| Finance & Insurance | 58 (85.3%) | 10 (14.7%) |
| Real Estate, Rental & Leasing | 47 (100.0%) | 0 (0.0%) |
| Professional & Scientific | 131 (48.0%) | 142 (52.0%) |
| Enterprise Management | 0 (0.0%) | 0 (0.0%) |
| Administrative & Support | 12 (100.0%) | 0 (0.0%) |
| Educational Services | 29 (20.6%) | 112 (79.4%) |
| Health Care & Social Assistance | 17 (13.6%) | 108 (86.4%) |
| Arts, Entertainment & Recreation | 41 (41.8%) | 57 (58.2%) |
| Accommodation & Food Services | 0 (0.0%) | 41 (100.0%) |
| Public Administration | 32 (35.6%) | 58 (64.4%) |
| Total | 551 (42.7%) | 738 (57.3%) |
Education in Juno Beach
School Enrollment in Juno Beach
The most common levels of schooling among the 204 students in Juno Beach are high school (66 | 32.4%), graduate / professional (55 | 27.0%), and middle school (42 | 20.6%).
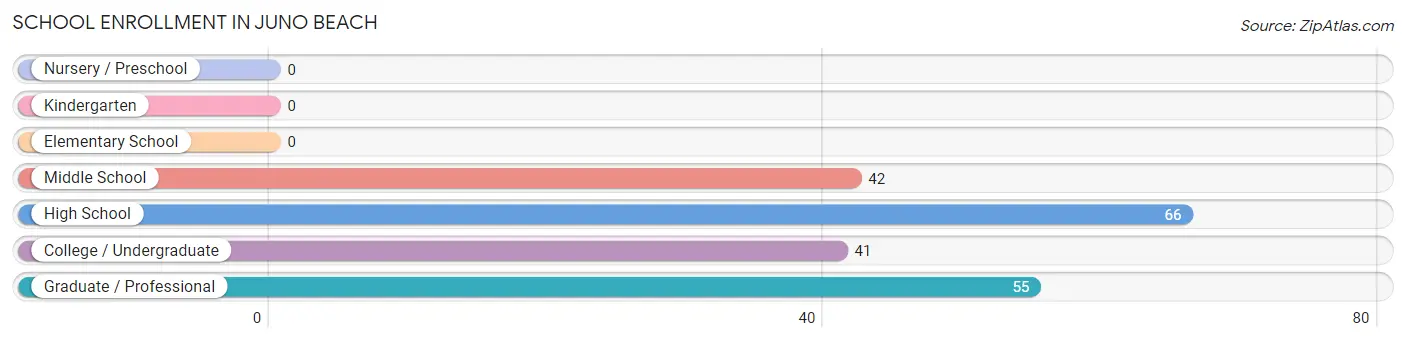
| School Level | # Students | % Students |
| Nursery / Preschool | 0 | 0.0% |
| Kindergarten | 0 | 0.0% |
| Elementary School | 0 | 0.0% |
| Middle School | 42 | 20.6% |
| High School | 66 | 32.4% |
| College / Undergraduate | 41 | 20.1% |
| Graduate / Professional | 55 | 27.0% |
| Total | 204 | 100.0% |
School Enrollment by Age by Funding Source in Juno Beach
Out of a total of 204 students who are enrolled in schools in Juno Beach, 76 (37.3%) attend a private institution, while the remaining 128 (62.7%) are enrolled in public schools. The age group of 35 years and over has the highest likelihood of being enrolled in private schools, with 47 (70.2% in the age bracket) enrolled. Conversely, the age group of 15 to 17 year olds has the lowest likelihood of being enrolled in a private school, with 32 (100.0% in the age bracket) attending a public institution.
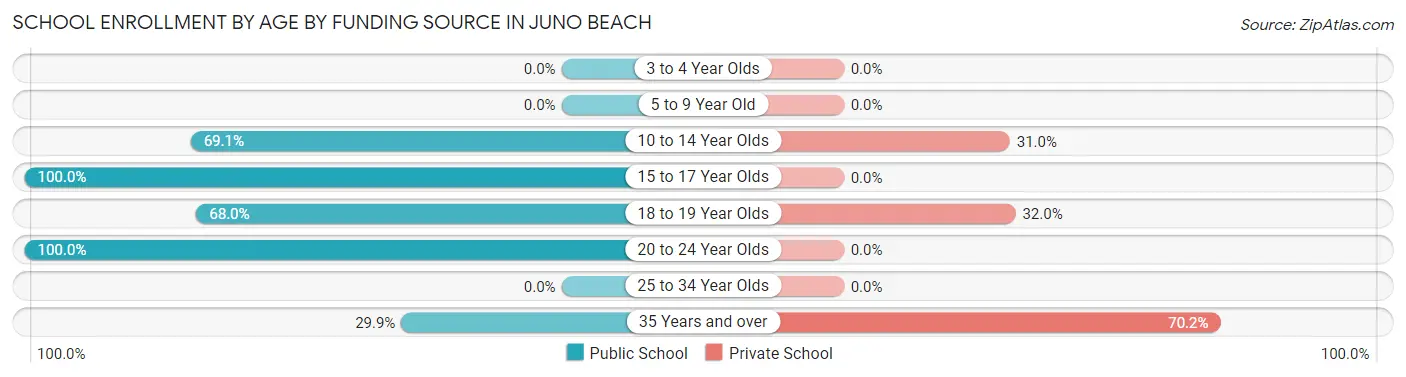
| Age Bracket | Public School | Private School |
| 3 to 4 Year Olds | 0 (0.0%) | 0 (0.0%) |
| 5 to 9 Year Old | 0 (0.0%) | 0 (0.0%) |
| 10 to 14 Year Olds | 29 (69.1%) | 13 (30.9%) |
| 15 to 17 Year Olds | 32 (100.0%) | 0 (0.0%) |
| 18 to 19 Year Olds | 34 (68.0%) | 16 (32.0%) |
| 20 to 24 Year Olds | 13 (100.0%) | 0 (0.0%) |
| 25 to 34 Year Olds | 0 (0.0%) | 0 (0.0%) |
| 35 Years and over | 20 (29.8%) | 47 (70.2%) |
| Total | 128 (62.7%) | 76 (37.3%) |
Educational Attainment by Field of Study in Juno Beach
Business (589 | 25.1%), social sciences (312 | 13.3%), education (257 | 10.9%), arts & humanities (215 | 9.1%), and engineering (183 | 7.8%) are the most common fields of study among 2,349 individuals in Juno Beach who have obtained a bachelor's degree or higher.
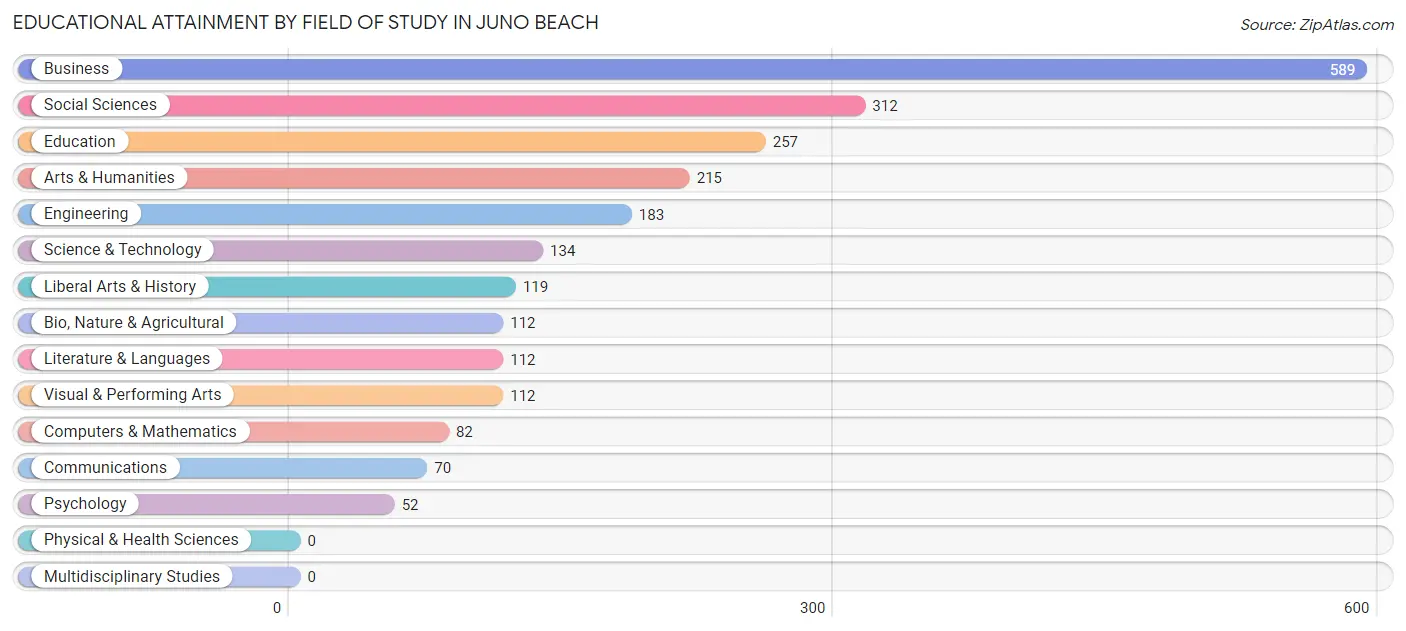
| Field of Study | # Graduates | % Graduates |
| Computers & Mathematics | 82 | 3.5% |
| Bio, Nature & Agricultural | 112 | 4.8% |
| Physical & Health Sciences | 0 | 0.0% |
| Psychology | 52 | 2.2% |
| Social Sciences | 312 | 13.3% |
| Engineering | 183 | 7.8% |
| Multidisciplinary Studies | 0 | 0.0% |
| Science & Technology | 134 | 5.7% |
| Business | 589 | 25.1% |
| Education | 257 | 10.9% |
| Literature & Languages | 112 | 4.8% |
| Liberal Arts & History | 119 | 5.1% |
| Visual & Performing Arts | 112 | 4.8% |
| Communications | 70 | 3.0% |
| Arts & Humanities | 215 | 9.1% |
| Total | 2,349 | 100.0% |
Transportation & Commute in Juno Beach
Vehicle Availability by Sex in Juno Beach
The most prevalent vehicle ownership categories in Juno Beach are males with 2 vehicles (267, accounting for 50.0%) and females with 2 vehicles (296, making up 37.0%).
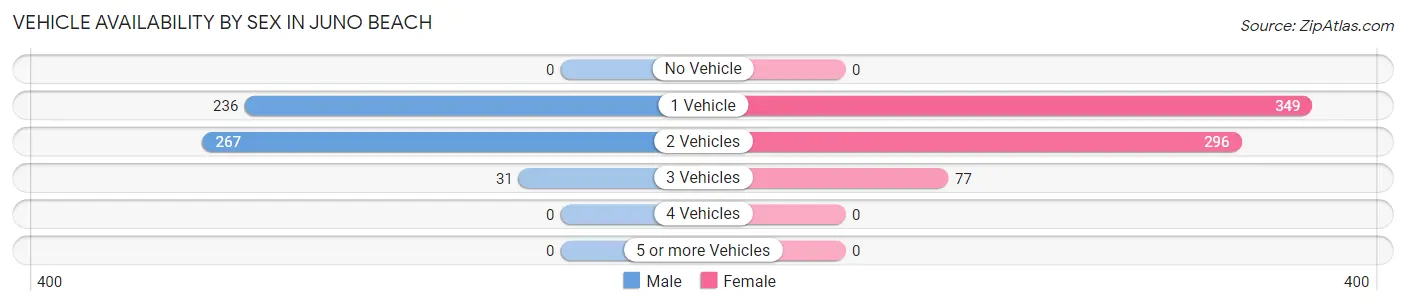
| Vehicles Available | Male | Female |
| No Vehicle | 0 (0.0%) | 0 (0.0%) |
| 1 Vehicle | 236 (44.2%) | 349 (48.3%) |
| 2 Vehicles | 267 (50.0%) | 296 (41.0%) |
| 3 Vehicles | 31 (5.8%) | 77 (10.7%) |
| 4 Vehicles | 0 (0.0%) | 0 (0.0%) |
| 5 or more Vehicles | 0 (0.0%) | 0 (0.0%) |
| Total | 534 (100.0%) | 722 (100.0%) |
Commute Time in Juno Beach
The most frequently occuring commute durations in Juno Beach are 10 to 14 minutes (233 commuters, 30.0%), 30 to 34 minutes (165 commuters, 21.3%), and 5 to 9 minutes (133 commuters, 17.1%).
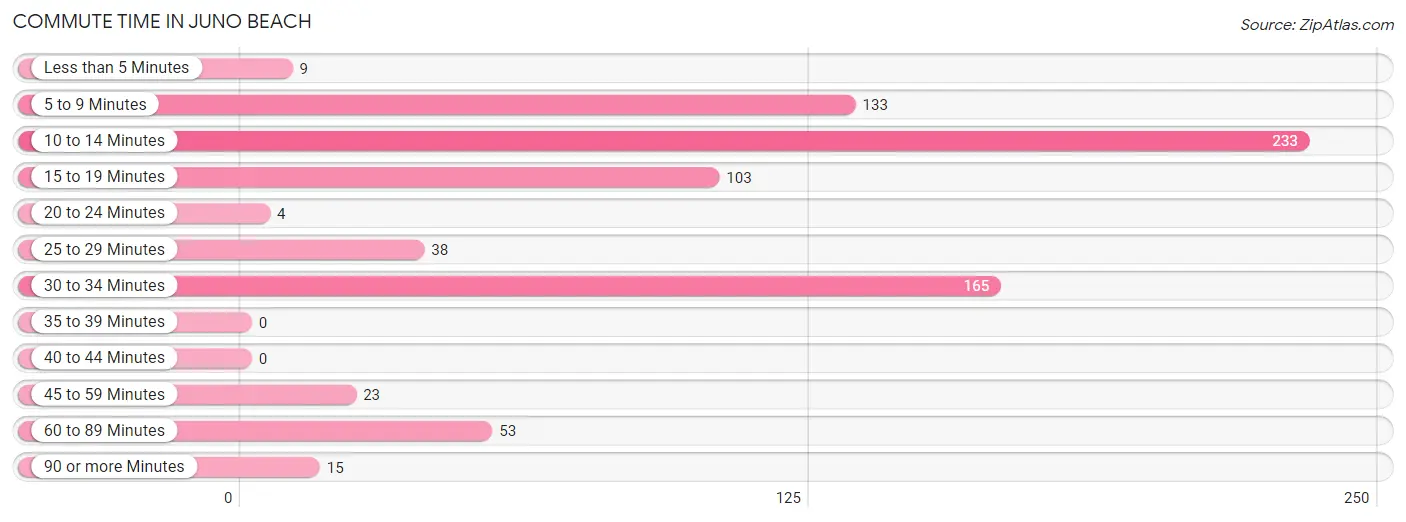
| Commute Time | # Commuters | % Commuters |
| Less than 5 Minutes | 9 | 1.2% |
| 5 to 9 Minutes | 133 | 17.1% |
| 10 to 14 Minutes | 233 | 30.0% |
| 15 to 19 Minutes | 103 | 13.3% |
| 20 to 24 Minutes | 4 | 0.5% |
| 25 to 29 Minutes | 38 | 4.9% |
| 30 to 34 Minutes | 165 | 21.3% |
| 35 to 39 Minutes | 0 | 0.0% |
| 40 to 44 Minutes | 0 | 0.0% |
| 45 to 59 Minutes | 23 | 3.0% |
| 60 to 89 Minutes | 53 | 6.8% |
| 90 or more Minutes | 15 | 1.9% |
Commute Time by Sex in Juno Beach
The most common commute times in Juno Beach are 10 to 14 minutes (118 commuters, 37.0%) for males and 10 to 14 minutes (115 commuters, 25.2%) for females.
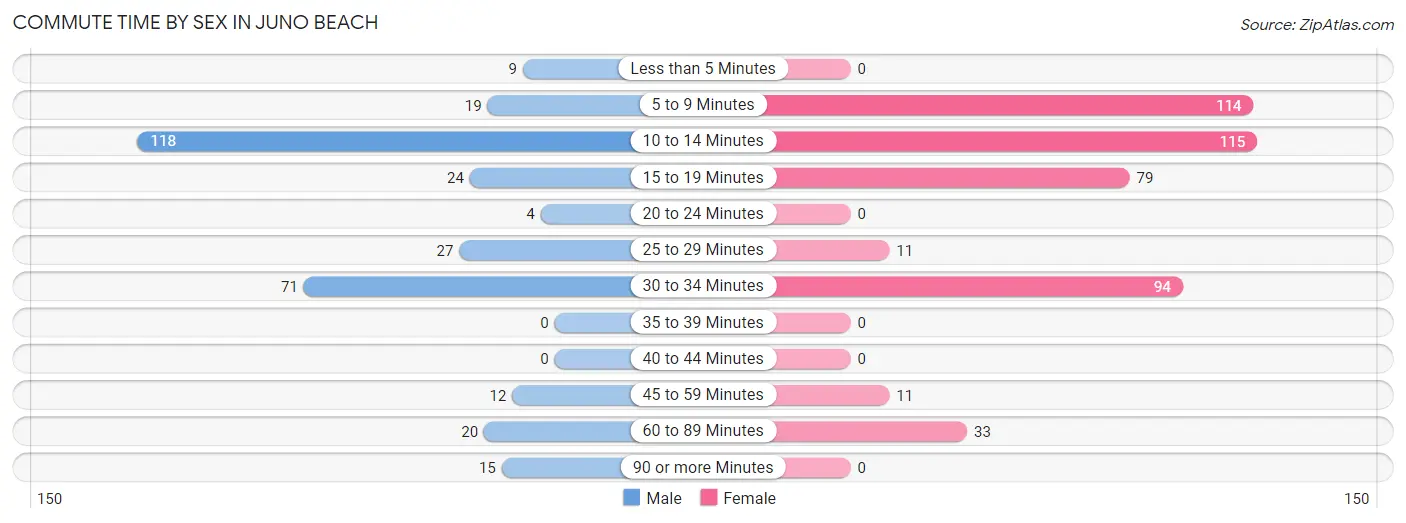
| Commute Time | Male | Female |
| Less than 5 Minutes | 9 (2.8%) | 0 (0.0%) |
| 5 to 9 Minutes | 19 (6.0%) | 114 (24.9%) |
| 10 to 14 Minutes | 118 (37.0%) | 115 (25.2%) |
| 15 to 19 Minutes | 24 (7.5%) | 79 (17.3%) |
| 20 to 24 Minutes | 4 (1.3%) | 0 (0.0%) |
| 25 to 29 Minutes | 27 (8.5%) | 11 (2.4%) |
| 30 to 34 Minutes | 71 (22.3%) | 94 (20.6%) |
| 35 to 39 Minutes | 0 (0.0%) | 0 (0.0%) |
| 40 to 44 Minutes | 0 (0.0%) | 0 (0.0%) |
| 45 to 59 Minutes | 12 (3.8%) | 11 (2.4%) |
| 60 to 89 Minutes | 20 (6.3%) | 33 (7.2%) |
| 90 or more Minutes | 15 (4.7%) | 0 (0.0%) |
Time of Departure to Work by Sex in Juno Beach
The most frequent times of departure to work in Juno Beach are 6:30 AM to 6:59 AM (63, 19.8%) for males and 8:00 AM to 8:29 AM (93, 20.3%) for females.
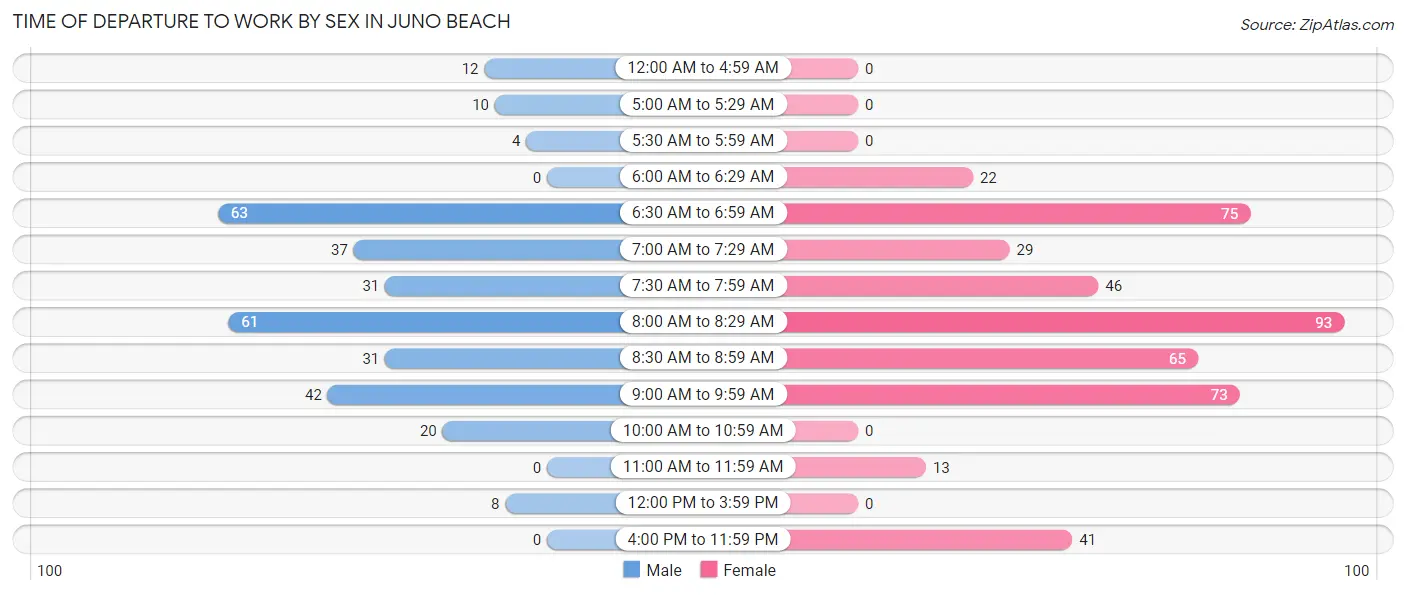
| Time of Departure | Male | Female |
| 12:00 AM to 4:59 AM | 12 (3.8%) | 0 (0.0%) |
| 5:00 AM to 5:29 AM | 10 (3.1%) | 0 (0.0%) |
| 5:30 AM to 5:59 AM | 4 (1.3%) | 0 (0.0%) |
| 6:00 AM to 6:29 AM | 0 (0.0%) | 22 (4.8%) |
| 6:30 AM to 6:59 AM | 63 (19.8%) | 75 (16.4%) |
| 7:00 AM to 7:29 AM | 37 (11.6%) | 29 (6.4%) |
| 7:30 AM to 7:59 AM | 31 (9.7%) | 46 (10.1%) |
| 8:00 AM to 8:29 AM | 61 (19.1%) | 93 (20.3%) |
| 8:30 AM to 8:59 AM | 31 (9.7%) | 65 (14.2%) |
| 9:00 AM to 9:59 AM | 42 (13.2%) | 73 (16.0%) |
| 10:00 AM to 10:59 AM | 20 (6.3%) | 0 (0.0%) |
| 11:00 AM to 11:59 AM | 0 (0.0%) | 13 (2.8%) |
| 12:00 PM to 3:59 PM | 8 (2.5%) | 0 (0.0%) |
| 4:00 PM to 11:59 PM | 0 (0.0%) | 41 (9.0%) |
| Total | 319 (100.0%) | 457 (100.0%) |
Housing Occupancy in Juno Beach
Occupancy by Ownership in Juno Beach
Of the total 2,332 dwellings in Juno Beach, owner-occupied units account for 1,683 (72.2%), while renter-occupied units make up 649 (27.8%).
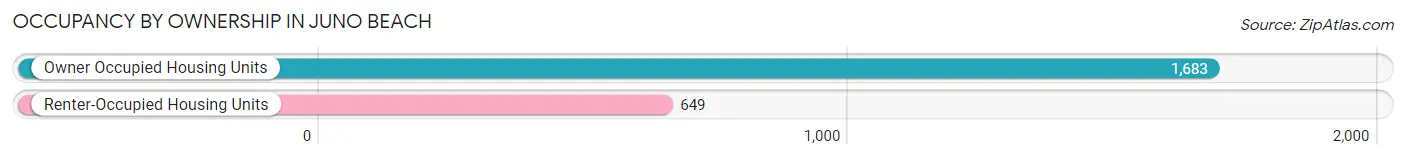
| Occupancy | # Housing Units | % Housing Units |
| Owner Occupied Housing Units | 1,683 | 72.2% |
| Renter-Occupied Housing Units | 649 | 27.8% |
| Total Occupied Housing Units | 2,332 | 100.0% |
Occupancy by Household Size in Juno Beach
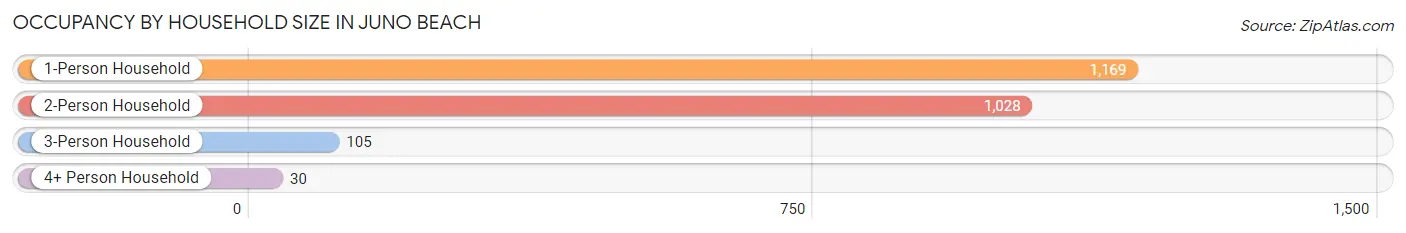
| Household Size | # Housing Units | % Housing Units |
| 1-Person Household | 1,169 | 50.1% |
| 2-Person Household | 1,028 | 44.1% |
| 3-Person Household | 105 | 4.5% |
| 4+ Person Household | 30 | 1.3% |
| Total Housing Units | 2,332 | 100.0% |
Occupancy by Ownership by Household Size in Juno Beach
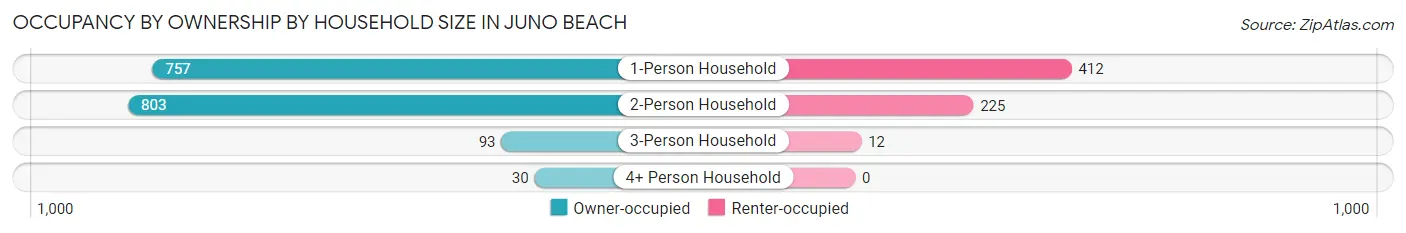
| Household Size | Owner-occupied | Renter-occupied |
| 1-Person Household | 757 (64.8%) | 412 (35.2%) |
| 2-Person Household | 803 (78.1%) | 225 (21.9%) |
| 3-Person Household | 93 (88.6%) | 12 (11.4%) |
| 4+ Person Household | 30 (100.0%) | 0 (0.0%) |
| Total Housing Units | 1,683 (72.2%) | 649 (27.8%) |
Occupancy by Educational Attainment in Juno Beach
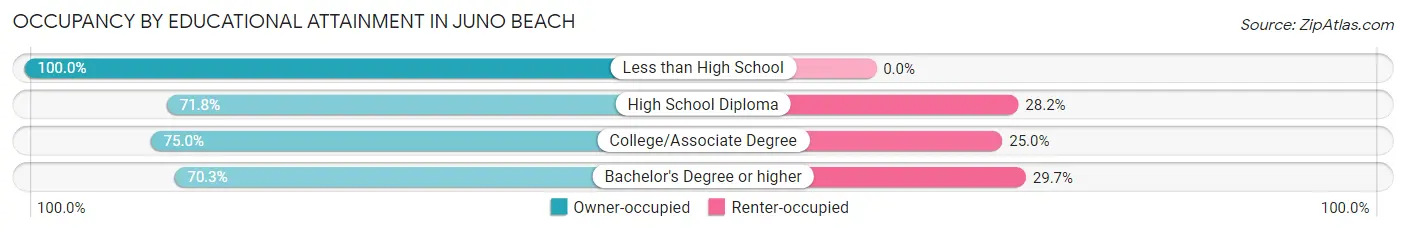
| Household Size | Owner-occupied | Renter-occupied |
| Less than High School | 63 (100.0%) | 0 (0.0%) |
| High School Diploma | 387 (71.8%) | 152 (28.2%) |
| College/Associate Degree | 264 (75.0%) | 88 (25.0%) |
| Bachelor's Degree or higher | 969 (70.3%) | 409 (29.7%) |
Occupancy by Age of Householder in Juno Beach
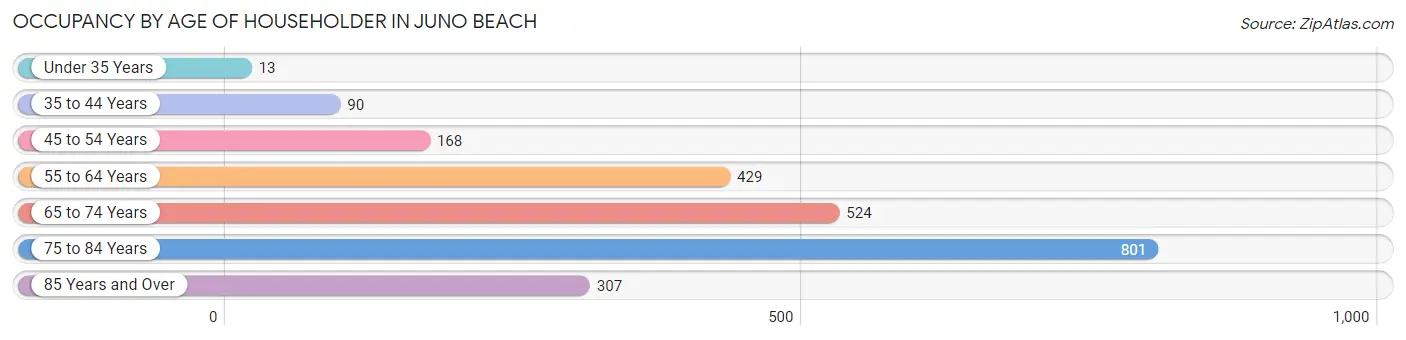
| Age Bracket | # Households | % Households |
| Under 35 Years | 13 | 0.6% |
| 35 to 44 Years | 90 | 3.9% |
| 45 to 54 Years | 168 | 7.2% |
| 55 to 64 Years | 429 | 18.4% |
| 65 to 74 Years | 524 | 22.5% |
| 75 to 84 Years | 801 | 34.4% |
| 85 Years and Over | 307 | 13.2% |
| Total | 2,332 | 100.0% |
Housing Finances in Juno Beach
Median Income by Occupancy in Juno Beach
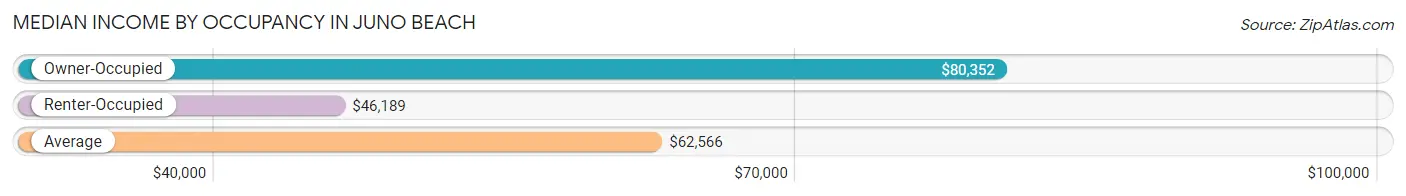
| Occupancy Type | # Households | Median Income |
| Owner-Occupied | 1,683 (72.2%) | $80,352 |
| Renter-Occupied | 649 (27.8%) | $46,189 |
| Average | 2,332 (100.0%) | $62,566 |
Occupancy by Householder Income Bracket in Juno Beach
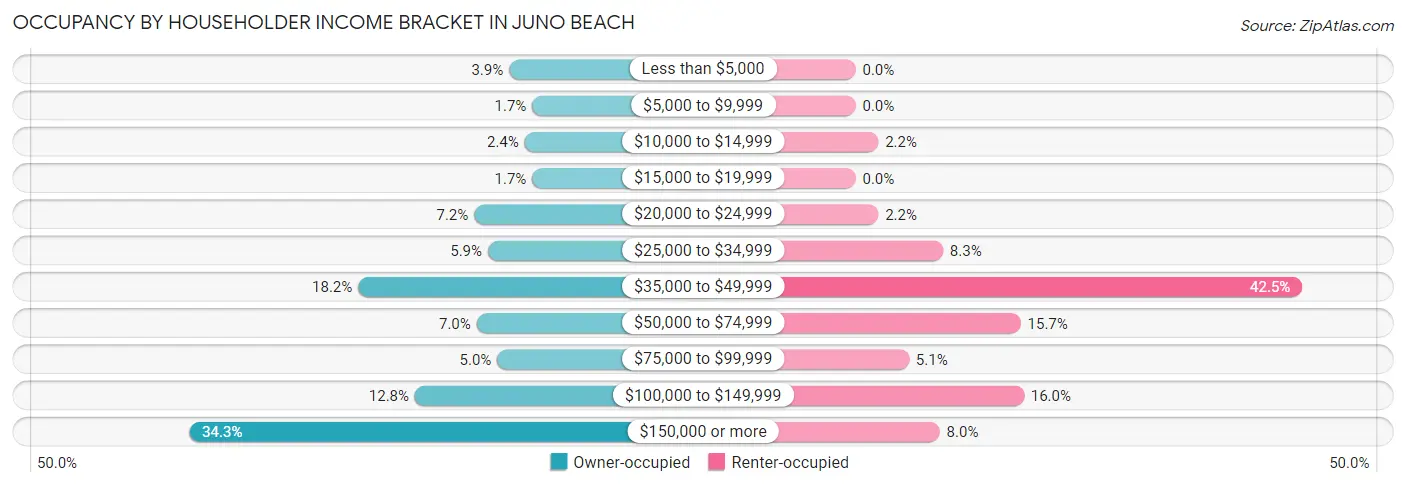
| Income Bracket | Owner-occupied | Renter-occupied |
| Less than $5,000 | 65 (3.9%) | 0 (0.0%) |
| $5,000 to $9,999 | 28 (1.7%) | 0 (0.0%) |
| $10,000 to $14,999 | 40 (2.4%) | 14 (2.2%) |
| $15,000 to $19,999 | 28 (1.7%) | 0 (0.0%) |
| $20,000 to $24,999 | 121 (7.2%) | 14 (2.2%) |
| $25,000 to $34,999 | 99 (5.9%) | 54 (8.3%) |
| $35,000 to $49,999 | 307 (18.2%) | 276 (42.5%) |
| $50,000 to $74,999 | 117 (7.0%) | 102 (15.7%) |
| $75,000 to $99,999 | 84 (5.0%) | 33 (5.1%) |
| $100,000 to $149,999 | 216 (12.8%) | 104 (16.0%) |
| $150,000 or more | 578 (34.3%) | 52 (8.0%) |
| Total | 1,683 (100.0%) | 649 (100.0%) |
Monthly Housing Cost Tiers in Juno Beach
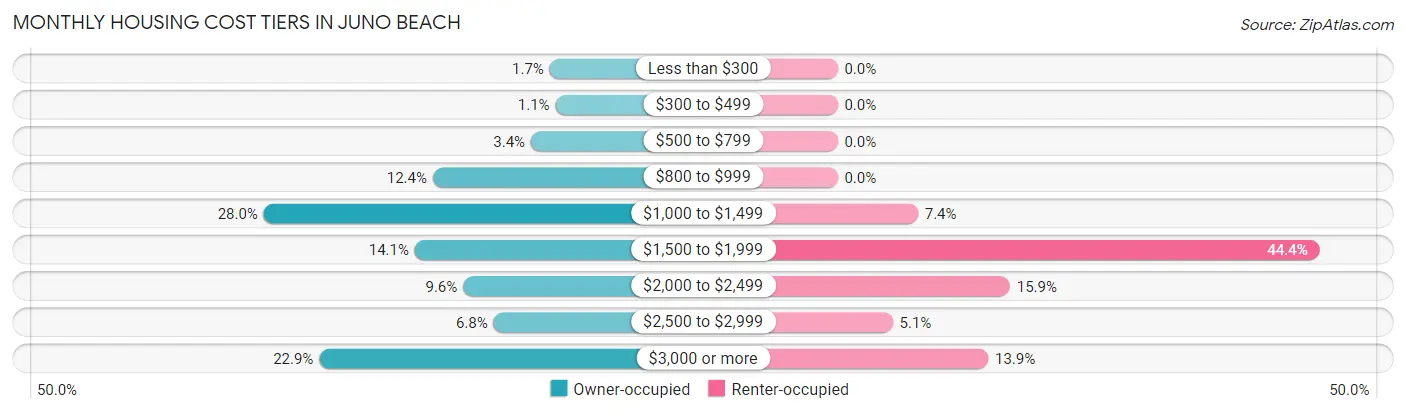
| Monthly Cost | Owner-occupied | Renter-occupied |
| Less than $300 | 28 (1.7%) | 0 (0.0%) |
| $300 to $499 | 19 (1.1%) | 0 (0.0%) |
| $500 to $799 | 57 (3.4%) | 0 (0.0%) |
| $800 to $999 | 209 (12.4%) | 0 (0.0%) |
| $1,000 to $1,499 | 471 (28.0%) | 48 (7.4%) |
| $1,500 to $1,999 | 237 (14.1%) | 288 (44.4%) |
| $2,000 to $2,499 | 162 (9.6%) | 103 (15.9%) |
| $2,500 to $2,999 | 115 (6.8%) | 33 (5.1%) |
| $3,000 or more | 385 (22.9%) | 90 (13.9%) |
| Total | 1,683 (100.0%) | 649 (100.0%) |
Physical Housing Characteristics in Juno Beach
Housing Structures in Juno Beach
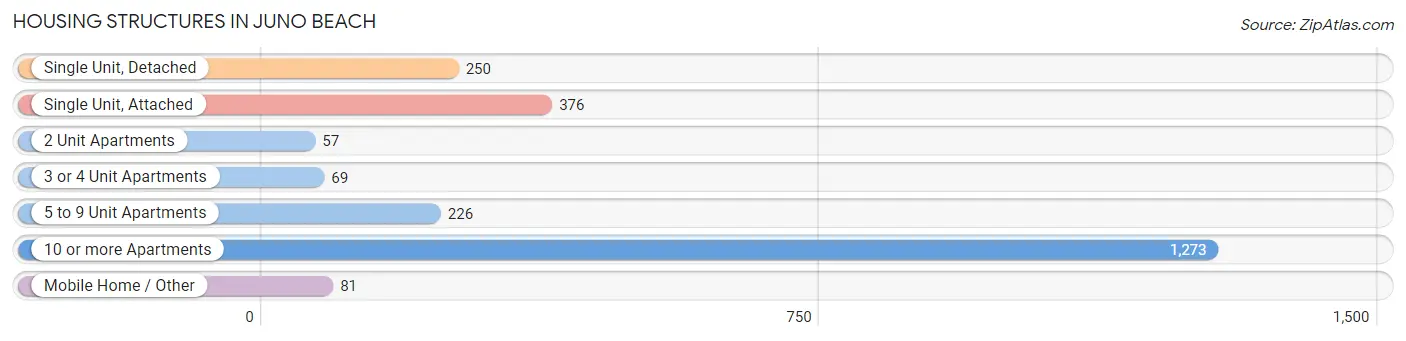
| Structure Type | # Housing Units | % Housing Units |
| Single Unit, Detached | 250 | 10.7% |
| Single Unit, Attached | 376 | 16.1% |
| 2 Unit Apartments | 57 | 2.4% |
| 3 or 4 Unit Apartments | 69 | 3.0% |
| 5 to 9 Unit Apartments | 226 | 9.7% |
| 10 or more Apartments | 1,273 | 54.6% |
| Mobile Home / Other | 81 | 3.5% |
| Total | 2,332 | 100.0% |
Housing Structures by Occupancy in Juno Beach
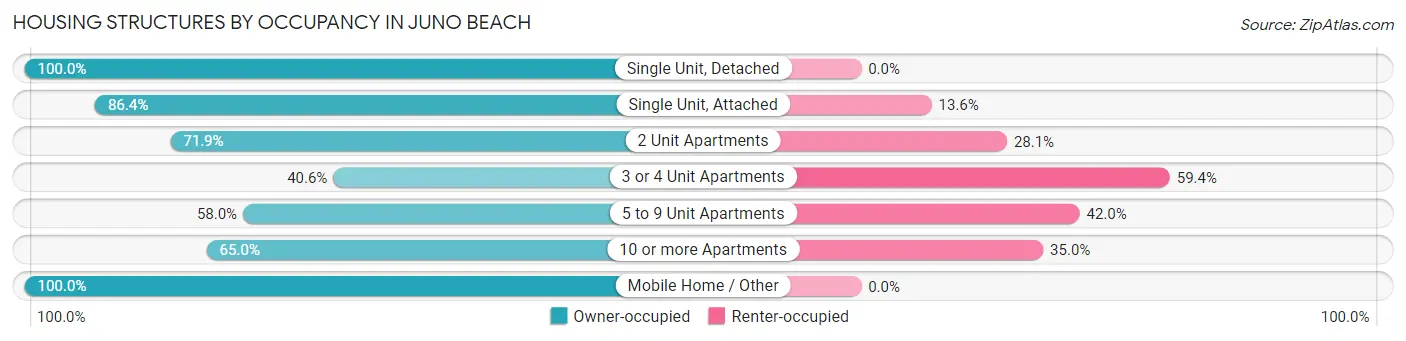
| Structure Type | Owner-occupied | Renter-occupied |
| Single Unit, Detached | 250 (100.0%) | 0 (0.0%) |
| Single Unit, Attached | 325 (86.4%) | 51 (13.6%) |
| 2 Unit Apartments | 41 (71.9%) | 16 (28.1%) |
| 3 or 4 Unit Apartments | 28 (40.6%) | 41 (59.4%) |
| 5 to 9 Unit Apartments | 131 (58.0%) | 95 (42.0%) |
| 10 or more Apartments | 827 (65.0%) | 446 (35.0%) |
| Mobile Home / Other | 81 (100.0%) | 0 (0.0%) |
| Total | 1,683 (72.2%) | 649 (27.8%) |
Housing Structures by Number of Rooms in Juno Beach
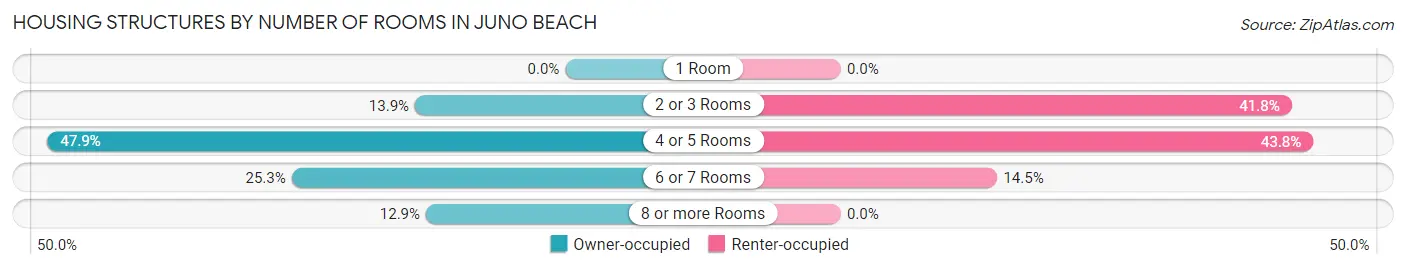
| Number of Rooms | Owner-occupied | Renter-occupied |
| 1 Room | 0 (0.0%) | 0 (0.0%) |
| 2 or 3 Rooms | 234 (13.9%) | 271 (41.8%) |
| 4 or 5 Rooms | 806 (47.9%) | 284 (43.8%) |
| 6 or 7 Rooms | 426 (25.3%) | 94 (14.5%) |
| 8 or more Rooms | 217 (12.9%) | 0 (0.0%) |
| Total | 1,683 (100.0%) | 649 (100.0%) |
Housing Structure by Heating Type in Juno Beach
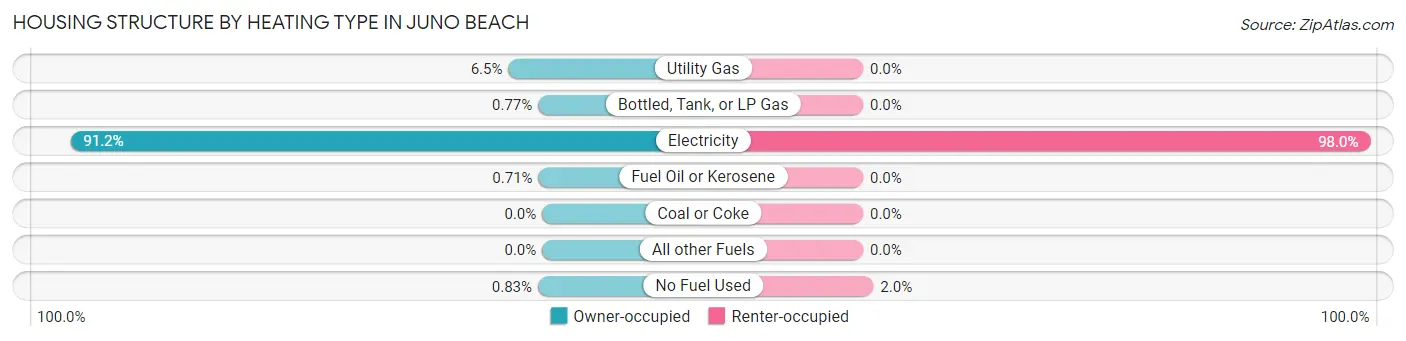
| Heating Type | Owner-occupied | Renter-occupied |
| Utility Gas | 110 (6.5%) | 0 (0.0%) |
| Bottled, Tank, or LP Gas | 13 (0.8%) | 0 (0.0%) |
| Electricity | 1,534 (91.1%) | 636 (98.0%) |
| Fuel Oil or Kerosene | 12 (0.7%) | 0 (0.0%) |
| Coal or Coke | 0 (0.0%) | 0 (0.0%) |
| All other Fuels | 0 (0.0%) | 0 (0.0%) |
| No Fuel Used | 14 (0.8%) | 13 (2.0%) |
| Total | 1,683 (100.0%) | 649 (100.0%) |
Household Vehicle Usage in Juno Beach
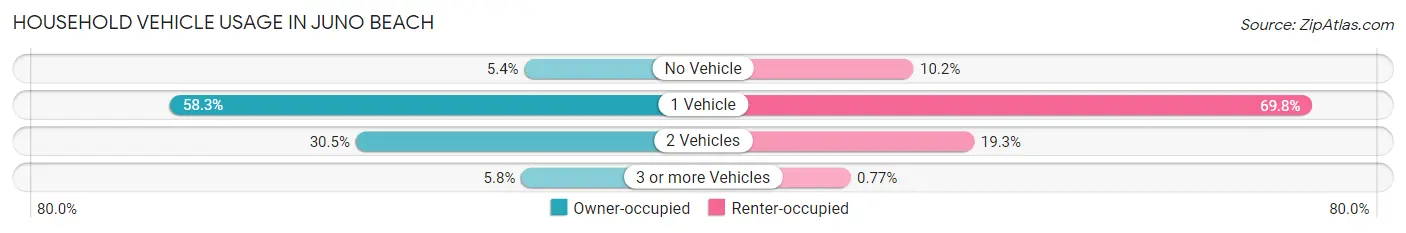
| Vehicles per Household | Owner-occupied | Renter-occupied |
| No Vehicle | 90 (5.3%) | 66 (10.2%) |
| 1 Vehicle | 981 (58.3%) | 453 (69.8%) |
| 2 Vehicles | 514 (30.5%) | 125 (19.3%) |
| 3 or more Vehicles | 98 (5.8%) | 5 (0.8%) |
| Total | 1,683 (100.0%) | 649 (100.0%) |
Real Estate & Mortgages in Juno Beach
Real Estate and Mortgage Overview in Juno Beach
| Characteristic | Without Mortgage | With Mortgage |
| Housing Units | 1,102 | 581 |
| Median Property Value | $554,900 | $652,500 |
| Median Household Income | $58,913 | $185 |
| Monthly Housing Costs | $1,338 | $279 |
| Real Estate Taxes | $4,938 | $44 |
Property Value by Mortgage Status in Juno Beach
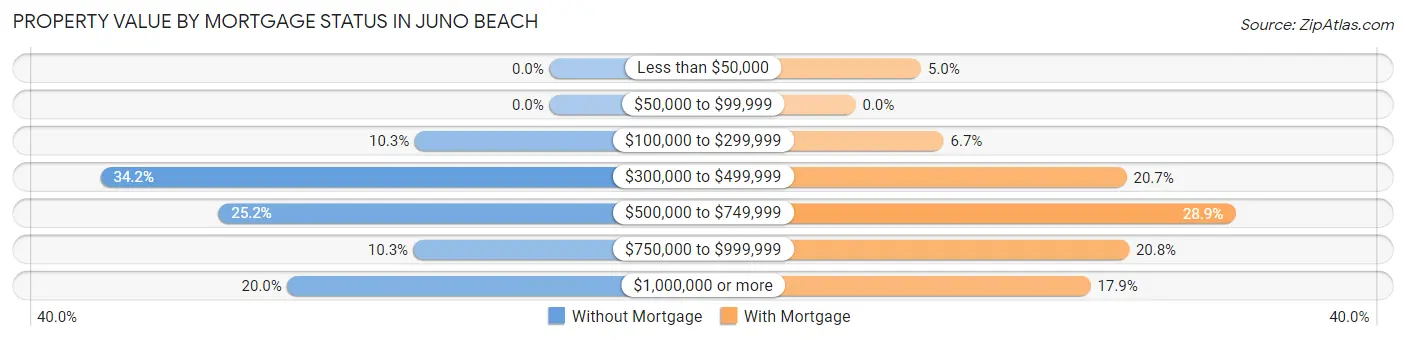
| Property Value | Without Mortgage | With Mortgage |
| Less than $50,000 | 0 (0.0%) | 29 (5.0%) |
| $50,000 to $99,999 | 0 (0.0%) | 0 (0.0%) |
| $100,000 to $299,999 | 113 (10.2%) | 39 (6.7%) |
| $300,000 to $499,999 | 377 (34.2%) | 120 (20.6%) |
| $500,000 to $749,999 | 278 (25.2%) | 168 (28.9%) |
| $750,000 to $999,999 | 114 (10.3%) | 121 (20.8%) |
| $1,000,000 or more | 220 (20.0%) | 104 (17.9%) |
| Total | 1,102 (100.0%) | 581 (100.0%) |
Household Income by Mortgage Status in Juno Beach
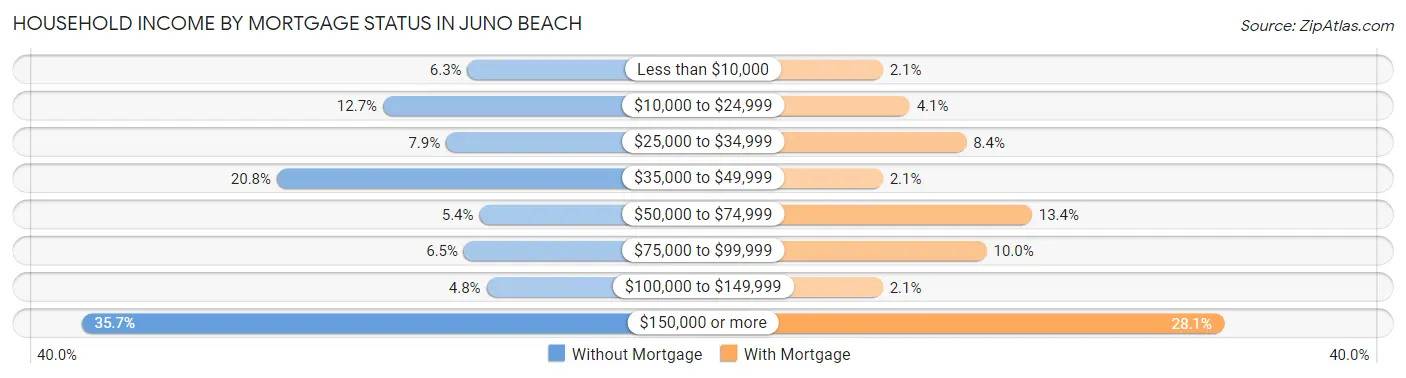
| Household Income | Without Mortgage | With Mortgage |
| Less than $10,000 | 69 (6.3%) | 12 (2.1%) |
| $10,000 to $24,999 | 140 (12.7%) | 24 (4.1%) |
| $25,000 to $34,999 | 87 (7.9%) | 49 (8.4%) |
| $35,000 to $49,999 | 229 (20.8%) | 12 (2.1%) |
| $50,000 to $74,999 | 59 (5.3%) | 78 (13.4%) |
| $75,000 to $99,999 | 72 (6.5%) | 58 (10.0%) |
| $100,000 to $149,999 | 53 (4.8%) | 12 (2.1%) |
| $150,000 or more | 393 (35.7%) | 163 (28.1%) |
| Total | 1,102 (100.0%) | 581 (100.0%) |
Property Value to Household Income Ratio in Juno Beach
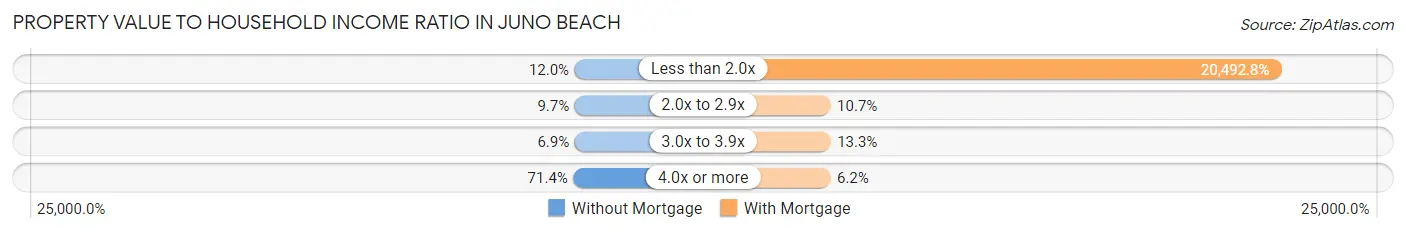
| Value-to-Income Ratio | Without Mortgage | With Mortgage |
| Less than 2.0x | 132 (12.0%) | 119,063 (20,492.8%) |
| 2.0x to 2.9x | 107 (9.7%) | 62 (10.7%) |
| 3.0x to 3.9x | 76 (6.9%) | 77 (13.3%) |
| 4.0x or more | 787 (71.4%) | 36 (6.2%) |
| Total | 1,102 (100.0%) | 581 (100.0%) |
Real Estate Taxes by Mortgage Status in Juno Beach
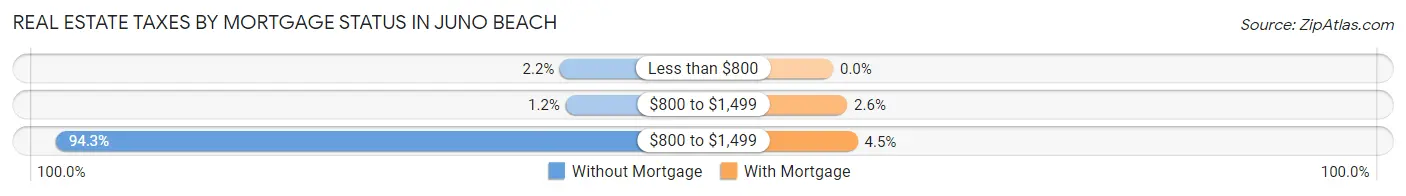
| Property Taxes | Without Mortgage | With Mortgage |
| Less than $800 | 24 (2.2%) | 0 (0.0%) |
| $800 to $1,499 | 13 (1.2%) | 15 (2.6%) |
| $800 to $1,499 | 1,039 (94.3%) | 26 (4.5%) |
| Total | 1,102 (100.0%) | 581 (100.0%) |
Health & Disability in Juno Beach
Health Insurance Coverage by Age in Juno Beach
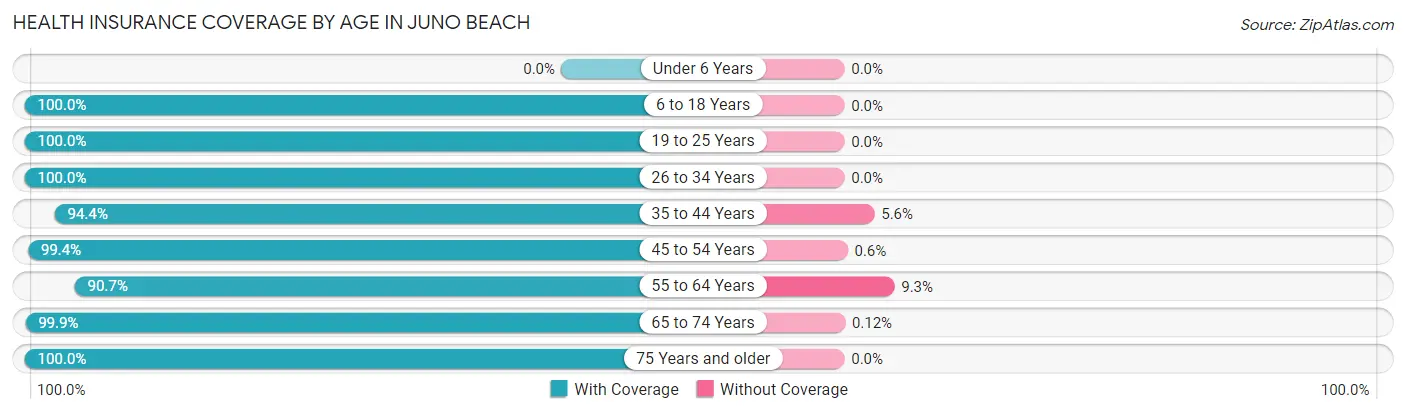
| Age Bracket | With Coverage | Without Coverage |
| Under 6 Years | 0 (0.0%) | 0 (0.0%) |
| 6 to 18 Years | 108 (100.0%) | 0 (0.0%) |
| 19 to 25 Years | 29 (100.0%) | 0 (0.0%) |
| 26 to 34 Years | 107 (100.0%) | 0 (0.0%) |
| 35 to 44 Years | 152 (94.4%) | 9 (5.6%) |
| 45 to 54 Years | 331 (99.4%) | 2 (0.6%) |
| 55 to 64 Years | 681 (90.7%) | 70 (9.3%) |
| 65 to 74 Years | 800 (99.9%) | 1 (0.1%) |
| 75 Years and older | 1,467 (100.0%) | 0 (0.0%) |
| Total | 3,675 (97.8%) | 82 (2.2%) |
Health Insurance Coverage by Citizenship Status in Juno Beach
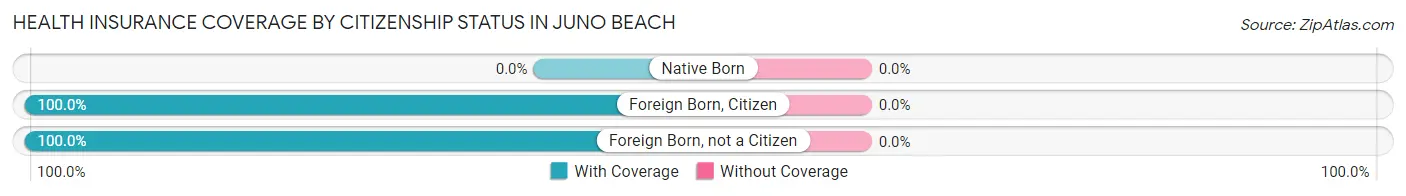
| Citizenship Status | With Coverage | Without Coverage |
| Native Born | 0 (0.0%) | 0 (0.0%) |
| Foreign Born, Citizen | 108 (100.0%) | 0 (0.0%) |
| Foreign Born, not a Citizen | 29 (100.0%) | 0 (0.0%) |
Health Insurance Coverage by Household Income in Juno Beach
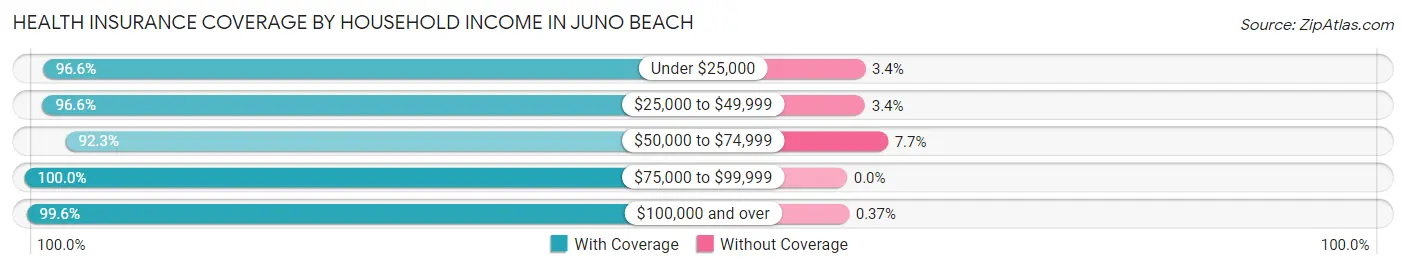
| Household Income | With Coverage | Without Coverage |
| Under $25,000 | 367 (96.6%) | 13 (3.4%) |
| $25,000 to $49,999 | 946 (96.6%) | 33 (3.4%) |
| $50,000 to $74,999 | 277 (92.3%) | 23 (7.7%) |
| $75,000 to $99,999 | 196 (100.0%) | 0 (0.0%) |
| $100,000 and over | 1,877 (99.6%) | 7 (0.4%) |
Public vs Private Health Insurance Coverage by Age in Juno Beach
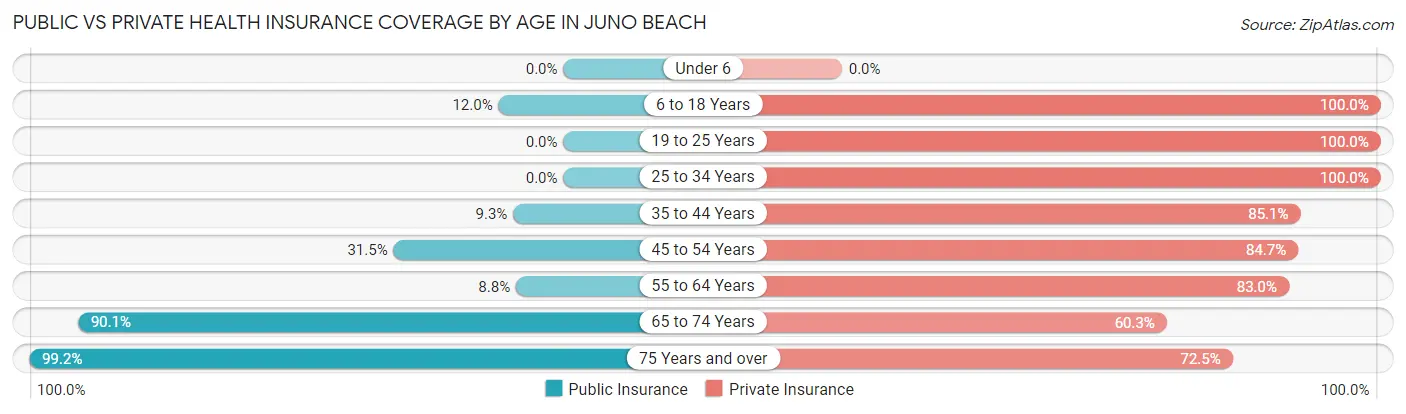
| Age Bracket | Public Insurance | Private Insurance |
| Under 6 | 0 (0.0%) | 0 (0.0%) |
| 6 to 18 Years | 13 (12.0%) | 108 (100.0%) |
| 19 to 25 Years | 0 (0.0%) | 29 (100.0%) |
| 25 to 34 Years | 0 (0.0%) | 107 (100.0%) |
| 35 to 44 Years | 15 (9.3%) | 137 (85.1%) |
| 45 to 54 Years | 105 (31.5%) | 282 (84.7%) |
| 55 to 64 Years | 66 (8.8%) | 623 (83.0%) |
| 65 to 74 Years | 722 (90.1%) | 483 (60.3%) |
| 75 Years and over | 1,455 (99.2%) | 1,064 (72.5%) |
| Total | 2,376 (63.2%) | 2,833 (75.4%) |
Disability Status by Sex by Age in Juno Beach
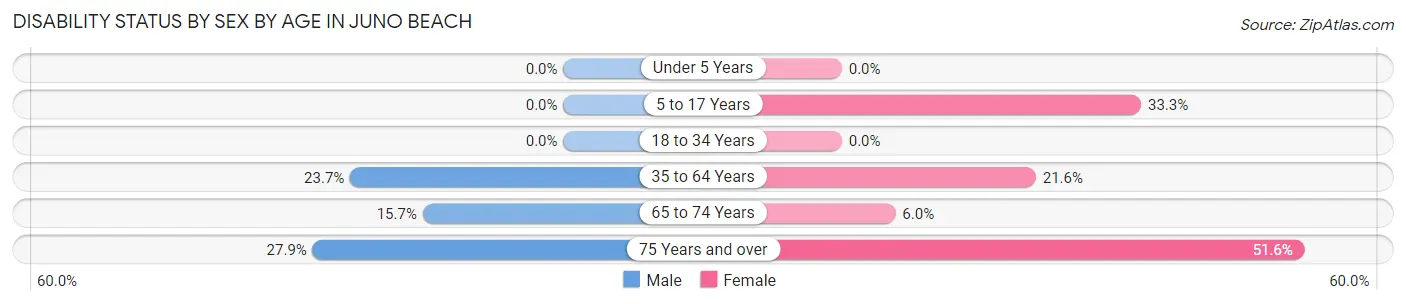
| Age Bracket | Male | Female |
| Under 5 Years | 0 (0.0%) | 0 (0.0%) |
| 5 to 17 Years | 0 (0.0%) | 21 (33.3%) |
| 18 to 34 Years | 0 (0.0%) | 0 (0.0%) |
| 35 to 64 Years | 122 (23.7%) | 158 (21.6%) |
| 65 to 74 Years | 52 (15.7%) | 28 (6.0%) |
| 75 Years and over | 148 (27.9%) | 483 (51.5%) |
Disability Class by Sex by Age in Juno Beach
Disability Class: Hearing Difficulty
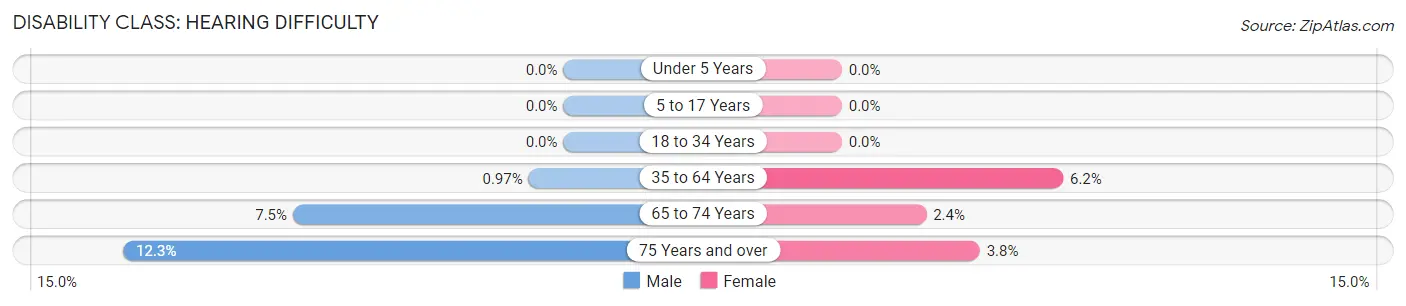
| Age Bracket | Male | Female |
| Under 5 Years | 0 (0.0%) | 0 (0.0%) |
| 5 to 17 Years | 0 (0.0%) | 0 (0.0%) |
| 18 to 34 Years | 0 (0.0%) | 0 (0.0%) |
| 35 to 64 Years | 5 (1.0%) | 45 (6.2%) |
| 65 to 74 Years | 25 (7.5%) | 11 (2.4%) |
| 75 Years and over | 65 (12.3%) | 36 (3.8%) |
Disability Class: Vision Difficulty
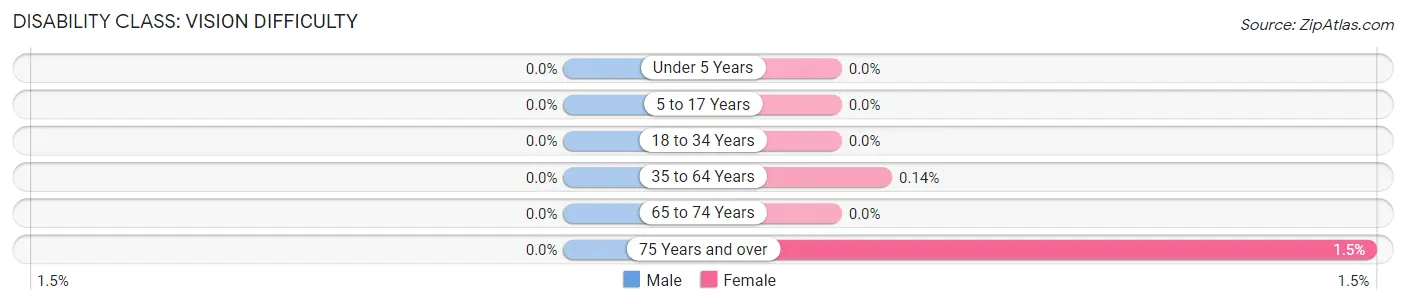
| Age Bracket | Male | Female |
| Under 5 Years | 0 (0.0%) | 0 (0.0%) |
| 5 to 17 Years | 0 (0.0%) | 0 (0.0%) |
| 18 to 34 Years | 0 (0.0%) | 0 (0.0%) |
| 35 to 64 Years | 0 (0.0%) | 1 (0.1%) |
| 65 to 74 Years | 0 (0.0%) | 0 (0.0%) |
| 75 Years and over | 0 (0.0%) | 14 (1.5%) |
Disability Class: Cognitive Difficulty
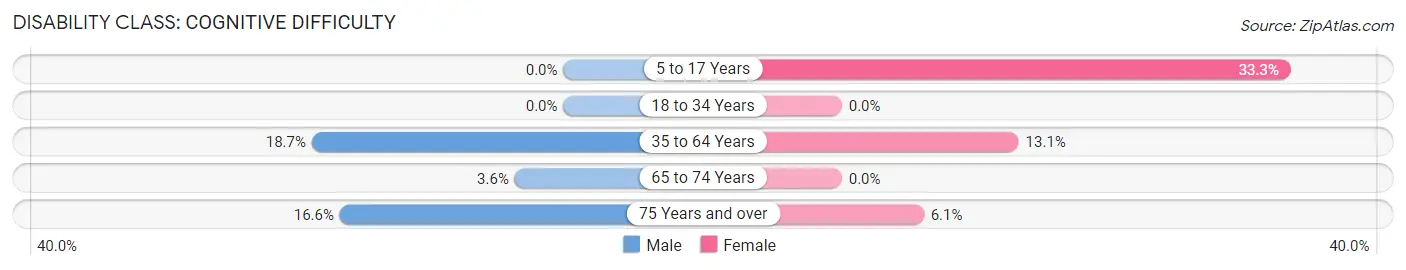
| Age Bracket | Male | Female |
| 5 to 17 Years | 0 (0.0%) | 21 (33.3%) |
| 18 to 34 Years | 0 (0.0%) | 0 (0.0%) |
| 35 to 64 Years | 96 (18.7%) | 96 (13.1%) |
| 65 to 74 Years | 12 (3.6%) | 0 (0.0%) |
| 75 Years and over | 88 (16.6%) | 57 (6.1%) |
Disability Class: Ambulatory Difficulty
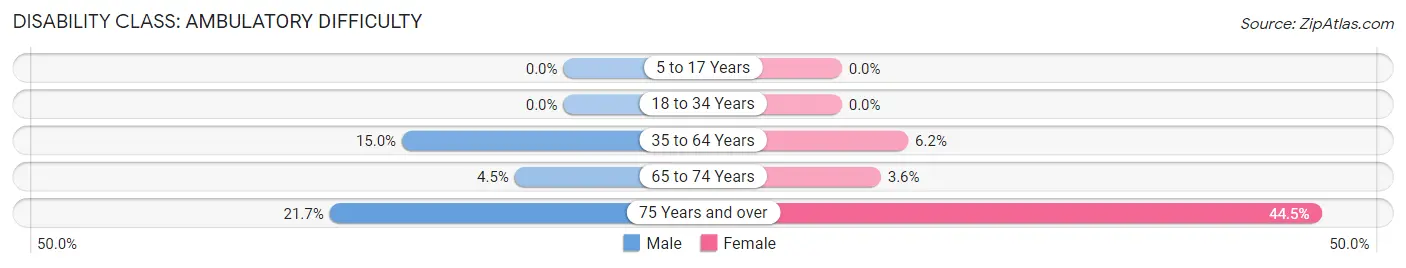
| Age Bracket | Male | Female |
| 5 to 17 Years | 0 (0.0%) | 0 (0.0%) |
| 18 to 34 Years | 0 (0.0%) | 0 (0.0%) |
| 35 to 64 Years | 77 (15.0%) | 45 (6.2%) |
| 65 to 74 Years | 15 (4.5%) | 17 (3.6%) |
| 75 Years and over | 115 (21.7%) | 417 (44.5%) |
Disability Class: Self-Care Difficulty
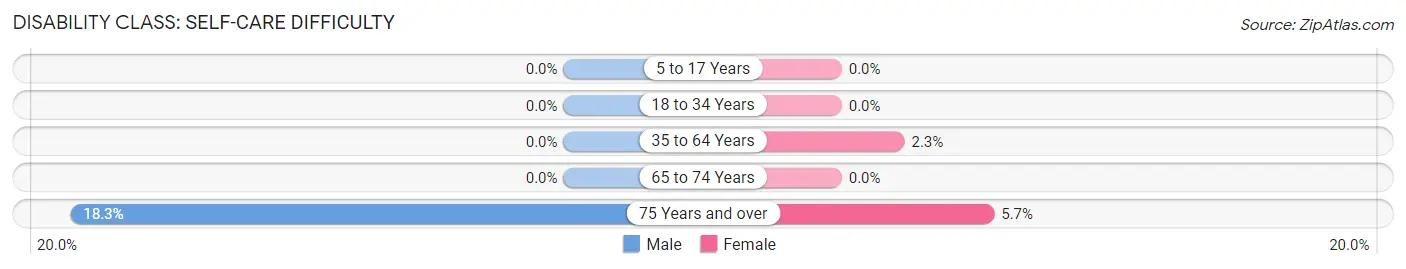
| Age Bracket | Male | Female |
| 5 to 17 Years | 0 (0.0%) | 0 (0.0%) |
| 18 to 34 Years | 0 (0.0%) | 0 (0.0%) |
| 35 to 64 Years | 0 (0.0%) | 17 (2.3%) |
| 65 to 74 Years | 0 (0.0%) | 0 (0.0%) |
| 75 Years and over | 97 (18.3%) | 53 (5.7%) |
Technology Access in Juno Beach
Computing Device Access in Juno Beach
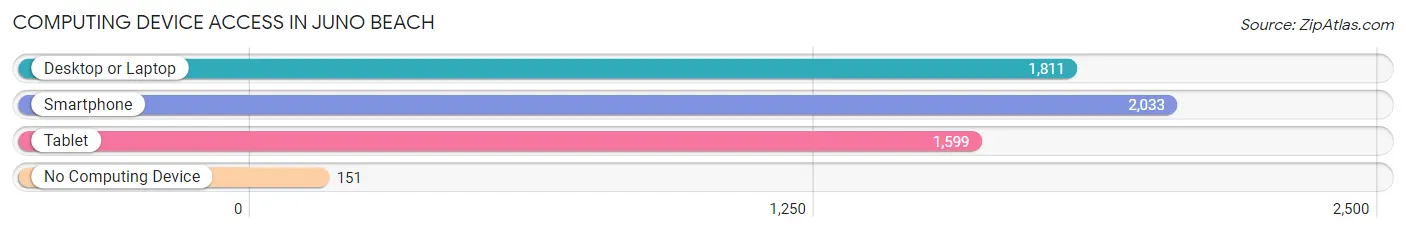
| Device Type | # Households | % Households |
| Desktop or Laptop | 1,811 | 77.7% |
| Smartphone | 2,033 | 87.2% |
| Tablet | 1,599 | 68.6% |
| No Computing Device | 151 | 6.5% |
| Total | 2,332 | 100.0% |
Internet Access in Juno Beach
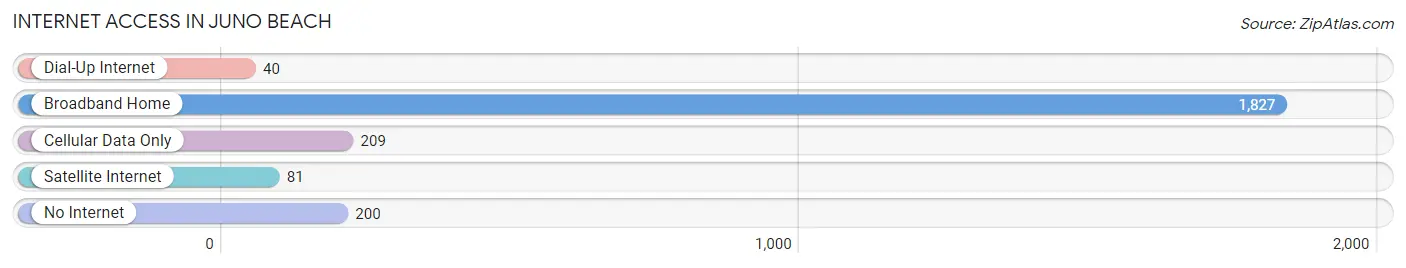
| Internet Type | # Households | % Households |
| Dial-Up Internet | 40 | 1.7% |
| Broadband Home | 1,827 | 78.3% |
| Cellular Data Only | 209 | 9.0% |
| Satellite Internet | 81 | 3.5% |
| No Internet | 200 | 8.6% |
| Total | 2,332 | 100.0% |
Juno Beach Summary
Juno Beach is a town located in Palm Beach County, Florida. It is situated on the Atlantic Ocean, just north of Jupiter and south of North Palm Beach. The town was incorporated in 1953 and has a population of approximately 3,300 people.
History
The area that is now Juno Beach was originally inhabited by the Tequesta Indians. The first European settlers arrived in the area in the late 1700s. The area was known as “Jupiter Inlet” and was used as a fishing and trading post. In the late 1800s, the area was developed as a resort town and was known as “Juno Beach”. The town was named after the Roman goddess Juno, who was the goddess of marriage and childbirth.
In the early 1900s, the area was developed as a residential community. The town was incorporated in 1953 and has since grown to become a popular beach destination.
Geography
Juno Beach is located in Palm Beach County, Florida. It is situated on the Atlantic Ocean, just north of Jupiter and south of North Palm Beach. The town is bordered by the Intracoastal Waterway to the west and the Atlantic Ocean to the east. The town is approximately 8.5 square miles in size and has a population of approximately 3,300 people.
The town is home to several parks, including Juno Beach Park, Loggerhead Park, and Juno Dunes Natural Area. The town also has several beaches, including Juno Beach, Juno Beach Park, and Loggerhead Park.
Economy
Juno Beach is a popular beach destination and is home to several businesses and attractions. The town is home to several restaurants, bars, and shops. The town is also home to several hotels and resorts, including the Juno Beach Resort and the Juno Beach Inn.
The town is also home to several businesses, including a marina, a golf course, and a fishing pier. The town is also home to several corporate offices, including the headquarters of the Florida Power & Light Company.
Demographics
As of the 2010 census, the population of Juno Beach was 3,262. The racial makeup of the town was 94.3% White, 1.7% African American, 0.2% Native American, 1.2% Asian, 0.1% Pacific Islander, 1.2% from other races, and 1.5% from two or more races. Hispanic or Latino of any race were 4.3% of the population.
The median income for a household in the town was $68,958, and the median income for a family was $77,958. The per capita income for the town was $37,958. About 4.3% of families and 5.3% of the population were below the poverty line, including 6.3% of those under age 18 and 4.3% of those age 65 or over.
Juno Beach is a popular beach destination and is home to several businesses and attractions. The town is home to several restaurants, bars, and shops. The town is also home to several hotels and resorts, including the Juno Beach Resort and the Juno Beach Inn. The town is also home to several corporate offices, including the headquarters of the Florida Power & Light Company. The town is also home to several parks, including Juno Beach Park, Loggerhead Park, and Juno Dunes Natural Area. The town also has several beaches, including Juno Beach, Juno Beach Park, and Loggerhead Park. The town is a popular destination for tourists and is home to a diverse population.
Common Questions
What is Per Capita Income in Juno Beach?
Per Capita income in Juno Beach is $85,768.
What is the Median Family Income in Juno Beach?
Median Family Income in Juno Beach is $151,458.
What is the Median Household income in Juno Beach?
Median Household Income in Juno Beach is $62,566.
What is Income or Wage Gap in Juno Beach?
Income or Wage Gap in Juno Beach is 54.1%.
Women in Juno Beach earn 45.9 cents for every dollar earned by a man.
What is Inequality or Gini Index in Juno Beach?
Inequality or Gini Index in Juno Beach is 0.57.
What is the Total Population of Juno Beach?
Total Population of Juno Beach is 3,818.
What is the Total Male Population of Juno Beach?
Total Male Population of Juno Beach is 1,443.
What is the Total Female Population of Juno Beach?
Total Female Population of Juno Beach is 2,375.
What is the Ratio of Males per 100 Females in Juno Beach?
There are 60.76 Males per 100 Females in Juno Beach.
What is the Ratio of Females per 100 Males in Juno Beach?
There are 164.59 Females per 100 Males in Juno Beach.
What is the Median Population Age in Juno Beach?
Median Population Age in Juno Beach is 69.2 Years.
What is the Average Family Size in Juno Beach
Average Family Size in Juno Beach is 2.2 People.
What is the Average Household Size in Juno Beach
Average Household Size in Juno Beach is 1.6 People.
How Large is the Labor Force in Juno Beach?
There are 1,412 People in the Labor Forcein in Juno Beach.
What is the Percentage of People in the Labor Force in Juno Beach?
37.4% of People are in the Labor Force in Juno Beach.
What is the Unemployment Rate in Juno Beach?
Unemployment Rate in Juno Beach is 8.8%.