South Beach, FL Map & Demographics
South Beach Map
South Beach Overview
$147,430
PER CAPITA INCOME
$201,574
AVG FAMILY INCOME
$193,281
AVG HOUSEHOLD INCOME
64.0%
WAGE / INCOME GAP [ % ]
36.0¢/ $1
WAGE / INCOME GAP [ $ ]
$14,161
FAMILY INCOME DEFICIT
0.52
INEQUALITY / GINI INDEX
3,120
TOTAL POPULATION
1,474
MALE POPULATION
1,646
FEMALE POPULATION
89.55
MALES / 100 FEMALES
111.67
FEMALES / 100 MALES
70.8
MEDIAN AGE
2.3
AVG FAMILY SIZE
2.0
AVG HOUSEHOLD SIZE
838
LABOR FORCE [ PEOPLE ]
28.9%
PERCENT IN LABOR FORCE
1.3%
UNEMPLOYMENT RATE
Income in South Beach
Income Overview in South Beach
Per Capita Income in South Beach is $147,430, while median incomes of families and households are $201,574 and $193,281 respectively.
| Characteristic | Number | Measure |
| Per Capita Income | 3,120 | $147,430 |
| Median Family Income | 1,166 | $201,574 |
| Mean Family Income | 1,166 | $310,124 |
| Median Household Income | 1,556 | $193,281 |
| Mean Household Income | 1,556 | $290,072 |
| Income Deficit | 1,166 | $14,161 |
| Wage / Income Gap (%) | 3,120 | 64.00% |
| Wage / Income Gap ($) | 3,120 | 36.00¢ per $1 |
| Gini / Inequality Index | 3,120 | 0.52 |
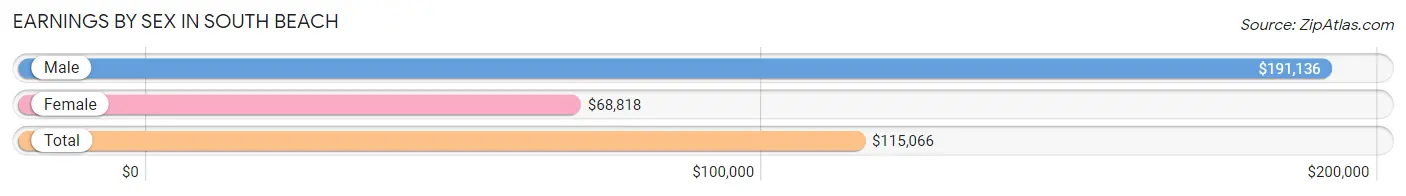
Earnings by Sex in South Beach
Average Earnings in South Beach are $115,066, $191,136 for men and $68,818 for women, a difference of 64.0%.
| Sex | Number | Average Earnings |
| Male | 514 (52.1%) | $191,136 |
| Female | 473 (47.9%) | $68,818 |
| Total | 987 (100.0%) | $115,066 |
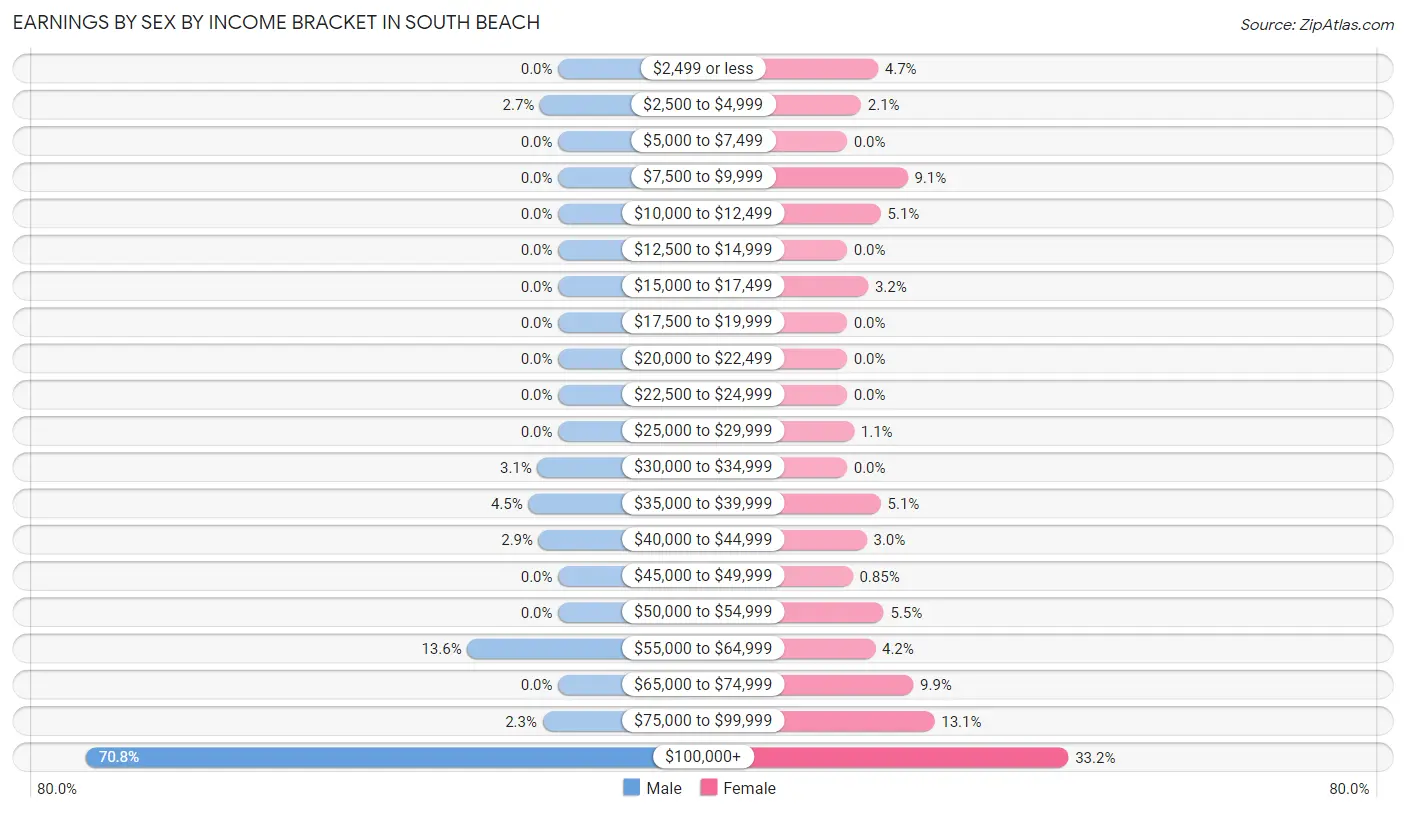
Earnings by Sex by Income Bracket in South Beach
The most common earnings brackets in South Beach are $100,000+ for men (364 | 70.8%) and $100,000+ for women (157 | 33.2%).
| Income | Male | Female |
| $2,499 or less | 0 (0.0%) | 22 (4.6%) |
| $2,500 to $4,999 | 14 (2.7%) | 10 (2.1%) |
| $5,000 to $7,499 | 0 (0.0%) | 0 (0.0%) |
| $7,500 to $9,999 | 0 (0.0%) | 43 (9.1%) |
| $10,000 to $12,499 | 0 (0.0%) | 24 (5.1%) |
| $12,500 to $14,999 | 0 (0.0%) | 0 (0.0%) |
| $15,000 to $17,499 | 0 (0.0%) | 15 (3.2%) |
| $17,500 to $19,999 | 0 (0.0%) | 0 (0.0%) |
| $20,000 to $22,499 | 0 (0.0%) | 0 (0.0%) |
| $22,500 to $24,999 | 0 (0.0%) | 0 (0.0%) |
| $25,000 to $29,999 | 0 (0.0%) | 5 (1.1%) |
| $30,000 to $34,999 | 16 (3.1%) | 0 (0.0%) |
| $35,000 to $39,999 | 23 (4.5%) | 24 (5.1%) |
| $40,000 to $44,999 | 15 (2.9%) | 14 (3.0%) |
| $45,000 to $49,999 | 0 (0.0%) | 4 (0.9%) |
| $50,000 to $54,999 | 0 (0.0%) | 26 (5.5%) |
| $55,000 to $64,999 | 70 (13.6%) | 20 (4.2%) |
| $65,000 to $74,999 | 0 (0.0%) | 47 (9.9%) |
| $75,000 to $99,999 | 12 (2.3%) | 62 (13.1%) |
| $100,000+ | 364 (70.8%) | 157 (33.2%) |
| Total | 514 (100.0%) | 473 (100.0%) |
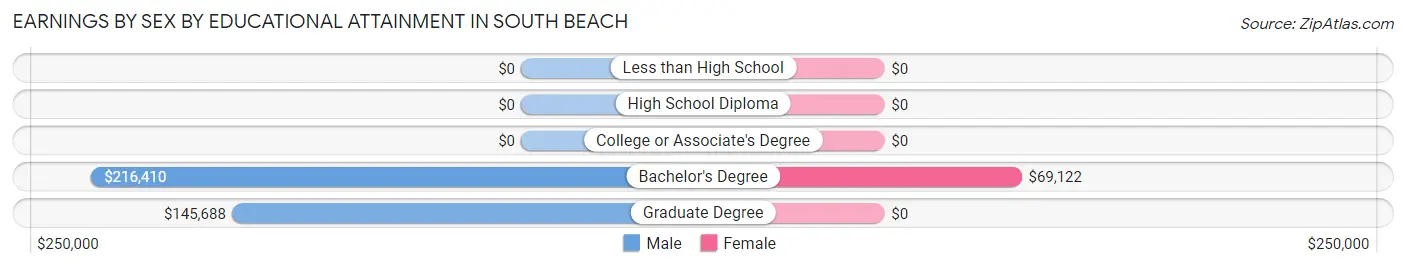
Earnings by Sex by Educational Attainment in South Beach
Average earnings in South Beach are $191,136 for men and $68,953 for women, a difference of 63.9%. Men with an educational attainment of bachelor's degree enjoy the highest average annual earnings of $216,410, while those with graduate degree education earn the least with $145,688. Women with an educational attainment of bachelor's degree earn the most with the average annual earnings of $69,122, while those with bachelor's degree education have the smallest earnings of $69,122.
| Educational Attainment | Male Income | Female Income |
| Less than High School | - | - |
| High School Diploma | - | - |
| College or Associate's Degree | - | - |
| Bachelor's Degree | $216,410 | $69,122 |
| Graduate Degree | $145,688 | $0 |
| Total | $191,136 | $68,953 |
Family Income in South Beach
Family Income Brackets in South Beach
According to the South Beach family income data, there are 600 families falling into the $200,000+ income range, which is the most common income bracket and makes up 51.5% of all families.
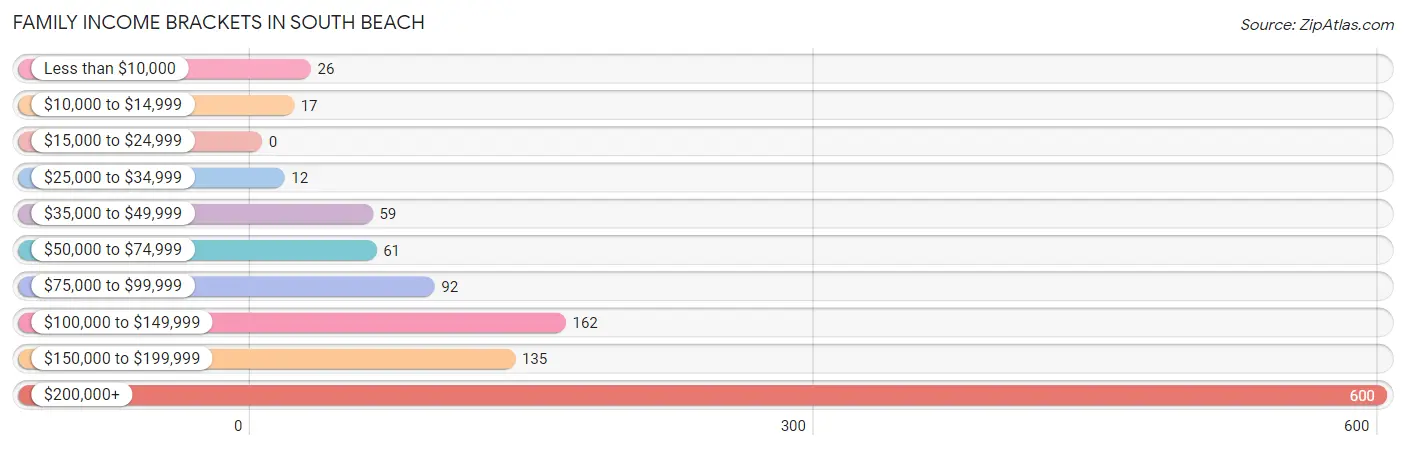
| Income Bracket | # Families | % Families |
| Less than $10,000 | 26 | 2.2% |
| $10,000 to $14,999 | 17 | 1.5% |
| $15,000 to $24,999 | 0 | 0.0% |
| $25,000 to $34,999 | 12 | 1.0% |
| $35,000 to $49,999 | 59 | 5.1% |
| $50,000 to $74,999 | 61 | 5.2% |
| $75,000 to $99,999 | 92 | 7.9% |
| $100,000 to $149,999 | 162 | 13.9% |
| $150,000 to $199,999 | 135 | 11.6% |
| $200,000+ | 600 | 51.5% |
Family Income by Famaliy Size in South Beach
4-person families (36 | 3.1%) account for the highest median family income in South Beach with $250,001 per family, while 2-person families (1,072 | 91.9%) have the highest median income of $97,678 per family member.
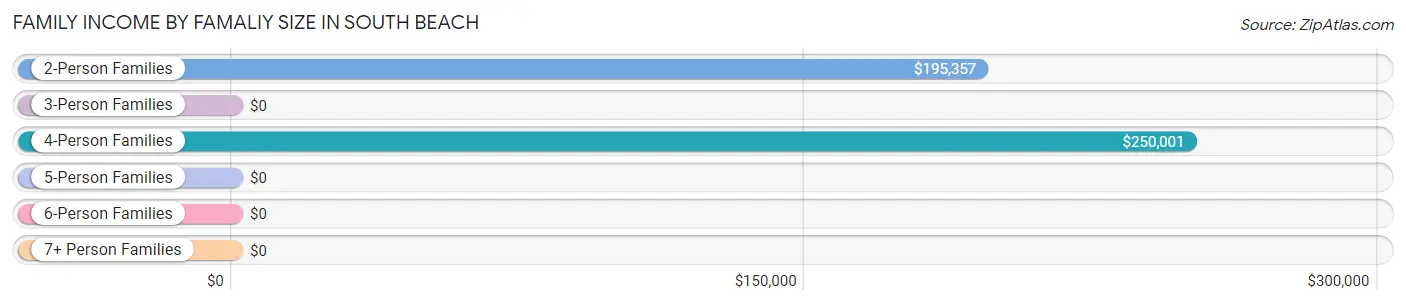
| Income Bracket | # Families | Median Income |
| 2-Person Families | 1,072 (91.9%) | $195,357 |
| 3-Person Families | 14 (1.2%) | $0 |
| 4-Person Families | 36 (3.1%) | $250,001 |
| 5-Person Families | 26 (2.2%) | $0 |
| 6-Person Families | 18 (1.5%) | $0 |
| 7+ Person Families | 0 (0.0%) | $0 |
| Total | 1,166 (100.0%) | $201,574 |
Family Income by Number of Earners in South Beach
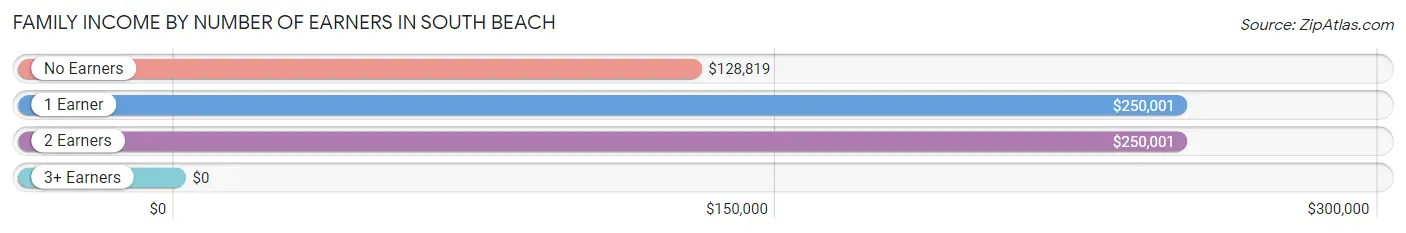
| Number of Earners | # Families | Median Income |
| No Earners | 627 (53.8%) | $128,819 |
| 1 Earner | 296 (25.4%) | $250,001 |
| 2 Earners | 243 (20.8%) | $250,001 |
| 3+ Earners | 0 (0.0%) | $0 |
| Total | 1,166 (100.0%) | $201,574 |
Household Income in South Beach
Household Income Brackets in South Beach
With 748 households falling in the category, the $200,000+ income range is the most frequent in South Beach, accounting for 48.1% of all households.
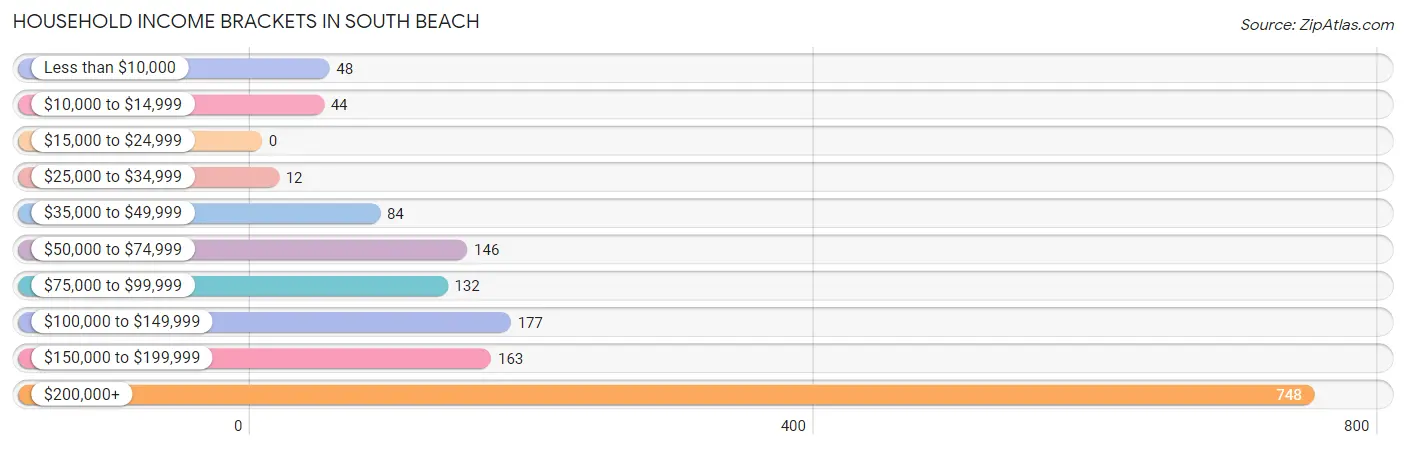
| Income Bracket | # Households | % Households |
| Less than $10,000 | 48 | 3.1% |
| $10,000 to $14,999 | 44 | 2.8% |
| $15,000 to $24,999 | 0 | 0.0% |
| $25,000 to $34,999 | 12 | 0.8% |
| $35,000 to $49,999 | 84 | 5.4% |
| $50,000 to $74,999 | 146 | 9.4% |
| $75,000 to $99,999 | 132 | 8.5% |
| $100,000 to $149,999 | 177 | 11.4% |
| $150,000 to $199,999 | 163 | 10.5% |
| $200,000+ | 748 | 48.1% |
Household Income by Householder Age in South Beach
The median household income in South Beach is $193,281, with the highest median household income of $250,001 found in the 45 to 64 years age bracket for the primary householder. A total of 324 households (20.8%) fall into this category. Meanwhile, the 15 to 24 years age bracket for the primary householder has the lowest median household income of $0, with 4 households (0.3%) in this group.
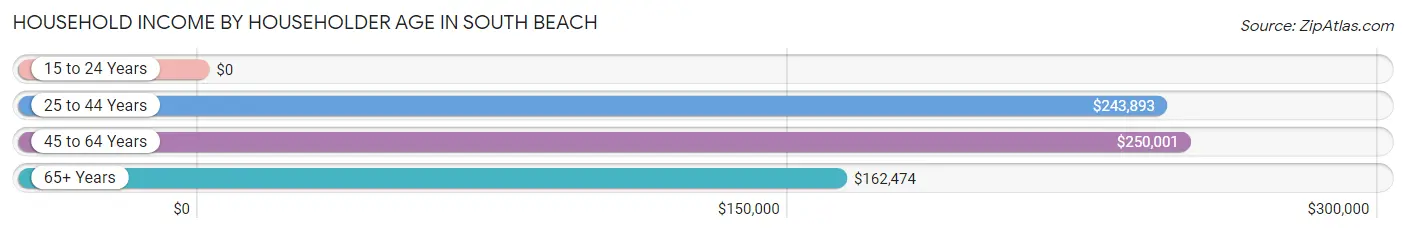
| Income Bracket | # Households | Median Income |
| 15 to 24 Years | 4 (0.3%) | $0 |
| 25 to 44 Years | 67 (4.3%) | $243,893 |
| 45 to 64 Years | 324 (20.8%) | $250,001 |
| 65+ Years | 1,161 (74.6%) | $162,474 |
| Total | 1,556 (100.0%) | $193,281 |
Poverty in South Beach
Income Below Poverty by Sex and Age in South Beach
With 3.0% poverty level for males and 5.4% for females among the residents of South Beach, 55 to 64 year old males and 55 to 64 year old females are the most vulnerable to poverty, with 26 males (27.1%) and 37 females (14.9%) in their respective age groups living below the poverty level.
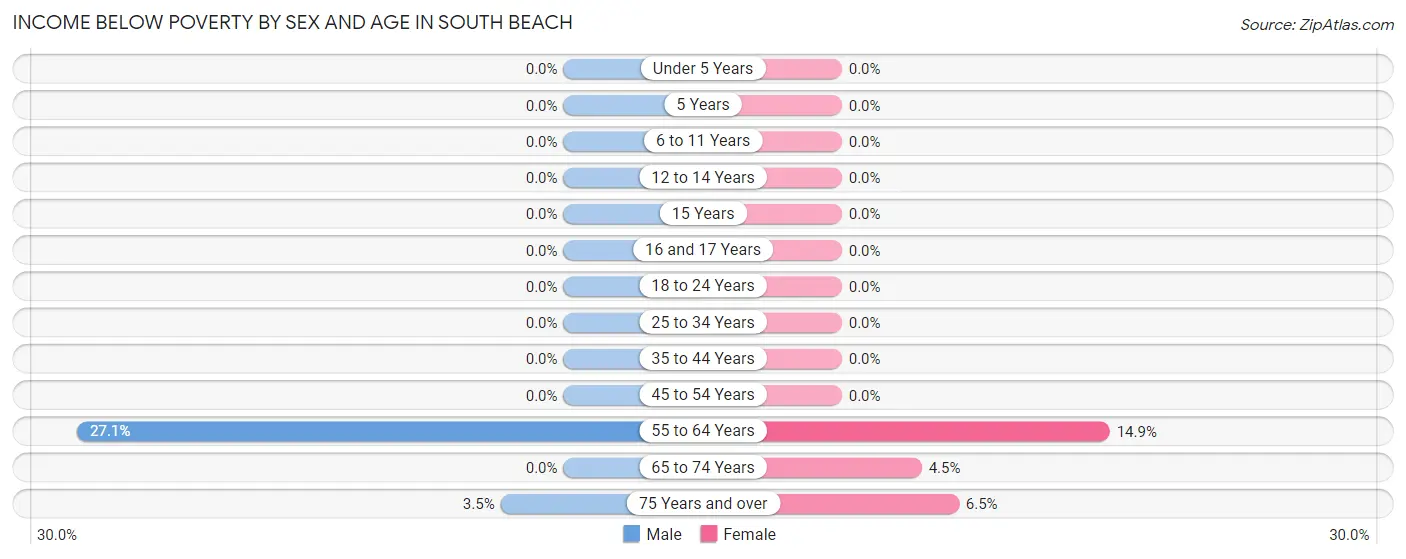
| Age Bracket | Male | Female |
| Under 5 Years | 0 (0.0%) | 0 (0.0%) |
| 5 Years | 0 (0.0%) | 0 (0.0%) |
| 6 to 11 Years | 0 (0.0%) | 0 (0.0%) |
| 12 to 14 Years | 0 (0.0%) | 0 (0.0%) |
| 15 Years | 0 (0.0%) | 0 (0.0%) |
| 16 and 17 Years | 0 (0.0%) | 0 (0.0%) |
| 18 to 24 Years | 0 (0.0%) | 0 (0.0%) |
| 25 to 34 Years | 0 (0.0%) | 0 (0.0%) |
| 35 to 44 Years | 0 (0.0%) | 0 (0.0%) |
| 45 to 54 Years | 0 (0.0%) | 0 (0.0%) |
| 55 to 64 Years | 26 (27.1%) | 37 (14.9%) |
| 65 to 74 Years | 0 (0.0%) | 23 (4.4%) |
| 75 Years and over | 18 (3.5%) | 29 (6.5%) |
| Total | 44 (3.0%) | 89 (5.4%) |
Income Above Poverty by Sex and Age in South Beach
According to the poverty statistics in South Beach, males aged 6 to 11 years and females aged under 5 years are the age groups that are most secure financially, with 100.0% of males and 100.0% of females in these age groups living above the poverty line.
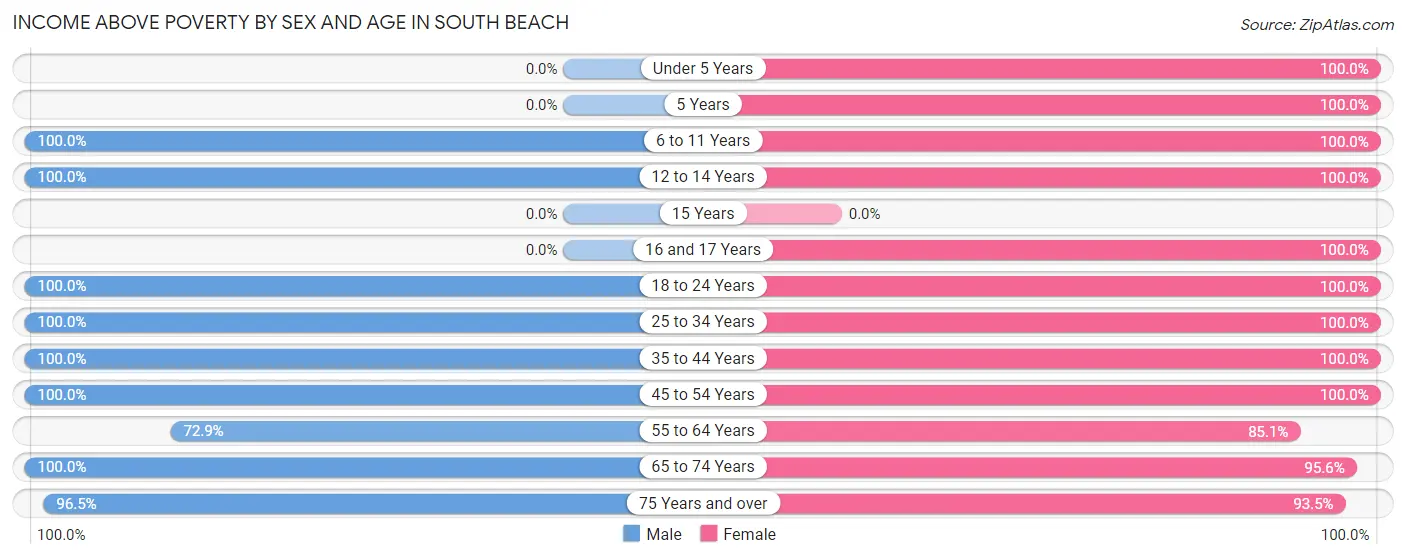
| Age Bracket | Male | Female |
| Under 5 Years | 0 (0.0%) | 22 (100.0%) |
| 5 Years | 0 (0.0%) | 12 (100.0%) |
| 6 to 11 Years | 65 (100.0%) | 58 (100.0%) |
| 12 to 14 Years | 32 (100.0%) | 31 (100.0%) |
| 15 Years | 0 (0.0%) | 0 (0.0%) |
| 16 and 17 Years | 0 (0.0%) | 14 (100.0%) |
| 18 to 24 Years | 17 (100.0%) | 4 (100.0%) |
| 25 to 34 Years | 4 (100.0%) | 15 (100.0%) |
| 35 to 44 Years | 58 (100.0%) | 58 (100.0%) |
| 45 to 54 Years | 198 (100.0%) | 222 (100.0%) |
| 55 to 64 Years | 70 (72.9%) | 211 (85.1%) |
| 65 to 74 Years | 489 (100.0%) | 494 (95.6%) |
| 75 Years and over | 497 (96.5%) | 416 (93.5%) |
| Total | 1,430 (97.0%) | 1,557 (94.6%) |
Income Below Poverty Among Married-Couple Families in South Beach
The poverty statistics for married-couple families in South Beach show that 3.8% or 44 of the total 1,152 families live below the poverty line. Families with no children have the highest poverty rate of 4.1%, comprising of 44 families. On the other hand, families with 1 or 2 children have the lowest poverty rate of 0.0%, which includes 0 families.
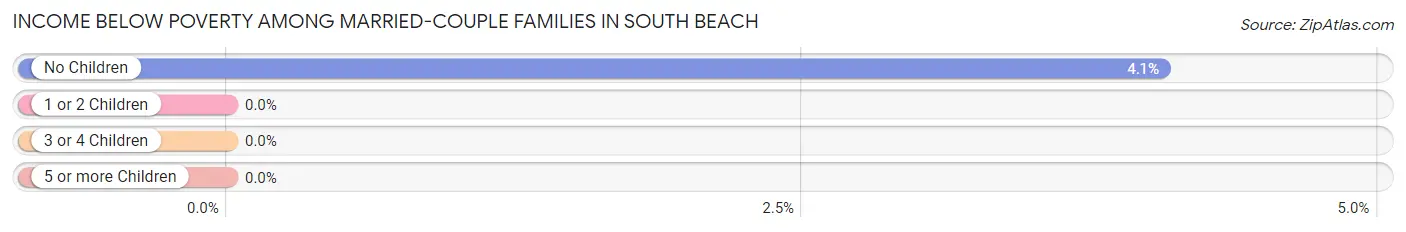
| Children | Above Poverty | Below Poverty |
| No Children | 1,041 (95.9%) | 44 (4.1%) |
| 1 or 2 Children | 23 (100.0%) | 0 (0.0%) |
| 3 or 4 Children | 44 (100.0%) | 0 (0.0%) |
| 5 or more Children | 0 (0.0%) | 0 (0.0%) |
| Total | 1,108 (96.2%) | 44 (3.8%) |
Income Below Poverty Among Single-Parent Households in South Beach
| Children | Single Father | Single Mother |
| No Children | 0 (0.0%) | 0 (0.0%) |
| 1 or 2 Children | 0 (0.0%) | 0 (0.0%) |
| 3 or 4 Children | 0 (0.0%) | 0 (0.0%) |
| 5 or more Children | 0 (0.0%) | 0 (0.0%) |
| Total | 0 (0.0%) | 0 (0.0%) |
Income Below Poverty Among Married-Couple vs Single-Parent Households in South Beach
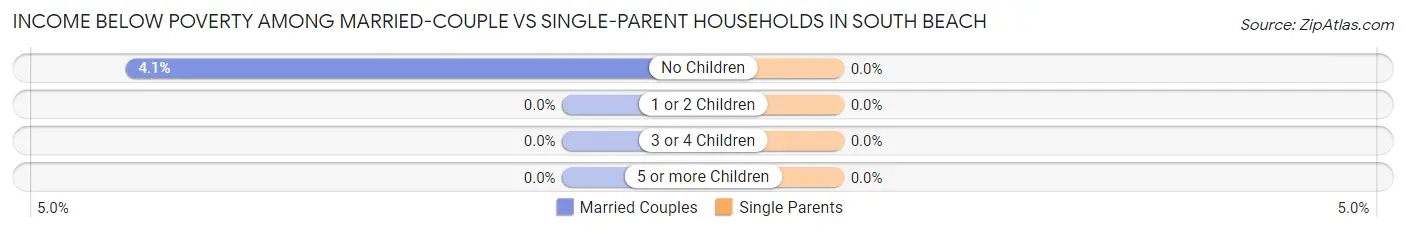
| Children | Married-Couple Families | Single-Parent Households |
| No Children | 44 (4.1%) | 0 (0.0%) |
| 1 or 2 Children | 0 (0.0%) | 0 (0.0%) |
| 3 or 4 Children | 0 (0.0%) | 0 (0.0%) |
| 5 or more Children | 0 (0.0%) | 0 (0.0%) |
| Total | 44 (3.8%) | 0 (0.0%) |
Race in South Beach
The most populous races in South Beach are White / Caucasian (3,080 | 98.7%), Hispanic or Latino (61 | 2.0%), and Two or more Races (22 | 0.7%).
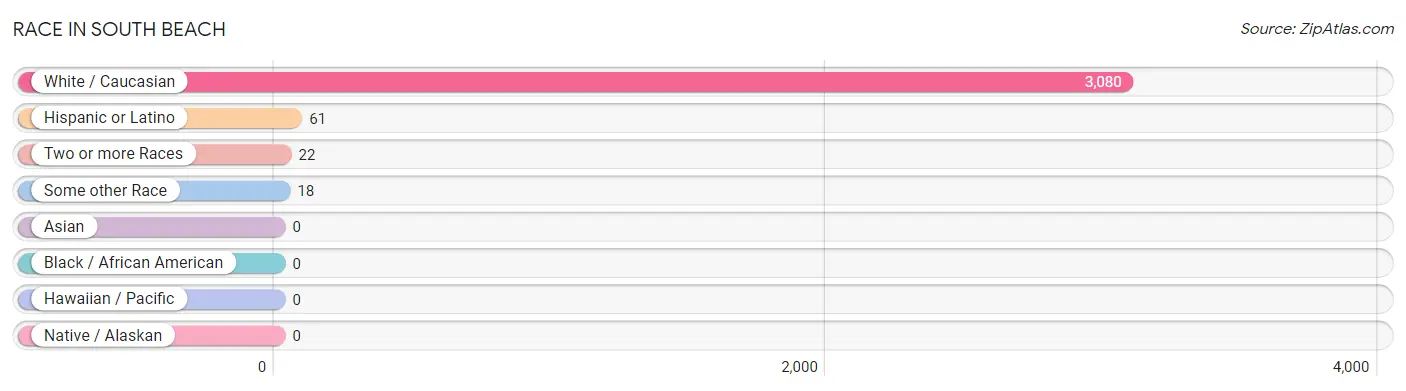
| Race | # Population | % Population |
| Asian | 0 | 0.0% |
| Black / African American | 0 | 0.0% |
| Hawaiian / Pacific | 0 | 0.0% |
| Hispanic or Latino | 61 | 2.0% |
| Native / Alaskan | 0 | 0.0% |
| White / Caucasian | 3,080 | 98.7% |
| Two or more Races | 22 | 0.7% |
| Some other Race | 18 | 0.6% |
| Total | 3,120 | 100.0% |
Ancestry in South Beach
The most populous ancestries reported in South Beach are English (1,101 | 35.3%), Irish (606 | 19.4%), German (455 | 14.6%), Italian (387 | 12.4%), and Scottish (327 | 10.5%), together accounting for 92.2% of all South Beach residents.
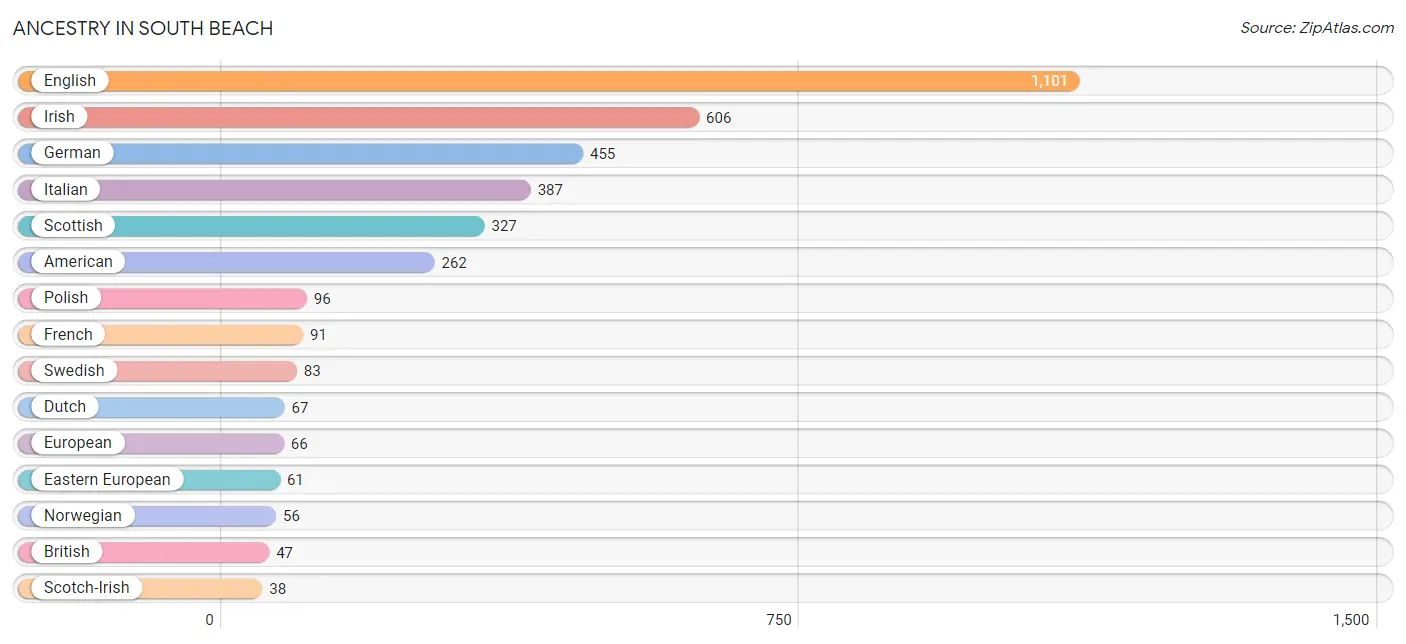
| Ancestry | # Population | % Population |
| American | 262 | 8.4% |
| Armenian | 19 | 0.6% |
| Belgian | 14 | 0.4% |
| British | 47 | 1.5% |
| Central American | 27 | 0.9% |
| Colombian | 30 | 1.0% |
| Creek | 4 | 0.1% |
| Cuban | 4 | 0.1% |
| Czech | 19 | 0.6% |
| Danish | 23 | 0.7% |
| Dutch | 67 | 2.1% |
| Eastern European | 61 | 2.0% |
| English | 1,101 | 35.3% |
| European | 66 | 2.1% |
| French | 91 | 2.9% |
| German | 455 | 14.6% |
| Greek | 14 | 0.4% |
| Indian (Asian) | 4 | 0.1% |
| Iranian | 17 | 0.5% |
| Irish | 606 | 19.4% |
| Italian | 387 | 12.4% |
| Lithuanian | 12 | 0.4% |
| Luxembourger | 9 | 0.3% |
| Nicaraguan | 27 | 0.9% |
| Northern European | 35 | 1.1% |
| Norwegian | 56 | 1.8% |
| Pakistani | 4 | 0.1% |
| Polish | 96 | 3.1% |
| Romanian | 16 | 0.5% |
| Scotch-Irish | 38 | 1.2% |
| Scottish | 327 | 10.5% |
| South American | 30 | 1.0% |
| Swedish | 83 | 2.7% |
| Swiss | 32 | 1.0% |
| Welsh | 34 | 1.1% | View All 35 Rows |
Immigrants in South Beach
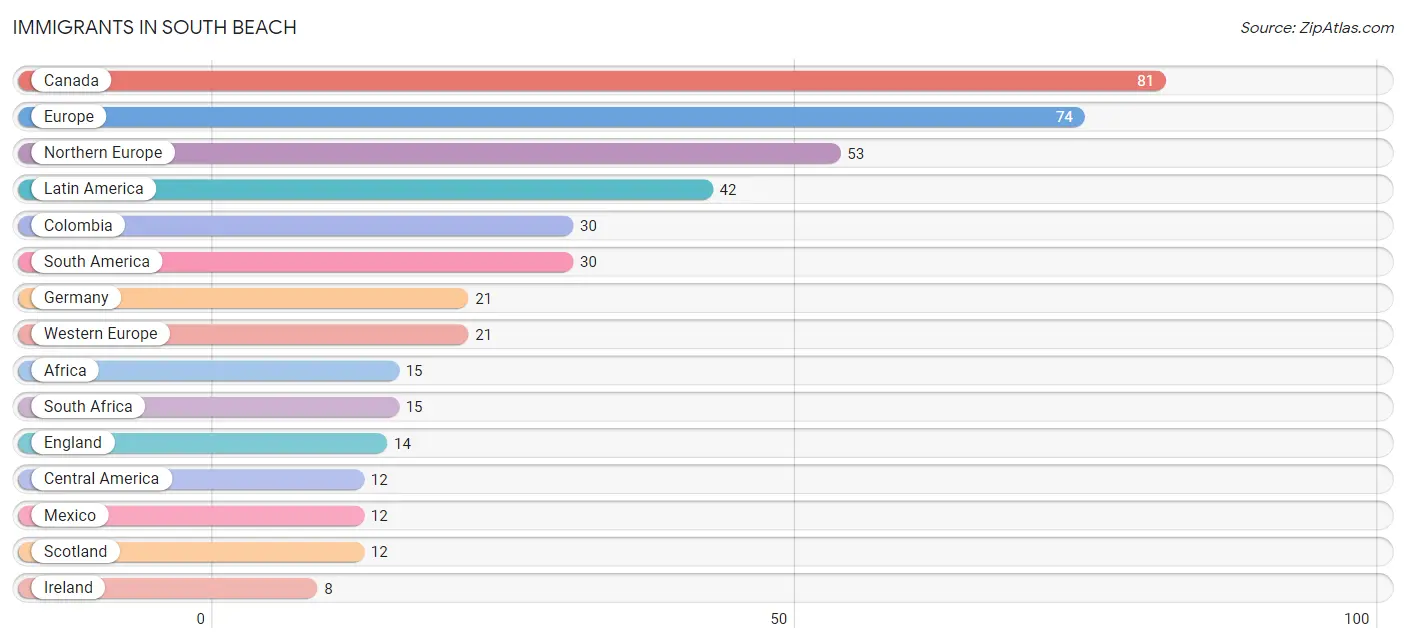
The most numerous immigrant groups reported in South Beach came from Canada (81 | 2.6%), Europe (74 | 2.4%), Northern Europe (53 | 1.7%), Latin America (42 | 1.3%), and Colombia (30 | 1.0%), together accounting for 9.0% of all South Beach residents.
| Immigration Origin | # Population | % Population |
| Africa | 15 | 0.5% |
| Canada | 81 | 2.6% |
| Central America | 12 | 0.4% |
| Colombia | 30 | 1.0% |
| England | 14 | 0.4% |
| Europe | 74 | 2.4% |
| Germany | 21 | 0.7% |
| Ireland | 8 | 0.3% |
| Latin America | 42 | 1.3% |
| Mexico | 12 | 0.4% |
| Northern Europe | 53 | 1.7% |
| Scotland | 12 | 0.4% |
| South Africa | 15 | 0.5% |
| South America | 30 | 1.0% |
| Western Europe | 21 | 0.7% | View All 15 Rows |
Sex and Age in South Beach
Sex and Age in South Beach
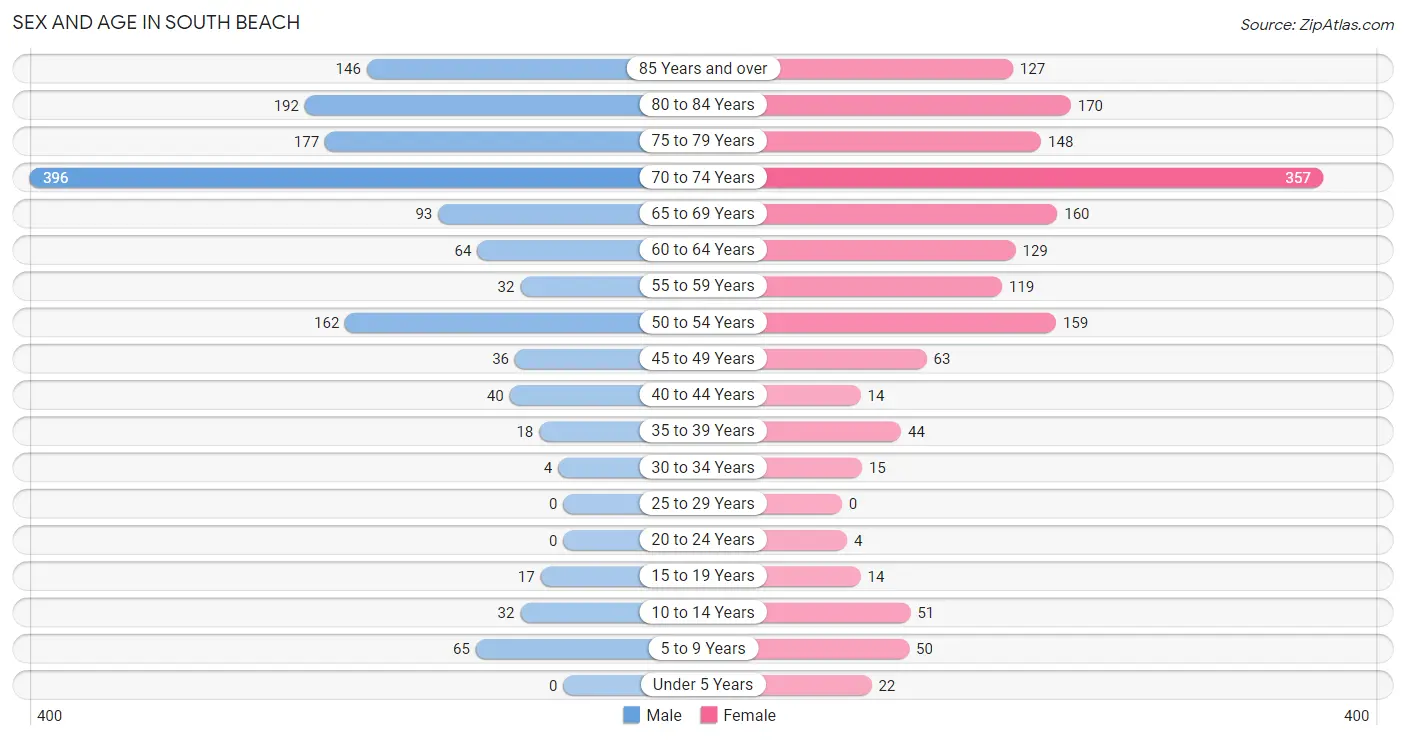
The most populous age groups in South Beach are 70 to 74 Years (396 | 26.9%) for men and 70 to 74 Years (357 | 21.7%) for women.
| Age Bracket | Male | Female |
| Under 5 Years | 0 (0.0%) | 22 (1.3%) |
| 5 to 9 Years | 65 (4.4%) | 50 (3.0%) |
| 10 to 14 Years | 32 (2.2%) | 51 (3.1%) |
| 15 to 19 Years | 17 (1.1%) | 14 (0.9%) |
| 20 to 24 Years | 0 (0.0%) | 4 (0.2%) |
| 25 to 29 Years | 0 (0.0%) | 0 (0.0%) |
| 30 to 34 Years | 4 (0.3%) | 15 (0.9%) |
| 35 to 39 Years | 18 (1.2%) | 44 (2.7%) |
| 40 to 44 Years | 40 (2.7%) | 14 (0.9%) |
| 45 to 49 Years | 36 (2.4%) | 63 (3.8%) |
| 50 to 54 Years | 162 (11.0%) | 159 (9.7%) |
| 55 to 59 Years | 32 (2.2%) | 119 (7.2%) |
| 60 to 64 Years | 64 (4.3%) | 129 (7.8%) |
| 65 to 69 Years | 93 (6.3%) | 160 (9.7%) |
| 70 to 74 Years | 396 (26.9%) | 357 (21.7%) |
| 75 to 79 Years | 177 (12.0%) | 148 (9.0%) |
| 80 to 84 Years | 192 (13.0%) | 170 (10.3%) |
| 85 Years and over | 146 (9.9%) | 127 (7.7%) |
| Total | 1,474 (100.0%) | 1,646 (100.0%) |
Families and Households in South Beach
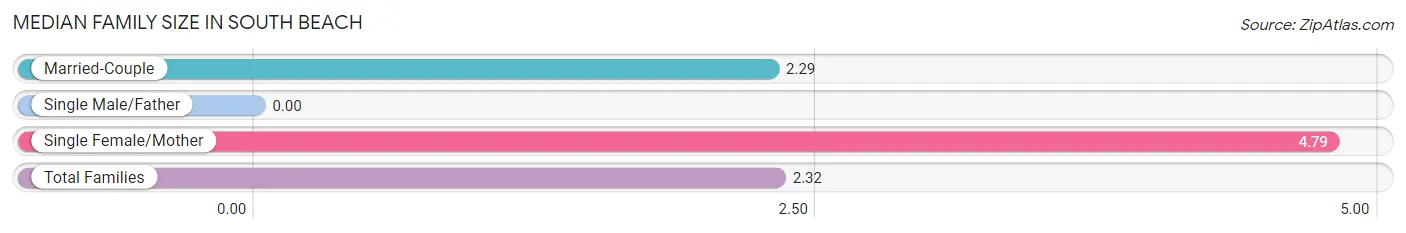
Median Family Size in South Beach
| Family Type | # Families | Family Size |
| Married-Couple | 1,152 (98.8%) | 2.29 |
| Single Male/Father | 0 (0.0%) | - |
| Single Female/Mother | 14 (1.2%) | 4.79 |
| Total Families | 1,166 (100.0%) | 2.32 |
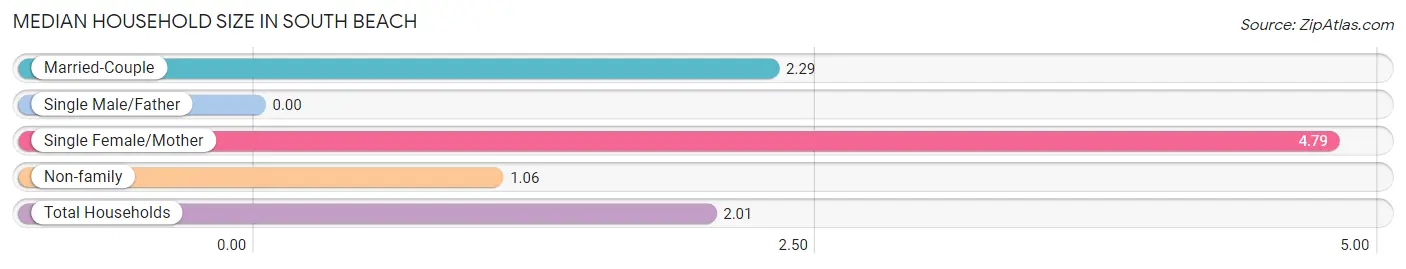
Median Household Size in South Beach
| Household Type | # Households | Household Size |
| Married-Couple | 1,152 (74.0%) | 2.29 |
| Single Male/Father | 0 (0.0%) | - |
| Single Female/Mother | 14 (0.9%) | 4.79 |
| Non-family | 390 (25.1%) | 1.06 |
| Total Households | 1,556 (100.0%) | 2.01 |
Household Size by Marriage Status in South Beach
Out of a total of 1,556 households in South Beach, 1,166 (74.9%) are family households, while 390 (25.1%) are nonfamily households. The most numerous type of family households are 2-person households, comprising 1,072, and the most common type of nonfamily households are 1-person households, comprising 366.
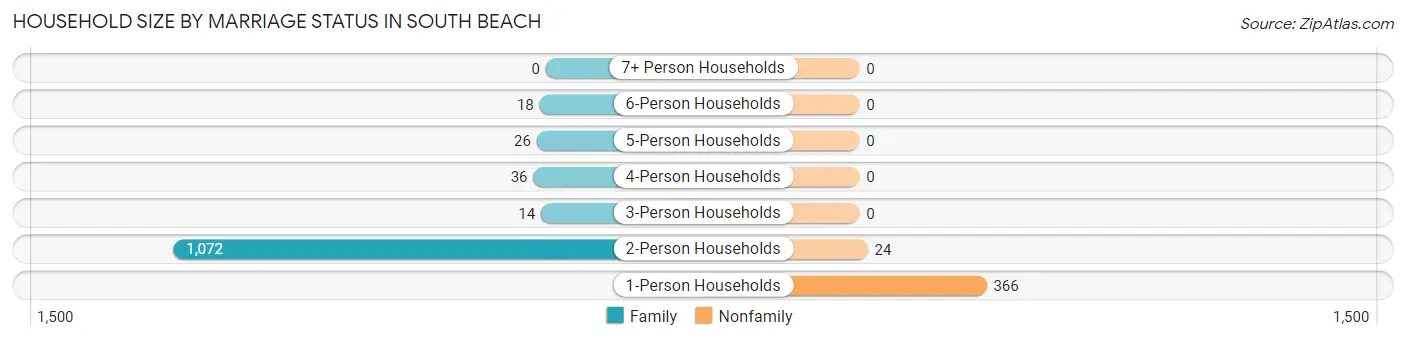
| Household Size | Family Households | Nonfamily Households |
| 1-Person Households | - | 366 (23.5%) |
| 2-Person Households | 1,072 (68.9%) | 24 (1.5%) |
| 3-Person Households | 14 (0.9%) | 0 (0.0%) |
| 4-Person Households | 36 (2.3%) | 0 (0.0%) |
| 5-Person Households | 26 (1.7%) | 0 (0.0%) |
| 6-Person Households | 18 (1.2%) | 0 (0.0%) |
| 7+ Person Households | 0 (0.0%) | 0 (0.0%) |
| Total | 1,166 (74.9%) | 390 (25.1%) |
Female Fertility in South Beach
Fertility by Age in South Beach
| Age Bracket | Women with Births | Births / 1,000 Women |
| 15 to 19 years | 0 (0.0%) | 0.0 |
| 20 to 34 years | 0 (0.0%) | 0.0 |
| 35 to 50 years | 0 (0.0%) | 0.0 |
| Total | 0 (0.0%) | 0.0 |
Fertility by Age by Marriage Status in South Beach
| Age Bracket | Married | Unmarried |
| 15 to 19 years | 0 (0.0%) | 0 (0.0%) |
| 20 to 34 years | 0 (0.0%) | 0 (0.0%) |
| 35 to 50 years | 0 (0.0%) | 0 (0.0%) |
| Total | 0 (0.0%) | 0 (0.0%) |
Fertility by Education in South Beach
| Educational Attainment | Women with Births | Births / 1,000 Women |
| Less than High School | 0 (0.0%) | 0.0 |
| High School Diploma | 0 (0.0%) | 0.0 |
| College or Associate's Degree | 0 (0.0%) | 0.0 |
| Bachelor's Degree | 0 (0.0%) | 0.0 |
| Graduate Degree | 0 (0.0%) | 0.0 |
| Total | 0 (0.0%) | 0.0 |
Fertility by Education by Marriage Status in South Beach
| Educational Attainment | Married | Unmarried |
| Less than High School | 0 (0.0%) | 0 (0.0%) |
| High School Diploma | 0 (0.0%) | 0 (0.0%) |
| College or Associate's Degree | 0 (0.0%) | 0 (0.0%) |
| Bachelor's Degree | 0 (0.0%) | 0 (0.0%) |
| Graduate Degree | 0 (0.0%) | 0 (0.0%) |
| Total | 0 (0.0%) | 0 (0.0%) |
Employment Characteristics in South Beach
Employment by Class of Employer in South Beach
Among the 816 employed individuals in South Beach, private company employees (441 | 54.0%), self-employed (incorporated) (213 | 26.1%), and self-employed (not incorporated) (96 | 11.8%) make up the most common classes of employment.
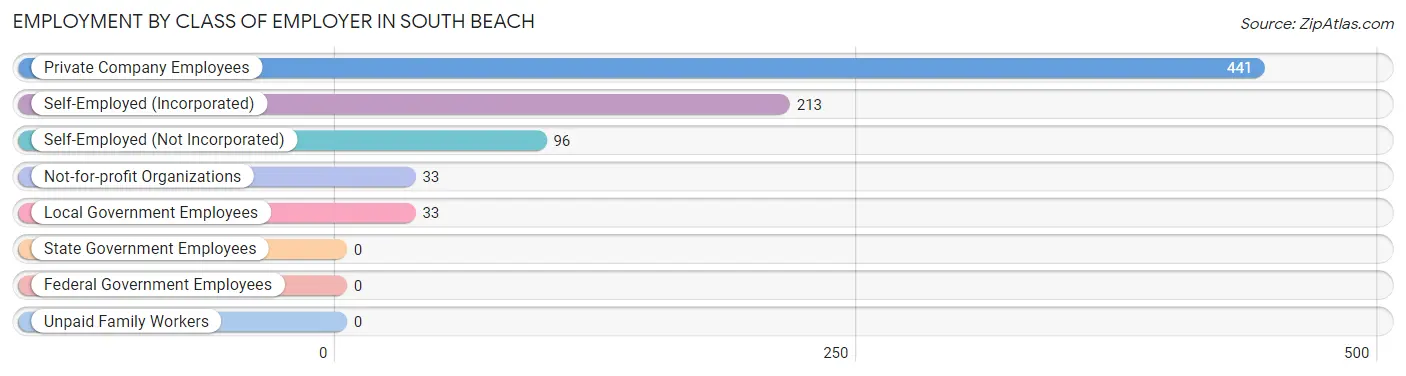
| Employer Class | # Employees | % Employees |
| Private Company Employees | 441 | 54.0% |
| Self-Employed (Incorporated) | 213 | 26.1% |
| Self-Employed (Not Incorporated) | 96 | 11.8% |
| Not-for-profit Organizations | 33 | 4.0% |
| Local Government Employees | 33 | 4.0% |
| State Government Employees | 0 | 0.0% |
| Federal Government Employees | 0 | 0.0% |
| Unpaid Family Workers | 0 | 0.0% |
| Total | 816 | 100.0% |
Employment Status by Age in South Beach
According to the labor force statistics for South Beach, out of the total population over 16 years of age (2,900), 28.9% or 838 individuals are in the labor force, with 1.3% or 11 of them unemployed. The age group with the highest labor force participation rate is 20 to 24 years, with 100.0% or 4 individuals in the labor force. Within the labor force, the 45 to 54 years age range has the highest percentage of unemployed individuals, with 4.2% or 11 of them being unemployed.
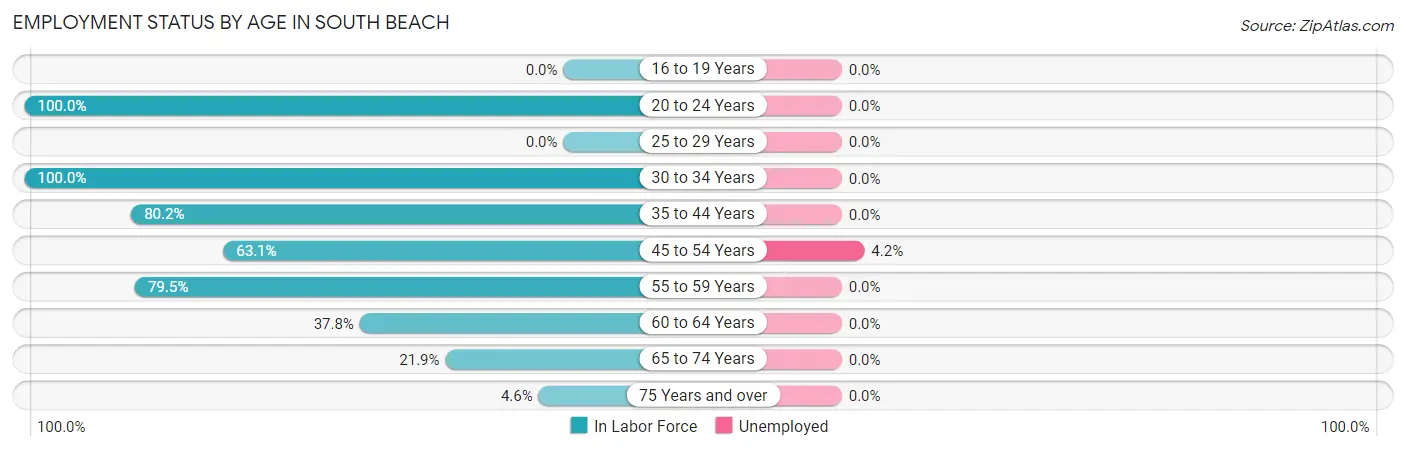
| Age Bracket | In Labor Force | Unemployed |
| 16 to 19 Years | 0 (0.0%) | 0 (0.0%) |
| 20 to 24 Years | 4 (100.0%) | 0 (0.0%) |
| 25 to 29 Years | 0 (0.0%) | 0 (0.0%) |
| 30 to 34 Years | 19 (100.0%) | 0 (0.0%) |
| 35 to 44 Years | 93 (80.2%) | 0 (0.0%) |
| 45 to 54 Years | 265 (63.1%) | 11 (4.2%) |
| 55 to 59 Years | 120 (79.5%) | 0 (0.0%) |
| 60 to 64 Years | 73 (37.8%) | 0 (0.0%) |
| 65 to 74 Years | 220 (21.9%) | 0 (0.0%) |
| 75 Years and over | 44 (4.6%) | 0 (0.0%) |
| Total | 838 (28.9%) | 11 (1.3%) |
Employment Status by Educational Attainment in South Beach
According to labor force statistics for South Beach, 63.4% of individuals (570) out of the total population between 25 and 64 years of age (899) are in the labor force, with 1.9% or 11 of them being unemployed. The group with the highest labor force participation rate are those with the educational attainment of bachelor's degree or higher, with 79.8% or 509 individuals in the labor force. Within the labor force, individuals with college / associate degree education have the highest percentage of unemployment, with 28.2% or 11 of them being unemployed.
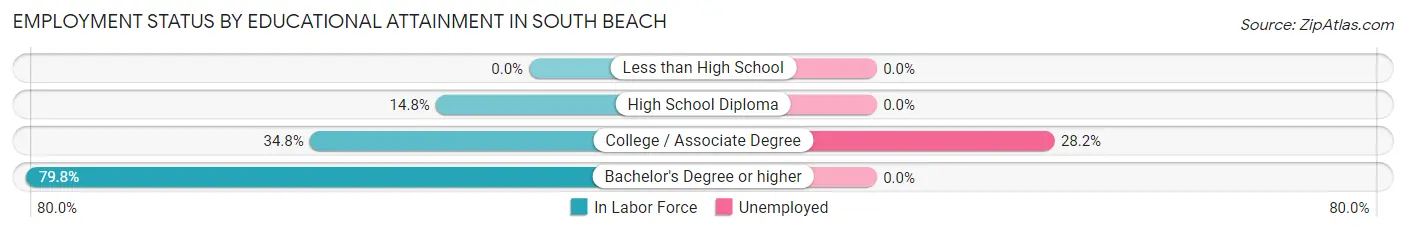
| Educational Attainment | In Labor Force | Unemployed |
| Less than High School | 0 (0.0%) | 0 (0.0%) |
| High School Diploma | 22 (14.8%) | 0 (0.0%) |
| College / Associate Degree | 39 (34.8%) | 32 (28.2%) |
| Bachelor's Degree or higher | 509 (79.8%) | 0 (0.0%) |
| Total | 570 (63.4%) | 17 (1.9%) |
Employment Occupations by Sex in South Beach
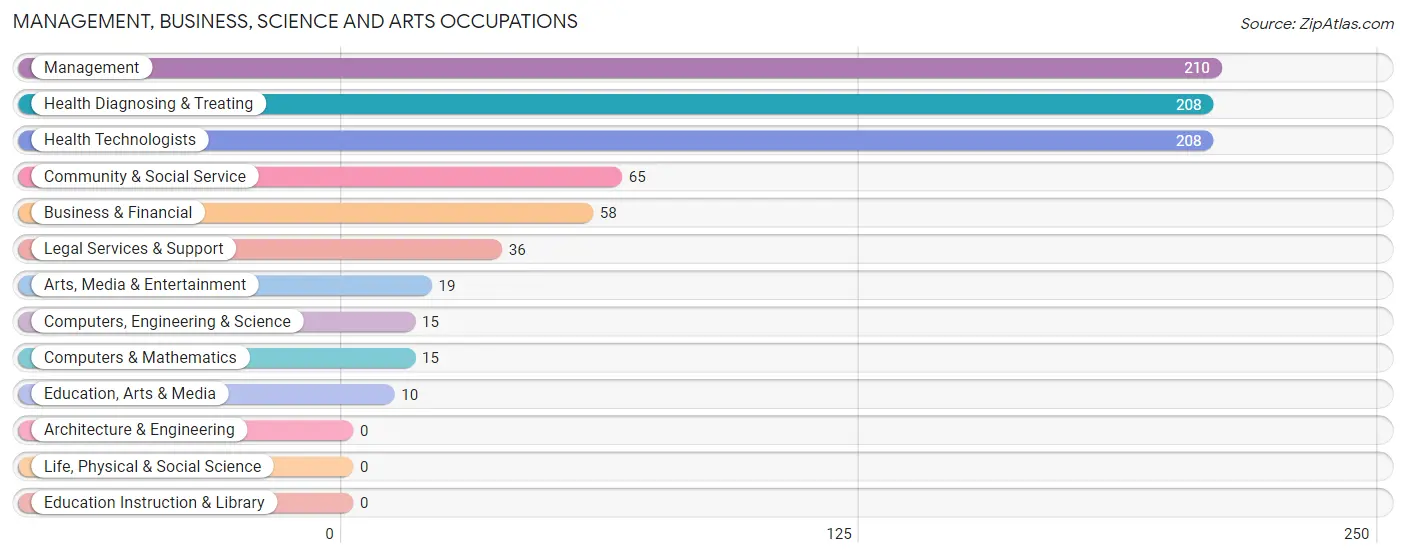
Management, Business, Science and Arts Occupations
The most common Management, Business, Science and Arts occupations in South Beach are Management (210 | 25.4%), Health Diagnosing & Treating (208 | 25.2%), Health Technologists (208 | 25.2%), Community & Social Service (65 | 7.9%), and Business & Financial (58 | 7.0%).
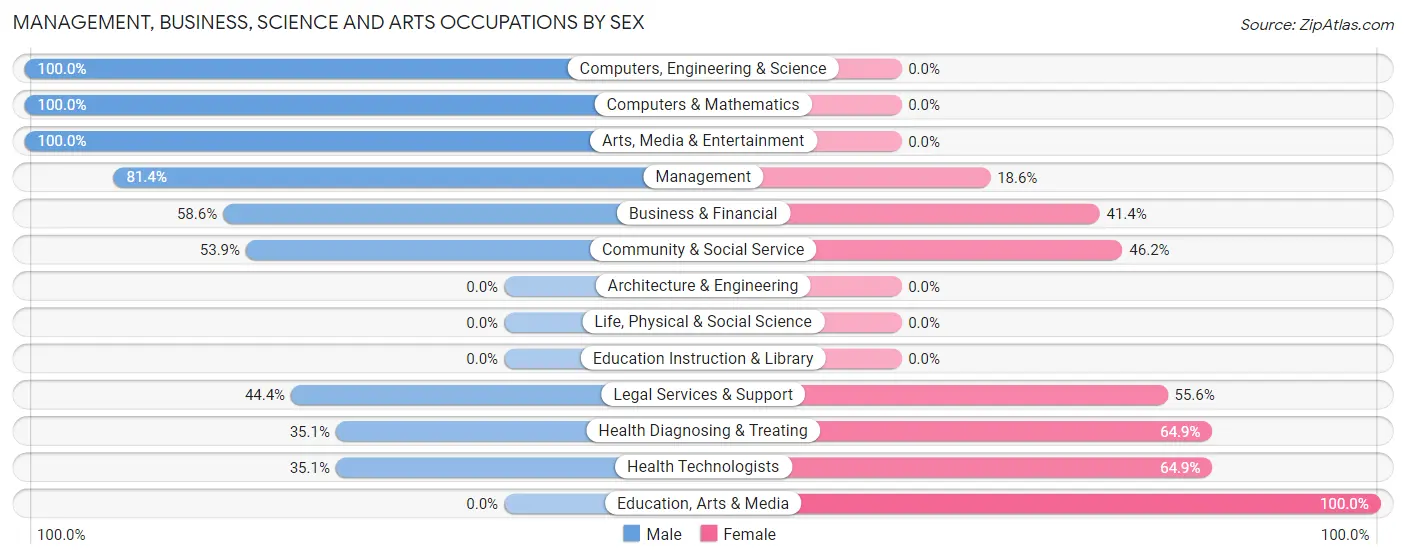
Management, Business, Science and Arts Occupations by Sex
Within the Management, Business, Science and Arts occupations in South Beach, the most male-oriented occupations are Computers, Engineering & Science (100.0%), Computers & Mathematics (100.0%), and Arts, Media & Entertainment (100.0%), while the most female-oriented occupations are Education, Arts & Media (100.0%), Health Diagnosing & Treating (64.9%), and Health Technologists (64.9%).
| Occupation | Male | Female |
| Management | 171 (81.4%) | 39 (18.6%) |
| Business & Financial | 34 (58.6%) | 24 (41.4%) |
| Computers, Engineering & Science | 15 (100.0%) | 0 (0.0%) |
| Computers & Mathematics | 15 (100.0%) | 0 (0.0%) |
| Architecture & Engineering | 0 (0.0%) | 0 (0.0%) |
| Life, Physical & Social Science | 0 (0.0%) | 0 (0.0%) |
| Community & Social Service | 35 (53.8%) | 30 (46.2%) |
| Education, Arts & Media | 0 (0.0%) | 10 (100.0%) |
| Legal Services & Support | 16 (44.4%) | 20 (55.6%) |
| Education Instruction & Library | 0 (0.0%) | 0 (0.0%) |
| Arts, Media & Entertainment | 19 (100.0%) | 0 (0.0%) |
| Health Diagnosing & Treating | 73 (35.1%) | 135 (64.9%) |
| Health Technologists | 73 (35.1%) | 135 (64.9%) |
| Total (Category) | 328 (59.0%) | 228 (41.0%) |
| Total (Overall) | 453 (54.8%) | 374 (45.2%) |
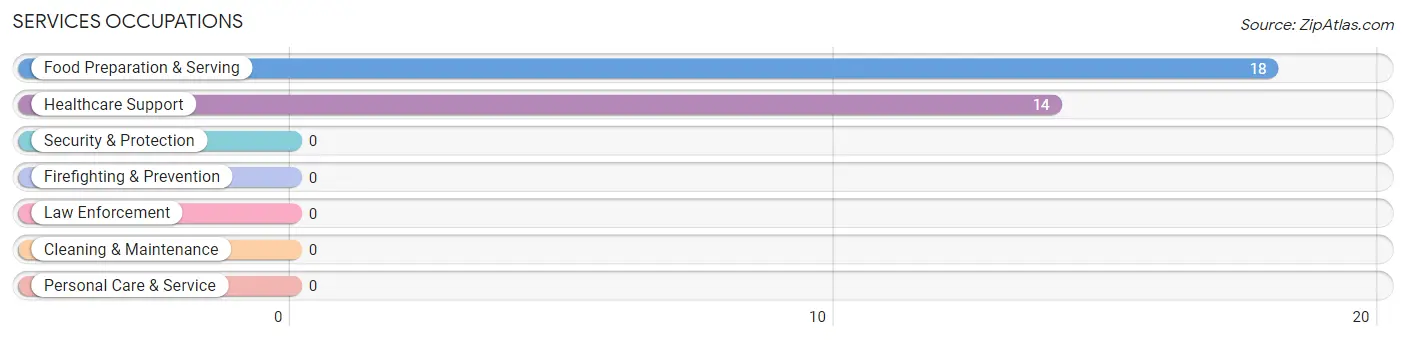
Services Occupations
The most common Services occupations in South Beach are Food Preparation & Serving (18 | 2.2%), and Healthcare Support (14 | 1.7%).
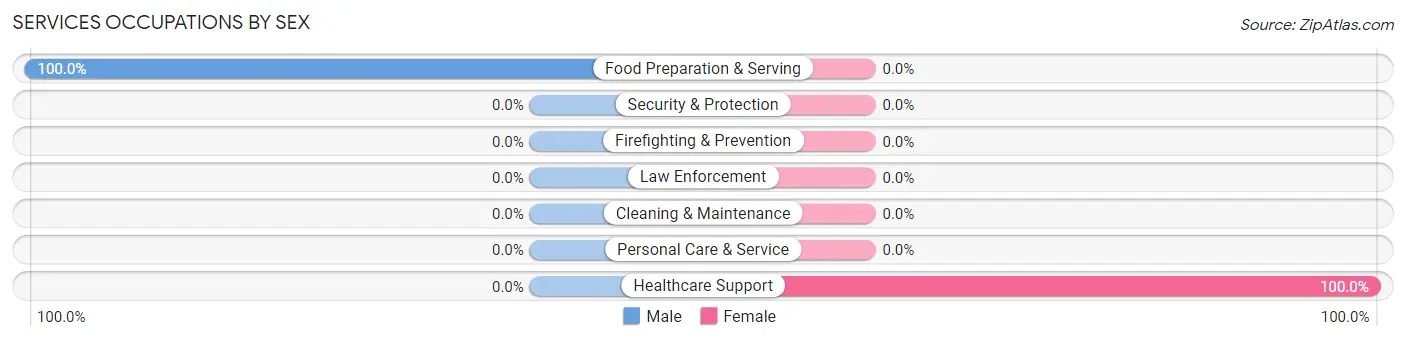
Services Occupations by Sex
| Occupation | Male | Female |
| Healthcare Support | 0 (0.0%) | 14 (100.0%) |
| Security & Protection | 0 (0.0%) | 0 (0.0%) |
| Firefighting & Prevention | 0 (0.0%) | 0 (0.0%) |
| Law Enforcement | 0 (0.0%) | 0 (0.0%) |
| Food Preparation & Serving | 18 (100.0%) | 0 (0.0%) |
| Cleaning & Maintenance | 0 (0.0%) | 0 (0.0%) |
| Personal Care & Service | 0 (0.0%) | 0 (0.0%) |
| Total (Category) | 18 (56.2%) | 14 (43.8%) |
| Total (Overall) | 453 (54.8%) | 374 (45.2%) |
Sales and Office Occupations
The most common Sales and Office occupations in South Beach are Sales & Related (142 | 17.2%), and Office & Administration (58 | 7.0%).
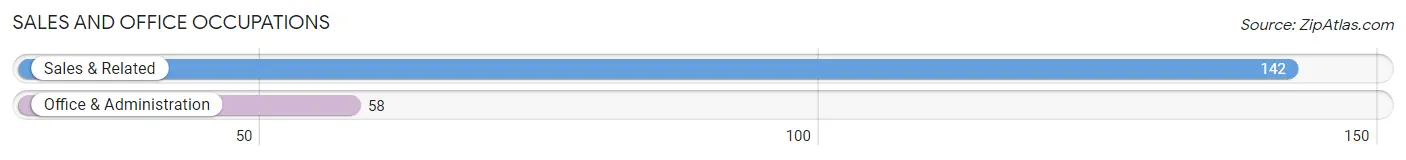
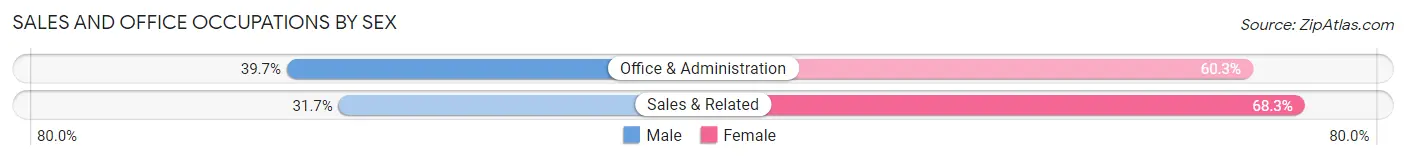
Sales and Office Occupations by Sex
| Occupation | Male | Female |
| Sales & Related | 45 (31.7%) | 97 (68.3%) |
| Office & Administration | 23 (39.7%) | 35 (60.3%) |
| Total (Category) | 68 (34.0%) | 132 (66.0%) |
| Total (Overall) | 453 (54.8%) | 374 (45.2%) |
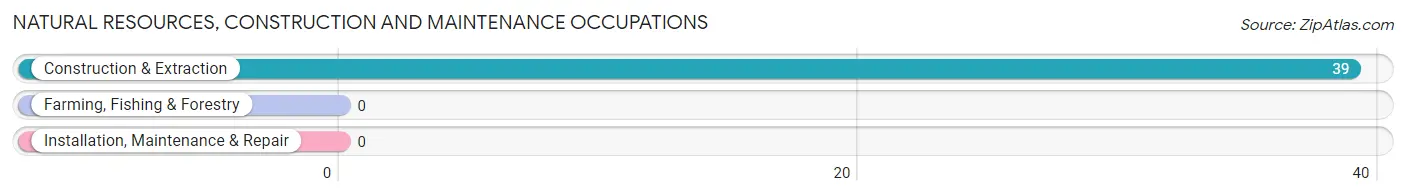
Natural Resources, Construction and Maintenance Occupations
The most common Natural Resources, Construction and Maintenance occupations in South Beach are , and Construction & Extraction (39 | 4.7%).
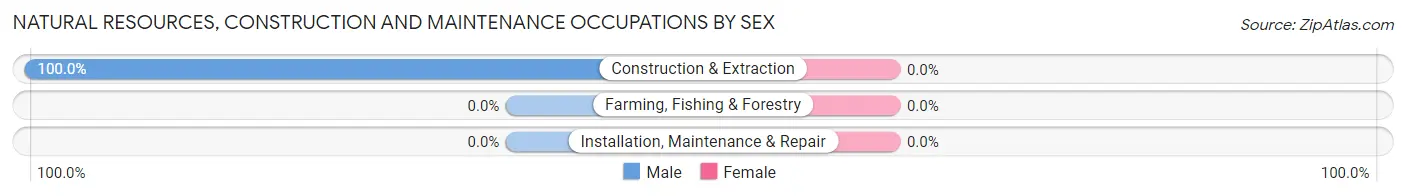
Natural Resources, Construction and Maintenance Occupations by Sex
| Occupation | Male | Female |
| Farming, Fishing & Forestry | 0 (0.0%) | 0 (0.0%) |
| Construction & Extraction | 39 (100.0%) | 0 (0.0%) |
| Installation, Maintenance & Repair | 0 (0.0%) | 0 (0.0%) |
| Total (Category) | 39 (100.0%) | 0 (0.0%) |
| Total (Overall) | 453 (54.8%) | 374 (45.2%) |
Production, Transportation and Moving Occupations
Production, Transportation and Moving Occupations by Sex
| Occupation | Male | Female |
| Production | 0 (0.0%) | 0 (0.0%) |
| Transportation | 0 (0.0%) | 0 (0.0%) |
| Material Moving | 0 (0.0%) | 0 (0.0%) |
| Total (Category) | 0 (0.0%) | 0 (0.0%) |
| Total (Overall) | 453 (54.8%) | 374 (45.2%) |
Employment Industries by Sex in South Beach
Employment Industries in South Beach
The major employment industries in South Beach include Health Care & Social Assistance (238 | 28.8%), Professional & Scientific (163 | 19.7%), Finance & Insurance (137 | 16.6%), Construction (65 | 7.9%), and Retail Trade (55 | 6.7%).
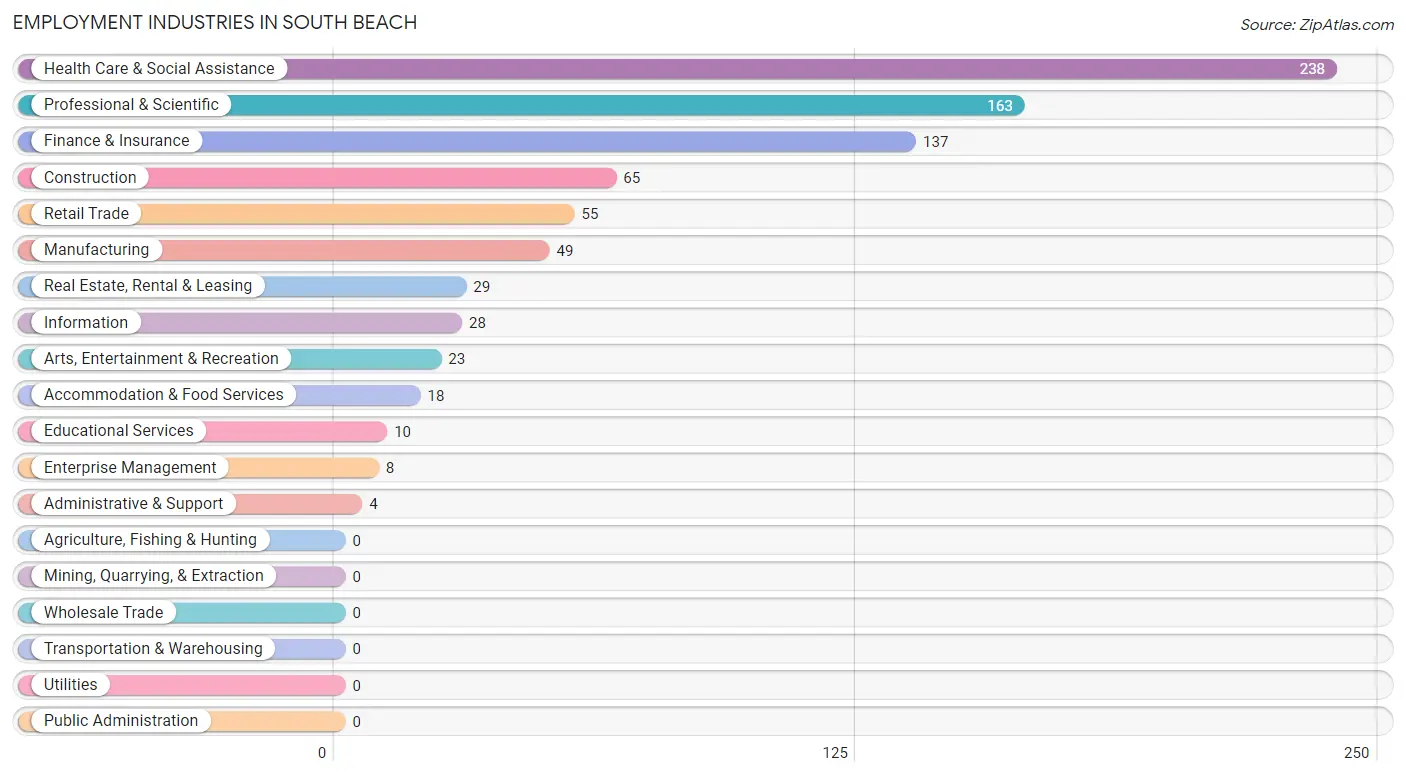
Employment Industries by Sex in South Beach
The South Beach industries that see more men than women are Construction (100.0%), Manufacturing (100.0%), and Information (100.0%), whereas the industries that tend to have a higher number of women are Retail Trade (100.0%), Real Estate, Rental & Leasing (100.0%), and Educational Services (100.0%).
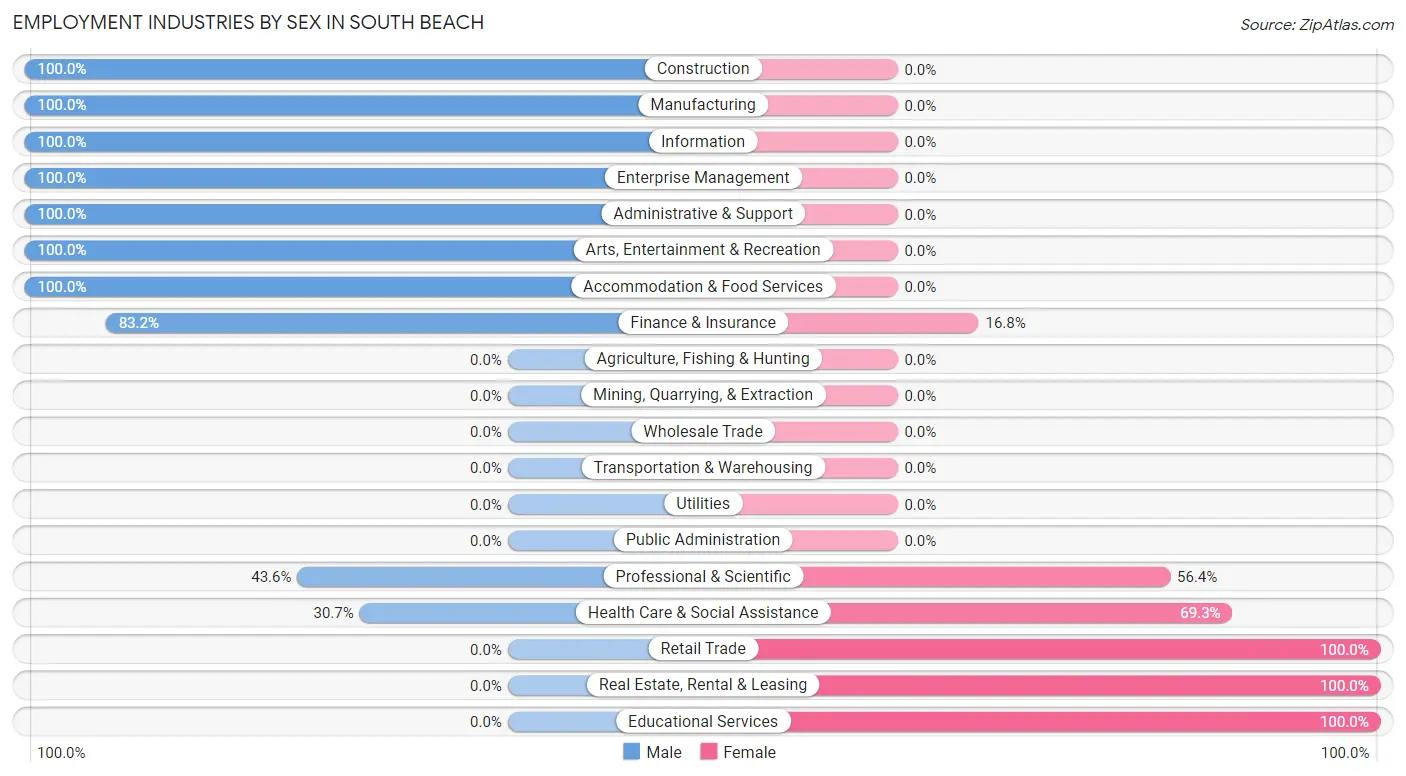
| Industry | Male | Female |
| Agriculture, Fishing & Hunting | 0 (0.0%) | 0 (0.0%) |
| Mining, Quarrying, & Extraction | 0 (0.0%) | 0 (0.0%) |
| Construction | 65 (100.0%) | 0 (0.0%) |
| Manufacturing | 49 (100.0%) | 0 (0.0%) |
| Wholesale Trade | 0 (0.0%) | 0 (0.0%) |
| Retail Trade | 0 (0.0%) | 55 (100.0%) |
| Transportation & Warehousing | 0 (0.0%) | 0 (0.0%) |
| Utilities | 0 (0.0%) | 0 (0.0%) |
| Information | 28 (100.0%) | 0 (0.0%) |
| Finance & Insurance | 114 (83.2%) | 23 (16.8%) |
| Real Estate, Rental & Leasing | 0 (0.0%) | 29 (100.0%) |
| Professional & Scientific | 71 (43.6%) | 92 (56.4%) |
| Enterprise Management | 8 (100.0%) | 0 (0.0%) |
| Administrative & Support | 4 (100.0%) | 0 (0.0%) |
| Educational Services | 0 (0.0%) | 10 (100.0%) |
| Health Care & Social Assistance | 73 (30.7%) | 165 (69.3%) |
| Arts, Entertainment & Recreation | 23 (100.0%) | 0 (0.0%) |
| Accommodation & Food Services | 18 (100.0%) | 0 (0.0%) |
| Public Administration | 0 (0.0%) | 0 (0.0%) |
| Total | 453 (54.8%) | 374 (45.2%) |
Education in South Beach
School Enrollment in South Beach
The most common levels of schooling among the 270 students in South Beach are elementary school (103 | 38.2%), middle school (63 | 23.3%), and nursery / preschool (34 | 12.6%).
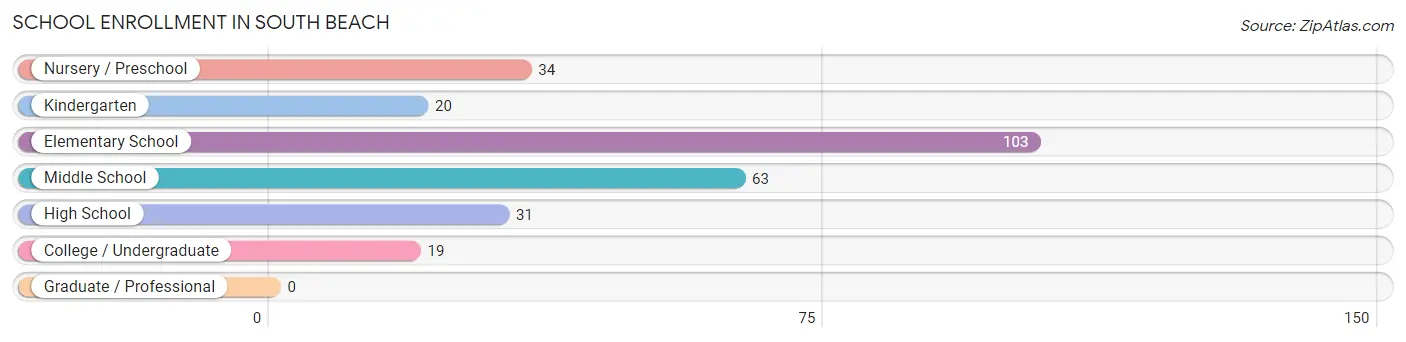
| School Level | # Students | % Students |
| Nursery / Preschool | 34 | 12.6% |
| Kindergarten | 20 | 7.4% |
| Elementary School | 103 | 38.2% |
| Middle School | 63 | 23.3% |
| High School | 31 | 11.5% |
| College / Undergraduate | 19 | 7.0% |
| Graduate / Professional | 0 | 0.0% |
| Total | 270 | 100.0% |
School Enrollment by Age by Funding Source in South Beach
Out of a total of 270 students who are enrolled in schools in South Beach, 58 (21.5%) attend a private institution, while the remaining 212 (78.5%) are enrolled in public schools. The age group of 35 years and over has the highest likelihood of being enrolled in private schools, with 15 (100.0% in the age bracket) enrolled. Conversely, the age group of 3 to 4 year olds has the lowest likelihood of being enrolled in a private school, with 22 (100.0% in the age bracket) attending a public institution.
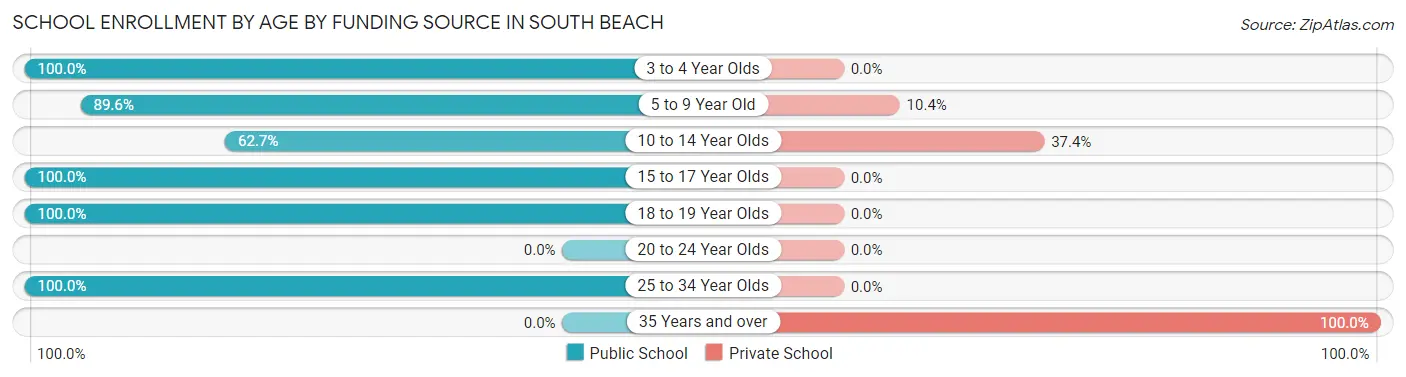
| Age Bracket | Public School | Private School |
| 3 to 4 Year Olds | 22 (100.0%) | 0 (0.0%) |
| 5 to 9 Year Old | 103 (89.6%) | 12 (10.4%) |
| 10 to 14 Year Olds | 52 (62.6%) | 31 (37.3%) |
| 15 to 17 Year Olds | 14 (100.0%) | 0 (0.0%) |
| 18 to 19 Year Olds | 17 (100.0%) | 0 (0.0%) |
| 20 to 24 Year Olds | 0 (0.0%) | 0 (0.0%) |
| 25 to 34 Year Olds | 4 (100.0%) | 0 (0.0%) |
| 35 Years and over | 0 (0.0%) | 15 (100.0%) |
| Total | 212 (78.5%) | 58 (21.5%) |
Educational Attainment by Field of Study in South Beach
Business (618 | 27.8%), social sciences (275 | 12.4%), science & technology (199 | 9.0%), visual & performing arts (173 | 7.8%), and liberal arts & history (165 | 7.4%) are the most common fields of study among 2,221 individuals in South Beach who have obtained a bachelor's degree or higher.
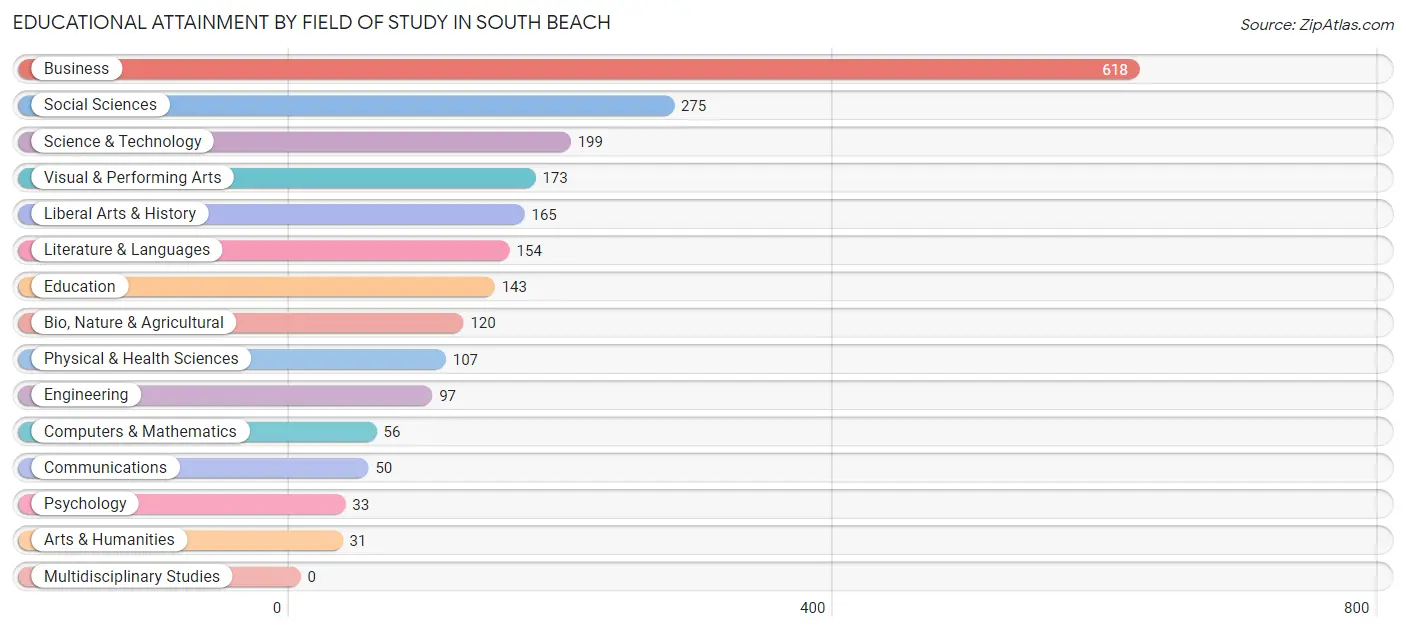
| Field of Study | # Graduates | % Graduates |
| Computers & Mathematics | 56 | 2.5% |
| Bio, Nature & Agricultural | 120 | 5.4% |
| Physical & Health Sciences | 107 | 4.8% |
| Psychology | 33 | 1.5% |
| Social Sciences | 275 | 12.4% |
| Engineering | 97 | 4.4% |
| Multidisciplinary Studies | 0 | 0.0% |
| Science & Technology | 199 | 9.0% |
| Business | 618 | 27.8% |
| Education | 143 | 6.4% |
| Literature & Languages | 154 | 6.9% |
| Liberal Arts & History | 165 | 7.4% |
| Visual & Performing Arts | 173 | 7.8% |
| Communications | 50 | 2.2% |
| Arts & Humanities | 31 | 1.4% |
| Total | 2,221 | 100.0% |
Transportation & Commute in South Beach
Vehicle Availability by Sex in South Beach
The most prevalent vehicle ownership categories in South Beach are males with 2 vehicles (252, accounting for 57.0%) and females with 2 vehicles (229, making up 67.4%).
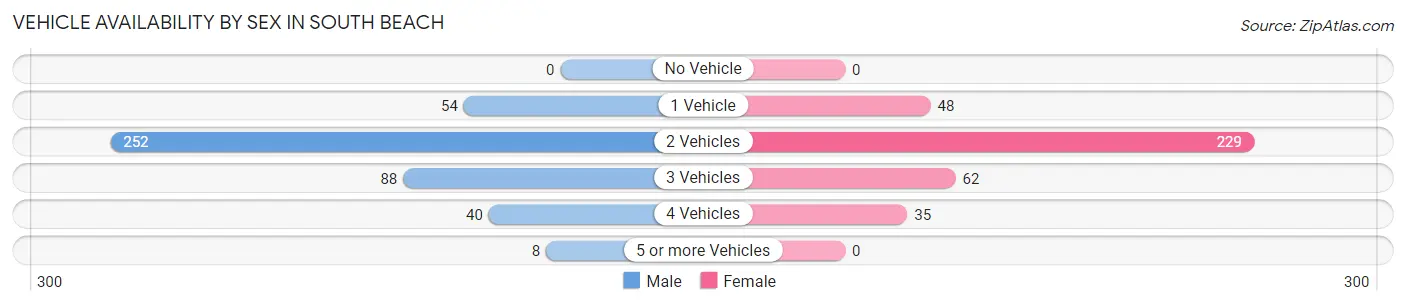
| Vehicles Available | Male | Female |
| No Vehicle | 0 (0.0%) | 0 (0.0%) |
| 1 Vehicle | 54 (12.2%) | 48 (12.8%) |
| 2 Vehicles | 252 (57.0%) | 229 (61.2%) |
| 3 Vehicles | 88 (19.9%) | 62 (16.6%) |
| 4 Vehicles | 40 (9.0%) | 35 (9.4%) |
| 5 or more Vehicles | 8 (1.8%) | 0 (0.0%) |
| Total | 442 (100.0%) | 374 (100.0%) |
Commute Time in South Beach
The most frequently occuring commute durations in South Beach are 20 to 24 minutes (170 commuters, 34.9%), 5 to 9 minutes (66 commuters, 13.6%), and 10 to 14 minutes (56 commuters, 11.5%).
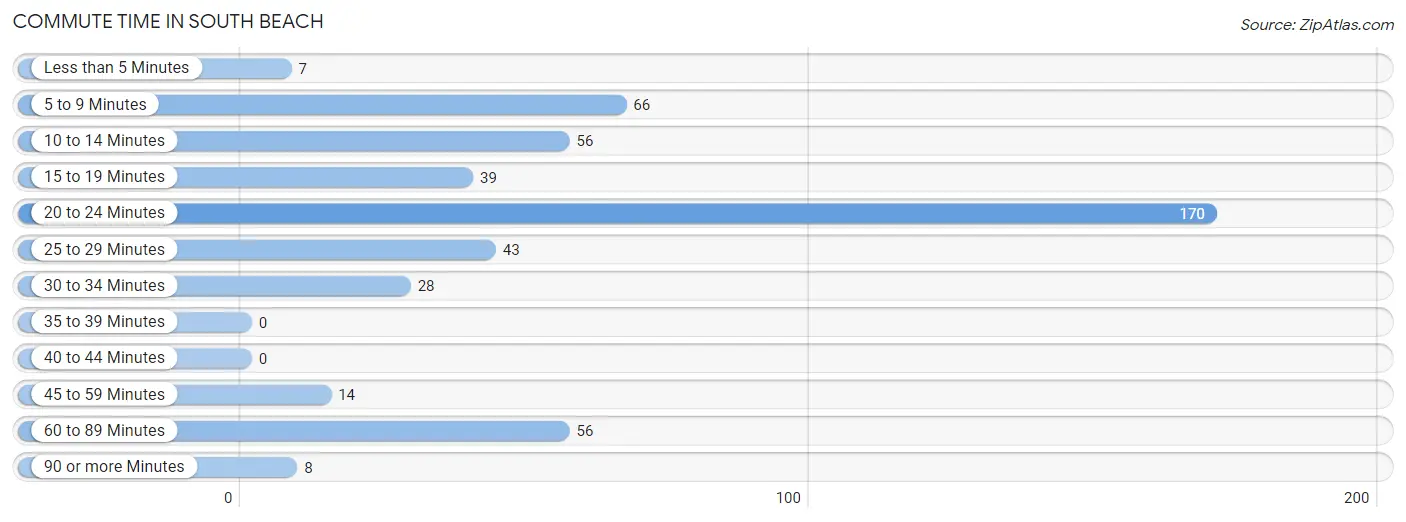
| Commute Time | # Commuters | % Commuters |
| Less than 5 Minutes | 7 | 1.4% |
| 5 to 9 Minutes | 66 | 13.6% |
| 10 to 14 Minutes | 56 | 11.5% |
| 15 to 19 Minutes | 39 | 8.0% |
| 20 to 24 Minutes | 170 | 34.9% |
| 25 to 29 Minutes | 43 | 8.8% |
| 30 to 34 Minutes | 28 | 5.8% |
| 35 to 39 Minutes | 0 | 0.0% |
| 40 to 44 Minutes | 0 | 0.0% |
| 45 to 59 Minutes | 14 | 2.9% |
| 60 to 89 Minutes | 56 | 11.5% |
| 90 or more Minutes | 8 | 1.6% |
Commute Time by Sex in South Beach
The most common commute times in South Beach are 20 to 24 minutes (82 commuters, 32.8%) for males and 20 to 24 minutes (88 commuters, 37.1%) for females.
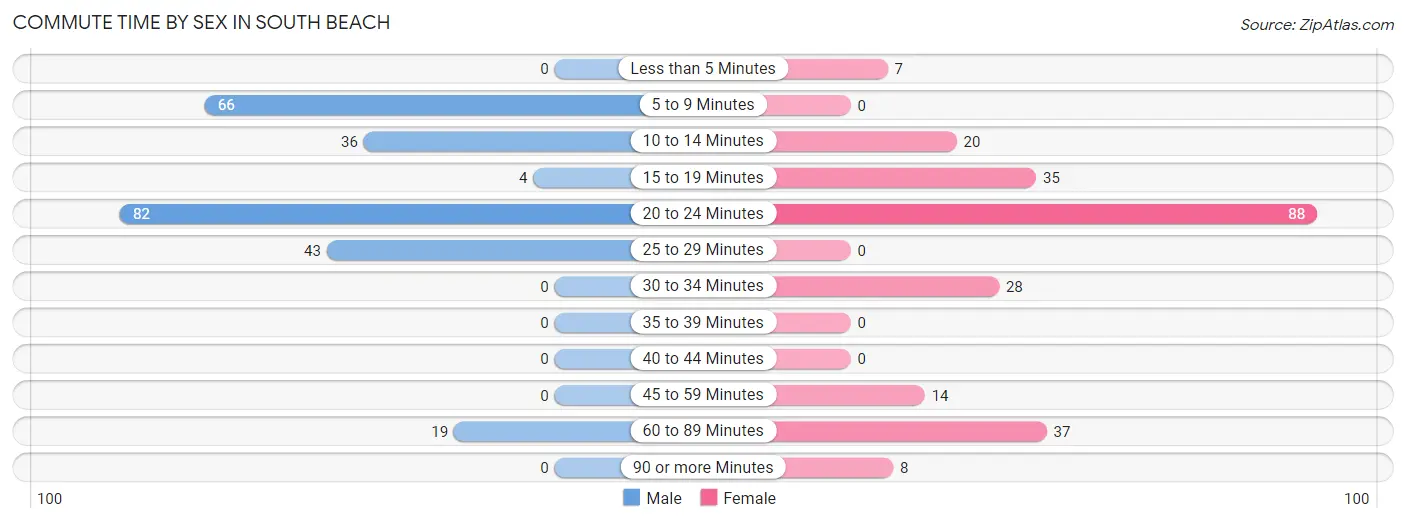
| Commute Time | Male | Female |
| Less than 5 Minutes | 0 (0.0%) | 7 (2.9%) |
| 5 to 9 Minutes | 66 (26.4%) | 0 (0.0%) |
| 10 to 14 Minutes | 36 (14.4%) | 20 (8.4%) |
| 15 to 19 Minutes | 4 (1.6%) | 35 (14.8%) |
| 20 to 24 Minutes | 82 (32.8%) | 88 (37.1%) |
| 25 to 29 Minutes | 43 (17.2%) | 0 (0.0%) |
| 30 to 34 Minutes | 0 (0.0%) | 28 (11.8%) |
| 35 to 39 Minutes | 0 (0.0%) | 0 (0.0%) |
| 40 to 44 Minutes | 0 (0.0%) | 0 (0.0%) |
| 45 to 59 Minutes | 0 (0.0%) | 14 (5.9%) |
| 60 to 89 Minutes | 19 (7.6%) | 37 (15.6%) |
| 90 or more Minutes | 0 (0.0%) | 8 (3.4%) |
Time of Departure to Work by Sex in South Beach
The most frequent times of departure to work in South Beach are 8:00 AM to 8:29 AM (139, 55.6%) for males and 7:30 AM to 7:59 AM (89, 37.6%) for females.
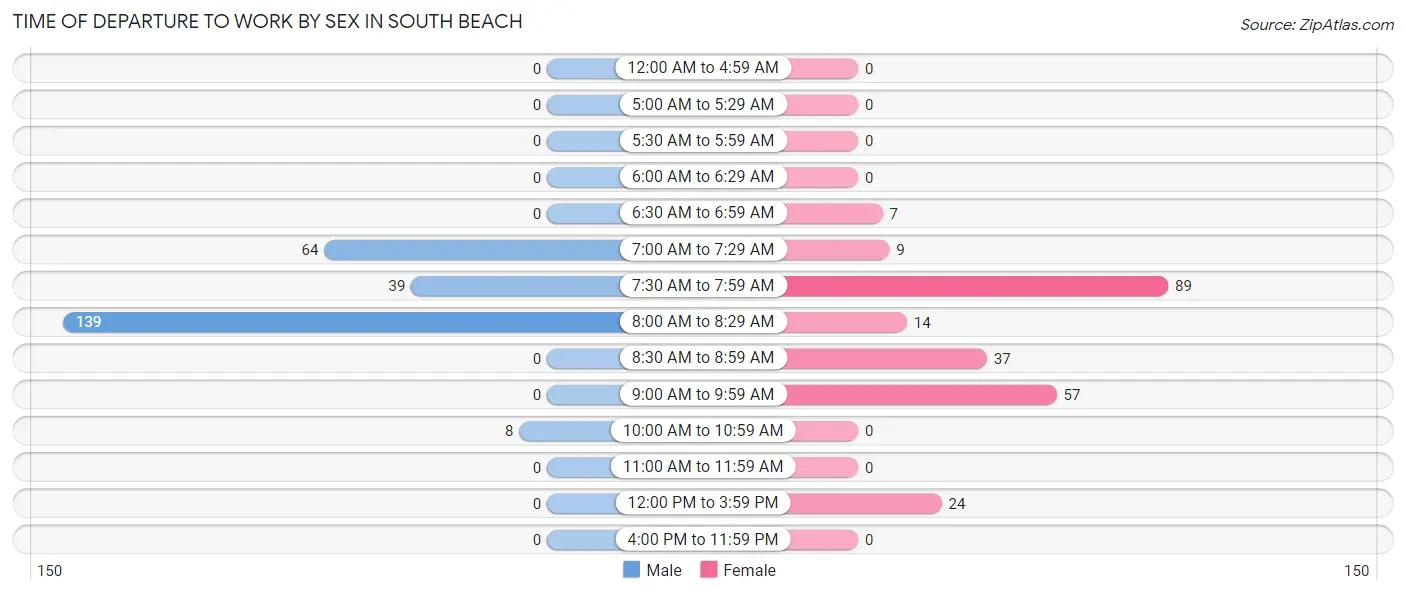
| Time of Departure | Male | Female |
| 12:00 AM to 4:59 AM | 0 (0.0%) | 0 (0.0%) |
| 5:00 AM to 5:29 AM | 0 (0.0%) | 0 (0.0%) |
| 5:30 AM to 5:59 AM | 0 (0.0%) | 0 (0.0%) |
| 6:00 AM to 6:29 AM | 0 (0.0%) | 0 (0.0%) |
| 6:30 AM to 6:59 AM | 0 (0.0%) | 7 (2.9%) |
| 7:00 AM to 7:29 AM | 64 (25.6%) | 9 (3.8%) |
| 7:30 AM to 7:59 AM | 39 (15.6%) | 89 (37.6%) |
| 8:00 AM to 8:29 AM | 139 (55.6%) | 14 (5.9%) |
| 8:30 AM to 8:59 AM | 0 (0.0%) | 37 (15.6%) |
| 9:00 AM to 9:59 AM | 0 (0.0%) | 57 (24.0%) |
| 10:00 AM to 10:59 AM | 8 (3.2%) | 0 (0.0%) |
| 11:00 AM to 11:59 AM | 0 (0.0%) | 0 (0.0%) |
| 12:00 PM to 3:59 PM | 0 (0.0%) | 24 (10.1%) |
| 4:00 PM to 11:59 PM | 0 (0.0%) | 0 (0.0%) |
| Total | 250 (100.0%) | 237 (100.0%) |
Housing Occupancy in South Beach
Occupancy by Ownership in South Beach
Of the total 1,556 dwellings in South Beach, owner-occupied units account for 1,539 (98.9%), while renter-occupied units make up 17 (1.1%).
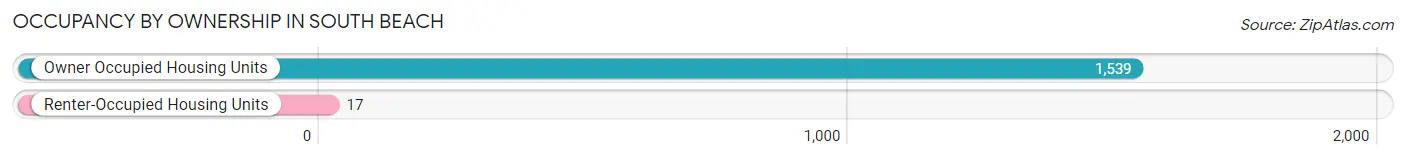
| Occupancy | # Housing Units | % Housing Units |
| Owner Occupied Housing Units | 1,539 | 98.9% |
| Renter-Occupied Housing Units | 17 | 1.1% |
| Total Occupied Housing Units | 1,556 | 100.0% |
Occupancy by Household Size in South Beach
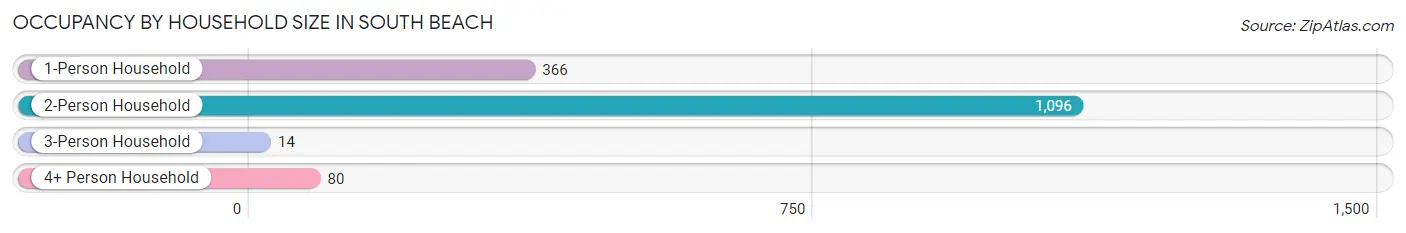
| Household Size | # Housing Units | % Housing Units |
| 1-Person Household | 366 | 23.5% |
| 2-Person Household | 1,096 | 70.4% |
| 3-Person Household | 14 | 0.9% |
| 4+ Person Household | 80 | 5.1% |
| Total Housing Units | 1,556 | 100.0% |
Occupancy by Ownership by Household Size in South Beach
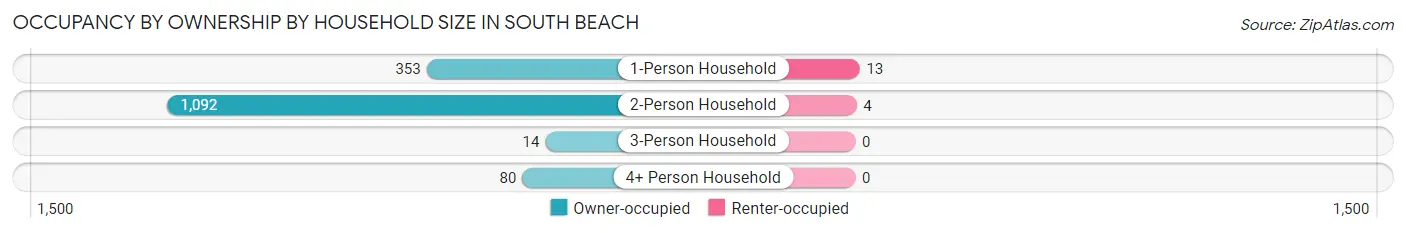
| Household Size | Owner-occupied | Renter-occupied |
| 1-Person Household | 353 (96.5%) | 13 (3.5%) |
| 2-Person Household | 1,092 (99.6%) | 4 (0.4%) |
| 3-Person Household | 14 (100.0%) | 0 (0.0%) |
| 4+ Person Household | 80 (100.0%) | 0 (0.0%) |
| Total Housing Units | 1,539 (98.9%) | 17 (1.1%) |
Occupancy by Educational Attainment in South Beach
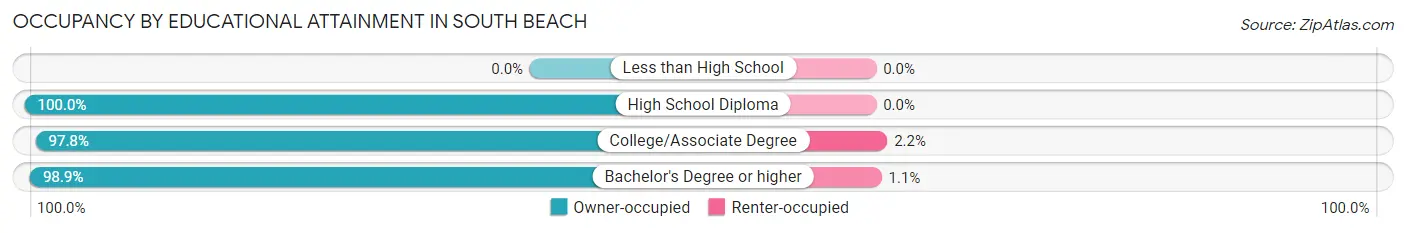
| Household Size | Owner-occupied | Renter-occupied |
| Less than High School | 0 (0.0%) | 0 (0.0%) |
| High School Diploma | 165 (100.0%) | 0 (0.0%) |
| College/Associate Degree | 179 (97.8%) | 4 (2.2%) |
| Bachelor's Degree or higher | 1,195 (98.9%) | 13 (1.1%) |
Occupancy by Age of Householder in South Beach
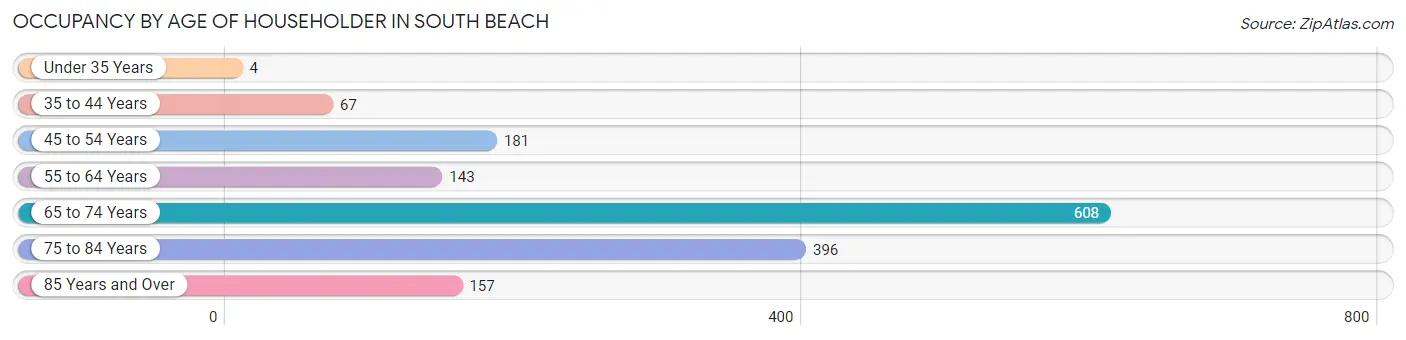
| Age Bracket | # Households | % Households |
| Under 35 Years | 4 | 0.3% |
| 35 to 44 Years | 67 | 4.3% |
| 45 to 54 Years | 181 | 11.6% |
| 55 to 64 Years | 143 | 9.2% |
| 65 to 74 Years | 608 | 39.1% |
| 75 to 84 Years | 396 | 25.5% |
| 85 Years and Over | 157 | 10.1% |
| Total | 1,556 | 100.0% |
Housing Finances in South Beach
Median Income by Occupancy in South Beach
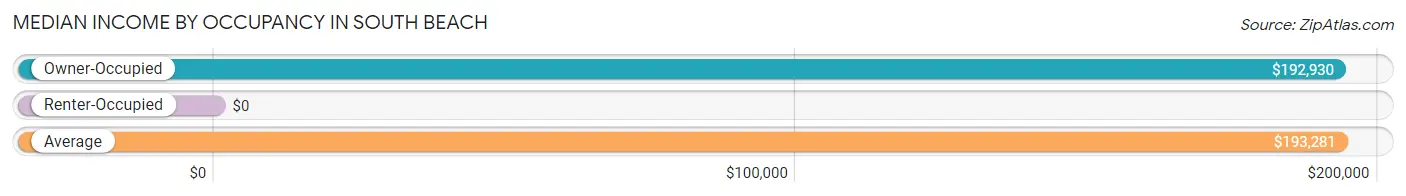
| Occupancy Type | # Households | Median Income |
| Owner-Occupied | 1,539 (98.9%) | $192,930 |
| Renter-Occupied | 17 (1.1%) | $0 |
| Average | 1,556 (100.0%) | $193,281 |
Occupancy by Householder Income Bracket in South Beach
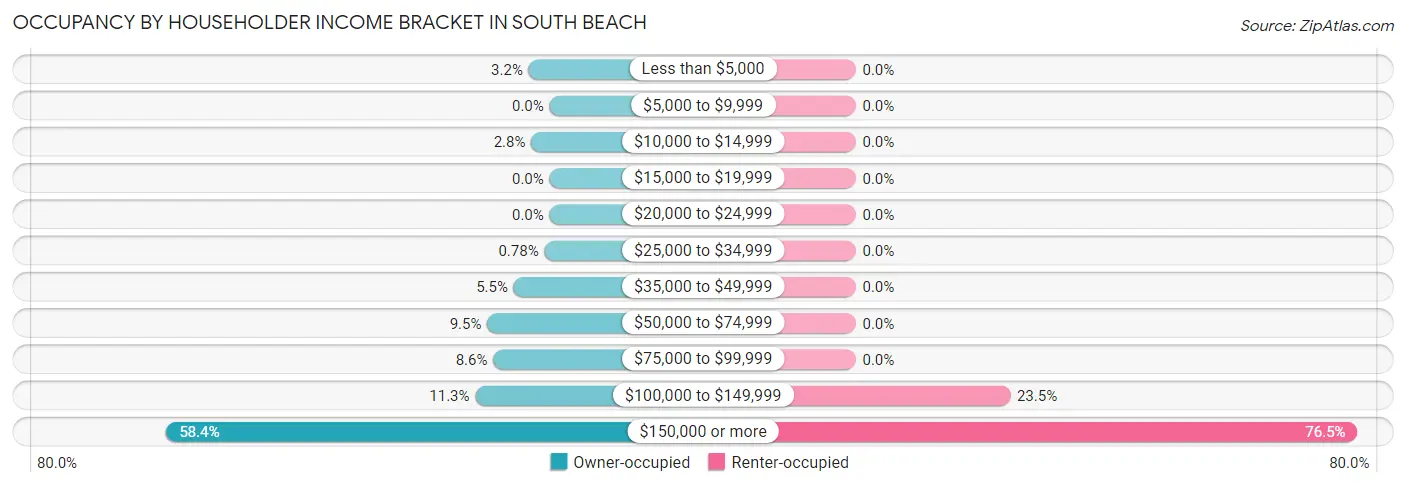
| Income Bracket | Owner-occupied | Renter-occupied |
| Less than $5,000 | 49 (3.2%) | 0 (0.0%) |
| $5,000 to $9,999 | 0 (0.0%) | 0 (0.0%) |
| $10,000 to $14,999 | 43 (2.8%) | 0 (0.0%) |
| $15,000 to $19,999 | 0 (0.0%) | 0 (0.0%) |
| $20,000 to $24,999 | 0 (0.0%) | 0 (0.0%) |
| $25,000 to $34,999 | 12 (0.8%) | 0 (0.0%) |
| $35,000 to $49,999 | 84 (5.5%) | 0 (0.0%) |
| $50,000 to $74,999 | 146 (9.5%) | 0 (0.0%) |
| $75,000 to $99,999 | 132 (8.6%) | 0 (0.0%) |
| $100,000 to $149,999 | 174 (11.3%) | 4 (23.5%) |
| $150,000 or more | 899 (58.4%) | 13 (76.5%) |
| Total | 1,539 (100.0%) | 17 (100.0%) |
Monthly Housing Cost Tiers in South Beach
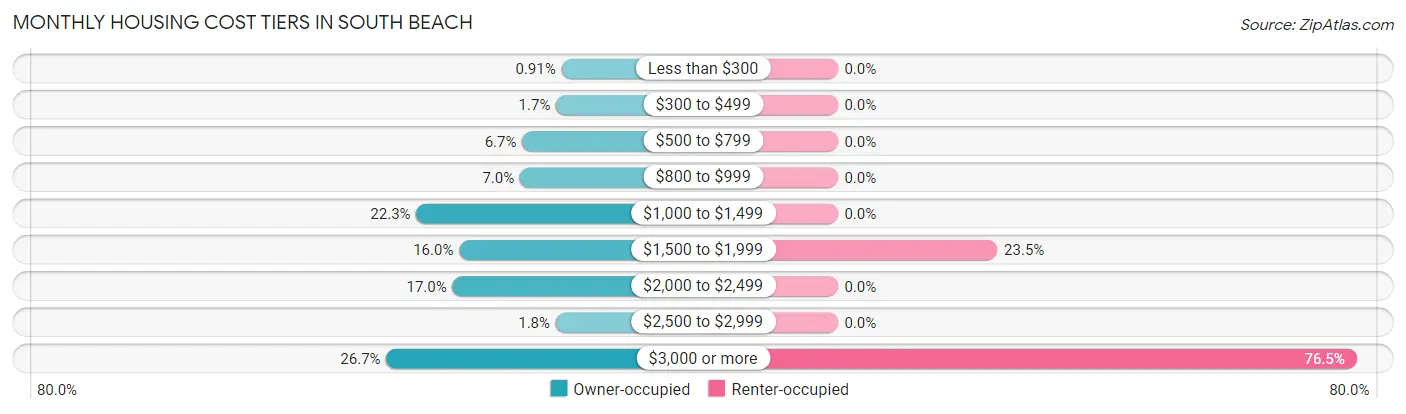
| Monthly Cost | Owner-occupied | Renter-occupied |
| Less than $300 | 14 (0.9%) | 0 (0.0%) |
| $300 to $499 | 26 (1.7%) | 0 (0.0%) |
| $500 to $799 | 103 (6.7%) | 0 (0.0%) |
| $800 to $999 | 108 (7.0%) | 0 (0.0%) |
| $1,000 to $1,499 | 343 (22.3%) | 0 (0.0%) |
| $1,500 to $1,999 | 246 (16.0%) | 4 (23.5%) |
| $2,000 to $2,499 | 261 (17.0%) | 0 (0.0%) |
| $2,500 to $2,999 | 27 (1.8%) | 0 (0.0%) |
| $3,000 or more | 411 (26.7%) | 13 (76.5%) |
| Total | 1,539 (100.0%) | 17 (100.0%) |
Physical Housing Characteristics in South Beach
Housing Structures in South Beach
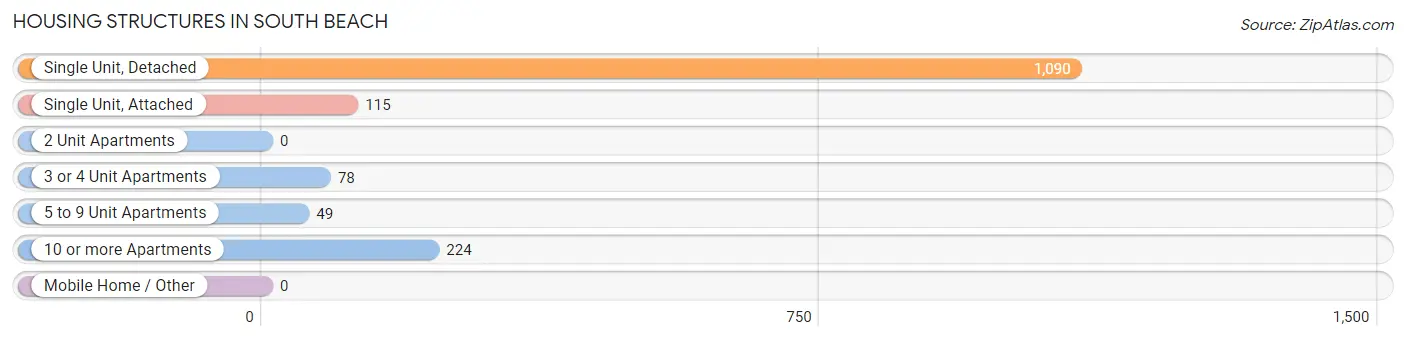
| Structure Type | # Housing Units | % Housing Units |
| Single Unit, Detached | 1,090 | 70.1% |
| Single Unit, Attached | 115 | 7.4% |
| 2 Unit Apartments | 0 | 0.0% |
| 3 or 4 Unit Apartments | 78 | 5.0% |
| 5 to 9 Unit Apartments | 49 | 3.2% |
| 10 or more Apartments | 224 | 14.4% |
| Mobile Home / Other | 0 | 0.0% |
| Total | 1,556 | 100.0% |
Housing Structures by Occupancy in South Beach
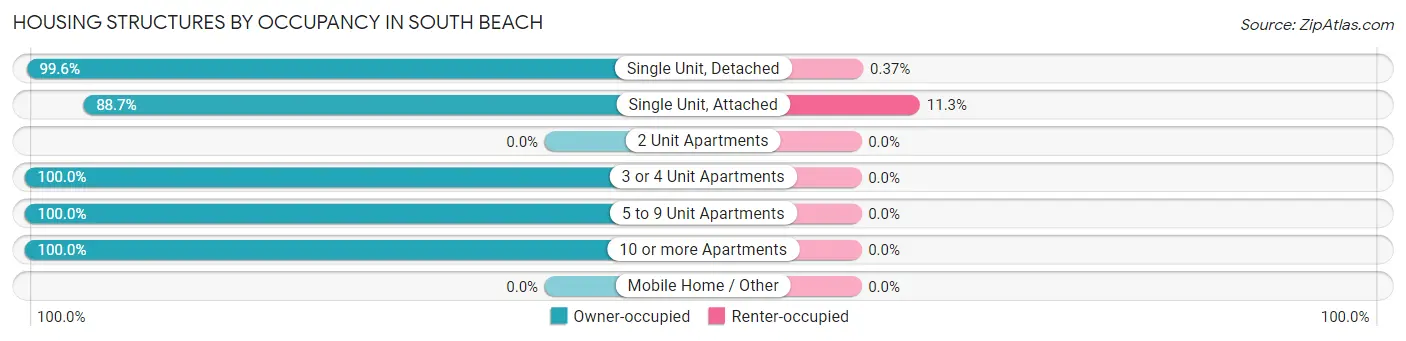
| Structure Type | Owner-occupied | Renter-occupied |
| Single Unit, Detached | 1,086 (99.6%) | 4 (0.4%) |
| Single Unit, Attached | 102 (88.7%) | 13 (11.3%) |
| 2 Unit Apartments | 0 (0.0%) | 0 (0.0%) |
| 3 or 4 Unit Apartments | 78 (100.0%) | 0 (0.0%) |
| 5 to 9 Unit Apartments | 49 (100.0%) | 0 (0.0%) |
| 10 or more Apartments | 224 (100.0%) | 0 (0.0%) |
| Mobile Home / Other | 0 (0.0%) | 0 (0.0%) |
| Total | 1,539 (98.9%) | 17 (1.1%) |
Housing Structures by Number of Rooms in South Beach
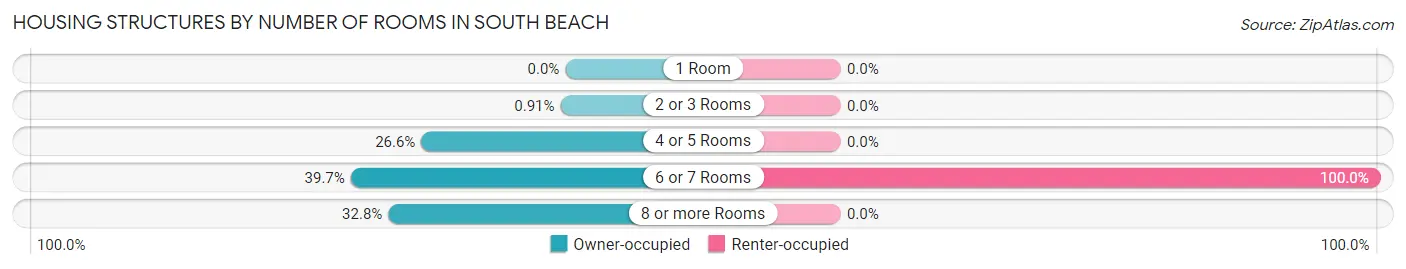
| Number of Rooms | Owner-occupied | Renter-occupied |
| 1 Room | 0 (0.0%) | 0 (0.0%) |
| 2 or 3 Rooms | 14 (0.9%) | 0 (0.0%) |
| 4 or 5 Rooms | 410 (26.6%) | 0 (0.0%) |
| 6 or 7 Rooms | 611 (39.7%) | 17 (100.0%) |
| 8 or more Rooms | 504 (32.8%) | 0 (0.0%) |
| Total | 1,539 (100.0%) | 17 (100.0%) |
Housing Structure by Heating Type in South Beach
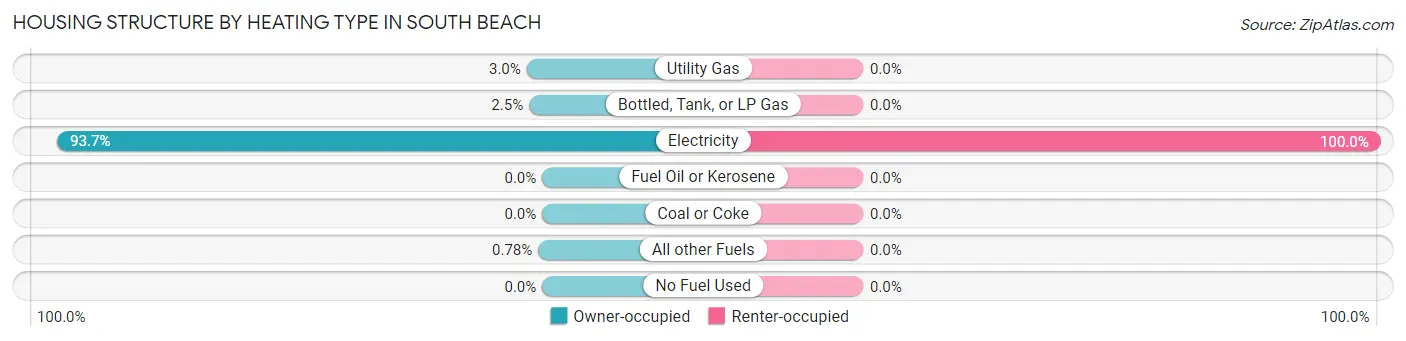
| Heating Type | Owner-occupied | Renter-occupied |
| Utility Gas | 46 (3.0%) | 0 (0.0%) |
| Bottled, Tank, or LP Gas | 39 (2.5%) | 0 (0.0%) |
| Electricity | 1,442 (93.7%) | 17 (100.0%) |
| Fuel Oil or Kerosene | 0 (0.0%) | 0 (0.0%) |
| Coal or Coke | 0 (0.0%) | 0 (0.0%) |
| All other Fuels | 12 (0.8%) | 0 (0.0%) |
| No Fuel Used | 0 (0.0%) | 0 (0.0%) |
| Total | 1,539 (100.0%) | 17 (100.0%) |
Household Vehicle Usage in South Beach
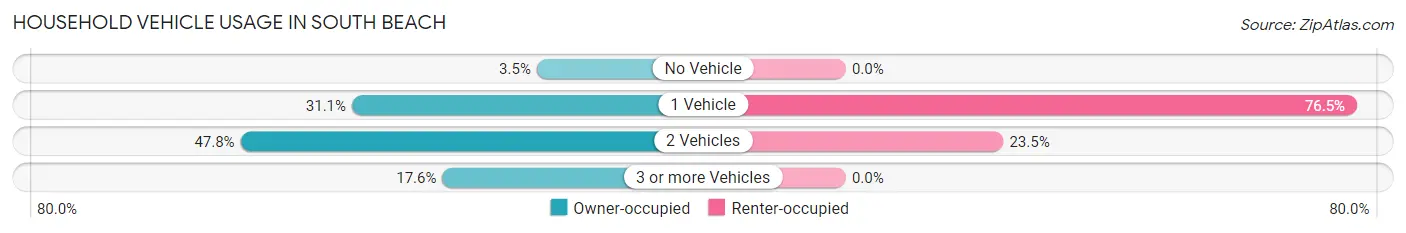
| Vehicles per Household | Owner-occupied | Renter-occupied |
| No Vehicle | 54 (3.5%) | 0 (0.0%) |
| 1 Vehicle | 479 (31.1%) | 13 (76.5%) |
| 2 Vehicles | 735 (47.8%) | 4 (23.5%) |
| 3 or more Vehicles | 271 (17.6%) | 0 (0.0%) |
| Total | 1,539 (100.0%) | 17 (100.0%) |
Real Estate & Mortgages in South Beach
Real Estate and Mortgage Overview in South Beach
| Characteristic | Without Mortgage | With Mortgage |
| Housing Units | 1,085 | 454 |
| Median Property Value | $816,400 | $804,900 |
| Median Household Income | $174,196 | $315 |
| Monthly Housing Costs | $1,481 | $285 |
| Real Estate Taxes | $6,232 | $0 |
Property Value by Mortgage Status in South Beach
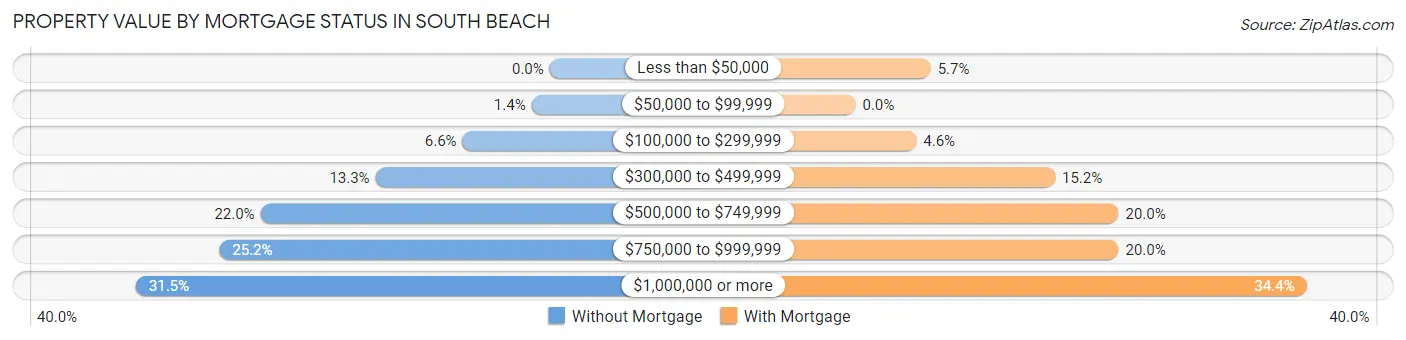
| Property Value | Without Mortgage | With Mortgage |
| Less than $50,000 | 0 (0.0%) | 26 (5.7%) |
| $50,000 to $99,999 | 15 (1.4%) | 0 (0.0%) |
| $100,000 to $299,999 | 72 (6.6%) | 21 (4.6%) |
| $300,000 to $499,999 | 144 (13.3%) | 69 (15.2%) |
| $500,000 to $749,999 | 239 (22.0%) | 91 (20.0%) |
| $750,000 to $999,999 | 273 (25.2%) | 91 (20.0%) |
| $1,000,000 or more | 342 (31.5%) | 156 (34.4%) |
| Total | 1,085 (100.0%) | 454 (100.0%) |
Household Income by Mortgage Status in South Beach
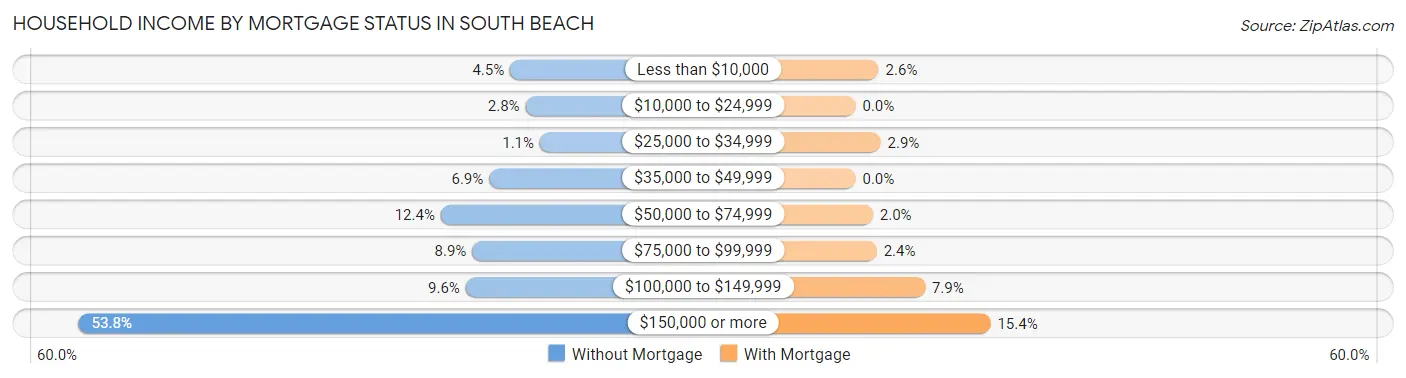
| Household Income | Without Mortgage | With Mortgage |
| Less than $10,000 | 49 (4.5%) | 12 (2.6%) |
| $10,000 to $24,999 | 30 (2.8%) | 0 (0.0%) |
| $25,000 to $34,999 | 12 (1.1%) | 13 (2.9%) |
| $35,000 to $49,999 | 75 (6.9%) | 0 (0.0%) |
| $50,000 to $74,999 | 135 (12.4%) | 9 (2.0%) |
| $75,000 to $99,999 | 96 (8.8%) | 11 (2.4%) |
| $100,000 to $149,999 | 104 (9.6%) | 36 (7.9%) |
| $150,000 or more | 584 (53.8%) | 70 (15.4%) |
| Total | 1,085 (100.0%) | 454 (100.0%) |
Property Value to Household Income Ratio in South Beach
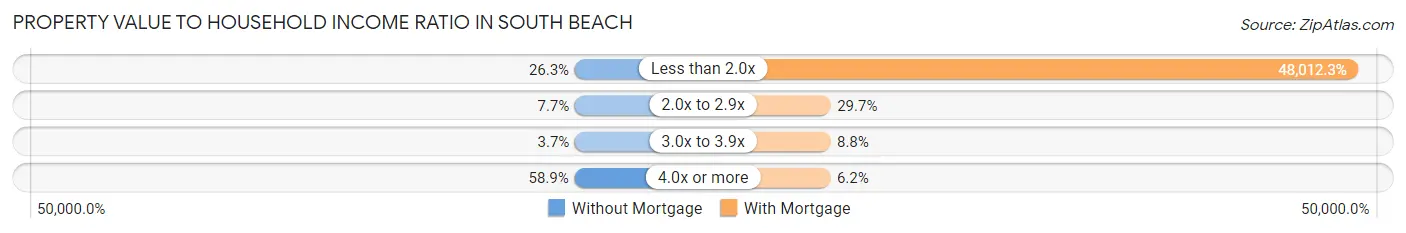
| Value-to-Income Ratio | Without Mortgage | With Mortgage |
| Less than 2.0x | 285 (26.3%) | 217,976 (48,012.3%) |
| 2.0x to 2.9x | 83 (7.6%) | 135 (29.7%) |
| 3.0x to 3.9x | 40 (3.7%) | 40 (8.8%) |
| 4.0x or more | 639 (58.9%) | 28 (6.2%) |
| Total | 1,085 (100.0%) | 454 (100.0%) |
Real Estate Taxes by Mortgage Status in South Beach
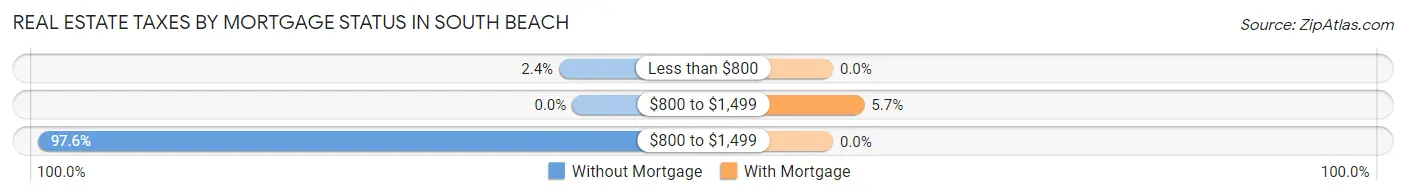
| Property Taxes | Without Mortgage | With Mortgage |
| Less than $800 | 26 (2.4%) | 0 (0.0%) |
| $800 to $1,499 | 0 (0.0%) | 26 (5.7%) |
| $800 to $1,499 | 1,059 (97.6%) | 0 (0.0%) |
| Total | 1,085 (100.0%) | 454 (100.0%) |
Health & Disability in South Beach
Health Insurance Coverage by Age in South Beach
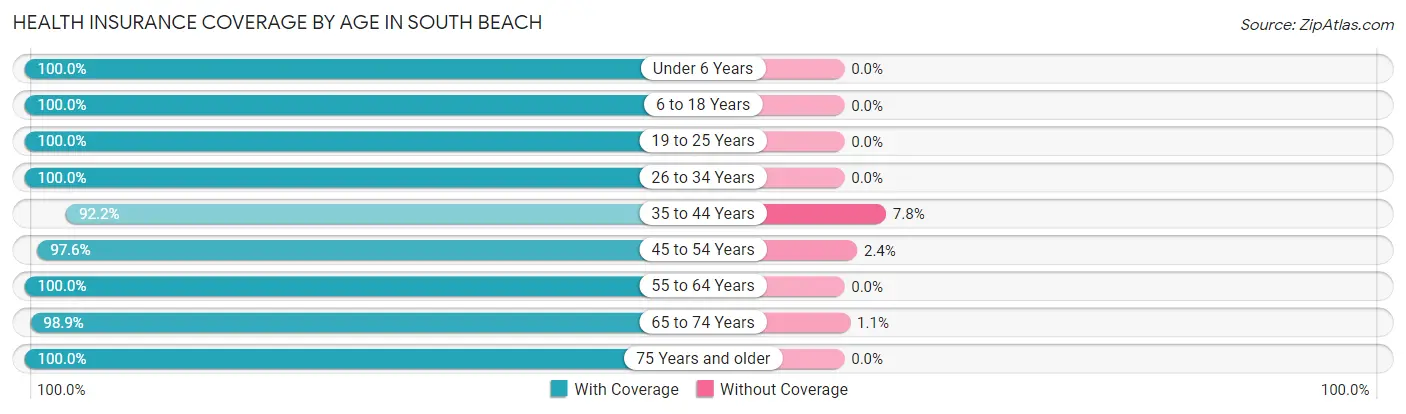
| Age Bracket | With Coverage | Without Coverage |
| Under 6 Years | 34 (100.0%) | 0 (0.0%) |
| 6 to 18 Years | 217 (100.0%) | 0 (0.0%) |
| 19 to 25 Years | 4 (100.0%) | 0 (0.0%) |
| 26 to 34 Years | 19 (100.0%) | 0 (0.0%) |
| 35 to 44 Years | 107 (92.2%) | 9 (7.8%) |
| 45 to 54 Years | 410 (97.6%) | 10 (2.4%) |
| 55 to 64 Years | 344 (100.0%) | 0 (0.0%) |
| 65 to 74 Years | 995 (98.9%) | 11 (1.1%) |
| 75 Years and older | 960 (100.0%) | 0 (0.0%) |
| Total | 3,090 (99.0%) | 30 (1.0%) |
Health Insurance Coverage by Citizenship Status in South Beach
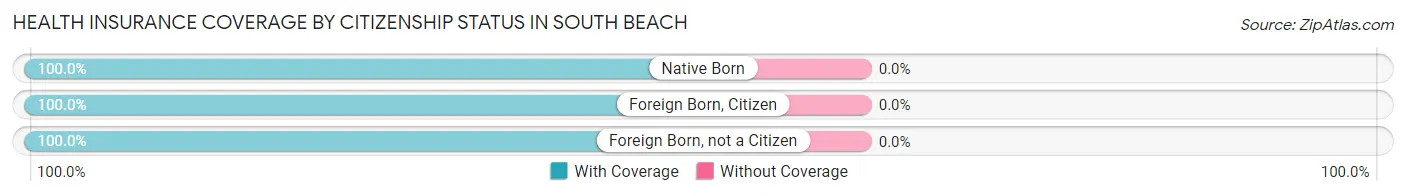
| Citizenship Status | With Coverage | Without Coverage |
| Native Born | 34 (100.0%) | 0 (0.0%) |
| Foreign Born, Citizen | 217 (100.0%) | 0 (0.0%) |
| Foreign Born, not a Citizen | 4 (100.0%) | 0 (0.0%) |
Health Insurance Coverage by Household Income in South Beach
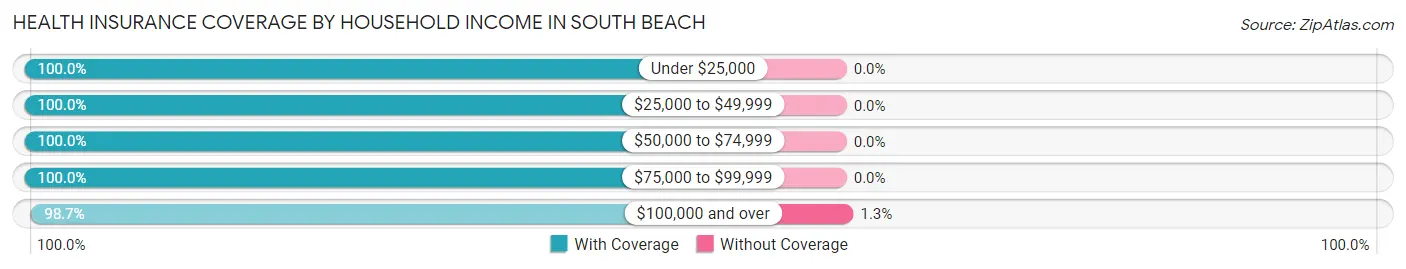
| Household Income | With Coverage | Without Coverage |
| Under $25,000 | 133 (100.0%) | 0 (0.0%) |
| $25,000 to $49,999 | 164 (100.0%) | 0 (0.0%) |
| $50,000 to $74,999 | 211 (100.0%) | 0 (0.0%) |
| $75,000 to $99,999 | 226 (100.0%) | 0 (0.0%) |
| $100,000 and over | 2,356 (98.7%) | 30 (1.3%) |
Public vs Private Health Insurance Coverage by Age in South Beach
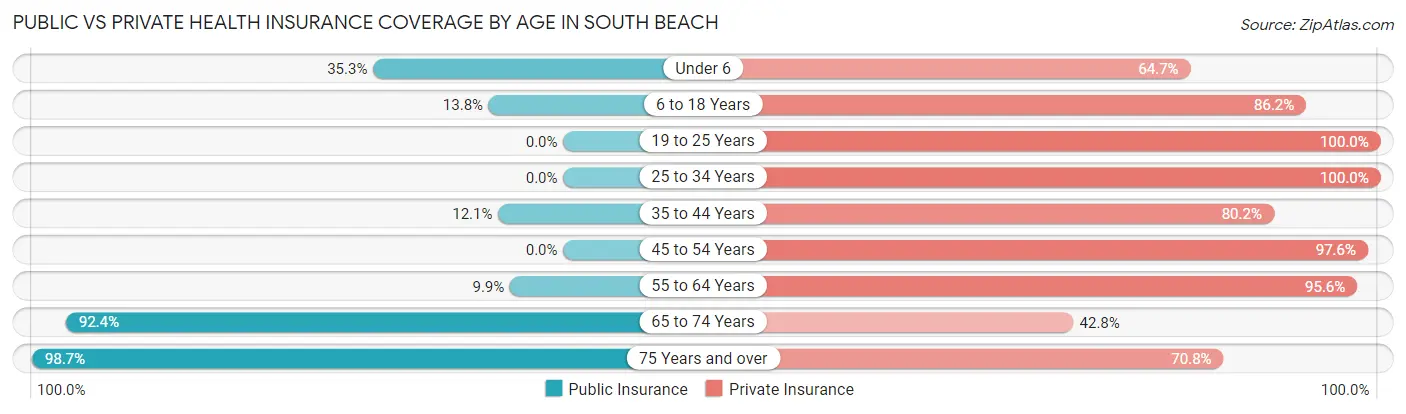
| Age Bracket | Public Insurance | Private Insurance |
| Under 6 | 12 (35.3%) | 22 (64.7%) |
| 6 to 18 Years | 30 (13.8%) | 187 (86.2%) |
| 19 to 25 Years | 0 (0.0%) | 4 (100.0%) |
| 25 to 34 Years | 0 (0.0%) | 19 (100.0%) |
| 35 to 44 Years | 14 (12.1%) | 93 (80.2%) |
| 45 to 54 Years | 0 (0.0%) | 410 (97.6%) |
| 55 to 64 Years | 34 (9.9%) | 329 (95.6%) |
| 65 to 74 Years | 929 (92.3%) | 431 (42.8%) |
| 75 Years and over | 947 (98.7%) | 680 (70.8%) |
| Total | 1,966 (63.0%) | 2,175 (69.7%) |
Disability Status by Sex by Age in South Beach
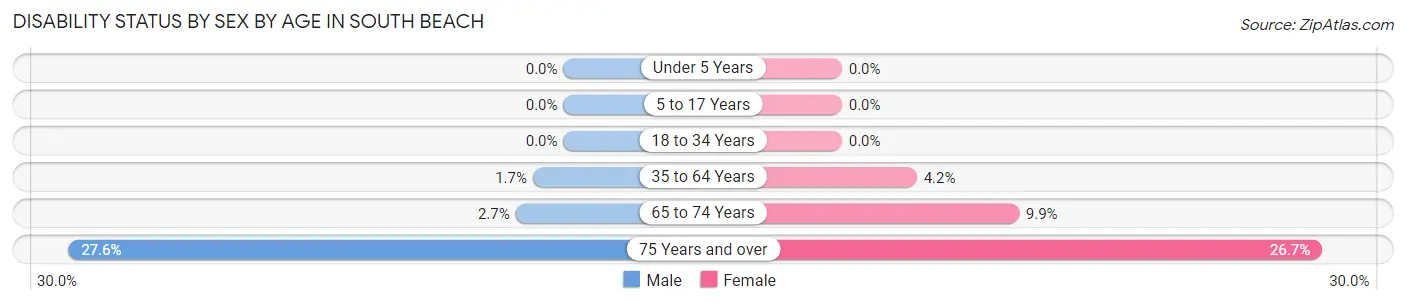
| Age Bracket | Male | Female |
| Under 5 Years | 0 (0.0%) | 0 (0.0%) |
| 5 to 17 Years | 0 (0.0%) | 0 (0.0%) |
| 18 to 34 Years | 0 (0.0%) | 0 (0.0%) |
| 35 to 64 Years | 6 (1.7%) | 22 (4.2%) |
| 65 to 74 Years | 13 (2.7%) | 51 (9.9%) |
| 75 Years and over | 142 (27.6%) | 119 (26.7%) |
Disability Class by Sex by Age in South Beach
Disability Class: Hearing Difficulty
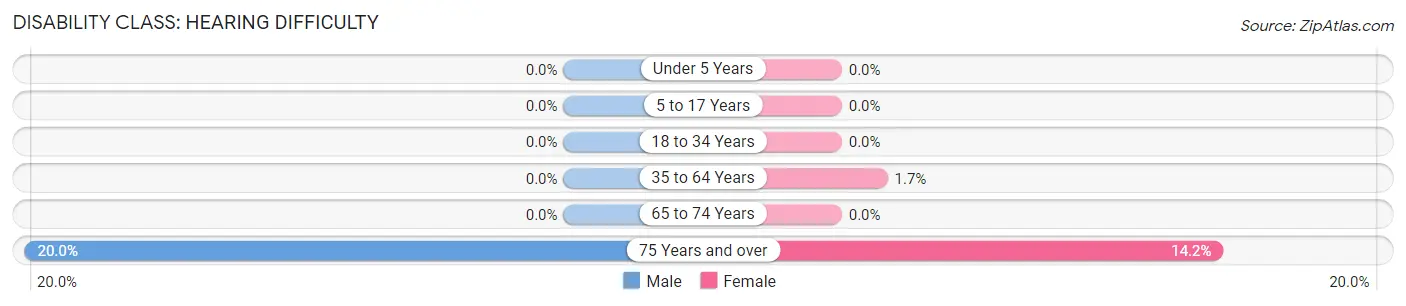
| Age Bracket | Male | Female |
| Under 5 Years | 0 (0.0%) | 0 (0.0%) |
| 5 to 17 Years | 0 (0.0%) | 0 (0.0%) |
| 18 to 34 Years | 0 (0.0%) | 0 (0.0%) |
| 35 to 64 Years | 0 (0.0%) | 9 (1.7%) |
| 65 to 74 Years | 0 (0.0%) | 0 (0.0%) |
| 75 Years and over | 103 (20.0%) | 63 (14.2%) |
Disability Class: Vision Difficulty
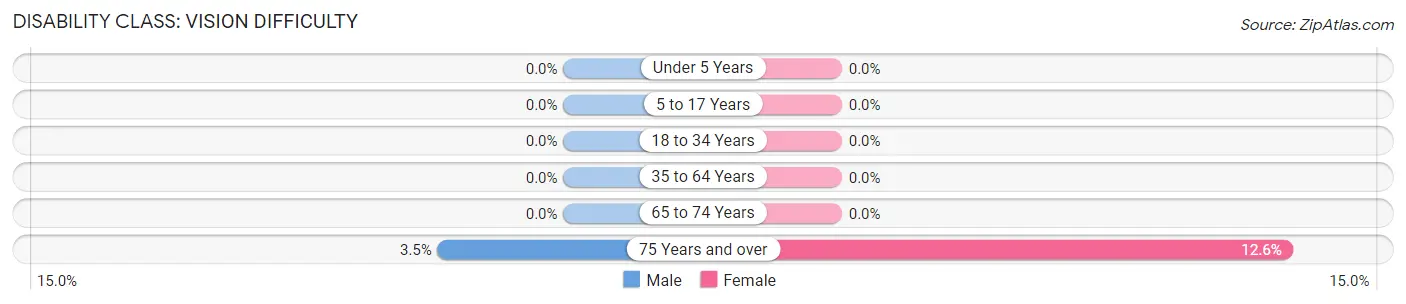
| Age Bracket | Male | Female |
| Under 5 Years | 0 (0.0%) | 0 (0.0%) |
| 5 to 17 Years | 0 (0.0%) | 0 (0.0%) |
| 18 to 34 Years | 0 (0.0%) | 0 (0.0%) |
| 35 to 64 Years | 0 (0.0%) | 0 (0.0%) |
| 65 to 74 Years | 0 (0.0%) | 0 (0.0%) |
| 75 Years and over | 18 (3.5%) | 56 (12.6%) |
Disability Class: Cognitive Difficulty
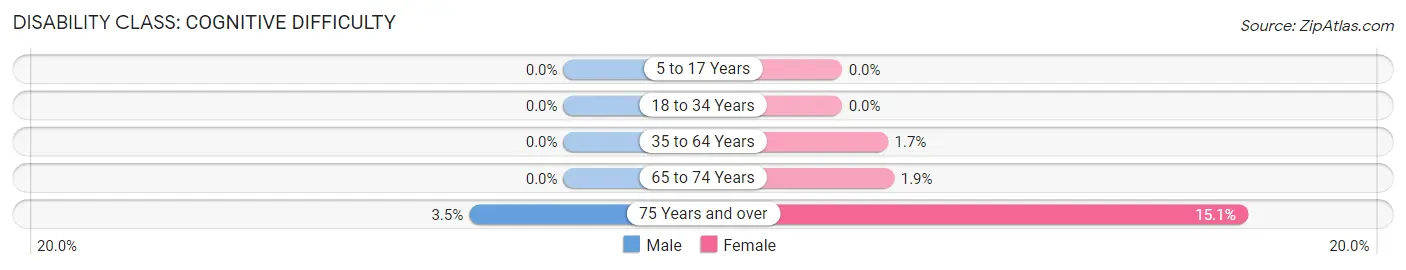
| Age Bracket | Male | Female |
| 5 to 17 Years | 0 (0.0%) | 0 (0.0%) |
| 18 to 34 Years | 0 (0.0%) | 0 (0.0%) |
| 35 to 64 Years | 0 (0.0%) | 9 (1.7%) |
| 65 to 74 Years | 0 (0.0%) | 10 (1.9%) |
| 75 Years and over | 18 (3.5%) | 67 (15.1%) |
Disability Class: Ambulatory Difficulty
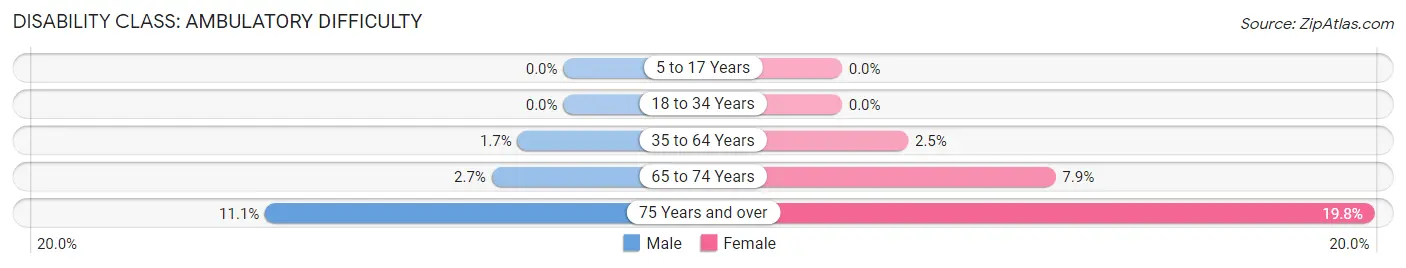
| Age Bracket | Male | Female |
| 5 to 17 Years | 0 (0.0%) | 0 (0.0%) |
| 18 to 34 Years | 0 (0.0%) | 0 (0.0%) |
| 35 to 64 Years | 6 (1.7%) | 13 (2.5%) |
| 65 to 74 Years | 13 (2.7%) | 41 (7.9%) |
| 75 Years and over | 57 (11.1%) | 88 (19.8%) |
Disability Class: Self-Care Difficulty
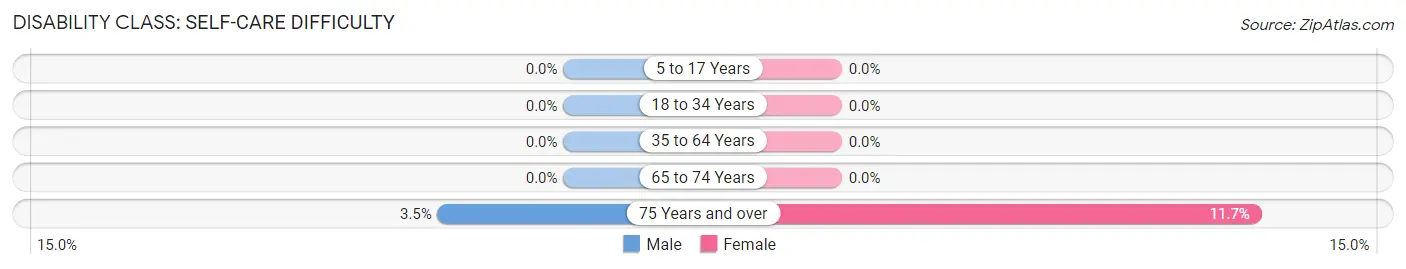
| Age Bracket | Male | Female |
| 5 to 17 Years | 0 (0.0%) | 0 (0.0%) |
| 18 to 34 Years | 0 (0.0%) | 0 (0.0%) |
| 35 to 64 Years | 0 (0.0%) | 0 (0.0%) |
| 65 to 74 Years | 0 (0.0%) | 0 (0.0%) |
| 75 Years and over | 18 (3.5%) | 52 (11.7%) |
Technology Access in South Beach
Computing Device Access in South Beach
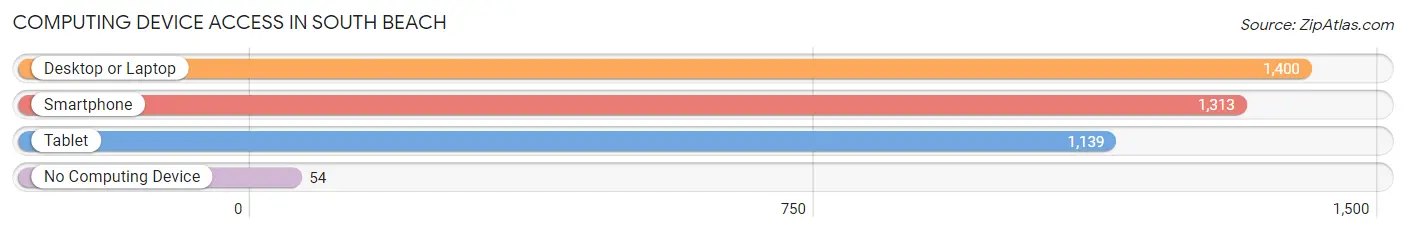
| Device Type | # Households | % Households |
| Desktop or Laptop | 1,400 | 90.0% |
| Smartphone | 1,313 | 84.4% |
| Tablet | 1,139 | 73.2% |
| No Computing Device | 54 | 3.5% |
| Total | 1,556 | 100.0% |
Internet Access in South Beach
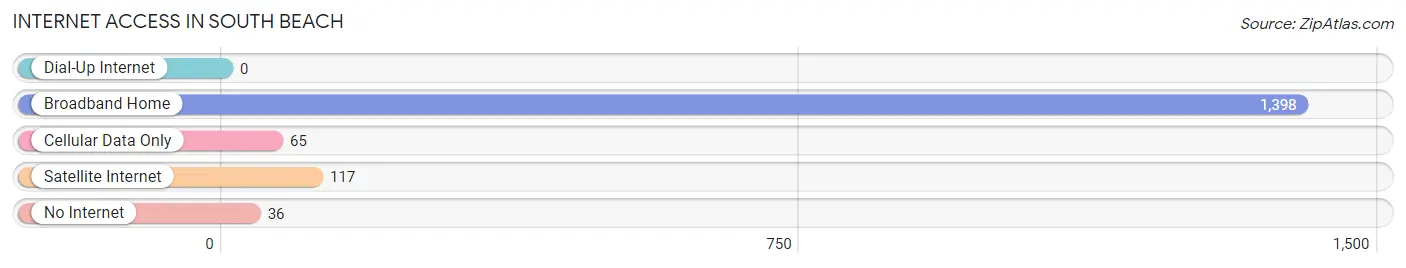
| Internet Type | # Households | % Households |
| Dial-Up Internet | 0 | 0.0% |
| Broadband Home | 1,398 | 89.8% |
| Cellular Data Only | 65 | 4.2% |
| Satellite Internet | 117 | 7.5% |
| No Internet | 36 | 2.3% |
| Total | 1,556 | 100.0% |
South Beach Summary
South Beach, FL is a vibrant and diverse city located in Miami-Dade County, Florida. It is a popular tourist destination and is known for its beautiful beaches, vibrant nightlife, and unique culture. South Beach is located on a barrier island between the Atlantic Ocean and Biscayne Bay. It is bordered by the cities of Miami Beach to the north and Bal Harbour to the south.
History
South Beach has a long and storied history. The area was originally inhabited by the Tequesta Indians, who were the first known inhabitants of the area. The Tequesta Indians were a peaceful tribe that lived in the area for thousands of years before the arrival of Europeans.
In the late 1800s, the area was developed by Henry Flagler, a railroad magnate. Flagler built a railroad bridge connecting the mainland to the island, which allowed for the development of the area. The area was then developed by Carl Fisher, who built the first hotel in the area, the Flamingo Hotel.
In the 1920s, the area became a popular destination for wealthy Americans, who built luxurious hotels and mansions in the area. The area was also known for its vibrant nightlife, which attracted celebrities and other famous people.
In the 1940s, the area was taken over by the US military, who used it as a training ground for soldiers. After the war, the area was redeveloped and became a popular tourist destination.
Geography
South Beach is located on a barrier island between the Atlantic Ocean and Biscayne Bay. It is bordered by the cities of Miami Beach to the north and Bal Harbour to the south. The area is known for its beautiful beaches, which are popular with tourists and locals alike.
The area is also known for its vibrant nightlife, which includes clubs, bars, and restaurants. The area is also home to many art galleries, museums, and other cultural attractions.
Economy
South Beach is a major tourist destination and is home to many hotels, restaurants, and other businesses that cater to tourists. The area is also home to many high-end shops and boutiques.
The area is also home to many businesses that cater to the local population, such as banks, grocery stores, and other services.
Demographics
South Beach is a diverse city with a population of approximately 87,000 people. The population is made up of a variety of ethnicities, including Hispanic, African American, and Caucasian. The median household income is approximately $50,000.
The area is also home to many immigrants, who make up a large portion of the population. The area is also home to many retirees, who are attracted to the area for its warm climate and beautiful beaches.
Common Questions
What is Per Capita Income in South Beach?
Per Capita income in South Beach is $147,430.
What is the Median Family Income in South Beach?
Median Family Income in South Beach is $201,574.
What is the Median Household income in South Beach?
Median Household Income in South Beach is $193,281.
What is Income or Wage Gap in South Beach?
Income or Wage Gap in South Beach is 64.0%.
Women in South Beach earn 36.0 cents for every dollar earned by a man.
What is Family Income Deficit in South Beach?
Family Income Deficit in South Beach is $14,161.
Families that are below poverty line in South Beach earn $14,161 less on average than the poverty threshold level.
What is Inequality or Gini Index in South Beach?
Inequality or Gini Index in South Beach is 0.52.
What is the Total Population of South Beach?
Total Population of South Beach is 3,120.
What is the Total Male Population of South Beach?
Total Male Population of South Beach is 1,474.
What is the Total Female Population of South Beach?
Total Female Population of South Beach is 1,646.
What is the Ratio of Males per 100 Females in South Beach?
There are 89.55 Males per 100 Females in South Beach.
What is the Ratio of Females per 100 Males in South Beach?
There are 111.67 Females per 100 Males in South Beach.
What is the Median Population Age in South Beach?
Median Population Age in South Beach is 70.8 Years.
What is the Average Family Size in South Beach
Average Family Size in South Beach is 2.3 People.
What is the Average Household Size in South Beach
Average Household Size in South Beach is 2.0 People.
How Large is the Labor Force in South Beach?
There are 838 People in the Labor Forcein in South Beach.
What is the Percentage of People in the Labor Force in South Beach?
28.9% of People are in the Labor Force in South Beach.
What is the Unemployment Rate in South Beach?
Unemployment Rate in South Beach is 1.3%.