Starke, FL Map & Demographics
Starke Map
Starke Overview
$19,910
PER CAPITA INCOME
$47,133
AVG FAMILY INCOME
$42,976
AVG HOUSEHOLD INCOME
23.5%
WAGE / INCOME GAP [ % ]
76.5¢/ $1
WAGE / INCOME GAP [ $ ]
0.48
INEQUALITY / GINI INDEX
5,756
TOTAL POPULATION
2,908
MALE POPULATION
2,848
FEMALE POPULATION
102.11
MALES / 100 FEMALES
97.94
FEMALES / 100 MALES
35.1
MEDIAN AGE
3.0
AVG FAMILY SIZE
2.5
AVG HOUSEHOLD SIZE
2,167
LABOR FORCE [ PEOPLE ]
49.6%
PERCENT IN LABOR FORCE
3.9%
UNEMPLOYMENT RATE
Starke Zip Codes
Income in Starke
Income Overview in Starke
Per Capita Income in Starke is $19,910, while median incomes of families and households are $47,133 and $42,976 respectively.
| Characteristic | Number | Measure |
| Per Capita Income | 5,756 | $19,910 |
| Median Family Income | 1,214 | $47,133 |
| Mean Family Income | 1,214 | $64,809 |
| Median Household Income | 2,124 | $42,976 |
| Mean Household Income | 2,124 | $50,027 |
| Income Deficit | 1,214 | $0 |
| Wage / Income Gap (%) | 5,756 | 23.52% |
| Wage / Income Gap ($) | 5,756 | 76.48¢ per $1 |
| Gini / Inequality Index | 5,756 | 0.48 |
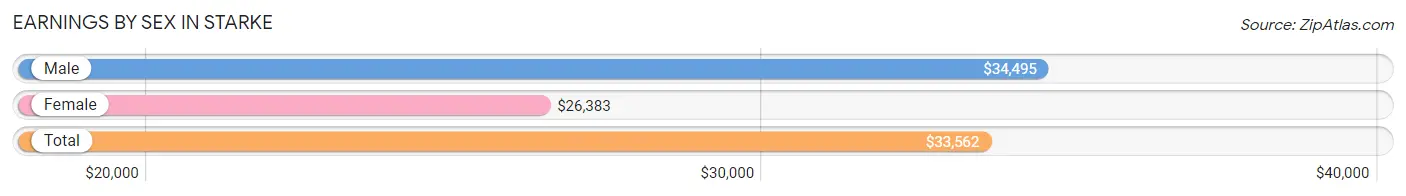
Earnings by Sex in Starke
Average Earnings in Starke are $33,562, $34,495 for men and $26,383 for women, a difference of 23.5%.
| Sex | Number | Average Earnings |
| Male | 1,316 (57.1%) | $34,495 |
| Female | 987 (42.9%) | $26,383 |
| Total | 2,303 (100.0%) | $33,562 |
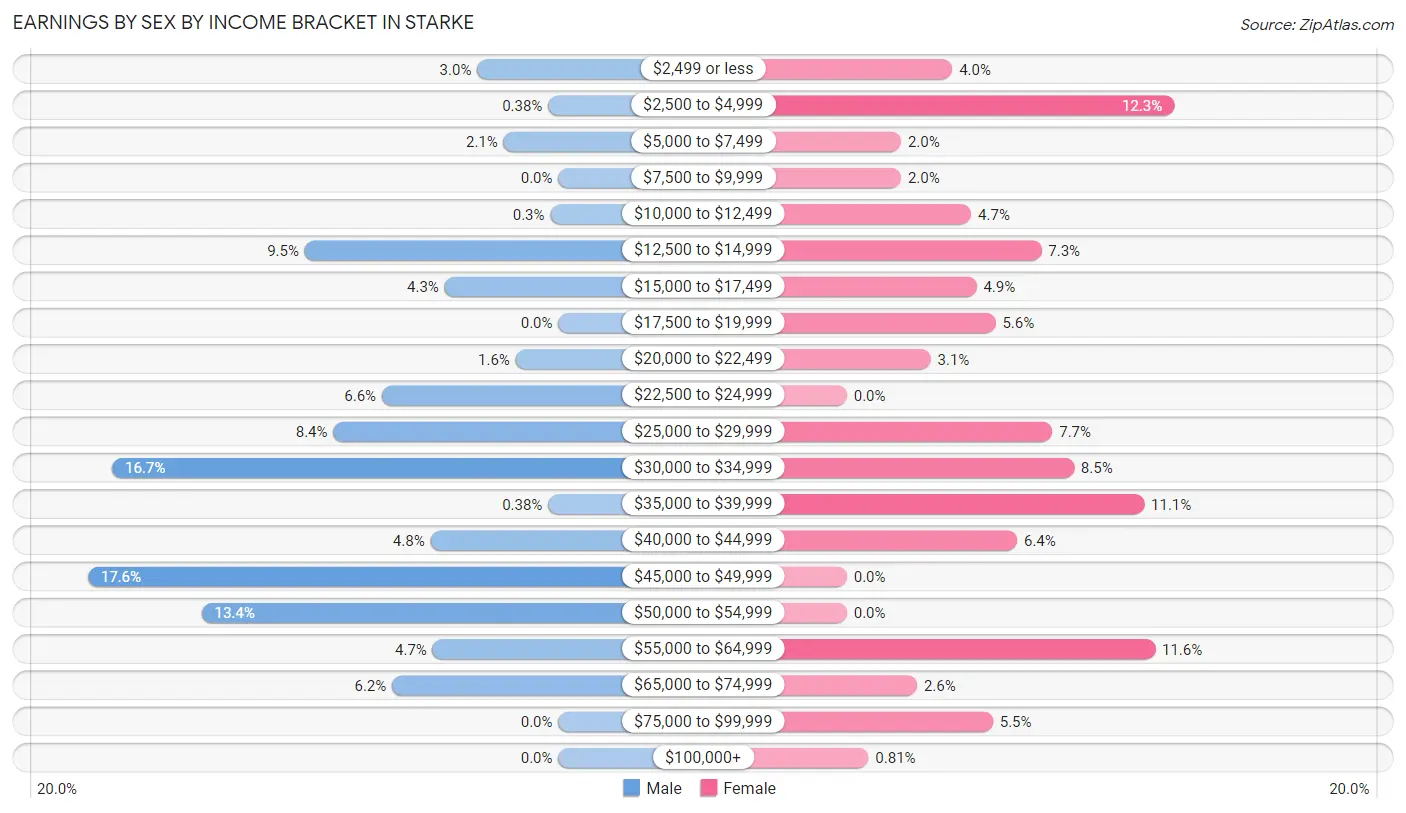
Earnings by Sex by Income Bracket in Starke
The most common earnings brackets in Starke are $45,000 to $49,999 for men (232 | 17.6%) and $2,500 to $4,999 for women (121 | 12.3%).
| Income | Male | Female |
| $2,499 or less | 40 (3.0%) | 39 (4.0%) |
| $2,500 to $4,999 | 5 (0.4%) | 121 (12.3%) |
| $5,000 to $7,499 | 27 (2.1%) | 20 (2.0%) |
| $7,500 to $9,999 | 0 (0.0%) | 20 (2.0%) |
| $10,000 to $12,499 | 4 (0.3%) | 46 (4.7%) |
| $12,500 to $14,999 | 125 (9.5%) | 72 (7.3%) |
| $15,000 to $17,499 | 56 (4.3%) | 48 (4.9%) |
| $17,500 to $19,999 | 0 (0.0%) | 55 (5.6%) |
| $20,000 to $22,499 | 21 (1.6%) | 31 (3.1%) |
| $22,500 to $24,999 | 87 (6.6%) | 0 (0.0%) |
| $25,000 to $29,999 | 111 (8.4%) | 76 (7.7%) |
| $30,000 to $34,999 | 220 (16.7%) | 84 (8.5%) |
| $35,000 to $39,999 | 5 (0.4%) | 110 (11.1%) |
| $40,000 to $44,999 | 63 (4.8%) | 63 (6.4%) |
| $45,000 to $49,999 | 232 (17.6%) | 0 (0.0%) |
| $50,000 to $54,999 | 176 (13.4%) | 0 (0.0%) |
| $55,000 to $64,999 | 62 (4.7%) | 114 (11.6%) |
| $65,000 to $74,999 | 82 (6.2%) | 26 (2.6%) |
| $75,000 to $99,999 | 0 (0.0%) | 54 (5.5%) |
| $100,000+ | 0 (0.0%) | 8 (0.8%) |
| Total | 1,316 (100.0%) | 987 (100.0%) |
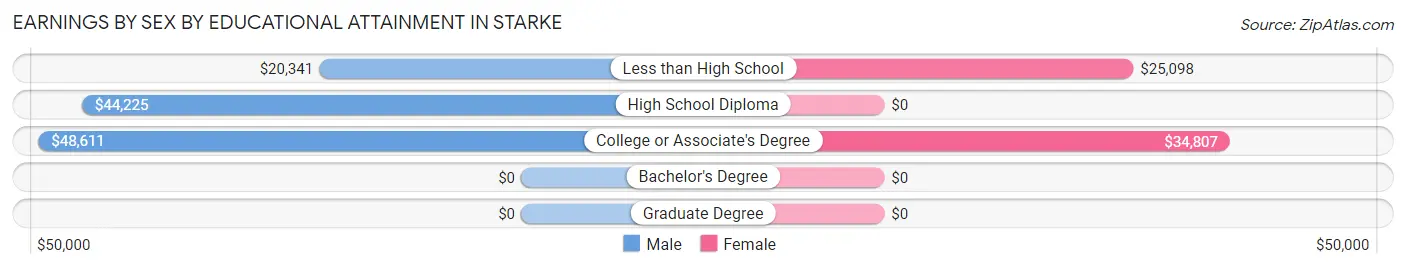
Earnings by Sex by Educational Attainment in Starke
Average earnings in Starke are $44,275 for men and $25,200 for women, a difference of 43.1%. Men with an educational attainment of college or associate's degree enjoy the highest average annual earnings of $48,611, while those with less than high school education earn the least with $20,341. Women with an educational attainment of college or associate's degree earn the most with the average annual earnings of $34,807, while those with less than high school education have the smallest earnings of $25,098.
| Educational Attainment | Male Income | Female Income |
| Less than High School | $20,341 | $25,098 |
| High School Diploma | $44,225 | $0 |
| College or Associate's Degree | $48,611 | $34,807 |
| Bachelor's Degree | - | - |
| Graduate Degree | - | - |
| Total | $44,275 | $25,200 |
Family Income in Starke
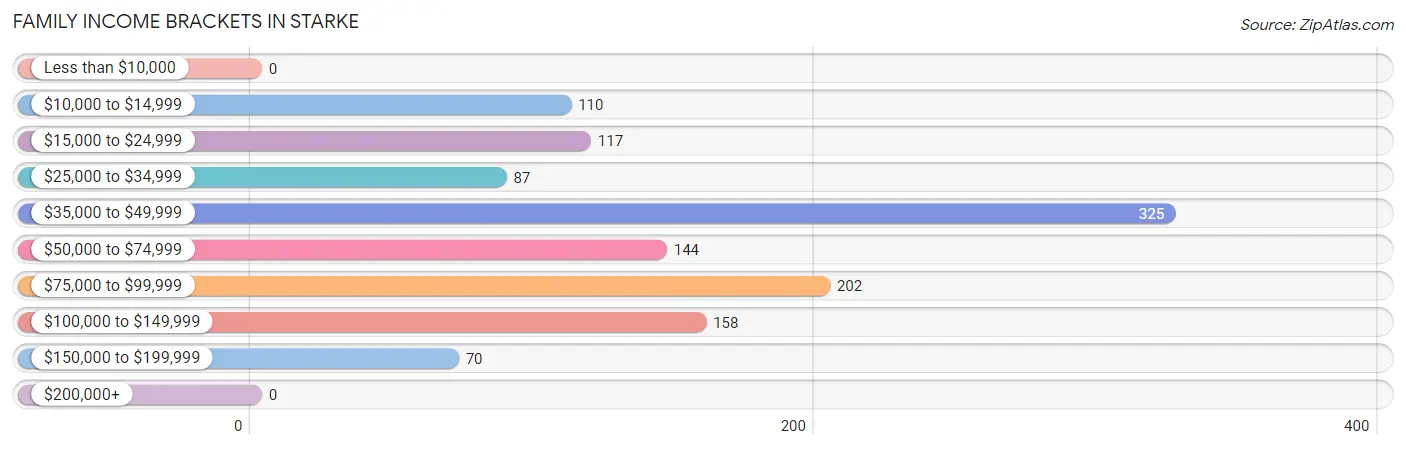
Family Income Brackets in Starke
According to the Starke family income data, there are 325 families falling into the $35,000 to $49,999 income range, which is the most common income bracket and makes up 26.8% of all families.
| Income Bracket | # Families | % Families |
| Less than $10,000 | 0 | 0.0% |
| $10,000 to $14,999 | 110 | 9.1% |
| $15,000 to $24,999 | 117 | 9.6% |
| $25,000 to $34,999 | 87 | 7.2% |
| $35,000 to $49,999 | 325 | 26.8% |
| $50,000 to $74,999 | 144 | 11.9% |
| $75,000 to $99,999 | 202 | 16.6% |
| $100,000 to $149,999 | 158 | 13.0% |
| $150,000 to $199,999 | 70 | 5.8% |
| $200,000+ | 0 | 0.0% |
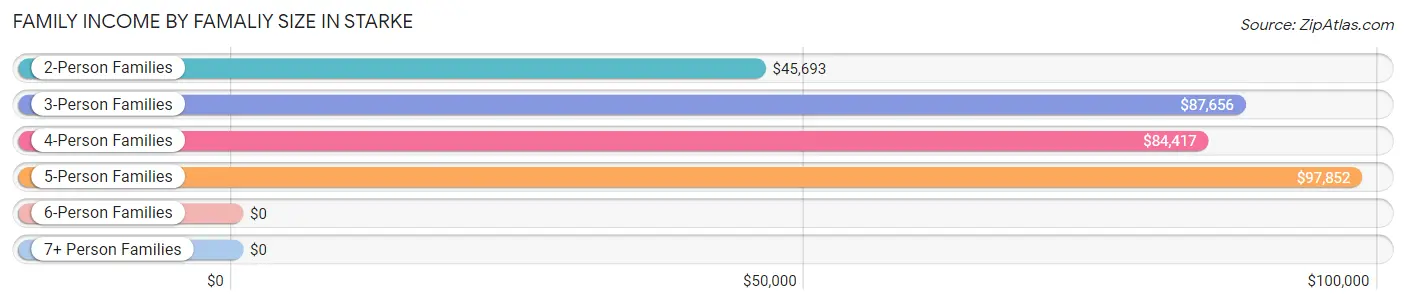
Family Income by Famaliy Size in Starke
5-person families (156 | 12.9%) account for the highest median family income in Starke with $97,852 per family, while 3-person families (306 | 25.2%) have the highest median income of $29,219 per family member.
| Income Bracket | # Families | Median Income |
| 2-Person Families | 513 (42.3%) | $45,693 |
| 3-Person Families | 306 (25.2%) | $87,656 |
| 4-Person Families | 189 (15.6%) | $84,417 |
| 5-Person Families | 156 (12.9%) | $97,852 |
| 6-Person Families | 42 (3.5%) | $0 |
| 7+ Person Families | 8 (0.7%) | $0 |
| Total | 1,214 (100.0%) | $47,133 |
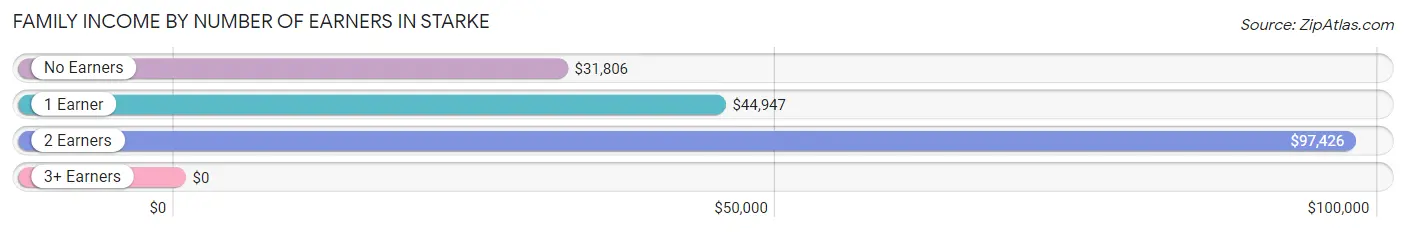
Family Income by Number of Earners in Starke
| Number of Earners | # Families | Median Income |
| No Earners | 173 (14.2%) | $31,806 |
| 1 Earner | 554 (45.6%) | $44,947 |
| 2 Earners | 423 (34.8%) | $97,426 |
| 3+ Earners | 64 (5.3%) | $0 |
| Total | 1,214 (100.0%) | $47,133 |
Household Income in Starke
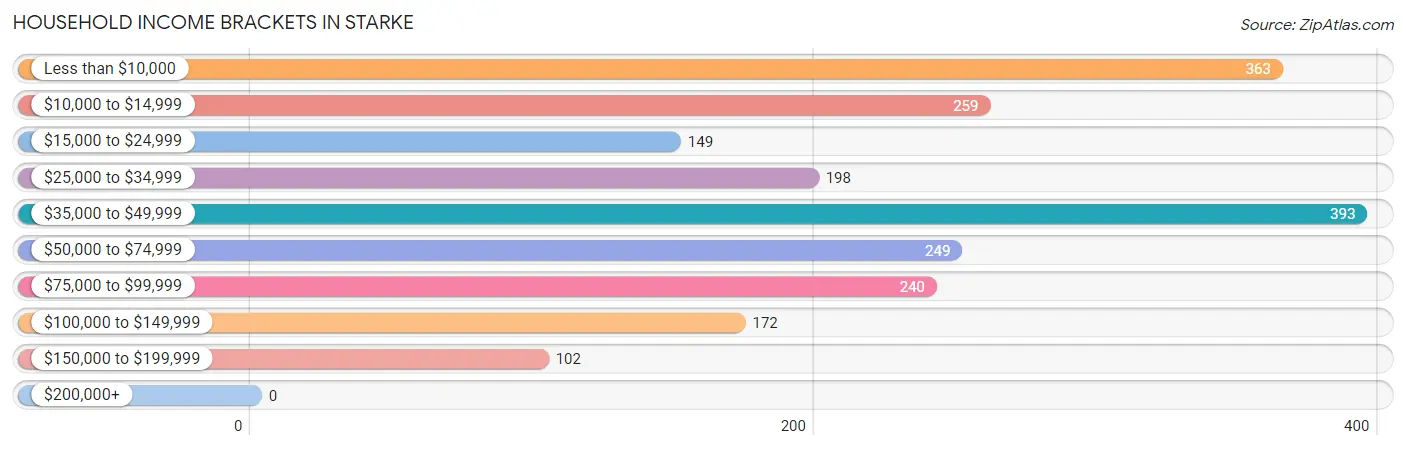
Household Income Brackets in Starke
With 393 households falling in the category, the $35,000 to $49,999 income range is the most frequent in Starke, accounting for 18.5% of all households.
| Income Bracket | # Households | % Households |
| Less than $10,000 | 363 | 17.1% |
| $10,000 to $14,999 | 259 | 12.2% |
| $15,000 to $24,999 | 149 | 7.0% |
| $25,000 to $34,999 | 198 | 9.3% |
| $35,000 to $49,999 | 393 | 18.5% |
| $50,000 to $74,999 | 249 | 11.7% |
| $75,000 to $99,999 | 240 | 11.3% |
| $100,000 to $149,999 | 172 | 8.1% |
| $150,000 to $199,999 | 102 | 4.8% |
| $200,000+ | 0 | 0.0% |
Household Income by Householder Age in Starke
The median household income in Starke is $42,976, with the highest median household income of $46,528 found in the 25 to 44 years age bracket for the primary householder. A total of 926 households (43.6%) fall into this category.
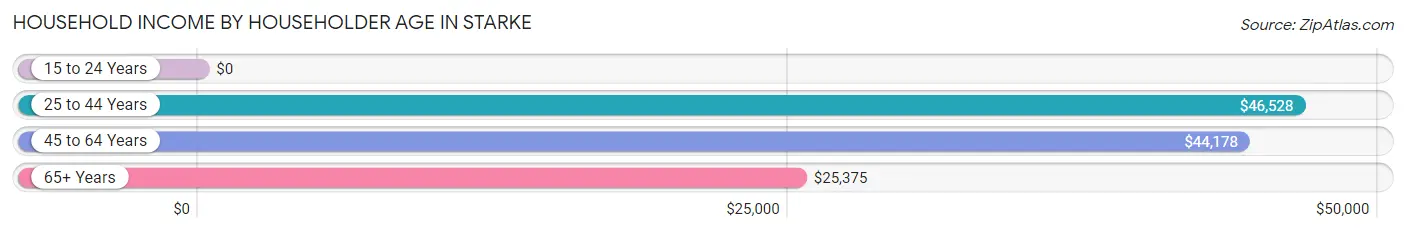
| Income Bracket | # Households | Median Income |
| 15 to 24 Years | 0 (0.0%) | $0 |
| 25 to 44 Years | 926 (43.6%) | $46,528 |
| 45 to 64 Years | 565 (26.6%) | $44,178 |
| 65+ Years | 633 (29.8%) | $25,375 |
| Total | 2,124 (100.0%) | $42,976 |
Poverty in Starke
Income Below Poverty by Sex and Age in Starke
With 25.3% poverty level for males and 38.2% for females among the residents of Starke, under 5 year old males and 15 year old females are the most vulnerable to poverty, with 97 males (61.0%) and 26 females (74.3%) in their respective age groups living below the poverty level.
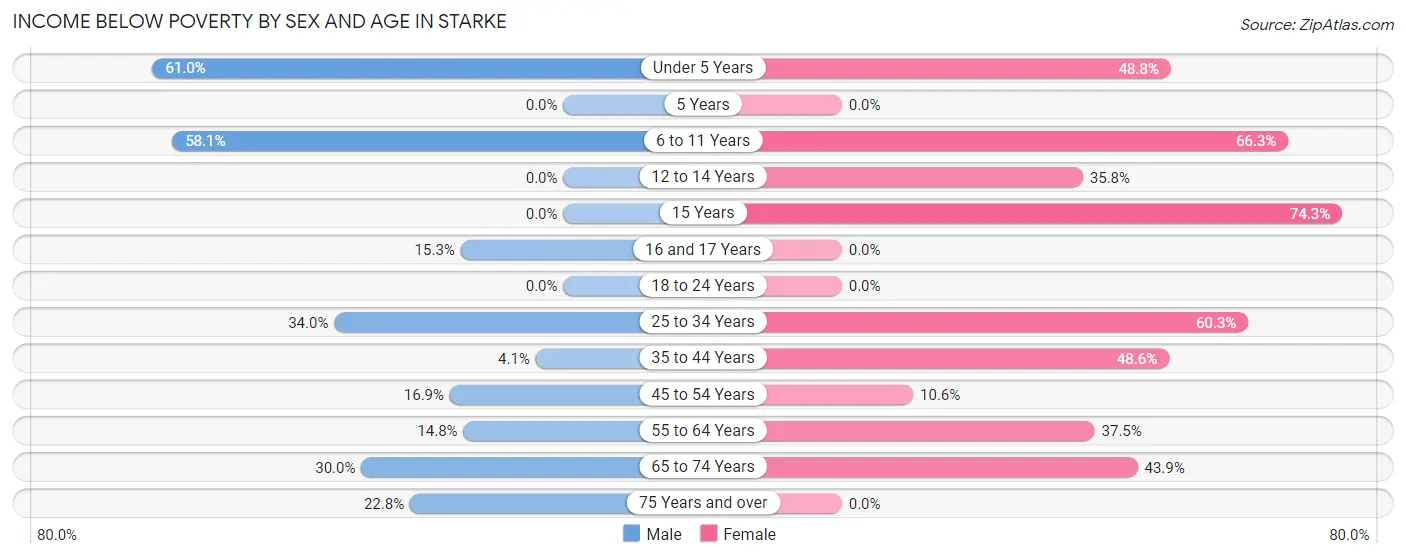
| Age Bracket | Male | Female |
| Under 5 Years | 97 (61.0%) | 84 (48.8%) |
| 5 Years | 0 (0.0%) | 0 (0.0%) |
| 6 to 11 Years | 187 (58.1%) | 114 (66.3%) |
| 12 to 14 Years | 0 (0.0%) | 58 (35.8%) |
| 15 Years | 0 (0.0%) | 26 (74.3%) |
| 16 and 17 Years | 9 (15.2%) | 0 (0.0%) |
| 18 to 24 Years | 0 (0.0%) | 0 (0.0%) |
| 25 to 34 Years | 216 (34.0%) | 245 (60.3%) |
| 35 to 44 Years | 15 (4.1%) | 137 (48.6%) |
| 45 to 54 Years | 31 (16.9%) | 25 (10.6%) |
| 55 to 64 Years | 27 (14.8%) | 116 (37.5%) |
| 65 to 74 Years | 51 (30.0%) | 173 (43.9%) |
| 75 Years and over | 23 (22.8%) | 0 (0.0%) |
| Total | 656 (25.3%) | 978 (38.2%) |
Income Above Poverty by Sex and Age in Starke
According to the poverty statistics in Starke, males aged 12 to 14 years and females aged 5 years are the age groups that are most secure financially, with 100.0% of males and 100.0% of females in these age groups living above the poverty line.
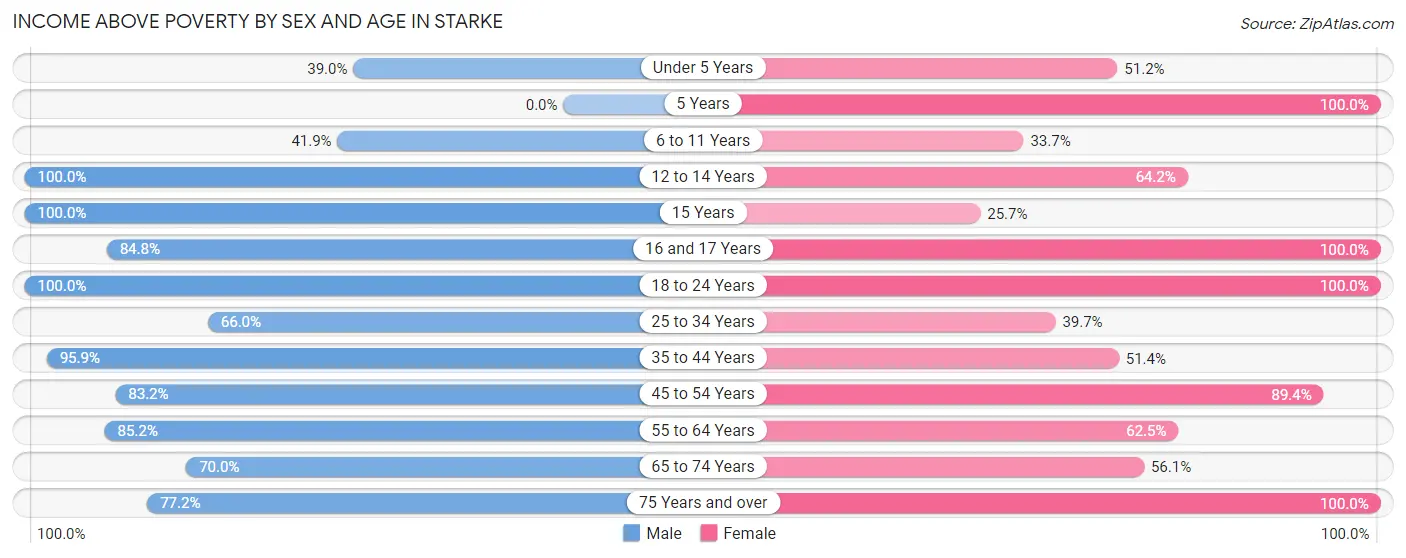
| Age Bracket | Male | Female |
| Under 5 Years | 62 (39.0%) | 88 (51.2%) |
| 5 Years | 0 (0.0%) | 34 (100.0%) |
| 6 to 11 Years | 135 (41.9%) | 58 (33.7%) |
| 12 to 14 Years | 198 (100.0%) | 104 (64.2%) |
| 15 Years | 54 (100.0%) | 9 (25.7%) |
| 16 and 17 Years | 50 (84.8%) | 42 (100.0%) |
| 18 to 24 Years | 165 (100.0%) | 115 (100.0%) |
| 25 to 34 Years | 419 (66.0%) | 161 (39.7%) |
| 35 to 44 Years | 350 (95.9%) | 145 (51.4%) |
| 45 to 54 Years | 153 (83.2%) | 211 (89.4%) |
| 55 to 64 Years | 155 (85.2%) | 193 (62.5%) |
| 65 to 74 Years | 119 (70.0%) | 221 (56.1%) |
| 75 Years and over | 78 (77.2%) | 202 (100.0%) |
| Total | 1,938 (74.7%) | 1,583 (61.8%) |
Income Below Poverty Among Married-Couple Families in Starke
The poverty statistics for married-couple families in Starke show that 5.2% or 36 of the total 693 families live below the poverty line. Families with 1 or 2 children have the highest poverty rate of 13.9%, comprising of 36 families. On the other hand, families with no children have the lowest poverty rate of 0.0%, which includes 0 families.
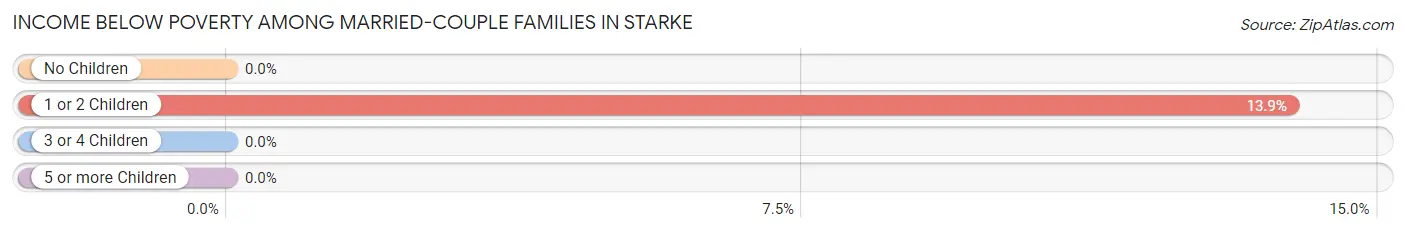
| Children | Above Poverty | Below Poverty |
| No Children | 351 (100.0%) | 0 (0.0%) |
| 1 or 2 Children | 224 (86.2%) | 36 (13.9%) |
| 3 or 4 Children | 82 (100.0%) | 0 (0.0%) |
| 5 or more Children | 0 (0.0%) | 0 (0.0%) |
| Total | 657 (94.8%) | 36 (5.2%) |
Income Below Poverty Among Single-Parent Households in Starke
According to the poverty data in Starke, 4.1% or 8 single-father households and 52.9% or 173 single-mother households are living below the poverty line. Among single-father households, those with 5 or more children have the highest poverty rate, with 8 households (100.0%) experiencing poverty. Likewise, among single-mother households, those with 3 or 4 children have the highest poverty rate, with 84 households (100.0%) falling below the poverty line.
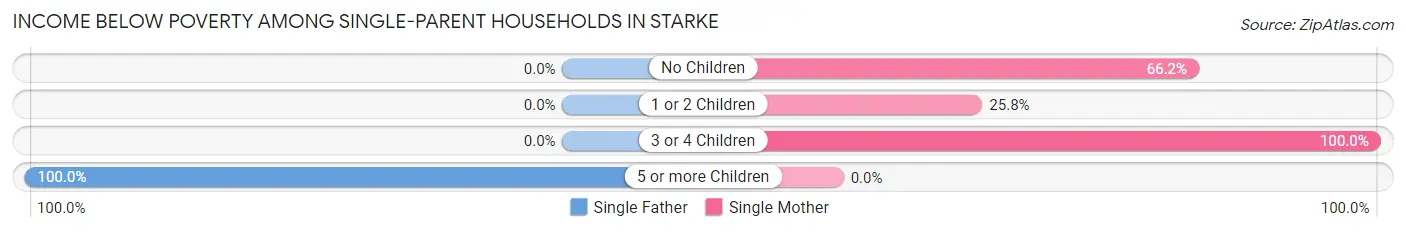
| Children | Single Father | Single Mother |
| No Children | 0 (0.0%) | 43 (66.1%) |
| 1 or 2 Children | 0 (0.0%) | 46 (25.8%) |
| 3 or 4 Children | 0 (0.0%) | 84 (100.0%) |
| 5 or more Children | 8 (100.0%) | 0 (0.0%) |
| Total | 8 (4.1%) | 173 (52.9%) |
Income Below Poverty Among Married-Couple vs Single-Parent Households in Starke
The poverty data for Starke shows that 36 of the married-couple family households (5.2%) and 181 of the single-parent households (34.7%) are living below the poverty level. Within the married-couple family households, those with 1 or 2 children have the highest poverty rate, with 36 households (13.9%) falling below the poverty line. Among the single-parent households, those with 3 or 4 children have the highest poverty rate, with 84 household (100.0%) living below poverty.
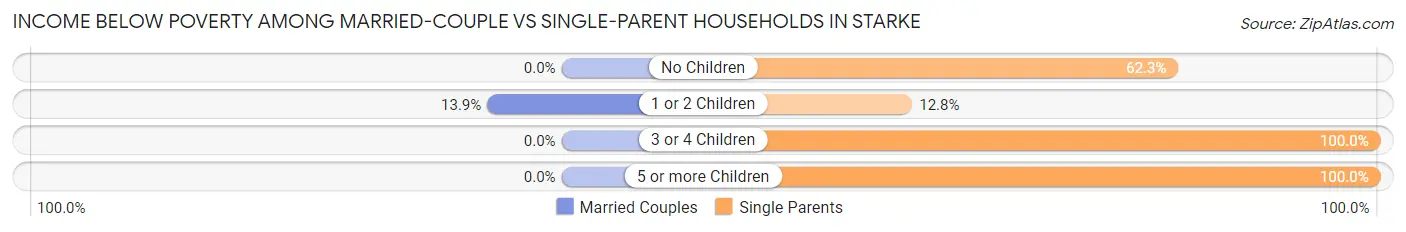
| Children | Married-Couple Families | Single-Parent Households |
| No Children | 0 (0.0%) | 43 (62.3%) |
| 1 or 2 Children | 36 (13.9%) | 46 (12.8%) |
| 3 or 4 Children | 0 (0.0%) | 84 (100.0%) |
| 5 or more Children | 0 (0.0%) | 8 (100.0%) |
| Total | 36 (5.2%) | 181 (34.7%) |
Race in Starke
The most populous races in Starke are White / Caucasian (3,778 | 65.6%), Black / African American (1,499 | 26.0%), and Two or more Races (397 | 6.9%).
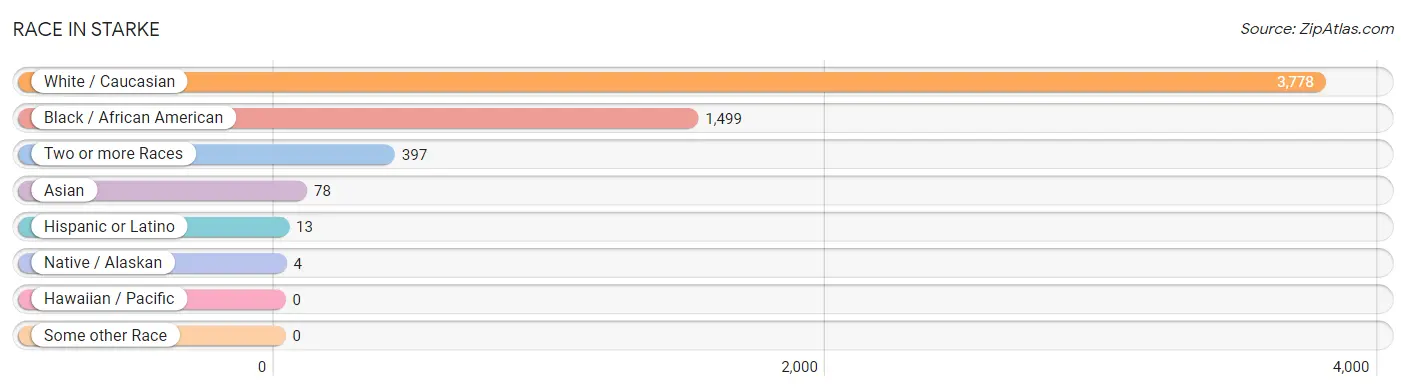
| Race | # Population | % Population |
| Asian | 78 | 1.4% |
| Black / African American | 1,499 | 26.0% |
| Hawaiian / Pacific | 0 | 0.0% |
| Hispanic or Latino | 13 | 0.2% |
| Native / Alaskan | 4 | 0.1% |
| White / Caucasian | 3,778 | 65.6% |
| Two or more Races | 397 | 6.9% |
| Some other Race | 0 | 0.0% |
| Total | 5,756 | 100.0% |
Ancestry in Starke
The most populous ancestries reported in Starke are English (557 | 9.7%), Irish (546 | 9.5%), American (479 | 8.3%), German (240 | 4.2%), and Thai (110 | 1.9%), together accounting for 33.6% of all Starke residents.
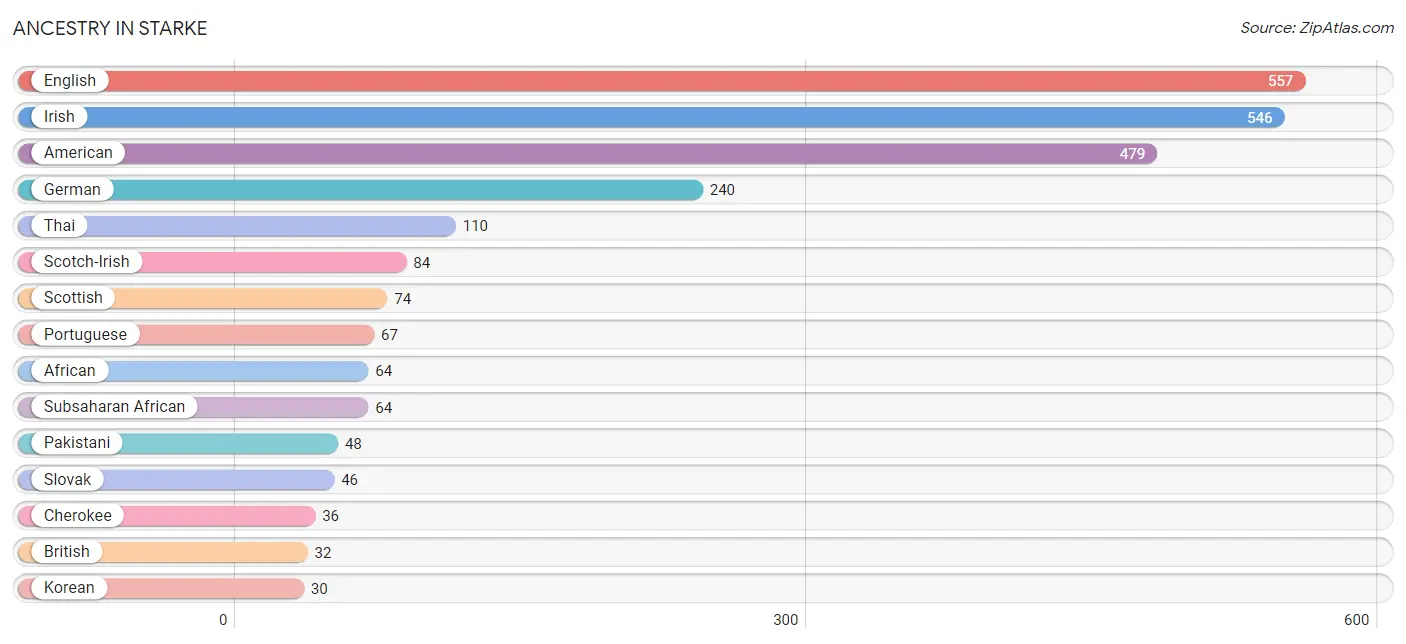
| Ancestry | # Population | % Population |
| African | 64 | 1.1% |
| American | 479 | 8.3% |
| Apache | 4 | 0.1% |
| Belizean | 5 | 0.1% |
| Blackfeet | 4 | 0.1% |
| British | 32 | 0.6% |
| Burmese | 4 | 0.1% |
| Cherokee | 36 | 0.6% |
| Dutch | 19 | 0.3% |
| Eastern European | 14 | 0.2% |
| English | 557 | 9.7% |
| European | 10 | 0.2% |
| French | 5 | 0.1% |
| French Canadian | 16 | 0.3% |
| German | 240 | 4.2% |
| Irish | 546 | 9.5% |
| Italian | 23 | 0.4% |
| Jamaican | 9 | 0.2% |
| Korean | 30 | 0.5% |
| Mexican | 8 | 0.1% |
| Pakistani | 48 | 0.8% |
| Polish | 8 | 0.1% |
| Portuguese | 67 | 1.2% |
| Scotch-Irish | 84 | 1.5% |
| Scottish | 74 | 1.3% |
| Slovak | 46 | 0.8% |
| Subsaharan African | 64 | 1.1% |
| Thai | 110 | 1.9% | View All 28 Rows |
Immigrants in Starke
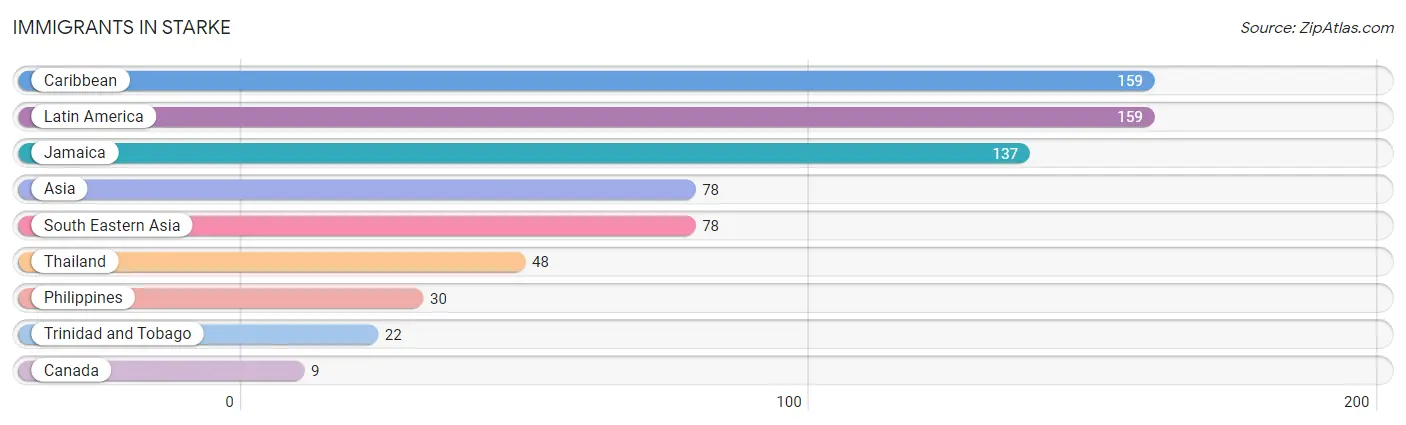
The most numerous immigrant groups reported in Starke came from Caribbean (159 | 2.8%), Latin America (159 | 2.8%), Jamaica (137 | 2.4%), Asia (78 | 1.4%), and South Eastern Asia (78 | 1.4%), together accounting for 10.6% of all Starke residents.
| Immigration Origin | # Population | % Population |
| Asia | 78 | 1.4% |
| Canada | 9 | 0.2% |
| Caribbean | 159 | 2.8% |
| Jamaica | 137 | 2.4% |
| Latin America | 159 | 2.8% |
| Philippines | 30 | 0.5% |
| South Eastern Asia | 78 | 1.4% |
| Thailand | 48 | 0.8% |
| Trinidad and Tobago | 22 | 0.4% | View All 9 Rows |
Sex and Age in Starke
Sex and Age in Starke
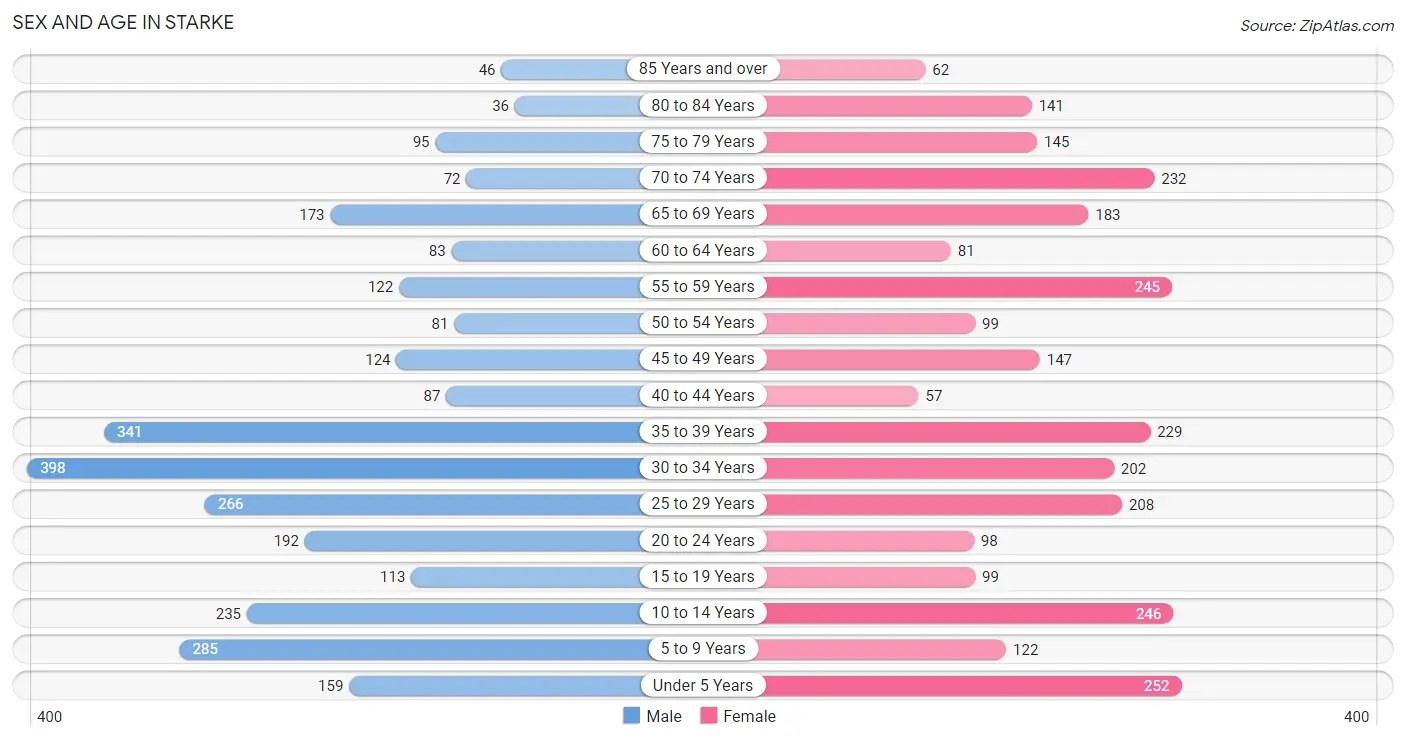
The most populous age groups in Starke are 30 to 34 Years (398 | 13.7%) for men and Under 5 Years (252 | 8.8%) for women.
| Age Bracket | Male | Female |
| Under 5 Years | 159 (5.5%) | 252 (8.8%) |
| 5 to 9 Years | 285 (9.8%) | 122 (4.3%) |
| 10 to 14 Years | 235 (8.1%) | 246 (8.6%) |
| 15 to 19 Years | 113 (3.9%) | 99 (3.5%) |
| 20 to 24 Years | 192 (6.6%) | 98 (3.4%) |
| 25 to 29 Years | 266 (9.1%) | 208 (7.3%) |
| 30 to 34 Years | 398 (13.7%) | 202 (7.1%) |
| 35 to 39 Years | 341 (11.7%) | 229 (8.0%) |
| 40 to 44 Years | 87 (3.0%) | 57 (2.0%) |
| 45 to 49 Years | 124 (4.3%) | 147 (5.2%) |
| 50 to 54 Years | 81 (2.8%) | 99 (3.5%) |
| 55 to 59 Years | 122 (4.2%) | 245 (8.6%) |
| 60 to 64 Years | 83 (2.9%) | 81 (2.8%) |
| 65 to 69 Years | 173 (5.9%) | 183 (6.4%) |
| 70 to 74 Years | 72 (2.5%) | 232 (8.2%) |
| 75 to 79 Years | 95 (3.3%) | 145 (5.1%) |
| 80 to 84 Years | 36 (1.2%) | 141 (5.0%) |
| 85 Years and over | 46 (1.6%) | 62 (2.2%) |
| Total | 2,908 (100.0%) | 2,848 (100.0%) |
Families and Households in Starke
Median Family Size in Starke
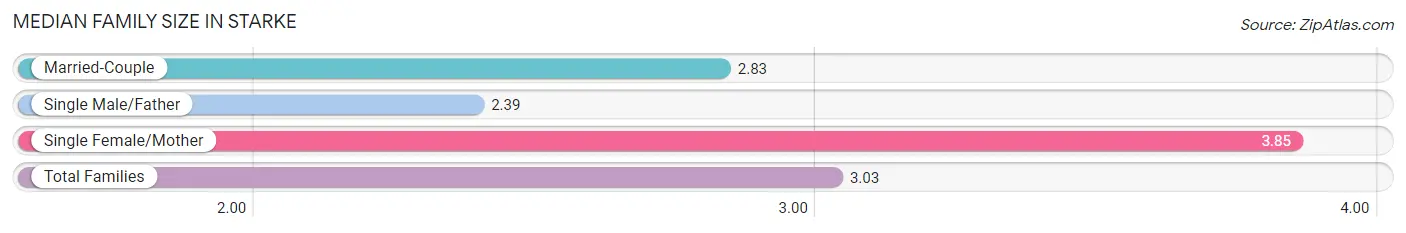
The median family size in Starke is 3.03 persons per family, with single female/mother families (327 | 26.9%) accounting for the largest median family size of 3.85 persons per family. On the other hand, single male/father families (194 | 16.0%) represent the smallest median family size with 2.39 persons per family.
| Family Type | # Families | Family Size |
| Married-Couple | 693 (57.1%) | 2.83 |
| Single Male/Father | 194 (16.0%) | 2.39 |
| Single Female/Mother | 327 (26.9%) | 3.85 |
| Total Families | 1,214 (100.0%) | 3.03 |
Median Household Size in Starke
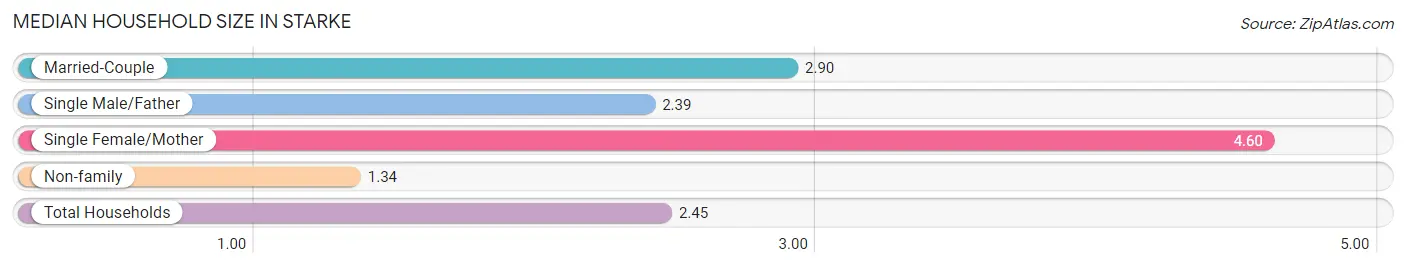
The median household size in Starke is 2.45 persons per household, with single female/mother households (327 | 15.4%) accounting for the largest median household size of 4.6 persons per household. non-family households (910 | 42.8%) represent the smallest median household size with 1.34 persons per household.
| Household Type | # Households | Household Size |
| Married-Couple | 693 (32.6%) | 2.90 |
| Single Male/Father | 194 (9.1%) | 2.39 |
| Single Female/Mother | 327 (15.4%) | 4.60 |
| Non-family | 910 (42.8%) | 1.34 |
| Total Households | 2,124 (100.0%) | 2.45 |
Household Size by Marriage Status in Starke
Out of a total of 2,124 households in Starke, 1,214 (57.2%) are family households, while 910 (42.8%) are nonfamily households. The most numerous type of family households are 2-person households, comprising 449, and the most common type of nonfamily households are 1-person households, comprising 853.
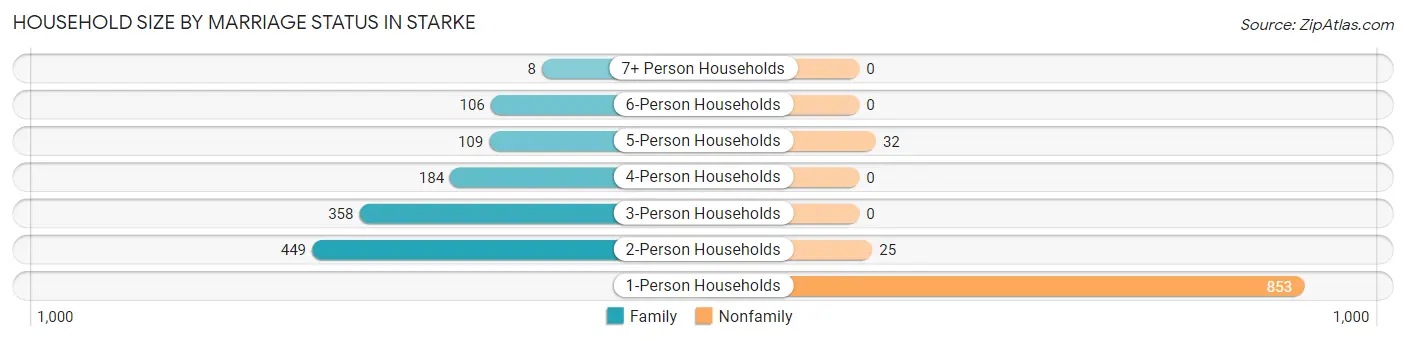
| Household Size | Family Households | Nonfamily Households |
| 1-Person Households | - | 853 (40.2%) |
| 2-Person Households | 449 (21.1%) | 25 (1.2%) |
| 3-Person Households | 358 (16.9%) | 0 (0.0%) |
| 4-Person Households | 184 (8.7%) | 0 (0.0%) |
| 5-Person Households | 109 (5.1%) | 32 (1.5%) |
| 6-Person Households | 106 (5.0%) | 0 (0.0%) |
| 7+ Person Households | 8 (0.4%) | 0 (0.0%) |
| Total | 1,214 (57.2%) | 910 (42.8%) |
Female Fertility in Starke
Fertility by Age in Starke
Average fertility rate in Starke is 14.0 births per 1,000 women. Women in the age bracket of 20 to 34 years have the highest fertility rate with 30.0 births per 1,000 women. Women in the age bracket of 20 to 34 years acount for 100.0% of all women with births.
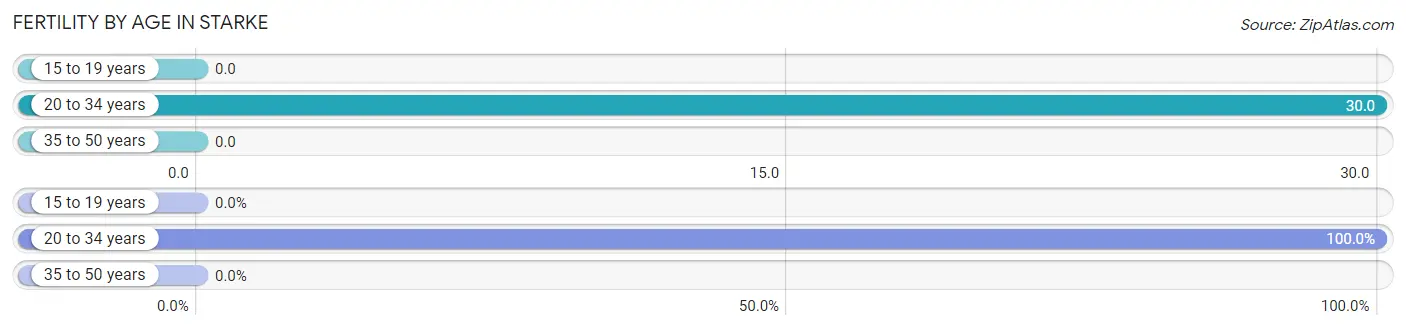
| Age Bracket | Women with Births | Births / 1,000 Women |
| 15 to 19 years | 0 (0.0%) | 0.0 |
| 20 to 34 years | 15 (100.0%) | 30.0 |
| 35 to 50 years | 0 (0.0%) | 0.0 |
| Total | 15 (100.0%) | 14.0 |
Fertility by Age by Marriage Status in Starke
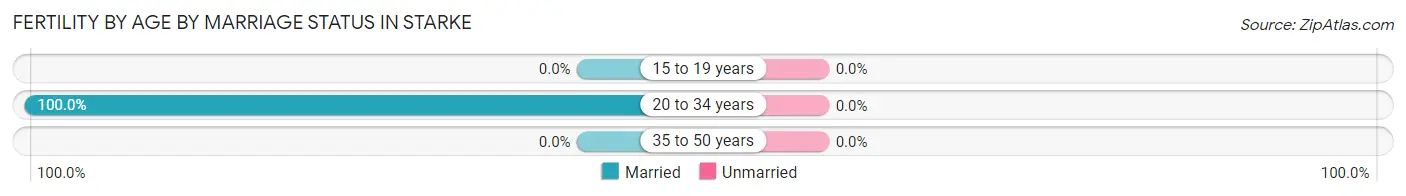
| Age Bracket | Married | Unmarried |
| 15 to 19 years | 0 (0.0%) | 0 (0.0%) |
| 20 to 34 years | 15 (100.0%) | 0 (0.0%) |
| 35 to 50 years | 0 (0.0%) | 0 (0.0%) |
| Total | 15 (100.0%) | 0 (0.0%) |
Fertility by Education in Starke
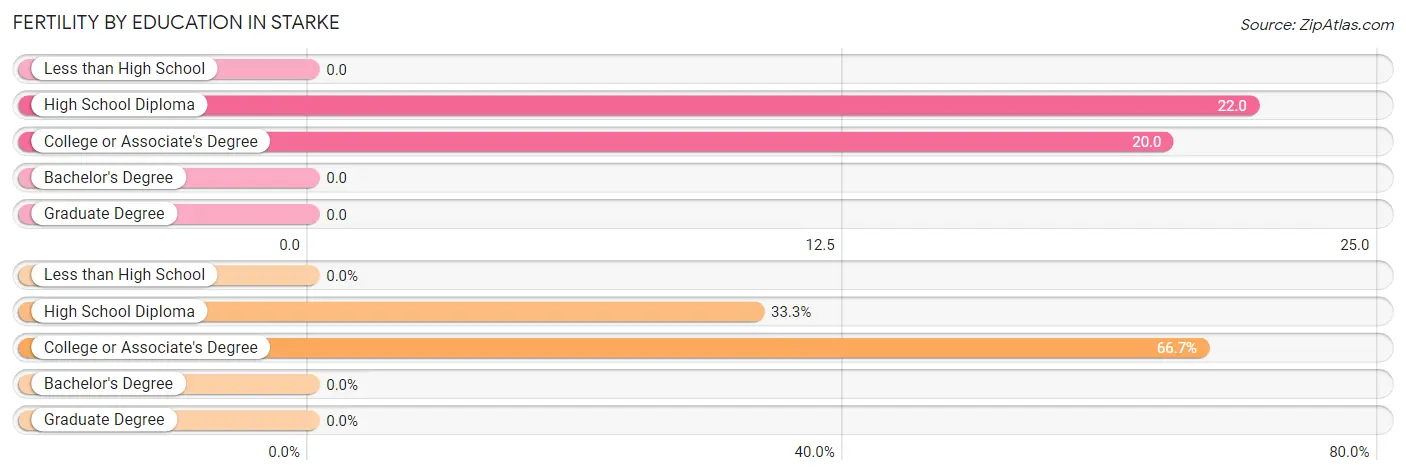
| Educational Attainment | Women with Births | Births / 1,000 Women |
| Less than High School | 0 (0.0%) | 0.0 |
| High School Diploma | 5 (33.3%) | 22.0 |
| College or Associate's Degree | 10 (66.7%) | 20.0 |
| Bachelor's Degree | 0 (0.0%) | 0.0 |
| Graduate Degree | 0 (0.0%) | 0.0 |
| Total | 15 (100.0%) | 14.0 |
Fertility by Education by Marriage Status in Starke
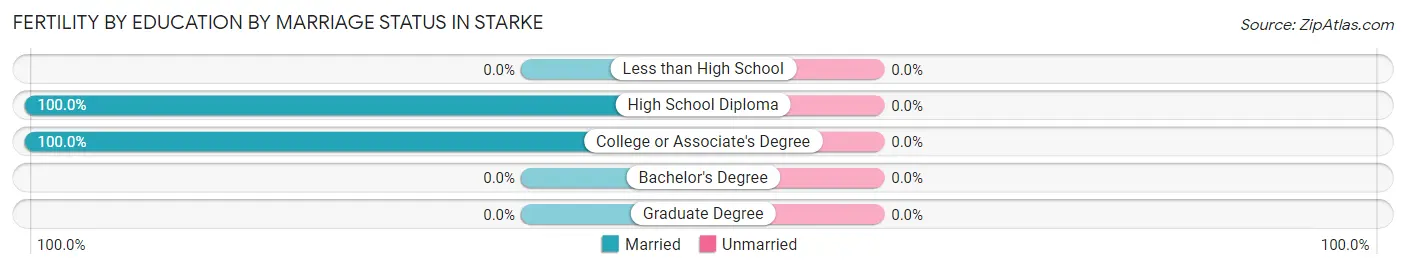
| Educational Attainment | Married | Unmarried |
| Less than High School | 0 (0.0%) | 0 (0.0%) |
| High School Diploma | 5 (100.0%) | 0 (0.0%) |
| College or Associate's Degree | 10 (100.0%) | 0 (0.0%) |
| Bachelor's Degree | 0 (0.0%) | 0 (0.0%) |
| Graduate Degree | 0 (0.0%) | 0 (0.0%) |
| Total | 15 (100.0%) | 0 (0.0%) |
Employment Characteristics in Starke
Employment by Class of Employer in Starke
Among the 2,074 employed individuals in Starke, private company employees (1,698 | 81.9%), state government employees (144 | 6.9%), and local government employees (114 | 5.5%) make up the most common classes of employment.
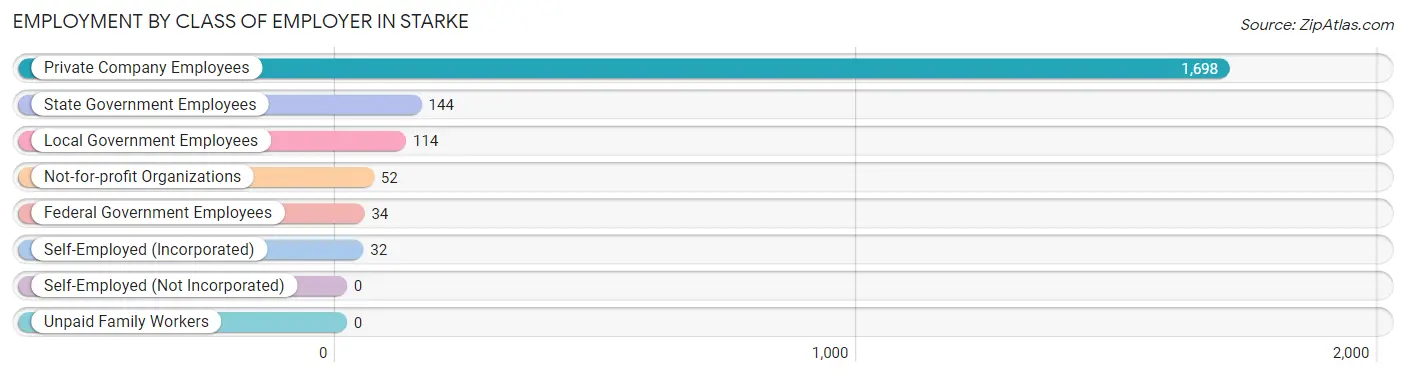
| Employer Class | # Employees | % Employees |
| Private Company Employees | 1,698 | 81.9% |
| Self-Employed (Incorporated) | 32 | 1.5% |
| Self-Employed (Not Incorporated) | 0 | 0.0% |
| Not-for-profit Organizations | 52 | 2.5% |
| Local Government Employees | 114 | 5.5% |
| State Government Employees | 144 | 6.9% |
| Federal Government Employees | 34 | 1.6% |
| Unpaid Family Workers | 0 | 0.0% |
| Total | 2,074 | 100.0% |
Employment Status by Age in Starke
According to the labor force statistics for Starke, out of the total population over 16 years of age (4,368), 49.6% or 2,167 individuals are in the labor force, with 3.9% or 85 of them unemployed. The age group with the highest labor force participation rate is 20 to 24 years, with 89.0% or 258 individuals in the labor force. Within the labor force, the 30 to 34 years age range has the highest percentage of unemployed individuals, with 16.3% or 65 of them being unemployed.
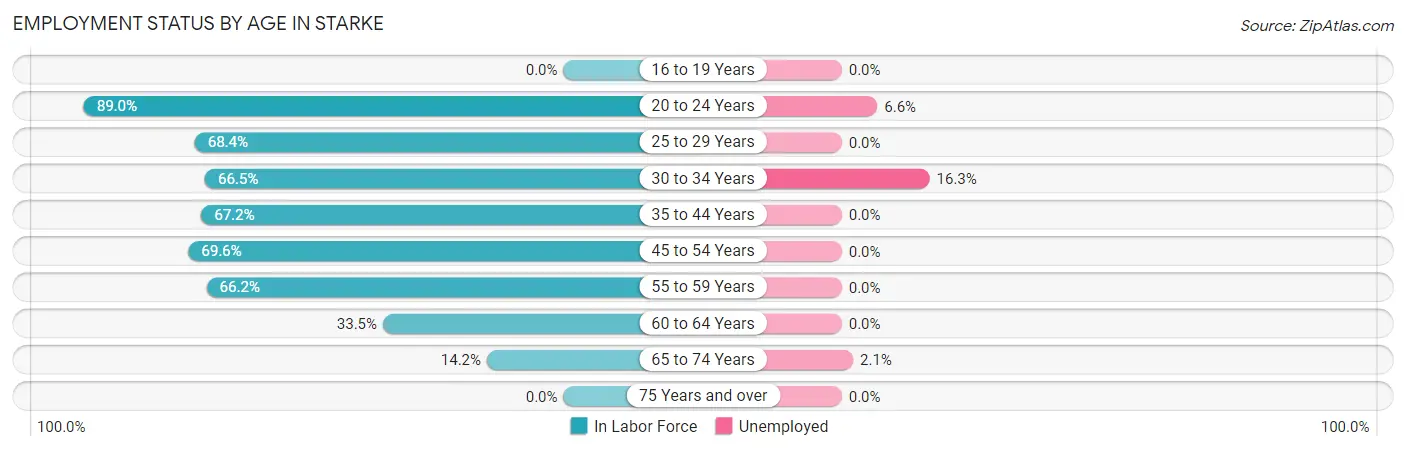
| Age Bracket | In Labor Force | Unemployed |
| 16 to 19 Years | 0 (0.0%) | 0 (0.0%) |
| 20 to 24 Years | 258 (89.0%) | 17 (6.6%) |
| 25 to 29 Years | 324 (68.4%) | 0 (0.0%) |
| 30 to 34 Years | 399 (66.5%) | 65 (16.3%) |
| 35 to 44 Years | 480 (67.2%) | 0 (0.0%) |
| 45 to 54 Years | 314 (69.6%) | 0 (0.0%) |
| 55 to 59 Years | 243 (66.2%) | 0 (0.0%) |
| 60 to 64 Years | 55 (33.5%) | 0 (0.0%) |
| 65 to 74 Years | 94 (14.2%) | 2 (2.1%) |
| 75 Years and over | 0 (0.0%) | 0 (0.0%) |
| Total | 2,167 (49.6%) | 85 (3.9%) |
Employment Status by Educational Attainment in Starke
According to labor force statistics for Starke, 65.5% of individuals (1,814) out of the total population between 25 and 64 years of age (2,770) are in the labor force, with 3.6% or 65 of them being unemployed. The group with the highest labor force participation rate are those with the educational attainment of high school diploma, with 74.3% or 834 individuals in the labor force. Within the labor force, individuals with college / associate degree education have the highest percentage of unemployment, with 4.7% or 39 of them being unemployed.
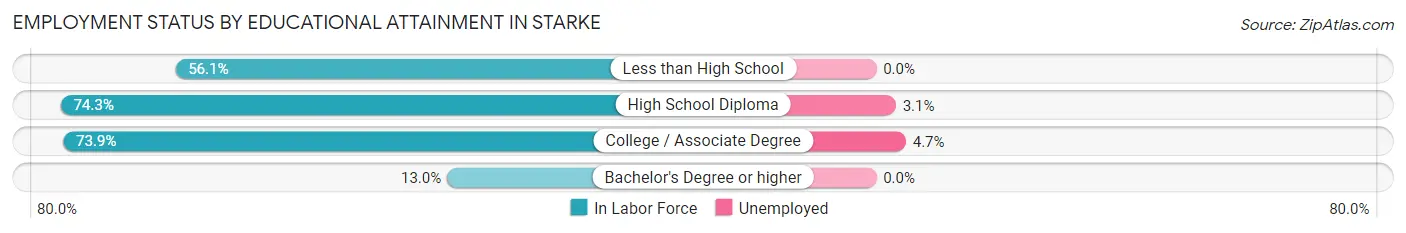
| Educational Attainment | In Labor Force | Unemployed |
| Less than High School | 110 (56.1%) | 0 (0.0%) |
| High School Diploma | 834 (74.3%) | 35 (3.1%) |
| College / Associate Degree | 828 (73.9%) | 53 (4.7%) |
| Bachelor's Degree or higher | 43 (13.0%) | 0 (0.0%) |
| Total | 1,814 (65.5%) | 100 (3.6%) |
Employment Occupations by Sex in Starke
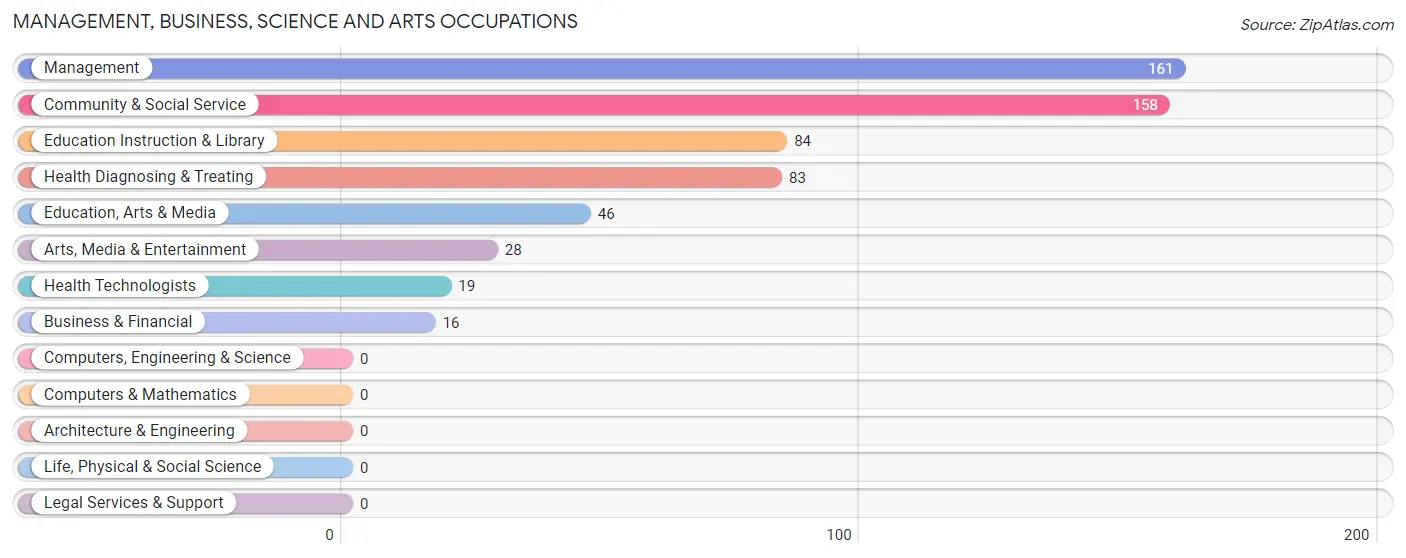
Management, Business, Science and Arts Occupations
The most common Management, Business, Science and Arts occupations in Starke are Management (161 | 7.7%), Community & Social Service (158 | 7.6%), Education Instruction & Library (84 | 4.0%), Health Diagnosing & Treating (83 | 4.0%), and Education, Arts & Media (46 | 2.2%).
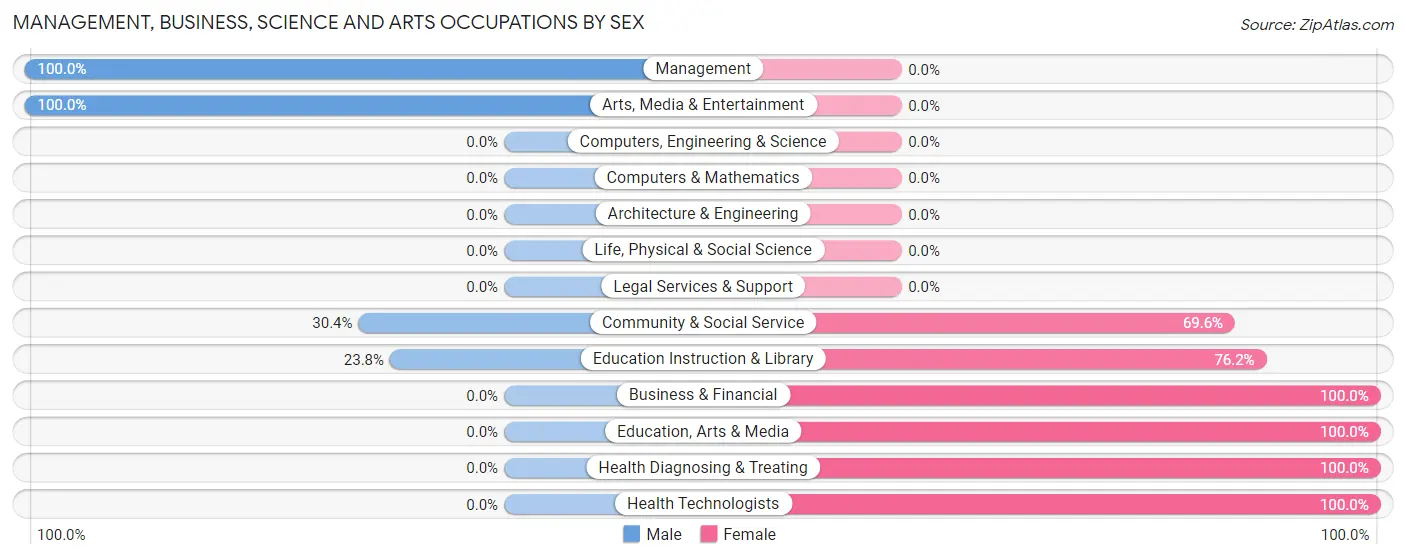
Management, Business, Science and Arts Occupations by Sex
Within the Management, Business, Science and Arts occupations in Starke, the most male-oriented occupations are Management (100.0%), Arts, Media & Entertainment (100.0%), and Community & Social Service (30.4%), while the most female-oriented occupations are Business & Financial (100.0%), Education, Arts & Media (100.0%), and Health Diagnosing & Treating (100.0%).
| Occupation | Male | Female |
| Management | 161 (100.0%) | 0 (0.0%) |
| Business & Financial | 0 (0.0%) | 16 (100.0%) |
| Computers, Engineering & Science | 0 (0.0%) | 0 (0.0%) |
| Computers & Mathematics | 0 (0.0%) | 0 (0.0%) |
| Architecture & Engineering | 0 (0.0%) | 0 (0.0%) |
| Life, Physical & Social Science | 0 (0.0%) | 0 (0.0%) |
| Community & Social Service | 48 (30.4%) | 110 (69.6%) |
| Education, Arts & Media | 0 (0.0%) | 46 (100.0%) |
| Legal Services & Support | 0 (0.0%) | 0 (0.0%) |
| Education Instruction & Library | 20 (23.8%) | 64 (76.2%) |
| Arts, Media & Entertainment | 28 (100.0%) | 0 (0.0%) |
| Health Diagnosing & Treating | 0 (0.0%) | 83 (100.0%) |
| Health Technologists | 0 (0.0%) | 19 (100.0%) |
| Total (Category) | 209 (50.0%) | 209 (50.0%) |
| Total (Overall) | 1,213 (58.2%) | 870 (41.8%) |
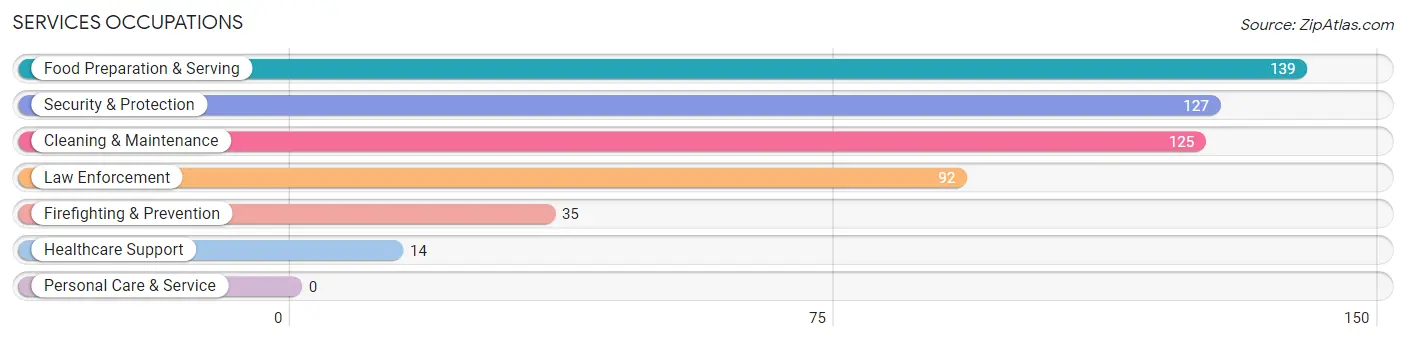
Services Occupations
The most common Services occupations in Starke are Food Preparation & Serving (139 | 6.7%), Security & Protection (127 | 6.1%), Cleaning & Maintenance (125 | 6.0%), Law Enforcement (92 | 4.4%), and Firefighting & Prevention (35 | 1.7%).
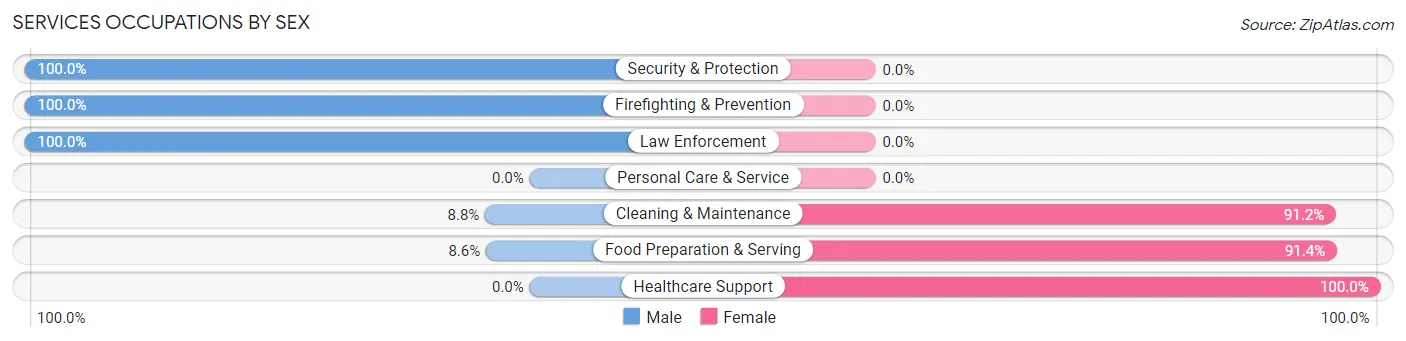
Services Occupations by Sex
Within the Services occupations in Starke, the most male-oriented occupations are Security & Protection (100.0%), Firefighting & Prevention (100.0%), and Law Enforcement (100.0%), while the most female-oriented occupations are Healthcare Support (100.0%), Food Preparation & Serving (91.4%), and Cleaning & Maintenance (91.2%).
| Occupation | Male | Female |
| Healthcare Support | 0 (0.0%) | 14 (100.0%) |
| Security & Protection | 127 (100.0%) | 0 (0.0%) |
| Firefighting & Prevention | 35 (100.0%) | 0 (0.0%) |
| Law Enforcement | 92 (100.0%) | 0 (0.0%) |
| Food Preparation & Serving | 12 (8.6%) | 127 (91.4%) |
| Cleaning & Maintenance | 11 (8.8%) | 114 (91.2%) |
| Personal Care & Service | 0 (0.0%) | 0 (0.0%) |
| Total (Category) | 150 (37.0%) | 255 (63.0%) |
| Total (Overall) | 1,213 (58.2%) | 870 (41.8%) |
Sales and Office Occupations
The most common Sales and Office occupations in Starke are Sales & Related (438 | 21.0%), and Office & Administration (169 | 8.1%).
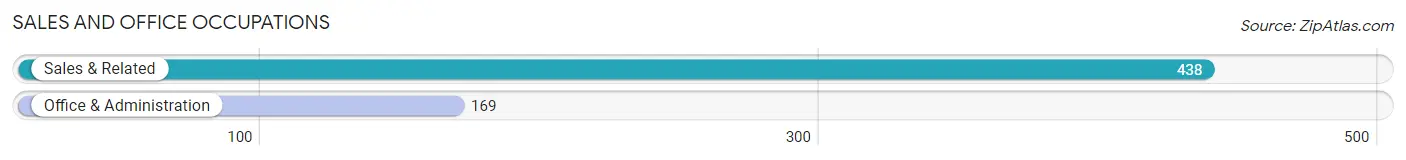
Sales and Office Occupations by Sex
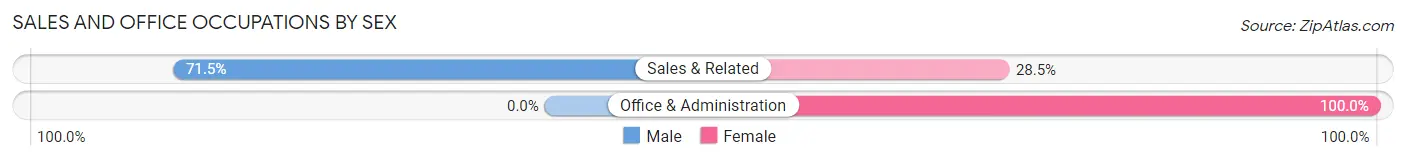
| Occupation | Male | Female |
| Sales & Related | 313 (71.5%) | 125 (28.5%) |
| Office & Administration | 0 (0.0%) | 169 (100.0%) |
| Total (Category) | 313 (51.6%) | 294 (48.4%) |
| Total (Overall) | 1,213 (58.2%) | 870 (41.8%) |
Natural Resources, Construction and Maintenance Occupations
The most common Natural Resources, Construction and Maintenance occupations in Starke are Installation, Maintenance & Repair (39 | 1.9%), and Construction & Extraction (16 | 0.8%).
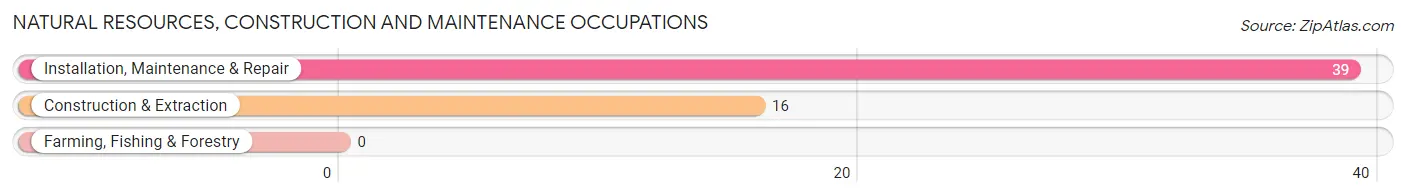
Natural Resources, Construction and Maintenance Occupations by Sex
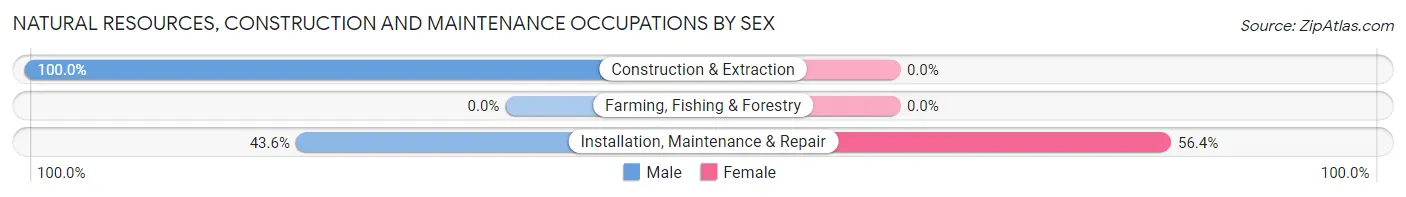
| Occupation | Male | Female |
| Farming, Fishing & Forestry | 0 (0.0%) | 0 (0.0%) |
| Construction & Extraction | 16 (100.0%) | 0 (0.0%) |
| Installation, Maintenance & Repair | 17 (43.6%) | 22 (56.4%) |
| Total (Category) | 33 (60.0%) | 22 (40.0%) |
| Total (Overall) | 1,213 (58.2%) | 870 (41.8%) |
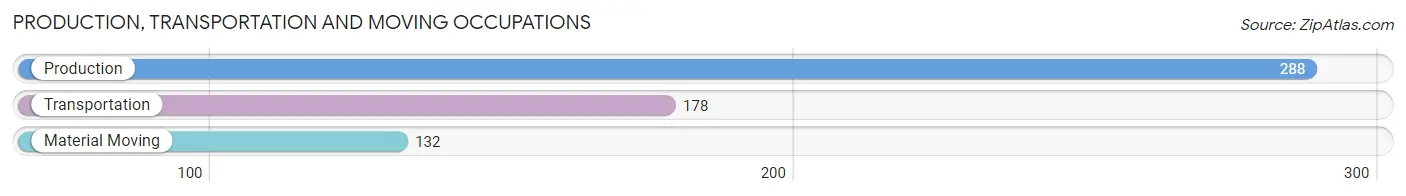
Production, Transportation and Moving Occupations
The most common Production, Transportation and Moving occupations in Starke are Production (288 | 13.8%), Transportation (178 | 8.6%), and Material Moving (132 | 6.3%).
Production, Transportation and Moving Occupations by Sex
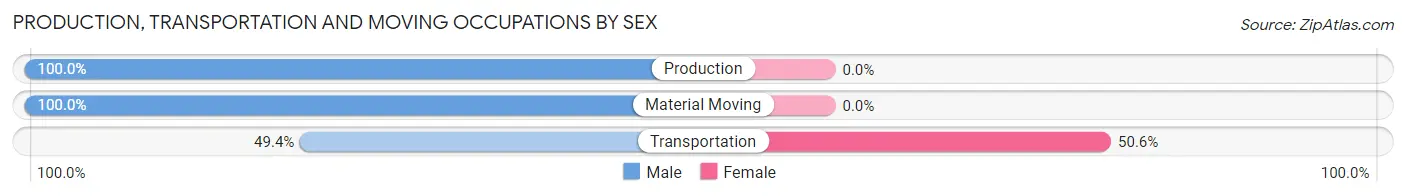
| Occupation | Male | Female |
| Production | 288 (100.0%) | 0 (0.0%) |
| Transportation | 88 (49.4%) | 90 (50.6%) |
| Material Moving | 132 (100.0%) | 0 (0.0%) |
| Total (Category) | 508 (85.0%) | 90 (15.0%) |
| Total (Overall) | 1,213 (58.2%) | 870 (41.8%) |
Employment Industries by Sex in Starke
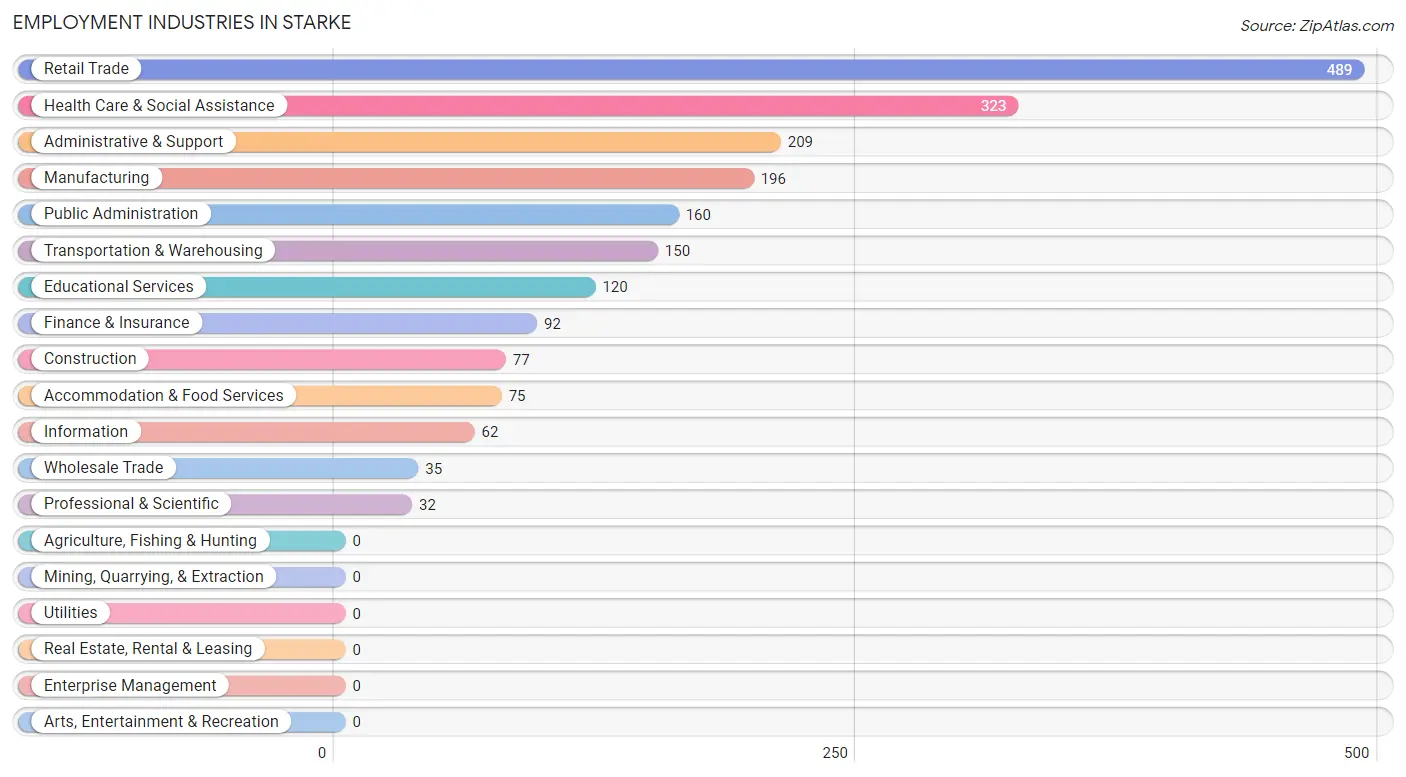
Employment Industries in Starke
The major employment industries in Starke include Retail Trade (489 | 23.5%), Health Care & Social Assistance (323 | 15.5%), Administrative & Support (209 | 10.0%), Manufacturing (196 | 9.4%), and Public Administration (160 | 7.7%).
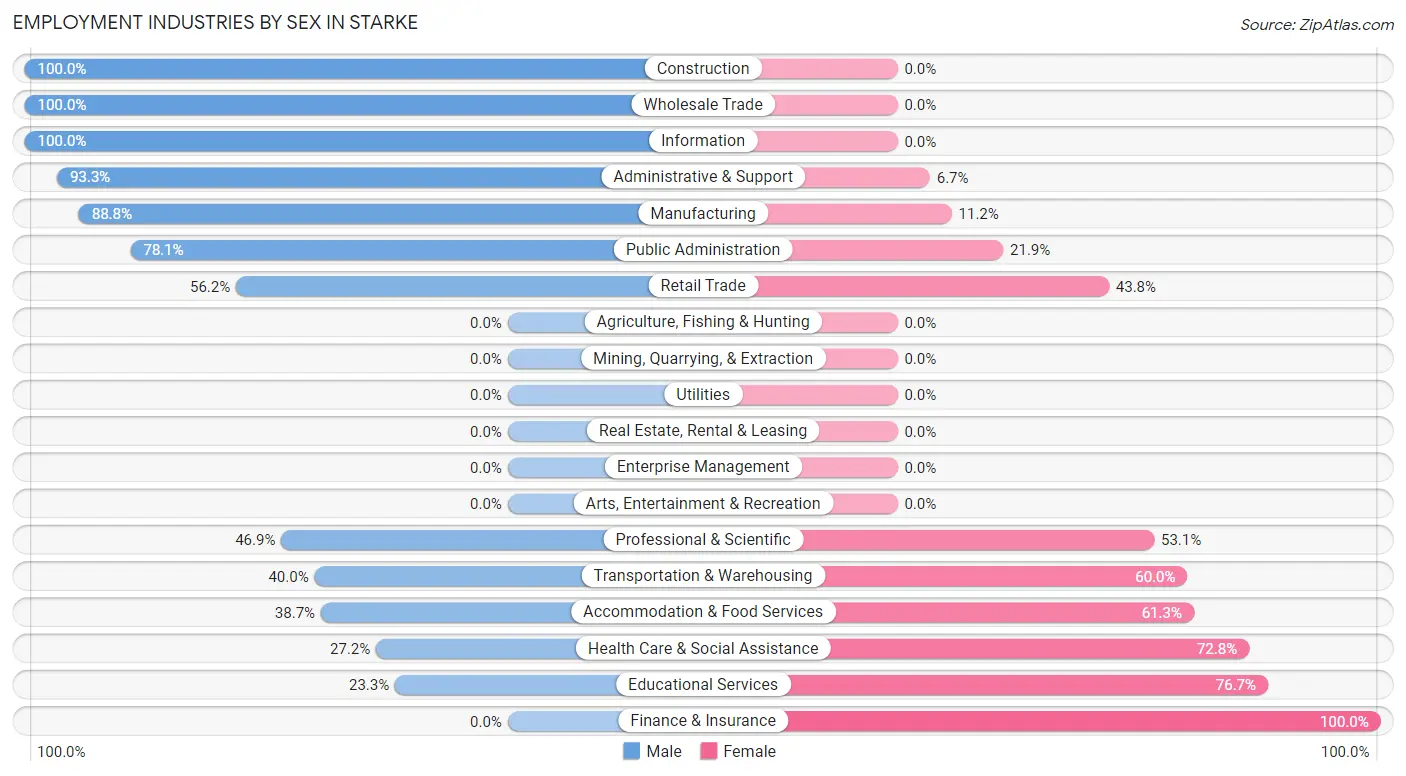
Employment Industries by Sex in Starke
The Starke industries that see more men than women are Construction (100.0%), Wholesale Trade (100.0%), and Information (100.0%), whereas the industries that tend to have a higher number of women are Finance & Insurance (100.0%), Educational Services (76.7%), and Health Care & Social Assistance (72.8%).
| Industry | Male | Female |
| Agriculture, Fishing & Hunting | 0 (0.0%) | 0 (0.0%) |
| Mining, Quarrying, & Extraction | 0 (0.0%) | 0 (0.0%) |
| Construction | 77 (100.0%) | 0 (0.0%) |
| Manufacturing | 174 (88.8%) | 22 (11.2%) |
| Wholesale Trade | 35 (100.0%) | 0 (0.0%) |
| Retail Trade | 275 (56.2%) | 214 (43.8%) |
| Transportation & Warehousing | 60 (40.0%) | 90 (60.0%) |
| Utilities | 0 (0.0%) | 0 (0.0%) |
| Information | 62 (100.0%) | 0 (0.0%) |
| Finance & Insurance | 0 (0.0%) | 92 (100.0%) |
| Real Estate, Rental & Leasing | 0 (0.0%) | 0 (0.0%) |
| Professional & Scientific | 15 (46.9%) | 17 (53.1%) |
| Enterprise Management | 0 (0.0%) | 0 (0.0%) |
| Administrative & Support | 195 (93.3%) | 14 (6.7%) |
| Educational Services | 28 (23.3%) | 92 (76.7%) |
| Health Care & Social Assistance | 88 (27.2%) | 235 (72.8%) |
| Arts, Entertainment & Recreation | 0 (0.0%) | 0 (0.0%) |
| Accommodation & Food Services | 29 (38.7%) | 46 (61.3%) |
| Public Administration | 125 (78.1%) | 35 (21.9%) |
| Total | 1,213 (58.2%) | 870 (41.8%) |
Education in Starke
School Enrollment in Starke
The most common levels of schooling among the 1,651 students in Starke are college / undergraduate (508 | 30.8%), middle school (381 | 23.1%), and elementary school (268 | 16.2%).
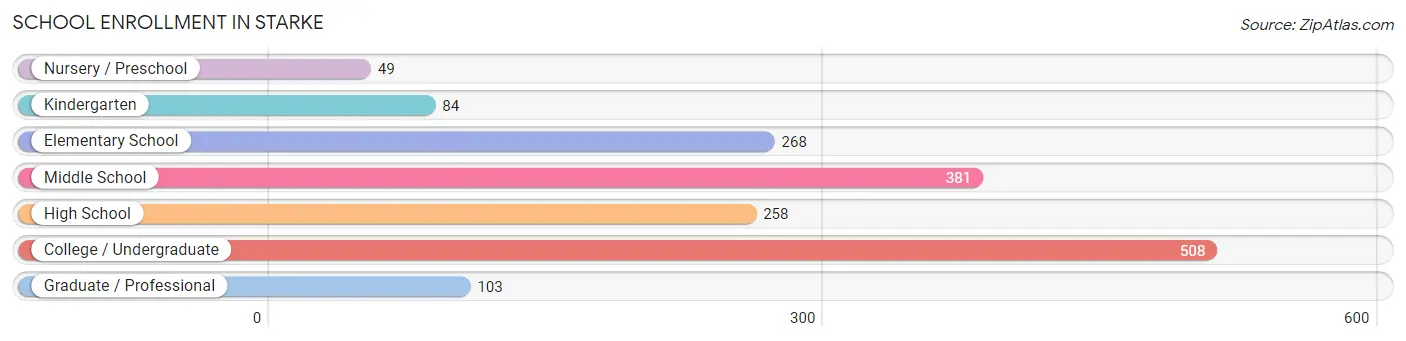
| School Level | # Students | % Students |
| Nursery / Preschool | 49 | 3.0% |
| Kindergarten | 84 | 5.1% |
| Elementary School | 268 | 16.2% |
| Middle School | 381 | 23.1% |
| High School | 258 | 15.6% |
| College / Undergraduate | 508 | 30.8% |
| Graduate / Professional | 103 | 6.2% |
| Total | 1,651 | 100.0% |
School Enrollment by Age by Funding Source in Starke
Out of a total of 1,651 students who are enrolled in schools in Starke, 231 (14.0%) attend a private institution, while the remaining 1,420 (86.0%) are enrolled in public schools. The age group of 18 to 19 year olds has the highest likelihood of being enrolled in private schools, with 22 (100.0% in the age bracket) enrolled. Conversely, the age group of 15 to 17 year olds has the lowest likelihood of being enrolled in a private school, with 190 (100.0% in the age bracket) attending a public institution.
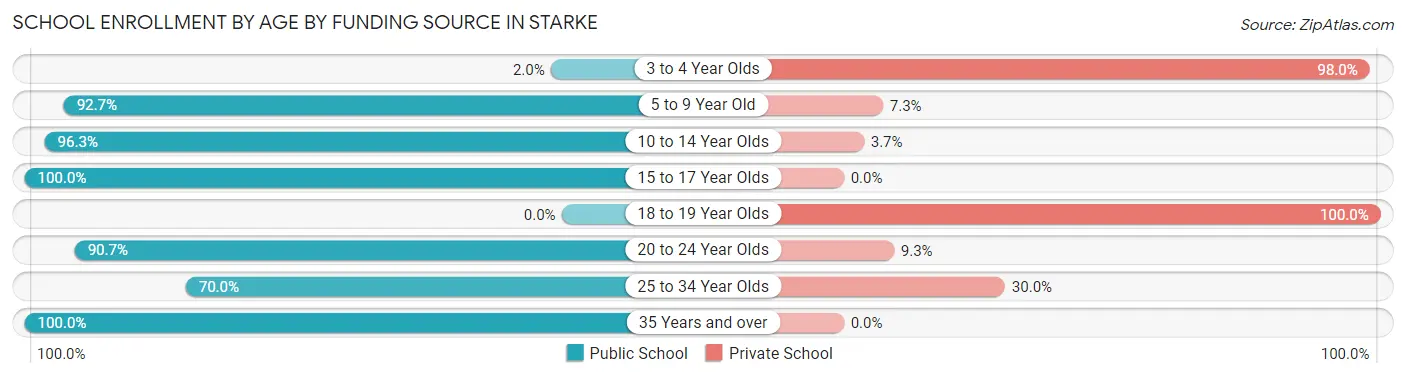
| Age Bracket | Public School | Private School |
| 3 to 4 Year Olds | 1 (2.0%) | 48 (98.0%) |
| 5 to 9 Year Old | 292 (92.7%) | 23 (7.3%) |
| 10 to 14 Year Olds | 463 (96.3%) | 18 (3.7%) |
| 15 to 17 Year Olds | 190 (100.0%) | 0 (0.0%) |
| 18 to 19 Year Olds | 0 (0.0%) | 22 (100.0%) |
| 20 to 24 Year Olds | 165 (90.7%) | 17 (9.3%) |
| 25 to 34 Year Olds | 240 (70.0%) | 103 (30.0%) |
| 35 Years and over | 69 (100.0%) | 0 (0.0%) |
| Total | 1,420 (86.0%) | 231 (14.0%) |
Educational Attainment by Field of Study in Starke
Education (156 | 32.6%), liberal arts & history (103 | 21.5%), bio, nature & agricultural (95 | 19.8%), multidisciplinary studies (46 | 9.6%), and psychology (27 | 5.6%) are the most common fields of study among 479 individuals in Starke who have obtained a bachelor's degree or higher.
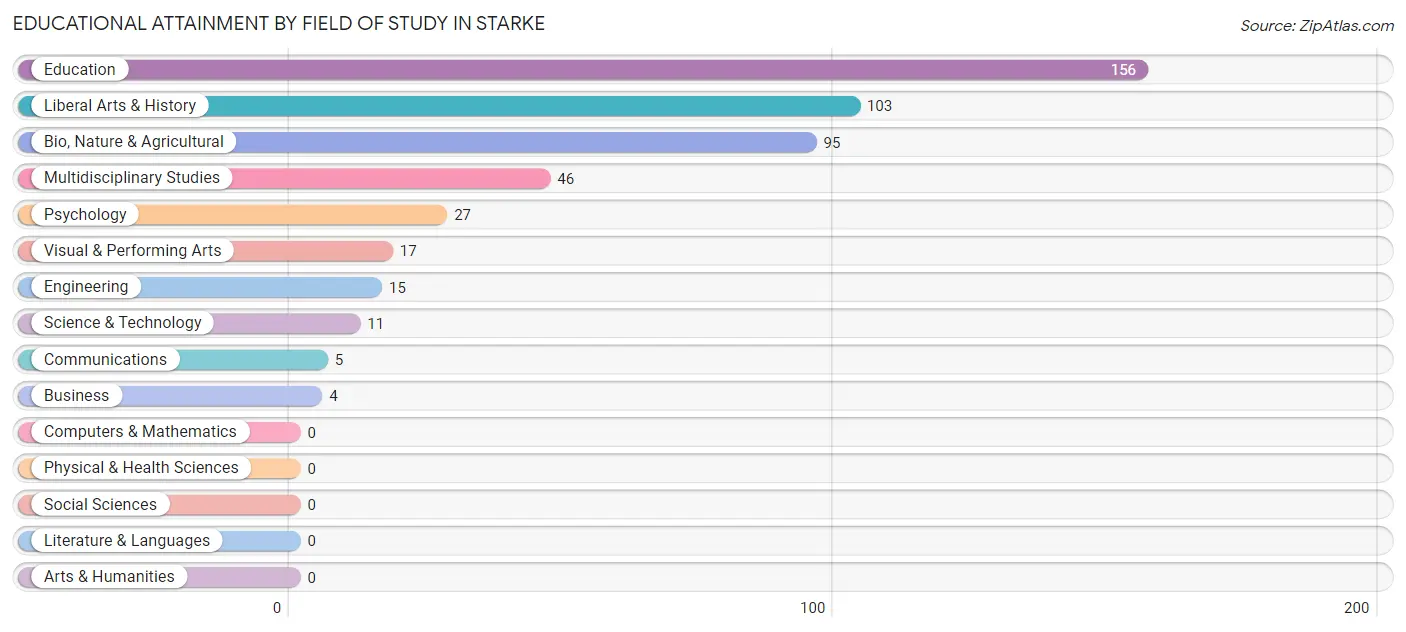
| Field of Study | # Graduates | % Graduates |
| Computers & Mathematics | 0 | 0.0% |
| Bio, Nature & Agricultural | 95 | 19.8% |
| Physical & Health Sciences | 0 | 0.0% |
| Psychology | 27 | 5.6% |
| Social Sciences | 0 | 0.0% |
| Engineering | 15 | 3.1% |
| Multidisciplinary Studies | 46 | 9.6% |
| Science & Technology | 11 | 2.3% |
| Business | 4 | 0.8% |
| Education | 156 | 32.6% |
| Literature & Languages | 0 | 0.0% |
| Liberal Arts & History | 103 | 21.5% |
| Visual & Performing Arts | 17 | 3.5% |
| Communications | 5 | 1.0% |
| Arts & Humanities | 0 | 0.0% |
| Total | 479 | 100.0% |
Transportation & Commute in Starke
Vehicle Availability by Sex in Starke
The most prevalent vehicle ownership categories in Starke are males with 2 vehicles (743, accounting for 61.7%) and females with 2 vehicles (364, making up 85.4%).
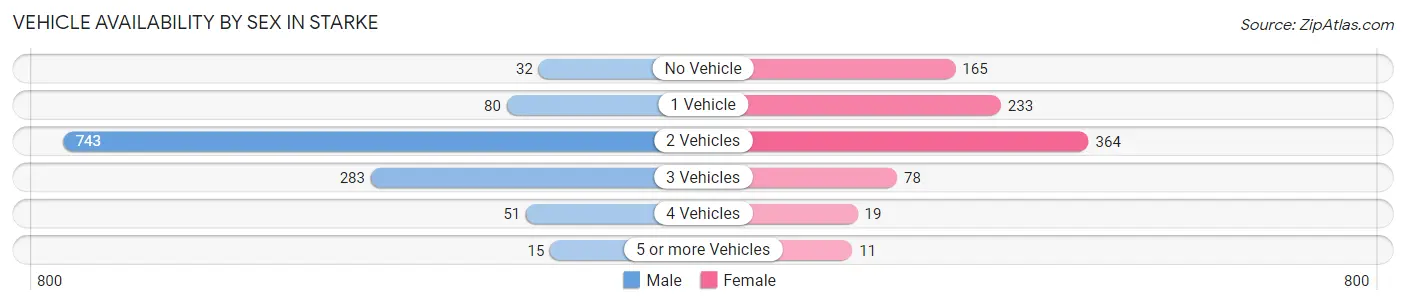
| Vehicles Available | Male | Female |
| No Vehicle | 32 (2.7%) | 165 (19.0%) |
| 1 Vehicle | 80 (6.6%) | 233 (26.8%) |
| 2 Vehicles | 743 (61.7%) | 364 (41.8%) |
| 3 Vehicles | 283 (23.5%) | 78 (9.0%) |
| 4 Vehicles | 51 (4.2%) | 19 (2.2%) |
| 5 or more Vehicles | 15 (1.3%) | 11 (1.3%) |
| Total | 1,204 (100.0%) | 870 (100.0%) |
Commute Time in Starke
The most frequently occuring commute durations in Starke are 5 to 9 minutes (670 commuters, 33.8%), 45 to 59 minutes (376 commuters, 18.9%), and 60 to 89 minutes (308 commuters, 15.5%).
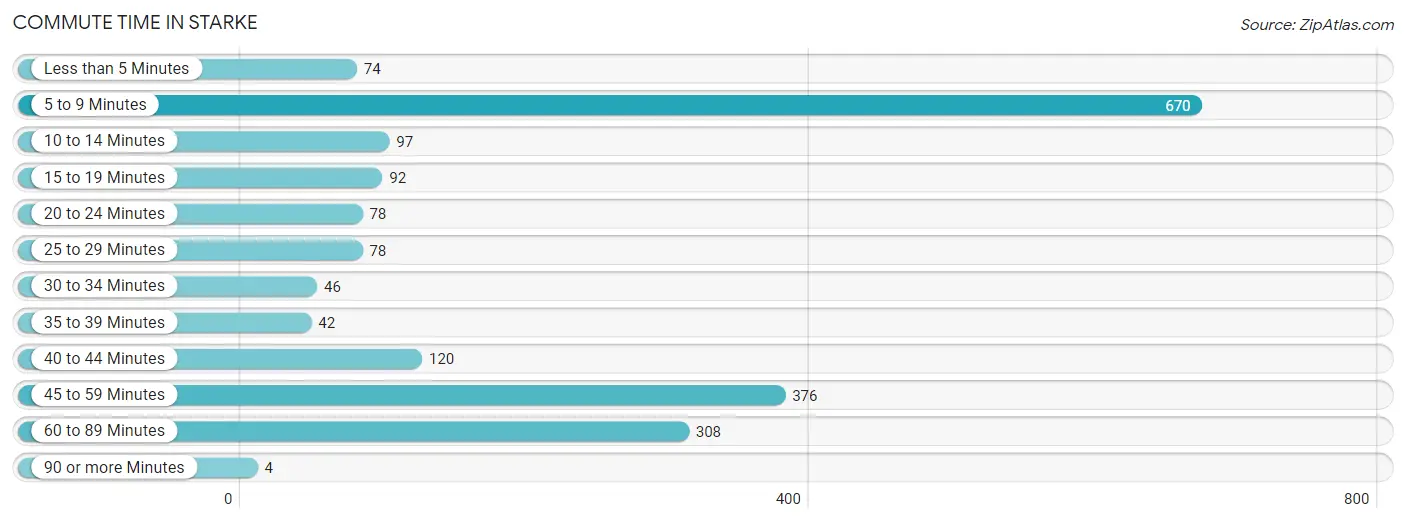
| Commute Time | # Commuters | % Commuters |
| Less than 5 Minutes | 74 | 3.7% |
| 5 to 9 Minutes | 670 | 33.8% |
| 10 to 14 Minutes | 97 | 4.9% |
| 15 to 19 Minutes | 92 | 4.6% |
| 20 to 24 Minutes | 78 | 3.9% |
| 25 to 29 Minutes | 78 | 3.9% |
| 30 to 34 Minutes | 46 | 2.3% |
| 35 to 39 Minutes | 42 | 2.1% |
| 40 to 44 Minutes | 120 | 6.0% |
| 45 to 59 Minutes | 376 | 18.9% |
| 60 to 89 Minutes | 308 | 15.5% |
| 90 or more Minutes | 4 | 0.2% |
Commute Time by Sex in Starke
The most common commute times in Starke are 5 to 9 minutes (310 commuters, 27.4%) for males and 5 to 9 minutes (360 commuters, 42.1%) for females.
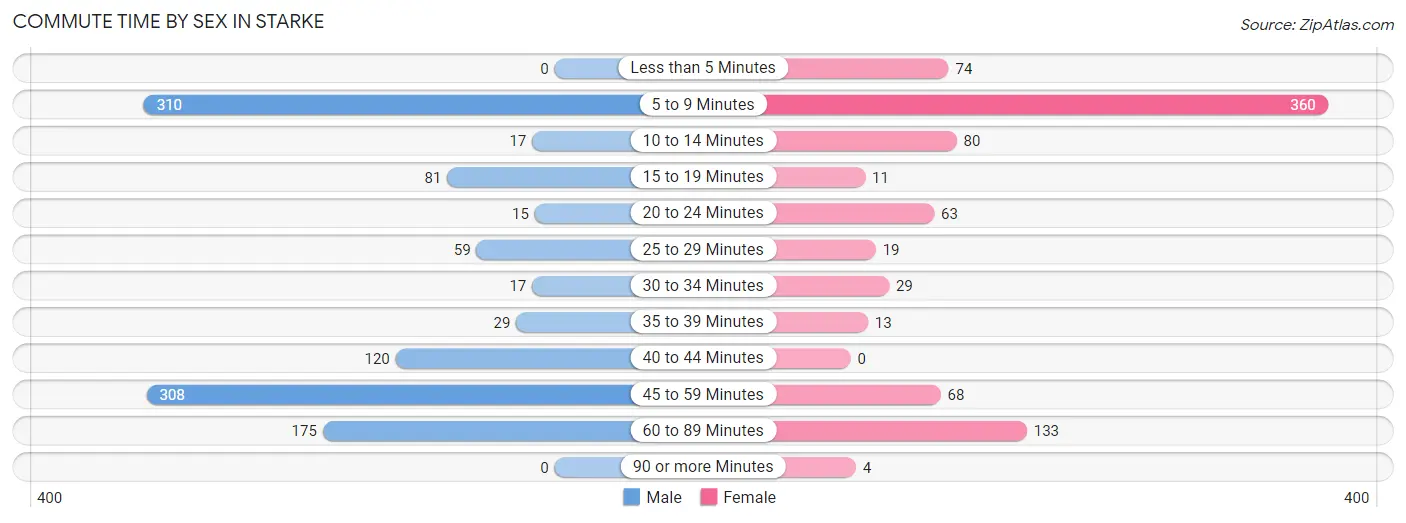
| Commute Time | Male | Female |
| Less than 5 Minutes | 0 (0.0%) | 74 (8.7%) |
| 5 to 9 Minutes | 310 (27.4%) | 360 (42.1%) |
| 10 to 14 Minutes | 17 (1.5%) | 80 (9.4%) |
| 15 to 19 Minutes | 81 (7.2%) | 11 (1.3%) |
| 20 to 24 Minutes | 15 (1.3%) | 63 (7.4%) |
| 25 to 29 Minutes | 59 (5.2%) | 19 (2.2%) |
| 30 to 34 Minutes | 17 (1.5%) | 29 (3.4%) |
| 35 to 39 Minutes | 29 (2.6%) | 13 (1.5%) |
| 40 to 44 Minutes | 120 (10.6%) | 0 (0.0%) |
| 45 to 59 Minutes | 308 (27.2%) | 68 (8.0%) |
| 60 to 89 Minutes | 175 (15.5%) | 133 (15.6%) |
| 90 or more Minutes | 0 (0.0%) | 4 (0.5%) |
Time of Departure to Work by Sex in Starke
The most frequent times of departure to work in Starke are 8:00 AM to 8:29 AM (308, 27.2%) for males and 6:30 AM to 6:59 AM (140, 16.4%) for females.
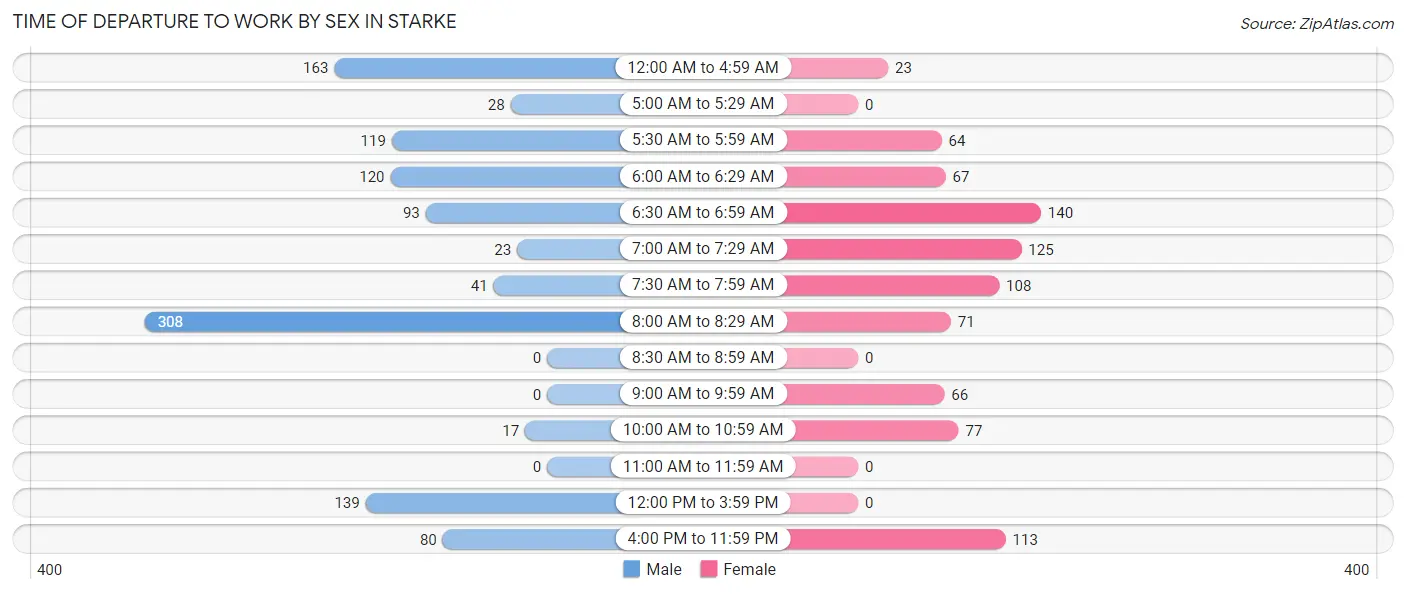
| Time of Departure | Male | Female |
| 12:00 AM to 4:59 AM | 163 (14.4%) | 23 (2.7%) |
| 5:00 AM to 5:29 AM | 28 (2.5%) | 0 (0.0%) |
| 5:30 AM to 5:59 AM | 119 (10.5%) | 64 (7.5%) |
| 6:00 AM to 6:29 AM | 120 (10.6%) | 67 (7.9%) |
| 6:30 AM to 6:59 AM | 93 (8.2%) | 140 (16.4%) |
| 7:00 AM to 7:29 AM | 23 (2.0%) | 125 (14.6%) |
| 7:30 AM to 7:59 AM | 41 (3.6%) | 108 (12.7%) |
| 8:00 AM to 8:29 AM | 308 (27.2%) | 71 (8.3%) |
| 8:30 AM to 8:59 AM | 0 (0.0%) | 0 (0.0%) |
| 9:00 AM to 9:59 AM | 0 (0.0%) | 66 (7.7%) |
| 10:00 AM to 10:59 AM | 17 (1.5%) | 77 (9.0%) |
| 11:00 AM to 11:59 AM | 0 (0.0%) | 0 (0.0%) |
| 12:00 PM to 3:59 PM | 139 (12.3%) | 0 (0.0%) |
| 4:00 PM to 11:59 PM | 80 (7.1%) | 113 (13.2%) |
| Total | 1,131 (100.0%) | 854 (100.0%) |
Housing Occupancy in Starke
Occupancy by Ownership in Starke
Of the total 2,124 dwellings in Starke, owner-occupied units account for 1,211 (57.0%), while renter-occupied units make up 913 (43.0%).
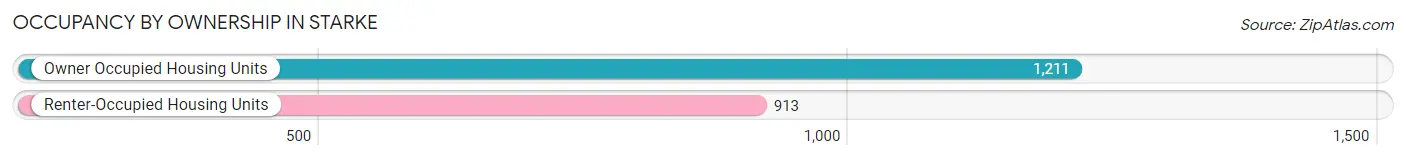
| Occupancy | # Housing Units | % Housing Units |
| Owner Occupied Housing Units | 1,211 | 57.0% |
| Renter-Occupied Housing Units | 913 | 43.0% |
| Total Occupied Housing Units | 2,124 | 100.0% |
Occupancy by Household Size in Starke
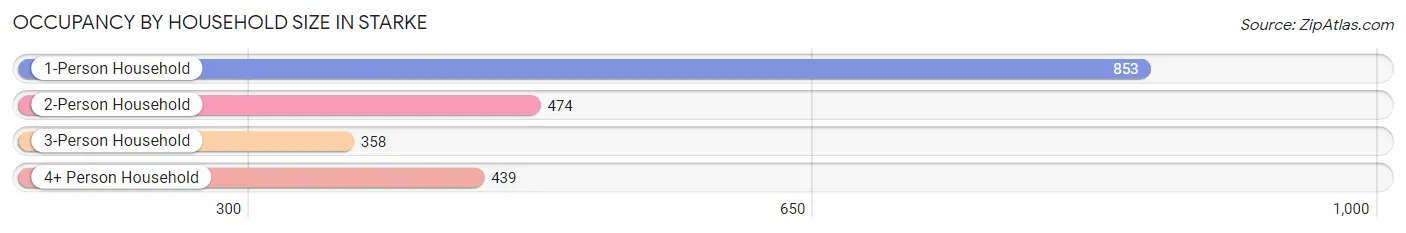
| Household Size | # Housing Units | % Housing Units |
| 1-Person Household | 853 | 40.2% |
| 2-Person Household | 474 | 22.3% |
| 3-Person Household | 358 | 16.9% |
| 4+ Person Household | 439 | 20.7% |
| Total Housing Units | 2,124 | 100.0% |
Occupancy by Ownership by Household Size in Starke
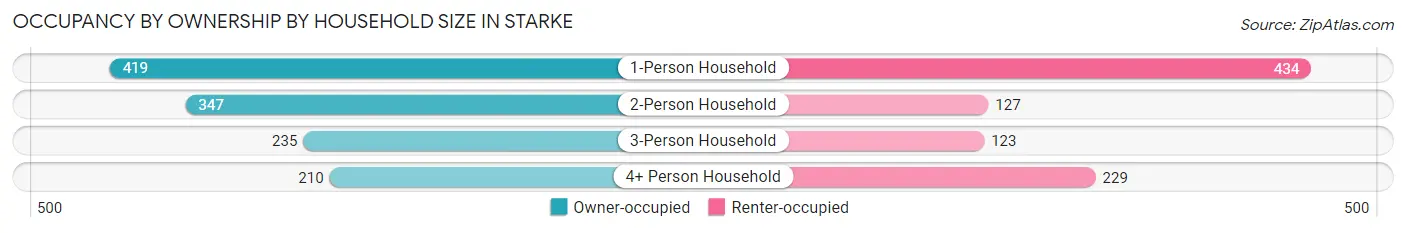
| Household Size | Owner-occupied | Renter-occupied |
| 1-Person Household | 419 (49.1%) | 434 (50.9%) |
| 2-Person Household | 347 (73.2%) | 127 (26.8%) |
| 3-Person Household | 235 (65.6%) | 123 (34.4%) |
| 4+ Person Household | 210 (47.8%) | 229 (52.2%) |
| Total Housing Units | 1,211 (57.0%) | 913 (43.0%) |
Occupancy by Educational Attainment in Starke
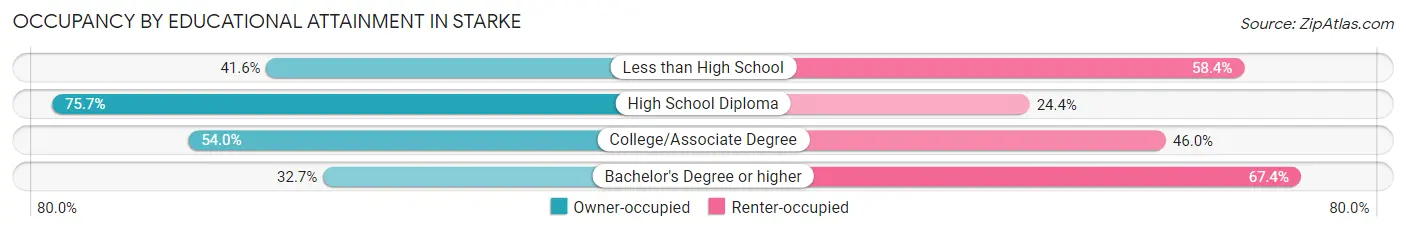
| Household Size | Owner-occupied | Renter-occupied |
| Less than High School | 112 (41.6%) | 157 (58.4%) |
| High School Diploma | 556 (75.6%) | 179 (24.3%) |
| College/Associate Degree | 448 (54.0%) | 381 (46.0%) |
| Bachelor's Degree or higher | 95 (32.7%) | 196 (67.3%) |
Occupancy by Age of Householder in Starke
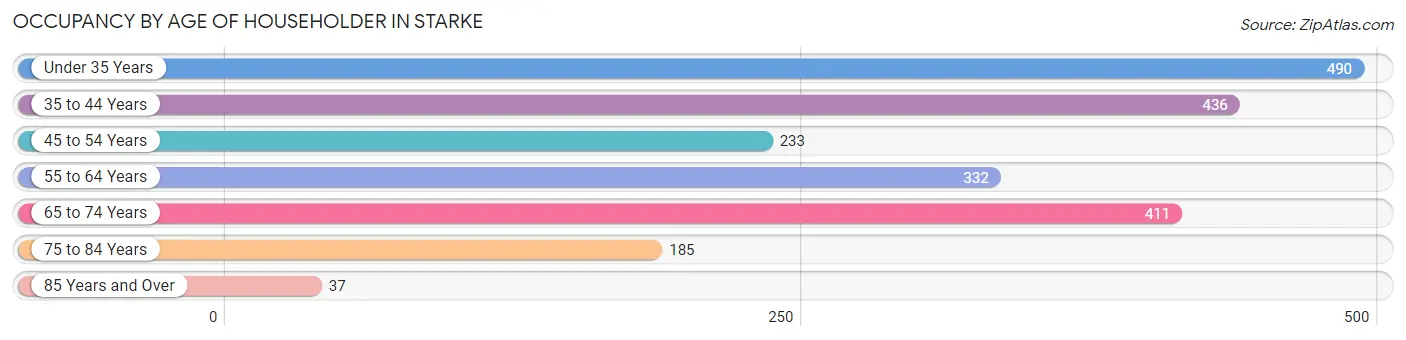
| Age Bracket | # Households | % Households |
| Under 35 Years | 490 | 23.1% |
| 35 to 44 Years | 436 | 20.5% |
| 45 to 54 Years | 233 | 11.0% |
| 55 to 64 Years | 332 | 15.6% |
| 65 to 74 Years | 411 | 19.4% |
| 75 to 84 Years | 185 | 8.7% |
| 85 Years and Over | 37 | 1.7% |
| Total | 2,124 | 100.0% |
Housing Finances in Starke
Median Income by Occupancy in Starke
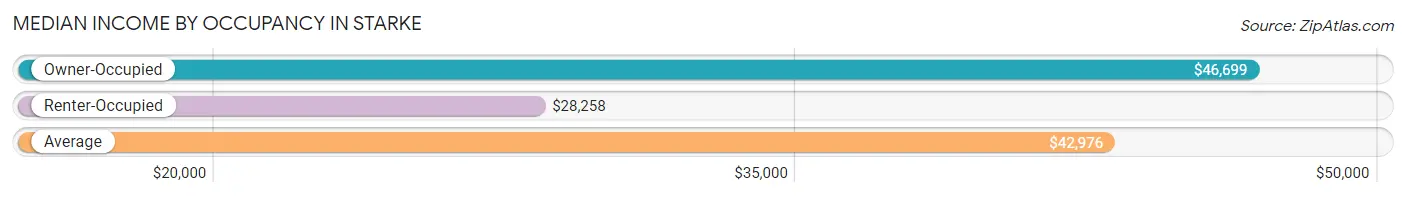
| Occupancy Type | # Households | Median Income |
| Owner-Occupied | 1,211 (57.0%) | $46,699 |
| Renter-Occupied | 913 (43.0%) | $28,258 |
| Average | 2,124 (100.0%) | $42,976 |
Occupancy by Householder Income Bracket in Starke
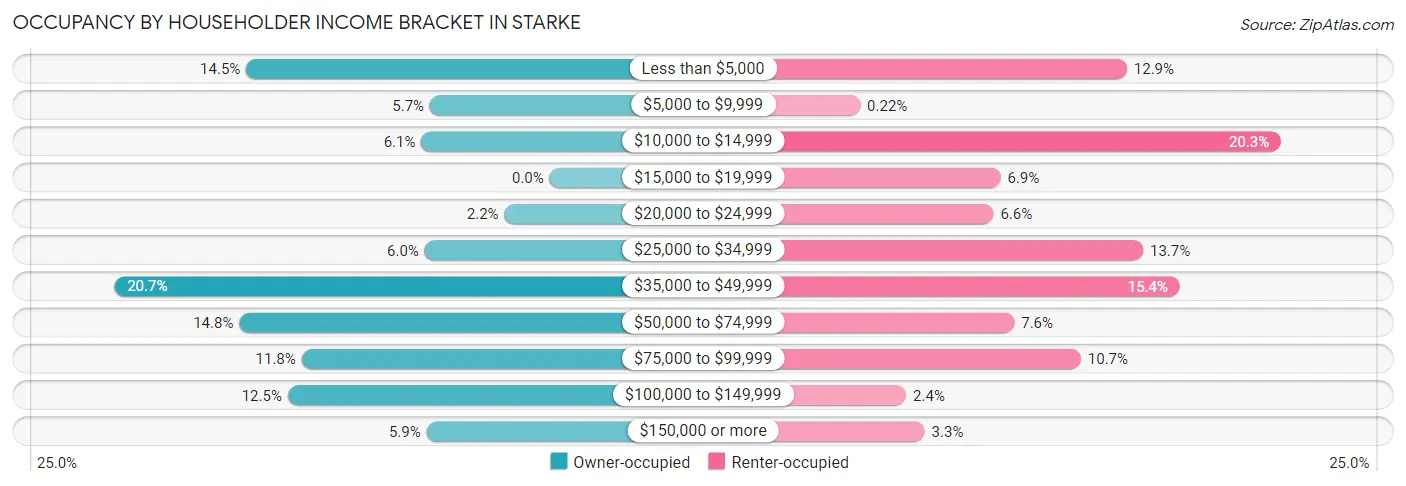
| Income Bracket | Owner-occupied | Renter-occupied |
| Less than $5,000 | 175 (14.4%) | 118 (12.9%) |
| $5,000 to $9,999 | 69 (5.7%) | 2 (0.2%) |
| $10,000 to $14,999 | 74 (6.1%) | 185 (20.3%) |
| $15,000 to $19,999 | 0 (0.0%) | 63 (6.9%) |
| $20,000 to $24,999 | 26 (2.1%) | 60 (6.6%) |
| $25,000 to $34,999 | 72 (5.9%) | 125 (13.7%) |
| $35,000 to $49,999 | 251 (20.7%) | 141 (15.4%) |
| $50,000 to $74,999 | 179 (14.8%) | 69 (7.6%) |
| $75,000 to $99,999 | 143 (11.8%) | 98 (10.7%) |
| $100,000 to $149,999 | 151 (12.5%) | 22 (2.4%) |
| $150,000 or more | 71 (5.9%) | 30 (3.3%) |
| Total | 1,211 (100.0%) | 913 (100.0%) |
Monthly Housing Cost Tiers in Starke
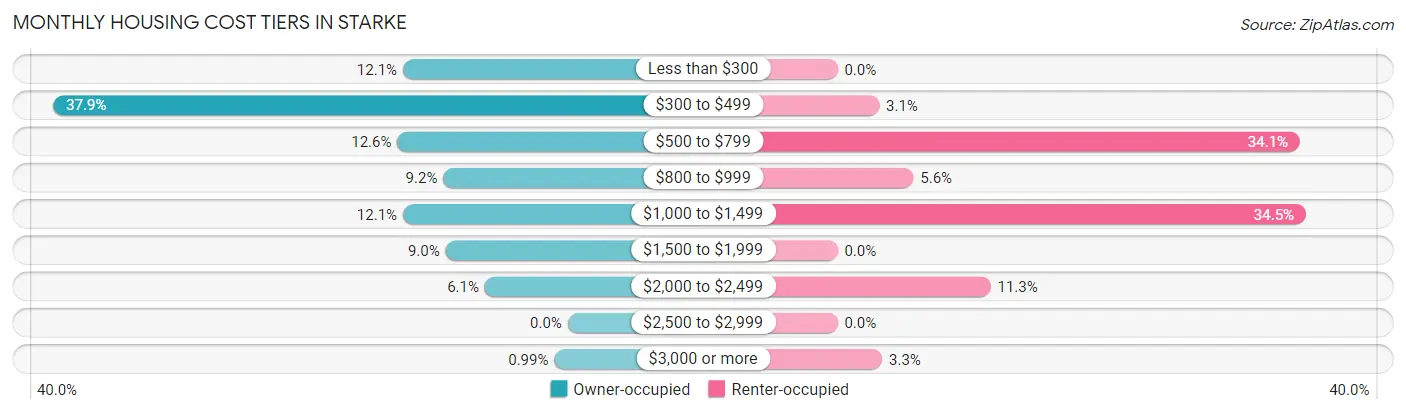
| Monthly Cost | Owner-occupied | Renter-occupied |
| Less than $300 | 147 (12.1%) | 0 (0.0%) |
| $300 to $499 | 459 (37.9%) | 28 (3.1%) |
| $500 to $799 | 152 (12.6%) | 311 (34.1%) |
| $800 to $999 | 111 (9.2%) | 51 (5.6%) |
| $1,000 to $1,499 | 147 (12.1%) | 315 (34.5%) |
| $1,500 to $1,999 | 109 (9.0%) | 0 (0.0%) |
| $2,000 to $2,499 | 74 (6.1%) | 103 (11.3%) |
| $2,500 to $2,999 | 0 (0.0%) | 0 (0.0%) |
| $3,000 or more | 12 (1.0%) | 30 (3.3%) |
| Total | 1,211 (100.0%) | 913 (100.0%) |
Physical Housing Characteristics in Starke
Housing Structures in Starke
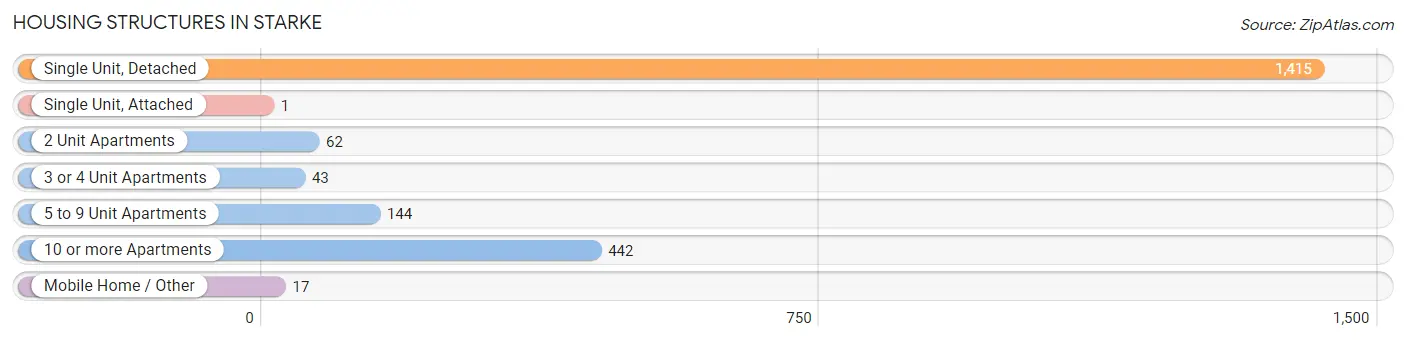
| Structure Type | # Housing Units | % Housing Units |
| Single Unit, Detached | 1,415 | 66.6% |
| Single Unit, Attached | 1 | 0.1% |
| 2 Unit Apartments | 62 | 2.9% |
| 3 or 4 Unit Apartments | 43 | 2.0% |
| 5 to 9 Unit Apartments | 144 | 6.8% |
| 10 or more Apartments | 442 | 20.8% |
| Mobile Home / Other | 17 | 0.8% |
| Total | 2,124 | 100.0% |
Housing Structures by Occupancy in Starke
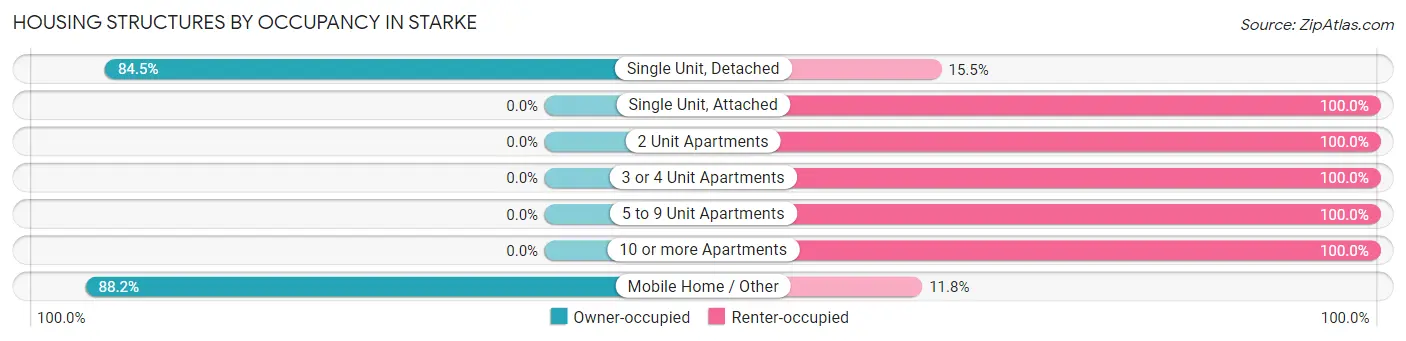
| Structure Type | Owner-occupied | Renter-occupied |
| Single Unit, Detached | 1,196 (84.5%) | 219 (15.5%) |
| Single Unit, Attached | 0 (0.0%) | 1 (100.0%) |
| 2 Unit Apartments | 0 (0.0%) | 62 (100.0%) |
| 3 or 4 Unit Apartments | 0 (0.0%) | 43 (100.0%) |
| 5 to 9 Unit Apartments | 0 (0.0%) | 144 (100.0%) |
| 10 or more Apartments | 0 (0.0%) | 442 (100.0%) |
| Mobile Home / Other | 15 (88.2%) | 2 (11.8%) |
| Total | 1,211 (57.0%) | 913 (43.0%) |
Housing Structures by Number of Rooms in Starke
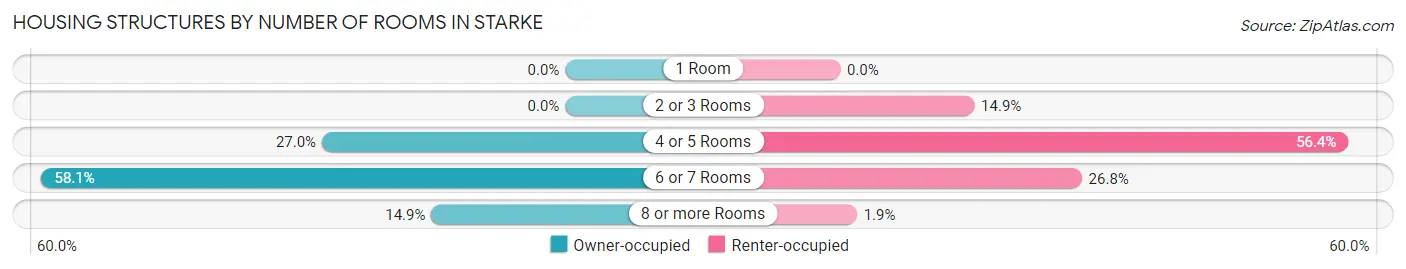
| Number of Rooms | Owner-occupied | Renter-occupied |
| 1 Room | 0 (0.0%) | 0 (0.0%) |
| 2 or 3 Rooms | 0 (0.0%) | 136 (14.9%) |
| 4 or 5 Rooms | 327 (27.0%) | 515 (56.4%) |
| 6 or 7 Rooms | 704 (58.1%) | 245 (26.8%) |
| 8 or more Rooms | 180 (14.9%) | 17 (1.9%) |
| Total | 1,211 (100.0%) | 913 (100.0%) |
Housing Structure by Heating Type in Starke
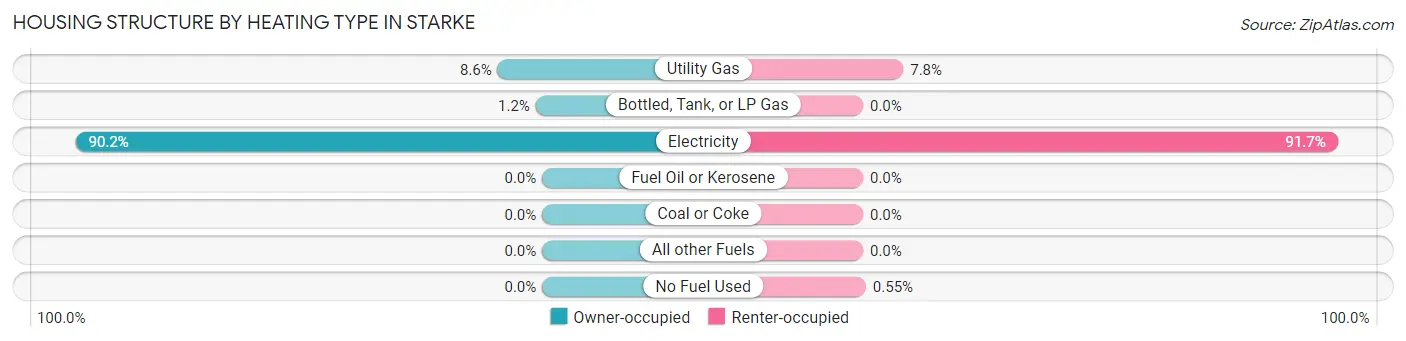
| Heating Type | Owner-occupied | Renter-occupied |
| Utility Gas | 104 (8.6%) | 71 (7.8%) |
| Bottled, Tank, or LP Gas | 15 (1.2%) | 0 (0.0%) |
| Electricity | 1,092 (90.2%) | 837 (91.7%) |
| Fuel Oil or Kerosene | 0 (0.0%) | 0 (0.0%) |
| Coal or Coke | 0 (0.0%) | 0 (0.0%) |
| All other Fuels | 0 (0.0%) | 0 (0.0%) |
| No Fuel Used | 0 (0.0%) | 5 (0.5%) |
| Total | 1,211 (100.0%) | 913 (100.0%) |
Household Vehicle Usage in Starke
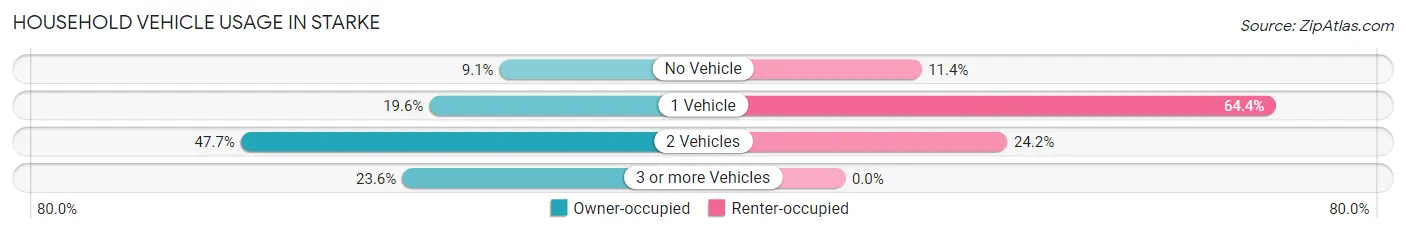
| Vehicles per Household | Owner-occupied | Renter-occupied |
| No Vehicle | 110 (9.1%) | 104 (11.4%) |
| 1 Vehicle | 237 (19.6%) | 588 (64.4%) |
| 2 Vehicles | 578 (47.7%) | 221 (24.2%) |
| 3 or more Vehicles | 286 (23.6%) | 0 (0.0%) |
| Total | 1,211 (100.0%) | 913 (100.0%) |
Real Estate & Mortgages in Starke
Real Estate and Mortgage Overview in Starke
| Characteristic | Without Mortgage | With Mortgage |
| Housing Units | 762 | 449 |
| Median Property Value | $87,900 | $210,400 |
| Median Household Income | $39,474 | $51 |
| Monthly Housing Costs | $391 | $12 |
| Real Estate Taxes | $668 | $0 |
Property Value by Mortgage Status in Starke
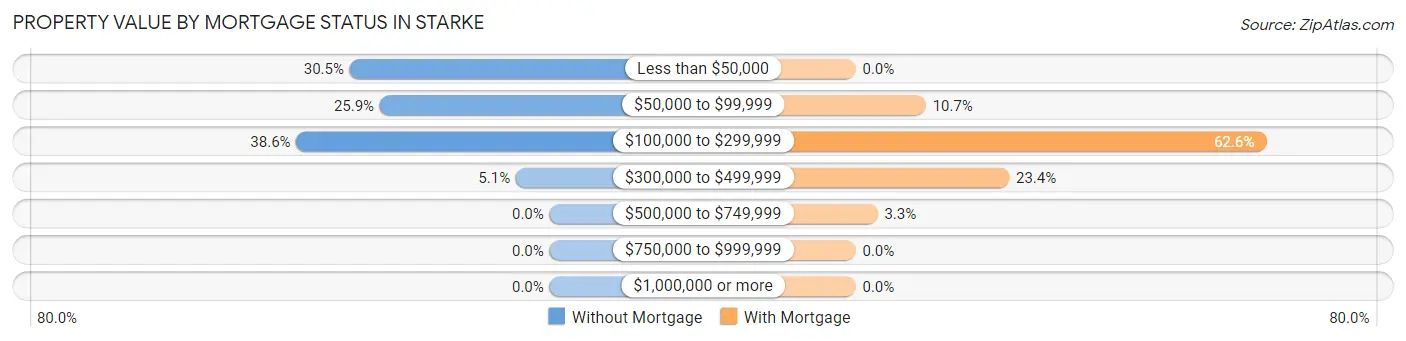
| Property Value | Without Mortgage | With Mortgage |
| Less than $50,000 | 232 (30.4%) | 0 (0.0%) |
| $50,000 to $99,999 | 197 (25.9%) | 48 (10.7%) |
| $100,000 to $299,999 | 294 (38.6%) | 281 (62.6%) |
| $300,000 to $499,999 | 39 (5.1%) | 105 (23.4%) |
| $500,000 to $749,999 | 0 (0.0%) | 15 (3.3%) |
| $750,000 to $999,999 | 0 (0.0%) | 0 (0.0%) |
| $1,000,000 or more | 0 (0.0%) | 0 (0.0%) |
| Total | 762 (100.0%) | 449 (100.0%) |
Household Income by Mortgage Status in Starke
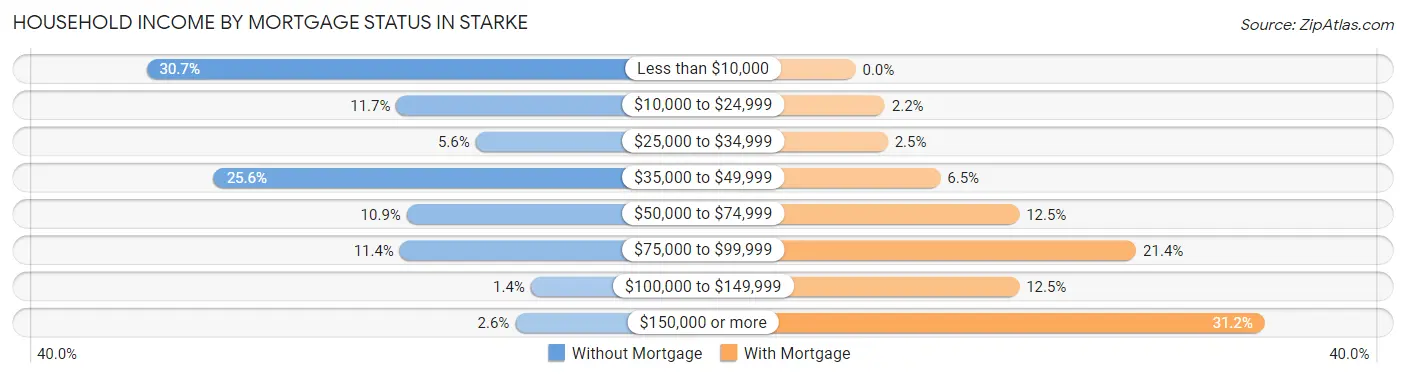
| Household Income | Without Mortgage | With Mortgage |
| Less than $10,000 | 234 (30.7%) | 0 (0.0%) |
| $10,000 to $24,999 | 89 (11.7%) | 10 (2.2%) |
| $25,000 to $34,999 | 43 (5.6%) | 11 (2.5%) |
| $35,000 to $49,999 | 195 (25.6%) | 29 (6.5%) |
| $50,000 to $74,999 | 83 (10.9%) | 56 (12.5%) |
| $75,000 to $99,999 | 87 (11.4%) | 96 (21.4%) |
| $100,000 to $149,999 | 11 (1.4%) | 56 (12.5%) |
| $150,000 or more | 20 (2.6%) | 140 (31.2%) |
| Total | 762 (100.0%) | 449 (100.0%) |
Property Value to Household Income Ratio in Starke
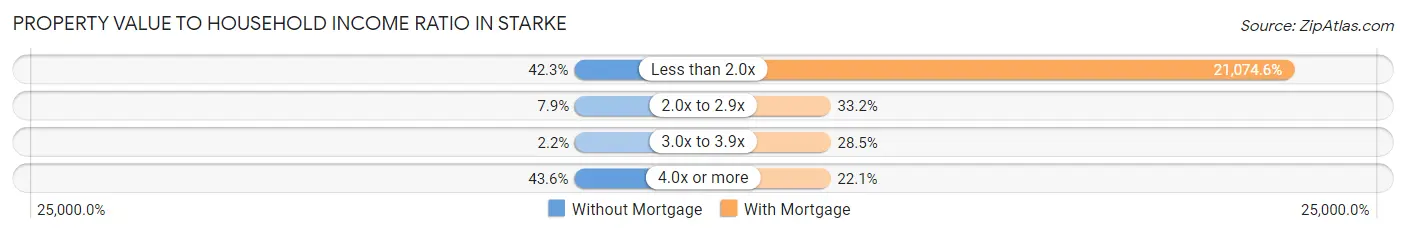
| Value-to-Income Ratio | Without Mortgage | With Mortgage |
| Less than 2.0x | 322 (42.3%) | 94,625 (21,074.6%) |
| 2.0x to 2.9x | 60 (7.9%) | 149 (33.2%) |
| 3.0x to 3.9x | 17 (2.2%) | 128 (28.5%) |
| 4.0x or more | 332 (43.6%) | 99 (22.1%) |
| Total | 762 (100.0%) | 449 (100.0%) |
Real Estate Taxes by Mortgage Status in Starke
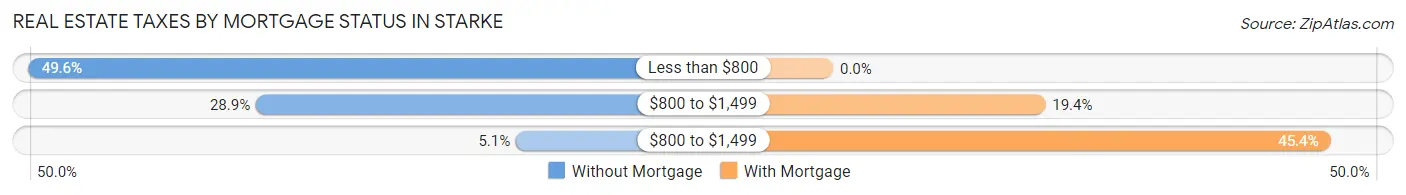
| Property Taxes | Without Mortgage | With Mortgage |
| Less than $800 | 378 (49.6%) | 0 (0.0%) |
| $800 to $1,499 | 220 (28.9%) | 87 (19.4%) |
| $800 to $1,499 | 39 (5.1%) | 204 (45.4%) |
| Total | 762 (100.0%) | 449 (100.0%) |
Health & Disability in Starke
Health Insurance Coverage by Age in Starke
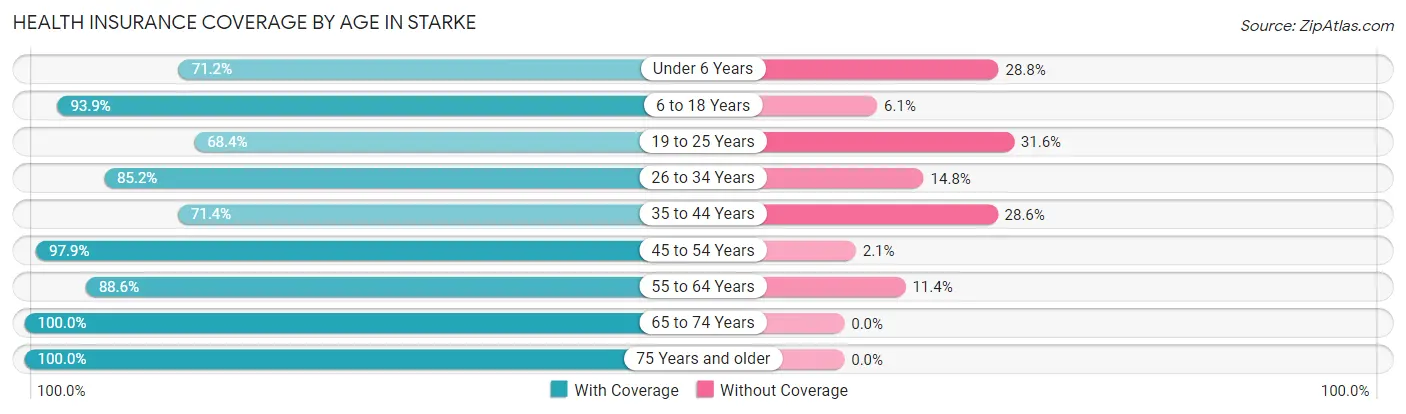
| Age Bracket | With Coverage | Without Coverage |
| Under 6 Years | 317 (71.2%) | 128 (28.8%) |
| 6 to 18 Years | 980 (93.9%) | 64 (6.1%) |
| 19 to 25 Years | 201 (68.4%) | 93 (31.6%) |
| 26 to 34 Years | 875 (85.2%) | 152 (14.8%) |
| 35 to 44 Years | 462 (71.4%) | 185 (28.6%) |
| 45 to 54 Years | 411 (97.9%) | 9 (2.1%) |
| 55 to 64 Years | 435 (88.6%) | 56 (11.4%) |
| 65 to 74 Years | 564 (100.0%) | 0 (0.0%) |
| 75 Years and older | 303 (100.0%) | 0 (0.0%) |
| Total | 4,548 (86.9%) | 687 (13.1%) |
Health Insurance Coverage by Citizenship Status in Starke
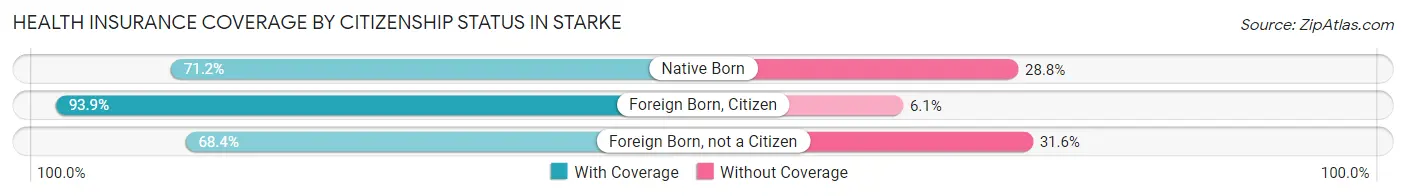
| Citizenship Status | With Coverage | Without Coverage |
| Native Born | 317 (71.2%) | 128 (28.8%) |
| Foreign Born, Citizen | 980 (93.9%) | 64 (6.1%) |
| Foreign Born, not a Citizen | 201 (68.4%) | 93 (31.6%) |
Health Insurance Coverage by Household Income in Starke
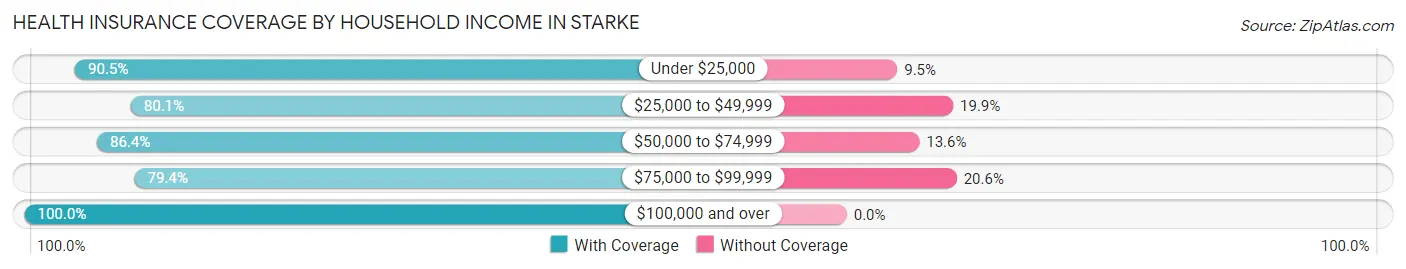
| Household Income | With Coverage | Without Coverage |
| Under $25,000 | 1,225 (90.5%) | 128 (9.5%) |
| $25,000 to $49,999 | 848 (80.1%) | 211 (19.9%) |
| $50,000 to $74,999 | 789 (86.4%) | 124 (13.6%) |
| $75,000 to $99,999 | 844 (79.4%) | 219 (20.6%) |
| $100,000 and over | 809 (100.0%) | 0 (0.0%) |
Public vs Private Health Insurance Coverage by Age in Starke
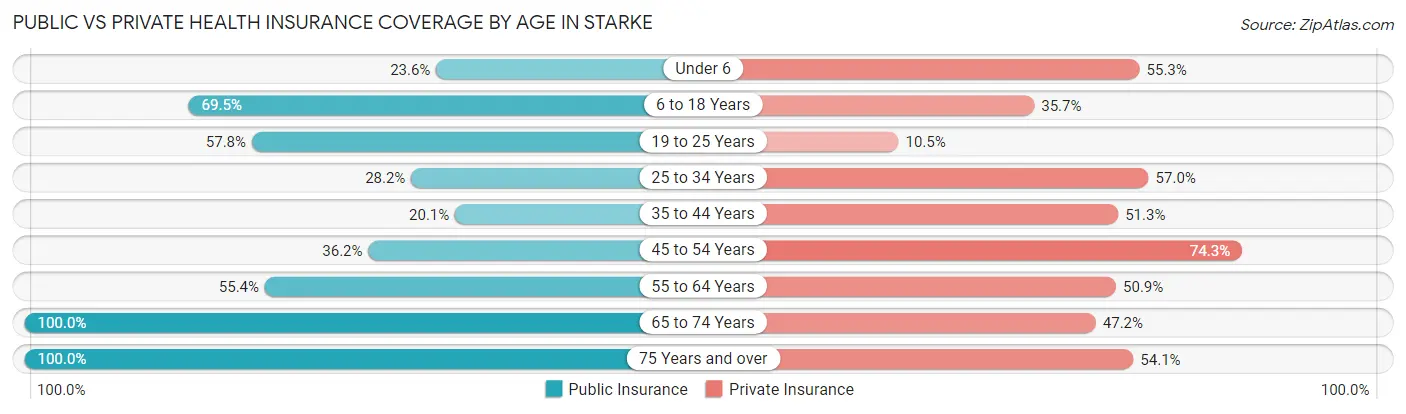
| Age Bracket | Public Insurance | Private Insurance |
| Under 6 | 105 (23.6%) | 246 (55.3%) |
| 6 to 18 Years | 726 (69.5%) | 373 (35.7%) |
| 19 to 25 Years | 170 (57.8%) | 31 (10.5%) |
| 25 to 34 Years | 290 (28.2%) | 585 (57.0%) |
| 35 to 44 Years | 130 (20.1%) | 332 (51.3%) |
| 45 to 54 Years | 152 (36.2%) | 312 (74.3%) |
| 55 to 64 Years | 272 (55.4%) | 250 (50.9%) |
| 65 to 74 Years | 564 (100.0%) | 266 (47.2%) |
| 75 Years and over | 303 (100.0%) | 164 (54.1%) |
| Total | 2,712 (51.8%) | 2,559 (48.9%) |
Disability Status by Sex by Age in Starke
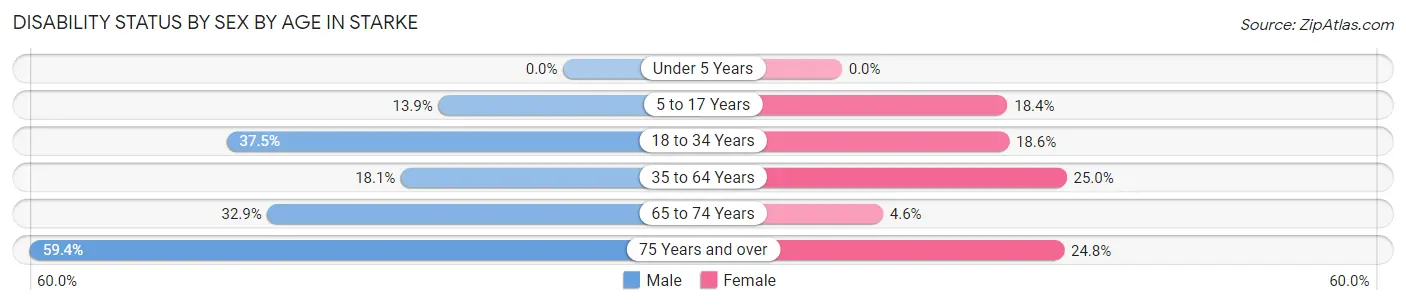
| Age Bracket | Male | Female |
| Under 5 Years | 0 (0.0%) | 0 (0.0%) |
| 5 to 17 Years | 88 (13.9%) | 82 (18.4%) |
| 18 to 34 Years | 300 (37.5%) | 97 (18.6%) |
| 35 to 64 Years | 132 (18.1%) | 207 (25.0%) |
| 65 to 74 Years | 56 (32.9%) | 18 (4.6%) |
| 75 Years and over | 60 (59.4%) | 50 (24.7%) |
Disability Class by Sex by Age in Starke
Disability Class: Hearing Difficulty
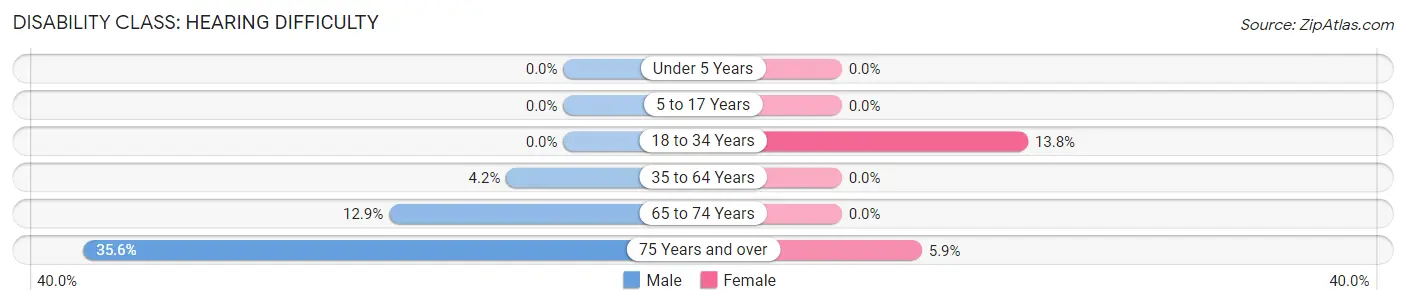
| Age Bracket | Male | Female |
| Under 5 Years | 0 (0.0%) | 0 (0.0%) |
| 5 to 17 Years | 0 (0.0%) | 0 (0.0%) |
| 18 to 34 Years | 0 (0.0%) | 72 (13.8%) |
| 35 to 64 Years | 31 (4.2%) | 0 (0.0%) |
| 65 to 74 Years | 22 (12.9%) | 0 (0.0%) |
| 75 Years and over | 36 (35.6%) | 12 (5.9%) |
Disability Class: Vision Difficulty
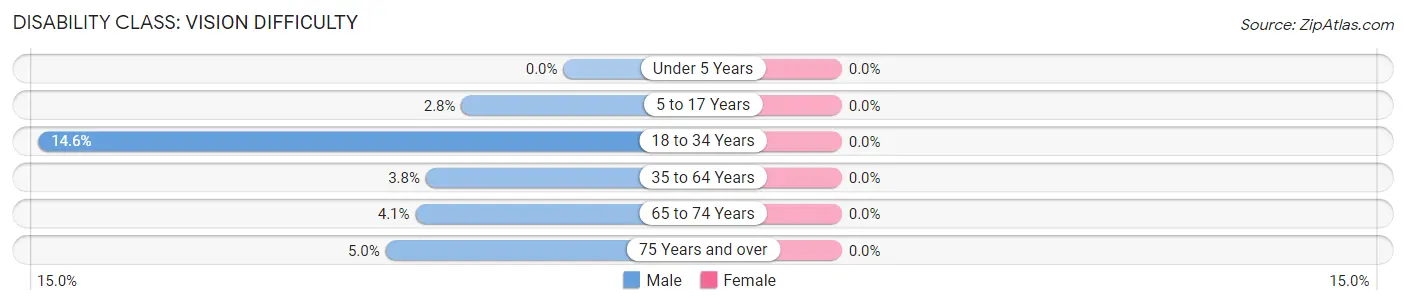
| Age Bracket | Male | Female |
| Under 5 Years | 0 (0.0%) | 0 (0.0%) |
| 5 to 17 Years | 18 (2.8%) | 0 (0.0%) |
| 18 to 34 Years | 117 (14.6%) | 0 (0.0%) |
| 35 to 64 Years | 28 (3.8%) | 0 (0.0%) |
| 65 to 74 Years | 7 (4.1%) | 0 (0.0%) |
| 75 Years and over | 5 (5.0%) | 0 (0.0%) |
Disability Class: Cognitive Difficulty
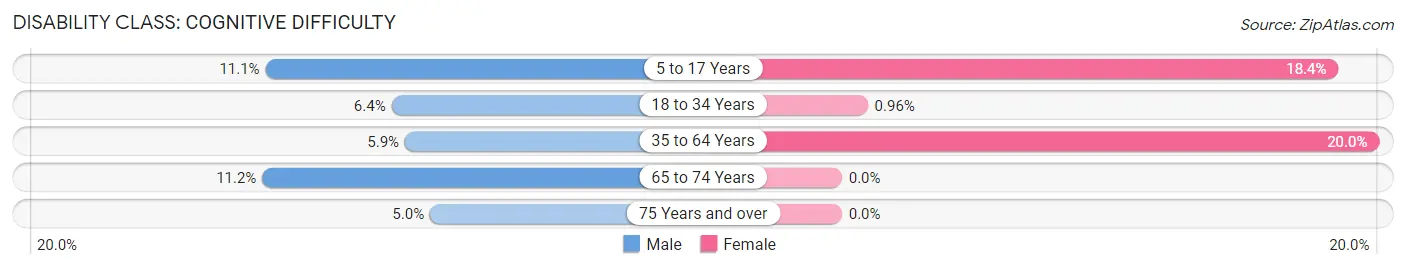
| Age Bracket | Male | Female |
| 5 to 17 Years | 70 (11.1%) | 82 (18.4%) |
| 18 to 34 Years | 51 (6.4%) | 5 (1.0%) |
| 35 to 64 Years | 43 (5.9%) | 165 (20.0%) |
| 65 to 74 Years | 19 (11.2%) | 0 (0.0%) |
| 75 Years and over | 5 (5.0%) | 0 (0.0%) |
Disability Class: Ambulatory Difficulty
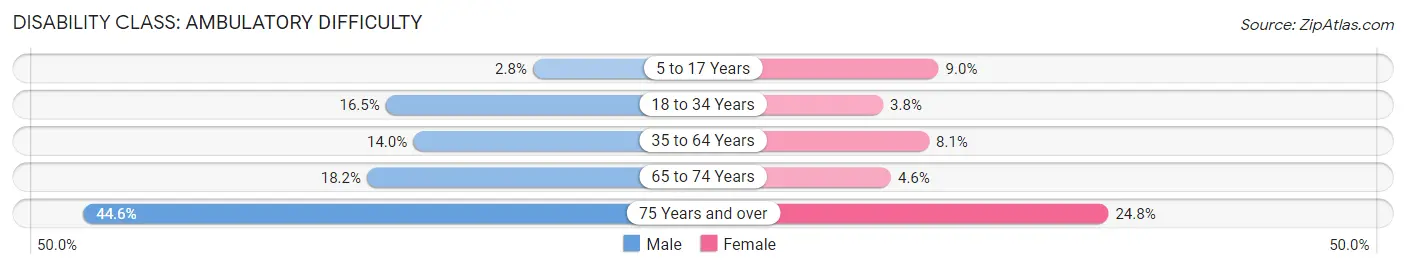
| Age Bracket | Male | Female |
| 5 to 17 Years | 18 (2.8%) | 40 (9.0%) |
| 18 to 34 Years | 132 (16.5%) | 20 (3.8%) |
| 35 to 64 Years | 102 (14.0%) | 67 (8.1%) |
| 65 to 74 Years | 31 (18.2%) | 18 (4.6%) |
| 75 Years and over | 45 (44.6%) | 50 (24.7%) |
Disability Class: Self-Care Difficulty
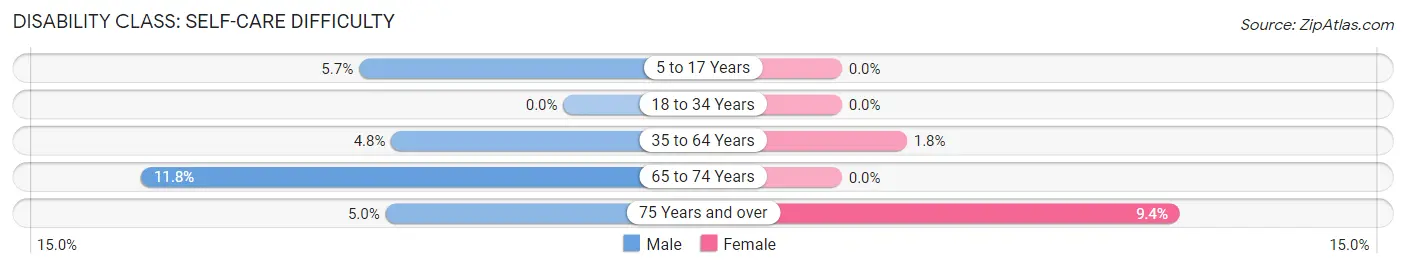
| Age Bracket | Male | Female |
| 5 to 17 Years | 36 (5.7%) | 0 (0.0%) |
| 18 to 34 Years | 0 (0.0%) | 0 (0.0%) |
| 35 to 64 Years | 35 (4.8%) | 15 (1.8%) |
| 65 to 74 Years | 20 (11.8%) | 0 (0.0%) |
| 75 Years and over | 5 (5.0%) | 19 (9.4%) |
Technology Access in Starke
Computing Device Access in Starke
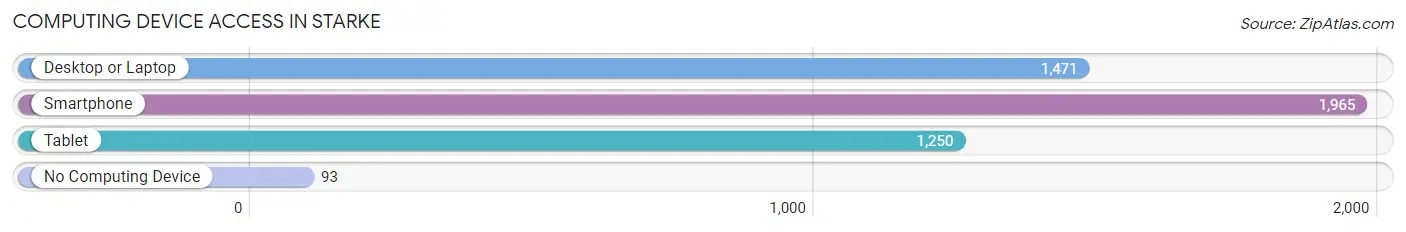
| Device Type | # Households | % Households |
| Desktop or Laptop | 1,471 | 69.3% |
| Smartphone | 1,965 | 92.5% |
| Tablet | 1,250 | 58.9% |
| No Computing Device | 93 | 4.4% |
| Total | 2,124 | 100.0% |
Internet Access in Starke
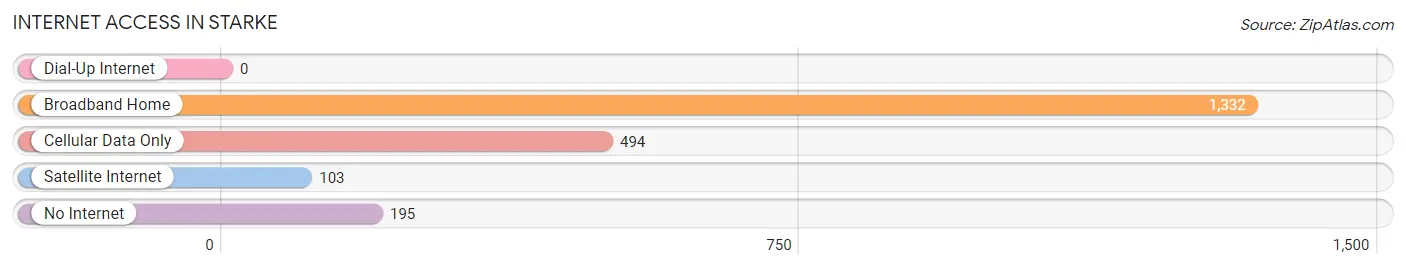
| Internet Type | # Households | % Households |
| Dial-Up Internet | 0 | 0.0% |
| Broadband Home | 1,332 | 62.7% |
| Cellular Data Only | 494 | 23.3% |
| Satellite Internet | 103 | 4.9% |
| No Internet | 195 | 9.2% |
| Total | 2,124 | 100.0% |
Starke Summary
Starke, Florida is a small city located in Bradford County in the northeastern part of the state. It is situated about 40 miles southwest of Jacksonville and is part of the Gainesville Metropolitan Statistical Area. The city has a population of approximately 5,400 people and is the county seat of Bradford County.
History
Starke was founded in 1879 by the Florida Railroad Company. The city was named after Madison Starke Perry, the fourth Governor of Florida. The city was incorporated in 1885 and was the first city in Bradford County. The city was a major hub for the railroad industry and was the site of the first railroad station in the county.
In the early 1900s, Starke was a major center for the timber industry. The city was home to several sawmills and lumber companies. The city also had a thriving agricultural industry, with cotton, corn, and tobacco being the main crops.
In the 1950s, Starke began to experience a decline in its economy. The timber industry had largely moved out of the area and the agricultural industry was in decline. The city began to focus on tourism and retail as its main sources of income.
Geography
Starke is located in the northeastern part of Florida, about 40 miles southwest of Jacksonville. The city is situated in Bradford County and is part of the Gainesville Metropolitan Statistical Area. The city is located on the Santa Fe River and is surrounded by several lakes, including Kingsley Lake, Sampson Lake, and New River.
The city has a total area of 4.2 square miles, all of which is land. The city has a humid subtropical climate, with hot, humid summers and mild winters. The average temperature in the summer is around 90 degrees Fahrenheit and the average temperature in the winter is around 60 degrees Fahrenheit.
Economy
Starke’s economy is largely based on tourism and retail. The city is home to several tourist attractions, including the Florida State Prison, the Bradford County Fairgrounds, and the Starke Golf and Country Club. The city also has several retail stores, including Walmart, Lowe’s, and several local businesses.
The city is also home to several manufacturing companies, including the Starke Plywood Company and the Starke Paper Company. The city is also home to several healthcare facilities, including Shands Starke Regional Medical Center and the Bradford County Health Department.
Demographics
As of the 2010 census, Starke had a population of 5,449 people. The racial makeup of the city was 75.3% White, 19.2% African American, 0.3% Native American, 0.7% Asian, 0.1% Pacific Islander, 2.3% from other races, and 2.3% from two or more races. Hispanic or Latino of any race were 5.3% of the population.
The median income for a household in the city was $30,938 and the median income for a family was $37,813. The per capita income for the city was $15,945. About 17.2% of the population was below the poverty line.
Starke is a small city with a rich history and a diverse economy. The city has a strong tourism and retail industry and is home to several manufacturing companies. The city also has a diverse population, with a mix of races and ethnicities.
Common Questions
What is Per Capita Income in Starke?
Per Capita income in Starke is $19,910.
What is the Median Family Income in Starke?
Median Family Income in Starke is $47,133.
What is the Median Household income in Starke?
Median Household Income in Starke is $42,976.
What is Income or Wage Gap in Starke?
Income or Wage Gap in Starke is 23.5%.
Women in Starke earn 76.5 cents for every dollar earned by a man.
What is Inequality or Gini Index in Starke?
Inequality or Gini Index in Starke is 0.48.
What is the Total Population of Starke?
Total Population of Starke is 5,756.
What is the Total Male Population of Starke?
Total Male Population of Starke is 2,908.
What is the Total Female Population of Starke?
Total Female Population of Starke is 2,848.
What is the Ratio of Males per 100 Females in Starke?
There are 102.11 Males per 100 Females in Starke.
What is the Ratio of Females per 100 Males in Starke?
There are 97.94 Females per 100 Males in Starke.
What is the Median Population Age in Starke?
Median Population Age in Starke is 35.1 Years.
What is the Average Family Size in Starke
Average Family Size in Starke is 3.0 People.
What is the Average Household Size in Starke
Average Household Size in Starke is 2.5 People.
How Large is the Labor Force in Starke?
There are 2,167 People in the Labor Forcein in Starke.
What is the Percentage of People in the Labor Force in Starke?
49.6% of People are in the Labor Force in Starke.
What is the Unemployment Rate in Starke?
Unemployment Rate in Starke is 3.9%.