Cypress Gardens, FL Map & Demographics
Cypress Gardens Map
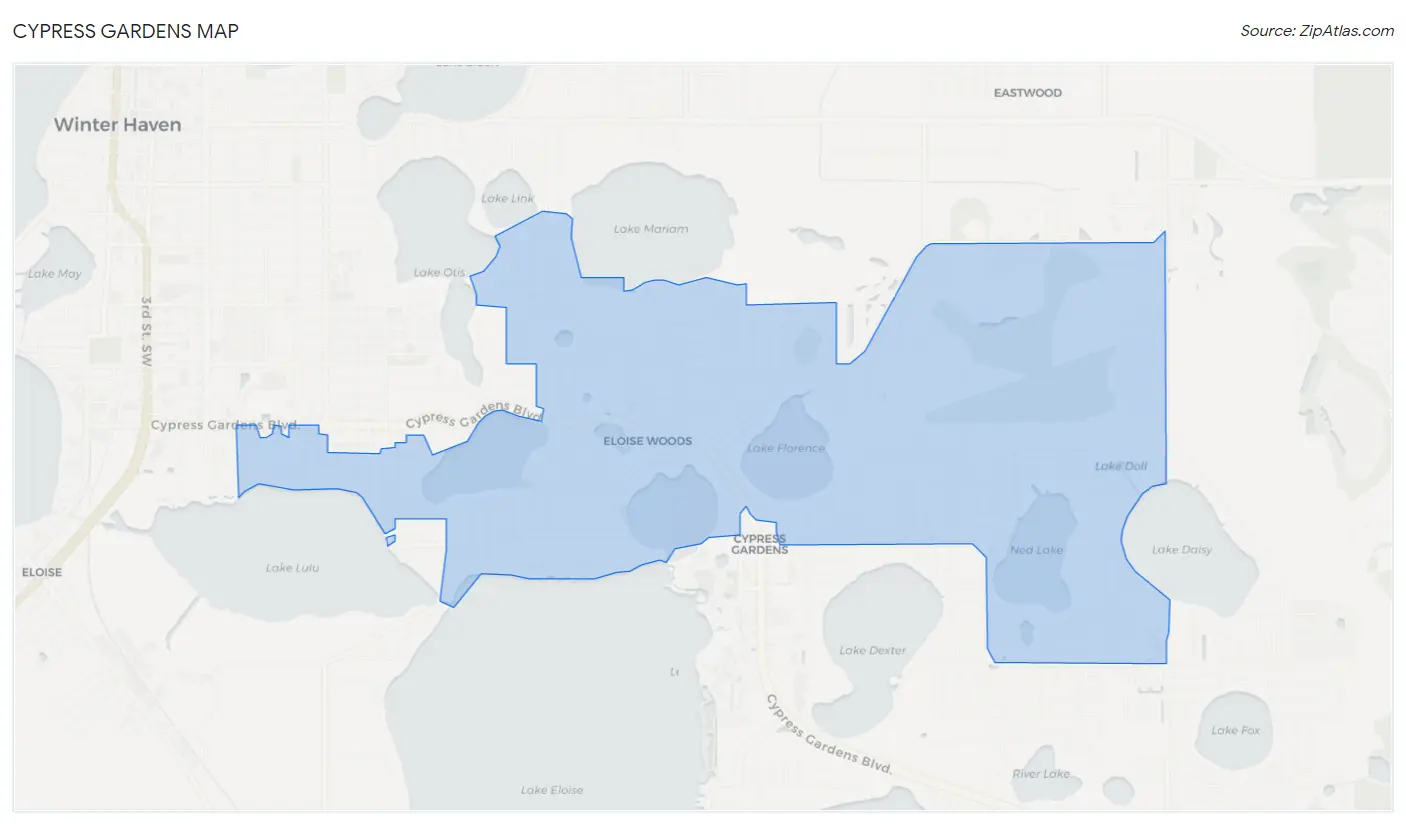
Cypress Gardens Overview
$38,472
PER CAPITA INCOME
$91,979
AVG FAMILY INCOME
$83,812
AVG HOUSEHOLD INCOME
23.4%
WAGE / INCOME GAP [ % ]
76.6¢/ $1
WAGE / INCOME GAP [ $ ]
0.41
INEQUALITY / GINI INDEX
9,692
TOTAL POPULATION
4,582
MALE POPULATION
5,110
FEMALE POPULATION
89.67
MALES / 100 FEMALES
111.52
FEMALES / 100 MALES
40.0
MEDIAN AGE
3.1
AVG FAMILY SIZE
2.7
AVG HOUSEHOLD SIZE
5,020
LABOR FORCE [ PEOPLE ]
63.0%
PERCENT IN LABOR FORCE
2.6%
UNEMPLOYMENT RATE
Income in Cypress Gardens
Income Overview in Cypress Gardens
Per Capita Income in Cypress Gardens is $38,472, while median incomes of families and households are $91,979 and $83,812 respectively.
| Characteristic | Number | Measure |
| Per Capita Income | 9,692 | $38,472 |
| Median Family Income | 2,604 | $91,979 |
| Mean Family Income | 2,604 | $114,822 |
| Median Household Income | 3,575 | $83,812 |
| Mean Household Income | 3,575 | $100,749 |
| Income Deficit | 2,604 | $0 |
| Wage / Income Gap (%) | 9,692 | 23.35% |
| Wage / Income Gap ($) | 9,692 | 76.65¢ per $1 |
| Gini / Inequality Index | 9,692 | 0.41 |
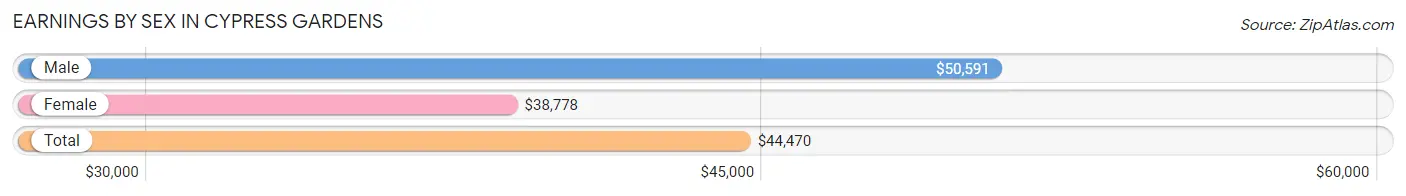
Earnings by Sex in Cypress Gardens
Average Earnings in Cypress Gardens are $44,470, $50,591 for men and $38,778 for women, a difference of 23.4%.
| Sex | Number | Average Earnings |
| Male | 2,381 (46.8%) | $50,591 |
| Female | 2,710 (53.2%) | $38,778 |
| Total | 5,091 (100.0%) | $44,470 |
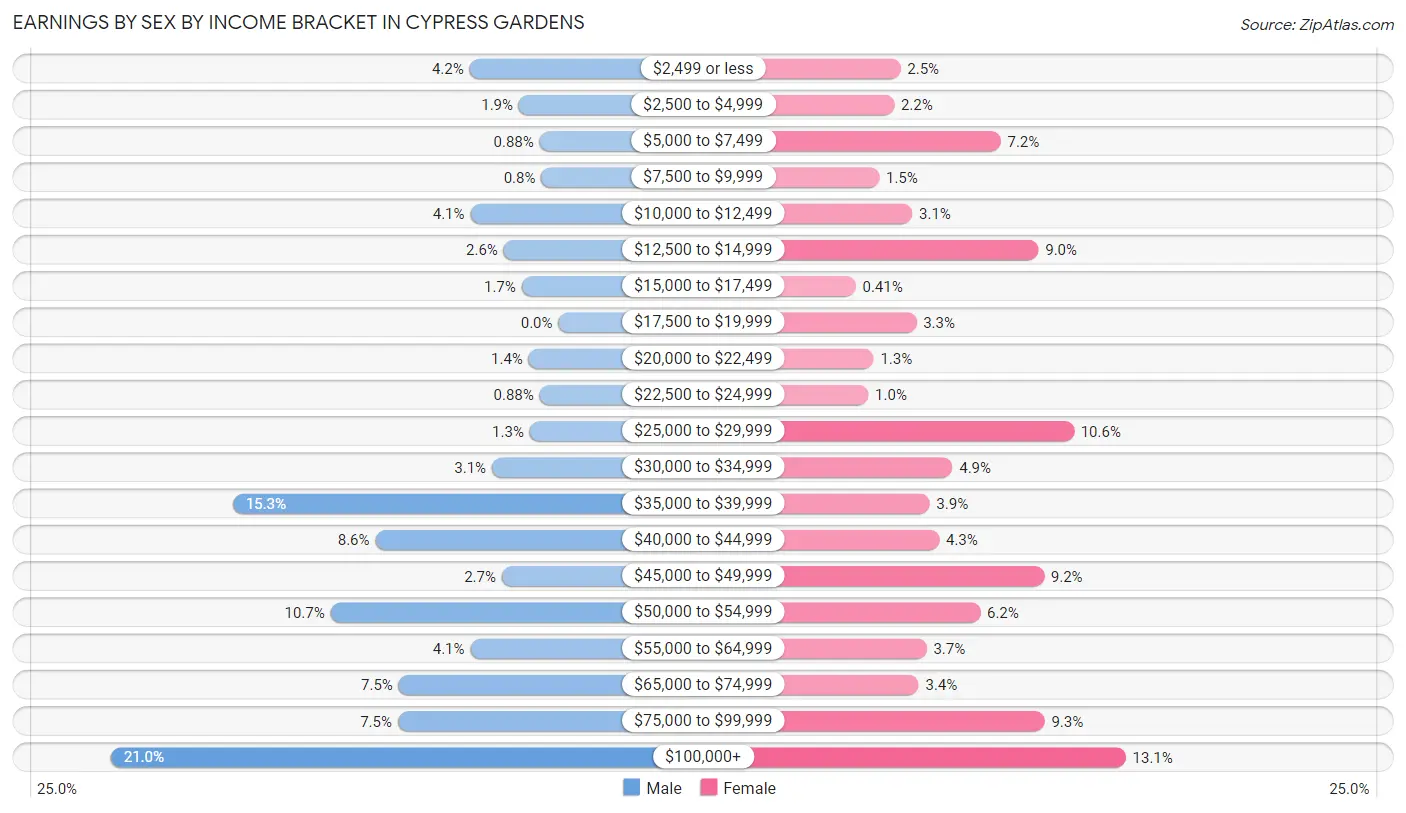
Earnings by Sex by Income Bracket in Cypress Gardens
The most common earnings brackets in Cypress Gardens are $100,000+ for men (499 | 21.0%) and $100,000+ for women (354 | 13.1%).
| Income | Male | Female |
| $2,499 or less | 99 (4.2%) | 68 (2.5%) |
| $2,500 to $4,999 | 44 (1.8%) | 60 (2.2%) |
| $5,000 to $7,499 | 21 (0.9%) | 195 (7.2%) |
| $7,500 to $9,999 | 19 (0.8%) | 41 (1.5%) |
| $10,000 to $12,499 | 98 (4.1%) | 83 (3.1%) |
| $12,500 to $14,999 | 61 (2.6%) | 243 (9.0%) |
| $15,000 to $17,499 | 41 (1.7%) | 11 (0.4%) |
| $17,500 to $19,999 | 0 (0.0%) | 88 (3.3%) |
| $20,000 to $22,499 | 33 (1.4%) | 34 (1.3%) |
| $22,500 to $24,999 | 21 (0.9%) | 27 (1.0%) |
| $25,000 to $29,999 | 32 (1.3%) | 288 (10.6%) |
| $30,000 to $34,999 | 74 (3.1%) | 134 (4.9%) |
| $35,000 to $39,999 | 363 (15.2%) | 105 (3.9%) |
| $40,000 to $44,999 | 204 (8.6%) | 117 (4.3%) |
| $45,000 to $49,999 | 63 (2.6%) | 250 (9.2%) |
| $50,000 to $54,999 | 254 (10.7%) | 169 (6.2%) |
| $55,000 to $64,999 | 98 (4.1%) | 101 (3.7%) |
| $65,000 to $74,999 | 178 (7.5%) | 91 (3.4%) |
| $75,000 to $99,999 | 179 (7.5%) | 251 (9.3%) |
| $100,000+ | 499 (21.0%) | 354 (13.1%) |
| Total | 2,381 (100.0%) | 2,710 (100.0%) |
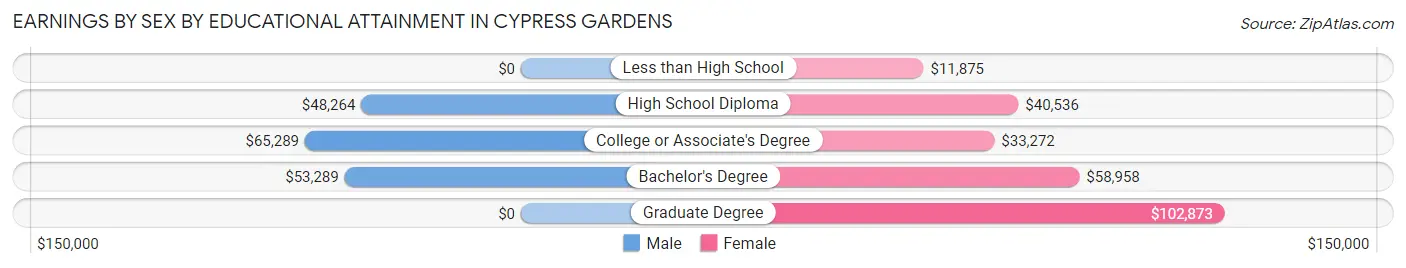
Earnings by Sex by Educational Attainment in Cypress Gardens
Average earnings in Cypress Gardens are $53,257 for men and $47,475 for women, a difference of 10.9%. Men with an educational attainment of college or associate's degree enjoy the highest average annual earnings of $65,289, while those with high school diploma education earn the least with $48,264. Women with an educational attainment of graduate degree earn the most with the average annual earnings of $102,873, while those with less than high school education have the smallest earnings of $11,875.
| Educational Attainment | Male Income | Female Income |
| Less than High School | - | - |
| High School Diploma | $48,264 | $40,536 |
| College or Associate's Degree | $65,289 | $33,272 |
| Bachelor's Degree | $53,289 | $58,958 |
| Graduate Degree | - | - |
| Total | $53,257 | $47,475 |
Family Income in Cypress Gardens
Family Income Brackets in Cypress Gardens
According to the Cypress Gardens family income data, there are 583 families falling into the $75,000 to $99,999 income range, which is the most common income bracket and makes up 22.4% of all families. Conversely, the $15,000 to $24,999 income bracket is the least frequent group with only 21 families (0.8%) belonging to this category.
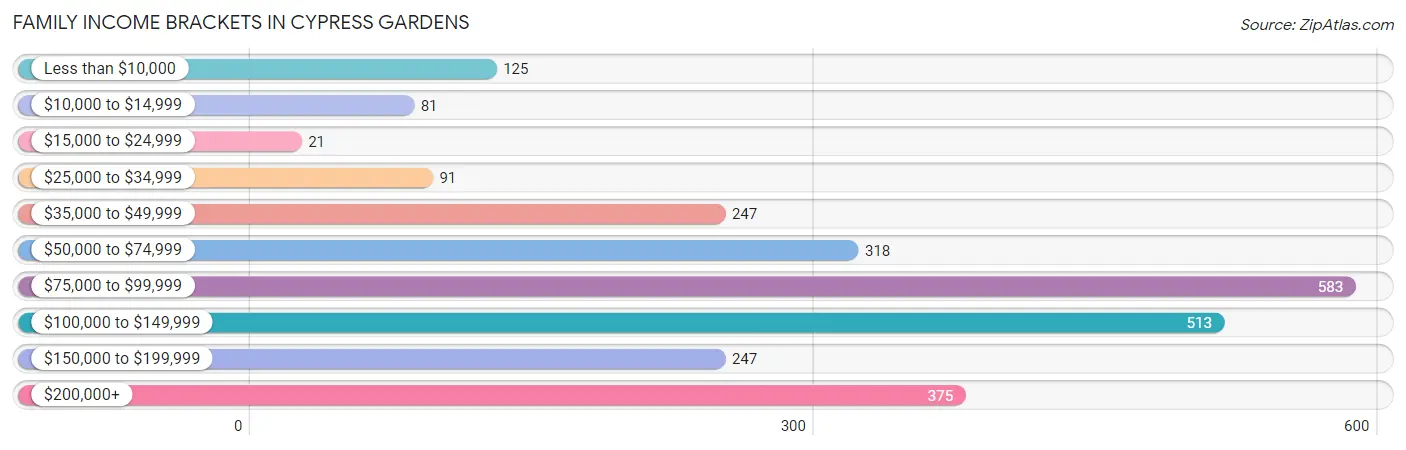
| Income Bracket | # Families | % Families |
| Less than $10,000 | 125 | 4.8% |
| $10,000 to $14,999 | 81 | 3.1% |
| $15,000 to $24,999 | 21 | 0.8% |
| $25,000 to $34,999 | 91 | 3.5% |
| $35,000 to $49,999 | 247 | 9.5% |
| $50,000 to $74,999 | 318 | 12.2% |
| $75,000 to $99,999 | 583 | 22.4% |
| $100,000 to $149,999 | 513 | 19.7% |
| $150,000 to $199,999 | 247 | 9.5% |
| $200,000+ | 375 | 14.4% |
Family Income by Famaliy Size in Cypress Gardens
4-person families (451 | 17.3%) account for the highest median family income in Cypress Gardens with $180,482 per family, while 4-person families (451 | 17.3%) have the highest median income of $45,120 per family member.
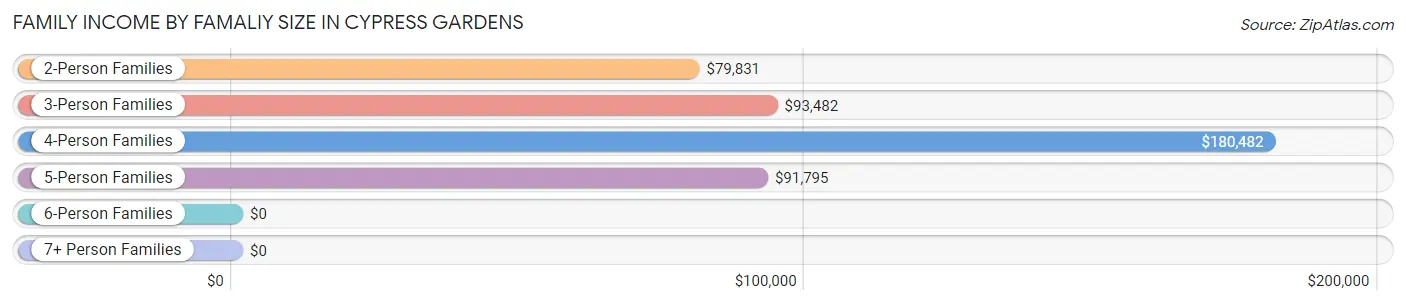
| Income Bracket | # Families | Median Income |
| 2-Person Families | 1,259 (48.3%) | $79,831 |
| 3-Person Families | 514 (19.7%) | $93,482 |
| 4-Person Families | 451 (17.3%) | $180,482 |
| 5-Person Families | 245 (9.4%) | $91,795 |
| 6-Person Families | 110 (4.2%) | $0 |
| 7+ Person Families | 25 (1.0%) | $0 |
| Total | 2,604 (100.0%) | $91,979 |
Family Income by Number of Earners in Cypress Gardens
The median family income in Cypress Gardens is $91,979, with families comprising 3+ earners (408) having the highest median family income of $168,048, while families with no earners (650) have the lowest median family income of $50,761, accounting for 15.7% and 25.0% of families, respectively.
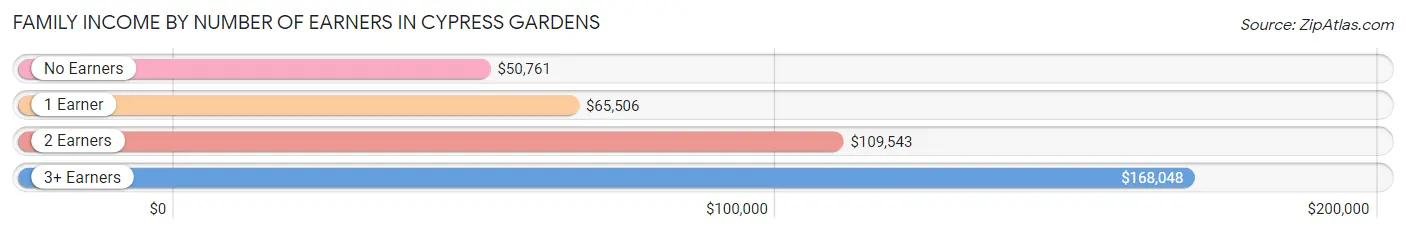
| Number of Earners | # Families | Median Income |
| No Earners | 650 (25.0%) | $50,761 |
| 1 Earner | 551 (21.2%) | $65,506 |
| 2 Earners | 995 (38.2%) | $109,543 |
| 3+ Earners | 408 (15.7%) | $168,048 |
| Total | 2,604 (100.0%) | $91,979 |
Household Income in Cypress Gardens
Household Income Brackets in Cypress Gardens
With 676 households falling in the category, the $75,000 to $99,999 income range is the most frequent in Cypress Gardens, accounting for 18.9% of all households. In contrast, only 100 households (2.8%) fall into the $10,000 to $14,999 income bracket, making it the least populous group.
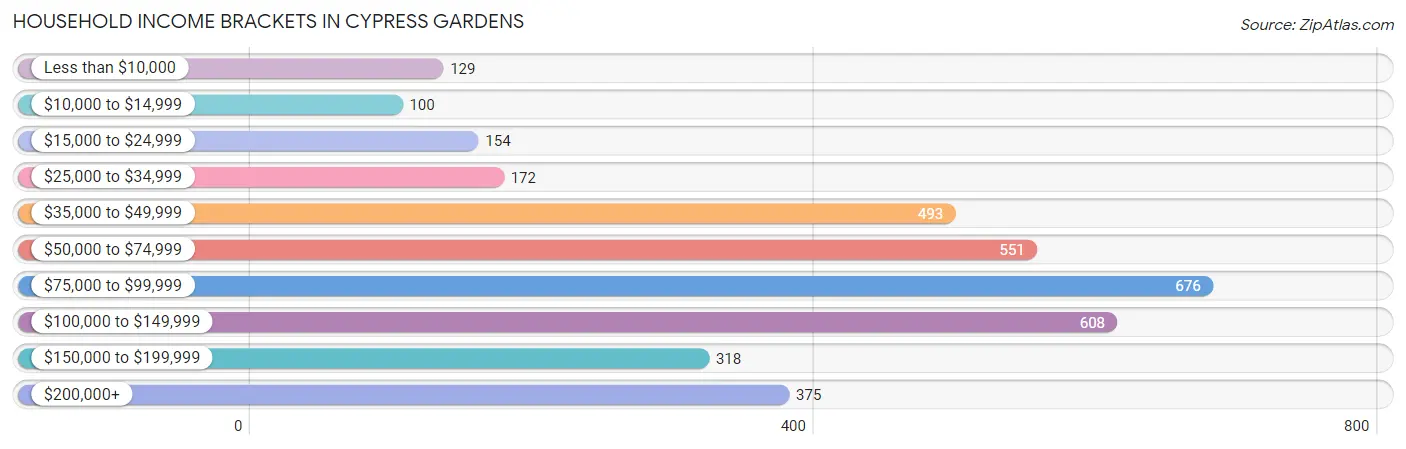
| Income Bracket | # Households | % Households |
| Less than $10,000 | 129 | 3.6% |
| $10,000 to $14,999 | 100 | 2.8% |
| $15,000 to $24,999 | 154 | 4.3% |
| $25,000 to $34,999 | 172 | 4.8% |
| $35,000 to $49,999 | 493 | 13.8% |
| $50,000 to $74,999 | 551 | 15.4% |
| $75,000 to $99,999 | 676 | 18.9% |
| $100,000 to $149,999 | 608 | 17.0% |
| $150,000 to $199,999 | 318 | 8.9% |
| $200,000+ | 375 | 10.5% |
Household Income by Householder Age in Cypress Gardens
The median household income in Cypress Gardens is $83,812, with the highest median household income of $105,462 found in the 45 to 64 years age bracket for the primary householder. A total of 1,165 households (32.6%) fall into this category. Meanwhile, the 15 to 24 years age bracket for the primary householder has the lowest median household income of $47,250, with 183 households (5.1%) in this group.
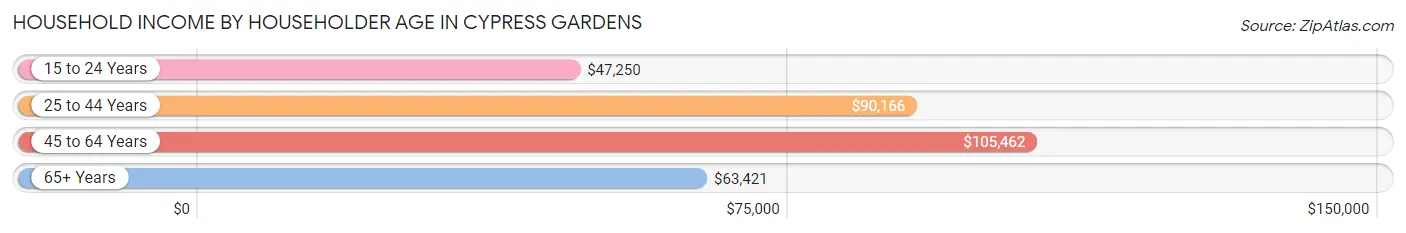
| Income Bracket | # Households | Median Income |
| 15 to 24 Years | 183 (5.1%) | $47,250 |
| 25 to 44 Years | 1,091 (30.5%) | $90,166 |
| 45 to 64 Years | 1,165 (32.6%) | $105,462 |
| 65+ Years | 1,136 (31.8%) | $63,421 |
| Total | 3,575 (100.0%) | $83,812 |
Poverty in Cypress Gardens
Income Below Poverty by Sex and Age in Cypress Gardens
With 11.4% poverty level for males and 11.4% for females among the residents of Cypress Gardens, under 5 year old males and under 5 year old females are the most vulnerable to poverty, with 182 males (51.7%) and 73 females (23.5%) in their respective age groups living below the poverty level.
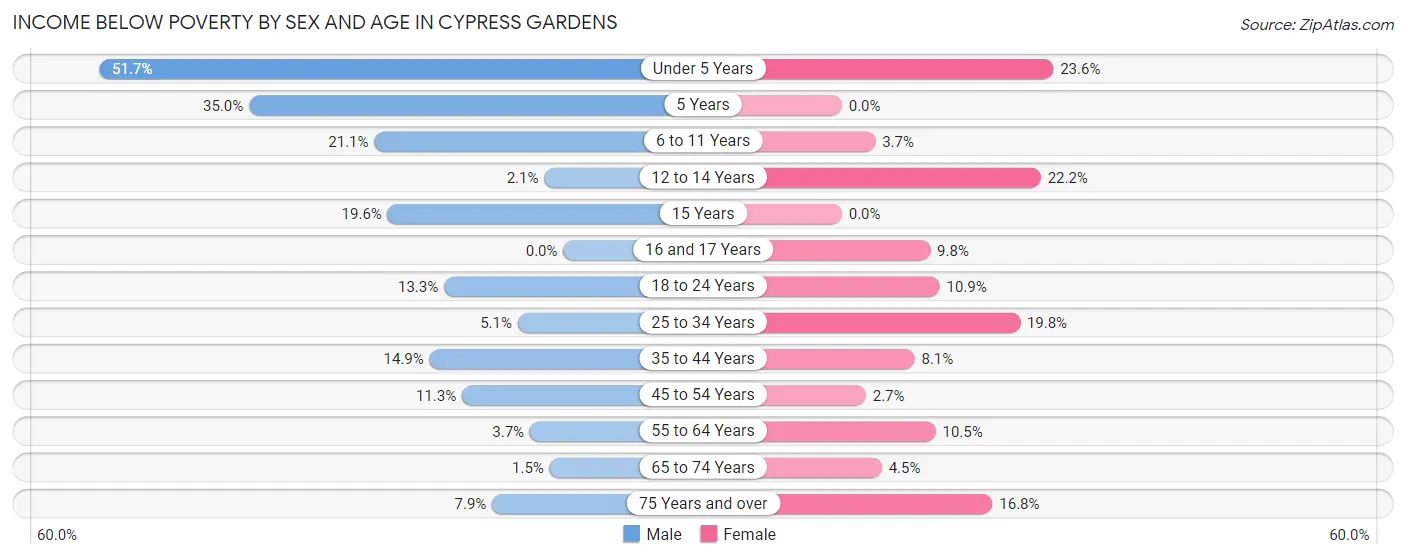
| Age Bracket | Male | Female |
| Under 5 Years | 182 (51.7%) | 73 (23.5%) |
| 5 Years | 28 (35.0%) | 0 (0.0%) |
| 6 to 11 Years | 28 (21.0%) | 13 (3.7%) |
| 12 to 14 Years | 6 (2.1%) | 33 (22.2%) |
| 15 Years | 9 (19.6%) | 0 (0.0%) |
| 16 and 17 Years | 0 (0.0%) | 6 (9.8%) |
| 18 to 24 Years | 44 (13.3%) | 76 (10.9%) |
| 25 to 34 Years | 32 (5.1%) | 126 (19.8%) |
| 35 to 44 Years | 90 (14.9%) | 50 (8.1%) |
| 45 to 54 Years | 49 (11.3%) | 9 (2.7%) |
| 55 to 64 Years | 21 (3.7%) | 91 (10.4%) |
| 65 to 74 Years | 10 (1.5%) | 26 (4.4%) |
| 75 Years and over | 23 (7.9%) | 80 (16.8%) |
| Total | 522 (11.4%) | 583 (11.4%) |
Income Above Poverty by Sex and Age in Cypress Gardens
According to the poverty statistics in Cypress Gardens, males aged 16 and 17 years and females aged 5 years are the age groups that are most secure financially, with 100.0% of males and 100.0% of females in these age groups living above the poverty line.
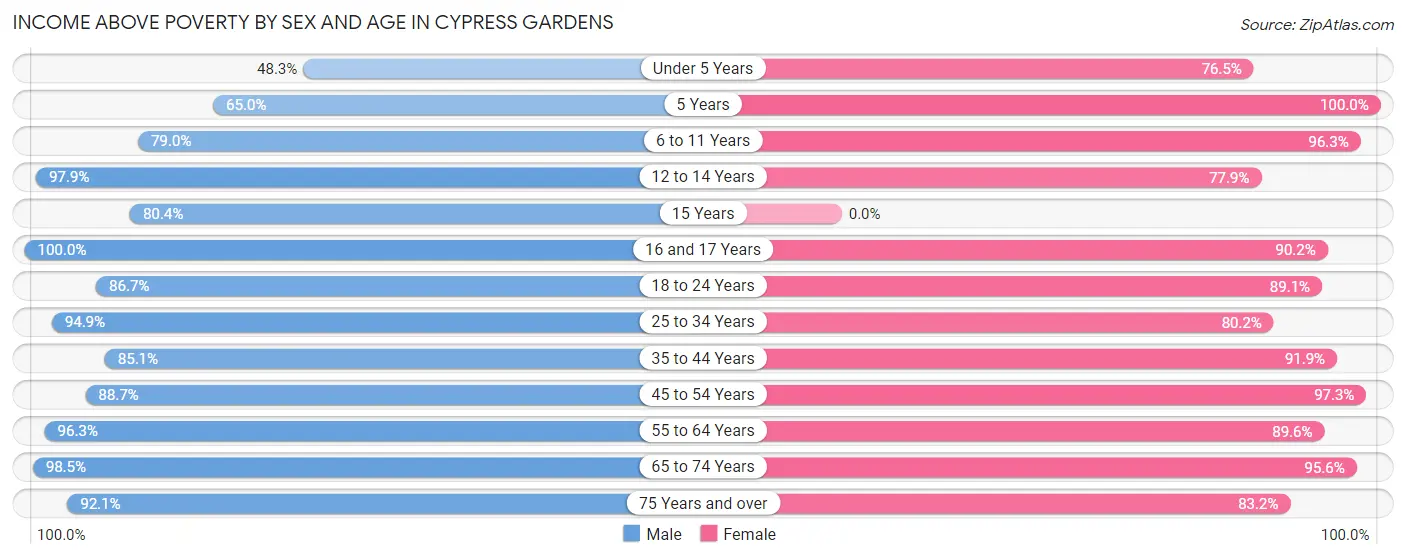
| Age Bracket | Male | Female |
| Under 5 Years | 170 (48.3%) | 237 (76.4%) |
| 5 Years | 52 (65.0%) | 11 (100.0%) |
| 6 to 11 Years | 105 (78.9%) | 336 (96.3%) |
| 12 to 14 Years | 277 (97.9%) | 116 (77.8%) |
| 15 Years | 37 (80.4%) | 0 (0.0%) |
| 16 and 17 Years | 177 (100.0%) | 55 (90.2%) |
| 18 to 24 Years | 287 (86.7%) | 622 (89.1%) |
| 25 to 34 Years | 599 (94.9%) | 509 (80.2%) |
| 35 to 44 Years | 514 (85.1%) | 567 (91.9%) |
| 45 to 54 Years | 385 (88.7%) | 328 (97.3%) |
| 55 to 64 Years | 543 (96.3%) | 780 (89.5%) |
| 65 to 74 Years | 647 (98.5%) | 558 (95.6%) |
| 75 Years and over | 267 (92.1%) | 397 (83.2%) |
| Total | 4,060 (88.6%) | 4,516 (88.6%) |
Income Below Poverty Among Married-Couple Families in Cypress Gardens
The poverty statistics for married-couple families in Cypress Gardens show that 5.5% or 114 of the total 2,064 families live below the poverty line. Families with 3 or 4 children have the highest poverty rate of 13.2%, comprising of 10 families. On the other hand, families with no children have the lowest poverty rate of 3.1%, which includes 41 families.
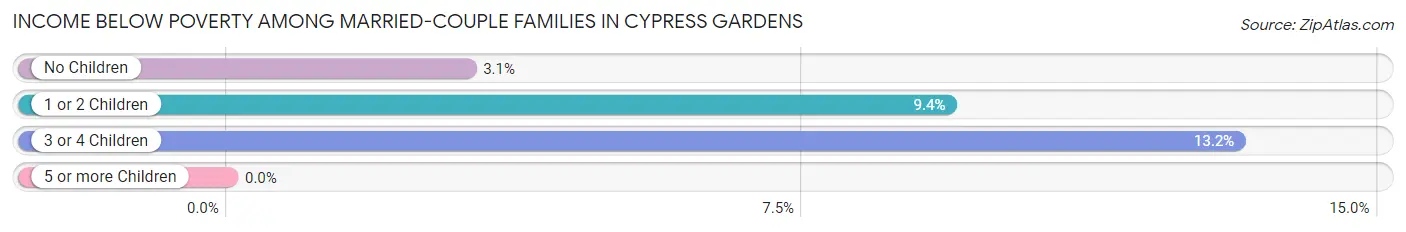
| Children | Above Poverty | Below Poverty |
| No Children | 1,276 (96.9%) | 41 (3.1%) |
| 1 or 2 Children | 608 (90.6%) | 63 (9.4%) |
| 3 or 4 Children | 66 (86.8%) | 10 (13.2%) |
| 5 or more Children | 0 (0.0%) | 0 (0.0%) |
| Total | 1,950 (94.5%) | 114 (5.5%) |
Income Below Poverty Among Single-Parent Households in Cypress Gardens
According to the poverty data in Cypress Gardens, 6.7% or 10 single-father households and 32.2% or 126 single-mother households are living below the poverty line. Among single-father households, those with 1 or 2 children have the highest poverty rate, with 10 households (22.7%) experiencing poverty. Likewise, among single-mother households, those with 1 or 2 children have the highest poverty rate, with 96 households (55.2%) falling below the poverty line.
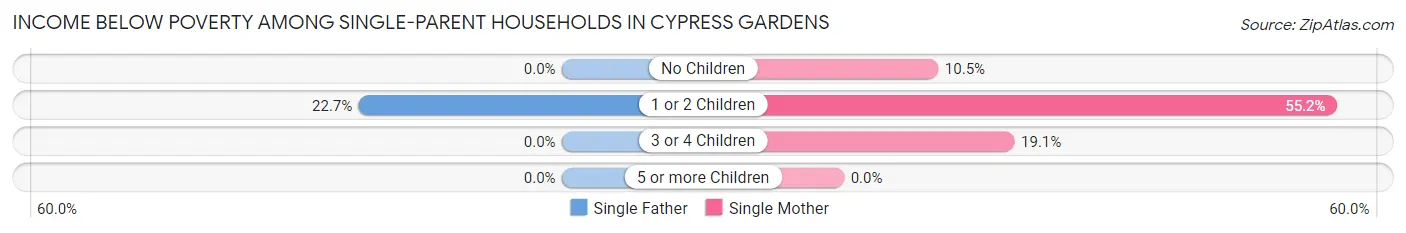
| Children | Single Father | Single Mother |
| No Children | 0 (0.0%) | 14 (10.5%) |
| 1 or 2 Children | 10 (22.7%) | 96 (55.2%) |
| 3 or 4 Children | 0 (0.0%) | 16 (19.1%) |
| 5 or more Children | 0 (0.0%) | 0 (0.0%) |
| Total | 10 (6.7%) | 126 (32.2%) |
Income Below Poverty Among Married-Couple vs Single-Parent Households in Cypress Gardens
The poverty data for Cypress Gardens shows that 114 of the married-couple family households (5.5%) and 136 of the single-parent households (25.2%) are living below the poverty level. Within the married-couple family households, those with 3 or 4 children have the highest poverty rate, with 10 households (13.2%) falling below the poverty line. Among the single-parent households, those with 1 or 2 children have the highest poverty rate, with 106 household (48.6%) living below poverty.
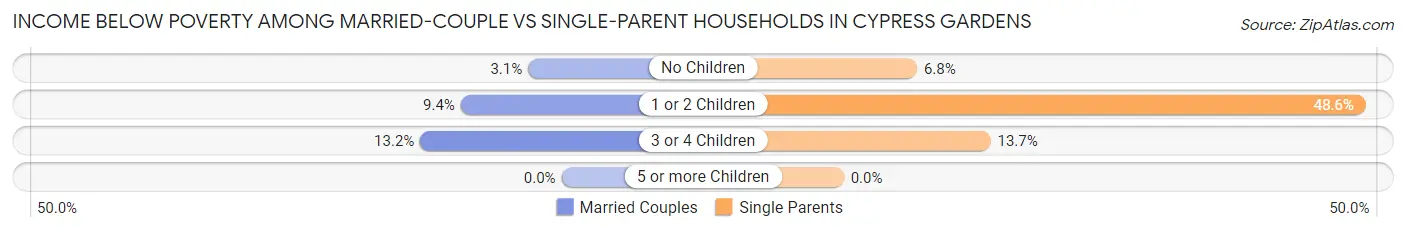
| Children | Married-Couple Families | Single-Parent Households |
| No Children | 41 (3.1%) | 14 (6.8%) |
| 1 or 2 Children | 63 (9.4%) | 106 (48.6%) |
| 3 or 4 Children | 10 (13.2%) | 16 (13.7%) |
| 5 or more Children | 0 (0.0%) | 0 (0.0%) |
| Total | 114 (5.5%) | 136 (25.2%) |
Race in Cypress Gardens
The most populous races in Cypress Gardens are White / Caucasian (7,574 | 78.1%), Hispanic or Latino (2,262 | 23.3%), and Two or more Races (691 | 7.1%).
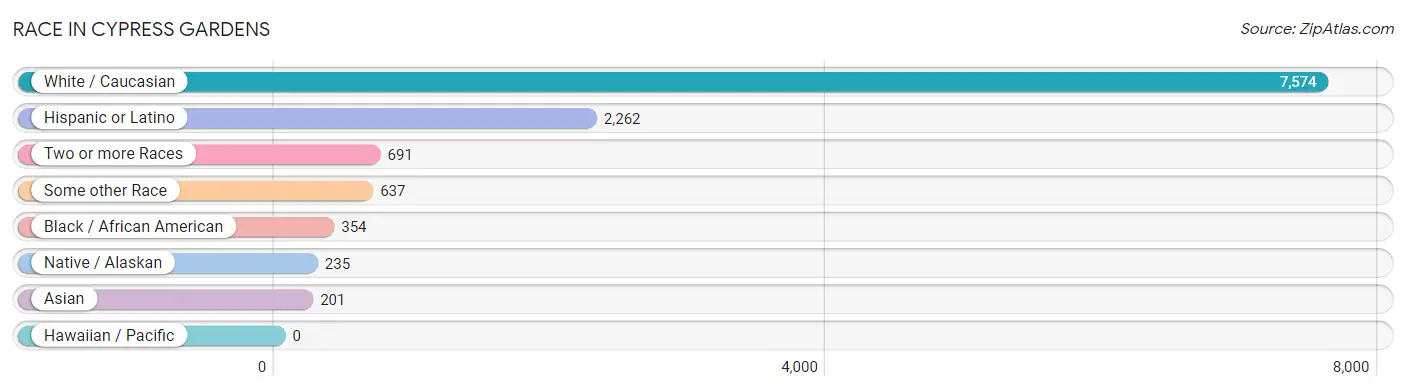
| Race | # Population | % Population |
| Asian | 201 | 2.1% |
| Black / African American | 354 | 3.6% |
| Hawaiian / Pacific | 0 | 0.0% |
| Hispanic or Latino | 2,262 | 23.3% |
| Native / Alaskan | 235 | 2.4% |
| White / Caucasian | 7,574 | 78.1% |
| Two or more Races | 691 | 7.1% |
| Some other Race | 637 | 6.6% |
| Total | 9,692 | 100.0% |
Ancestry in Cypress Gardens
The most populous ancestries reported in Cypress Gardens are American (2,052 | 21.2%), Puerto Rican (1,198 | 12.4%), German (888 | 9.2%), Mexican (786 | 8.1%), and English (781 | 8.1%), together accounting for 58.9% of all Cypress Gardens residents.
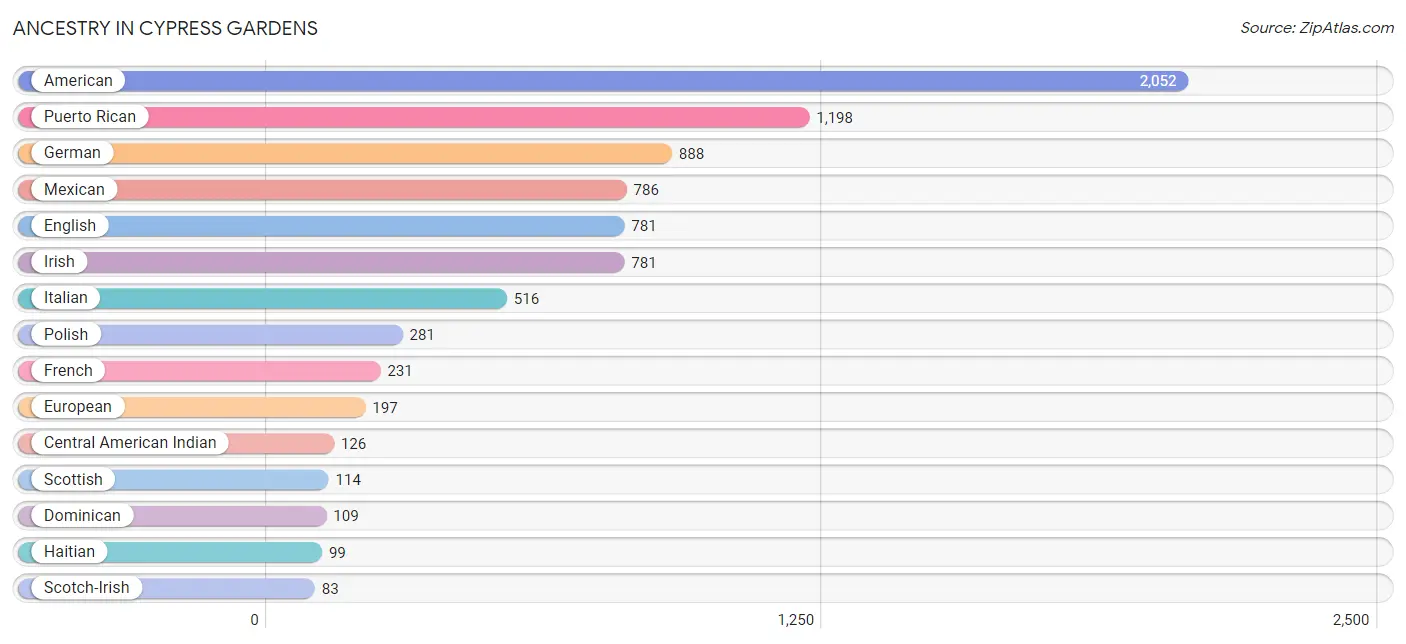
| Ancestry | # Population | % Population |
| American | 2,052 | 21.2% |
| Armenian | 27 | 0.3% |
| Bahamian | 8 | 0.1% |
| Bhutanese | 10 | 0.1% |
| Brazilian | 18 | 0.2% |
| British | 45 | 0.5% |
| Burmese | 48 | 0.5% |
| Canadian | 8 | 0.1% |
| Central American | 17 | 0.2% |
| Central American Indian | 126 | 1.3% |
| Cherokee | 10 | 0.1% |
| Colombian | 16 | 0.2% |
| Croatian | 27 | 0.3% |
| Cuban | 47 | 0.5% |
| Dominican | 109 | 1.1% |
| Dutch | 62 | 0.6% |
| Eastern European | 12 | 0.1% |
| Ecuadorian | 53 | 0.5% |
| English | 781 | 8.1% |
| European | 197 | 2.0% |
| Finnish | 19 | 0.2% |
| French | 231 | 2.4% |
| French Canadian | 15 | 0.2% |
| German | 888 | 9.2% |
| Greek | 26 | 0.3% |
| Guatemalan | 17 | 0.2% |
| Haitian | 99 | 1.0% |
| Indian (Asian) | 33 | 0.3% |
| Iranian | 11 | 0.1% |
| Irish | 781 | 8.1% |
| Italian | 516 | 5.3% |
| Korean | 61 | 0.6% |
| Mexican | 786 | 8.1% |
| Norwegian | 33 | 0.3% |
| Pakistani | 37 | 0.4% |
| Polish | 281 | 2.9% |
| Puerto Rican | 1,198 | 12.4% |
| Russian | 21 | 0.2% |
| Scotch-Irish | 83 | 0.9% |
| Scottish | 114 | 1.2% |
| Sioux | 57 | 0.6% |
| Slovak | 8 | 0.1% |
| South American | 69 | 0.7% |
| Spaniard | 11 | 0.1% |
| Sri Lankan | 21 | 0.2% |
| Swedish | 70 | 0.7% |
| Swiss | 55 | 0.6% |
| Thai | 1 | 0.0% |
| Ute | 35 | 0.4% | View All 49 Rows |
Immigrants in Cypress Gardens
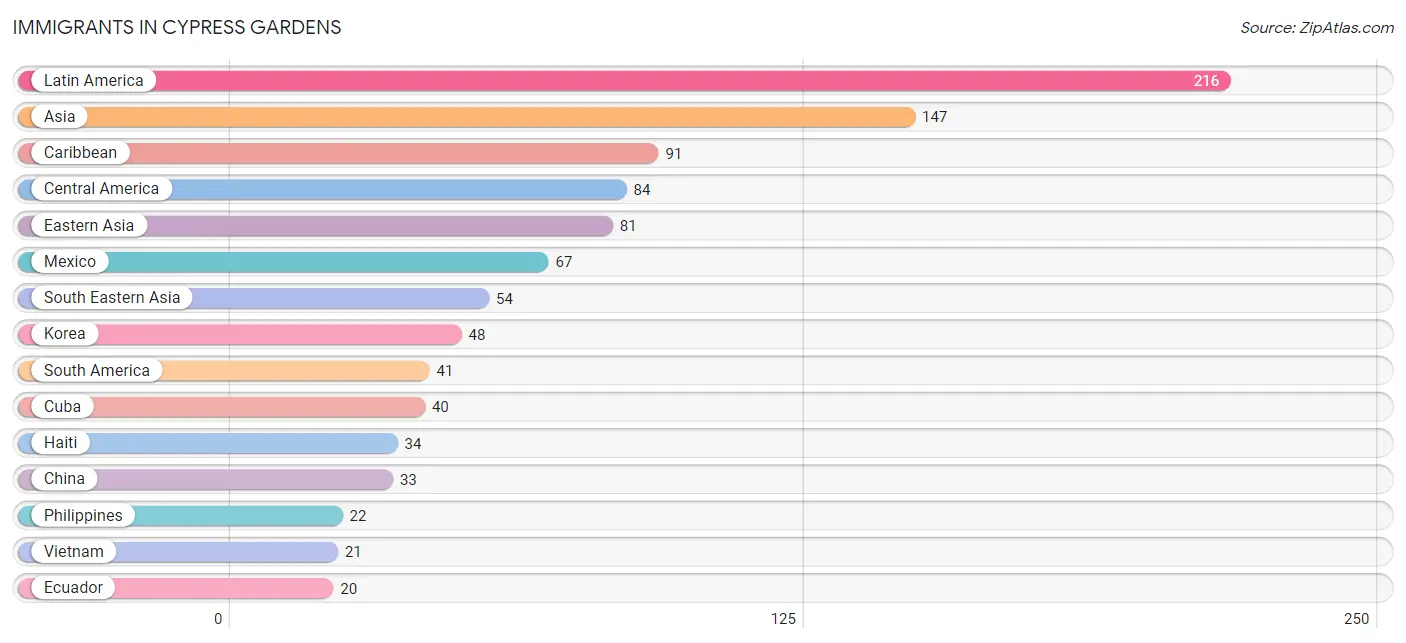
The most numerous immigrant groups reported in Cypress Gardens came from Latin America (216 | 2.2%), Asia (147 | 1.5%), Caribbean (91 | 0.9%), Central America (84 | 0.9%), and Eastern Asia (81 | 0.8%), together accounting for 6.4% of all Cypress Gardens residents.
| Immigration Origin | # Population | % Population |
| Asia | 147 | 1.5% |
| Bahamas | 8 | 0.1% |
| Brazil | 5 | 0.1% |
| Canada | 8 | 0.1% |
| Caribbean | 91 | 0.9% |
| Central America | 84 | 0.9% |
| China | 33 | 0.3% |
| Colombia | 16 | 0.2% |
| Cuba | 40 | 0.4% |
| Eastern Asia | 81 | 0.8% |
| Ecuador | 20 | 0.2% |
| Europe | 19 | 0.2% |
| Guatemala | 17 | 0.2% |
| Haiti | 34 | 0.4% |
| India | 1 | 0.0% |
| Korea | 48 | 0.5% |
| Latin America | 216 | 2.2% |
| Lebanon | 11 | 0.1% |
| Mexico | 67 | 0.7% |
| Northern Europe | 19 | 0.2% |
| Philippines | 22 | 0.2% |
| South America | 41 | 0.4% |
| South Central Asia | 1 | 0.0% |
| South Eastern Asia | 54 | 0.6% |
| Thailand | 11 | 0.1% |
| Vietnam | 21 | 0.2% |
| Western Asia | 11 | 0.1% | View All 27 Rows |
Sex and Age in Cypress Gardens
Sex and Age in Cypress Gardens
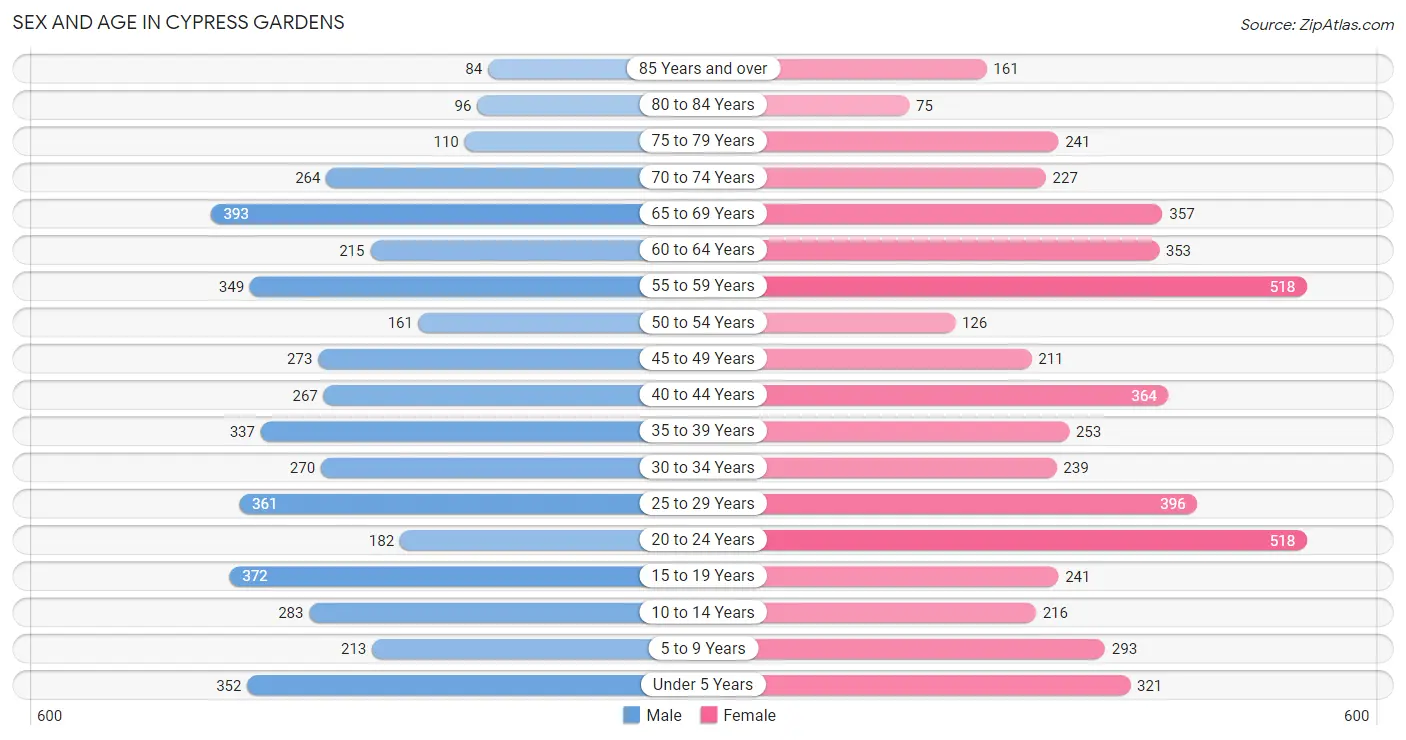
The most populous age groups in Cypress Gardens are 65 to 69 Years (393 | 8.6%) for men and 20 to 24 Years (518 | 10.1%) for women.
| Age Bracket | Male | Female |
| Under 5 Years | 352 (7.7%) | 321 (6.3%) |
| 5 to 9 Years | 213 (4.6%) | 293 (5.7%) |
| 10 to 14 Years | 283 (6.2%) | 216 (4.2%) |
| 15 to 19 Years | 372 (8.1%) | 241 (4.7%) |
| 20 to 24 Years | 182 (4.0%) | 518 (10.1%) |
| 25 to 29 Years | 361 (7.9%) | 396 (7.7%) |
| 30 to 34 Years | 270 (5.9%) | 239 (4.7%) |
| 35 to 39 Years | 337 (7.3%) | 253 (5.0%) |
| 40 to 44 Years | 267 (5.8%) | 364 (7.1%) |
| 45 to 49 Years | 273 (6.0%) | 211 (4.1%) |
| 50 to 54 Years | 161 (3.5%) | 126 (2.5%) |
| 55 to 59 Years | 349 (7.6%) | 518 (10.1%) |
| 60 to 64 Years | 215 (4.7%) | 353 (6.9%) |
| 65 to 69 Years | 393 (8.6%) | 357 (7.0%) |
| 70 to 74 Years | 264 (5.8%) | 227 (4.4%) |
| 75 to 79 Years | 110 (2.4%) | 241 (4.7%) |
| 80 to 84 Years | 96 (2.1%) | 75 (1.5%) |
| 85 Years and over | 84 (1.8%) | 161 (3.2%) |
| Total | 4,582 (100.0%) | 5,110 (100.0%) |
Families and Households in Cypress Gardens
Median Family Size in Cypress Gardens
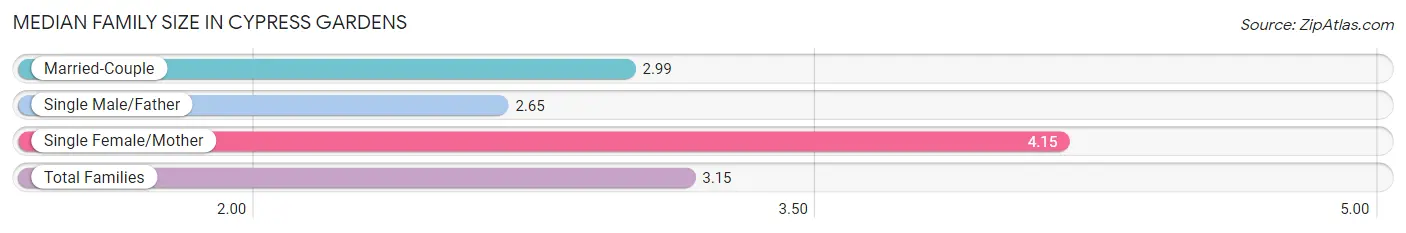
The median family size in Cypress Gardens is 3.15 persons per family, with single female/mother families (391 | 15.0%) accounting for the largest median family size of 4.15 persons per family. On the other hand, single male/father families (149 | 5.7%) represent the smallest median family size with 2.65 persons per family.
| Family Type | # Families | Family Size |
| Married-Couple | 2,064 (79.3%) | 2.99 |
| Single Male/Father | 149 (5.7%) | 2.65 |
| Single Female/Mother | 391 (15.0%) | 4.15 |
| Total Families | 2,604 (100.0%) | 3.15 |
Median Household Size in Cypress Gardens
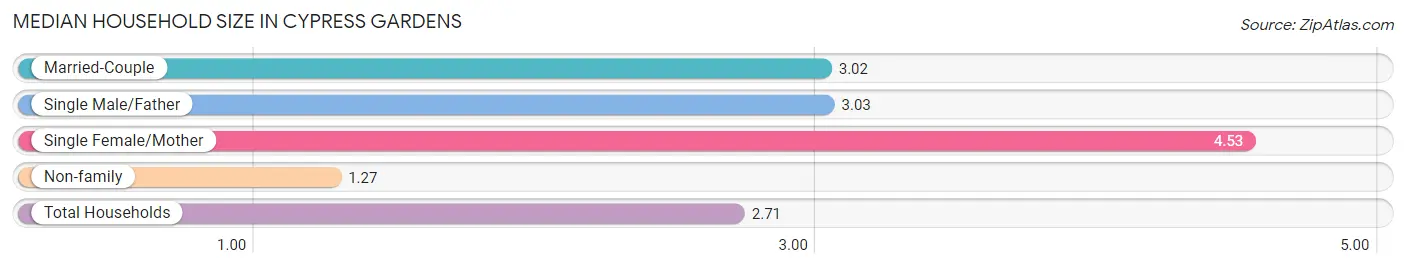
The median household size in Cypress Gardens is 2.71 persons per household, with single female/mother households (391 | 10.9%) accounting for the largest median household size of 4.53 persons per household. non-family households (971 | 27.2%) represent the smallest median household size with 1.27 persons per household.
| Household Type | # Households | Household Size |
| Married-Couple | 2,064 (57.7%) | 3.02 |
| Single Male/Father | 149 (4.2%) | 3.03 |
| Single Female/Mother | 391 (10.9%) | 4.53 |
| Non-family | 971 (27.2%) | 1.27 |
| Total Households | 3,575 (100.0%) | 2.71 |
Household Size by Marriage Status in Cypress Gardens
Out of a total of 3,575 households in Cypress Gardens, 2,604 (72.8%) are family households, while 971 (27.2%) are nonfamily households. The most numerous type of family households are 2-person households, comprising 1,226, and the most common type of nonfamily households are 1-person households, comprising 727.
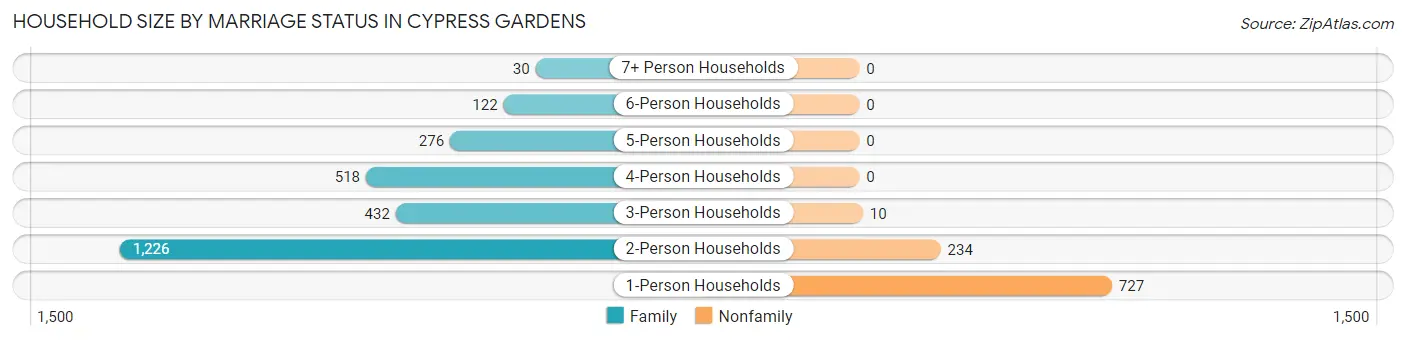
| Household Size | Family Households | Nonfamily Households |
| 1-Person Households | - | 727 (20.3%) |
| 2-Person Households | 1,226 (34.3%) | 234 (6.6%) |
| 3-Person Households | 432 (12.1%) | 10 (0.3%) |
| 4-Person Households | 518 (14.5%) | 0 (0.0%) |
| 5-Person Households | 276 (7.7%) | 0 (0.0%) |
| 6-Person Households | 122 (3.4%) | 0 (0.0%) |
| 7+ Person Households | 30 (0.8%) | 0 (0.0%) |
| Total | 2,604 (72.8%) | 971 (27.2%) |
Female Fertility in Cypress Gardens
Fertility by Age in Cypress Gardens
Average fertility rate in Cypress Gardens is 54.0 births per 1,000 women. Women in the age bracket of 20 to 34 years have the highest fertility rate with 96.0 births per 1,000 women. Women in the age bracket of 20 to 34 years acount for 91.0% of all women with births.
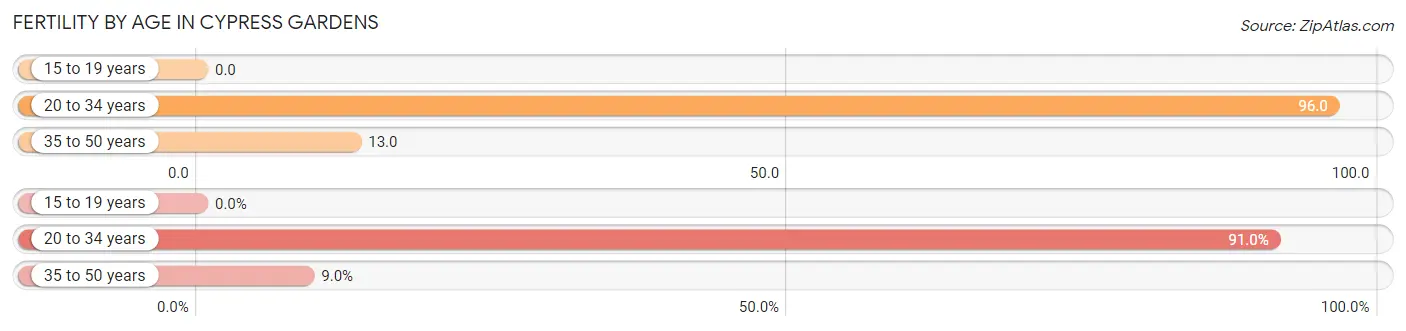
| Age Bracket | Women with Births | Births / 1,000 Women |
| 15 to 19 years | 0 (0.0%) | 0.0 |
| 20 to 34 years | 111 (91.0%) | 96.0 |
| 35 to 50 years | 11 (9.0%) | 13.0 |
| Total | 122 (100.0%) | 54.0 |
Fertility by Age by Marriage Status in Cypress Gardens
8.2% of women with births (122) in Cypress Gardens are married. The highest percentage of unmarried women with births falls into 35 to 50 years age bracket with 100.0% of them unmarried at the time of birth, while the lowest percentage of unmarried women with births belong to 20 to 34 years age bracket with 91.0% of them unmarried.
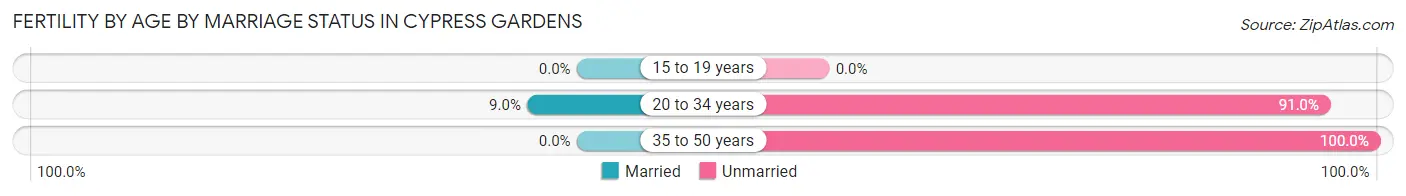
| Age Bracket | Married | Unmarried |
| 15 to 19 years | 0 (0.0%) | 0 (0.0%) |
| 20 to 34 years | 10 (9.0%) | 101 (91.0%) |
| 35 to 50 years | 0 (0.0%) | 11 (100.0%) |
| Total | 10 (8.2%) | 112 (91.8%) |
Fertility by Education in Cypress Gardens
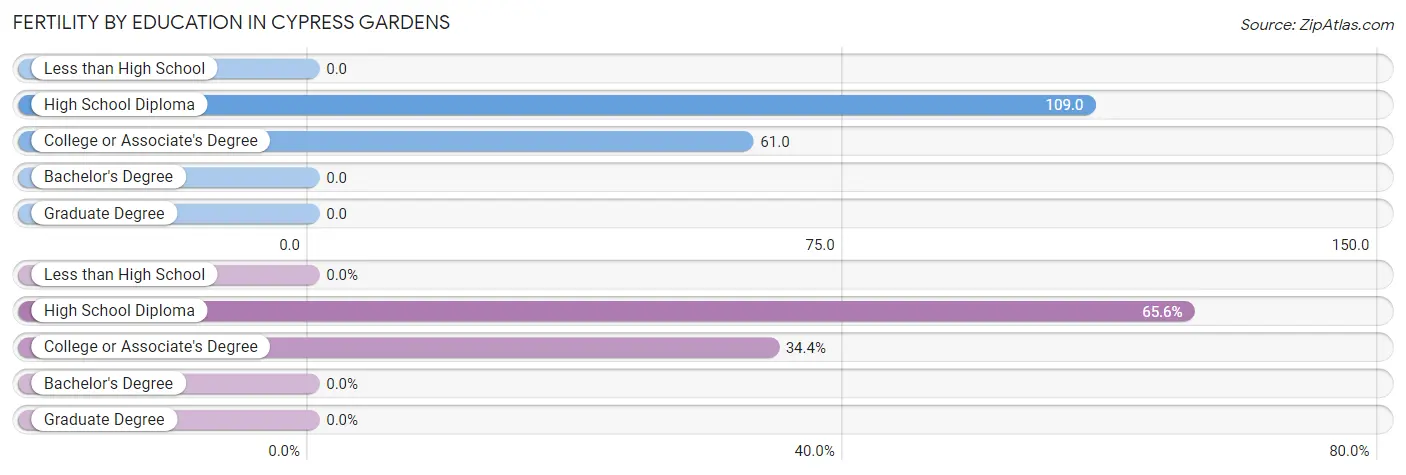
| Educational Attainment | Women with Births | Births / 1,000 Women |
| Less than High School | 0 (0.0%) | 0.0 |
| High School Diploma | 80 (65.6%) | 109.0 |
| College or Associate's Degree | 42 (34.4%) | 61.0 |
| Bachelor's Degree | 0 (0.0%) | 0.0 |
| Graduate Degree | 0 (0.0%) | 0.0 |
| Total | 122 (100.0%) | 54.0 |
Fertility by Education by Marriage Status in Cypress Gardens
91.8% of women with births in Cypress Gardens are unmarried. Women with the educational attainment of college or associate's degree are most likely to be married with 23.8% of them married at childbirth, while women with the educational attainment of high school diploma are least likely to be married with 100.0% of them unmarried at childbirth.
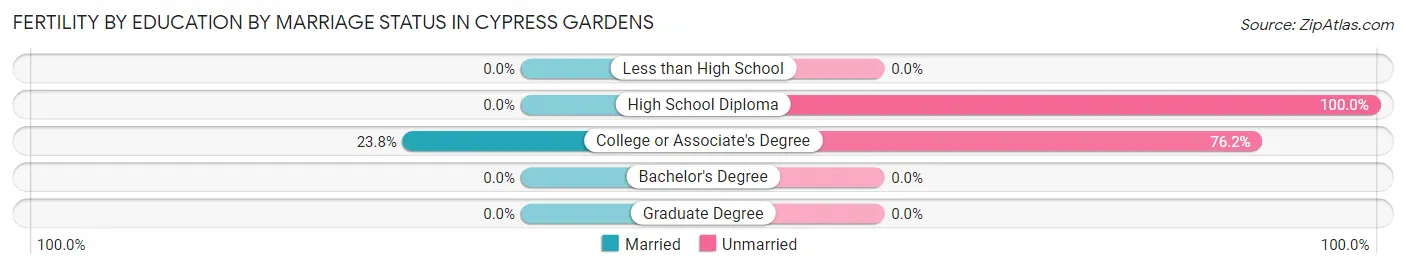
| Educational Attainment | Married | Unmarried |
| Less than High School | 0 (0.0%) | 0 (0.0%) |
| High School Diploma | 0 (0.0%) | 80 (100.0%) |
| College or Associate's Degree | 10 (23.8%) | 32 (76.2%) |
| Bachelor's Degree | 0 (0.0%) | 0 (0.0%) |
| Graduate Degree | 0 (0.0%) | 0 (0.0%) |
| Total | 10 (8.2%) | 112 (91.8%) |
Employment Characteristics in Cypress Gardens
Employment by Class of Employer in Cypress Gardens
Among the 4,849 employed individuals in Cypress Gardens, private company employees (3,073 | 63.4%), local government employees (832 | 17.2%), and not-for-profit organizations (442 | 9.1%) make up the most common classes of employment.
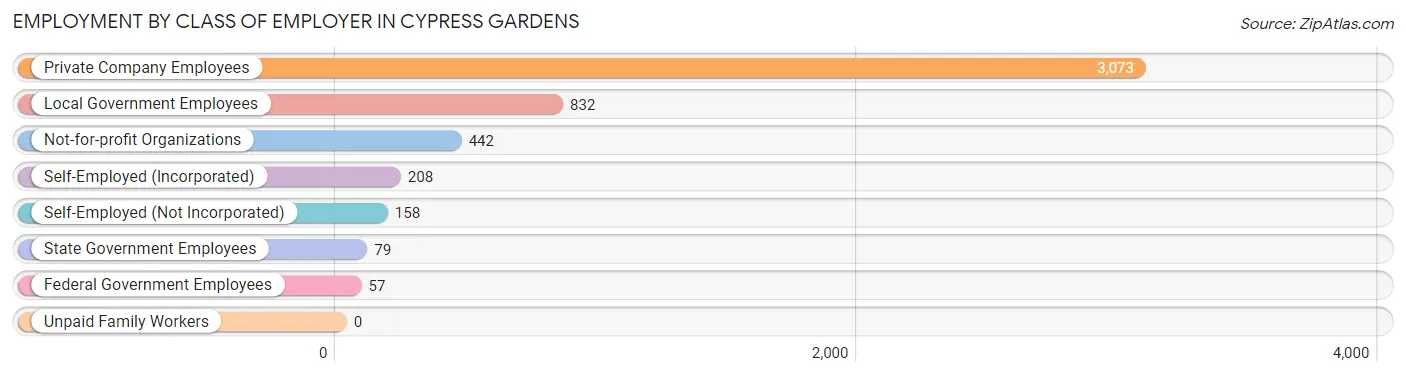
| Employer Class | # Employees | % Employees |
| Private Company Employees | 3,073 | 63.4% |
| Self-Employed (Incorporated) | 208 | 4.3% |
| Self-Employed (Not Incorporated) | 158 | 3.3% |
| Not-for-profit Organizations | 442 | 9.1% |
| Local Government Employees | 832 | 17.2% |
| State Government Employees | 79 | 1.6% |
| Federal Government Employees | 57 | 1.2% |
| Unpaid Family Workers | 0 | 0.0% |
| Total | 4,849 | 100.0% |
Employment Status by Age in Cypress Gardens
According to the labor force statistics for Cypress Gardens, out of the total population over 16 years of age (7,968), 63.0% or 5,020 individuals are in the labor force, with 2.6% or 131 of them unemployed. The age group with the highest labor force participation rate is 45 to 54 years, with 89.6% or 691 individuals in the labor force. Within the labor force, the 16 to 19 years age range has the highest percentage of unemployed individuals, with 8.9% or 22 of them being unemployed.
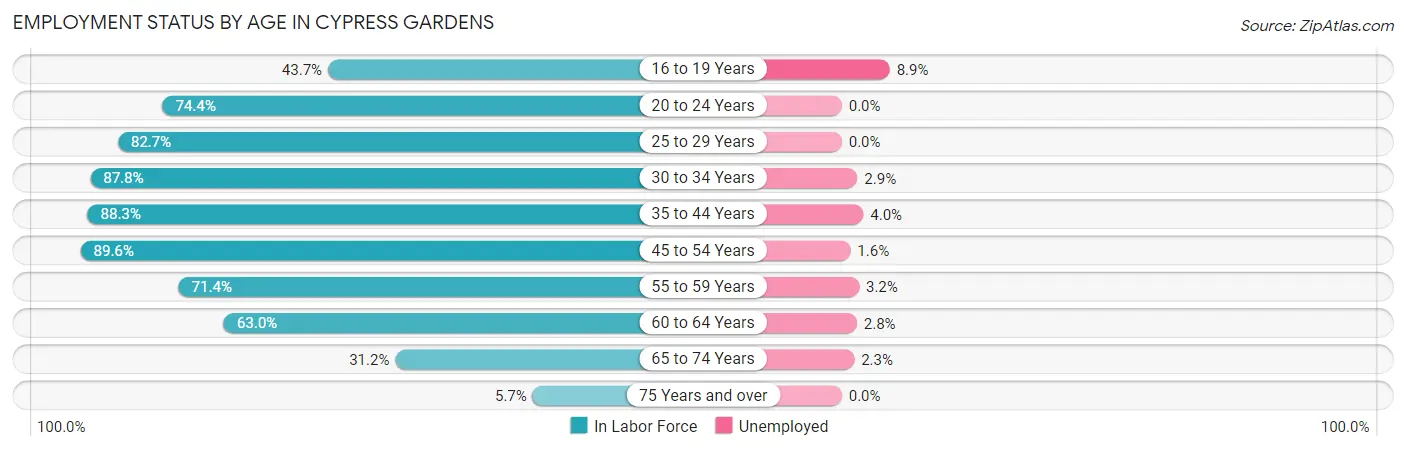
| Age Bracket | In Labor Force | Unemployed |
| 16 to 19 Years | 248 (43.7%) | 22 (8.9%) |
| 20 to 24 Years | 521 (74.4%) | 0 (0.0%) |
| 25 to 29 Years | 626 (82.7%) | 0 (0.0%) |
| 30 to 34 Years | 447 (87.8%) | 13 (2.9%) |
| 35 to 44 Years | 1,078 (88.3%) | 43 (4.0%) |
| 45 to 54 Years | 691 (89.6%) | 11 (1.6%) |
| 55 to 59 Years | 619 (71.4%) | 20 (3.2%) |
| 60 to 64 Years | 358 (63.0%) | 10 (2.8%) |
| 65 to 74 Years | 387 (31.2%) | 9 (2.3%) |
| 75 Years and over | 44 (5.7%) | 0 (0.0%) |
| Total | 5,020 (63.0%) | 131 (2.6%) |
Employment Status by Educational Attainment in Cypress Gardens
According to labor force statistics for Cypress Gardens, 81.4% of individuals (3,820) out of the total population between 25 and 64 years of age (4,693) are in the labor force, with 2.5% or 96 of them being unemployed. The group with the highest labor force participation rate are those with the educational attainment of bachelor's degree or higher, with 94.8% or 1,338 individuals in the labor force. Within the labor force, individuals with college / associate degree education have the highest percentage of unemployment, with 3.0% or 41 of them being unemployed.
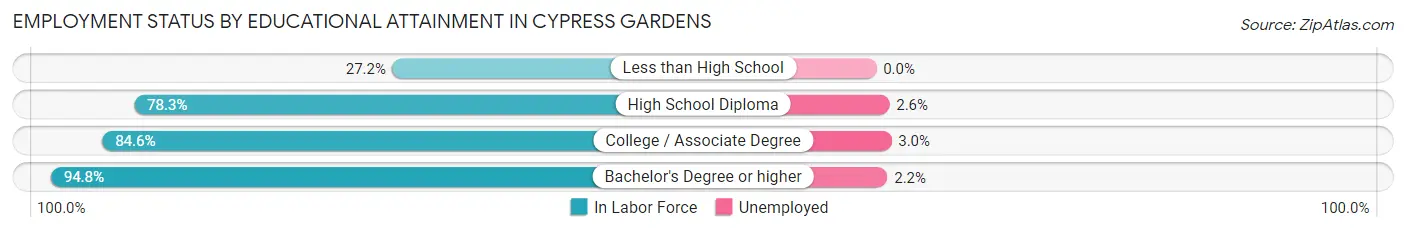
| Educational Attainment | In Labor Force | Unemployed |
| Less than High School | 102 (27.2%) | 0 (0.0%) |
| High School Diploma | 998 (78.3%) | 33 (2.6%) |
| College / Associate Degree | 1,382 (84.6%) | 49 (3.0%) |
| Bachelor's Degree or higher | 1,338 (94.8%) | 31 (2.2%) |
| Total | 3,820 (81.4%) | 117 (2.5%) |
Employment Occupations by Sex in Cypress Gardens
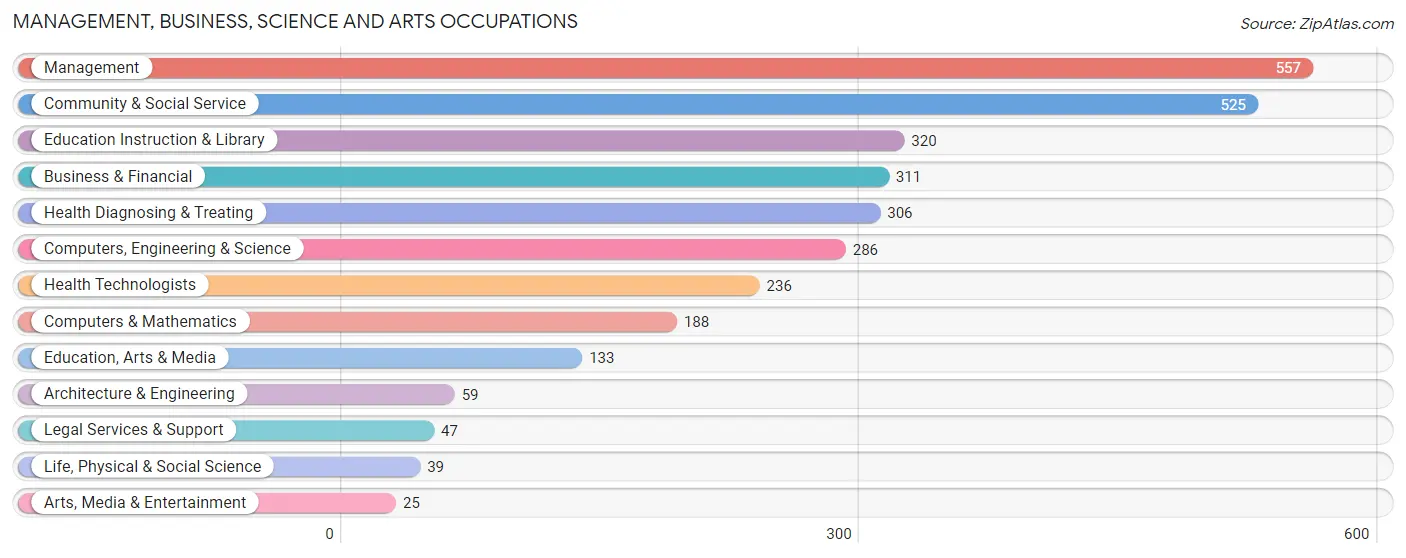
Management, Business, Science and Arts Occupations
The most common Management, Business, Science and Arts occupations in Cypress Gardens are Management (557 | 11.4%), Community & Social Service (525 | 10.7%), Education Instruction & Library (320 | 6.5%), Business & Financial (311 | 6.4%), and Health Diagnosing & Treating (306 | 6.3%).
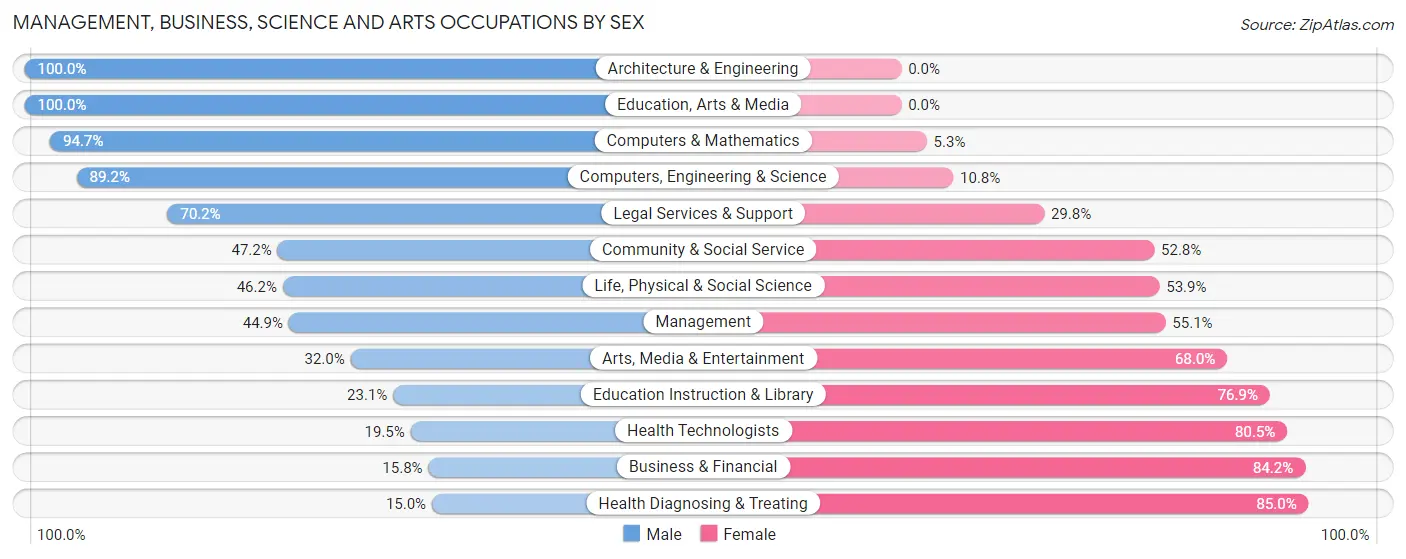
Management, Business, Science and Arts Occupations by Sex
Within the Management, Business, Science and Arts occupations in Cypress Gardens, the most male-oriented occupations are Architecture & Engineering (100.0%), Education, Arts & Media (100.0%), and Computers & Mathematics (94.7%), while the most female-oriented occupations are Health Diagnosing & Treating (85.0%), Business & Financial (84.2%), and Health Technologists (80.5%).
| Occupation | Male | Female |
| Management | 250 (44.9%) | 307 (55.1%) |
| Business & Financial | 49 (15.8%) | 262 (84.2%) |
| Computers, Engineering & Science | 255 (89.2%) | 31 (10.8%) |
| Computers & Mathematics | 178 (94.7%) | 10 (5.3%) |
| Architecture & Engineering | 59 (100.0%) | 0 (0.0%) |
| Life, Physical & Social Science | 18 (46.2%) | 21 (53.8%) |
| Community & Social Service | 248 (47.2%) | 277 (52.8%) |
| Education, Arts & Media | 133 (100.0%) | 0 (0.0%) |
| Legal Services & Support | 33 (70.2%) | 14 (29.8%) |
| Education Instruction & Library | 74 (23.1%) | 246 (76.9%) |
| Arts, Media & Entertainment | 8 (32.0%) | 17 (68.0%) |
| Health Diagnosing & Treating | 46 (15.0%) | 260 (85.0%) |
| Health Technologists | 46 (19.5%) | 190 (80.5%) |
| Total (Category) | 848 (42.7%) | 1,137 (57.3%) |
| Total (Overall) | 2,313 (47.3%) | 2,578 (52.7%) |
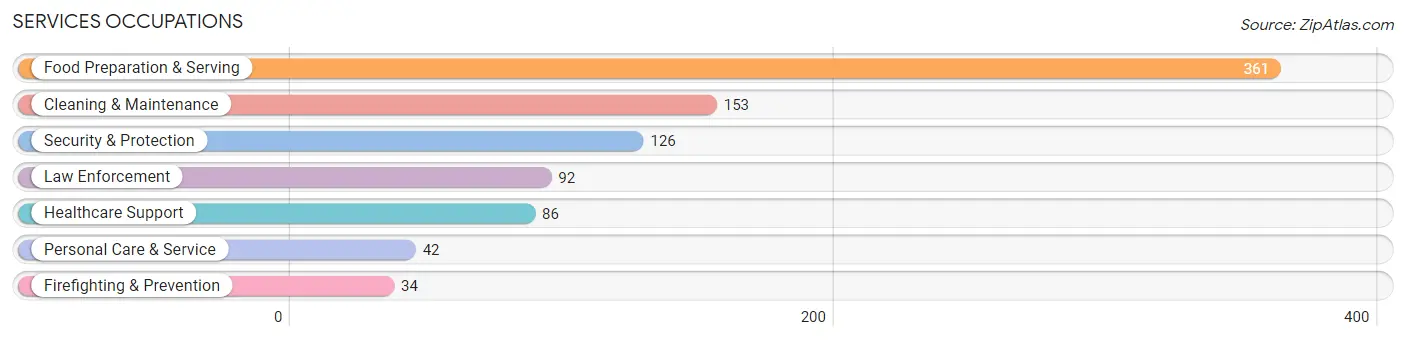
Services Occupations
The most common Services occupations in Cypress Gardens are Food Preparation & Serving (361 | 7.4%), Cleaning & Maintenance (153 | 3.1%), Security & Protection (126 | 2.6%), Law Enforcement (92 | 1.9%), and Healthcare Support (86 | 1.8%).
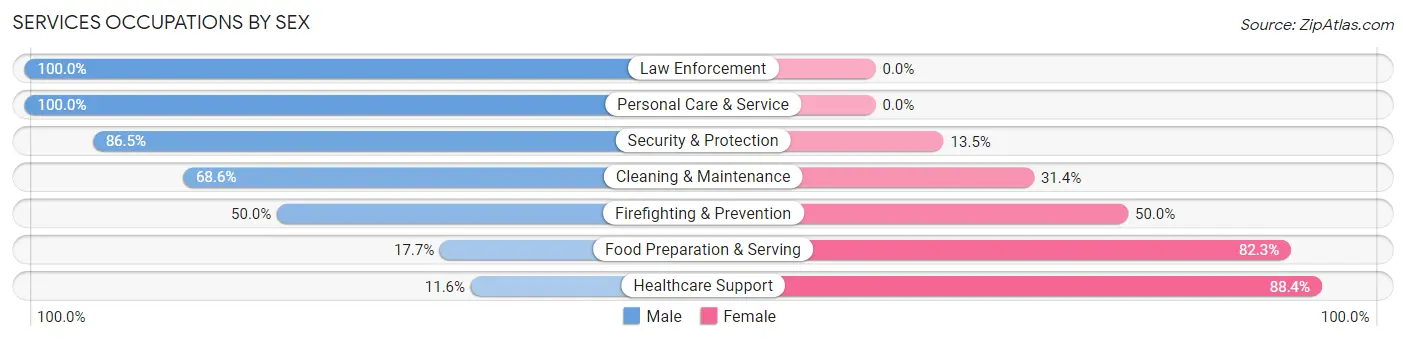
Services Occupations by Sex
Within the Services occupations in Cypress Gardens, the most male-oriented occupations are Law Enforcement (100.0%), Personal Care & Service (100.0%), and Security & Protection (86.5%), while the most female-oriented occupations are Healthcare Support (88.4%), Food Preparation & Serving (82.3%), and Firefighting & Prevention (50.0%).
| Occupation | Male | Female |
| Healthcare Support | 10 (11.6%) | 76 (88.4%) |
| Security & Protection | 109 (86.5%) | 17 (13.5%) |
| Firefighting & Prevention | 17 (50.0%) | 17 (50.0%) |
| Law Enforcement | 92 (100.0%) | 0 (0.0%) |
| Food Preparation & Serving | 64 (17.7%) | 297 (82.3%) |
| Cleaning & Maintenance | 105 (68.6%) | 48 (31.4%) |
| Personal Care & Service | 42 (100.0%) | 0 (0.0%) |
| Total (Category) | 330 (43.0%) | 438 (57.0%) |
| Total (Overall) | 2,313 (47.3%) | 2,578 (52.7%) |
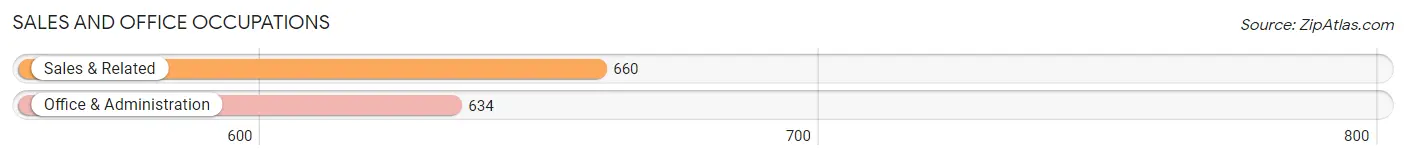
Sales and Office Occupations
The most common Sales and Office occupations in Cypress Gardens are Sales & Related (660 | 13.5%), and Office & Administration (634 | 13.0%).
Sales and Office Occupations by Sex
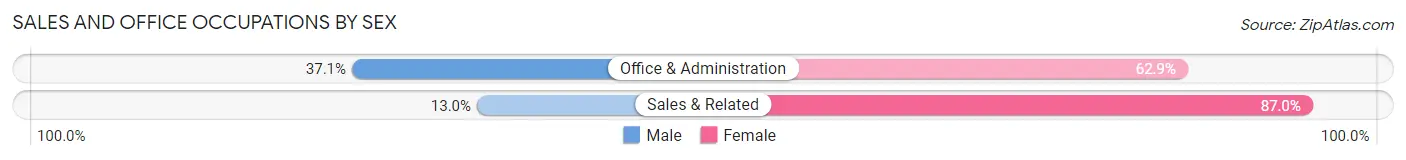
| Occupation | Male | Female |
| Sales & Related | 86 (13.0%) | 574 (87.0%) |
| Office & Administration | 235 (37.1%) | 399 (62.9%) |
| Total (Category) | 321 (24.8%) | 973 (75.2%) |
| Total (Overall) | 2,313 (47.3%) | 2,578 (52.7%) |
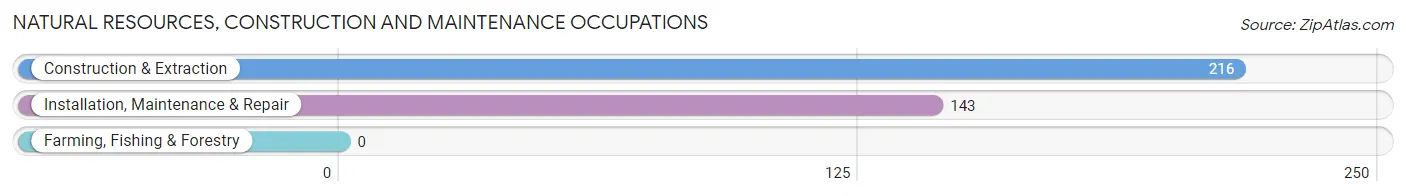
Natural Resources, Construction and Maintenance Occupations
The most common Natural Resources, Construction and Maintenance occupations in Cypress Gardens are Construction & Extraction (216 | 4.4%), and Installation, Maintenance & Repair (143 | 2.9%).
Natural Resources, Construction and Maintenance Occupations by Sex
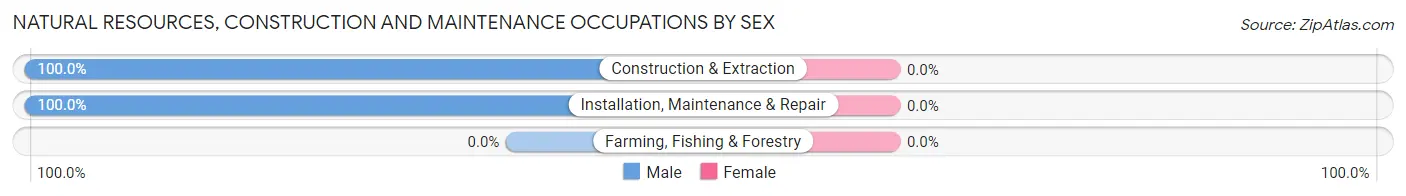
| Occupation | Male | Female |
| Farming, Fishing & Forestry | 0 (0.0%) | 0 (0.0%) |
| Construction & Extraction | 216 (100.0%) | 0 (0.0%) |
| Installation, Maintenance & Repair | 143 (100.0%) | 0 (0.0%) |
| Total (Category) | 359 (100.0%) | 0 (0.0%) |
| Total (Overall) | 2,313 (47.3%) | 2,578 (52.7%) |
Production, Transportation and Moving Occupations
The most common Production, Transportation and Moving occupations in Cypress Gardens are Transportation (215 | 4.4%), Production (185 | 3.8%), and Material Moving (85 | 1.7%).
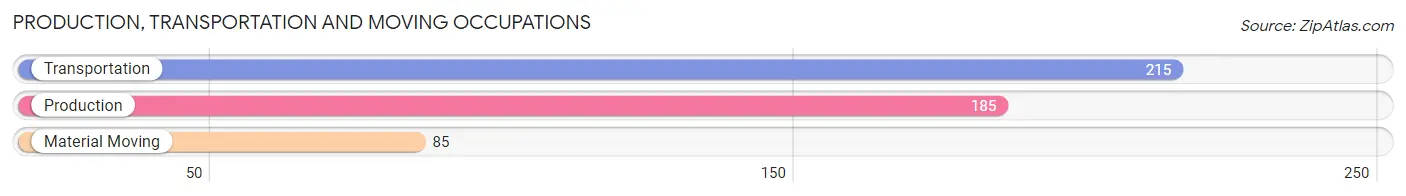
Production, Transportation and Moving Occupations by Sex
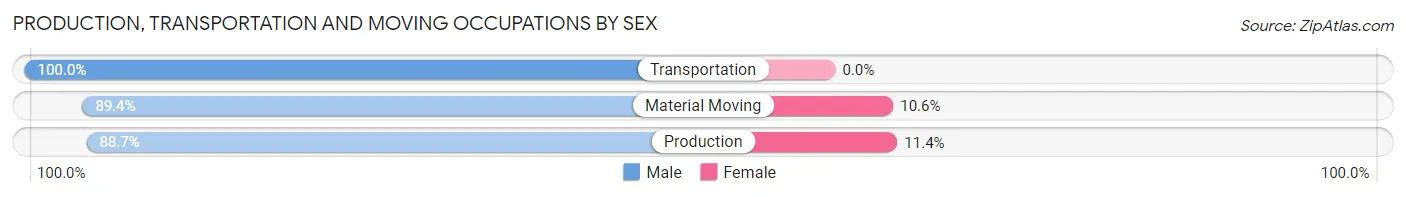
| Occupation | Male | Female |
| Production | 164 (88.6%) | 21 (11.4%) |
| Transportation | 215 (100.0%) | 0 (0.0%) |
| Material Moving | 76 (89.4%) | 9 (10.6%) |
| Total (Category) | 455 (93.8%) | 30 (6.2%) |
| Total (Overall) | 2,313 (47.3%) | 2,578 (52.7%) |
Employment Industries by Sex in Cypress Gardens
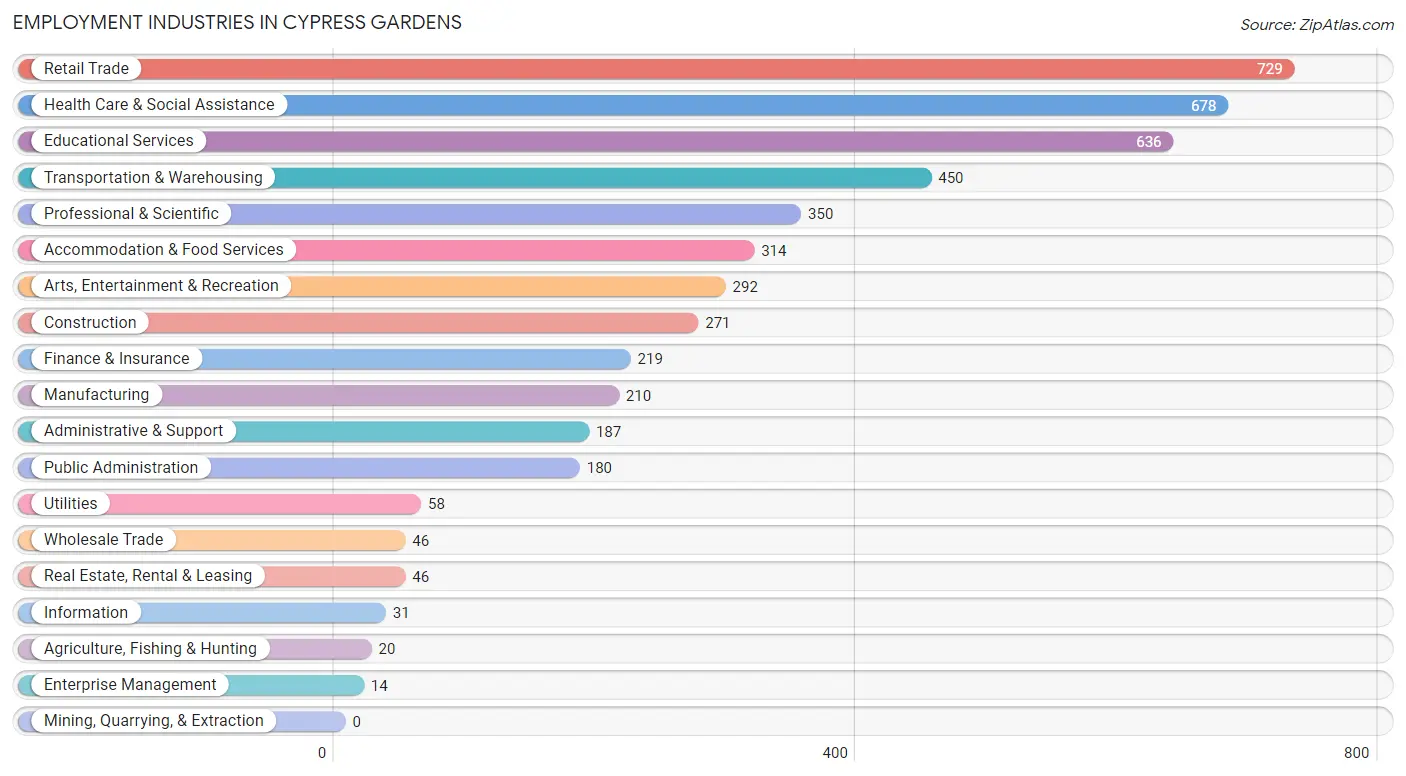
Employment Industries in Cypress Gardens
The major employment industries in Cypress Gardens include Retail Trade (729 | 14.9%), Health Care & Social Assistance (678 | 13.9%), Educational Services (636 | 13.0%), Transportation & Warehousing (450 | 9.2%), and Professional & Scientific (350 | 7.2%).
Employment Industries by Sex in Cypress Gardens
The Cypress Gardens industries that see more men than women are Utilities (100.0%), Information (100.0%), and Construction (95.9%), whereas the industries that tend to have a higher number of women are Enterprise Management (100.0%), Finance & Insurance (92.2%), and Retail Trade (82.4%).
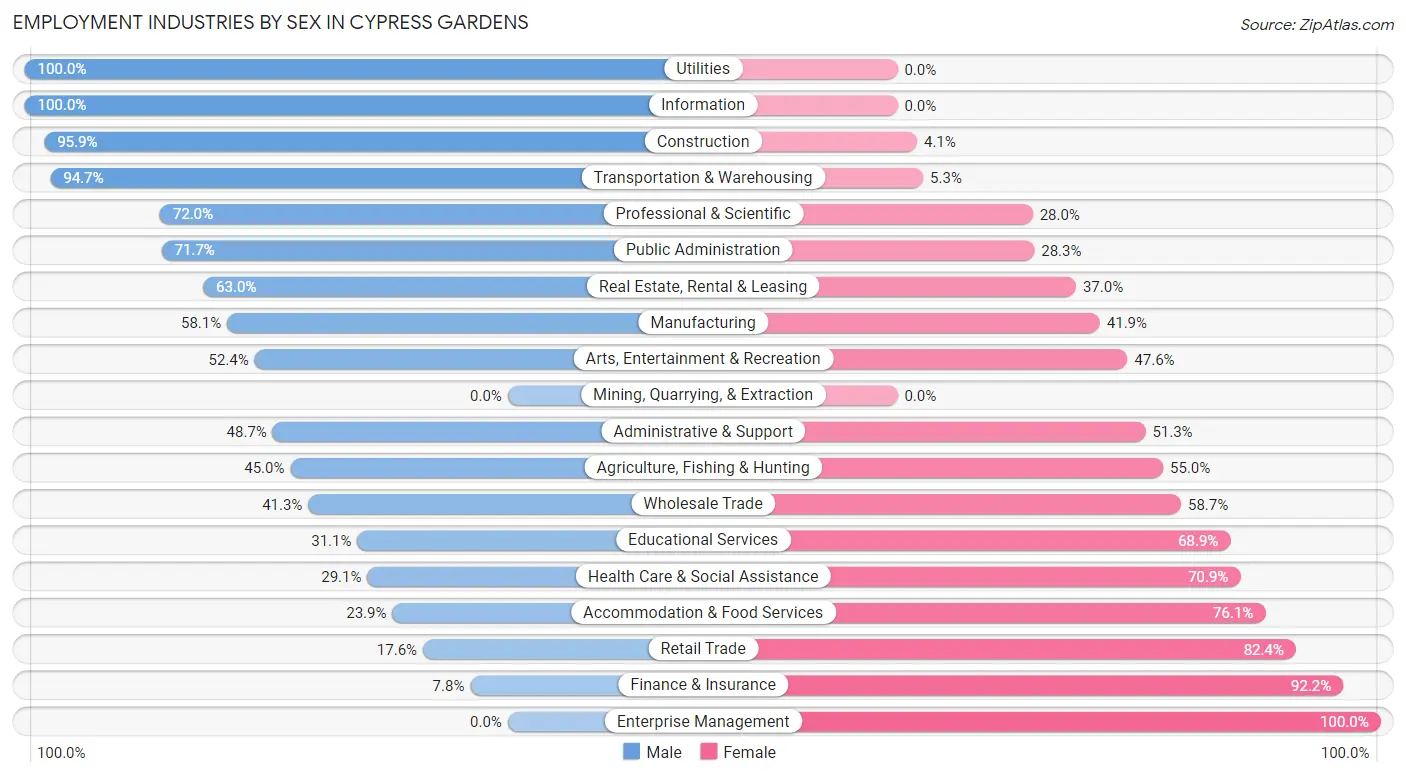
| Industry | Male | Female |
| Agriculture, Fishing & Hunting | 9 (45.0%) | 11 (55.0%) |
| Mining, Quarrying, & Extraction | 0 (0.0%) | 0 (0.0%) |
| Construction | 260 (95.9%) | 11 (4.1%) |
| Manufacturing | 122 (58.1%) | 88 (41.9%) |
| Wholesale Trade | 19 (41.3%) | 27 (58.7%) |
| Retail Trade | 128 (17.6%) | 601 (82.4%) |
| Transportation & Warehousing | 426 (94.7%) | 24 (5.3%) |
| Utilities | 58 (100.0%) | 0 (0.0%) |
| Information | 31 (100.0%) | 0 (0.0%) |
| Finance & Insurance | 17 (7.8%) | 202 (92.2%) |
| Real Estate, Rental & Leasing | 29 (63.0%) | 17 (37.0%) |
| Professional & Scientific | 252 (72.0%) | 98 (28.0%) |
| Enterprise Management | 0 (0.0%) | 14 (100.0%) |
| Administrative & Support | 91 (48.7%) | 96 (51.3%) |
| Educational Services | 198 (31.1%) | 438 (68.9%) |
| Health Care & Social Assistance | 197 (29.1%) | 481 (70.9%) |
| Arts, Entertainment & Recreation | 153 (52.4%) | 139 (47.6%) |
| Accommodation & Food Services | 75 (23.9%) | 239 (76.1%) |
| Public Administration | 129 (71.7%) | 51 (28.3%) |
| Total | 2,313 (47.3%) | 2,578 (52.7%) |
Education in Cypress Gardens
School Enrollment in Cypress Gardens
The most common levels of schooling among the 1,899 students in Cypress Gardens are high school (562 | 29.6%), elementary school (433 | 22.8%), and middle school (420 | 22.1%).
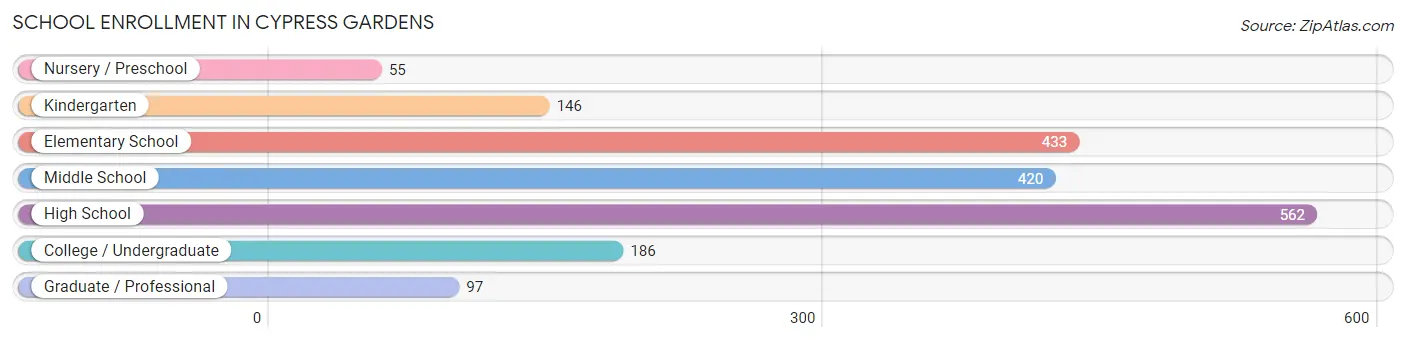
| School Level | # Students | % Students |
| Nursery / Preschool | 55 | 2.9% |
| Kindergarten | 146 | 7.7% |
| Elementary School | 433 | 22.8% |
| Middle School | 420 | 22.1% |
| High School | 562 | 29.6% |
| College / Undergraduate | 186 | 9.8% |
| Graduate / Professional | 97 | 5.1% |
| Total | 1,899 | 100.0% |
School Enrollment by Age by Funding Source in Cypress Gardens
Out of a total of 1,899 students who are enrolled in schools in Cypress Gardens, 273 (14.4%) attend a private institution, while the remaining 1,626 (85.6%) are enrolled in public schools. The age group of 10 to 14 year olds has the highest likelihood of being enrolled in private schools, with 139 (27.9% in the age bracket) enrolled. Conversely, the age group of 25 to 34 year olds has the lowest likelihood of being enrolled in a private school, with 22 (100.0% in the age bracket) attending a public institution.
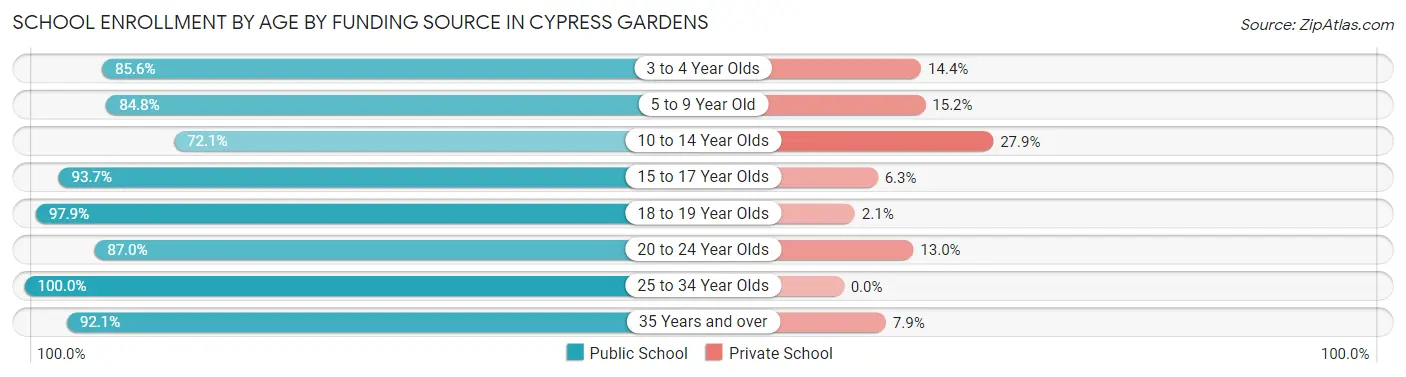
| Age Bracket | Public School | Private School |
| 3 to 4 Year Olds | 83 (85.6%) | 14 (14.4%) |
| 5 to 9 Year Old | 429 (84.8%) | 77 (15.2%) |
| 10 to 14 Year Olds | 360 (72.1%) | 139 (27.9%) |
| 15 to 17 Year Olds | 266 (93.7%) | 18 (6.3%) |
| 18 to 19 Year Olds | 281 (97.9%) | 6 (2.1%) |
| 20 to 24 Year Olds | 67 (87.0%) | 10 (13.0%) |
| 25 to 34 Year Olds | 22 (100.0%) | 0 (0.0%) |
| 35 Years and over | 117 (92.1%) | 10 (7.9%) |
| Total | 1,626 (85.6%) | 273 (14.4%) |
Educational Attainment by Field of Study in Cypress Gardens
Education (586 | 27.1%), business (440 | 20.4%), science & technology (221 | 10.2%), liberal arts & history (163 | 7.5%), and arts & humanities (154 | 7.1%) are the most common fields of study among 2,159 individuals in Cypress Gardens who have obtained a bachelor's degree or higher.
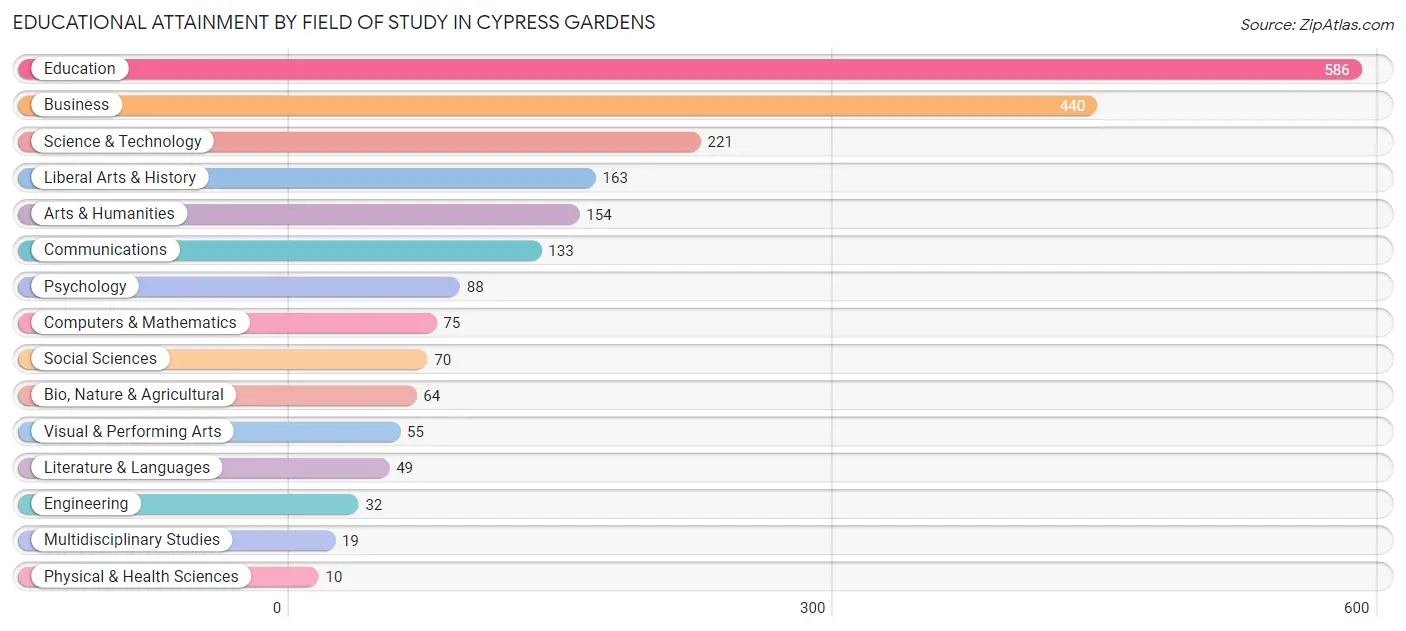
| Field of Study | # Graduates | % Graduates |
| Computers & Mathematics | 75 | 3.5% |
| Bio, Nature & Agricultural | 64 | 3.0% |
| Physical & Health Sciences | 10 | 0.5% |
| Psychology | 88 | 4.1% |
| Social Sciences | 70 | 3.2% |
| Engineering | 32 | 1.5% |
| Multidisciplinary Studies | 19 | 0.9% |
| Science & Technology | 221 | 10.2% |
| Business | 440 | 20.4% |
| Education | 586 | 27.1% |
| Literature & Languages | 49 | 2.3% |
| Liberal Arts & History | 163 | 7.5% |
| Visual & Performing Arts | 55 | 2.5% |
| Communications | 133 | 6.2% |
| Arts & Humanities | 154 | 7.1% |
| Total | 2,159 | 100.0% |
Transportation & Commute in Cypress Gardens
Vehicle Availability by Sex in Cypress Gardens
The most prevalent vehicle ownership categories in Cypress Gardens are males with 2 vehicles (867, accounting for 37.5%) and females with 2 vehicles (955, making up 34.2%).
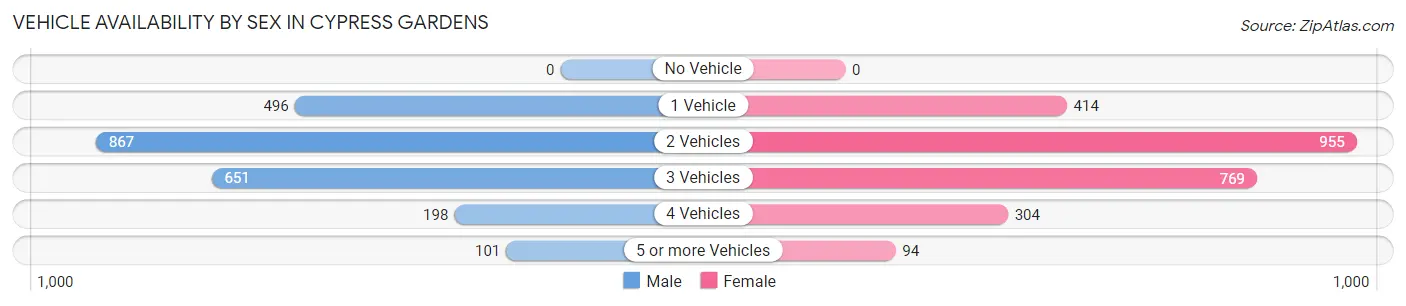
| Vehicles Available | Male | Female |
| No Vehicle | 0 (0.0%) | 0 (0.0%) |
| 1 Vehicle | 496 (21.4%) | 414 (16.3%) |
| 2 Vehicles | 867 (37.5%) | 955 (37.7%) |
| 3 Vehicles | 651 (28.1%) | 769 (30.3%) |
| 4 Vehicles | 198 (8.6%) | 304 (12.0%) |
| 5 or more Vehicles | 101 (4.4%) | 94 (3.7%) |
| Total | 2,313 (100.0%) | 2,536 (100.0%) |
Commute Time in Cypress Gardens
The most frequently occuring commute durations in Cypress Gardens are 10 to 14 minutes (930 commuters, 20.6%), 15 to 19 minutes (581 commuters, 12.9%), and 30 to 34 minutes (531 commuters, 11.8%).
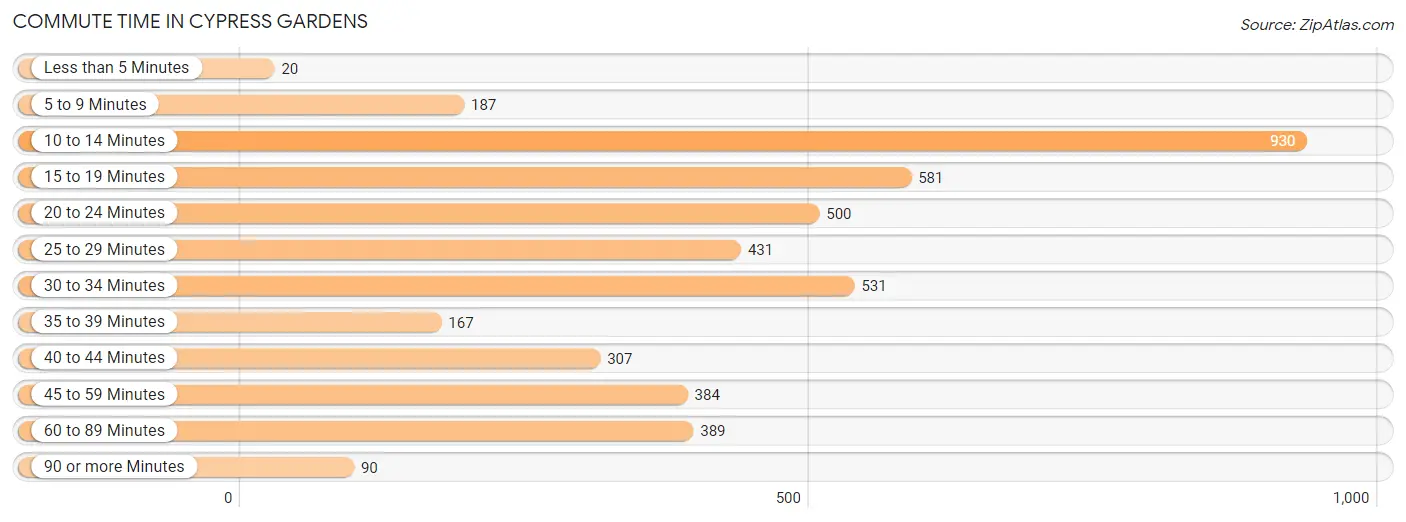
| Commute Time | # Commuters | % Commuters |
| Less than 5 Minutes | 20 | 0.4% |
| 5 to 9 Minutes | 187 | 4.1% |
| 10 to 14 Minutes | 930 | 20.6% |
| 15 to 19 Minutes | 581 | 12.9% |
| 20 to 24 Minutes | 500 | 11.1% |
| 25 to 29 Minutes | 431 | 9.5% |
| 30 to 34 Minutes | 531 | 11.8% |
| 35 to 39 Minutes | 167 | 3.7% |
| 40 to 44 Minutes | 307 | 6.8% |
| 45 to 59 Minutes | 384 | 8.5% |
| 60 to 89 Minutes | 389 | 8.6% |
| 90 or more Minutes | 90 | 2.0% |
Commute Time by Sex in Cypress Gardens
The most common commute times in Cypress Gardens are 30 to 34 minutes (327 commuters, 14.7%) for males and 10 to 14 minutes (634 commuters, 27.7%) for females.
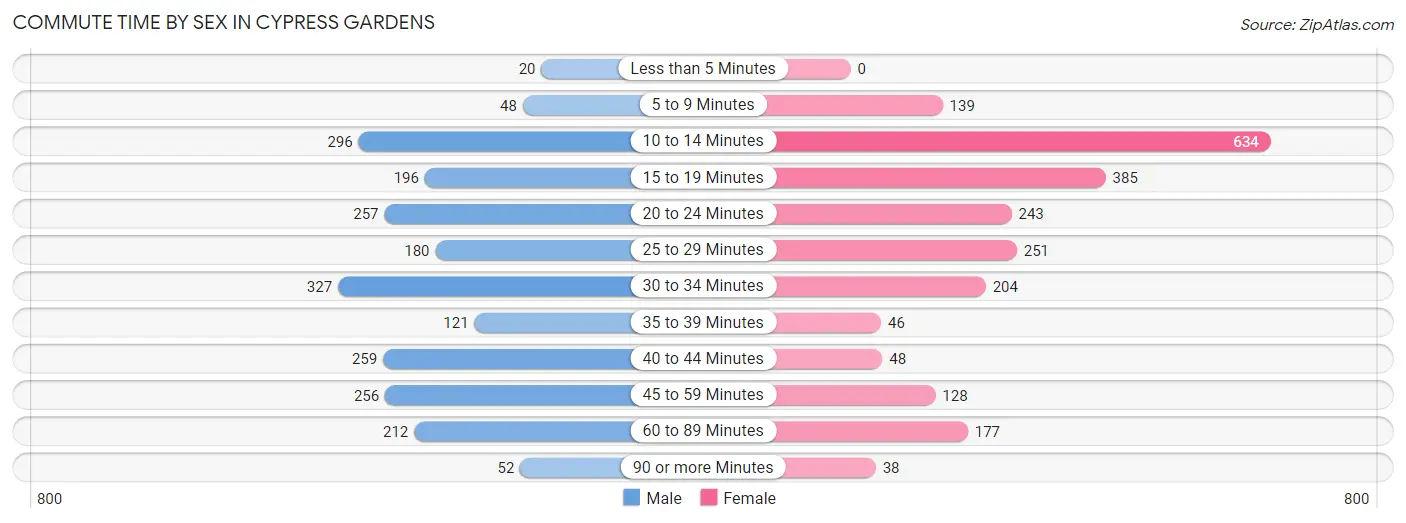
| Commute Time | Male | Female |
| Less than 5 Minutes | 20 (0.9%) | 0 (0.0%) |
| 5 to 9 Minutes | 48 (2.2%) | 139 (6.1%) |
| 10 to 14 Minutes | 296 (13.3%) | 634 (27.7%) |
| 15 to 19 Minutes | 196 (8.8%) | 385 (16.8%) |
| 20 to 24 Minutes | 257 (11.6%) | 243 (10.6%) |
| 25 to 29 Minutes | 180 (8.1%) | 251 (11.0%) |
| 30 to 34 Minutes | 327 (14.7%) | 204 (8.9%) |
| 35 to 39 Minutes | 121 (5.4%) | 46 (2.0%) |
| 40 to 44 Minutes | 259 (11.7%) | 48 (2.1%) |
| 45 to 59 Minutes | 256 (11.5%) | 128 (5.6%) |
| 60 to 89 Minutes | 212 (9.5%) | 177 (7.7%) |
| 90 or more Minutes | 52 (2.3%) | 38 (1.7%) |
Time of Departure to Work by Sex in Cypress Gardens
The most frequent times of departure to work in Cypress Gardens are 6:30 AM to 6:59 AM (597, 26.8%) for males and 7:00 AM to 7:29 AM (549, 23.9%) for females.
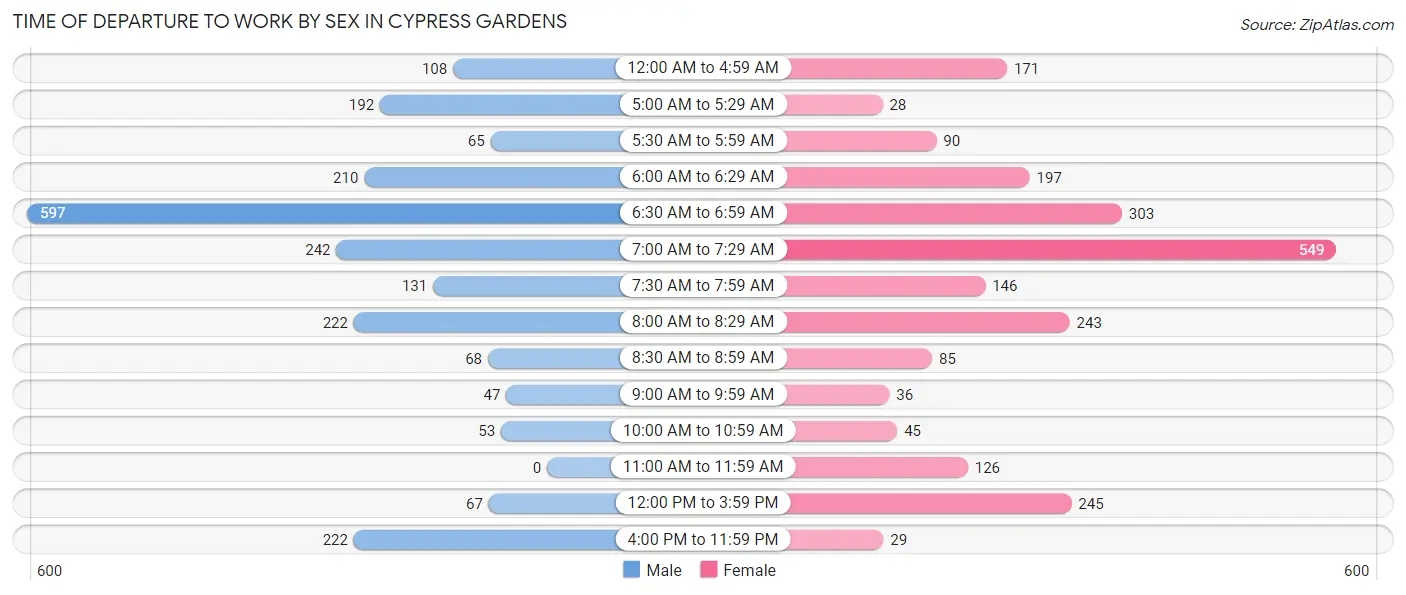
| Time of Departure | Male | Female |
| 12:00 AM to 4:59 AM | 108 (4.9%) | 171 (7.5%) |
| 5:00 AM to 5:29 AM | 192 (8.6%) | 28 (1.2%) |
| 5:30 AM to 5:59 AM | 65 (2.9%) | 90 (3.9%) |
| 6:00 AM to 6:29 AM | 210 (9.4%) | 197 (8.6%) |
| 6:30 AM to 6:59 AM | 597 (26.8%) | 303 (13.2%) |
| 7:00 AM to 7:29 AM | 242 (10.9%) | 549 (23.9%) |
| 7:30 AM to 7:59 AM | 131 (5.9%) | 146 (6.4%) |
| 8:00 AM to 8:29 AM | 222 (10.0%) | 243 (10.6%) |
| 8:30 AM to 8:59 AM | 68 (3.1%) | 85 (3.7%) |
| 9:00 AM to 9:59 AM | 47 (2.1%) | 36 (1.6%) |
| 10:00 AM to 10:59 AM | 53 (2.4%) | 45 (2.0%) |
| 11:00 AM to 11:59 AM | 0 (0.0%) | 126 (5.5%) |
| 12:00 PM to 3:59 PM | 67 (3.0%) | 245 (10.7%) |
| 4:00 PM to 11:59 PM | 222 (10.0%) | 29 (1.3%) |
| Total | 2,224 (100.0%) | 2,293 (100.0%) |
Housing Occupancy in Cypress Gardens
Occupancy by Ownership in Cypress Gardens
Of the total 3,575 dwellings in Cypress Gardens, owner-occupied units account for 2,801 (78.3%), while renter-occupied units make up 774 (21.6%).
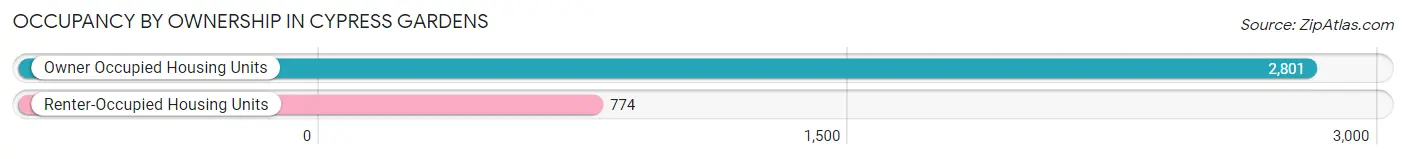
| Occupancy | # Housing Units | % Housing Units |
| Owner Occupied Housing Units | 2,801 | 78.3% |
| Renter-Occupied Housing Units | 774 | 21.6% |
| Total Occupied Housing Units | 3,575 | 100.0% |
Occupancy by Household Size in Cypress Gardens
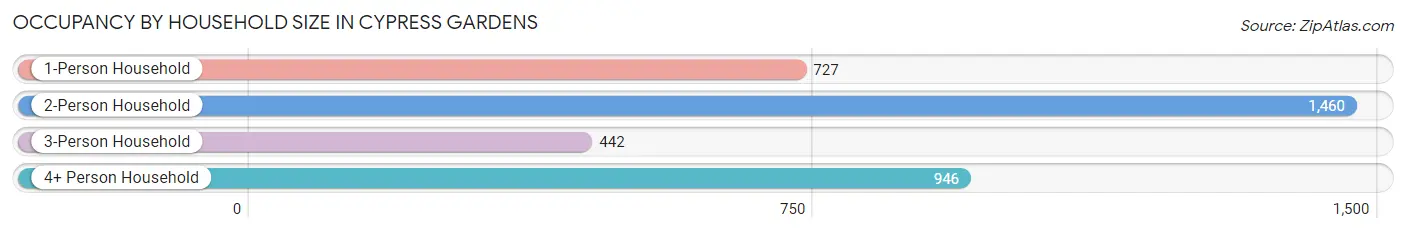
| Household Size | # Housing Units | % Housing Units |
| 1-Person Household | 727 | 20.3% |
| 2-Person Household | 1,460 | 40.8% |
| 3-Person Household | 442 | 12.4% |
| 4+ Person Household | 946 | 26.5% |
| Total Housing Units | 3,575 | 100.0% |
Occupancy by Ownership by Household Size in Cypress Gardens
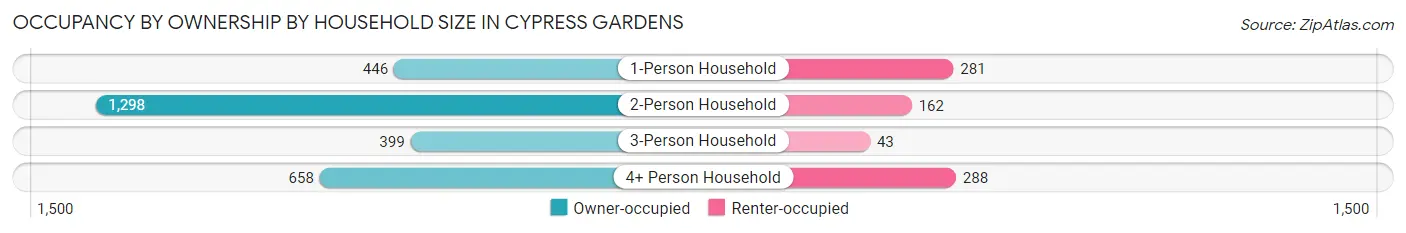
| Household Size | Owner-occupied | Renter-occupied |
| 1-Person Household | 446 (61.4%) | 281 (38.7%) |
| 2-Person Household | 1,298 (88.9%) | 162 (11.1%) |
| 3-Person Household | 399 (90.3%) | 43 (9.7%) |
| 4+ Person Household | 658 (69.6%) | 288 (30.4%) |
| Total Housing Units | 2,801 (78.3%) | 774 (21.6%) |
Occupancy by Educational Attainment in Cypress Gardens
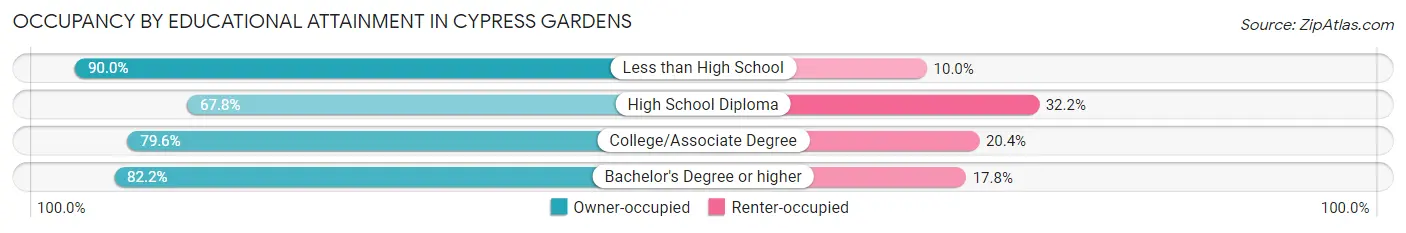
| Household Size | Owner-occupied | Renter-occupied |
| Less than High School | 189 (90.0%) | 21 (10.0%) |
| High School Diploma | 572 (67.8%) | 272 (32.2%) |
| College/Associate Degree | 1,012 (79.6%) | 259 (20.4%) |
| Bachelor's Degree or higher | 1,028 (82.2%) | 222 (17.8%) |
Occupancy by Age of Householder in Cypress Gardens
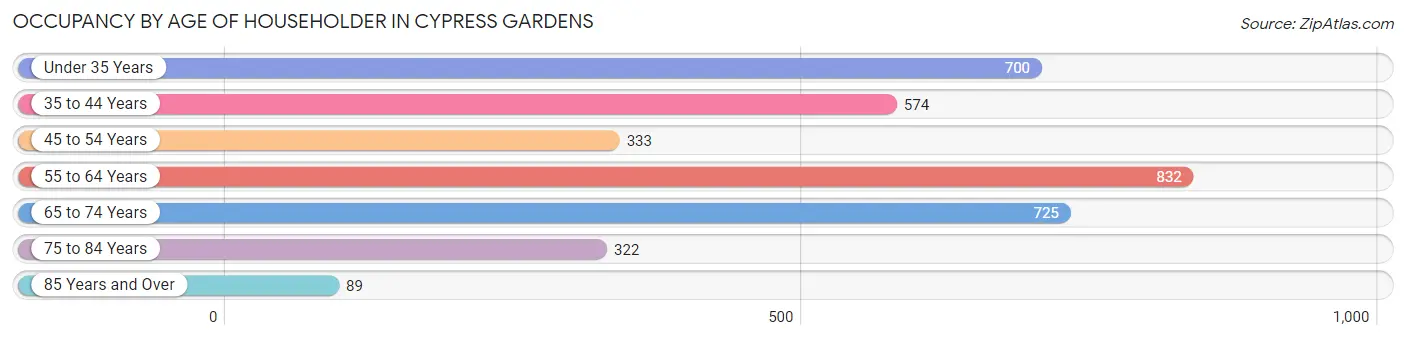
| Age Bracket | # Households | % Households |
| Under 35 Years | 700 | 19.6% |
| 35 to 44 Years | 574 | 16.1% |
| 45 to 54 Years | 333 | 9.3% |
| 55 to 64 Years | 832 | 23.3% |
| 65 to 74 Years | 725 | 20.3% |
| 75 to 84 Years | 322 | 9.0% |
| 85 Years and Over | 89 | 2.5% |
| Total | 3,575 | 100.0% |
Housing Finances in Cypress Gardens
Median Income by Occupancy in Cypress Gardens
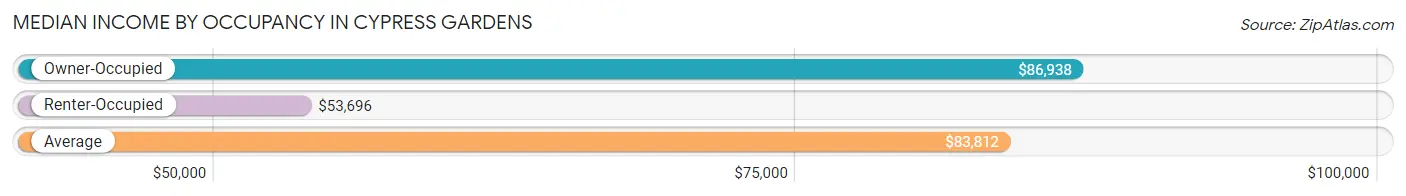
| Occupancy Type | # Households | Median Income |
| Owner-Occupied | 2,801 (78.3%) | $86,938 |
| Renter-Occupied | 774 (21.6%) | $53,696 |
| Average | 3,575 (100.0%) | $83,812 |
Occupancy by Householder Income Bracket in Cypress Gardens
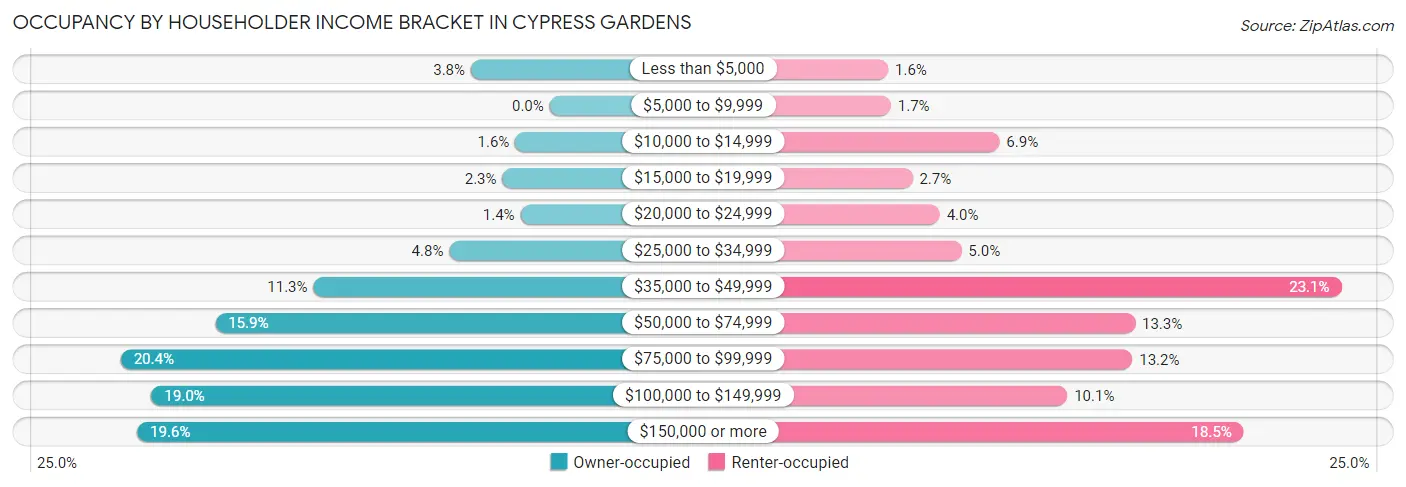
| Income Bracket | Owner-occupied | Renter-occupied |
| Less than $5,000 | 105 (3.7%) | 12 (1.5%) |
| $5,000 to $9,999 | 0 (0.0%) | 13 (1.7%) |
| $10,000 to $14,999 | 46 (1.6%) | 53 (6.9%) |
| $15,000 to $19,999 | 63 (2.2%) | 21 (2.7%) |
| $20,000 to $24,999 | 39 (1.4%) | 31 (4.0%) |
| $25,000 to $34,999 | 134 (4.8%) | 39 (5.0%) |
| $35,000 to $49,999 | 315 (11.3%) | 179 (23.1%) |
| $50,000 to $74,999 | 446 (15.9%) | 103 (13.3%) |
| $75,000 to $99,999 | 572 (20.4%) | 102 (13.2%) |
| $100,000 to $149,999 | 531 (19.0%) | 78 (10.1%) |
| $150,000 or more | 550 (19.6%) | 143 (18.5%) |
| Total | 2,801 (100.0%) | 774 (100.0%) |
Monthly Housing Cost Tiers in Cypress Gardens
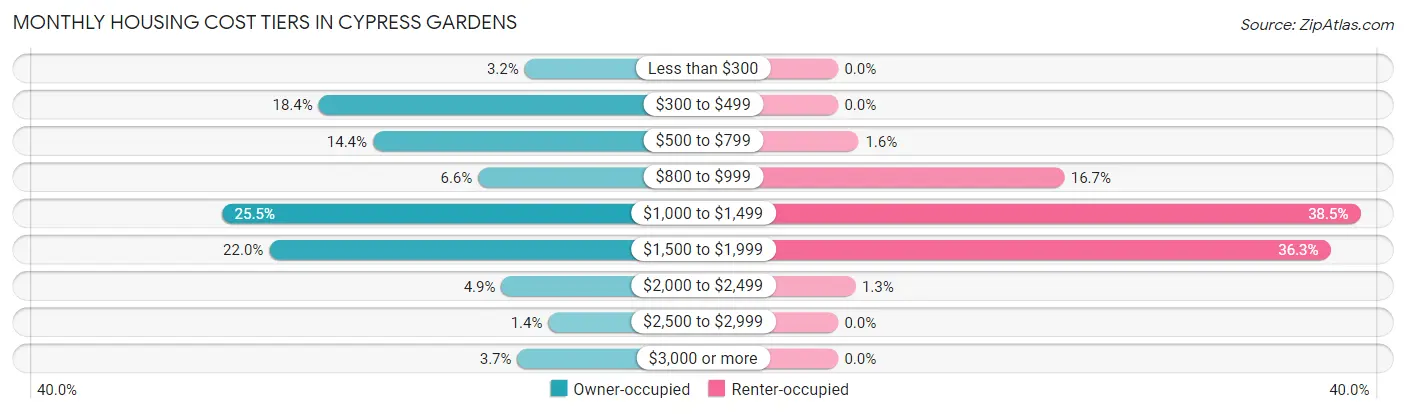
| Monthly Cost | Owner-occupied | Renter-occupied |
| Less than $300 | 89 (3.2%) | 0 (0.0%) |
| $300 to $499 | 514 (18.3%) | 0 (0.0%) |
| $500 to $799 | 402 (14.3%) | 12 (1.5%) |
| $800 to $999 | 185 (6.6%) | 129 (16.7%) |
| $1,000 to $1,499 | 714 (25.5%) | 298 (38.5%) |
| $1,500 to $1,999 | 616 (22.0%) | 281 (36.3%) |
| $2,000 to $2,499 | 137 (4.9%) | 10 (1.3%) |
| $2,500 to $2,999 | 40 (1.4%) | 0 (0.0%) |
| $3,000 or more | 104 (3.7%) | 0 (0.0%) |
| Total | 2,801 (100.0%) | 774 (100.0%) |
Physical Housing Characteristics in Cypress Gardens
Housing Structures in Cypress Gardens
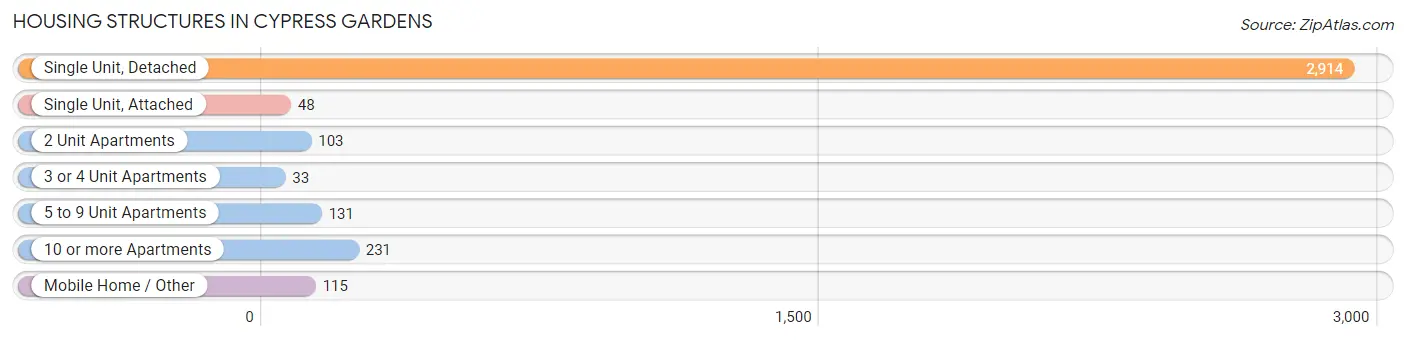
| Structure Type | # Housing Units | % Housing Units |
| Single Unit, Detached | 2,914 | 81.5% |
| Single Unit, Attached | 48 | 1.3% |
| 2 Unit Apartments | 103 | 2.9% |
| 3 or 4 Unit Apartments | 33 | 0.9% |
| 5 to 9 Unit Apartments | 131 | 3.7% |
| 10 or more Apartments | 231 | 6.5% |
| Mobile Home / Other | 115 | 3.2% |
| Total | 3,575 | 100.0% |
Housing Structures by Occupancy in Cypress Gardens
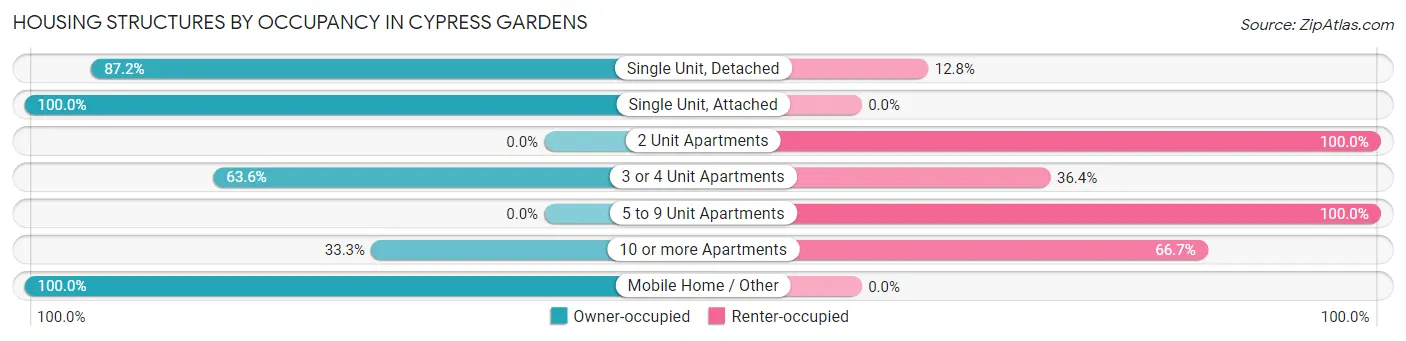
| Structure Type | Owner-occupied | Renter-occupied |
| Single Unit, Detached | 2,540 (87.2%) | 374 (12.8%) |
| Single Unit, Attached | 48 (100.0%) | 0 (0.0%) |
| 2 Unit Apartments | 0 (0.0%) | 103 (100.0%) |
| 3 or 4 Unit Apartments | 21 (63.6%) | 12 (36.4%) |
| 5 to 9 Unit Apartments | 0 (0.0%) | 131 (100.0%) |
| 10 or more Apartments | 77 (33.3%) | 154 (66.7%) |
| Mobile Home / Other | 115 (100.0%) | 0 (0.0%) |
| Total | 2,801 (78.3%) | 774 (21.6%) |
Housing Structures by Number of Rooms in Cypress Gardens
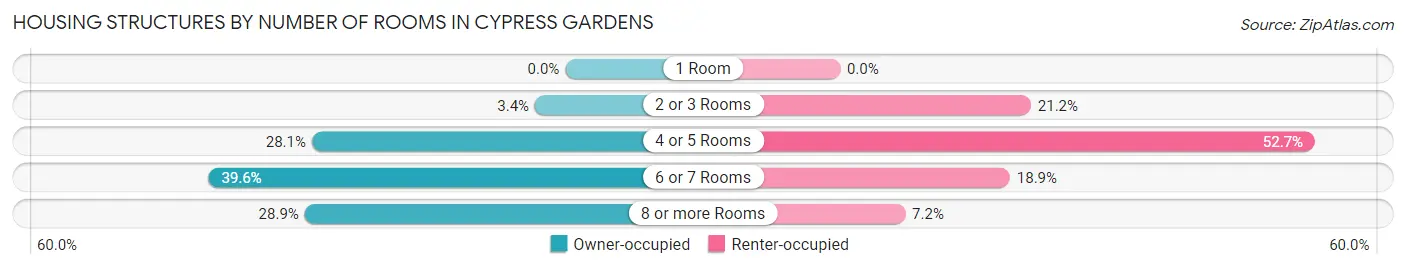
| Number of Rooms | Owner-occupied | Renter-occupied |
| 1 Room | 0 (0.0%) | 0 (0.0%) |
| 2 or 3 Rooms | 94 (3.4%) | 164 (21.2%) |
| 4 or 5 Rooms | 788 (28.1%) | 408 (52.7%) |
| 6 or 7 Rooms | 1,109 (39.6%) | 146 (18.9%) |
| 8 or more Rooms | 810 (28.9%) | 56 (7.2%) |
| Total | 2,801 (100.0%) | 774 (100.0%) |
Housing Structure by Heating Type in Cypress Gardens
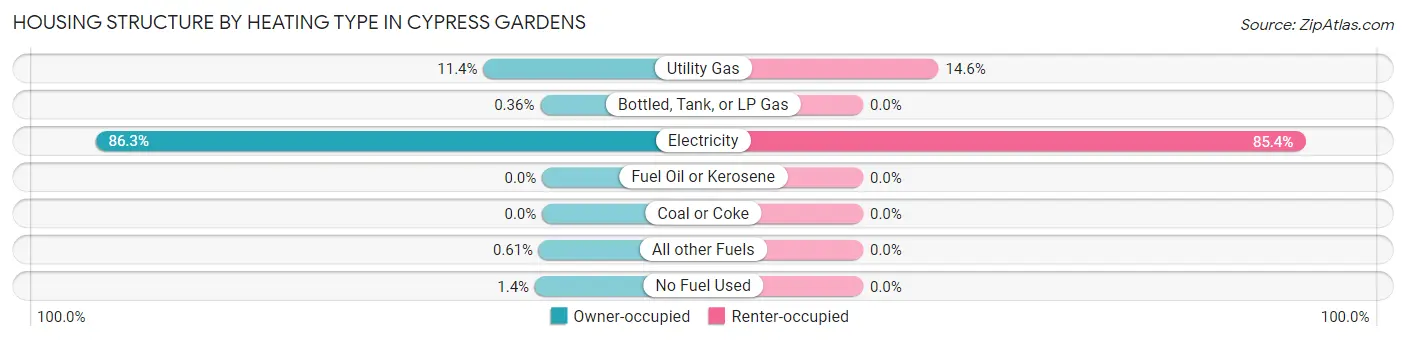
| Heating Type | Owner-occupied | Renter-occupied |
| Utility Gas | 318 (11.4%) | 113 (14.6%) |
| Bottled, Tank, or LP Gas | 10 (0.4%) | 0 (0.0%) |
| Electricity | 2,417 (86.3%) | 661 (85.4%) |
| Fuel Oil or Kerosene | 0 (0.0%) | 0 (0.0%) |
| Coal or Coke | 0 (0.0%) | 0 (0.0%) |
| All other Fuels | 17 (0.6%) | 0 (0.0%) |
| No Fuel Used | 39 (1.4%) | 0 (0.0%) |
| Total | 2,801 (100.0%) | 774 (100.0%) |
Household Vehicle Usage in Cypress Gardens
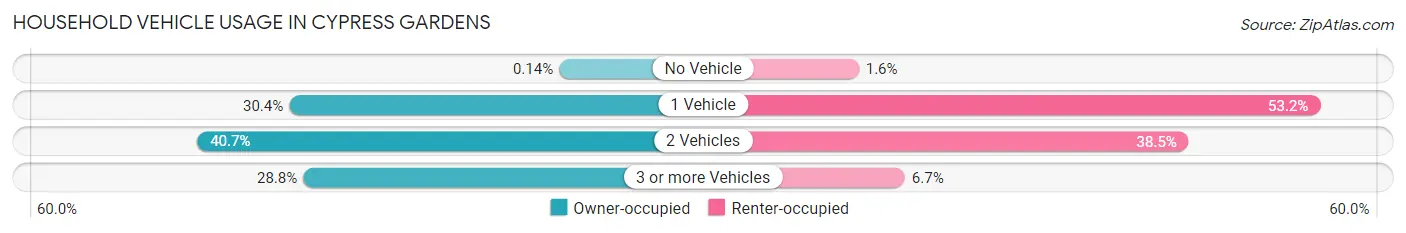
| Vehicles per Household | Owner-occupied | Renter-occupied |
| No Vehicle | 4 (0.1%) | 12 (1.5%) |
| 1 Vehicle | 851 (30.4%) | 412 (53.2%) |
| 2 Vehicles | 1,139 (40.7%) | 298 (38.5%) |
| 3 or more Vehicles | 807 (28.8%) | 52 (6.7%) |
| Total | 2,801 (100.0%) | 774 (100.0%) |
Real Estate & Mortgages in Cypress Gardens
Real Estate and Mortgage Overview in Cypress Gardens
| Characteristic | Without Mortgage | With Mortgage |
| Housing Units | 1,059 | 1,742 |
| Median Property Value | $212,600 | $246,300 |
| Median Household Income | $58,275 | $479 |
| Monthly Housing Costs | $476 | $104 |
| Real Estate Taxes | $1,406 | $62 |
Property Value by Mortgage Status in Cypress Gardens
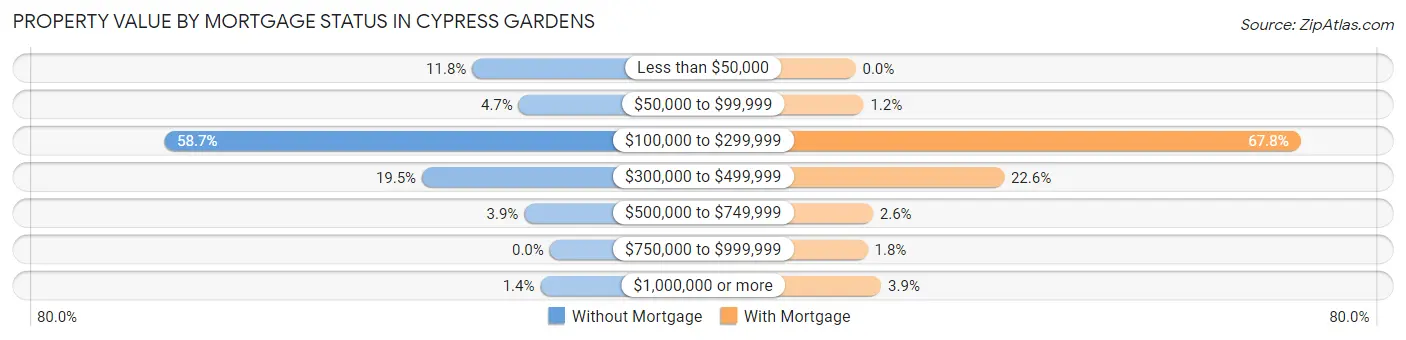
| Property Value | Without Mortgage | With Mortgage |
| Less than $50,000 | 125 (11.8%) | 0 (0.0%) |
| $50,000 to $99,999 | 50 (4.7%) | 21 (1.2%) |
| $100,000 to $299,999 | 622 (58.7%) | 1,181 (67.8%) |
| $300,000 to $499,999 | 206 (19.5%) | 394 (22.6%) |
| $500,000 to $749,999 | 41 (3.9%) | 46 (2.6%) |
| $750,000 to $999,999 | 0 (0.0%) | 32 (1.8%) |
| $1,000,000 or more | 15 (1.4%) | 68 (3.9%) |
| Total | 1,059 (100.0%) | 1,742 (100.0%) |
Household Income by Mortgage Status in Cypress Gardens
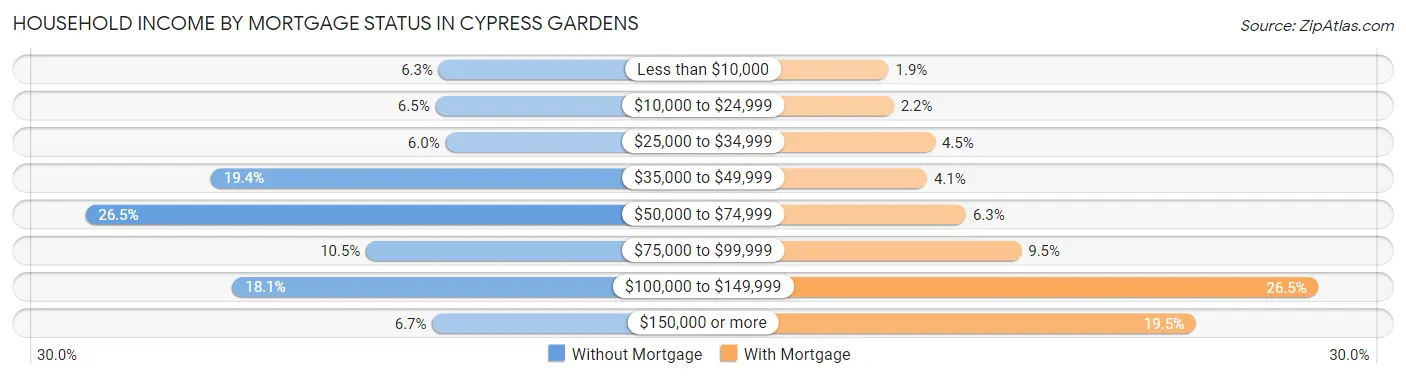
| Household Income | Without Mortgage | With Mortgage |
| Less than $10,000 | 67 (6.3%) | 33 (1.9%) |
| $10,000 to $24,999 | 69 (6.5%) | 38 (2.2%) |
| $25,000 to $34,999 | 63 (5.9%) | 79 (4.5%) |
| $35,000 to $49,999 | 205 (19.4%) | 71 (4.1%) |
| $50,000 to $74,999 | 281 (26.5%) | 110 (6.3%) |
| $75,000 to $99,999 | 111 (10.5%) | 165 (9.5%) |
| $100,000 to $149,999 | 192 (18.1%) | 461 (26.5%) |
| $150,000 or more | 71 (6.7%) | 339 (19.5%) |
| Total | 1,059 (100.0%) | 1,742 (100.0%) |
Property Value to Household Income Ratio in Cypress Gardens
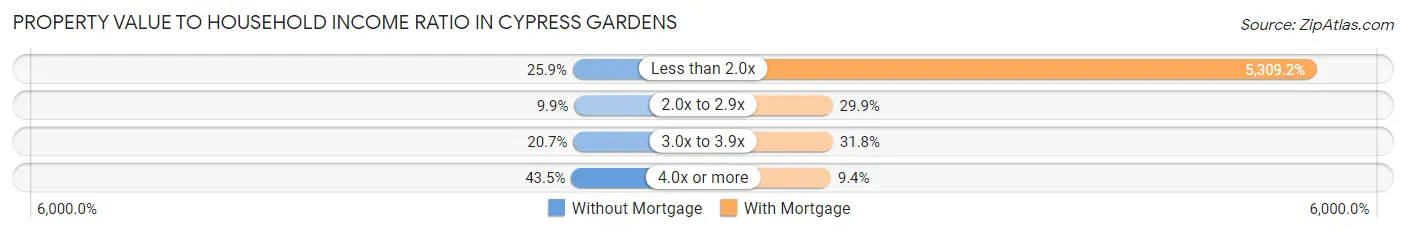
| Value-to-Income Ratio | Without Mortgage | With Mortgage |
| Less than 2.0x | 274 (25.9%) | 92,487 (5,309.2%) |
| 2.0x to 2.9x | 105 (9.9%) | 520 (29.8%) |
| 3.0x to 3.9x | 219 (20.7%) | 554 (31.8%) |
| 4.0x or more | 461 (43.5%) | 163 (9.4%) |
| Total | 1,059 (100.0%) | 1,742 (100.0%) |
Real Estate Taxes by Mortgage Status in Cypress Gardens
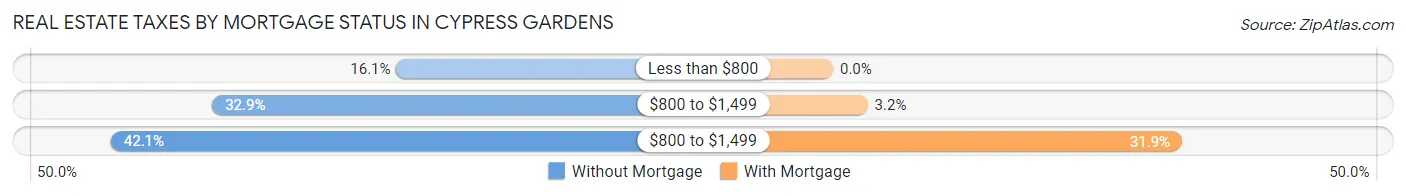
| Property Taxes | Without Mortgage | With Mortgage |
| Less than $800 | 170 (16.1%) | 0 (0.0%) |
| $800 to $1,499 | 348 (32.9%) | 55 (3.2%) |
| $800 to $1,499 | 446 (42.1%) | 555 (31.9%) |
| Total | 1,059 (100.0%) | 1,742 (100.0%) |
Health & Disability in Cypress Gardens
Health Insurance Coverage by Age in Cypress Gardens
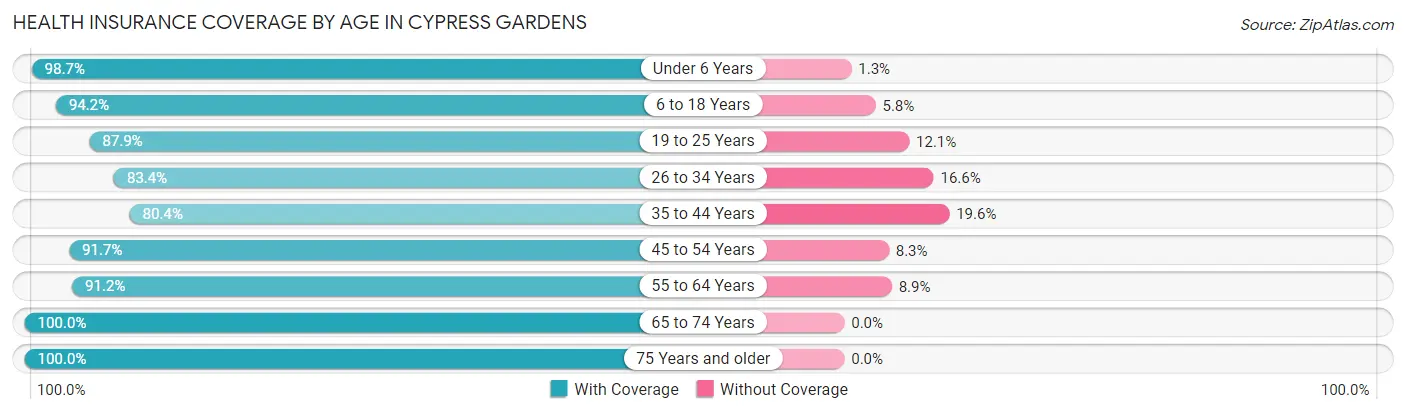
| Age Bracket | With Coverage | Without Coverage |
| Under 6 Years | 754 (98.7%) | 10 (1.3%) |
| 6 to 18 Years | 1,211 (94.2%) | 75 (5.8%) |
| 19 to 25 Years | 931 (87.9%) | 128 (12.1%) |
| 26 to 34 Years | 957 (83.4%) | 191 (16.6%) |
| 35 to 44 Years | 982 (80.4%) | 239 (19.6%) |
| 45 to 54 Years | 707 (91.7%) | 64 (8.3%) |
| 55 to 64 Years | 1,308 (91.1%) | 127 (8.8%) |
| 65 to 74 Years | 1,241 (100.0%) | 0 (0.0%) |
| 75 Years and older | 767 (100.0%) | 0 (0.0%) |
| Total | 8,858 (91.4%) | 834 (8.6%) |
Health Insurance Coverage by Citizenship Status in Cypress Gardens
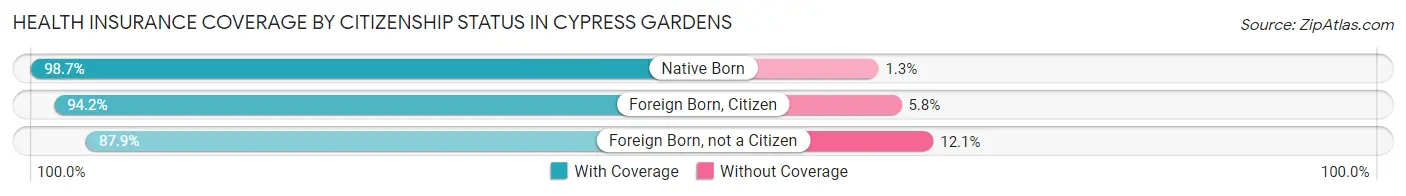
| Citizenship Status | With Coverage | Without Coverage |
| Native Born | 754 (98.7%) | 10 (1.3%) |
| Foreign Born, Citizen | 1,211 (94.2%) | 75 (5.8%) |
| Foreign Born, not a Citizen | 931 (87.9%) | 128 (12.1%) |
Health Insurance Coverage by Household Income in Cypress Gardens
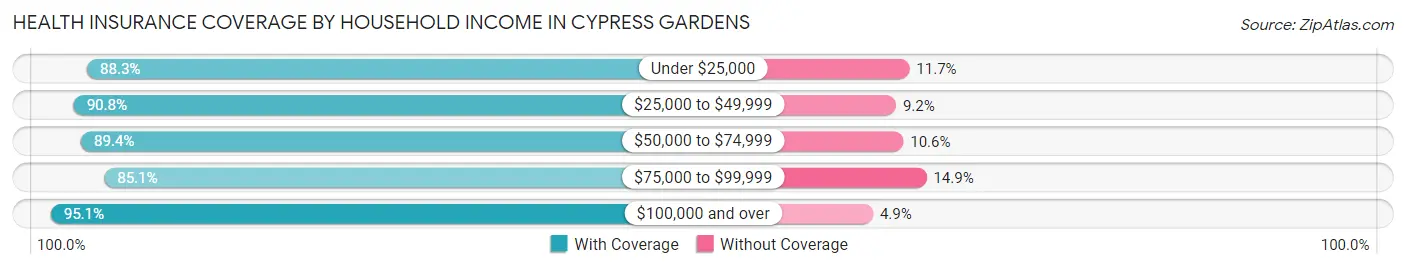
| Household Income | With Coverage | Without Coverage |
| Under $25,000 | 655 (88.3%) | 87 (11.7%) |
| $25,000 to $49,999 | 1,272 (90.8%) | 129 (9.2%) |
| $50,000 to $74,999 | 1,149 (89.4%) | 136 (10.6%) |
| $75,000 to $99,999 | 1,481 (85.1%) | 260 (14.9%) |
| $100,000 and over | 4,295 (95.1%) | 222 (4.9%) |
Public vs Private Health Insurance Coverage by Age in Cypress Gardens
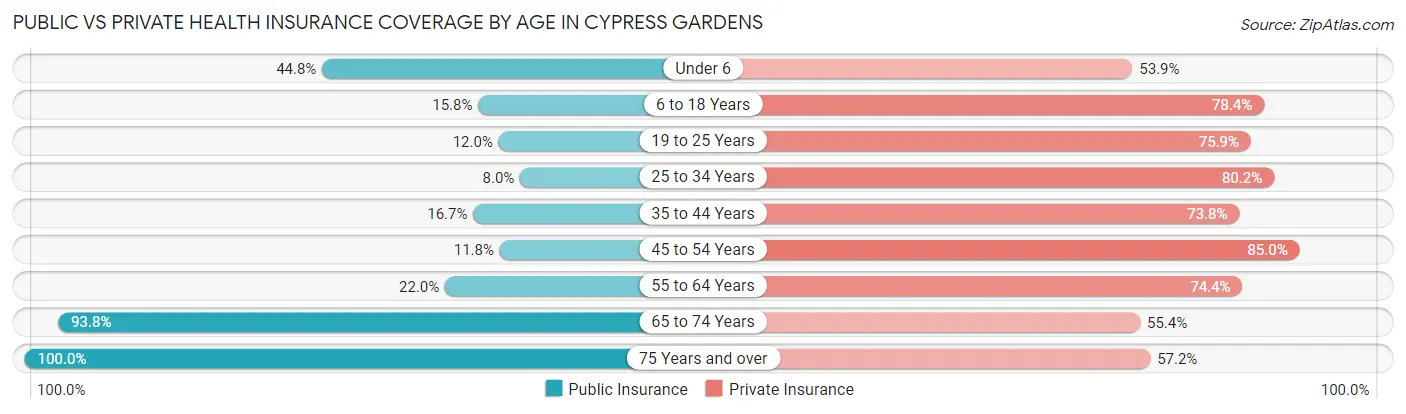
| Age Bracket | Public Insurance | Private Insurance |
| Under 6 | 342 (44.8%) | 412 (53.9%) |
| 6 to 18 Years | 203 (15.8%) | 1,008 (78.4%) |
| 19 to 25 Years | 127 (12.0%) | 804 (75.9%) |
| 25 to 34 Years | 92 (8.0%) | 921 (80.2%) |
| 35 to 44 Years | 204 (16.7%) | 901 (73.8%) |
| 45 to 54 Years | 91 (11.8%) | 655 (85.0%) |
| 55 to 64 Years | 315 (22.0%) | 1,067 (74.4%) |
| 65 to 74 Years | 1,164 (93.8%) | 687 (55.4%) |
| 75 Years and over | 767 (100.0%) | 439 (57.2%) |
| Total | 3,305 (34.1%) | 6,894 (71.1%) |
Disability Status by Sex by Age in Cypress Gardens
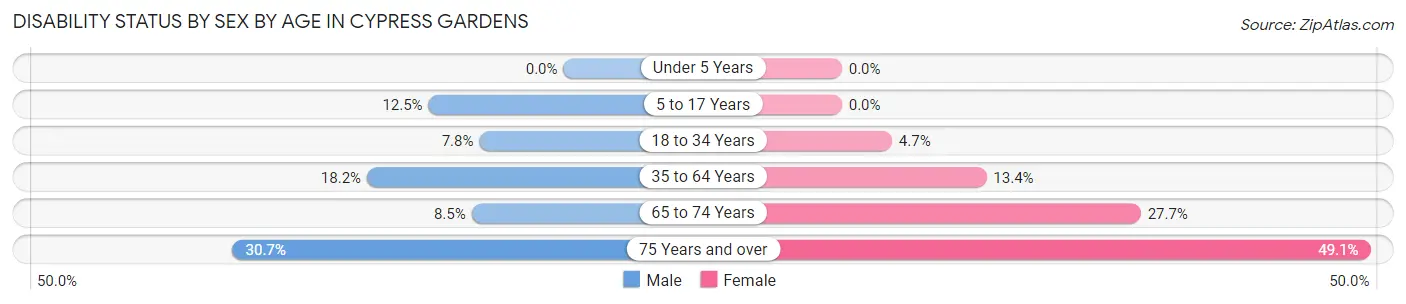
| Age Bracket | Male | Female |
| Under 5 Years | 0 (0.0%) | 0 (0.0%) |
| 5 to 17 Years | 90 (12.5%) | 0 (0.0%) |
| 18 to 34 Years | 75 (7.8%) | 62 (4.6%) |
| 35 to 64 Years | 292 (18.2%) | 245 (13.4%) |
| 65 to 74 Years | 56 (8.5%) | 162 (27.7%) |
| 75 Years and over | 89 (30.7%) | 234 (49.1%) |
Disability Class by Sex by Age in Cypress Gardens
Disability Class: Hearing Difficulty
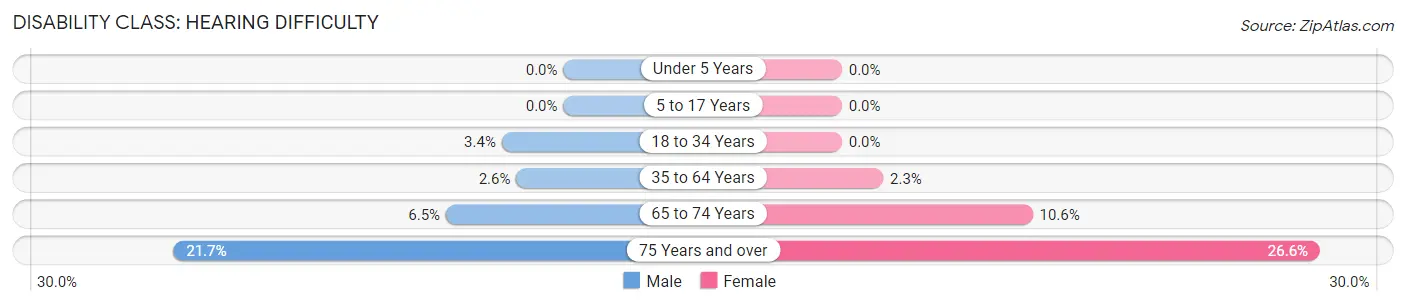
| Age Bracket | Male | Female |
| Under 5 Years | 0 (0.0%) | 0 (0.0%) |
| 5 to 17 Years | 0 (0.0%) | 0 (0.0%) |
| 18 to 34 Years | 33 (3.4%) | 0 (0.0%) |
| 35 to 64 Years | 42 (2.6%) | 42 (2.3%) |
| 65 to 74 Years | 43 (6.5%) | 62 (10.6%) |
| 75 Years and over | 63 (21.7%) | 127 (26.6%) |
Disability Class: Vision Difficulty
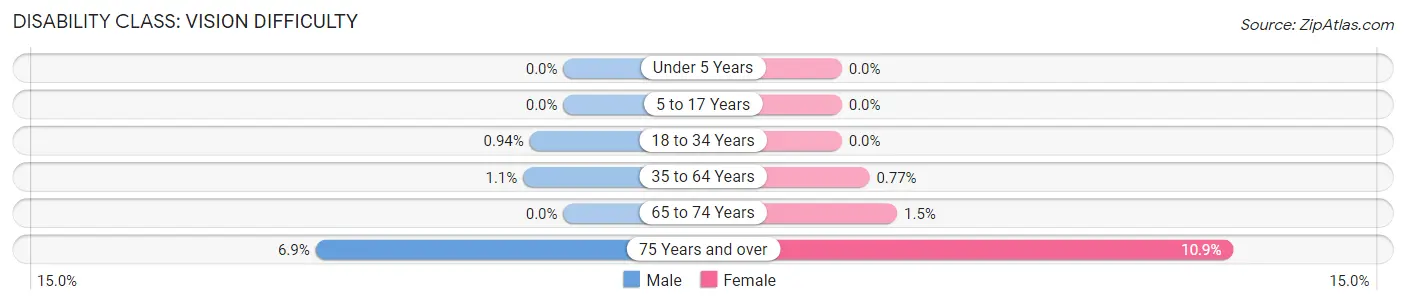
| Age Bracket | Male | Female |
| Under 5 Years | 0 (0.0%) | 0 (0.0%) |
| 5 to 17 Years | 0 (0.0%) | 0 (0.0%) |
| 18 to 34 Years | 9 (0.9%) | 0 (0.0%) |
| 35 to 64 Years | 18 (1.1%) | 14 (0.8%) |
| 65 to 74 Years | 0 (0.0%) | 9 (1.5%) |
| 75 Years and over | 20 (6.9%) | 52 (10.9%) |
Disability Class: Cognitive Difficulty
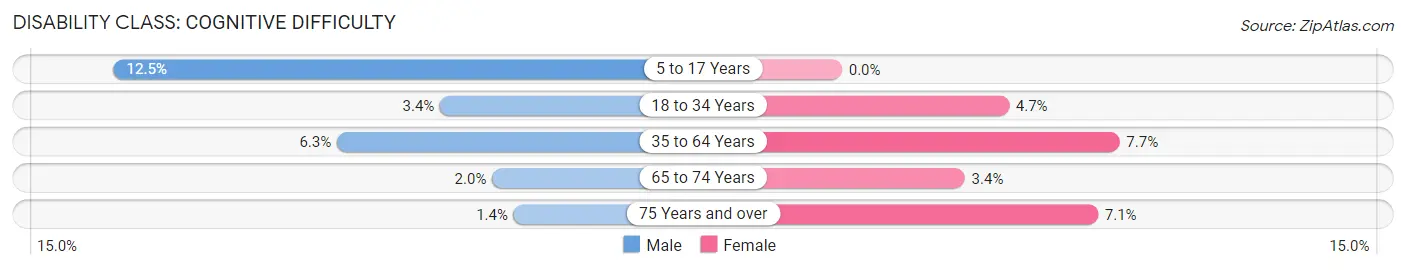
| Age Bracket | Male | Female |
| 5 to 17 Years | 90 (12.5%) | 0 (0.0%) |
| 18 to 34 Years | 33 (3.4%) | 62 (4.6%) |
| 35 to 64 Years | 101 (6.3%) | 141 (7.7%) |
| 65 to 74 Years | 13 (2.0%) | 20 (3.4%) |
| 75 Years and over | 4 (1.4%) | 34 (7.1%) |
Disability Class: Ambulatory Difficulty
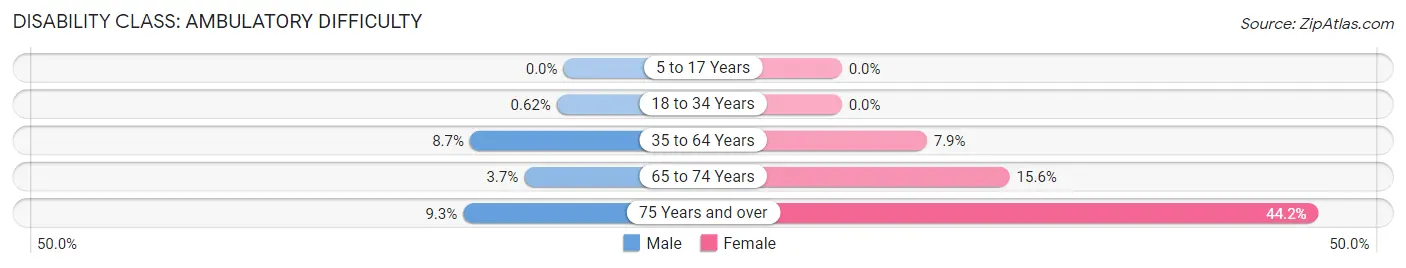
| Age Bracket | Male | Female |
| 5 to 17 Years | 0 (0.0%) | 0 (0.0%) |
| 18 to 34 Years | 6 (0.6%) | 0 (0.0%) |
| 35 to 64 Years | 139 (8.7%) | 144 (7.9%) |
| 65 to 74 Years | 24 (3.6%) | 91 (15.6%) |
| 75 Years and over | 27 (9.3%) | 211 (44.2%) |
Disability Class: Self-Care Difficulty
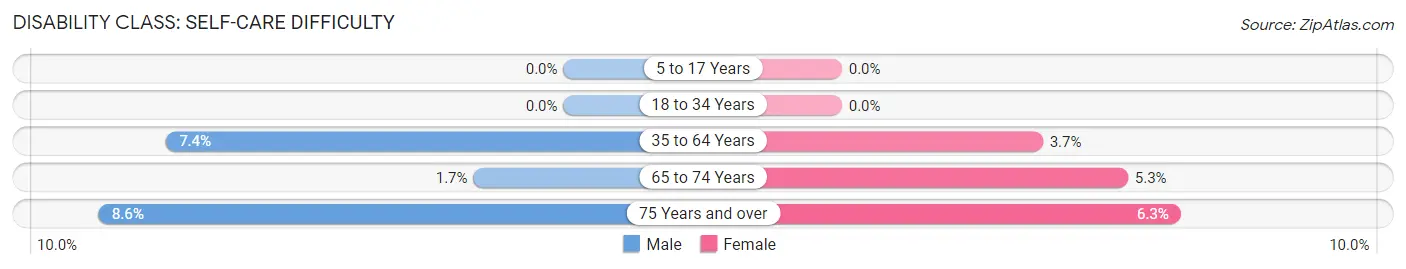
| Age Bracket | Male | Female |
| 5 to 17 Years | 0 (0.0%) | 0 (0.0%) |
| 18 to 34 Years | 0 (0.0%) | 0 (0.0%) |
| 35 to 64 Years | 118 (7.4%) | 68 (3.7%) |
| 65 to 74 Years | 11 (1.7%) | 31 (5.3%) |
| 75 Years and over | 25 (8.6%) | 30 (6.3%) |
Technology Access in Cypress Gardens
Computing Device Access in Cypress Gardens
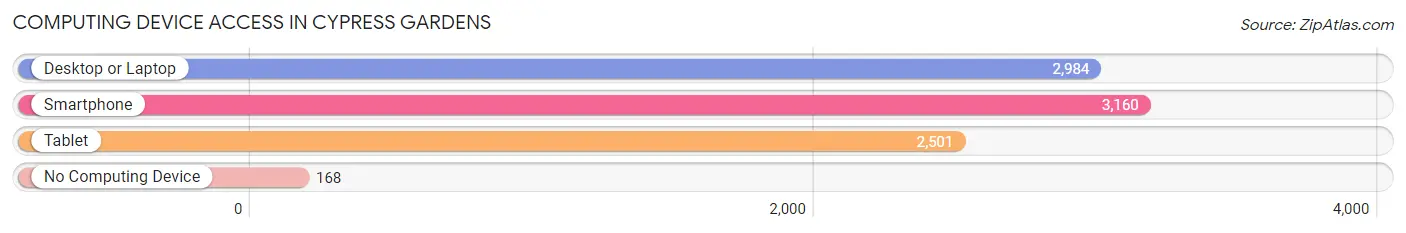
| Device Type | # Households | % Households |
| Desktop or Laptop | 2,984 | 83.5% |
| Smartphone | 3,160 | 88.4% |
| Tablet | 2,501 | 70.0% |
| No Computing Device | 168 | 4.7% |
| Total | 3,575 | 100.0% |
Internet Access in Cypress Gardens
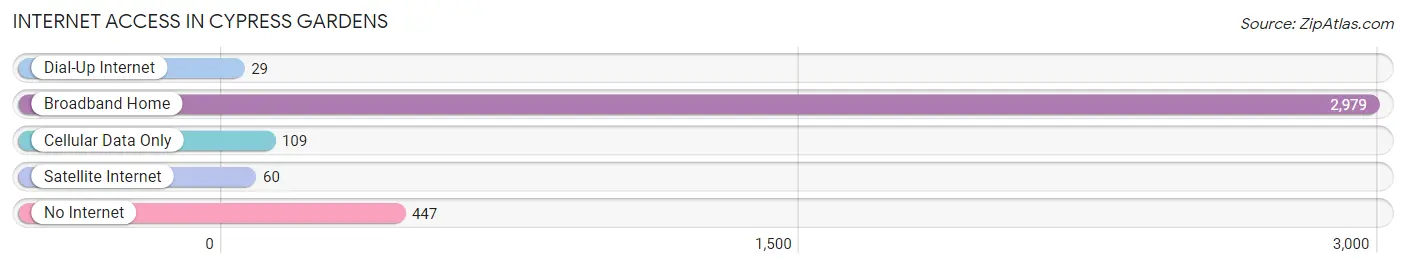
| Internet Type | # Households | % Households |
| Dial-Up Internet | 29 | 0.8% |
| Broadband Home | 2,979 | 83.3% |
| Cellular Data Only | 109 | 3.0% |
| Satellite Internet | 60 | 1.7% |
| No Internet | 447 | 12.5% |
| Total | 3,575 | 100.0% |
Cypress Gardens Summary
Cypress Gardens is a small town located in Polk County, Florida. It is situated on the south shore of Lake Eloise, approximately 10 miles south of Winter Haven. The town was founded in 1936 by Dick Pope Sr., who is credited with creating the first theme park in the United States. Cypress Gardens was a popular tourist destination for many years, and it was the site of many famous films and television shows.
History
Cypress Gardens was founded in 1936 by Dick Pope Sr., who had a vision of creating a beautiful garden paradise. He purchased the land from the State of Florida and began to develop the area. He planted thousands of cypress trees, which gave the area its name. He also built a large lake, which he named Lake Eloise.
Pope opened the park to the public in 1938, and it quickly became a popular tourist destination. The park featured a variety of attractions, including a water ski show, a butterfly garden, and a botanical garden. It was also the site of many famous films and television shows, including the classic movie “Gone with the Wind” and the television show “The Mickey Mouse Club.”
In the 1950s, Cypress Gardens began to decline in popularity. In 1966, the park was sold to a group of investors who planned to turn it into a theme park. However, the plans never materialized and the park closed in 2003.
Geography
Cypress Gardens is located in Polk County, Florida. It is situated on the south shore of Lake Eloise, approximately 10 miles south of Winter Haven. The town is bordered by the cities of Winter Haven, Lakeland, and Haines City.
The town has a total area of 1.3 square miles, all of which is land. The terrain is mostly flat, with some rolling hills. The climate is subtropical, with hot, humid summers and mild winters.
Economy
Cypress Gardens is primarily a residential community, with no major industries. The town is home to a variety of small businesses, including restaurants, retail stores, and professional services.
The town is also home to a number of tourist attractions, including the Cypress Gardens Adventure Park, which features a variety of rides and attractions. The park also hosts a variety of events, including concerts and festivals.
Demographics
As of the 2010 census, the population of Cypress Gardens was 2,845. The racial makeup of the town was 79.3% White, 15.2% African American, 0.3% Native American, 0.7% Asian, 0.1% Pacific Islander, and 4.4% from other races. Hispanic or Latino of any race were 8.2% of the population.
The median household income in Cypress Gardens was $37,917, and the median family income was $45,938. The per capita income was $19,945. About 11.3% of families and 14.2% of the population were below the poverty line, including 19.2% of those under age 18 and 8.2% of those age 65 or over.
Common Questions
What is Per Capita Income in Cypress Gardens?
Per Capita income in Cypress Gardens is $38,472.
What is the Median Family Income in Cypress Gardens?
Median Family Income in Cypress Gardens is $91,979.
What is the Median Household income in Cypress Gardens?
Median Household Income in Cypress Gardens is $83,812.
What is Income or Wage Gap in Cypress Gardens?
Income or Wage Gap in Cypress Gardens is 23.4%.
Women in Cypress Gardens earn 76.6 cents for every dollar earned by a man.
What is Inequality or Gini Index in Cypress Gardens?
Inequality or Gini Index in Cypress Gardens is 0.41.
What is the Total Population of Cypress Gardens?
Total Population of Cypress Gardens is 9,692.
What is the Total Male Population of Cypress Gardens?
Total Male Population of Cypress Gardens is 4,582.
What is the Total Female Population of Cypress Gardens?
Total Female Population of Cypress Gardens is 5,110.
What is the Ratio of Males per 100 Females in Cypress Gardens?
There are 89.67 Males per 100 Females in Cypress Gardens.
What is the Ratio of Females per 100 Males in Cypress Gardens?
There are 111.52 Females per 100 Males in Cypress Gardens.
What is the Median Population Age in Cypress Gardens?
Median Population Age in Cypress Gardens is 40.0 Years.
What is the Average Family Size in Cypress Gardens
Average Family Size in Cypress Gardens is 3.1 People.
What is the Average Household Size in Cypress Gardens
Average Household Size in Cypress Gardens is 2.7 People.
How Large is the Labor Force in Cypress Gardens?
There are 5,020 People in the Labor Forcein in Cypress Gardens.
What is the Percentage of People in the Labor Force in Cypress Gardens?
63.0% of People are in the Labor Force in Cypress Gardens.
What is the Unemployment Rate in Cypress Gardens?
Unemployment Rate in Cypress Gardens is 2.6%.