Sarasota Springs, FL Map & Demographics
Sarasota Springs Map
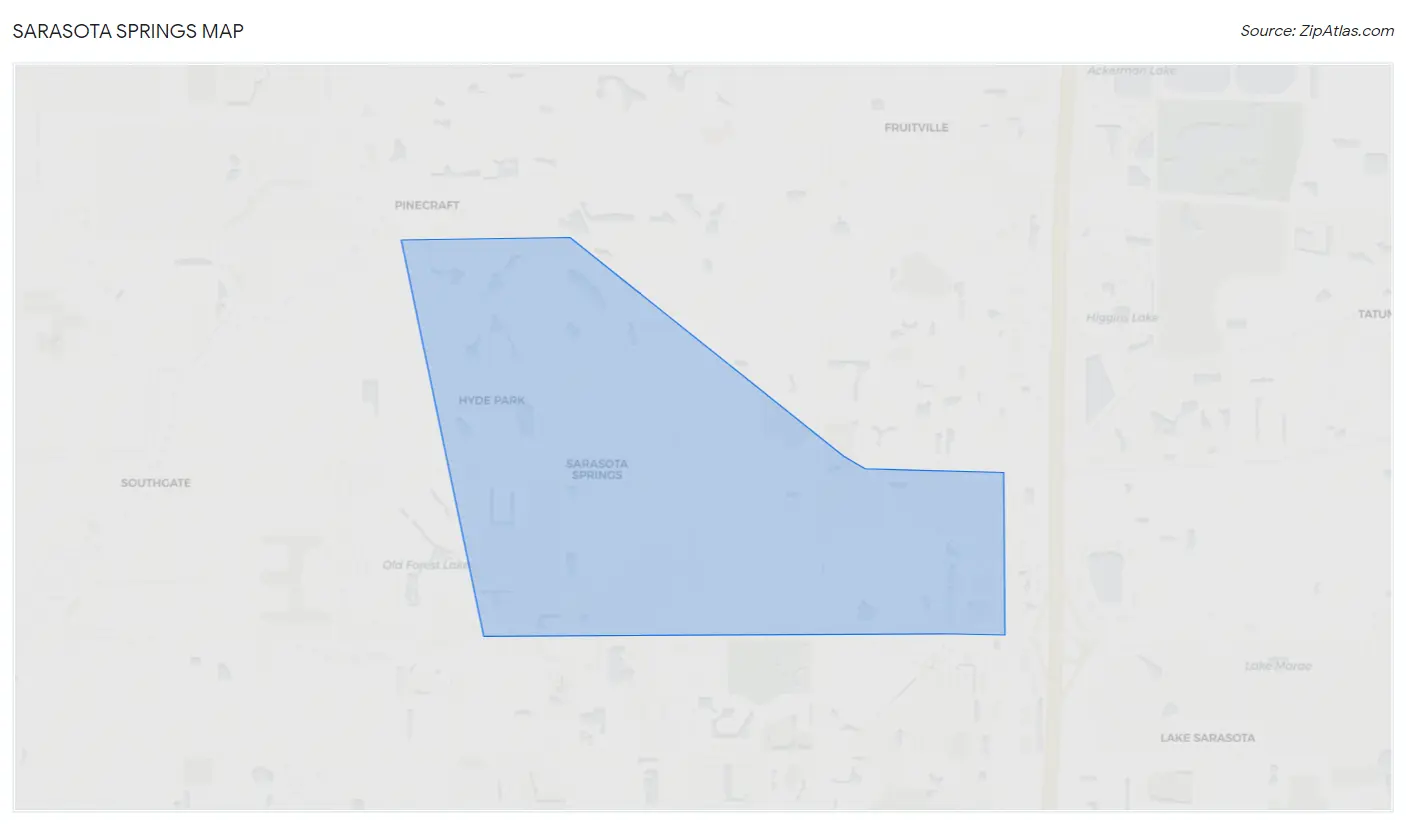
Sarasota Springs Overview
$40,055
PER CAPITA INCOME
$90,651
AVG FAMILY INCOME
$88,630
AVG HOUSEHOLD INCOME
20.7%
WAGE / INCOME GAP [ % ]
79.3¢/ $1
WAGE / INCOME GAP [ $ ]
0.41
INEQUALITY / GINI INDEX
12,500
TOTAL POPULATION
6,087
MALE POPULATION
6,413
FEMALE POPULATION
94.92
MALES / 100 FEMALES
105.36
FEMALES / 100 MALES
40.1
MEDIAN AGE
3.1
AVG FAMILY SIZE
2.7
AVG HOUSEHOLD SIZE
7,385
LABOR FORCE [ PEOPLE ]
73.9%
PERCENT IN LABOR FORCE
2.9%
UNEMPLOYMENT RATE
Income in Sarasota Springs
Income Overview in Sarasota Springs
Per Capita Income in Sarasota Springs is $40,055, while median incomes of families and households are $90,651 and $88,630 respectively.
| Characteristic | Number | Measure |
| Per Capita Income | 12,500 | $40,055 |
| Median Family Income | 3,223 | $90,651 |
| Mean Family Income | 3,223 | $118,544 |
| Median Household Income | 4,624 | $88,630 |
| Mean Household Income | 4,624 | $107,864 |
| Income Deficit | 3,223 | $0 |
| Wage / Income Gap (%) | 12,500 | 20.74% |
| Wage / Income Gap ($) | 12,500 | 79.26¢ per $1 |
| Gini / Inequality Index | 12,500 | 0.41 |
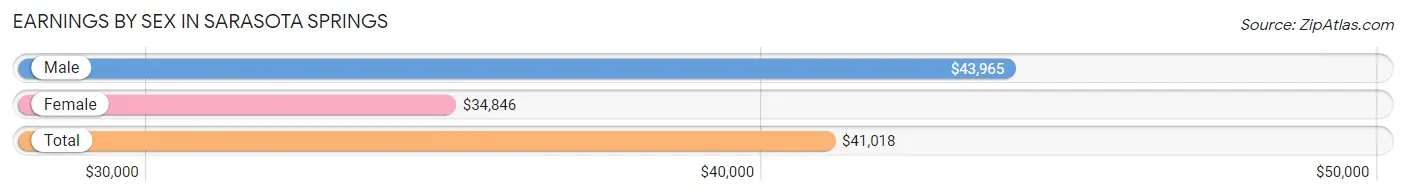
Earnings by Sex in Sarasota Springs
Average Earnings in Sarasota Springs are $41,018, $43,965 for men and $34,846 for women, a difference of 20.7%.
| Sex | Number | Average Earnings |
| Male | 3,882 (50.7%) | $43,965 |
| Female | 3,779 (49.3%) | $34,846 |
| Total | 7,661 (100.0%) | $41,018 |
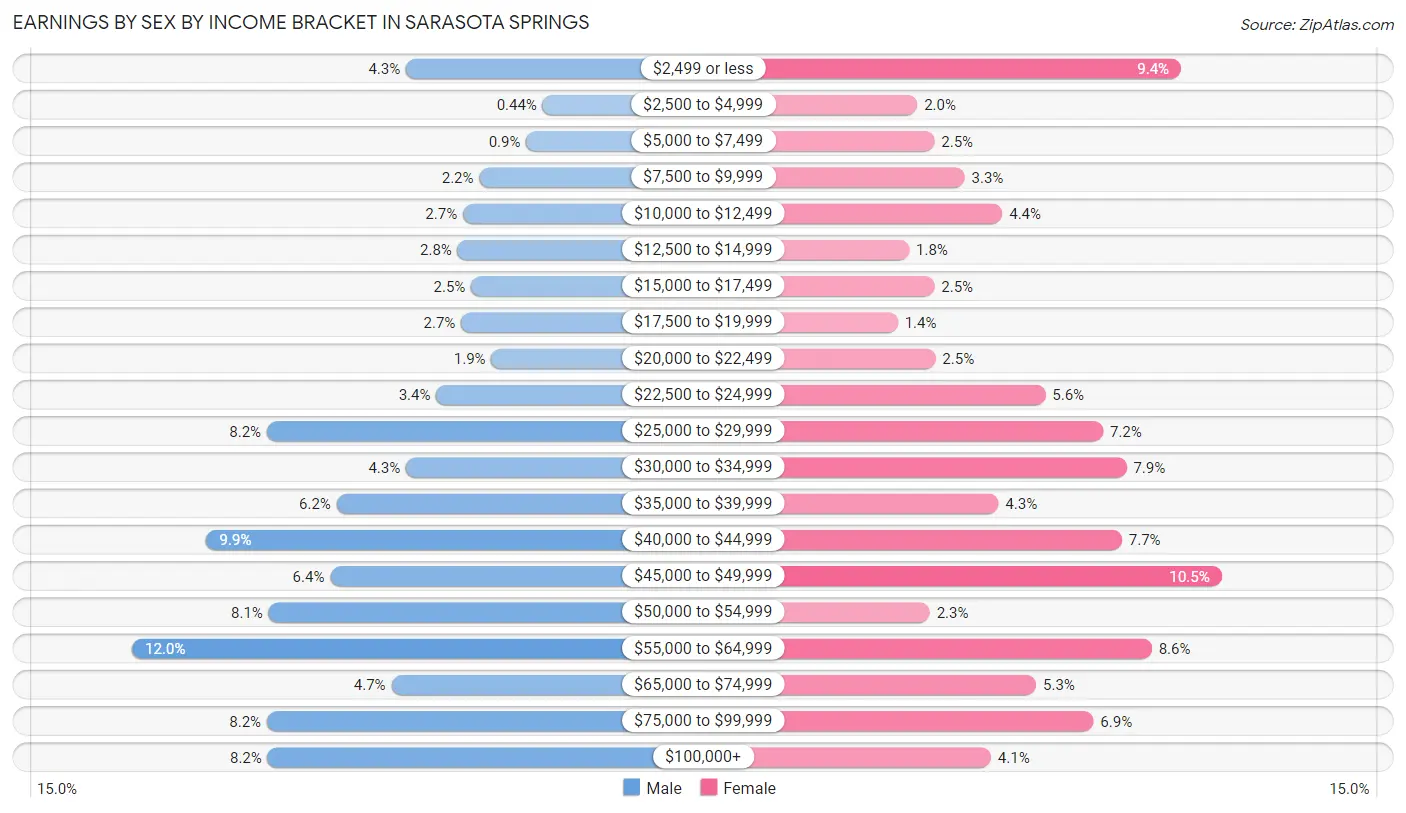
Earnings by Sex by Income Bracket in Sarasota Springs
The most common earnings brackets in Sarasota Springs are $55,000 to $64,999 for men (465 | 12.0%) and $45,000 to $49,999 for women (398 | 10.5%).
| Income | Male | Female |
| $2,499 or less | 166 (4.3%) | 355 (9.4%) |
| $2,500 to $4,999 | 17 (0.4%) | 75 (2.0%) |
| $5,000 to $7,499 | 35 (0.9%) | 93 (2.5%) |
| $7,500 to $9,999 | 86 (2.2%) | 125 (3.3%) |
| $10,000 to $12,499 | 104 (2.7%) | 165 (4.4%) |
| $12,500 to $14,999 | 110 (2.8%) | 66 (1.8%) |
| $15,000 to $17,499 | 95 (2.5%) | 93 (2.5%) |
| $17,500 to $19,999 | 106 (2.7%) | 54 (1.4%) |
| $20,000 to $22,499 | 73 (1.9%) | 94 (2.5%) |
| $22,500 to $24,999 | 133 (3.4%) | 211 (5.6%) |
| $25,000 to $29,999 | 318 (8.2%) | 272 (7.2%) |
| $30,000 to $34,999 | 166 (4.3%) | 297 (7.9%) |
| $35,000 to $39,999 | 242 (6.2%) | 161 (4.3%) |
| $40,000 to $44,999 | 384 (9.9%) | 292 (7.7%) |
| $45,000 to $49,999 | 249 (6.4%) | 398 (10.5%) |
| $50,000 to $54,999 | 316 (8.1%) | 88 (2.3%) |
| $55,000 to $64,999 | 465 (12.0%) | 324 (8.6%) |
| $65,000 to $74,999 | 182 (4.7%) | 201 (5.3%) |
| $75,000 to $99,999 | 318 (8.2%) | 262 (6.9%) |
| $100,000+ | 317 (8.2%) | 153 (4.1%) |
| Total | 3,882 (100.0%) | 3,779 (100.0%) |
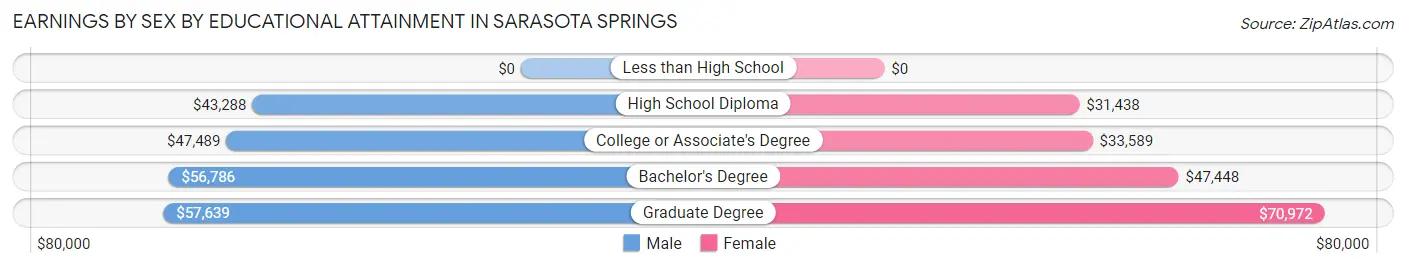
Earnings by Sex by Educational Attainment in Sarasota Springs
Average earnings in Sarasota Springs are $46,631 for men and $38,705 for women, a difference of 17.0%. Men with an educational attainment of graduate degree enjoy the highest average annual earnings of $57,639, while those with high school diploma education earn the least with $43,288. Women with an educational attainment of graduate degree earn the most with the average annual earnings of $70,972, while those with high school diploma education have the smallest earnings of $31,438.
| Educational Attainment | Male Income | Female Income |
| Less than High School | - | - |
| High School Diploma | $43,288 | $31,438 |
| College or Associate's Degree | $47,489 | $33,589 |
| Bachelor's Degree | $56,786 | $47,448 |
| Graduate Degree | $57,639 | $70,972 |
| Total | $46,631 | $38,705 |
Family Income in Sarasota Springs
Family Income Brackets in Sarasota Springs
According to the Sarasota Springs family income data, there are 722 families falling into the $100,000 to $149,999 income range, which is the most common income bracket and makes up 22.4% of all families. Conversely, the less than $10,000 income bracket is the least frequent group with only 23 families (0.7%) belonging to this category.
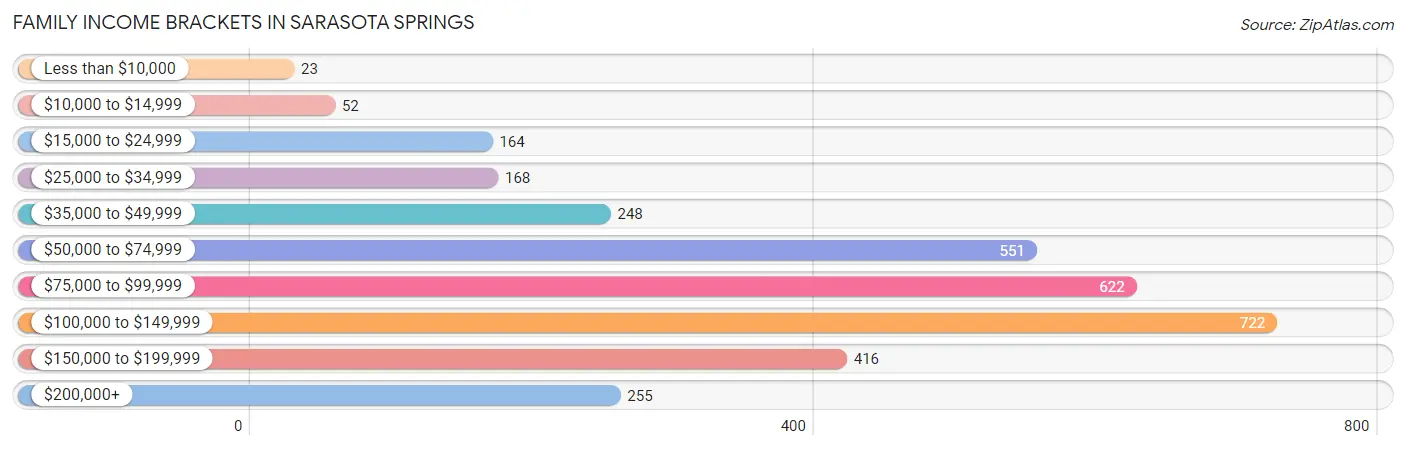
| Income Bracket | # Families | % Families |
| Less than $10,000 | 23 | 0.7% |
| $10,000 to $14,999 | 52 | 1.6% |
| $15,000 to $24,999 | 164 | 5.1% |
| $25,000 to $34,999 | 168 | 5.2% |
| $35,000 to $49,999 | 248 | 7.7% |
| $50,000 to $74,999 | 551 | 17.1% |
| $75,000 to $99,999 | 622 | 19.3% |
| $100,000 to $149,999 | 722 | 22.4% |
| $150,000 to $199,999 | 416 | 12.9% |
| $200,000+ | 255 | 7.9% |
Family Income by Famaliy Size in Sarasota Springs
4-person families (514 | 16.0%) account for the highest median family income in Sarasota Springs with $118,333 per family, while 2-person families (1,683 | 52.2%) have the highest median income of $42,790 per family member.
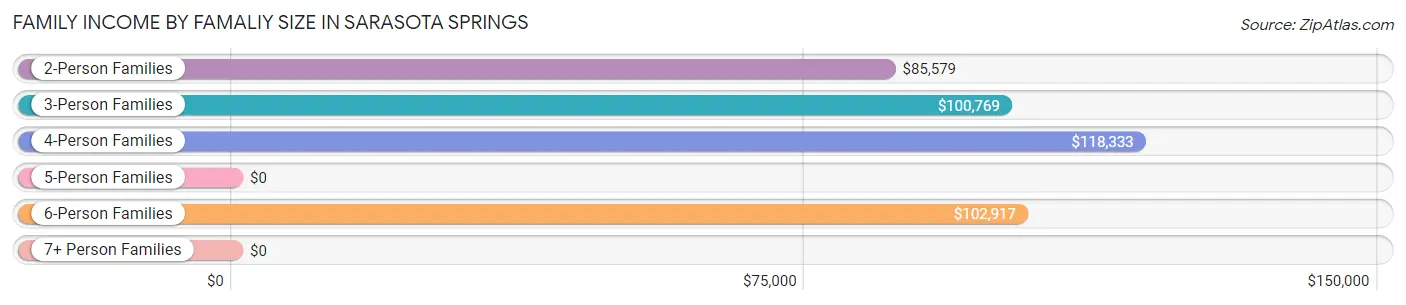
| Income Bracket | # Families | Median Income |
| 2-Person Families | 1,683 (52.2%) | $85,579 |
| 3-Person Families | 576 (17.9%) | $100,769 |
| 4-Person Families | 514 (16.0%) | $118,333 |
| 5-Person Families | 378 (11.7%) | $0 |
| 6-Person Families | 47 (1.5%) | $102,917 |
| 7+ Person Families | 25 (0.8%) | $0 |
| Total | 3,223 (100.0%) | $90,651 |
Family Income by Number of Earners in Sarasota Springs
The median family income in Sarasota Springs is $90,651, with families comprising 3+ earners (594) having the highest median family income of $156,923, while families with 1 earner (970) have the lowest median family income of $57,500, accounting for 18.4% and 30.1% of families, respectively.
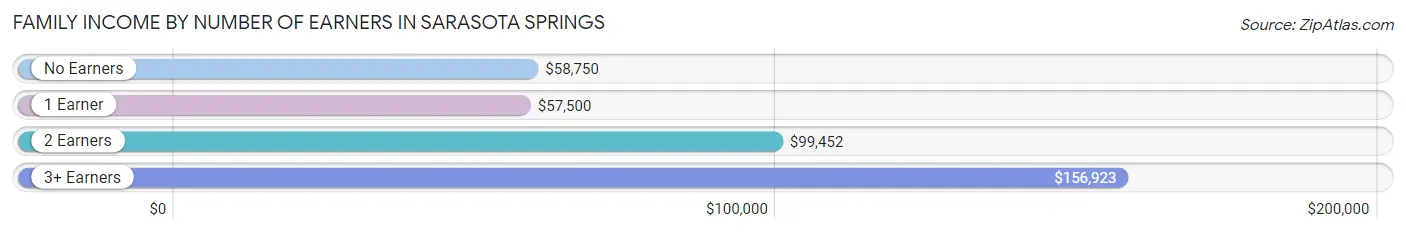
| Number of Earners | # Families | Median Income |
| No Earners | 292 (9.1%) | $58,750 |
| 1 Earner | 970 (30.1%) | $57,500 |
| 2 Earners | 1,367 (42.4%) | $99,452 |
| 3+ Earners | 594 (18.4%) | $156,923 |
| Total | 3,223 (100.0%) | $90,651 |
Household Income in Sarasota Springs
Household Income Brackets in Sarasota Springs
With 1,091 households falling in the category, the $100,000 to $149,999 income range is the most frequent in Sarasota Springs, accounting for 23.6% of all households. In contrast, only 88 households (1.9%) fall into the $10,000 to $14,999 income bracket, making it the least populous group.
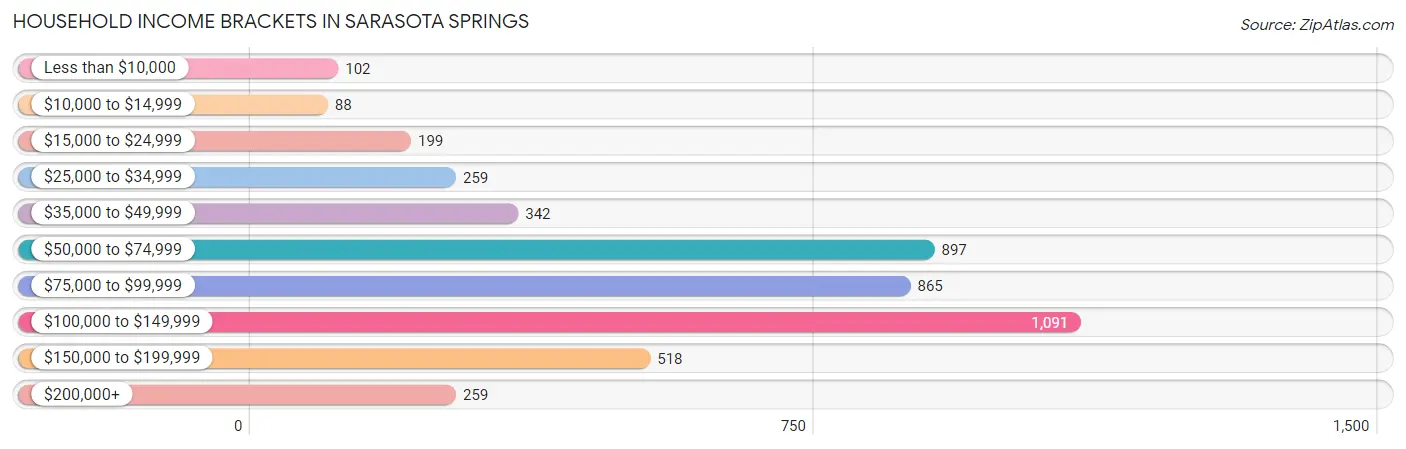
| Income Bracket | # Households | % Households |
| Less than $10,000 | 102 | 2.2% |
| $10,000 to $14,999 | 88 | 1.9% |
| $15,000 to $24,999 | 199 | 4.3% |
| $25,000 to $34,999 | 259 | 5.6% |
| $35,000 to $49,999 | 342 | 7.4% |
| $50,000 to $74,999 | 897 | 19.4% |
| $75,000 to $99,999 | 865 | 18.7% |
| $100,000 to $149,999 | 1,091 | 23.6% |
| $150,000 to $199,999 | 518 | 11.2% |
| $200,000+ | 259 | 5.6% |
Household Income by Householder Age in Sarasota Springs
The median household income in Sarasota Springs is $88,630, with the highest median household income of $91,985 found in the 25 to 44 years age bracket for the primary householder. A total of 1,341 households (29.0%) fall into this category. Meanwhile, the 15 to 24 years age bracket for the primary householder has the lowest median household income of $57,120, with 49 households (1.1%) in this group.
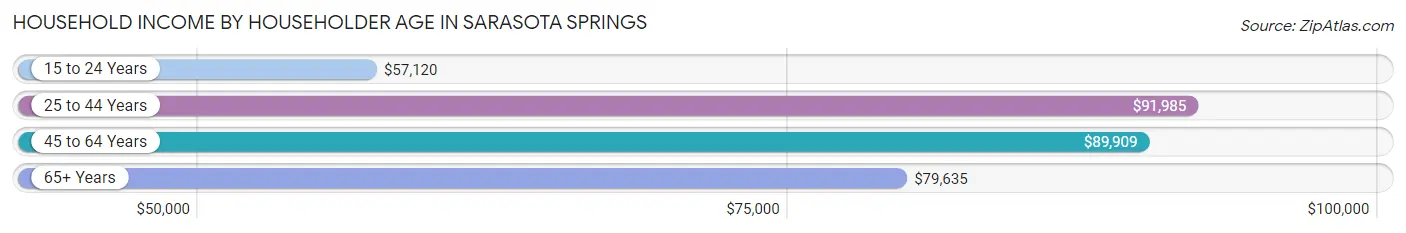
| Income Bracket | # Households | Median Income |
| 15 to 24 Years | 49 (1.1%) | $57,120 |
| 25 to 44 Years | 1,341 (29.0%) | $91,985 |
| 45 to 64 Years | 1,861 (40.3%) | $89,909 |
| 65+ Years | 1,373 (29.7%) | $79,635 |
| Total | 4,624 (100.0%) | $88,630 |
Poverty in Sarasota Springs
Income Below Poverty by Sex and Age in Sarasota Springs
With 9.8% poverty level for males and 12.9% for females among the residents of Sarasota Springs, 15 year old males and 12 to 14 year old females are the most vulnerable to poverty, with 72 males (64.3%) and 153 females (55.6%) in their respective age groups living below the poverty level.
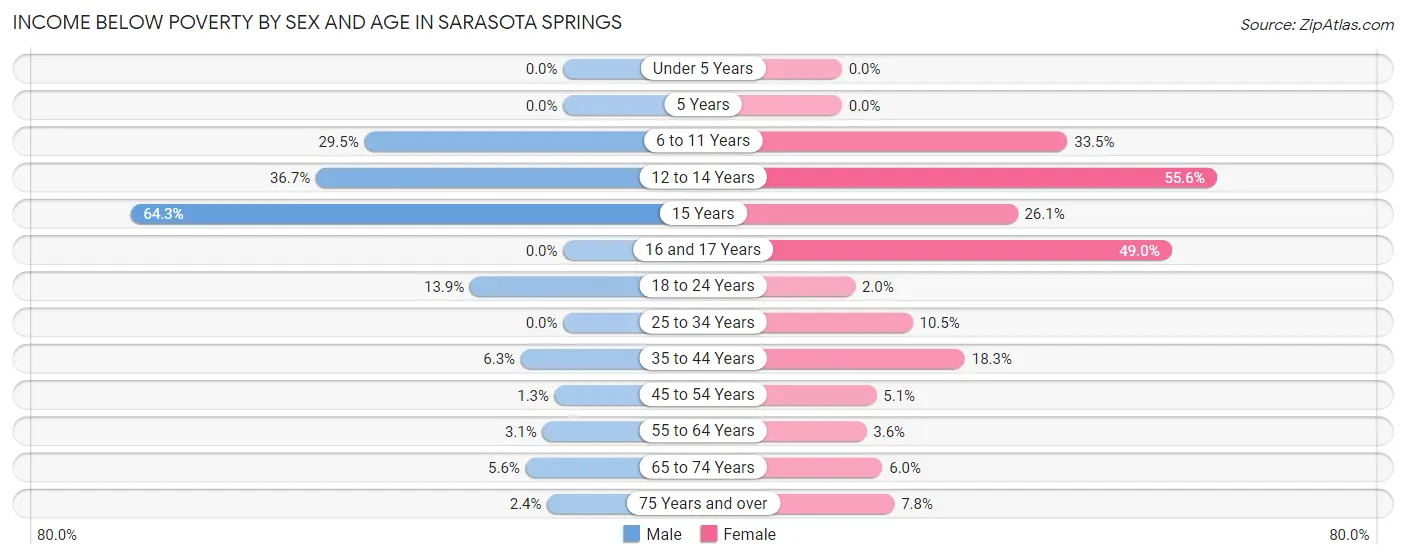
| Age Bracket | Male | Female |
| Under 5 Years | 0 (0.0%) | 0 (0.0%) |
| 5 Years | 0 (0.0%) | 0 (0.0%) |
| 6 to 11 Years | 150 (29.5%) | 145 (33.5%) |
| 12 to 14 Years | 180 (36.7%) | 153 (55.6%) |
| 15 Years | 72 (64.3%) | 54 (26.1%) |
| 16 and 17 Years | 0 (0.0%) | 70 (48.9%) |
| 18 to 24 Years | 64 (13.9%) | 8 (2.0%) |
| 25 to 34 Years | 0 (0.0%) | 82 (10.5%) |
| 35 to 44 Years | 52 (6.3%) | 150 (18.3%) |
| 45 to 54 Years | 9 (1.3%) | 47 (5.1%) |
| 55 to 64 Years | 28 (3.1%) | 34 (3.6%) |
| 65 to 74 Years | 33 (5.6%) | 48 (6.0%) |
| 75 Years and over | 6 (2.4%) | 33 (7.8%) |
| Total | 594 (9.8%) | 824 (12.9%) |
Income Above Poverty by Sex and Age in Sarasota Springs
According to the poverty statistics in Sarasota Springs, males aged under 5 years and females aged under 5 years are the age groups that are most secure financially, with 100.0% of males and 100.0% of females in these age groups living above the poverty line.
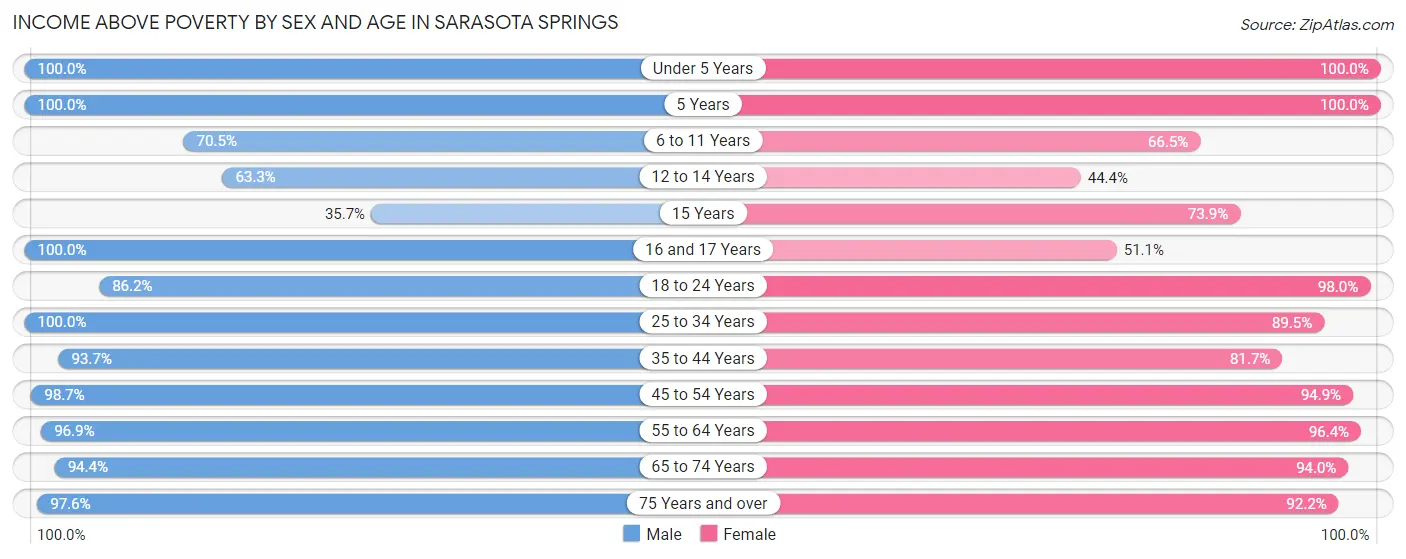
| Age Bracket | Male | Female |
| Under 5 Years | 155 (100.0%) | 225 (100.0%) |
| 5 Years | 44 (100.0%) | 35 (100.0%) |
| 6 to 11 Years | 358 (70.5%) | 288 (66.5%) |
| 12 to 14 Years | 310 (63.3%) | 122 (44.4%) |
| 15 Years | 40 (35.7%) | 153 (73.9%) |
| 16 and 17 Years | 135 (100.0%) | 73 (51.0%) |
| 18 to 24 Years | 398 (86.2%) | 401 (98.0%) |
| 25 to 34 Years | 884 (100.0%) | 699 (89.5%) |
| 35 to 44 Years | 774 (93.7%) | 671 (81.7%) |
| 45 to 54 Years | 703 (98.7%) | 869 (94.9%) |
| 55 to 64 Years | 877 (96.9%) | 900 (96.4%) |
| 65 to 74 Years | 556 (94.4%) | 751 (94.0%) |
| 75 Years and over | 247 (97.6%) | 391 (92.2%) |
| Total | 5,481 (90.2%) | 5,578 (87.1%) |
Income Below Poverty Among Married-Couple Families in Sarasota Springs
The poverty statistics for married-couple families in Sarasota Springs show that 0.6% or 14 of the total 2,256 families live below the poverty line. Families with no children have the highest poverty rate of 0.9%, comprising of 14 families. On the other hand, families with 1 or 2 children have the lowest poverty rate of 0.0%, which includes 0 families.
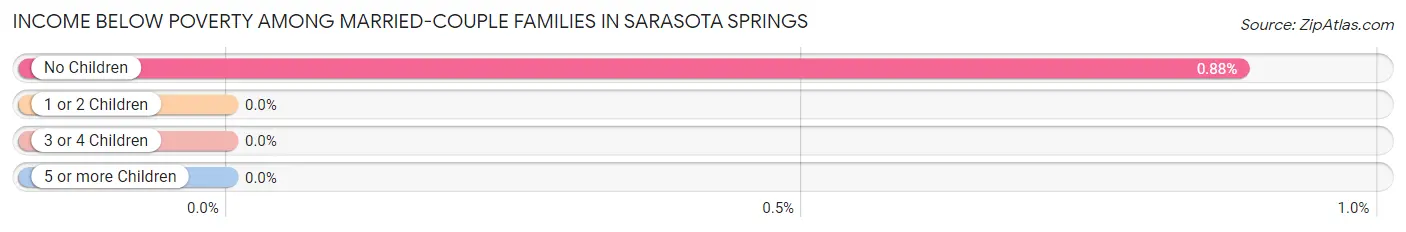
| Children | Above Poverty | Below Poverty |
| No Children | 1,569 (99.1%) | 14 (0.9%) |
| 1 or 2 Children | 539 (100.0%) | 0 (0.0%) |
| 3 or 4 Children | 134 (100.0%) | 0 (0.0%) |
| 5 or more Children | 0 (0.0%) | 0 (0.0%) |
| Total | 2,242 (99.4%) | 14 (0.6%) |
Income Below Poverty Among Single-Parent Households in Sarasota Springs
According to the poverty data in Sarasota Springs, 9.8% or 20 single-father households and 25.3% or 193 single-mother households are living below the poverty line. Among single-father households, those with 1 or 2 children have the highest poverty rate, with 15 households (16.7%) experiencing poverty. Likewise, among single-mother households, those with 3 or 4 children have the highest poverty rate, with 177 households (100.0%) falling below the poverty line.
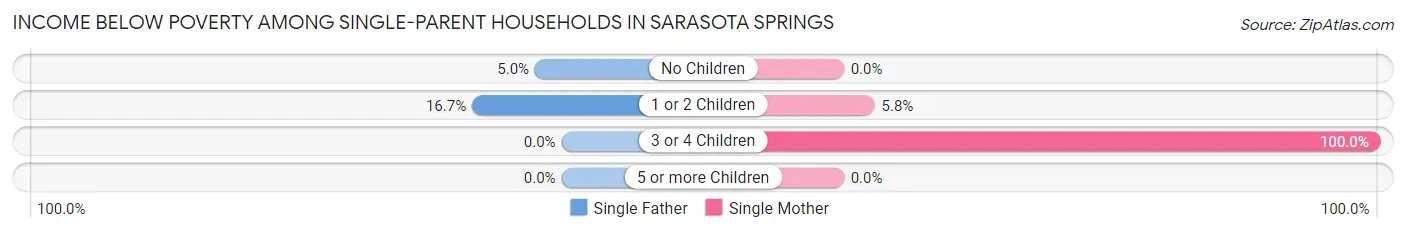
| Children | Single Father | Single Mother |
| No Children | 5 (5.0%) | 0 (0.0%) |
| 1 or 2 Children | 15 (16.7%) | 16 (5.8%) |
| 3 or 4 Children | 0 (0.0%) | 177 (100.0%) |
| 5 or more Children | 0 (0.0%) | 0 (0.0%) |
| Total | 20 (9.8%) | 193 (25.3%) |
Income Below Poverty Among Married-Couple vs Single-Parent Households in Sarasota Springs
The poverty data for Sarasota Springs shows that 14 of the married-couple family households (0.6%) and 213 of the single-parent households (22.0%) are living below the poverty level. Within the married-couple family households, those with no children have the highest poverty rate, with 14 households (0.9%) falling below the poverty line. Among the single-parent households, those with 3 or 4 children have the highest poverty rate, with 177 household (92.7%) living below poverty.
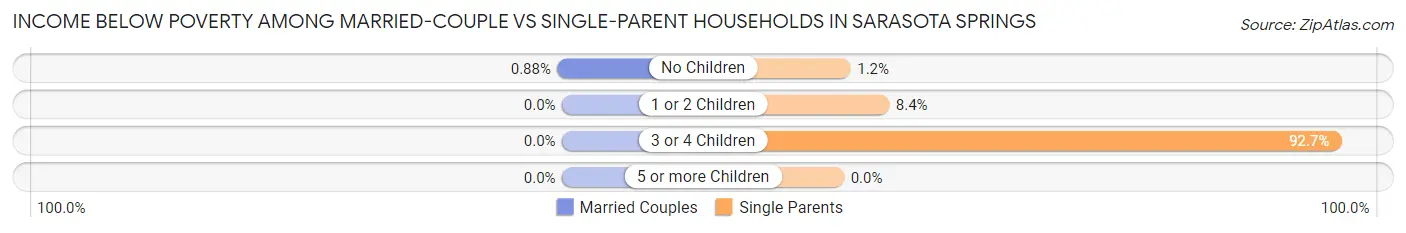
| Children | Married-Couple Families | Single-Parent Households |
| No Children | 14 (0.9%) | 5 (1.2%) |
| 1 or 2 Children | 0 (0.0%) | 31 (8.4%) |
| 3 or 4 Children | 0 (0.0%) | 177 (92.7%) |
| 5 or more Children | 0 (0.0%) | 0 (0.0%) |
| Total | 14 (0.6%) | 213 (22.0%) |
Race in Sarasota Springs
The most populous races in Sarasota Springs are White / Caucasian (10,491 | 83.9%), Hispanic or Latino (2,130 | 17.0%), and Two or more Races (935 | 7.5%).
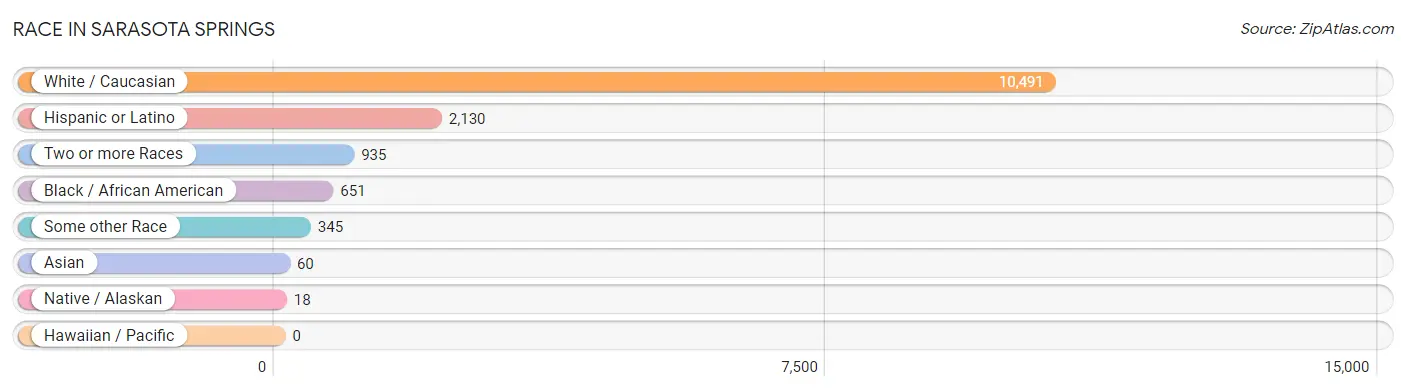
| Race | # Population | % Population |
| Asian | 60 | 0.5% |
| Black / African American | 651 | 5.2% |
| Hawaiian / Pacific | 0 | 0.0% |
| Hispanic or Latino | 2,130 | 17.0% |
| Native / Alaskan | 18 | 0.1% |
| White / Caucasian | 10,491 | 83.9% |
| Two or more Races | 935 | 7.5% |
| Some other Race | 345 | 2.8% |
| Total | 12,500 | 100.0% |
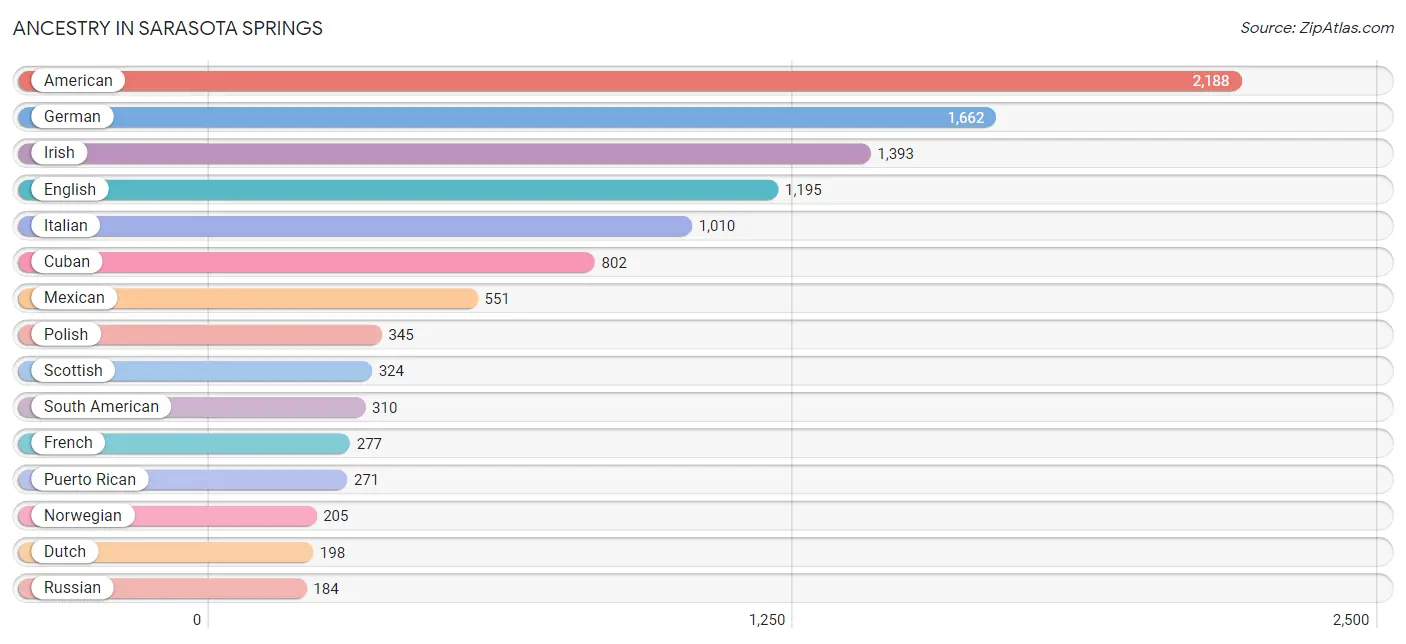
Ancestry in Sarasota Springs
The most populous ancestries reported in Sarasota Springs are American (2,188 | 17.5%), German (1,662 | 13.3%), Irish (1,393 | 11.1%), English (1,195 | 9.6%), and Italian (1,010 | 8.1%), together accounting for 59.6% of all Sarasota Springs residents.
| Ancestry | # Population | % Population |
| Alsatian | 4 | 0.0% |
| American | 2,188 | 17.5% |
| Arab | 28 | 0.2% |
| Austrian | 77 | 0.6% |
| Belgian | 38 | 0.3% |
| Bhutanese | 26 | 0.2% |
| Brazilian | 138 | 1.1% |
| British | 96 | 0.8% |
| Burmese | 14 | 0.1% |
| Canadian | 18 | 0.1% |
| Central American | 98 | 0.8% |
| Central American Indian | 41 | 0.3% |
| Cherokee | 24 | 0.2% |
| Chilean | 9 | 0.1% |
| Chippewa | 3 | 0.0% |
| Colombian | 105 | 0.8% |
| Croatian | 23 | 0.2% |
| Cuban | 802 | 6.4% |
| Czech | 55 | 0.4% |
| Czechoslovakian | 6 | 0.1% |
| Danish | 38 | 0.3% |
| Dominican | 30 | 0.2% |
| Dutch | 198 | 1.6% |
| Eastern European | 31 | 0.3% |
| Ecuadorian | 16 | 0.1% |
| English | 1,195 | 9.6% |
| European | 63 | 0.5% |
| Finnish | 13 | 0.1% |
| French | 277 | 2.2% |
| French Canadian | 21 | 0.2% |
| German | 1,662 | 13.3% |
| Greek | 17 | 0.1% |
| Guatemalan | 14 | 0.1% |
| Hungarian | 28 | 0.2% |
| Indian (Asian) | 24 | 0.2% |
| Irish | 1,393 | 11.1% |
| Iroquois | 13 | 0.1% |
| Italian | 1,010 | 8.1% |
| Korean | 36 | 0.3% |
| Lebanese | 28 | 0.2% |
| Mexican | 551 | 4.4% |
| Nicaraguan | 13 | 0.1% |
| Northern European | 13 | 0.1% |
| Norwegian | 205 | 1.6% |
| Pakistani | 54 | 0.4% |
| Peruvian | 68 | 0.5% |
| Polish | 345 | 2.8% |
| Portuguese | 17 | 0.1% |
| Puerto Rican | 271 | 2.2% |
| Russian | 184 | 1.5% |
| Salvadoran | 71 | 0.6% |
| Scandinavian | 21 | 0.2% |
| Scotch-Irish | 80 | 0.6% |
| Scottish | 324 | 2.6% |
| Slovak | 25 | 0.2% |
| Slovene | 5 | 0.0% |
| South American | 310 | 2.5% |
| Spaniard | 17 | 0.1% |
| Spanish | 15 | 0.1% |
| Sri Lankan | 32 | 0.3% |
| Swedish | 161 | 1.3% |
| Swiss | 132 | 1.1% |
| Thai | 6 | 0.1% |
| Turkish | 37 | 0.3% |
| Ukrainian | 31 | 0.3% |
| Venezuelan | 112 | 0.9% |
| Welsh | 62 | 0.5% |
| Yugoslavian | 37 | 0.3% | View All 68 Rows |
Immigrants in Sarasota Springs
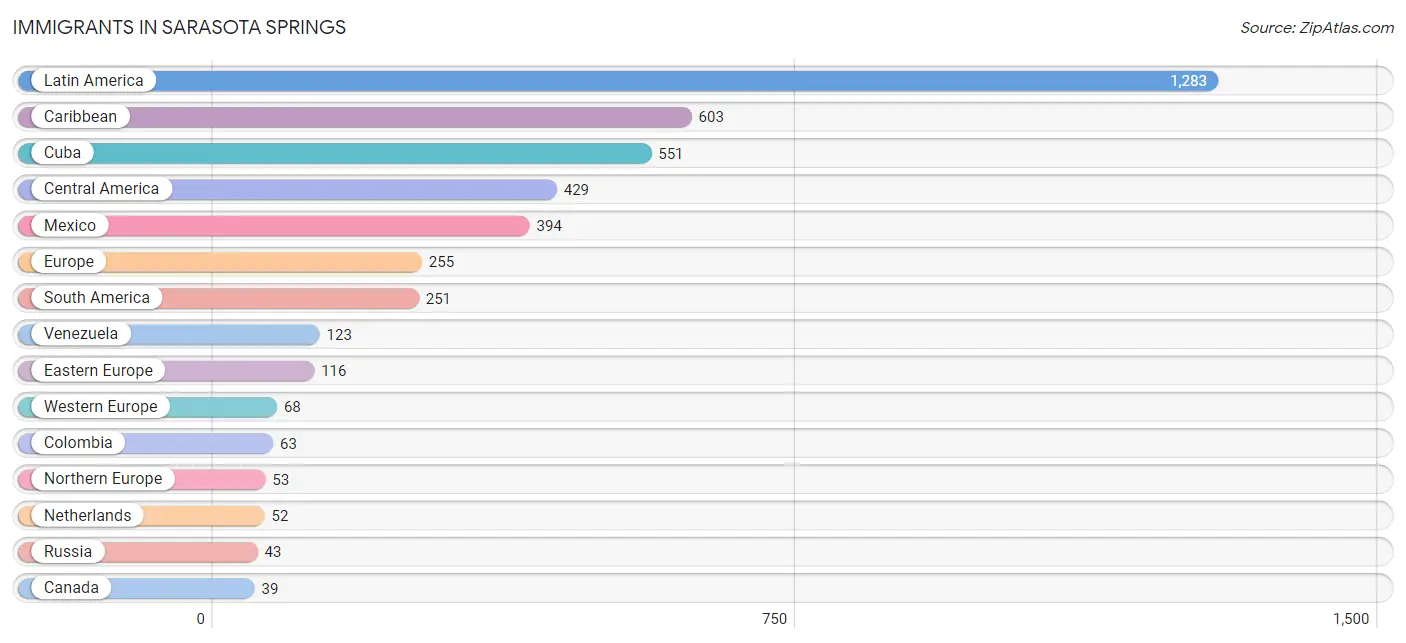
The most numerous immigrant groups reported in Sarasota Springs came from Latin America (1,283 | 10.3%), Caribbean (603 | 4.8%), Cuba (551 | 4.4%), Central America (429 | 3.4%), and Mexico (394 | 3.2%), together accounting for 26.1% of all Sarasota Springs residents.
| Immigration Origin | # Population | % Population |
| Africa | 4 | 0.0% |
| Austria | 16 | 0.1% |
| Barbados | 13 | 0.1% |
| Belize | 8 | 0.1% |
| Bosnia and Herzegovina | 31 | 0.3% |
| Brazil | 27 | 0.2% |
| Canada | 39 | 0.3% |
| Caribbean | 603 | 4.8% |
| Central America | 429 | 3.4% |
| Colombia | 63 | 0.5% |
| Cuba | 551 | 4.4% |
| Dominican Republic | 39 | 0.3% |
| Eastern Europe | 116 | 0.9% |
| England | 24 | 0.2% |
| Europe | 255 | 2.0% |
| Guatemala | 14 | 0.1% |
| Hungary | 9 | 0.1% |
| Ireland | 14 | 0.1% |
| Italy | 18 | 0.1% |
| Latin America | 1,283 | 10.3% |
| Mexico | 394 | 3.2% |
| Netherlands | 52 | 0.4% |
| Nicaragua | 13 | 0.1% |
| Northern Europe | 53 | 0.4% |
| Peru | 38 | 0.3% |
| Poland | 7 | 0.1% |
| Russia | 43 | 0.3% |
| Scotland | 15 | 0.1% |
| South Africa | 4 | 0.0% |
| South America | 251 | 2.0% |
| Southern Europe | 18 | 0.1% |
| Ukraine | 26 | 0.2% |
| Venezuela | 123 | 1.0% |
| Western Europe | 68 | 0.5% | View All 34 Rows |
Sex and Age in Sarasota Springs
Sex and Age in Sarasota Springs
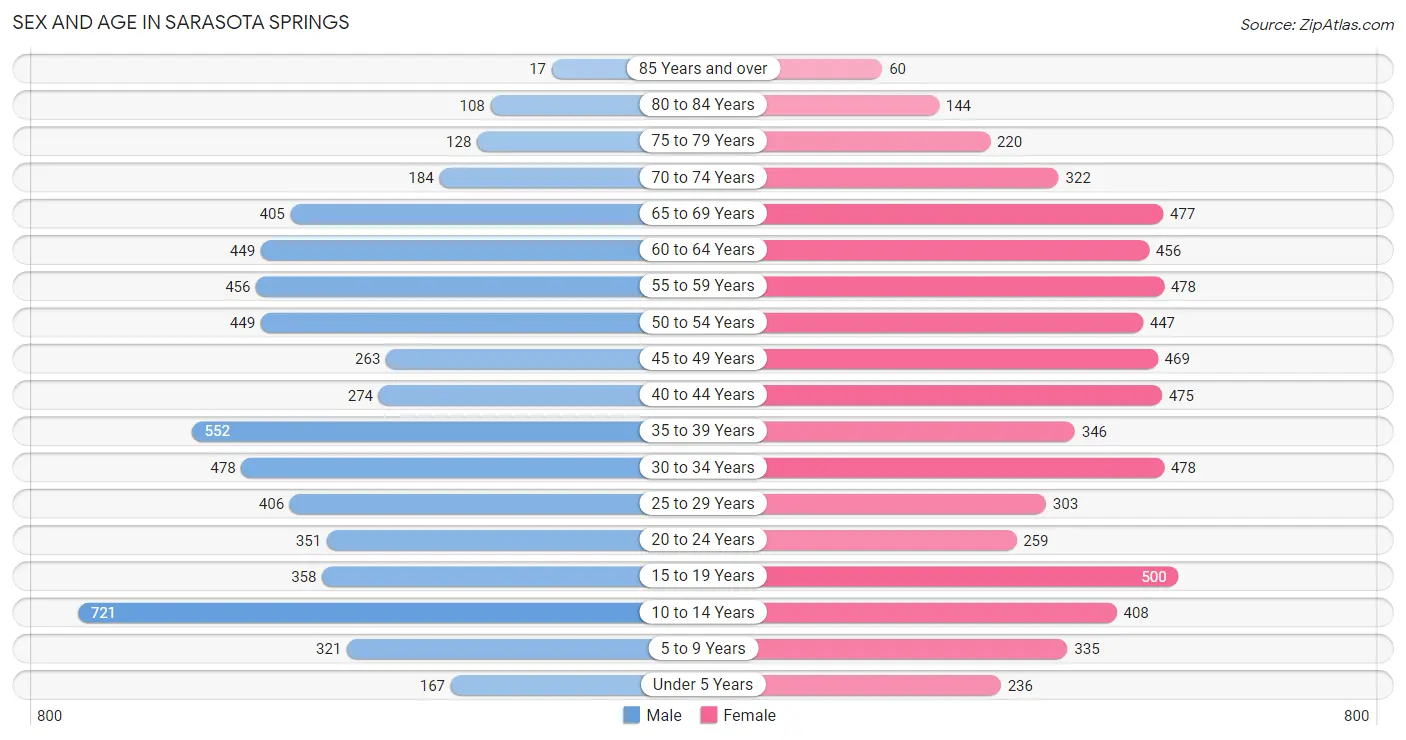
The most populous age groups in Sarasota Springs are 10 to 14 Years (721 | 11.8%) for men and 15 to 19 Years (500 | 7.8%) for women.
| Age Bracket | Male | Female |
| Under 5 Years | 167 (2.7%) | 236 (3.7%) |
| 5 to 9 Years | 321 (5.3%) | 335 (5.2%) |
| 10 to 14 Years | 721 (11.8%) | 408 (6.4%) |
| 15 to 19 Years | 358 (5.9%) | 500 (7.8%) |
| 20 to 24 Years | 351 (5.8%) | 259 (4.0%) |
| 25 to 29 Years | 406 (6.7%) | 303 (4.7%) |
| 30 to 34 Years | 478 (7.9%) | 478 (7.4%) |
| 35 to 39 Years | 552 (9.1%) | 346 (5.4%) |
| 40 to 44 Years | 274 (4.5%) | 475 (7.4%) |
| 45 to 49 Years | 263 (4.3%) | 469 (7.3%) |
| 50 to 54 Years | 449 (7.4%) | 447 (7.0%) |
| 55 to 59 Years | 456 (7.5%) | 478 (7.4%) |
| 60 to 64 Years | 449 (7.4%) | 456 (7.1%) |
| 65 to 69 Years | 405 (6.7%) | 477 (7.4%) |
| 70 to 74 Years | 184 (3.0%) | 322 (5.0%) |
| 75 to 79 Years | 128 (2.1%) | 220 (3.4%) |
| 80 to 84 Years | 108 (1.8%) | 144 (2.2%) |
| 85 Years and over | 17 (0.3%) | 60 (0.9%) |
| Total | 6,087 (100.0%) | 6,413 (100.0%) |
Families and Households in Sarasota Springs
Median Family Size in Sarasota Springs
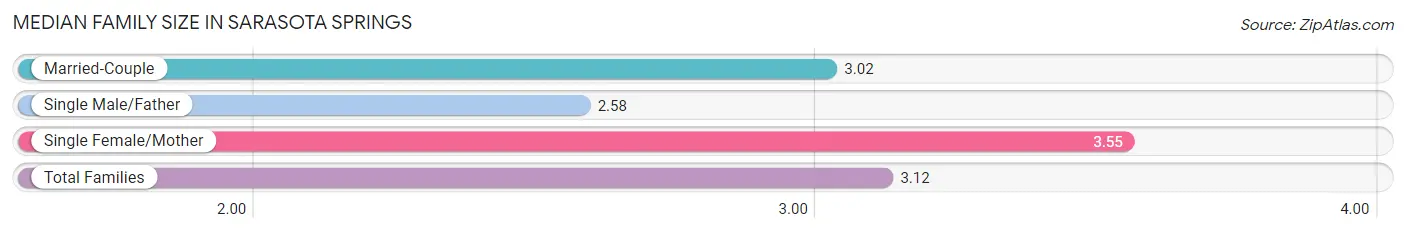
The median family size in Sarasota Springs is 3.12 persons per family, with single female/mother families (762 | 23.6%) accounting for the largest median family size of 3.55 persons per family. On the other hand, single male/father families (205 | 6.4%) represent the smallest median family size with 2.58 persons per family.
| Family Type | # Families | Family Size |
| Married-Couple | 2,256 (70.0%) | 3.02 |
| Single Male/Father | 205 (6.4%) | 2.58 |
| Single Female/Mother | 762 (23.6%) | 3.55 |
| Total Families | 3,223 (100.0%) | 3.12 |
Median Household Size in Sarasota Springs
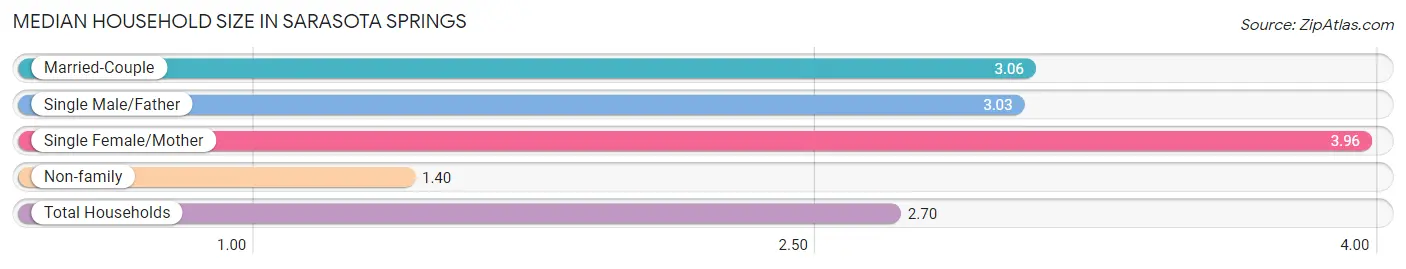
The median household size in Sarasota Springs is 2.70 persons per household, with single female/mother households (762 | 16.5%) accounting for the largest median household size of 3.96 persons per household. non-family households (1,401 | 30.3%) represent the smallest median household size with 1.40 persons per household.
| Household Type | # Households | Household Size |
| Married-Couple | 2,256 (48.8%) | 3.06 |
| Single Male/Father | 205 (4.4%) | 3.03 |
| Single Female/Mother | 762 (16.5%) | 3.96 |
| Non-family | 1,401 (30.3%) | 1.40 |
| Total Households | 4,624 (100.0%) | 2.70 |
Household Size by Marriage Status in Sarasota Springs
Out of a total of 4,624 households in Sarasota Springs, 3,223 (69.7%) are family households, while 1,401 (30.3%) are nonfamily households. The most numerous type of family households are 2-person households, comprising 1,552, and the most common type of nonfamily households are 1-person households, comprising 1,068.
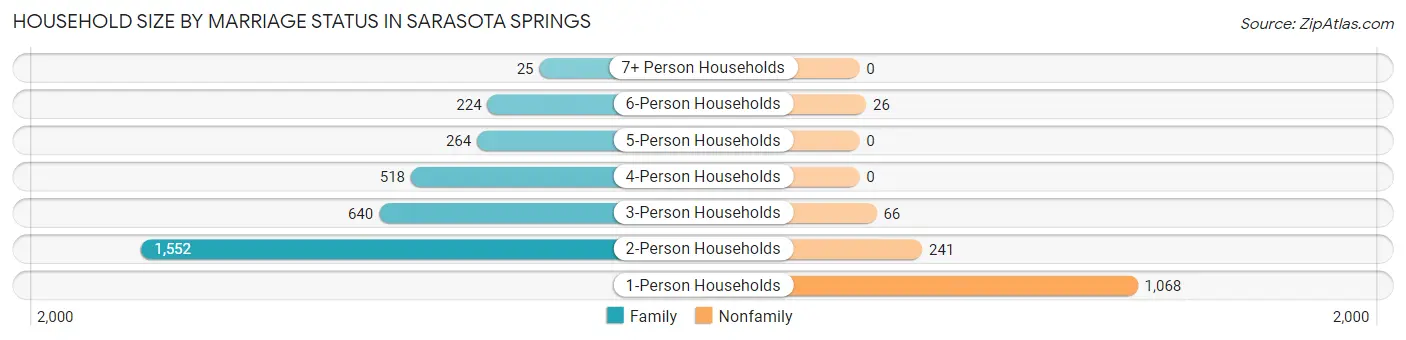
| Household Size | Family Households | Nonfamily Households |
| 1-Person Households | - | 1,068 (23.1%) |
| 2-Person Households | 1,552 (33.6%) | 241 (5.2%) |
| 3-Person Households | 640 (13.8%) | 66 (1.4%) |
| 4-Person Households | 518 (11.2%) | 0 (0.0%) |
| 5-Person Households | 264 (5.7%) | 0 (0.0%) |
| 6-Person Households | 224 (4.8%) | 26 (0.6%) |
| 7+ Person Households | 25 (0.5%) | 0 (0.0%) |
| Total | 3,223 (69.7%) | 1,401 (30.3%) |
Female Fertility in Sarasota Springs
Fertility by Age in Sarasota Springs
Average fertility rate in Sarasota Springs is 20.0 births per 1,000 women. Women in the age bracket of 20 to 34 years have the highest fertility rate with 38.0 births per 1,000 women. Women in the age bracket of 20 to 34 years acount for 70.2% of all women with births.
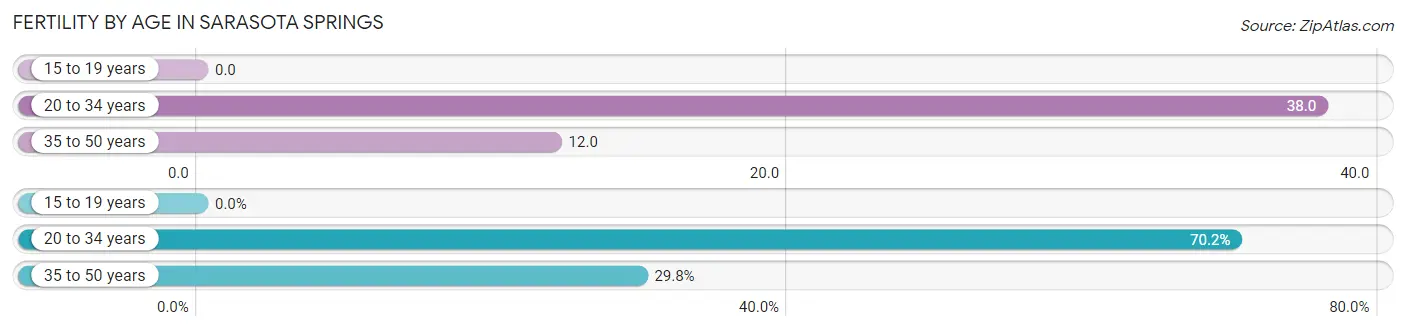
| Age Bracket | Women with Births | Births / 1,000 Women |
| 15 to 19 years | 0 (0.0%) | 0.0 |
| 20 to 34 years | 40 (70.2%) | 38.0 |
| 35 to 50 years | 17 (29.8%) | 12.0 |
| Total | 57 (100.0%) | 20.0 |
Fertility by Age by Marriage Status in Sarasota Springs
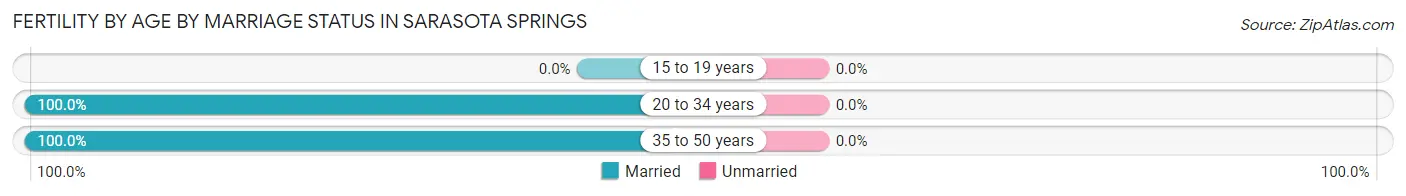
| Age Bracket | Married | Unmarried |
| 15 to 19 years | 0 (0.0%) | 0 (0.0%) |
| 20 to 34 years | 40 (100.0%) | 0 (0.0%) |
| 35 to 50 years | 17 (100.0%) | 0 (0.0%) |
| Total | 57 (100.0%) | 0 (0.0%) |
Fertility by Education in Sarasota Springs
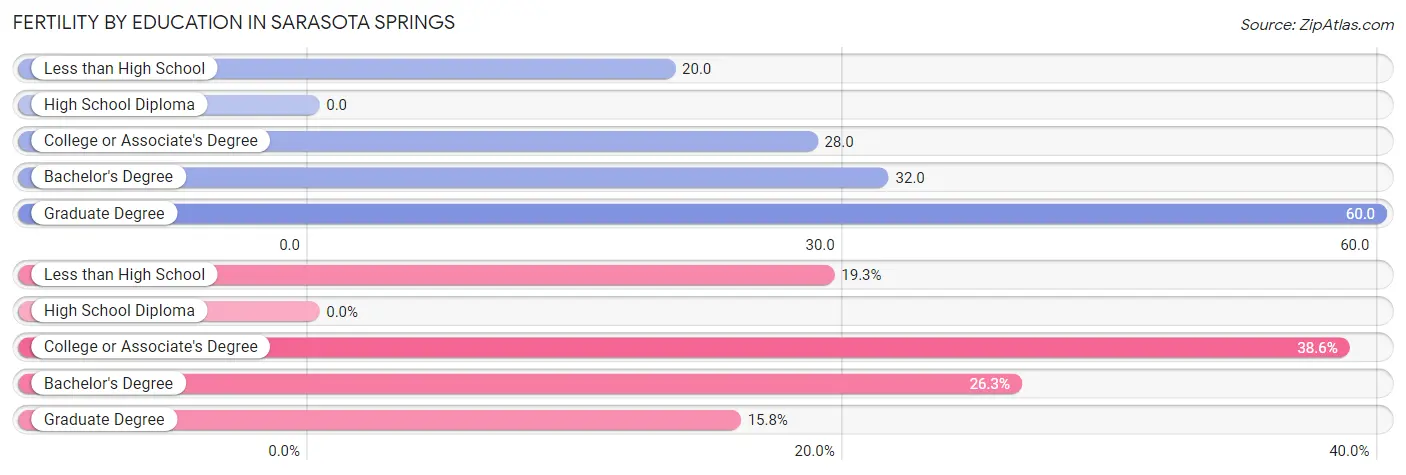
| Educational Attainment | Women with Births | Births / 1,000 Women |
| Less than High School | 11 (19.3%) | 20.0 |
| High School Diploma | 0 (0.0%) | 0.0 |
| College or Associate's Degree | 22 (38.6%) | 28.0 |
| Bachelor's Degree | 15 (26.3%) | 32.0 |
| Graduate Degree | 9 (15.8%) | 60.0 |
| Total | 57 (100.0%) | 20.0 |
Fertility by Education by Marriage Status in Sarasota Springs
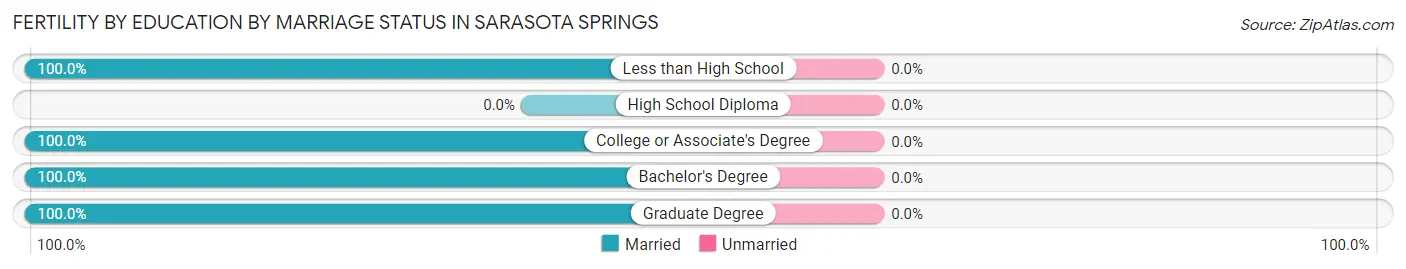
| Educational Attainment | Married | Unmarried |
| Less than High School | 11 (100.0%) | 0 (0.0%) |
| High School Diploma | 0 (0.0%) | 0 (0.0%) |
| College or Associate's Degree | 22 (100.0%) | 0 (0.0%) |
| Bachelor's Degree | 15 (100.0%) | 0 (0.0%) |
| Graduate Degree | 9 (100.0%) | 0 (0.0%) |
| Total | 57 (100.0%) | 0 (0.0%) |
Employment Characteristics in Sarasota Springs
Employment by Class of Employer in Sarasota Springs
Among the 7,062 employed individuals in Sarasota Springs, private company employees (5,347 | 75.7%), local government employees (493 | 7.0%), and not-for-profit organizations (443 | 6.3%) make up the most common classes of employment.
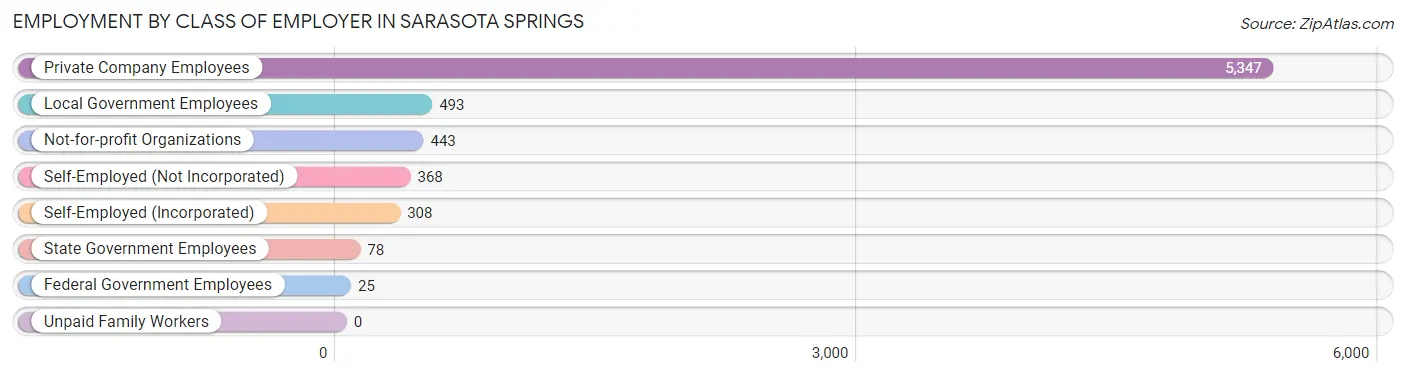
| Employer Class | # Employees | % Employees |
| Private Company Employees | 5,347 | 75.7% |
| Self-Employed (Incorporated) | 308 | 4.4% |
| Self-Employed (Not Incorporated) | 368 | 5.2% |
| Not-for-profit Organizations | 443 | 6.3% |
| Local Government Employees | 493 | 7.0% |
| State Government Employees | 78 | 1.1% |
| Federal Government Employees | 25 | 0.4% |
| Unpaid Family Workers | 0 | 0.0% |
| Total | 7,062 | 100.0% |
Employment Status by Age in Sarasota Springs
According to the labor force statistics for Sarasota Springs, out of the total population over 16 years of age (9,993), 73.9% or 7,385 individuals are in the labor force, with 2.9% or 214 of them unemployed. The age group with the highest labor force participation rate is 30 to 34 years, with 92.7% or 886 individuals in the labor force. Within the labor force, the 16 to 19 years age range has the highest percentage of unemployed individuals, with 13.1% or 41 of them being unemployed.
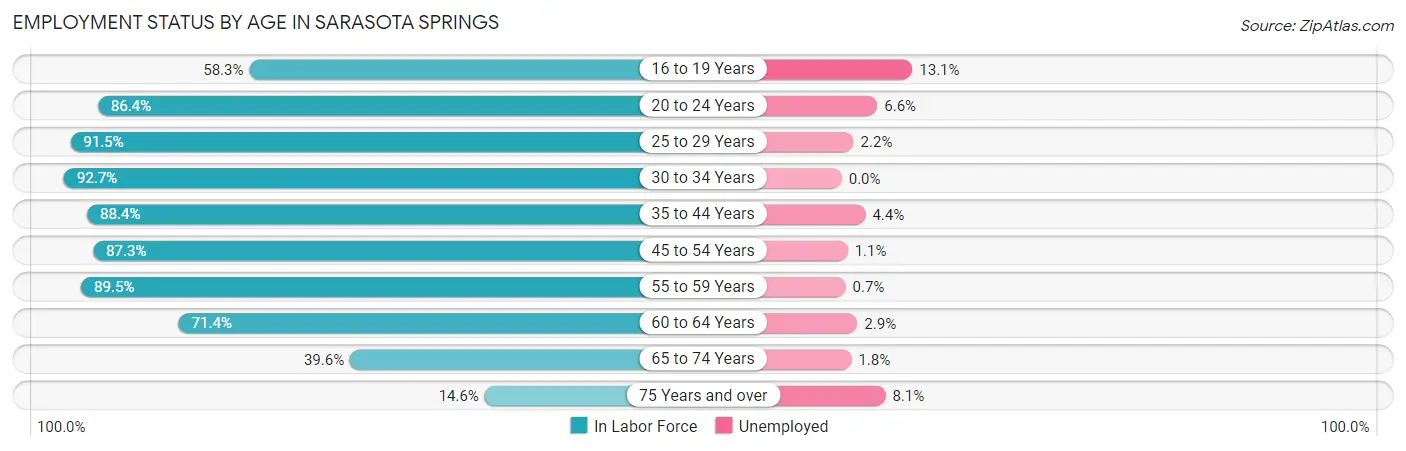
| Age Bracket | In Labor Force | Unemployed |
| 16 to 19 Years | 314 (58.3%) | 41 (13.1%) |
| 20 to 24 Years | 527 (86.4%) | 35 (6.6%) |
| 25 to 29 Years | 649 (91.5%) | 14 (2.2%) |
| 30 to 34 Years | 886 (92.7%) | 0 (0.0%) |
| 35 to 44 Years | 1,456 (88.4%) | 64 (4.4%) |
| 45 to 54 Years | 1,421 (87.3%) | 16 (1.1%) |
| 55 to 59 Years | 836 (89.5%) | 6 (0.7%) |
| 60 to 64 Years | 646 (71.4%) | 19 (2.9%) |
| 65 to 74 Years | 550 (39.6%) | 10 (1.8%) |
| 75 Years and over | 99 (14.6%) | 8 (8.1%) |
| Total | 7,385 (73.9%) | 214 (2.9%) |
Employment Status by Educational Attainment in Sarasota Springs
According to labor force statistics for Sarasota Springs, 87.0% of individuals (5,898) out of the total population between 25 and 64 years of age (6,779) are in the labor force, with 2.0% or 118 of them being unemployed. The group with the highest labor force participation rate are those with the educational attainment of bachelor's degree or higher, with 94.5% or 1,504 individuals in the labor force. Within the labor force, individuals with less than high school education have the highest percentage of unemployment, with 12.3% or 37 of them being unemployed.
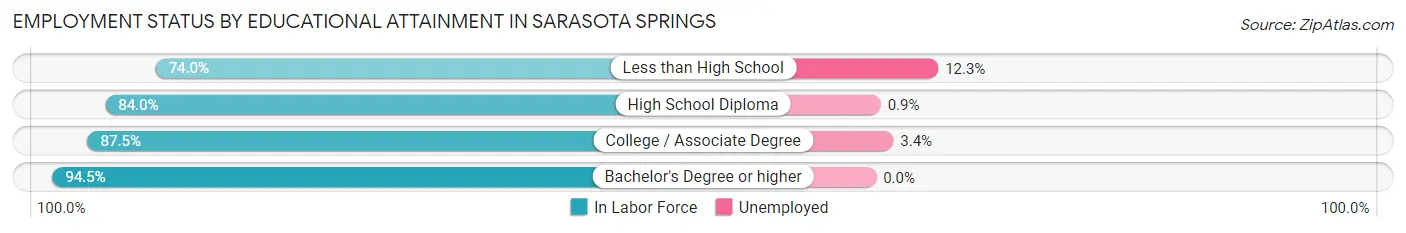
| Educational Attainment | In Labor Force | Unemployed |
| Less than High School | 301 (74.0%) | 50 (12.3%) |
| High School Diploma | 2,256 (84.0%) | 24 (0.9%) |
| College / Associate Degree | 1,832 (87.5%) | 71 (3.4%) |
| Bachelor's Degree or higher | 1,504 (94.5%) | 0 (0.0%) |
| Total | 5,898 (87.0%) | 136 (2.0%) |
Employment Occupations by Sex in Sarasota Springs
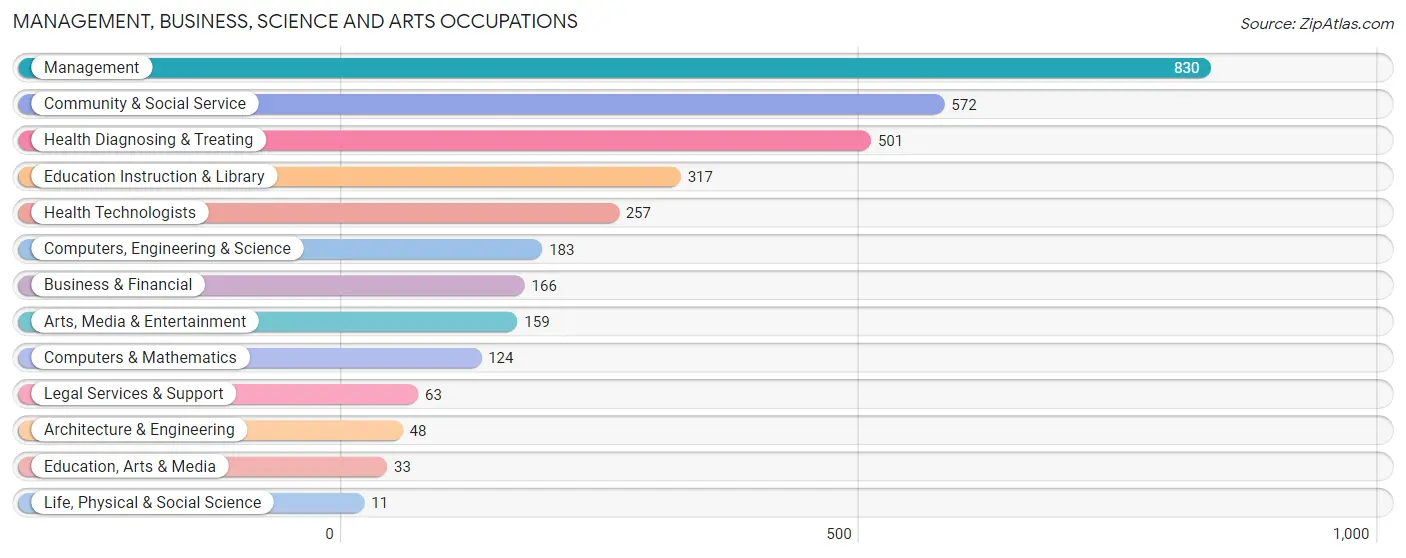
Management, Business, Science and Arts Occupations
The most common Management, Business, Science and Arts occupations in Sarasota Springs are Management (830 | 11.6%), Community & Social Service (572 | 8.0%), Health Diagnosing & Treating (501 | 7.0%), Education Instruction & Library (317 | 4.4%), and Health Technologists (257 | 3.6%).
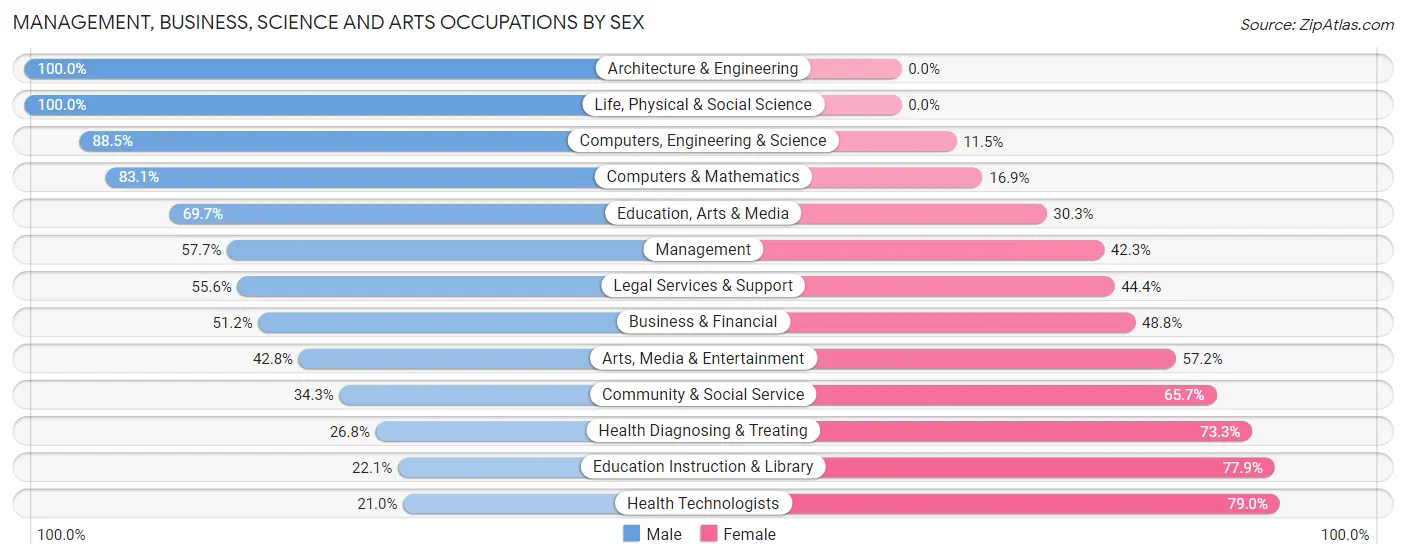
Management, Business, Science and Arts Occupations by Sex
Within the Management, Business, Science and Arts occupations in Sarasota Springs, the most male-oriented occupations are Architecture & Engineering (100.0%), Life, Physical & Social Science (100.0%), and Computers, Engineering & Science (88.5%), while the most female-oriented occupations are Health Technologists (79.0%), Education Instruction & Library (77.9%), and Health Diagnosing & Treating (73.3%).
| Occupation | Male | Female |
| Management | 479 (57.7%) | 351 (42.3%) |
| Business & Financial | 85 (51.2%) | 81 (48.8%) |
| Computers, Engineering & Science | 162 (88.5%) | 21 (11.5%) |
| Computers & Mathematics | 103 (83.1%) | 21 (16.9%) |
| Architecture & Engineering | 48 (100.0%) | 0 (0.0%) |
| Life, Physical & Social Science | 11 (100.0%) | 0 (0.0%) |
| Community & Social Service | 196 (34.3%) | 376 (65.7%) |
| Education, Arts & Media | 23 (69.7%) | 10 (30.3%) |
| Legal Services & Support | 35 (55.6%) | 28 (44.4%) |
| Education Instruction & Library | 70 (22.1%) | 247 (77.9%) |
| Arts, Media & Entertainment | 68 (42.8%) | 91 (57.2%) |
| Health Diagnosing & Treating | 134 (26.8%) | 367 (73.3%) |
| Health Technologists | 54 (21.0%) | 203 (79.0%) |
| Total (Category) | 1,056 (46.9%) | 1,196 (53.1%) |
| Total (Overall) | 3,678 (51.3%) | 3,493 (48.7%) |
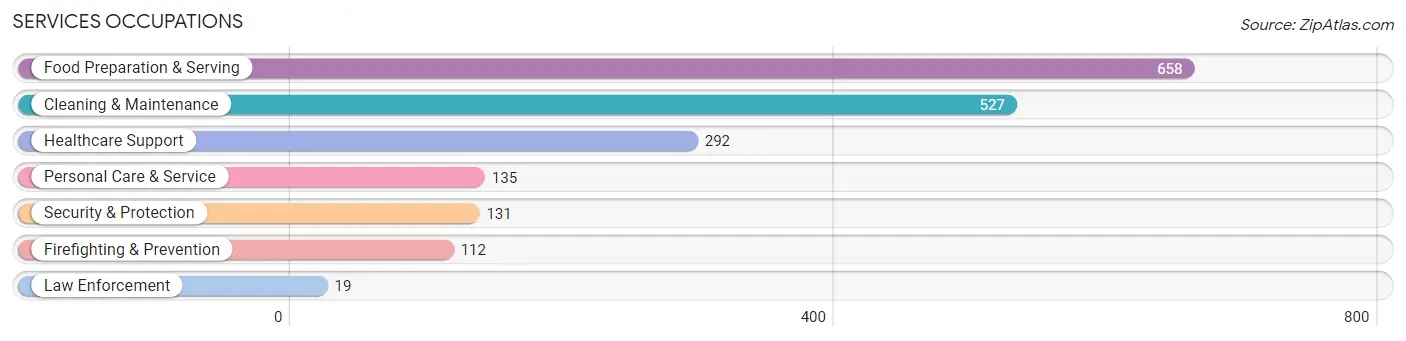
Services Occupations
The most common Services occupations in Sarasota Springs are Food Preparation & Serving (658 | 9.2%), Cleaning & Maintenance (527 | 7.3%), Healthcare Support (292 | 4.1%), Personal Care & Service (135 | 1.9%), and Security & Protection (131 | 1.8%).
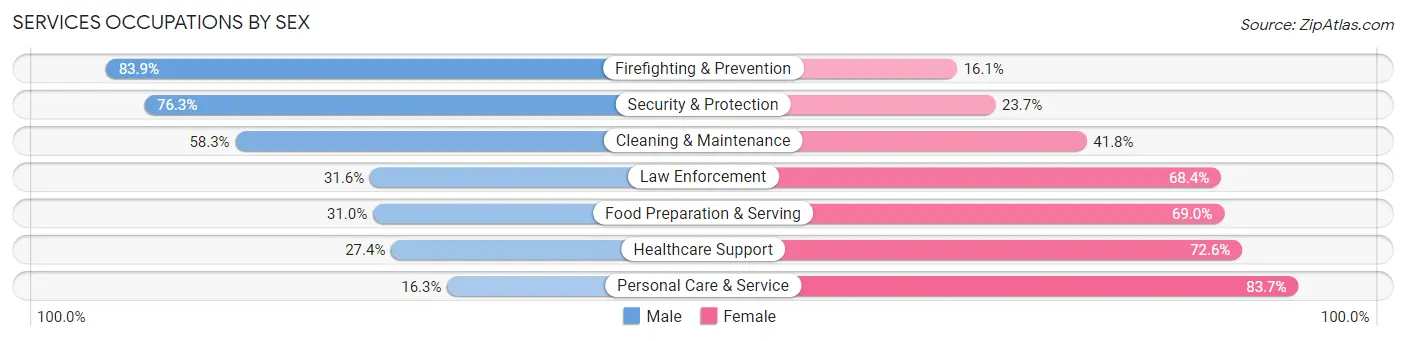
Services Occupations by Sex
Within the Services occupations in Sarasota Springs, the most male-oriented occupations are Firefighting & Prevention (83.9%), Security & Protection (76.3%), and Cleaning & Maintenance (58.3%), while the most female-oriented occupations are Personal Care & Service (83.7%), Healthcare Support (72.6%), and Food Preparation & Serving (69.0%).
| Occupation | Male | Female |
| Healthcare Support | 80 (27.4%) | 212 (72.6%) |
| Security & Protection | 100 (76.3%) | 31 (23.7%) |
| Firefighting & Prevention | 94 (83.9%) | 18 (16.1%) |
| Law Enforcement | 6 (31.6%) | 13 (68.4%) |
| Food Preparation & Serving | 204 (31.0%) | 454 (69.0%) |
| Cleaning & Maintenance | 307 (58.3%) | 220 (41.7%) |
| Personal Care & Service | 22 (16.3%) | 113 (83.7%) |
| Total (Category) | 713 (40.9%) | 1,030 (59.1%) |
| Total (Overall) | 3,678 (51.3%) | 3,493 (48.7%) |
Sales and Office Occupations
The most common Sales and Office occupations in Sarasota Springs are Office & Administration (949 | 13.2%), and Sales & Related (671 | 9.4%).
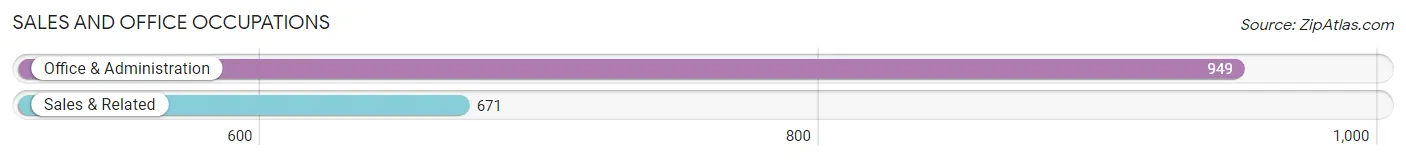
Sales and Office Occupations by Sex
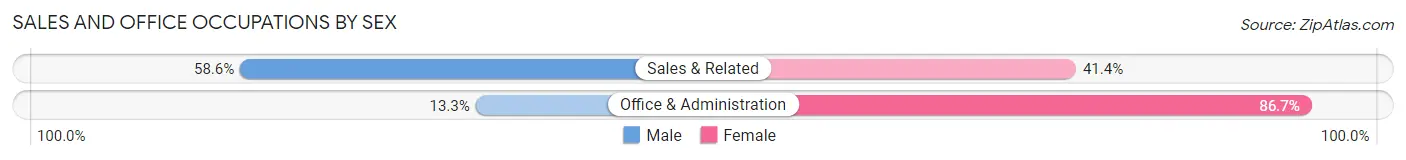
| Occupation | Male | Female |
| Sales & Related | 393 (58.6%) | 278 (41.4%) |
| Office & Administration | 126 (13.3%) | 823 (86.7%) |
| Total (Category) | 519 (32.0%) | 1,101 (68.0%) |
| Total (Overall) | 3,678 (51.3%) | 3,493 (48.7%) |
Natural Resources, Construction and Maintenance Occupations
The most common Natural Resources, Construction and Maintenance occupations in Sarasota Springs are Construction & Extraction (562 | 7.8%), Installation, Maintenance & Repair (237 | 3.3%), and Farming, Fishing & Forestry (12 | 0.2%).
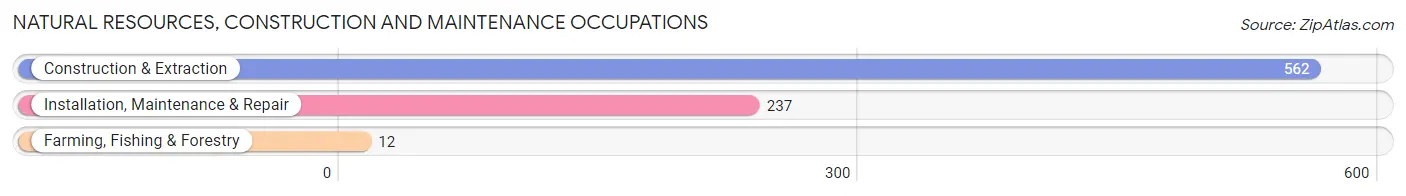
Natural Resources, Construction and Maintenance Occupations by Sex
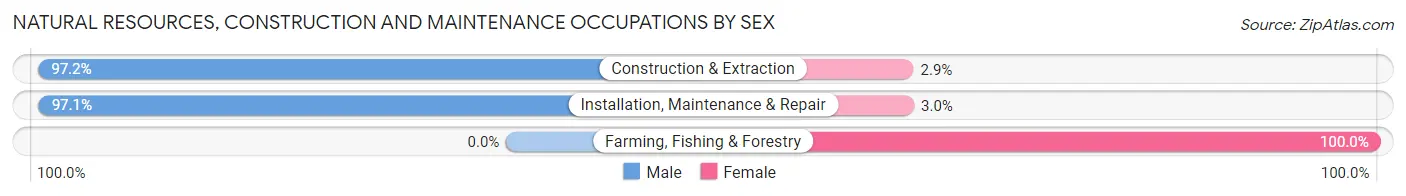
| Occupation | Male | Female |
| Farming, Fishing & Forestry | 0 (0.0%) | 12 (100.0%) |
| Construction & Extraction | 546 (97.2%) | 16 (2.9%) |
| Installation, Maintenance & Repair | 230 (97.1%) | 7 (2.9%) |
| Total (Category) | 776 (95.7%) | 35 (4.3%) |
| Total (Overall) | 3,678 (51.3%) | 3,493 (48.7%) |
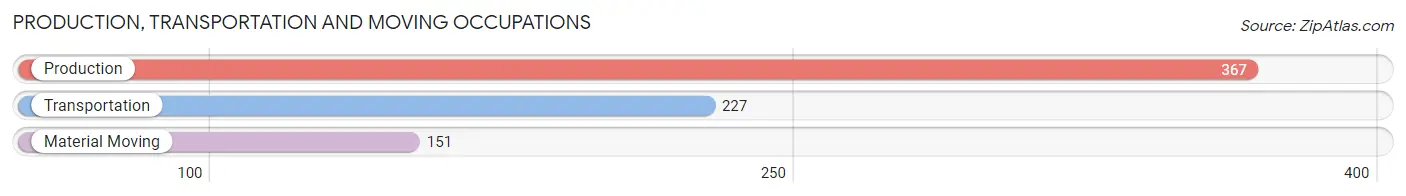
Production, Transportation and Moving Occupations
The most common Production, Transportation and Moving occupations in Sarasota Springs are Production (367 | 5.1%), Transportation (227 | 3.2%), and Material Moving (151 | 2.1%).
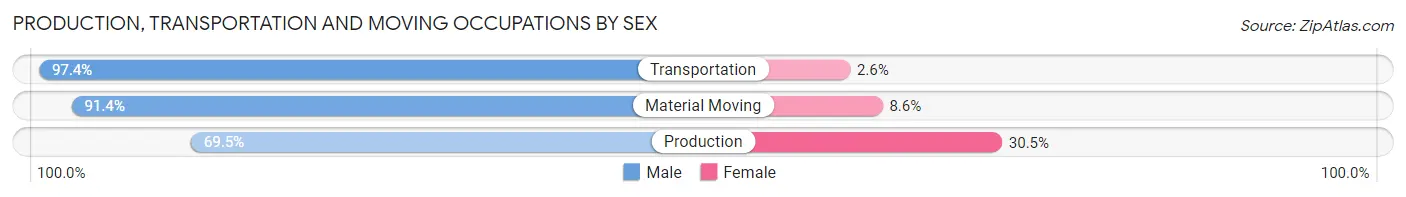
Production, Transportation and Moving Occupations by Sex
| Occupation | Male | Female |
| Production | 255 (69.5%) | 112 (30.5%) |
| Transportation | 221 (97.4%) | 6 (2.6%) |
| Material Moving | 138 (91.4%) | 13 (8.6%) |
| Total (Category) | 614 (82.4%) | 131 (17.6%) |
| Total (Overall) | 3,678 (51.3%) | 3,493 (48.7%) |
Employment Industries by Sex in Sarasota Springs
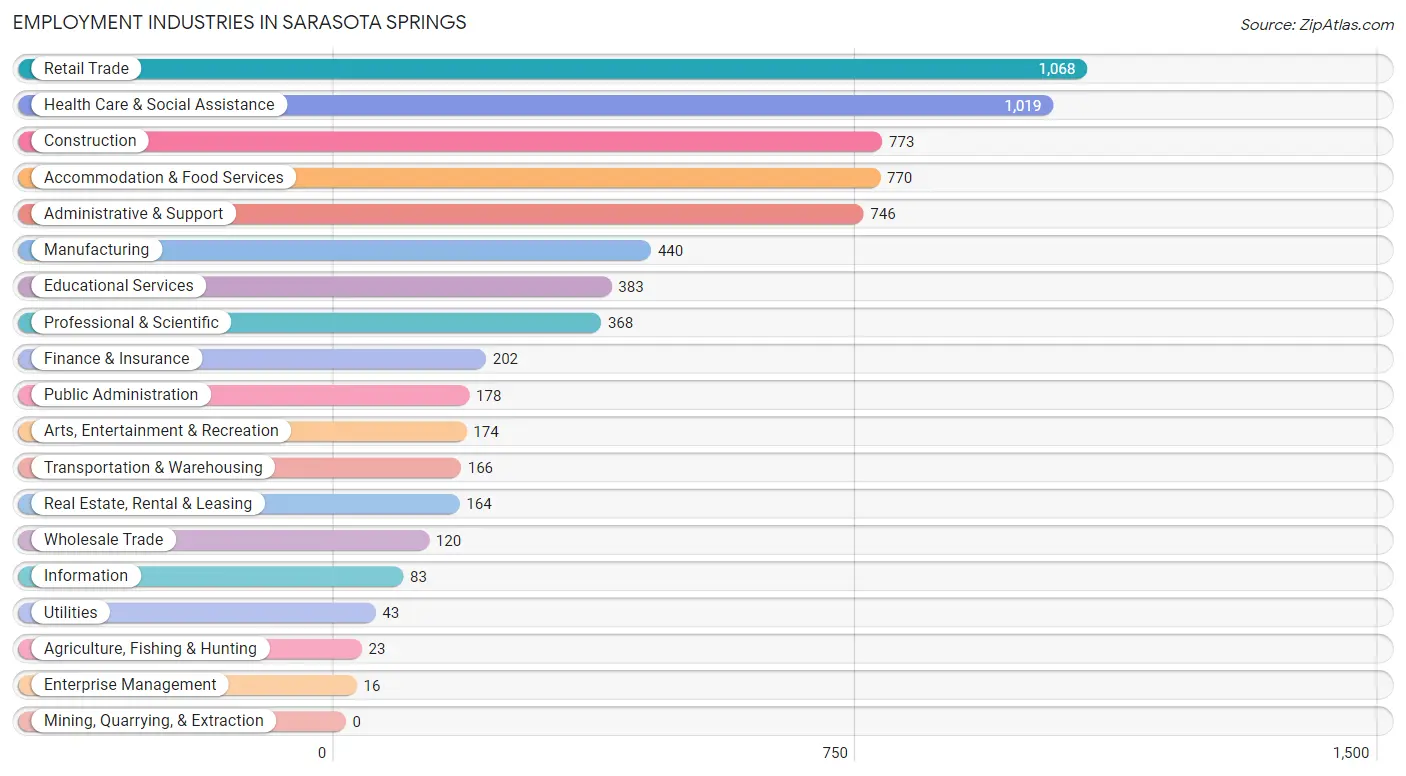
Employment Industries in Sarasota Springs
The major employment industries in Sarasota Springs include Retail Trade (1,068 | 14.9%), Health Care & Social Assistance (1,019 | 14.2%), Construction (773 | 10.8%), Accommodation & Food Services (770 | 10.7%), and Administrative & Support (746 | 10.4%).
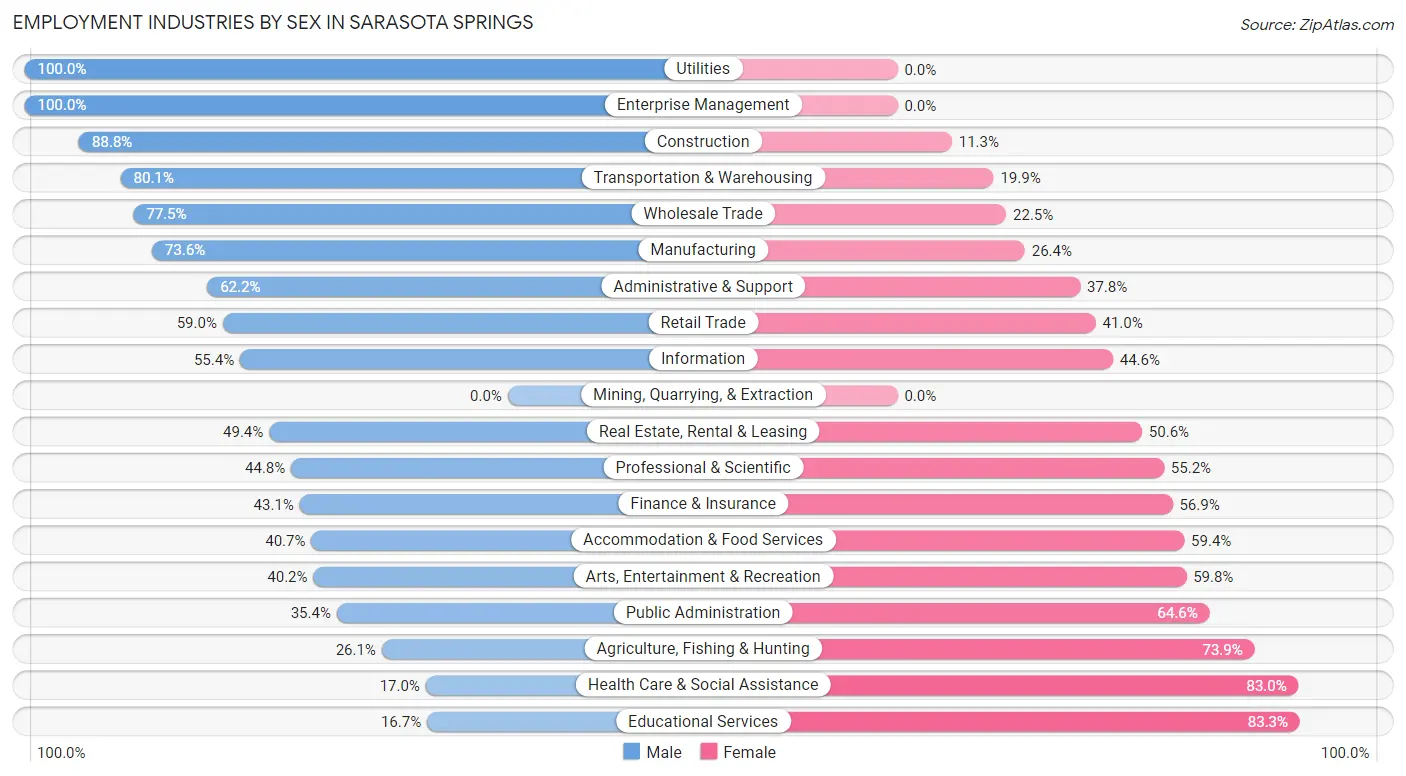
Employment Industries by Sex in Sarasota Springs
The Sarasota Springs industries that see more men than women are Utilities (100.0%), Enterprise Management (100.0%), and Construction (88.7%), whereas the industries that tend to have a higher number of women are Educational Services (83.3%), Health Care & Social Assistance (83.0%), and Agriculture, Fishing & Hunting (73.9%).
| Industry | Male | Female |
| Agriculture, Fishing & Hunting | 6 (26.1%) | 17 (73.9%) |
| Mining, Quarrying, & Extraction | 0 (0.0%) | 0 (0.0%) |
| Construction | 686 (88.7%) | 87 (11.3%) |
| Manufacturing | 324 (73.6%) | 116 (26.4%) |
| Wholesale Trade | 93 (77.5%) | 27 (22.5%) |
| Retail Trade | 630 (59.0%) | 438 (41.0%) |
| Transportation & Warehousing | 133 (80.1%) | 33 (19.9%) |
| Utilities | 43 (100.0%) | 0 (0.0%) |
| Information | 46 (55.4%) | 37 (44.6%) |
| Finance & Insurance | 87 (43.1%) | 115 (56.9%) |
| Real Estate, Rental & Leasing | 81 (49.4%) | 83 (50.6%) |
| Professional & Scientific | 165 (44.8%) | 203 (55.2%) |
| Enterprise Management | 16 (100.0%) | 0 (0.0%) |
| Administrative & Support | 464 (62.2%) | 282 (37.8%) |
| Educational Services | 64 (16.7%) | 319 (83.3%) |
| Health Care & Social Assistance | 173 (17.0%) | 846 (83.0%) |
| Arts, Entertainment & Recreation | 70 (40.2%) | 104 (59.8%) |
| Accommodation & Food Services | 313 (40.6%) | 457 (59.4%) |
| Public Administration | 63 (35.4%) | 115 (64.6%) |
| Total | 3,678 (51.3%) | 3,493 (48.7%) |
Education in Sarasota Springs
School Enrollment in Sarasota Springs
The most common levels of schooling among the 2,975 students in Sarasota Springs are middle school (883 | 29.7%), high school (804 | 27.0%), and elementary school (593 | 19.9%).
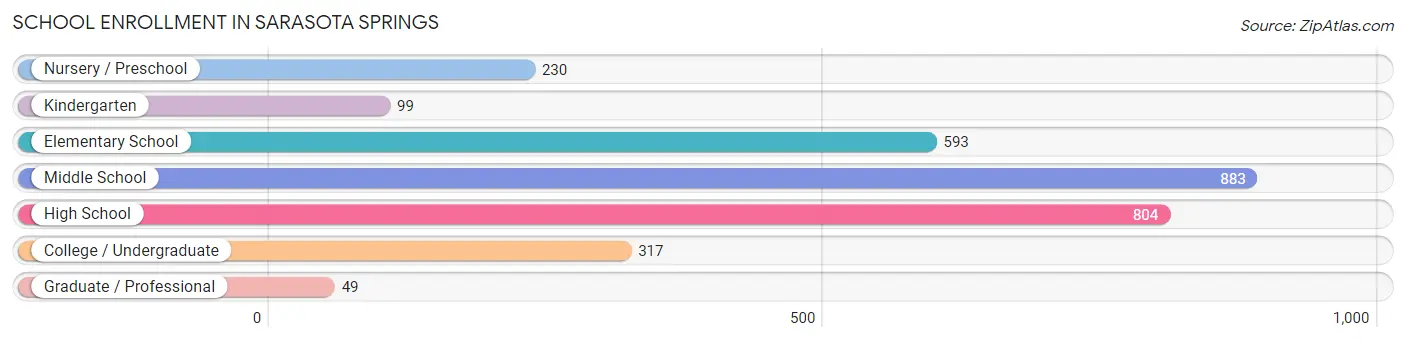
| School Level | # Students | % Students |
| Nursery / Preschool | 230 | 7.7% |
| Kindergarten | 99 | 3.3% |
| Elementary School | 593 | 19.9% |
| Middle School | 883 | 29.7% |
| High School | 804 | 27.0% |
| College / Undergraduate | 317 | 10.7% |
| Graduate / Professional | 49 | 1.7% |
| Total | 2,975 | 100.0% |
School Enrollment by Age by Funding Source in Sarasota Springs
Out of a total of 2,975 students who are enrolled in schools in Sarasota Springs, 411 (13.8%) attend a private institution, while the remaining 2,564 (86.2%) are enrolled in public schools. The age group of 3 to 4 year olds has the highest likelihood of being enrolled in private schools, with 74 (42.8% in the age bracket) enrolled. Conversely, the age group of 18 to 19 year olds has the lowest likelihood of being enrolled in a private school, with 122 (100.0% in the age bracket) attending a public institution.
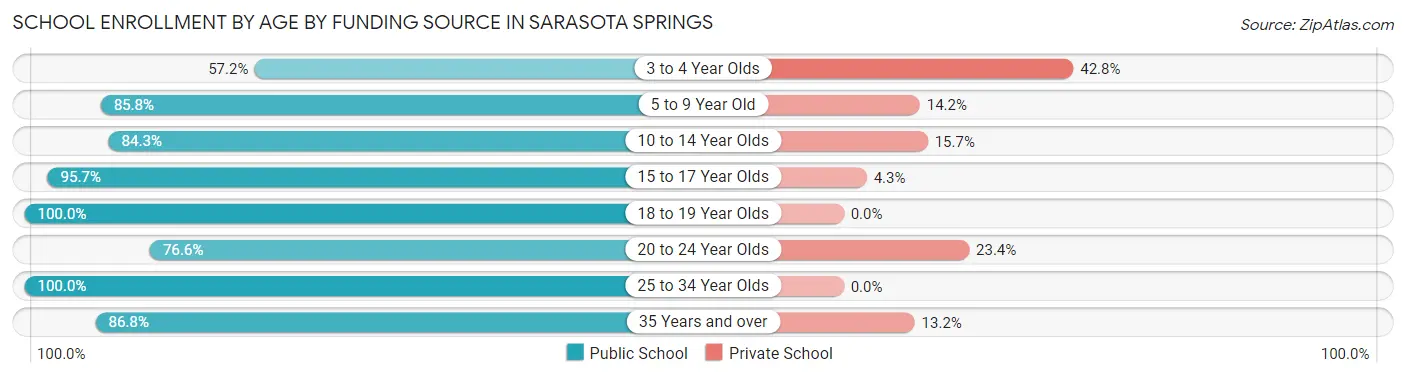
| Age Bracket | Public School | Private School |
| 3 to 4 Year Olds | 99 (57.2%) | 74 (42.8%) |
| 5 to 9 Year Old | 557 (85.8%) | 92 (14.2%) |
| 10 to 14 Year Olds | 926 (84.3%) | 172 (15.7%) |
| 15 to 17 Year Olds | 535 (95.7%) | 24 (4.3%) |
| 18 to 19 Year Olds | 122 (100.0%) | 0 (0.0%) |
| 20 to 24 Year Olds | 82 (76.6%) | 25 (23.4%) |
| 25 to 34 Year Olds | 93 (100.0%) | 0 (0.0%) |
| 35 Years and over | 151 (86.8%) | 23 (13.2%) |
| Total | 2,564 (86.2%) | 411 (13.8%) |
Educational Attainment by Field of Study in Sarasota Springs
Business (407 | 17.3%), education (289 | 12.3%), science & technology (243 | 10.3%), arts & humanities (191 | 8.1%), and psychology (166 | 7.1%) are the most common fields of study among 2,349 individuals in Sarasota Springs who have obtained a bachelor's degree or higher.
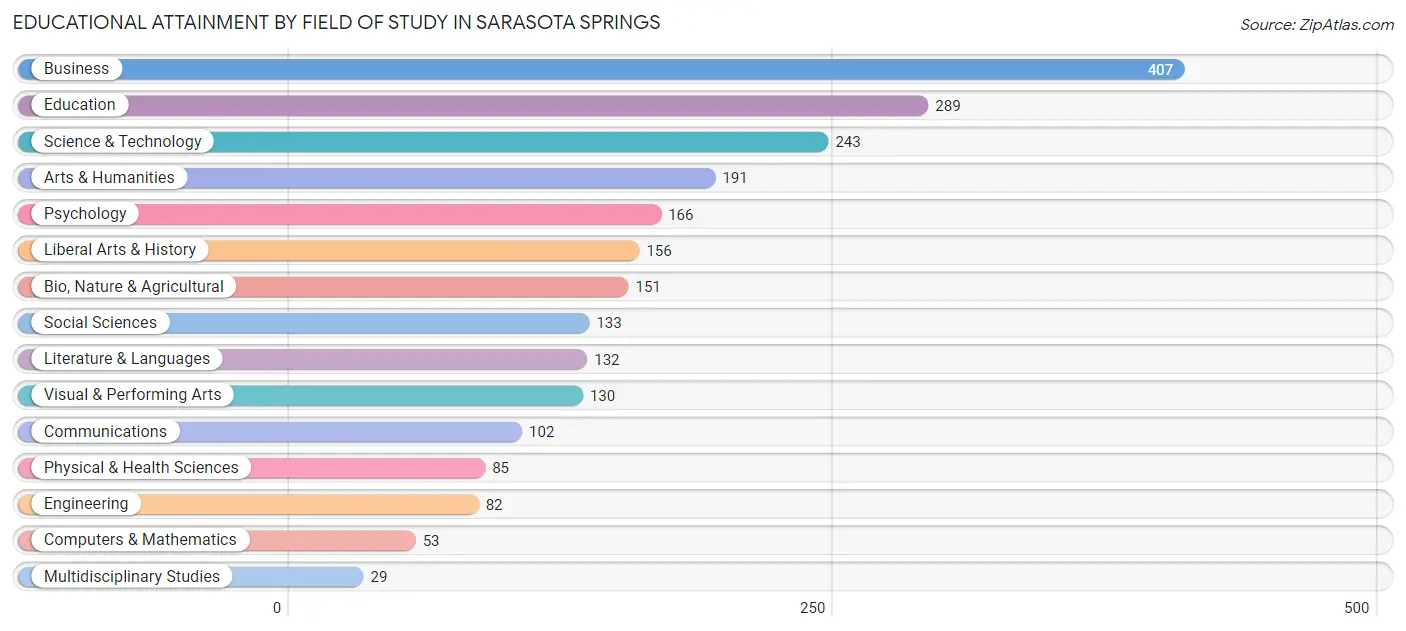
| Field of Study | # Graduates | % Graduates |
| Computers & Mathematics | 53 | 2.3% |
| Bio, Nature & Agricultural | 151 | 6.4% |
| Physical & Health Sciences | 85 | 3.6% |
| Psychology | 166 | 7.1% |
| Social Sciences | 133 | 5.7% |
| Engineering | 82 | 3.5% |
| Multidisciplinary Studies | 29 | 1.2% |
| Science & Technology | 243 | 10.3% |
| Business | 407 | 17.3% |
| Education | 289 | 12.3% |
| Literature & Languages | 132 | 5.6% |
| Liberal Arts & History | 156 | 6.6% |
| Visual & Performing Arts | 130 | 5.5% |
| Communications | 102 | 4.3% |
| Arts & Humanities | 191 | 8.1% |
| Total | 2,349 | 100.0% |
Transportation & Commute in Sarasota Springs
Vehicle Availability by Sex in Sarasota Springs
The most prevalent vehicle ownership categories in Sarasota Springs are males with 2 vehicles (1,582, accounting for 43.4%) and females with 2 vehicles (1,322, making up 46.3%).
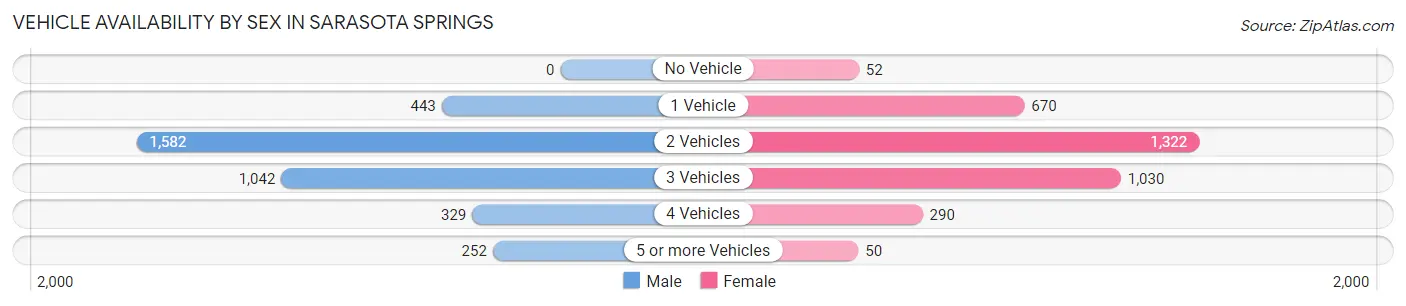
| Vehicles Available | Male | Female |
| No Vehicle | 0 (0.0%) | 52 (1.5%) |
| 1 Vehicle | 443 (12.1%) | 670 (19.6%) |
| 2 Vehicles | 1,582 (43.4%) | 1,322 (38.7%) |
| 3 Vehicles | 1,042 (28.6%) | 1,030 (30.2%) |
| 4 Vehicles | 329 (9.0%) | 290 (8.5%) |
| 5 or more Vehicles | 252 (6.9%) | 50 (1.5%) |
| Total | 3,648 (100.0%) | 3,414 (100.0%) |
Commute Time in Sarasota Springs
The most frequently occuring commute durations in Sarasota Springs are 20 to 24 minutes (1,849 commuters, 28.3%), 15 to 19 minutes (1,225 commuters, 18.8%), and 30 to 34 minutes (1,143 commuters, 17.5%).
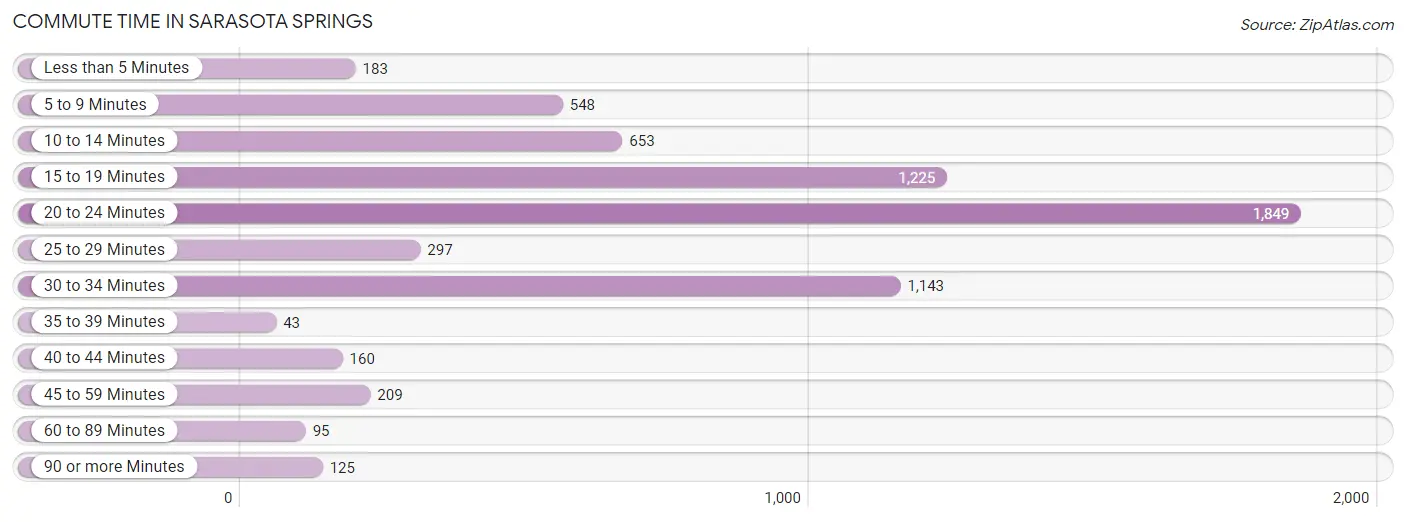
| Commute Time | # Commuters | % Commuters |
| Less than 5 Minutes | 183 | 2.8% |
| 5 to 9 Minutes | 548 | 8.4% |
| 10 to 14 Minutes | 653 | 10.0% |
| 15 to 19 Minutes | 1,225 | 18.8% |
| 20 to 24 Minutes | 1,849 | 28.3% |
| 25 to 29 Minutes | 297 | 4.5% |
| 30 to 34 Minutes | 1,143 | 17.5% |
| 35 to 39 Minutes | 43 | 0.7% |
| 40 to 44 Minutes | 160 | 2.5% |
| 45 to 59 Minutes | 209 | 3.2% |
| 60 to 89 Minutes | 95 | 1.5% |
| 90 or more Minutes | 125 | 1.9% |
Commute Time by Sex in Sarasota Springs
The most common commute times in Sarasota Springs are 20 to 24 minutes (858 commuters, 25.1%) for males and 20 to 24 minutes (991 commuters, 31.9%) for females.

| Commute Time | Male | Female |
| Less than 5 Minutes | 38 (1.1%) | 145 (4.7%) |
| 5 to 9 Minutes | 382 (11.2%) | 166 (5.3%) |
| 10 to 14 Minutes | 333 (9.7%) | 320 (10.3%) |
| 15 to 19 Minutes | 486 (14.2%) | 739 (23.8%) |
| 20 to 24 Minutes | 858 (25.1%) | 991 (31.9%) |
| 25 to 29 Minutes | 156 (4.6%) | 141 (4.5%) |
| 30 to 34 Minutes | 826 (24.1%) | 317 (10.2%) |
| 35 to 39 Minutes | 23 (0.7%) | 20 (0.6%) |
| 40 to 44 Minutes | 80 (2.3%) | 80 (2.6%) |
| 45 to 59 Minutes | 109 (3.2%) | 100 (3.2%) |
| 60 to 89 Minutes | 61 (1.8%) | 34 (1.1%) |
| 90 or more Minutes | 69 (2.0%) | 56 (1.8%) |
Time of Departure to Work by Sex in Sarasota Springs
The most frequent times of departure to work in Sarasota Springs are 7:00 AM to 7:29 AM (543, 15.9%) for males and 7:00 AM to 7:29 AM (515, 16.6%) for females.
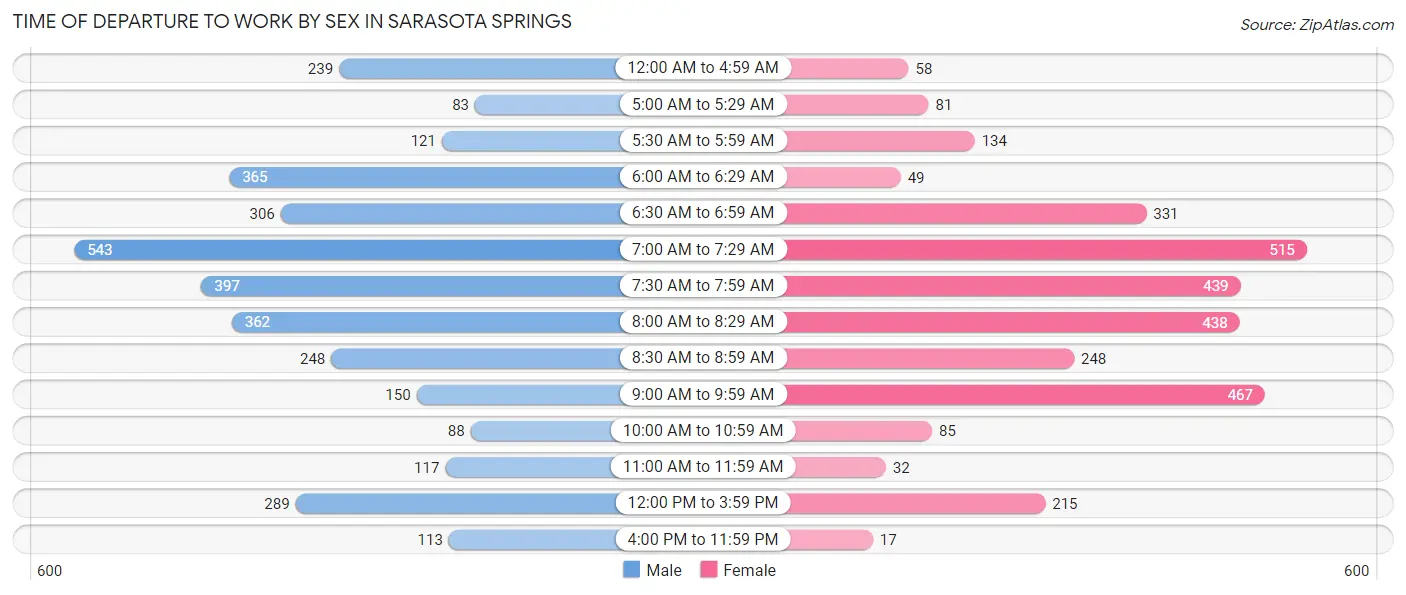
| Time of Departure | Male | Female |
| 12:00 AM to 4:59 AM | 239 (7.0%) | 58 (1.9%) |
| 5:00 AM to 5:29 AM | 83 (2.4%) | 81 (2.6%) |
| 5:30 AM to 5:59 AM | 121 (3.5%) | 134 (4.3%) |
| 6:00 AM to 6:29 AM | 365 (10.7%) | 49 (1.6%) |
| 6:30 AM to 6:59 AM | 306 (8.9%) | 331 (10.6%) |
| 7:00 AM to 7:29 AM | 543 (15.9%) | 515 (16.6%) |
| 7:30 AM to 7:59 AM | 397 (11.6%) | 439 (14.1%) |
| 8:00 AM to 8:29 AM | 362 (10.6%) | 438 (14.1%) |
| 8:30 AM to 8:59 AM | 248 (7.2%) | 248 (8.0%) |
| 9:00 AM to 9:59 AM | 150 (4.4%) | 467 (15.0%) |
| 10:00 AM to 10:59 AM | 88 (2.6%) | 85 (2.7%) |
| 11:00 AM to 11:59 AM | 117 (3.4%) | 32 (1.0%) |
| 12:00 PM to 3:59 PM | 289 (8.5%) | 215 (6.9%) |
| 4:00 PM to 11:59 PM | 113 (3.3%) | 17 (0.5%) |
| Total | 3,421 (100.0%) | 3,109 (100.0%) |
Housing Occupancy in Sarasota Springs
Occupancy by Ownership in Sarasota Springs
Of the total 4,624 dwellings in Sarasota Springs, owner-occupied units account for 3,627 (78.4%), while renter-occupied units make up 997 (21.6%).
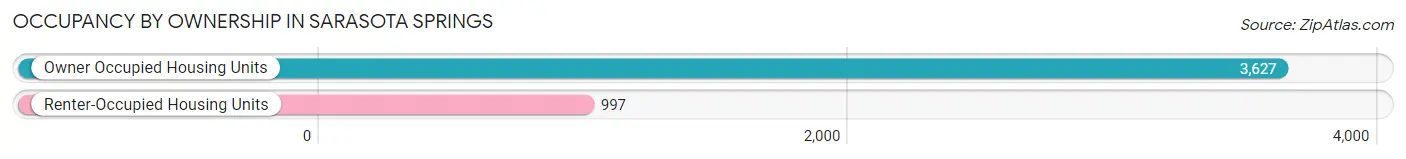
| Occupancy | # Housing Units | % Housing Units |
| Owner Occupied Housing Units | 3,627 | 78.4% |
| Renter-Occupied Housing Units | 997 | 21.6% |
| Total Occupied Housing Units | 4,624 | 100.0% |
Occupancy by Household Size in Sarasota Springs
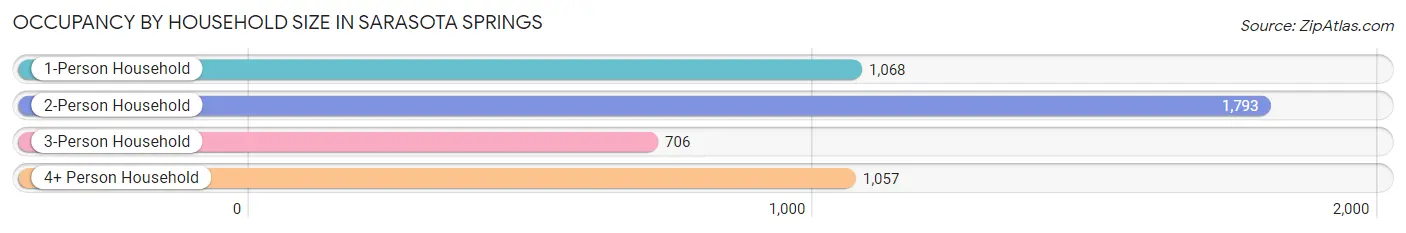
| Household Size | # Housing Units | % Housing Units |
| 1-Person Household | 1,068 | 23.1% |
| 2-Person Household | 1,793 | 38.8% |
| 3-Person Household | 706 | 15.3% |
| 4+ Person Household | 1,057 | 22.9% |
| Total Housing Units | 4,624 | 100.0% |
Occupancy by Ownership by Household Size in Sarasota Springs
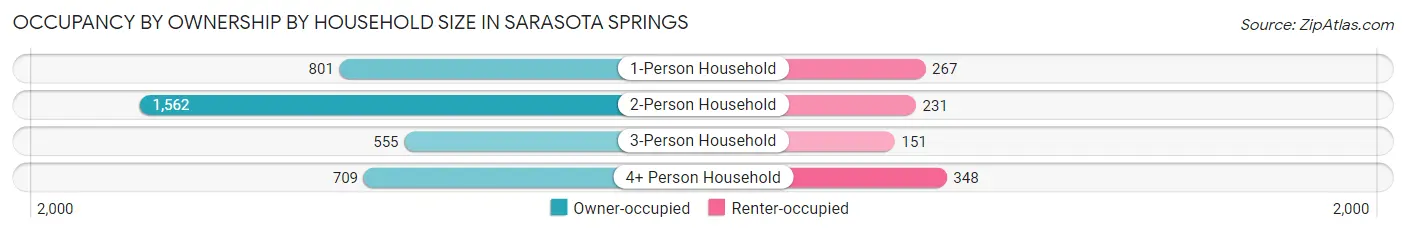
| Household Size | Owner-occupied | Renter-occupied |
| 1-Person Household | 801 (75.0%) | 267 (25.0%) |
| 2-Person Household | 1,562 (87.1%) | 231 (12.9%) |
| 3-Person Household | 555 (78.6%) | 151 (21.4%) |
| 4+ Person Household | 709 (67.1%) | 348 (32.9%) |
| Total Housing Units | 3,627 (78.4%) | 997 (21.6%) |
Occupancy by Educational Attainment in Sarasota Springs
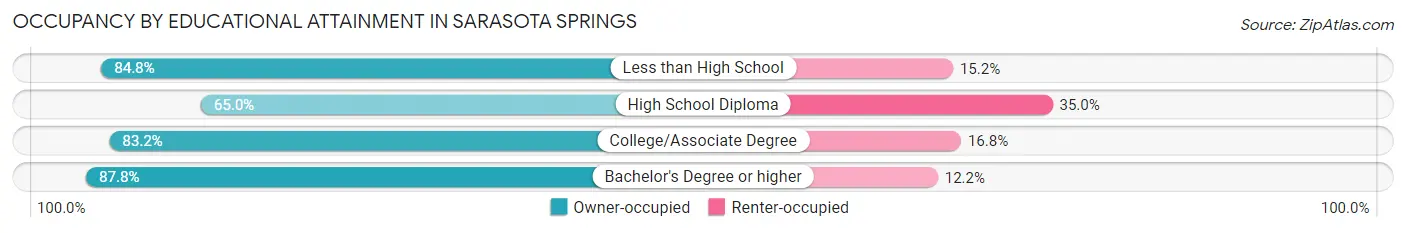
| Household Size | Owner-occupied | Renter-occupied |
| Less than High School | 217 (84.8%) | 39 (15.2%) |
| High School Diploma | 1,001 (65.0%) | 538 (35.0%) |
| College/Associate Degree | 1,345 (83.2%) | 272 (16.8%) |
| Bachelor's Degree or higher | 1,064 (87.8%) | 148 (12.2%) |
Occupancy by Age of Householder in Sarasota Springs
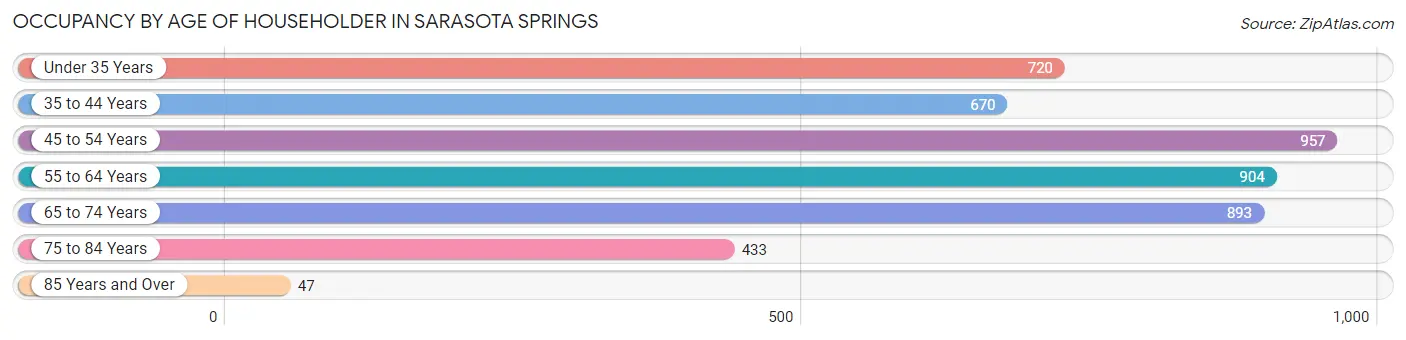
| Age Bracket | # Households | % Households |
| Under 35 Years | 720 | 15.6% |
| 35 to 44 Years | 670 | 14.5% |
| 45 to 54 Years | 957 | 20.7% |
| 55 to 64 Years | 904 | 19.6% |
| 65 to 74 Years | 893 | 19.3% |
| 75 to 84 Years | 433 | 9.4% |
| 85 Years and Over | 47 | 1.0% |
| Total | 4,624 | 100.0% |
Housing Finances in Sarasota Springs
Median Income by Occupancy in Sarasota Springs
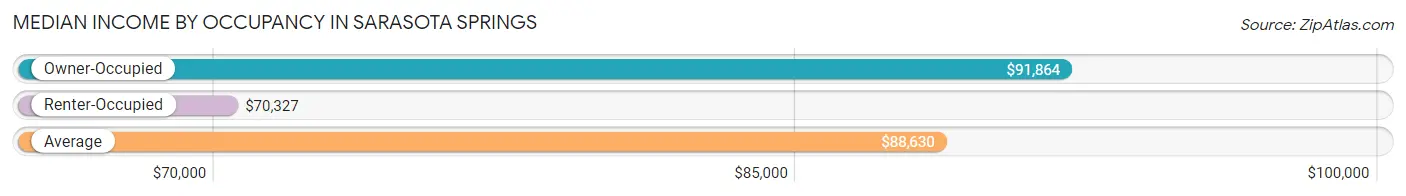
| Occupancy Type | # Households | Median Income |
| Owner-Occupied | 3,627 (78.4%) | $91,864 |
| Renter-Occupied | 997 (21.6%) | $70,327 |
| Average | 4,624 (100.0%) | $88,630 |
Occupancy by Householder Income Bracket in Sarasota Springs
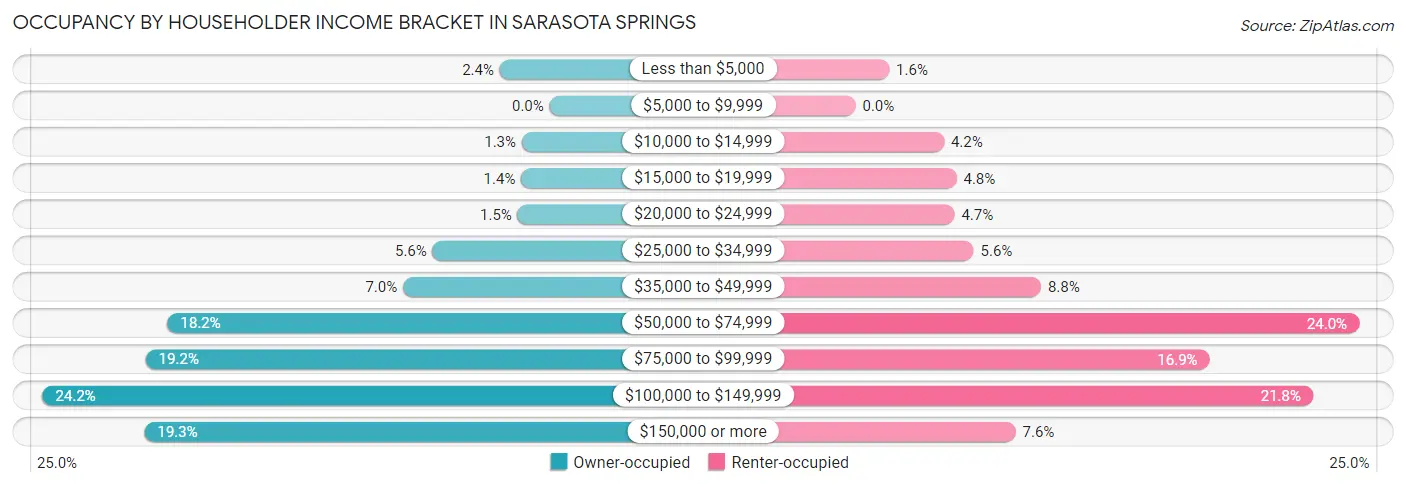
| Income Bracket | Owner-occupied | Renter-occupied |
| Less than $5,000 | 86 (2.4%) | 16 (1.6%) |
| $5,000 to $9,999 | 0 (0.0%) | 0 (0.0%) |
| $10,000 to $14,999 | 48 (1.3%) | 42 (4.2%) |
| $15,000 to $19,999 | 49 (1.3%) | 48 (4.8%) |
| $20,000 to $24,999 | 55 (1.5%) | 47 (4.7%) |
| $25,000 to $34,999 | 202 (5.6%) | 56 (5.6%) |
| $35,000 to $49,999 | 253 (7.0%) | 88 (8.8%) |
| $50,000 to $74,999 | 660 (18.2%) | 239 (24.0%) |
| $75,000 to $99,999 | 698 (19.2%) | 168 (16.9%) |
| $100,000 to $149,999 | 876 (24.1%) | 217 (21.8%) |
| $150,000 or more | 700 (19.3%) | 76 (7.6%) |
| Total | 3,627 (100.0%) | 997 (100.0%) |
Monthly Housing Cost Tiers in Sarasota Springs
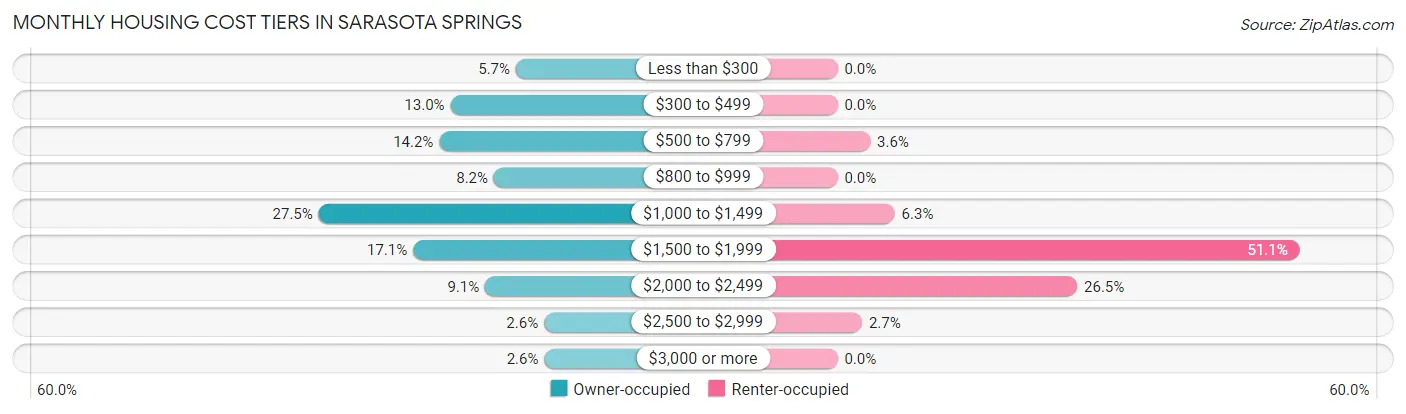
| Monthly Cost | Owner-occupied | Renter-occupied |
| Less than $300 | 208 (5.7%) | 0 (0.0%) |
| $300 to $499 | 470 (13.0%) | 0 (0.0%) |
| $500 to $799 | 515 (14.2%) | 36 (3.6%) |
| $800 to $999 | 296 (8.2%) | 0 (0.0%) |
| $1,000 to $1,499 | 998 (27.5%) | 63 (6.3%) |
| $1,500 to $1,999 | 620 (17.1%) | 509 (51.0%) |
| $2,000 to $2,499 | 331 (9.1%) | 264 (26.5%) |
| $2,500 to $2,999 | 95 (2.6%) | 27 (2.7%) |
| $3,000 or more | 94 (2.6%) | 0 (0.0%) |
| Total | 3,627 (100.0%) | 997 (100.0%) |
Physical Housing Characteristics in Sarasota Springs
Housing Structures in Sarasota Springs
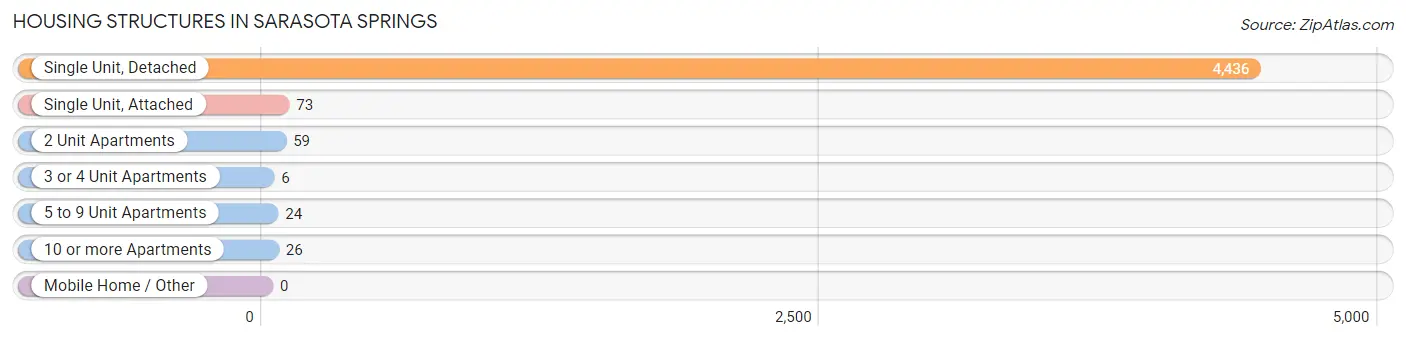
| Structure Type | # Housing Units | % Housing Units |
| Single Unit, Detached | 4,436 | 95.9% |
| Single Unit, Attached | 73 | 1.6% |
| 2 Unit Apartments | 59 | 1.3% |
| 3 or 4 Unit Apartments | 6 | 0.1% |
| 5 to 9 Unit Apartments | 24 | 0.5% |
| 10 or more Apartments | 26 | 0.6% |
| Mobile Home / Other | 0 | 0.0% |
| Total | 4,624 | 100.0% |
Housing Structures by Occupancy in Sarasota Springs
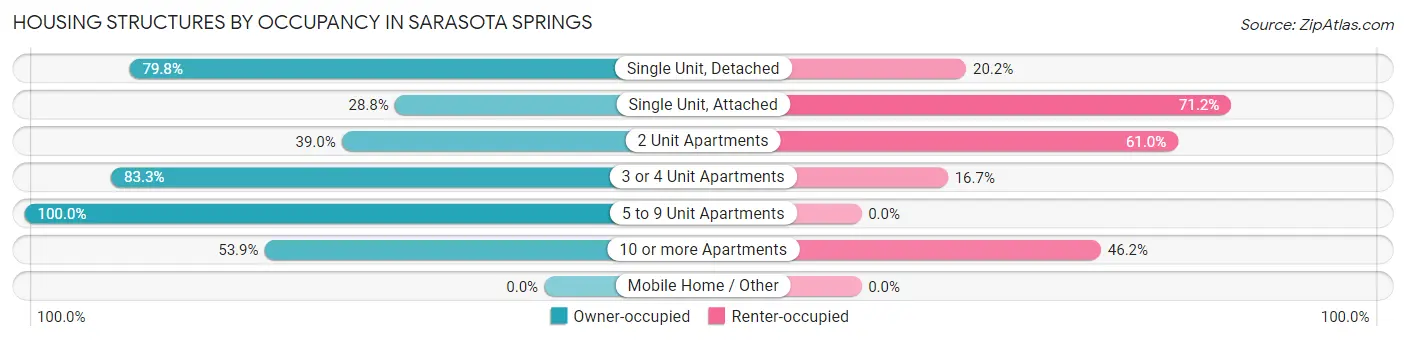
| Structure Type | Owner-occupied | Renter-occupied |
| Single Unit, Detached | 3,540 (79.8%) | 896 (20.2%) |
| Single Unit, Attached | 21 (28.8%) | 52 (71.2%) |
| 2 Unit Apartments | 23 (39.0%) | 36 (61.0%) |
| 3 or 4 Unit Apartments | 5 (83.3%) | 1 (16.7%) |
| 5 to 9 Unit Apartments | 24 (100.0%) | 0 (0.0%) |
| 10 or more Apartments | 14 (53.8%) | 12 (46.2%) |
| Mobile Home / Other | 0 (0.0%) | 0 (0.0%) |
| Total | 3,627 (78.4%) | 997 (21.6%) |
Housing Structures by Number of Rooms in Sarasota Springs
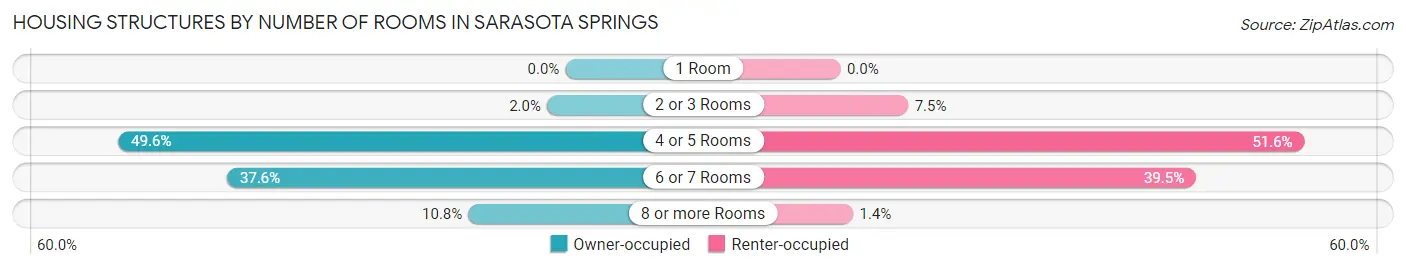
| Number of Rooms | Owner-occupied | Renter-occupied |
| 1 Room | 0 (0.0%) | 0 (0.0%) |
| 2 or 3 Rooms | 74 (2.0%) | 75 (7.5%) |
| 4 or 5 Rooms | 1,800 (49.6%) | 514 (51.5%) |
| 6 or 7 Rooms | 1,362 (37.6%) | 394 (39.5%) |
| 8 or more Rooms | 391 (10.8%) | 14 (1.4%) |
| Total | 3,627 (100.0%) | 997 (100.0%) |
Housing Structure by Heating Type in Sarasota Springs
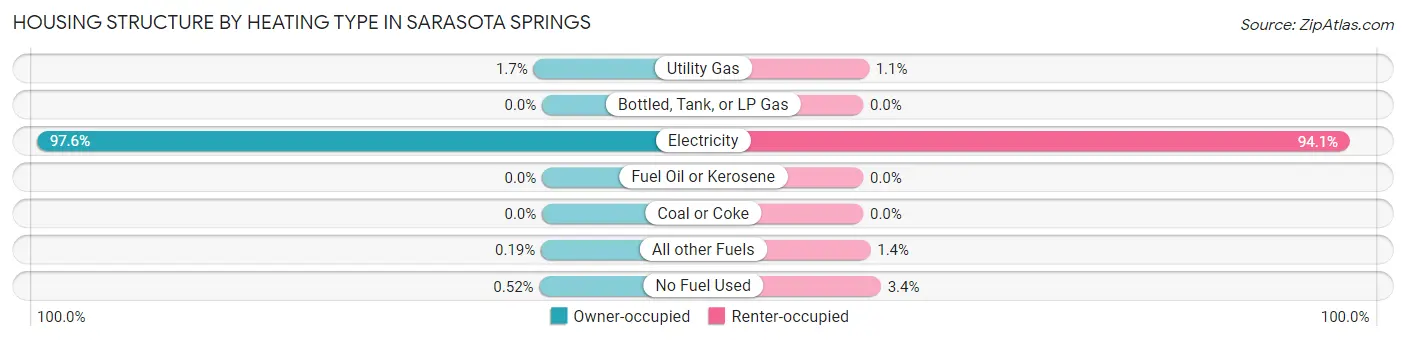
| Heating Type | Owner-occupied | Renter-occupied |
| Utility Gas | 60 (1.7%) | 11 (1.1%) |
| Bottled, Tank, or LP Gas | 0 (0.0%) | 0 (0.0%) |
| Electricity | 3,541 (97.6%) | 938 (94.1%) |
| Fuel Oil or Kerosene | 0 (0.0%) | 0 (0.0%) |
| Coal or Coke | 0 (0.0%) | 0 (0.0%) |
| All other Fuels | 7 (0.2%) | 14 (1.4%) |
| No Fuel Used | 19 (0.5%) | 34 (3.4%) |
| Total | 3,627 (100.0%) | 997 (100.0%) |
Household Vehicle Usage in Sarasota Springs
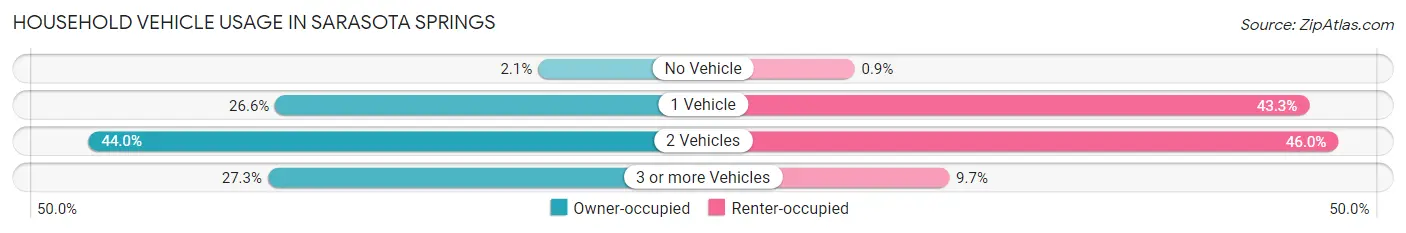
| Vehicles per Household | Owner-occupied | Renter-occupied |
| No Vehicle | 75 (2.1%) | 9 (0.9%) |
| 1 Vehicle | 965 (26.6%) | 432 (43.3%) |
| 2 Vehicles | 1,597 (44.0%) | 459 (46.0%) |
| 3 or more Vehicles | 990 (27.3%) | 97 (9.7%) |
| Total | 3,627 (100.0%) | 997 (100.0%) |
Real Estate & Mortgages in Sarasota Springs
Real Estate and Mortgage Overview in Sarasota Springs
| Characteristic | Without Mortgage | With Mortgage |
| Housing Units | 1,267 | 2,360 |
| Median Property Value | $295,300 | $267,400 |
| Median Household Income | $85,347 | $395 |
| Monthly Housing Costs | $486 | $79 |
| Real Estate Taxes | $1,708 | $41 |
Property Value by Mortgage Status in Sarasota Springs
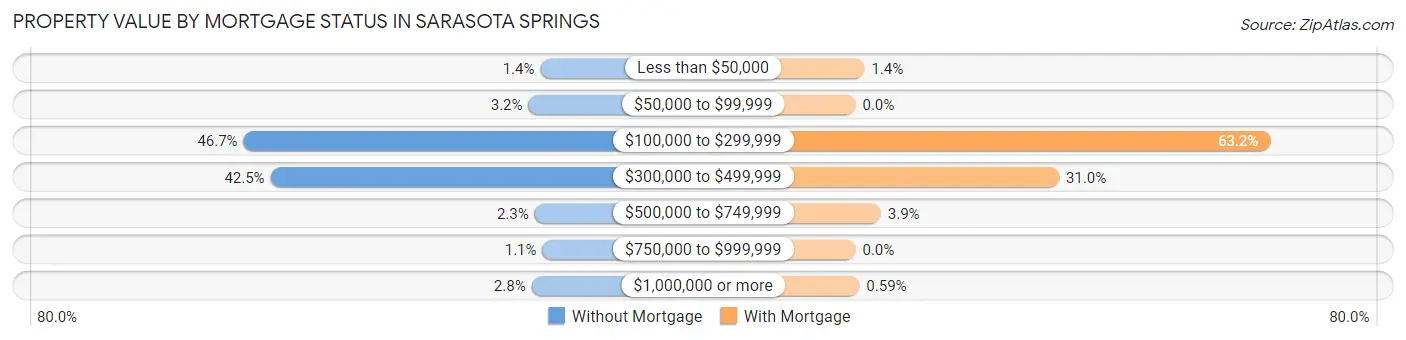
| Property Value | Without Mortgage | With Mortgage |
| Less than $50,000 | 18 (1.4%) | 32 (1.4%) |
| $50,000 to $99,999 | 41 (3.2%) | 0 (0.0%) |
| $100,000 to $299,999 | 591 (46.7%) | 1,491 (63.2%) |
| $300,000 to $499,999 | 539 (42.5%) | 732 (31.0%) |
| $500,000 to $749,999 | 29 (2.3%) | 91 (3.9%) |
| $750,000 to $999,999 | 14 (1.1%) | 0 (0.0%) |
| $1,000,000 or more | 35 (2.8%) | 14 (0.6%) |
| Total | 1,267 (100.0%) | 2,360 (100.0%) |
Household Income by Mortgage Status in Sarasota Springs
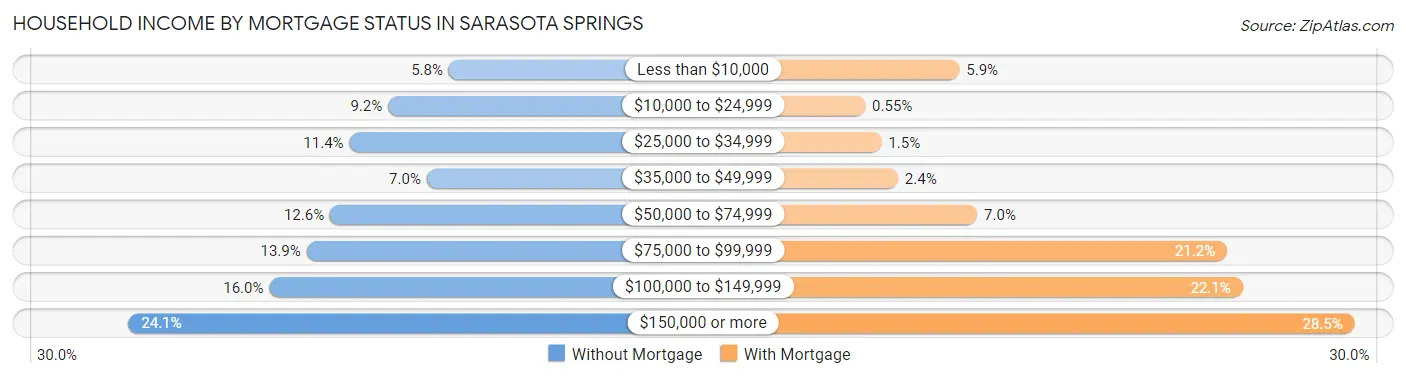
| Household Income | Without Mortgage | With Mortgage |
| Less than $10,000 | 73 (5.8%) | 140 (5.9%) |
| $10,000 to $24,999 | 117 (9.2%) | 13 (0.5%) |
| $25,000 to $34,999 | 145 (11.4%) | 35 (1.5%) |
| $35,000 to $49,999 | 89 (7.0%) | 57 (2.4%) |
| $50,000 to $74,999 | 159 (12.6%) | 164 (7.0%) |
| $75,000 to $99,999 | 176 (13.9%) | 501 (21.2%) |
| $100,000 to $149,999 | 203 (16.0%) | 522 (22.1%) |
| $150,000 or more | 305 (24.1%) | 673 (28.5%) |
| Total | 1,267 (100.0%) | 2,360 (100.0%) |
Property Value to Household Income Ratio in Sarasota Springs
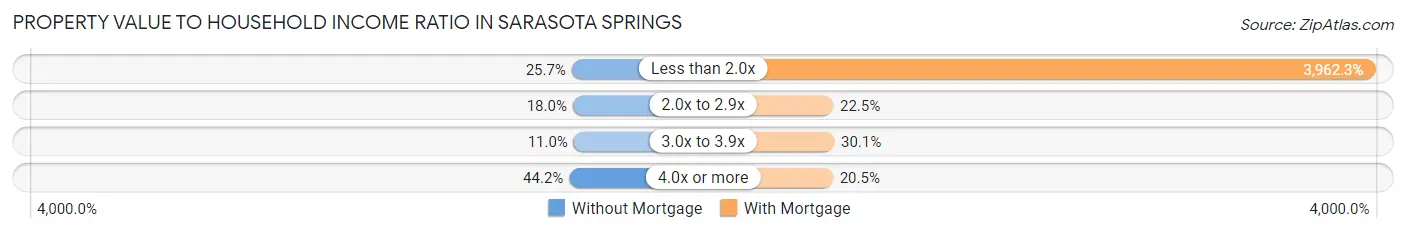
| Value-to-Income Ratio | Without Mortgage | With Mortgage |
| Less than 2.0x | 326 (25.7%) | 93,509 (3,962.3%) |
| 2.0x to 2.9x | 228 (18.0%) | 532 (22.5%) |
| 3.0x to 3.9x | 139 (11.0%) | 711 (30.1%) |
| 4.0x or more | 560 (44.2%) | 483 (20.5%) |
| Total | 1,267 (100.0%) | 2,360 (100.0%) |
Real Estate Taxes by Mortgage Status in Sarasota Springs
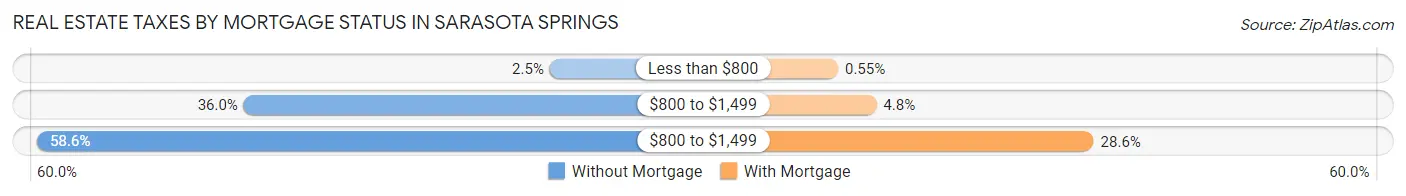
| Property Taxes | Without Mortgage | With Mortgage |
| Less than $800 | 31 (2.5%) | 13 (0.5%) |
| $800 to $1,499 | 456 (36.0%) | 112 (4.8%) |
| $800 to $1,499 | 743 (58.6%) | 674 (28.6%) |
| Total | 1,267 (100.0%) | 2,360 (100.0%) |
Health & Disability in Sarasota Springs
Health Insurance Coverage by Age in Sarasota Springs
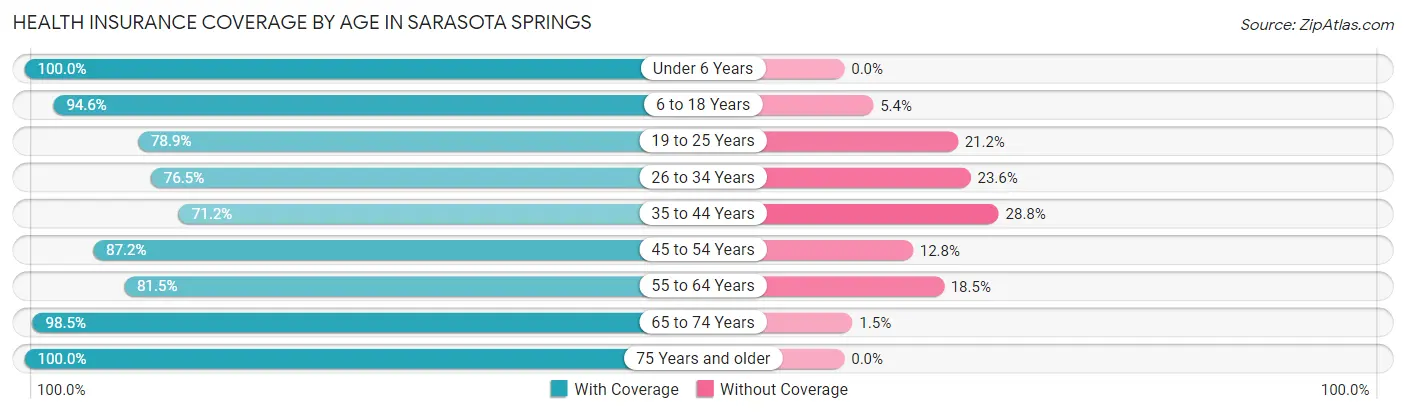
| Age Bracket | With Coverage | Without Coverage |
| Under 6 Years | 482 (100.0%) | 0 (0.0%) |
| 6 to 18 Years | 2,385 (94.6%) | 136 (5.4%) |
| 19 to 25 Years | 589 (78.8%) | 158 (21.1%) |
| 26 to 34 Years | 1,201 (76.4%) | 370 (23.5%) |
| 35 to 44 Years | 1,173 (71.2%) | 474 (28.8%) |
| 45 to 54 Years | 1,420 (87.2%) | 208 (12.8%) |
| 55 to 64 Years | 1,498 (81.5%) | 341 (18.5%) |
| 65 to 74 Years | 1,367 (98.5%) | 21 (1.5%) |
| 75 Years and older | 677 (100.0%) | 0 (0.0%) |
| Total | 10,792 (86.3%) | 1,708 (13.7%) |
Health Insurance Coverage by Citizenship Status in Sarasota Springs
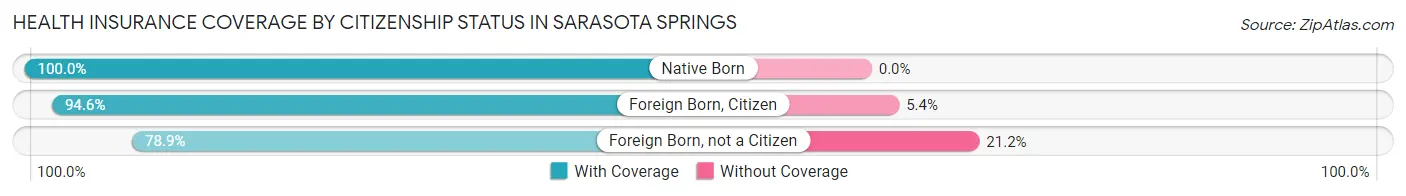
| Citizenship Status | With Coverage | Without Coverage |
| Native Born | 482 (100.0%) | 0 (0.0%) |
| Foreign Born, Citizen | 2,385 (94.6%) | 136 (5.4%) |
| Foreign Born, not a Citizen | 589 (78.8%) | 158 (21.1%) |
Health Insurance Coverage by Household Income in Sarasota Springs
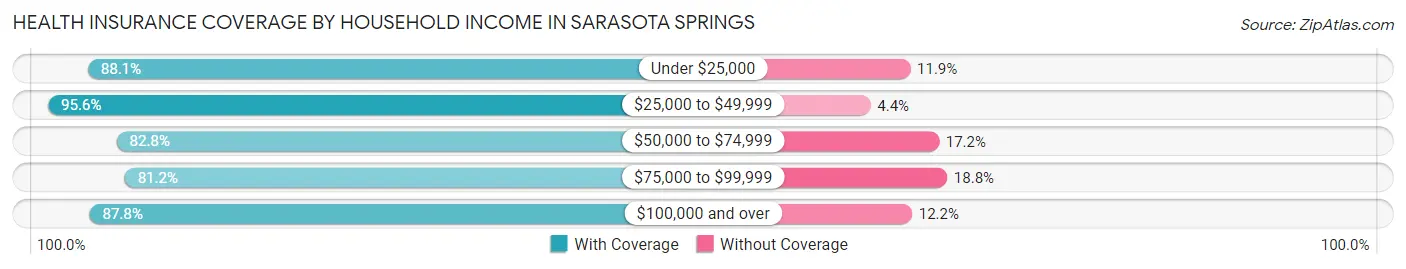
| Household Income | With Coverage | Without Coverage |
| Under $25,000 | 468 (88.1%) | 63 (11.9%) |
| $25,000 to $49,999 | 1,105 (95.6%) | 51 (4.4%) |
| $50,000 to $74,999 | 1,848 (82.8%) | 385 (17.2%) |
| $75,000 to $99,999 | 2,022 (81.2%) | 467 (18.8%) |
| $100,000 and over | 5,349 (87.8%) | 742 (12.2%) |
Public vs Private Health Insurance Coverage by Age in Sarasota Springs
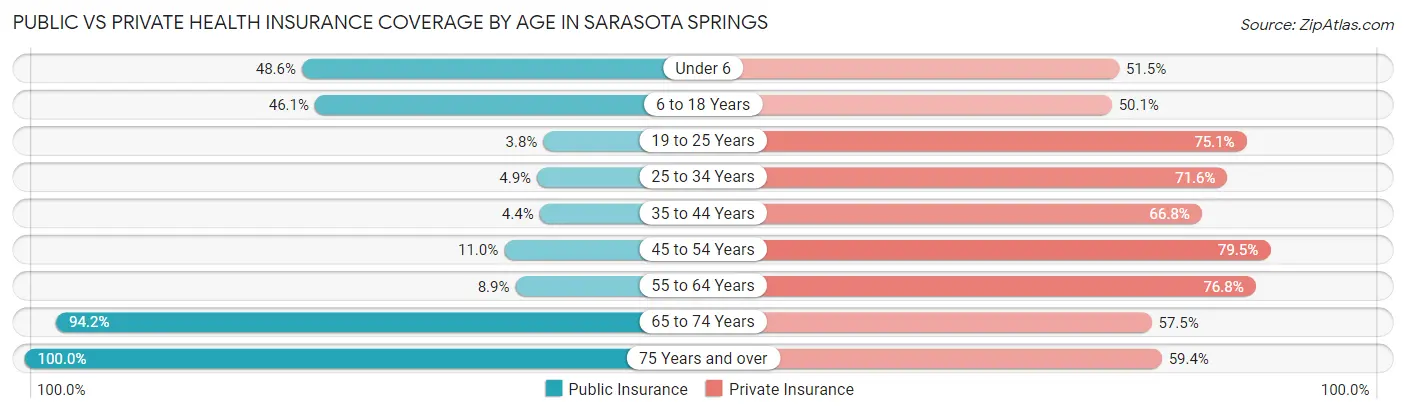
| Age Bracket | Public Insurance | Private Insurance |
| Under 6 | 234 (48.5%) | 248 (51.4%) |
| 6 to 18 Years | 1,163 (46.1%) | 1,263 (50.1%) |
| 19 to 25 Years | 28 (3.7%) | 561 (75.1%) |
| 25 to 34 Years | 77 (4.9%) | 1,124 (71.6%) |
| 35 to 44 Years | 73 (4.4%) | 1,100 (66.8%) |
| 45 to 54 Years | 179 (11.0%) | 1,294 (79.5%) |
| 55 to 64 Years | 164 (8.9%) | 1,412 (76.8%) |
| 65 to 74 Years | 1,307 (94.2%) | 798 (57.5%) |
| 75 Years and over | 677 (100.0%) | 402 (59.4%) |
| Total | 3,902 (31.2%) | 8,202 (65.6%) |
Disability Status by Sex by Age in Sarasota Springs
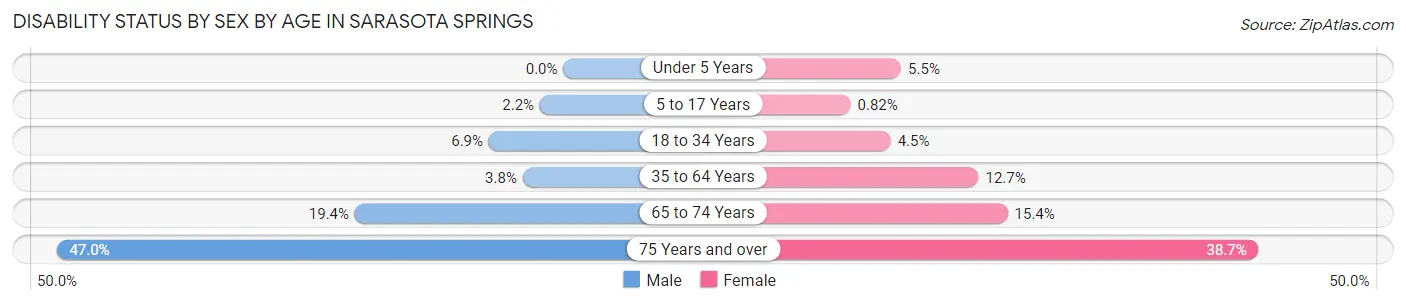
| Age Bracket | Male | Female |
| Under 5 Years | 0 (0.0%) | 13 (5.5%) |
| 5 to 17 Years | 28 (2.2%) | 9 (0.8%) |
| 18 to 34 Years | 93 (6.9%) | 54 (4.5%) |
| 35 to 64 Years | 92 (3.8%) | 339 (12.7%) |
| 65 to 74 Years | 114 (19.4%) | 123 (15.4%) |
| 75 Years and over | 119 (47.0%) | 164 (38.7%) |
Disability Class by Sex by Age in Sarasota Springs
Disability Class: Hearing Difficulty
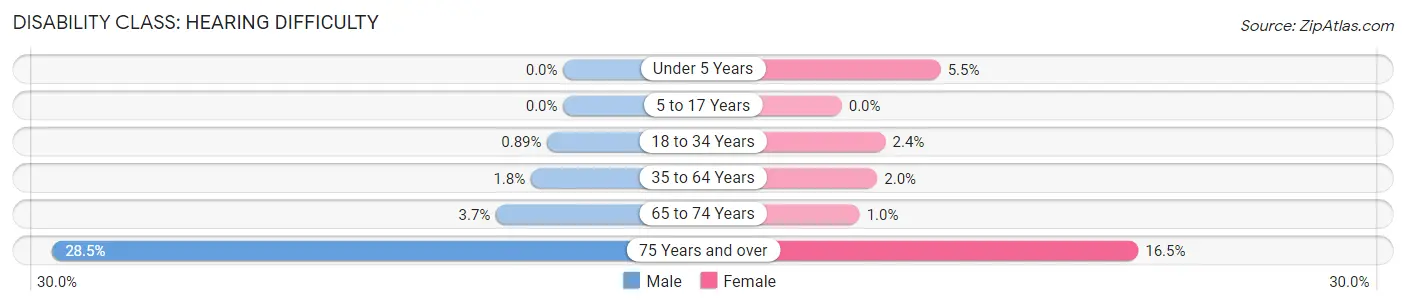
| Age Bracket | Male | Female |
| Under 5 Years | 0 (0.0%) | 13 (5.5%) |
| 5 to 17 Years | 0 (0.0%) | 0 (0.0%) |
| 18 to 34 Years | 12 (0.9%) | 29 (2.4%) |
| 35 to 64 Years | 44 (1.8%) | 53 (2.0%) |
| 65 to 74 Years | 22 (3.7%) | 8 (1.0%) |
| 75 Years and over | 72 (28.5%) | 70 (16.5%) |
Disability Class: Vision Difficulty
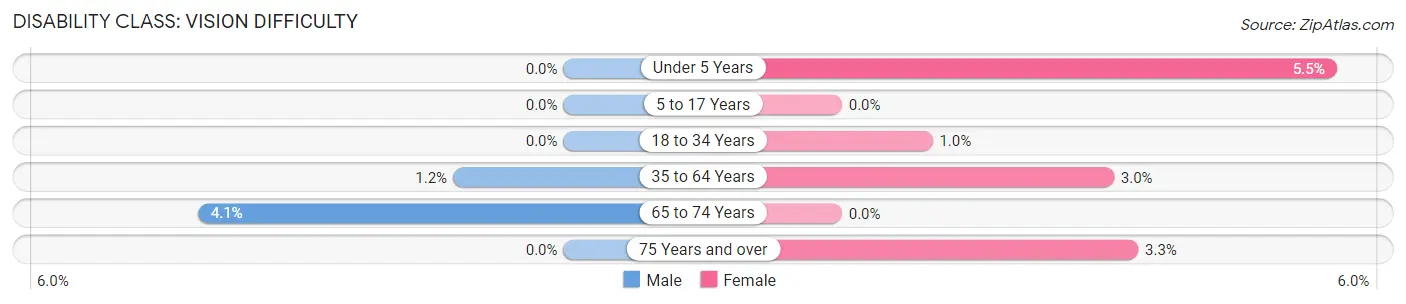
| Age Bracket | Male | Female |
| Under 5 Years | 0 (0.0%) | 13 (5.5%) |
| 5 to 17 Years | 0 (0.0%) | 0 (0.0%) |
| 18 to 34 Years | 0 (0.0%) | 12 (1.0%) |
| 35 to 64 Years | 30 (1.2%) | 81 (3.0%) |
| 65 to 74 Years | 24 (4.1%) | 0 (0.0%) |
| 75 Years and over | 0 (0.0%) | 14 (3.3%) |
Disability Class: Cognitive Difficulty
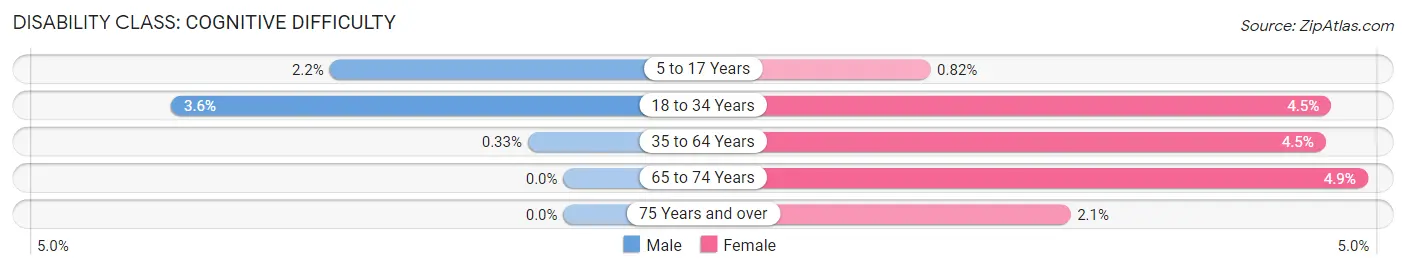
| Age Bracket | Male | Female |
| 5 to 17 Years | 28 (2.2%) | 9 (0.8%) |
| 18 to 34 Years | 49 (3.6%) | 54 (4.5%) |
| 35 to 64 Years | 8 (0.3%) | 120 (4.5%) |
| 65 to 74 Years | 0 (0.0%) | 39 (4.9%) |
| 75 Years and over | 0 (0.0%) | 9 (2.1%) |
Disability Class: Ambulatory Difficulty
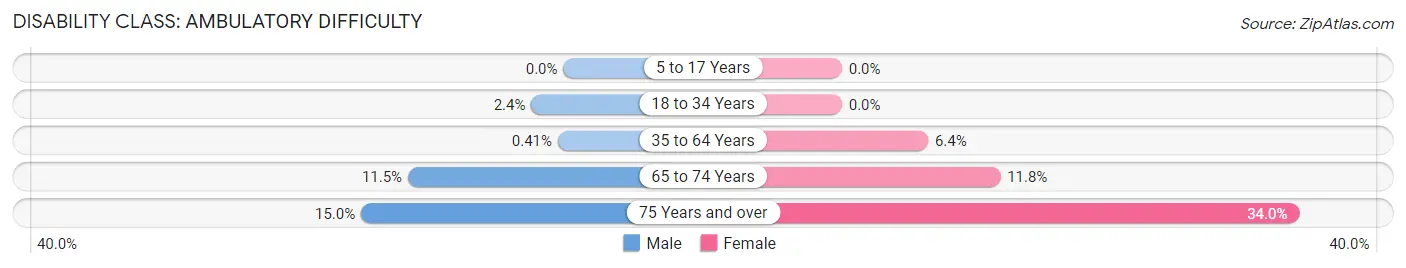
| Age Bracket | Male | Female |
| 5 to 17 Years | 0 (0.0%) | 0 (0.0%) |
| 18 to 34 Years | 32 (2.4%) | 0 (0.0%) |
| 35 to 64 Years | 10 (0.4%) | 171 (6.4%) |
| 65 to 74 Years | 68 (11.5%) | 94 (11.8%) |
| 75 Years and over | 38 (15.0%) | 144 (34.0%) |
Disability Class: Self-Care Difficulty
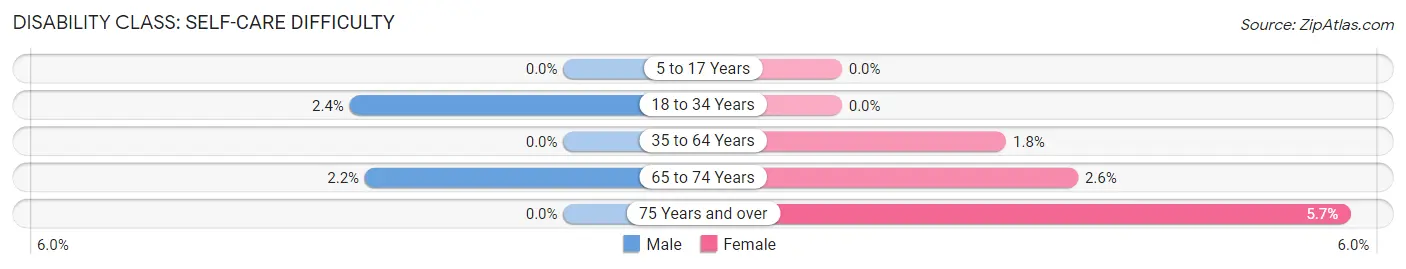
| Age Bracket | Male | Female |
| 5 to 17 Years | 0 (0.0%) | 0 (0.0%) |
| 18 to 34 Years | 32 (2.4%) | 0 (0.0%) |
| 35 to 64 Years | 0 (0.0%) | 49 (1.8%) |
| 65 to 74 Years | 13 (2.2%) | 21 (2.6%) |
| 75 Years and over | 0 (0.0%) | 24 (5.7%) |
Technology Access in Sarasota Springs
Computing Device Access in Sarasota Springs
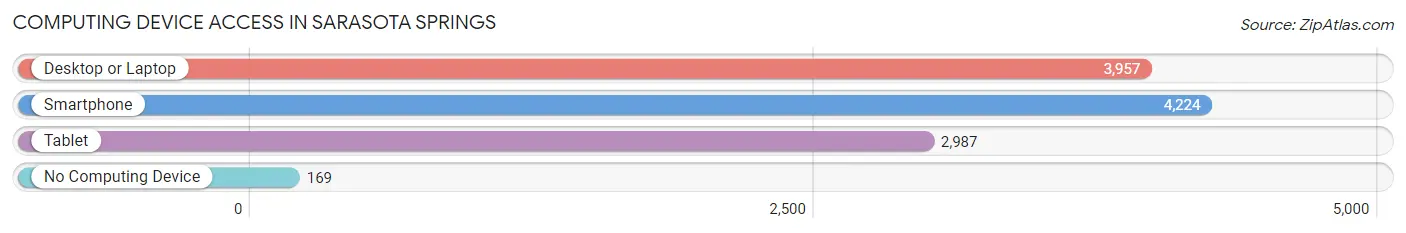
| Device Type | # Households | % Households |
| Desktop or Laptop | 3,957 | 85.6% |
| Smartphone | 4,224 | 91.3% |
| Tablet | 2,987 | 64.6% |
| No Computing Device | 169 | 3.6% |
| Total | 4,624 | 100.0% |
Internet Access in Sarasota Springs
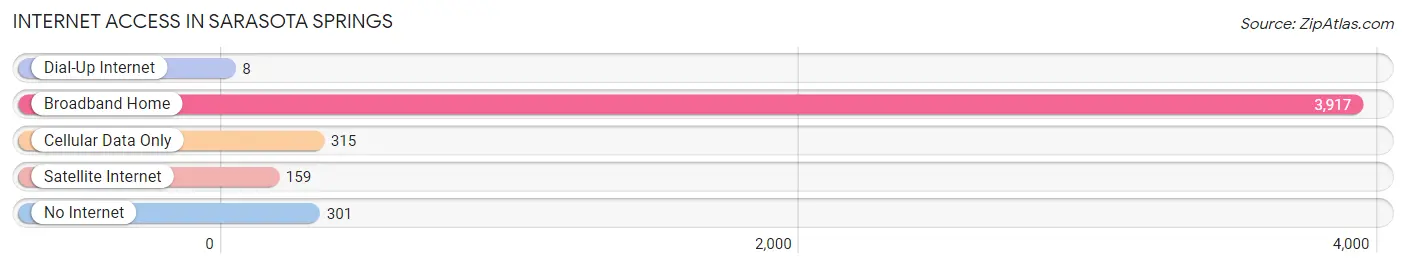
| Internet Type | # Households | % Households |
| Dial-Up Internet | 8 | 0.2% |
| Broadband Home | 3,917 | 84.7% |
| Cellular Data Only | 315 | 6.8% |
| Satellite Internet | 159 | 3.4% |
| No Internet | 301 | 6.5% |
| Total | 4,624 | 100.0% |
Sarasota Springs Summary
Sarasota Springs, Florida is a city located in Sarasota County, Florida, United States. It is located on the Gulf Coast of Florida, about 60 miles south of Tampa. The city is part of the Bradenton-Sarasota-Venice Metropolitan Statistical Area. As of the 2010 census, the city had a population of 51,917.
History
Sarasota Springs was founded in 1885 by John Hamilton Gillespie, a Scottish immigrant who had moved to the area from New York. He purchased land from the Seminole Indians and began to develop the area. The city was originally called Gillespieville, but the name was changed to Sarasota Springs in 1887.
The city grew rapidly in the early 1900s, and by 1910 it had a population of 1,500. The city was incorporated in 1911, and by 1920 the population had grown to 3,000.
In the 1920s, Sarasota Springs became a popular tourist destination, and many wealthy people built large homes in the area. The city was also home to a number of celebrities, including John D. Rockefeller, Thomas Edison, and John Ringling.
In the 1950s, the city began to experience a population decline as people moved away to other parts of Florida. However, the city has seen a resurgence in recent years, and the population has grown to over 50,000.
Geography
Sarasota Springs is located in the central part of Sarasota County, on the Gulf Coast of Florida. The city is bordered by the cities of Bradenton to the north, Venice to the south, and North Port to the east.
The city covers an area of 24.3 square miles, and has a population density of 2,093 people per square mile. The city is located at an elevation of 15 feet above sea level.
Economy
Sarasota Springs has a diverse economy, with a number of industries providing employment opportunities. The city is home to a number of large companies, including Sarasota Memorial Hospital, Sarasota County Government, and the University of South Florida.
The city is also home to a number of smaller businesses, including restaurants, retail stores, and professional services. Tourism is also an important part of the city's economy, with many people visiting the area for its beaches, golf courses, and other attractions.
Demographics
As of the 2010 census, the population of Sarasota Springs was 51,917. The racial makeup of the city was 79.2% White, 11.3% African American, 0.4% Native American, 2.2% Asian, 0.1% Pacific Islander, 4.2% from other races, and 2.7% from two or more races. Hispanic or Latino of any race were 11.3% of the population.
The median household income in the city was $45,945, and the median family income was $54,945. The per capita income was $25,945. About 11.3% of the population was below the poverty line.
Common Questions
What is Per Capita Income in Sarasota Springs?
Per Capita income in Sarasota Springs is $40,055.
What is the Median Family Income in Sarasota Springs?
Median Family Income in Sarasota Springs is $90,651.
What is the Median Household income in Sarasota Springs?
Median Household Income in Sarasota Springs is $88,630.
What is Income or Wage Gap in Sarasota Springs?
Income or Wage Gap in Sarasota Springs is 20.7%.
Women in Sarasota Springs earn 79.3 cents for every dollar earned by a man.
What is Inequality or Gini Index in Sarasota Springs?
Inequality or Gini Index in Sarasota Springs is 0.41.
What is the Total Population of Sarasota Springs?
Total Population of Sarasota Springs is 12,500.
What is the Total Male Population of Sarasota Springs?
Total Male Population of Sarasota Springs is 6,087.
What is the Total Female Population of Sarasota Springs?
Total Female Population of Sarasota Springs is 6,413.
What is the Ratio of Males per 100 Females in Sarasota Springs?
There are 94.92 Males per 100 Females in Sarasota Springs.
What is the Ratio of Females per 100 Males in Sarasota Springs?
There are 105.36 Females per 100 Males in Sarasota Springs.
What is the Median Population Age in Sarasota Springs?
Median Population Age in Sarasota Springs is 40.1 Years.
What is the Average Family Size in Sarasota Springs
Average Family Size in Sarasota Springs is 3.1 People.
What is the Average Household Size in Sarasota Springs
Average Household Size in Sarasota Springs is 2.7 People.
How Large is the Labor Force in Sarasota Springs?
There are 7,385 People in the Labor Forcein in Sarasota Springs.
What is the Percentage of People in the Labor Force in Sarasota Springs?
73.9% of People are in the Labor Force in Sarasota Springs.
What is the Unemployment Rate in Sarasota Springs?
Unemployment Rate in Sarasota Springs is 2.9%.