Vero Beach, FL Map & Demographics
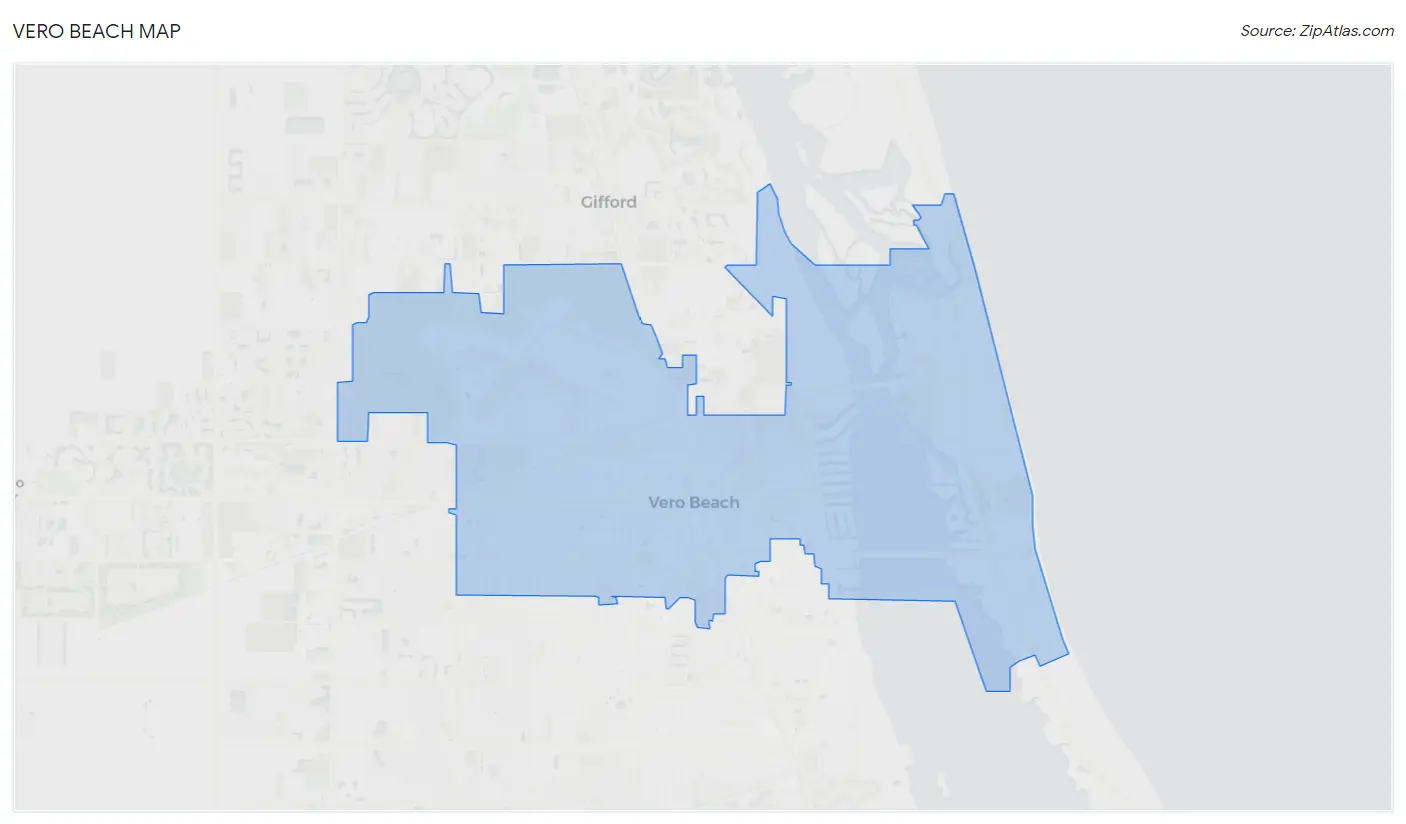
Vero Beach Map
Vero Beach Overview
$51,610
PER CAPITA INCOME
$81,828
AVG FAMILY INCOME
$59,335
AVG HOUSEHOLD INCOME
44.3%
WAGE / INCOME GAP [ % ]
55.7¢/ $1
WAGE / INCOME GAP [ $ ]
$11,034
FAMILY INCOME DEFICIT
0.57
INEQUALITY / GINI INDEX
16,531
TOTAL POPULATION
7,776
MALE POPULATION
8,755
FEMALE POPULATION
88.82
MALES / 100 FEMALES
112.59
FEMALES / 100 MALES
54.3
MEDIAN AGE
2.9
AVG FAMILY SIZE
2.1
AVG HOUSEHOLD SIZE
8,108
LABOR FORCE [ PEOPLE ]
55.4%
PERCENT IN LABOR FORCE
3.5%
UNEMPLOYMENT RATE
Vero Beach Area Codes
Income in Vero Beach
Income Overview in Vero Beach
Per Capita Income in Vero Beach is $51,610, while median incomes of families and households are $81,828 and $59,335 respectively.
| Characteristic | Number | Measure |
| Per Capita Income | 16,531 | $51,610 |
| Median Family Income | 3,788 | $81,828 |
| Mean Family Income | 3,788 | $143,171 |
| Median Household Income | 7,725 | $59,335 |
| Mean Household Income | 7,725 | $103,869 |
| Income Deficit | 3,788 | $11,034 |
| Wage / Income Gap (%) | 16,531 | 44.27% |
| Wage / Income Gap ($) | 16,531 | 55.73¢ per $1 |
| Gini / Inequality Index | 16,531 | 0.57 |
Earnings by Sex in Vero Beach
Average Earnings in Vero Beach are $36,722, $44,589 for men and $24,848 for women, a difference of 44.3%.
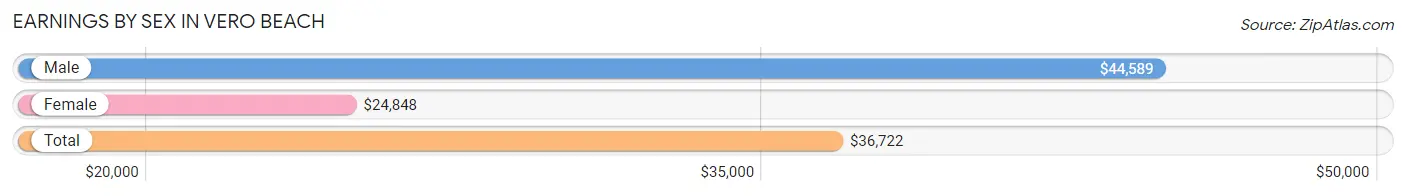
| Sex | Number | Average Earnings |
| Male | 4,507 (51.7%) | $44,589 |
| Female | 4,202 (48.2%) | $24,848 |
| Total | 8,709 (100.0%) | $36,722 |
Earnings by Sex by Income Bracket in Vero Beach
The most common earnings brackets in Vero Beach are $55,000 to $64,999 for men (809 | 17.9%) and $75,000 to $99,999 for women (380 | 9.0%).
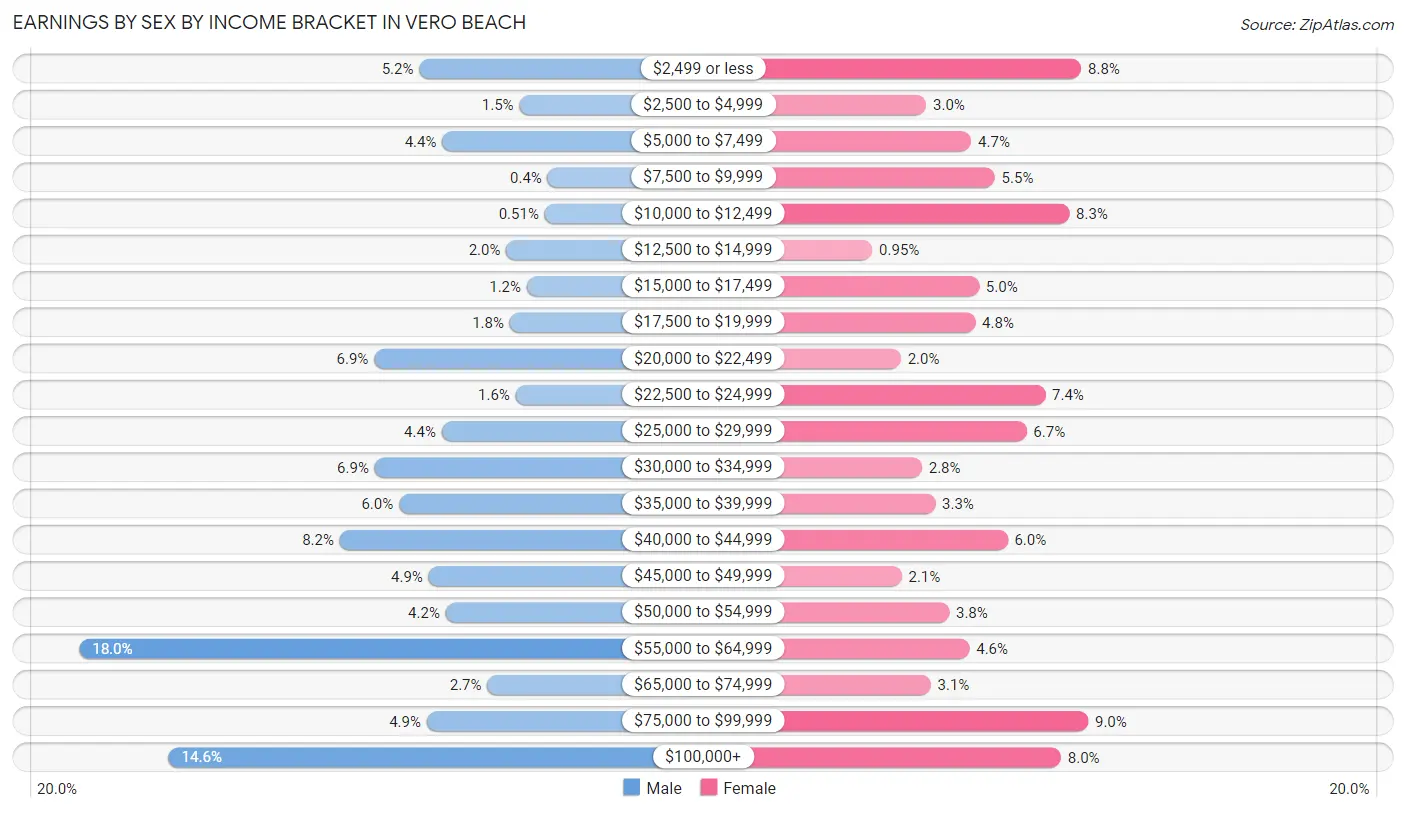
| Income | Male | Female |
| $2,499 or less | 235 (5.2%) | 369 (8.8%) |
| $2,500 to $4,999 | 66 (1.5%) | 125 (3.0%) |
| $5,000 to $7,499 | 196 (4.3%) | 196 (4.7%) |
| $7,500 to $9,999 | 18 (0.4%) | 233 (5.5%) |
| $10,000 to $12,499 | 23 (0.5%) | 350 (8.3%) |
| $12,500 to $14,999 | 88 (1.9%) | 40 (0.9%) |
| $15,000 to $17,499 | 53 (1.2%) | 208 (5.0%) |
| $17,500 to $19,999 | 82 (1.8%) | 202 (4.8%) |
| $20,000 to $22,499 | 311 (6.9%) | 85 (2.0%) |
| $22,500 to $24,999 | 72 (1.6%) | 312 (7.4%) |
| $25,000 to $29,999 | 197 (4.4%) | 283 (6.7%) |
| $30,000 to $34,999 | 310 (6.9%) | 118 (2.8%) |
| $35,000 to $39,999 | 269 (6.0%) | 139 (3.3%) |
| $40,000 to $44,999 | 369 (8.2%) | 253 (6.0%) |
| $45,000 to $49,999 | 219 (4.9%) | 86 (2.1%) |
| $50,000 to $54,999 | 190 (4.2%) | 161 (3.8%) |
| $55,000 to $64,999 | 809 (17.9%) | 193 (4.6%) |
| $65,000 to $74,999 | 120 (2.7%) | 132 (3.1%) |
| $75,000 to $99,999 | 222 (4.9%) | 380 (9.0%) |
| $100,000+ | 658 (14.6%) | 337 (8.0%) |
| Total | 4,507 (100.0%) | 4,202 (100.0%) |
Earnings by Sex by Educational Attainment in Vero Beach
Average earnings in Vero Beach are $46,617 for men and $27,851 for women, a difference of 40.3%. Men with an educational attainment of graduate degree enjoy the highest average annual earnings of $87,679, while those with less than high school education earn the least with $36,628. Women with an educational attainment of graduate degree earn the most with the average annual earnings of $53,851, while those with less than high school education have the smallest earnings of $7,844.
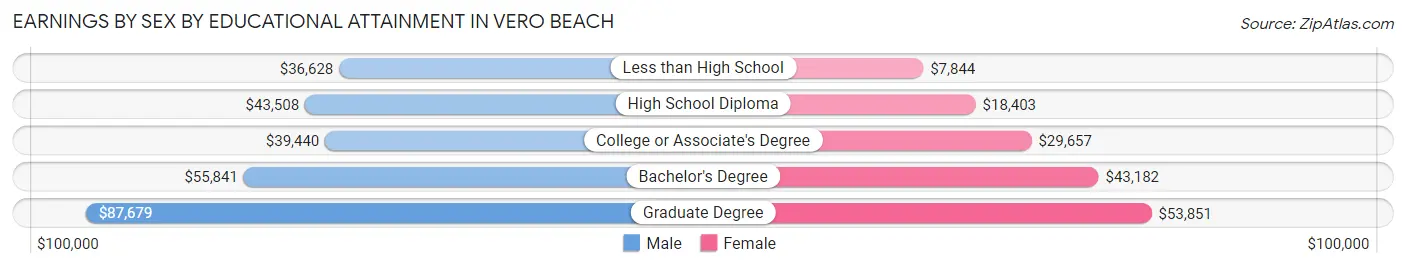
| Educational Attainment | Male Income | Female Income |
| Less than High School | $36,628 | $7,844 |
| High School Diploma | $43,508 | $18,403 |
| College or Associate's Degree | $39,440 | $29,657 |
| Bachelor's Degree | $55,841 | $43,182 |
| Graduate Degree | $87,679 | $53,851 |
| Total | $46,617 | $27,851 |
Family Income in Vero Beach
Family Income Brackets in Vero Beach
According to the Vero Beach family income data, there are 667 families falling into the $75,000 to $99,999 income range, which is the most common income bracket and makes up 17.6% of all families. Conversely, the $25,000 to $34,999 income bracket is the least frequent group with only 91 families (2.4%) belonging to this category.
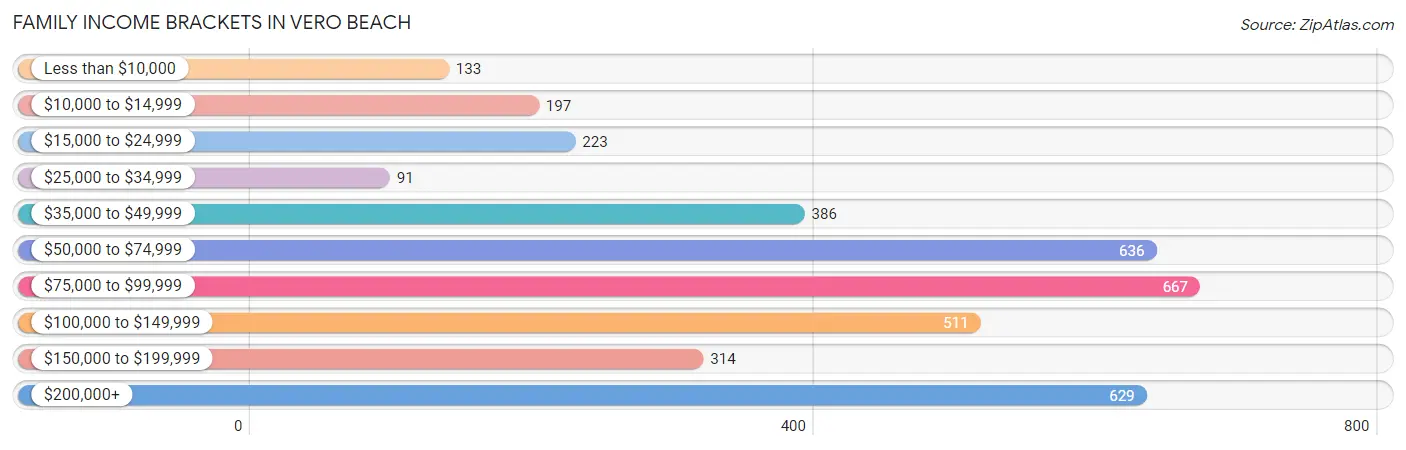
| Income Bracket | # Families | % Families |
| Less than $10,000 | 133 | 3.5% |
| $10,000 to $14,999 | 197 | 5.2% |
| $15,000 to $24,999 | 223 | 5.9% |
| $25,000 to $34,999 | 91 | 2.4% |
| $35,000 to $49,999 | 386 | 10.2% |
| $50,000 to $74,999 | 636 | 16.8% |
| $75,000 to $99,999 | 667 | 17.6% |
| $100,000 to $149,999 | 511 | 13.5% |
| $150,000 to $199,999 | 314 | 8.3% |
| $200,000+ | 629 | 16.6% |
Family Income by Famaliy Size in Vero Beach
5-person families (119 | 3.1%) account for the highest median family income in Vero Beach with $235,481 per family, while 5-person families (119 | 3.1%) have the highest median income of $47,096 per family member.
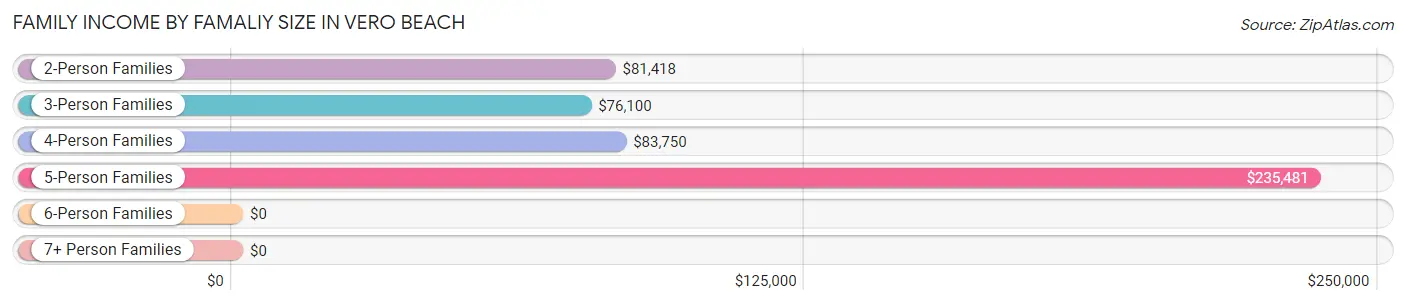
| Income Bracket | # Families | Median Income |
| 2-Person Families | 2,714 (71.7%) | $81,418 |
| 3-Person Families | 672 (17.7%) | $76,100 |
| 4-Person Families | 283 (7.5%) | $83,750 |
| 5-Person Families | 119 (3.1%) | $235,481 |
| 6-Person Families | 0 (0.0%) | $0 |
| 7+ Person Families | 0 (0.0%) | $0 |
| Total | 3,788 (100.0%) | $81,828 |
Family Income by Number of Earners in Vero Beach
The median family income in Vero Beach is $81,828, with families comprising 3+ earners (190) having the highest median family income of $164,844, while families with no earners (870) have the lowest median family income of $68,012, accounting for 5.0% and 23.0% of families, respectively.
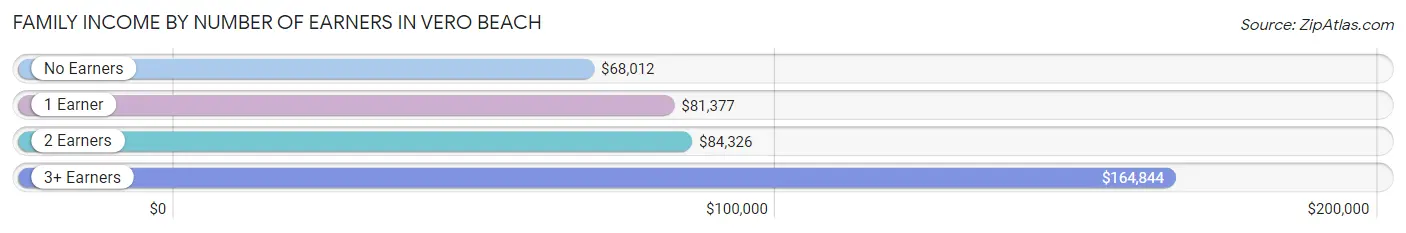
| Number of Earners | # Families | Median Income |
| No Earners | 870 (23.0%) | $68,012 |
| 1 Earner | 1,463 (38.6%) | $81,377 |
| 2 Earners | 1,265 (33.4%) | $84,326 |
| 3+ Earners | 190 (5.0%) | $164,844 |
| Total | 3,788 (100.0%) | $81,828 |
Household Income in Vero Beach
Household Income Brackets in Vero Beach
With 1,290 households falling in the category, the $50,000 to $74,999 income range is the most frequent in Vero Beach, accounting for 16.7% of all households. In contrast, only 409 households (5.3%) fall into the $150,000 to $199,999 income bracket, making it the least populous group.
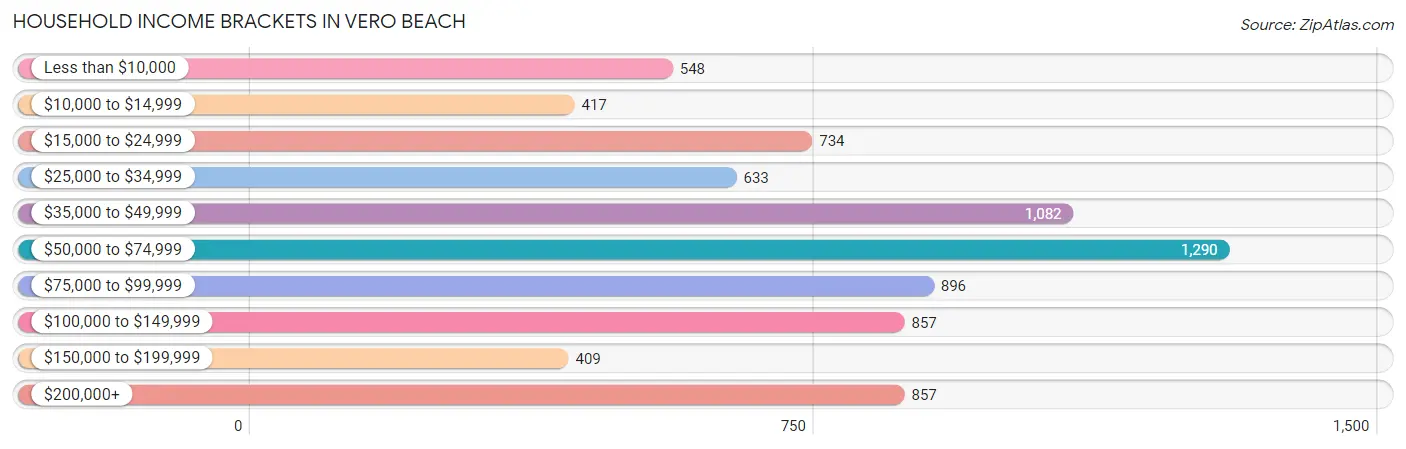
| Income Bracket | # Households | % Households |
| Less than $10,000 | 548 | 7.1% |
| $10,000 to $14,999 | 417 | 5.4% |
| $15,000 to $24,999 | 734 | 9.5% |
| $25,000 to $34,999 | 633 | 8.2% |
| $35,000 to $49,999 | 1,082 | 14.0% |
| $50,000 to $74,999 | 1,290 | 16.7% |
| $75,000 to $99,999 | 896 | 11.6% |
| $100,000 to $149,999 | 857 | 11.1% |
| $150,000 to $199,999 | 409 | 5.3% |
| $200,000+ | 857 | 11.1% |
Household Income by Householder Age in Vero Beach
The median household income in Vero Beach is $59,335, with the highest median household income of $64,615 found in the 45 to 64 years age bracket for the primary householder. A total of 2,800 households (36.2%) fall into this category. Meanwhile, the 15 to 24 years age bracket for the primary householder has the lowest median household income of $48,393, with 136 households (1.8%) in this group.
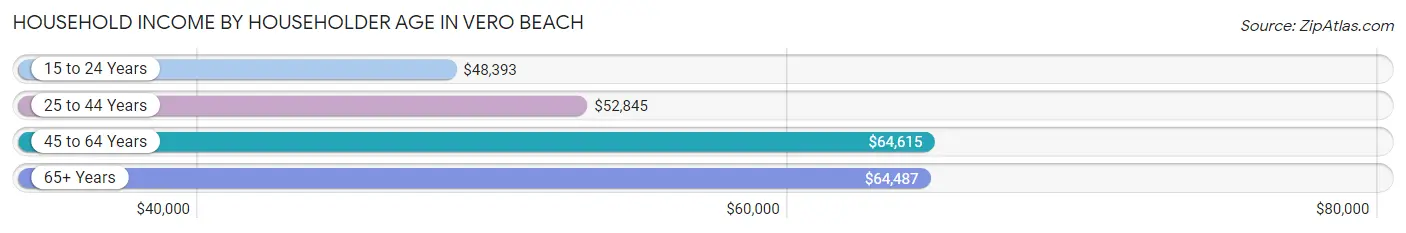
| Income Bracket | # Households | Median Income |
| 15 to 24 Years | 136 (1.8%) | $48,393 |
| 25 to 44 Years | 1,398 (18.1%) | $52,845 |
| 45 to 64 Years | 2,800 (36.2%) | $64,615 |
| 65+ Years | 3,391 (43.9%) | $64,487 |
| Total | 7,725 (100.0%) | $59,335 |
Poverty in Vero Beach
Income Below Poverty by Sex and Age in Vero Beach
With 11.9% poverty level for males and 15.8% for females among the residents of Vero Beach, 16 and 17 year old males and 5 year old females are the most vulnerable to poverty, with 26 males (41.9%) and 66 females (100.0%) in their respective age groups living below the poverty level.
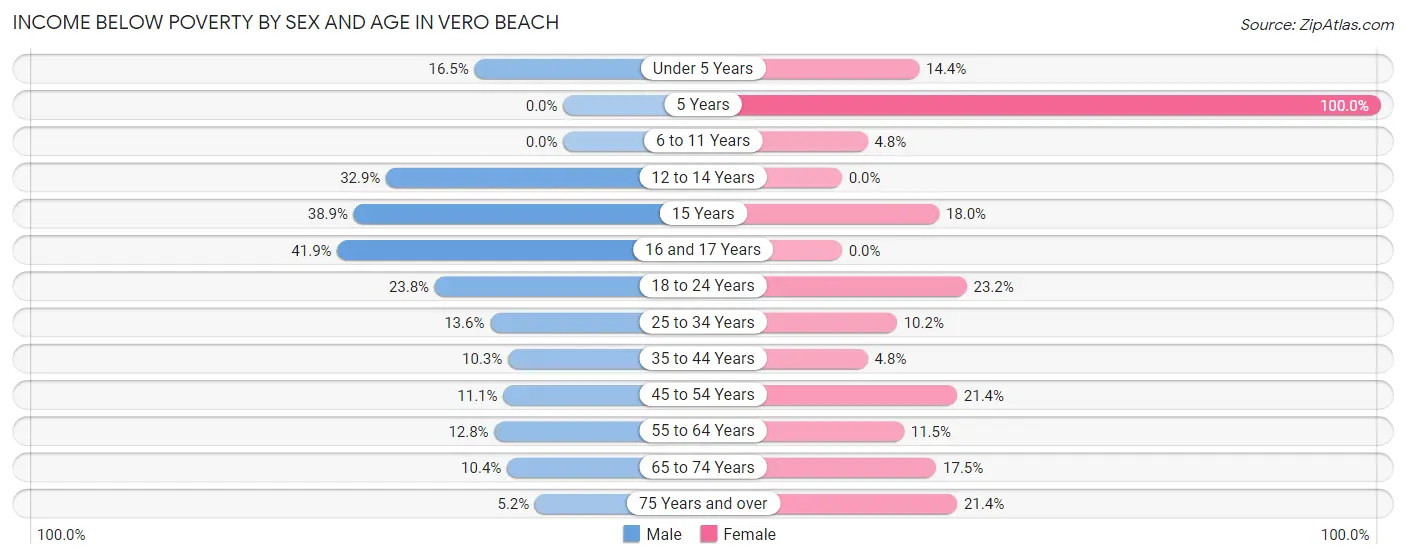
| Age Bracket | Male | Female |
| Under 5 Years | 31 (16.5%) | 64 (14.3%) |
| 5 Years | 0 (0.0%) | 66 (100.0%) |
| 6 to 11 Years | 0 (0.0%) | 13 (4.8%) |
| 12 to 14 Years | 48 (32.9%) | 0 (0.0%) |
| 15 Years | 28 (38.9%) | 11 (18.0%) |
| 16 and 17 Years | 26 (41.9%) | 0 (0.0%) |
| 18 to 24 Years | 92 (23.8%) | 145 (23.2%) |
| 25 to 34 Years | 125 (13.6%) | 87 (10.2%) |
| 35 to 44 Years | 106 (10.2%) | 35 (4.8%) |
| 45 to 54 Years | 86 (11.1%) | 223 (21.4%) |
| 55 to 64 Years | 192 (12.8%) | 187 (11.5%) |
| 65 to 74 Years | 117 (10.4%) | 245 (17.5%) |
| 75 Years and over | 51 (5.2%) | 291 (21.4%) |
| Total | 902 (11.9%) | 1,367 (15.8%) |
Income Above Poverty by Sex and Age in Vero Beach
According to the poverty statistics in Vero Beach, males aged 5 years and females aged 12 to 14 years are the age groups that are most secure financially, with 100.0% of males and 100.0% of females in these age groups living above the poverty line.
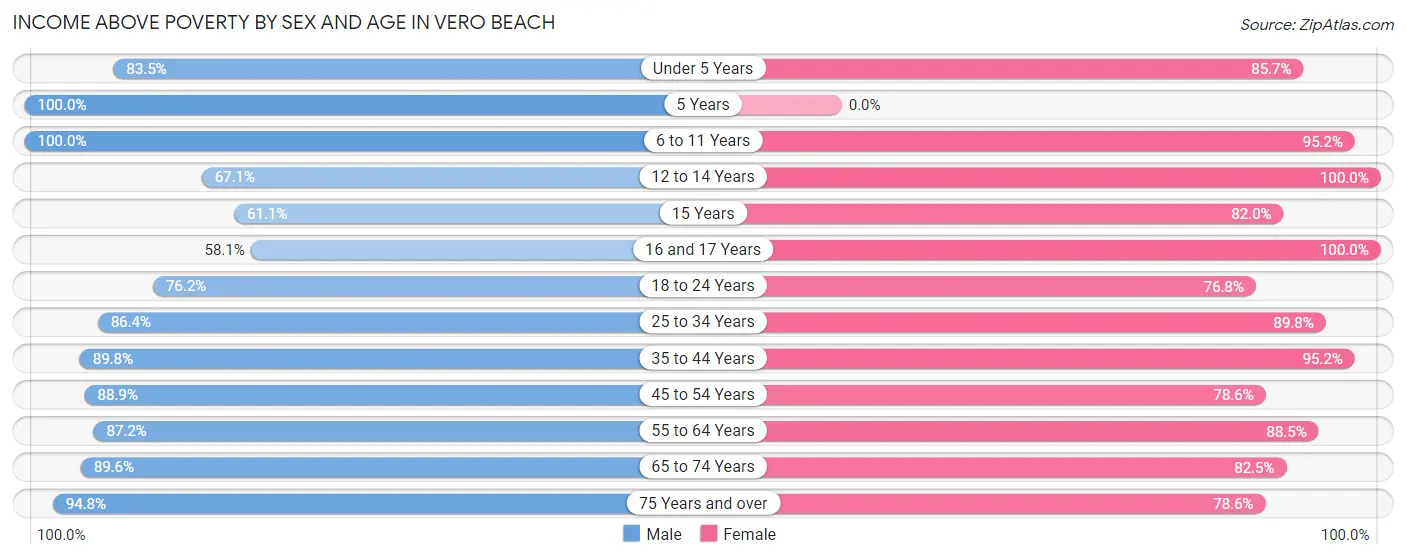
| Age Bracket | Male | Female |
| Under 5 Years | 157 (83.5%) | 382 (85.7%) |
| 5 Years | 123 (100.0%) | 0 (0.0%) |
| 6 to 11 Years | 286 (100.0%) | 259 (95.2%) |
| 12 to 14 Years | 98 (67.1%) | 86 (100.0%) |
| 15 Years | 44 (61.1%) | 50 (82.0%) |
| 16 and 17 Years | 36 (58.1%) | 91 (100.0%) |
| 18 to 24 Years | 294 (76.2%) | 481 (76.8%) |
| 25 to 34 Years | 796 (86.4%) | 766 (89.8%) |
| 35 to 44 Years | 928 (89.7%) | 694 (95.2%) |
| 45 to 54 Years | 687 (88.9%) | 821 (78.6%) |
| 55 to 64 Years | 1,309 (87.2%) | 1,437 (88.5%) |
| 65 to 74 Years | 1,005 (89.6%) | 1,155 (82.5%) |
| 75 Years and over | 923 (94.8%) | 1,070 (78.6%) |
| Total | 6,686 (88.1%) | 7,292 (84.2%) |
Income Below Poverty Among Married-Couple Families in Vero Beach
The poverty statistics for married-couple families in Vero Beach show that 4.3% or 128 of the total 2,954 families live below the poverty line. Families with no children have the highest poverty rate of 4.5%, comprising of 107 families. On the other hand, families with 3 or 4 children have the lowest poverty rate of 0.0%, which includes 0 families.
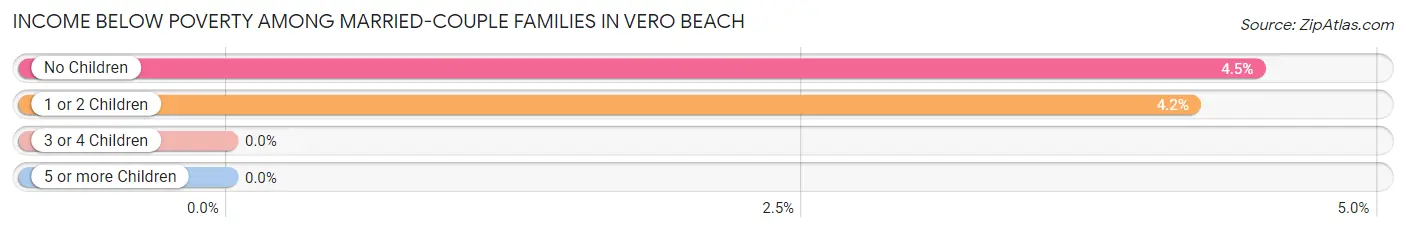
| Children | Above Poverty | Below Poverty |
| No Children | 2,285 (95.5%) | 107 (4.5%) |
| 1 or 2 Children | 480 (95.8%) | 21 (4.2%) |
| 3 or 4 Children | 61 (100.0%) | 0 (0.0%) |
| 5 or more Children | 0 (0.0%) | 0 (0.0%) |
| Total | 2,826 (95.7%) | 128 (4.3%) |
Income Below Poverty Among Single-Parent Households in Vero Beach
| Children | Single Father | Single Mother |
| No Children | 0 (0.0%) | 130 (36.9%) |
| 1 or 2 Children | 0 (0.0%) | 125 (32.4%) |
| 3 or 4 Children | 0 (0.0%) | 0 (0.0%) |
| 5 or more Children | 0 (0.0%) | 0 (0.0%) |
| Total | 0 (0.0%) | 255 (34.3%) |
Income Below Poverty Among Married-Couple vs Single-Parent Households in Vero Beach
The poverty data for Vero Beach shows that 128 of the married-couple family households (4.3%) and 255 of the single-parent households (30.6%) are living below the poverty level. Within the married-couple family households, those with no children have the highest poverty rate, with 107 households (4.5%) falling below the poverty line. Among the single-parent households, those with no children have the highest poverty rate, with 130 household (35.4%) living below poverty.
| Children | Married-Couple Families | Single-Parent Households |
| No Children | 107 (4.5%) | 130 (35.4%) |
| 1 or 2 Children | 21 (4.2%) | 125 (27.1%) |
| 3 or 4 Children | 0 (0.0%) | 0 (0.0%) |
| 5 or more Children | 0 (0.0%) | 0 (0.0%) |
| Total | 128 (4.3%) | 255 (30.6%) |
Race in Vero Beach
The most populous races in Vero Beach are White / Caucasian (13,133 | 79.4%), Hispanic or Latino (1,489 | 9.0%), and Two or more Races (1,137 | 6.9%).
| Race | # Population | % Population |
| Asian | 445 | 2.7% |
| Black / African American | 1,133 | 6.9% |
| Hawaiian / Pacific | 8 | 0.1% |
| Hispanic or Latino | 1,489 | 9.0% |
| Native / Alaskan | 49 | 0.3% |
| White / Caucasian | 13,133 | 79.4% |
| Two or more Races | 1,137 | 6.9% |
| Some other Race | 626 | 3.8% |
| Total | 16,531 | 100.0% |
Ancestry in Vero Beach
The most populous ancestries reported in Vero Beach are English (2,663 | 16.1%), German (2,645 | 16.0%), Irish (2,303 | 13.9%), American (1,322 | 8.0%), and Italian (1,180 | 7.1%), together accounting for 61.2% of all Vero Beach residents.
| Ancestry | # Population | % Population |
| African | 48 | 0.3% |
| Albanian | 4 | 0.0% |
| American | 1,322 | 8.0% |
| Apache | 49 | 0.3% |
| Arab | 53 | 0.3% |
| Argentinean | 22 | 0.1% |
| Australian | 13 | 0.1% |
| Austrian | 59 | 0.4% |
| Bahamian | 51 | 0.3% |
| Belgian | 35 | 0.2% |
| Bhutanese | 51 | 0.3% |
| Blackfeet | 18 | 0.1% |
| Brazilian | 40 | 0.2% |
| British | 252 | 1.5% |
| Bulgarian | 15 | 0.1% |
| Canadian | 101 | 0.6% |
| Central American | 11 | 0.1% |
| Cherokee | 17 | 0.1% |
| Comanche | 25 | 0.2% |
| Creek | 9 | 0.1% |
| Croatian | 5 | 0.0% |
| Cuban | 371 | 2.2% |
| Czech | 75 | 0.4% |
| Danish | 22 | 0.1% |
| Dominican | 22 | 0.1% |
| Dutch | 90 | 0.5% |
| Eastern European | 72 | 0.4% |
| English | 2,663 | 16.1% |
| European | 809 | 4.9% |
| French | 614 | 3.7% |
| French Canadian | 90 | 0.5% |
| German | 2,645 | 16.0% |
| Greek | 54 | 0.3% |
| Guamanian / Chamorro | 27 | 0.2% |
| Honduran | 11 | 0.1% |
| Hungarian | 74 | 0.4% |
| Indian (Asian) | 107 | 0.6% |
| Indonesian | 92 | 0.6% |
| Iranian | 8 | 0.1% |
| Irish | 2,303 | 13.9% |
| Iroquois | 3 | 0.0% |
| Italian | 1,180 | 7.1% |
| Jamaican | 116 | 0.7% |
| Korean | 151 | 0.9% |
| Latvian | 12 | 0.1% |
| Lebanese | 53 | 0.3% |
| Lithuanian | 28 | 0.2% |
| Luxembourger | 21 | 0.1% |
| Maltese | 12 | 0.1% |
| Mexican | 527 | 3.2% |
| Northern European | 54 | 0.3% |
| Norwegian | 77 | 0.5% |
| Pakistani | 7 | 0.0% |
| Pennsylvania German | 14 | 0.1% |
| Peruvian | 26 | 0.2% |
| Polish | 432 | 2.6% |
| Portuguese | 16 | 0.1% |
| Puerto Rican | 211 | 1.3% |
| Romanian | 26 | 0.2% |
| Russian | 174 | 1.1% |
| Scandinavian | 118 | 0.7% |
| Scotch-Irish | 159 | 1.0% |
| Scottish | 849 | 5.1% |
| Serbian | 26 | 0.2% |
| Slavic | 7 | 0.0% |
| Slovak | 68 | 0.4% |
| South American | 48 | 0.3% |
| Spaniard | 72 | 0.4% |
| Spanish | 25 | 0.2% |
| Sri Lankan | 7 | 0.0% |
| Subsaharan African | 48 | 0.3% |
| Swedish | 176 | 1.1% |
| Swiss | 39 | 0.2% |
| Thai | 184 | 1.1% |
| Ukrainian | 7 | 0.0% |
| Welsh | 94 | 0.6% |
| Yugoslavian | 6 | 0.0% | View All 77 Rows |
Immigrants in Vero Beach
The most numerous immigrant groups reported in Vero Beach came from Latin America (816 | 4.9%), Caribbean (540 | 3.3%), Asia (408 | 2.5%), Cuba (345 | 2.1%), and Europe (309 | 1.9%), together accounting for 14.6% of all Vero Beach residents.
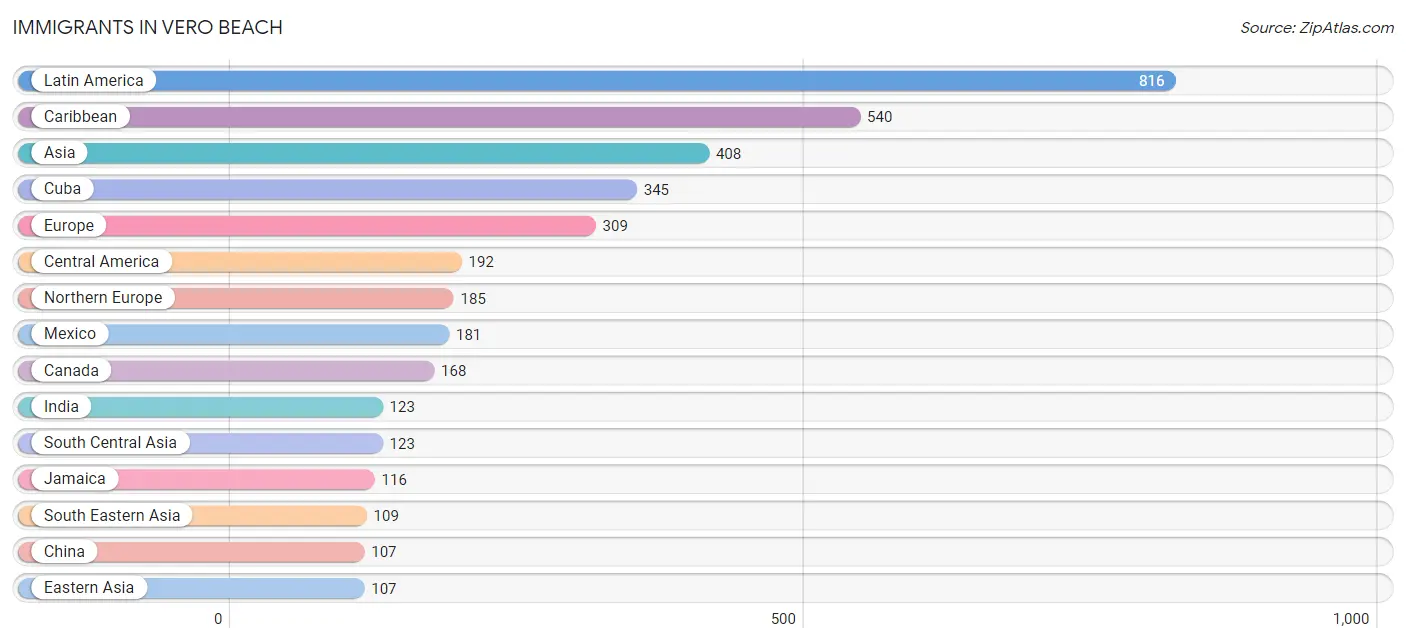
| Immigration Origin | # Population | % Population |
| Africa | 50 | 0.3% |
| Argentina | 52 | 0.3% |
| Asia | 408 | 2.5% |
| Australia | 13 | 0.1% |
| Bahamas | 51 | 0.3% |
| Belarus | 22 | 0.1% |
| Belgium | 15 | 0.1% |
| Brazil | 6 | 0.0% |
| Canada | 168 | 1.0% |
| Caribbean | 540 | 3.3% |
| Central America | 192 | 1.2% |
| China | 107 | 0.6% |
| Cuba | 345 | 2.1% |
| Czechoslovakia | 9 | 0.1% |
| Dominican Republic | 22 | 0.1% |
| Eastern Asia | 107 | 0.6% |
| Eastern Europe | 46 | 0.3% |
| England | 62 | 0.4% |
| Europe | 309 | 1.9% |
| Germany | 47 | 0.3% |
| Haiti | 6 | 0.0% |
| Honduras | 11 | 0.1% |
| Hong Kong | 53 | 0.3% |
| Hungary | 8 | 0.1% |
| India | 123 | 0.7% |
| Ireland | 2 | 0.0% |
| Jamaica | 116 | 0.7% |
| Latin America | 816 | 4.9% |
| Lebanon | 69 | 0.4% |
| Mexico | 181 | 1.1% |
| Netherlands | 8 | 0.1% |
| Northern Europe | 185 | 1.1% |
| Oceania | 13 | 0.1% |
| Peru | 26 | 0.2% |
| Philippines | 6 | 0.0% |
| Scotland | 60 | 0.4% |
| Senegal | 50 | 0.3% |
| South America | 84 | 0.5% |
| South Central Asia | 123 | 0.7% |
| South Eastern Asia | 109 | 0.7% |
| Southern Europe | 8 | 0.1% |
| Spain | 8 | 0.1% |
| Thailand | 11 | 0.1% |
| Ukraine | 7 | 0.0% |
| Western Africa | 50 | 0.3% |
| Western Asia | 69 | 0.4% |
| Western Europe | 70 | 0.4% | View All 47 Rows |
Sex and Age in Vero Beach
Sex and Age in Vero Beach
The most populous age groups in Vero Beach are 60 to 64 Years (904 | 11.6%) for men and 60 to 64 Years (899 | 10.3%) for women.
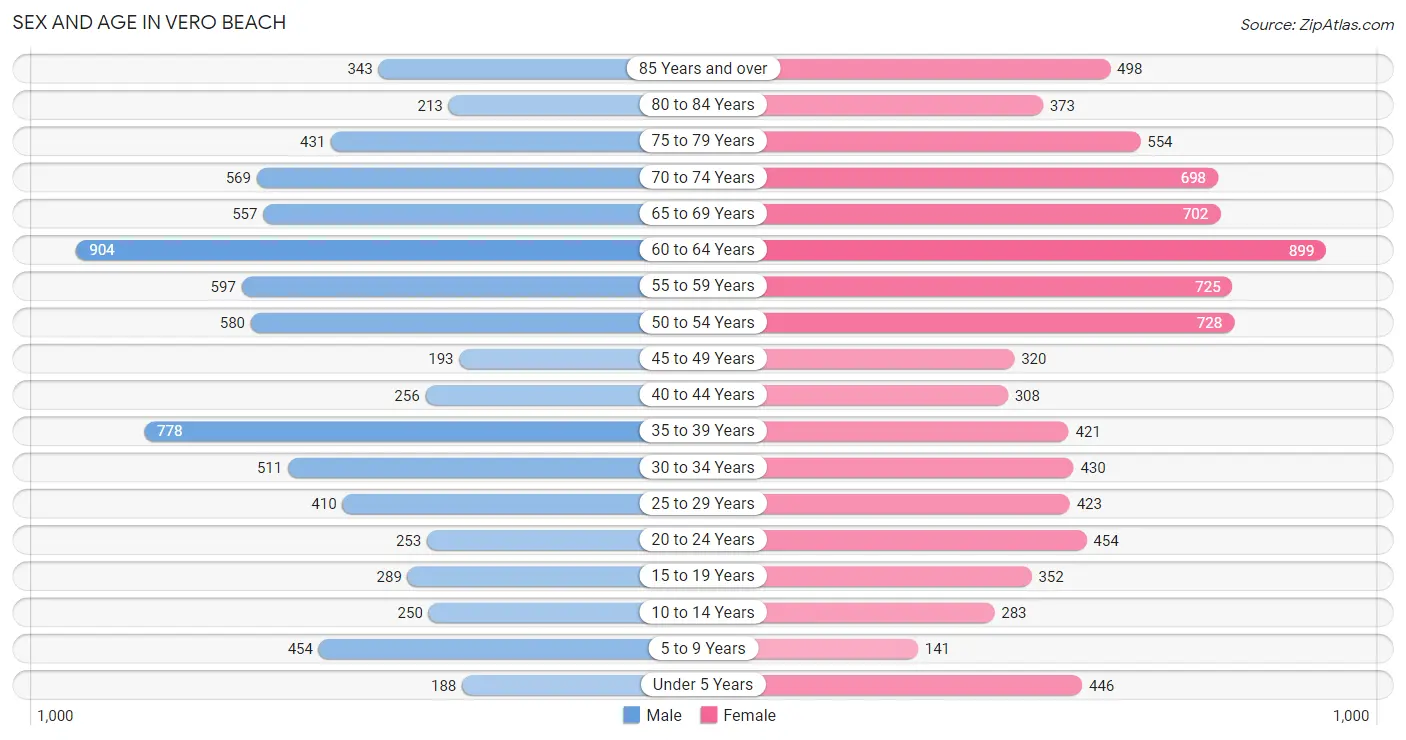
| Age Bracket | Male | Female |
| Under 5 Years | 188 (2.4%) | 446 (5.1%) |
| 5 to 9 Years | 454 (5.8%) | 141 (1.6%) |
| 10 to 14 Years | 250 (3.2%) | 283 (3.2%) |
| 15 to 19 Years | 289 (3.7%) | 352 (4.0%) |
| 20 to 24 Years | 253 (3.3%) | 454 (5.2%) |
| 25 to 29 Years | 410 (5.3%) | 423 (4.8%) |
| 30 to 34 Years | 511 (6.6%) | 430 (4.9%) |
| 35 to 39 Years | 778 (10.0%) | 421 (4.8%) |
| 40 to 44 Years | 256 (3.3%) | 308 (3.5%) |
| 45 to 49 Years | 193 (2.5%) | 320 (3.7%) |
| 50 to 54 Years | 580 (7.5%) | 728 (8.3%) |
| 55 to 59 Years | 597 (7.7%) | 725 (8.3%) |
| 60 to 64 Years | 904 (11.6%) | 899 (10.3%) |
| 65 to 69 Years | 557 (7.2%) | 702 (8.0%) |
| 70 to 74 Years | 569 (7.3%) | 698 (8.0%) |
| 75 to 79 Years | 431 (5.5%) | 554 (6.3%) |
| 80 to 84 Years | 213 (2.7%) | 373 (4.3%) |
| 85 Years and over | 343 (4.4%) | 498 (5.7%) |
| Total | 7,776 (100.0%) | 8,755 (100.0%) |
Families and Households in Vero Beach
Median Family Size in Vero Beach
The median family size in Vero Beach is 2.88 persons per family, with married-couple families (2,954 | 78.0%) accounting for the largest median family size of 2.91 persons per family. On the other hand, single male/father families (90 | 2.4%) represent the smallest median family size with 2.52 persons per family.
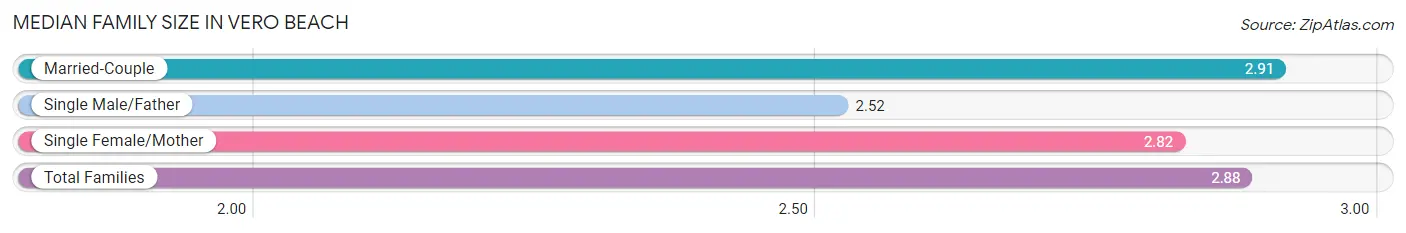
| Family Type | # Families | Family Size |
| Married-Couple | 2,954 (78.0%) | 2.91 |
| Single Male/Father | 90 (2.4%) | 2.52 |
| Single Female/Mother | 744 (19.6%) | 2.82 |
| Total Families | 3,788 (100.0%) | 2.88 |
Median Household Size in Vero Beach
The median household size in Vero Beach is 2.11 persons per household, with single male/father households (90 | 1.2%) accounting for the largest median household size of 3.69 persons per household. non-family households (3,937 | 51.0%) represent the smallest median household size with 1.24 persons per household.
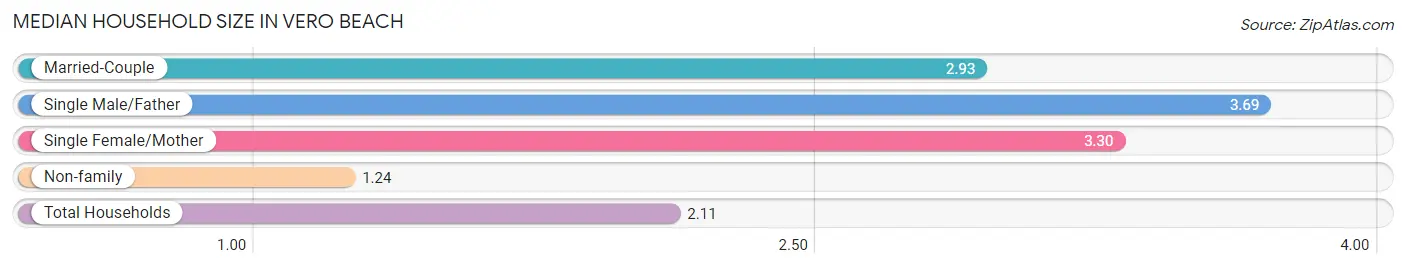
| Household Type | # Households | Household Size |
| Married-Couple | 2,954 (38.2%) | 2.93 |
| Single Male/Father | 90 (1.2%) | 3.69 |
| Single Female/Mother | 744 (9.6%) | 3.30 |
| Non-family | 3,937 (51.0%) | 1.24 |
| Total Households | 7,725 (100.0%) | 2.11 |
Household Size by Marriage Status in Vero Beach
Out of a total of 7,725 households in Vero Beach, 3,788 (49.0%) are family households, while 3,937 (51.0%) are nonfamily households. The most numerous type of family households are 2-person households, comprising 2,552, and the most common type of nonfamily households are 1-person households, comprising 3,367.
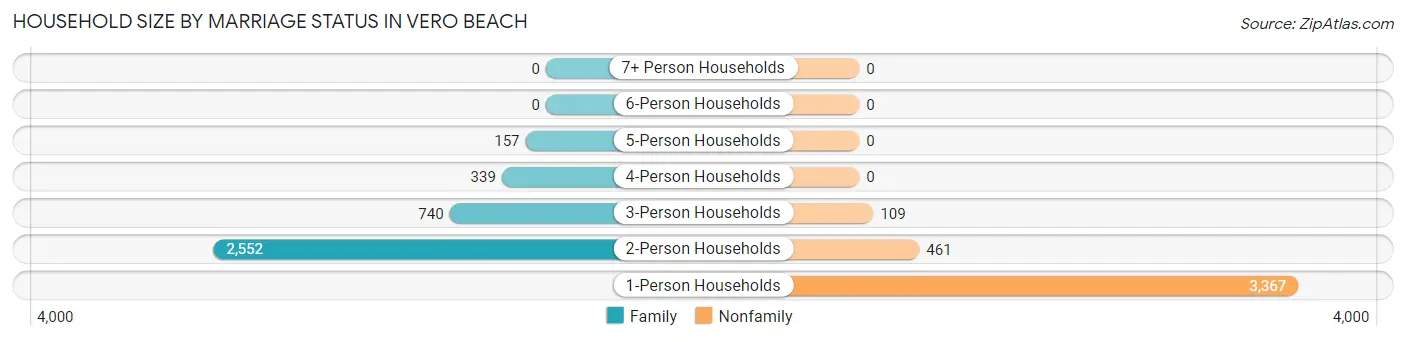
| Household Size | Family Households | Nonfamily Households |
| 1-Person Households | - | 3,367 (43.6%) |
| 2-Person Households | 2,552 (33.0%) | 461 (6.0%) |
| 3-Person Households | 740 (9.6%) | 109 (1.4%) |
| 4-Person Households | 339 (4.4%) | 0 (0.0%) |
| 5-Person Households | 157 (2.0%) | 0 (0.0%) |
| 6-Person Households | 0 (0.0%) | 0 (0.0%) |
| 7+ Person Households | 0 (0.0%) | 0 (0.0%) |
| Total | 3,788 (49.0%) | 3,937 (51.0%) |
Female Fertility in Vero Beach
Fertility by Age in Vero Beach
Average fertility rate in Vero Beach is 14.0 births per 1,000 women. Women in the age bracket of 20 to 34 years have the highest fertility rate with 21.0 births per 1,000 women. Women in the age bracket of 20 to 34 years acount for 67.5% of all women with births.
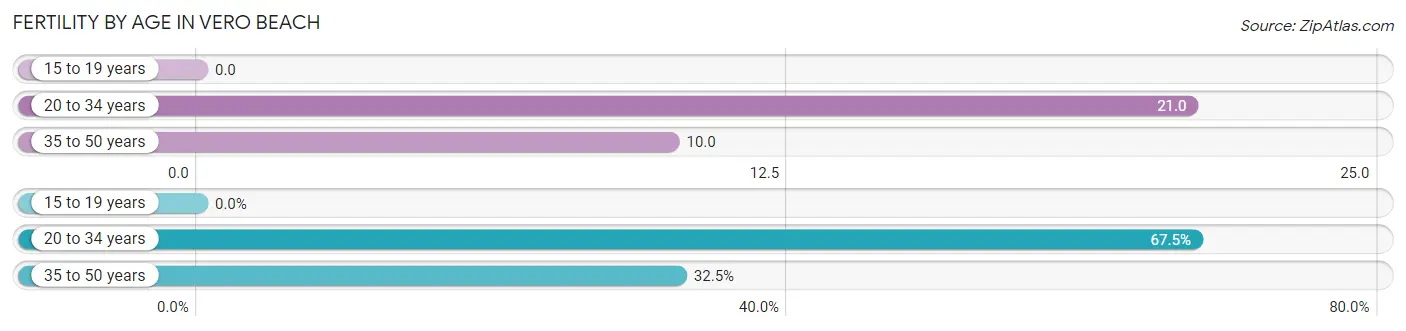
| Age Bracket | Women with Births | Births / 1,000 Women |
| 15 to 19 years | 0 (0.0%) | 0.0 |
| 20 to 34 years | 27 (67.5%) | 21.0 |
| 35 to 50 years | 13 (32.5%) | 10.0 |
| Total | 40 (100.0%) | 14.0 |
Fertility by Age by Marriage Status in Vero Beach
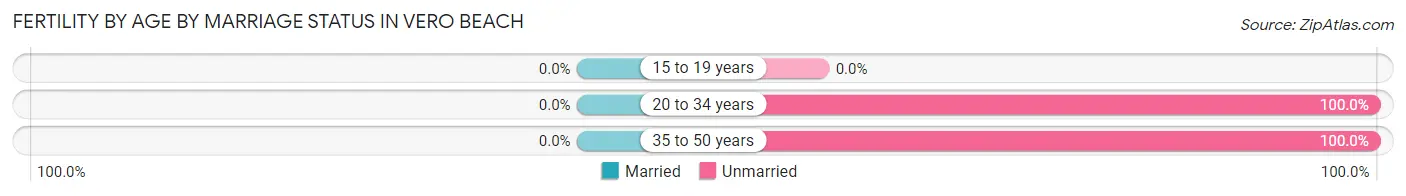
| Age Bracket | Married | Unmarried |
| 15 to 19 years | 0 (0.0%) | 0 (0.0%) |
| 20 to 34 years | 0 (0.0%) | 27 (100.0%) |
| 35 to 50 years | 0 (0.0%) | 13 (100.0%) |
| Total | 0 (0.0%) | 40 (100.0%) |
Fertility by Education in Vero Beach
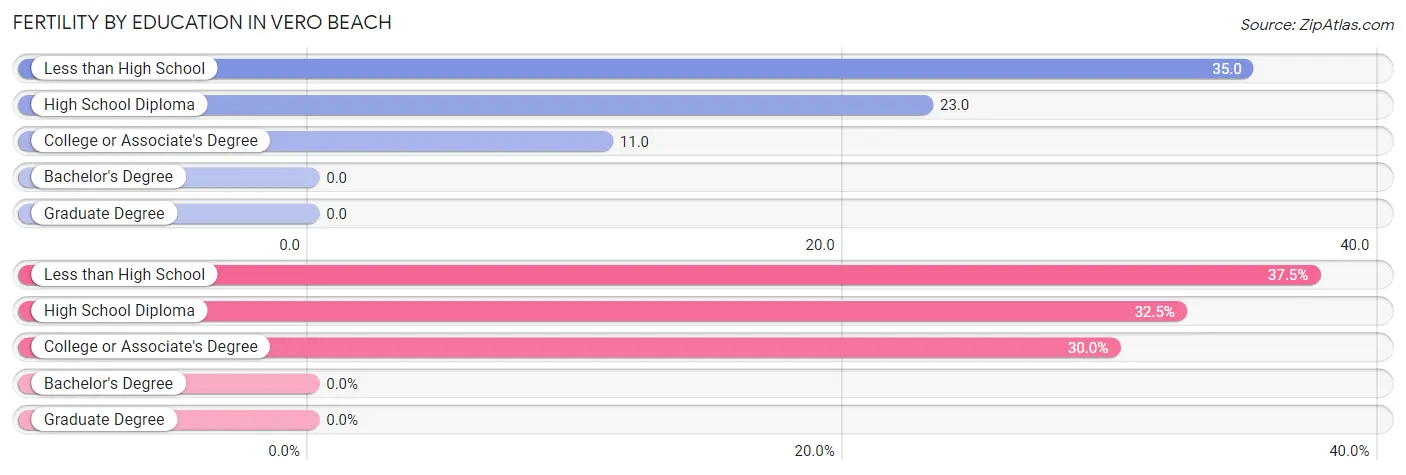
| Educational Attainment | Women with Births | Births / 1,000 Women |
| Less than High School | 15 (37.5%) | 35.0 |
| High School Diploma | 13 (32.5%) | 23.0 |
| College or Associate's Degree | 12 (30.0%) | 11.0 |
| Bachelor's Degree | 0 (0.0%) | 0.0 |
| Graduate Degree | 0 (0.0%) | 0.0 |
| Total | 40 (100.0%) | 14.0 |
Fertility by Education by Marriage Status in Vero Beach
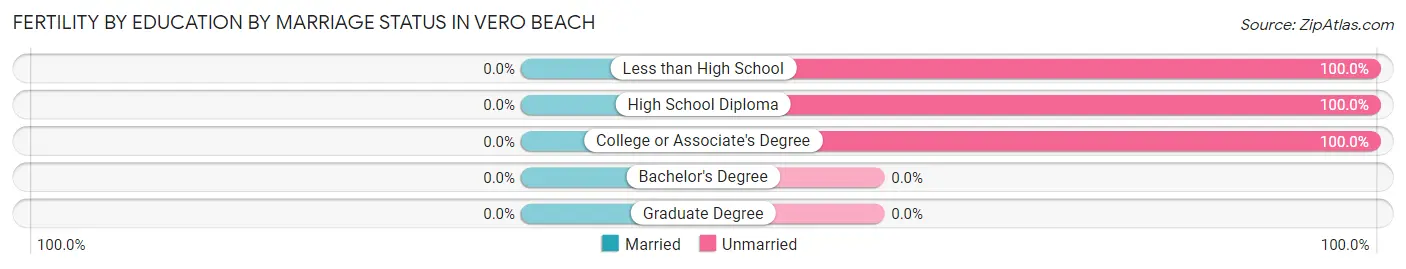
| Educational Attainment | Married | Unmarried |
| Less than High School | 0 (0.0%) | 15 (100.0%) |
| High School Diploma | 0 (0.0%) | 13 (100.0%) |
| College or Associate's Degree | 0 (0.0%) | 12 (100.0%) |
| Bachelor's Degree | 0 (0.0%) | 0 (0.0%) |
| Graduate Degree | 0 (0.0%) | 0 (0.0%) |
| Total | 0 (0.0%) | 40 (100.0%) |
Employment Characteristics in Vero Beach
Employment by Class of Employer in Vero Beach
Among the 7,707 employed individuals in Vero Beach, private company employees (4,807 | 62.4%), self-employed (incorporated) (770 | 10.0%), and not-for-profit organizations (588 | 7.6%) make up the most common classes of employment.
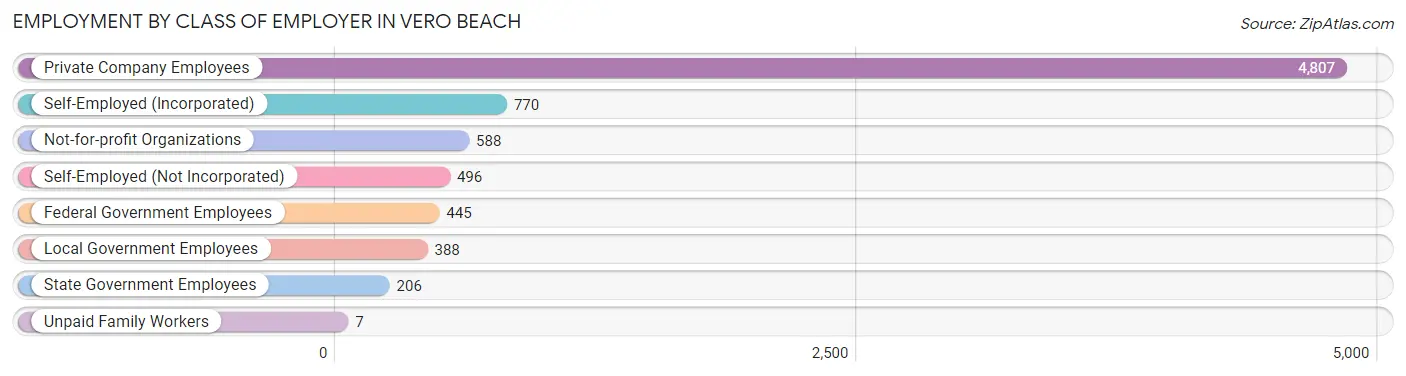
| Employer Class | # Employees | % Employees |
| Private Company Employees | 4,807 | 62.4% |
| Self-Employed (Incorporated) | 770 | 10.0% |
| Self-Employed (Not Incorporated) | 496 | 6.4% |
| Not-for-profit Organizations | 588 | 7.6% |
| Local Government Employees | 388 | 5.0% |
| State Government Employees | 206 | 2.7% |
| Federal Government Employees | 445 | 5.8% |
| Unpaid Family Workers | 7 | 0.1% |
| Total | 7,707 | 100.0% |
Employment Status by Age in Vero Beach
According to the labor force statistics for Vero Beach, out of the total population over 16 years of age (14,636), 55.4% or 8,108 individuals are in the labor force, with 3.5% or 284 of them unemployed. The age group with the highest labor force participation rate is 35 to 44 years, with 91.9% or 1,620 individuals in the labor force. Within the labor force, the 25 to 29 years age range has the highest percentage of unemployed individuals, with 6.7% or 44 of them being unemployed.
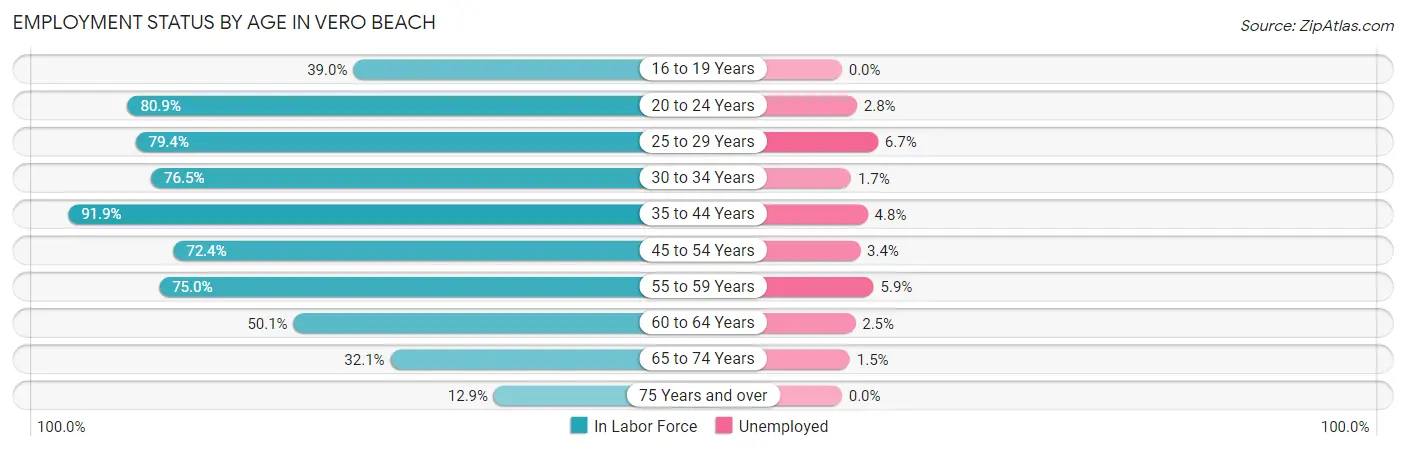
| Age Bracket | In Labor Force | Unemployed |
| 16 to 19 Years | 198 (39.0%) | 0 (0.0%) |
| 20 to 24 Years | 572 (80.9%) | 16 (2.8%) |
| 25 to 29 Years | 661 (79.4%) | 44 (6.7%) |
| 30 to 34 Years | 720 (76.5%) | 12 (1.7%) |
| 35 to 44 Years | 1,620 (91.9%) | 78 (4.8%) |
| 45 to 54 Years | 1,318 (72.4%) | 45 (3.4%) |
| 55 to 59 Years | 992 (75.0%) | 59 (5.9%) |
| 60 to 64 Years | 903 (50.1%) | 23 (2.5%) |
| 65 to 74 Years | 811 (32.1%) | 12 (1.5%) |
| 75 Years and over | 311 (12.9%) | 0 (0.0%) |
| Total | 8,108 (55.4%) | 284 (3.5%) |
Employment Status by Educational Attainment in Vero Beach
According to labor force statistics for Vero Beach, 73.3% of individuals (6,218) out of the total population between 25 and 64 years of age (8,483) are in the labor force, with 4.2% or 261 of them being unemployed. The group with the highest labor force participation rate are those with the educational attainment of high school diploma, with 79.3% or 1,741 individuals in the labor force. Within the labor force, individuals with college / associate degree education have the highest percentage of unemployment, with 6.6% or 125 of them being unemployed.
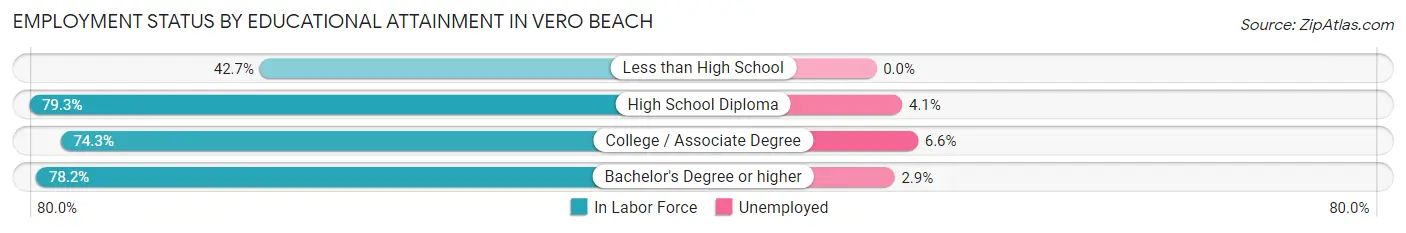
| Educational Attainment | In Labor Force | Unemployed |
| Less than High School | 412 (42.7%) | 0 (0.0%) |
| High School Diploma | 1,741 (79.3%) | 90 (4.1%) |
| College / Associate Degree | 1,891 (74.3%) | 168 (6.6%) |
| Bachelor's Degree or higher | 2,171 (78.2%) | 81 (2.9%) |
| Total | 6,218 (73.3%) | 356 (4.2%) |
Employment Occupations by Sex in Vero Beach
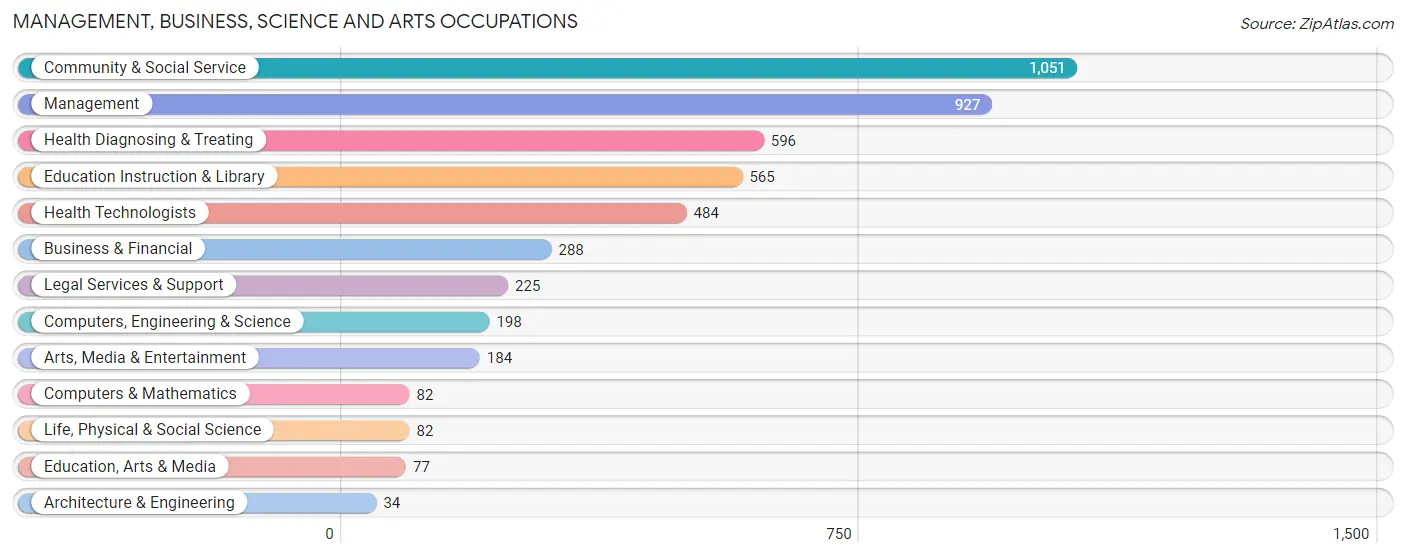
Management, Business, Science and Arts Occupations
The most common Management, Business, Science and Arts occupations in Vero Beach are Community & Social Service (1,051 | 14.2%), Management (927 | 12.5%), Health Diagnosing & Treating (596 | 8.0%), Education Instruction & Library (565 | 7.6%), and Health Technologists (484 | 6.5%).
Management, Business, Science and Arts Occupations by Sex
Within the Management, Business, Science and Arts occupations in Vero Beach, the most male-oriented occupations are Architecture & Engineering (85.3%), Computers & Mathematics (64.6%), and Management (62.4%), while the most female-oriented occupations are Life, Physical & Social Science (86.6%), Legal Services & Support (76.4%), and Health Diagnosing & Treating (73.7%).
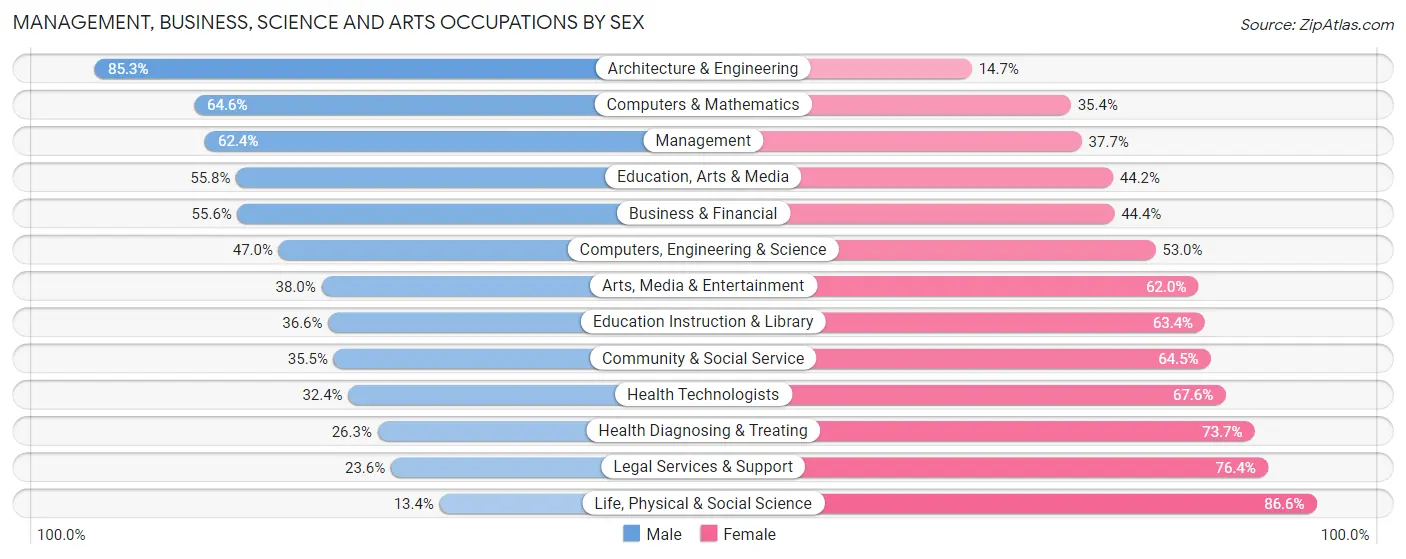
| Occupation | Male | Female |
| Management | 578 (62.4%) | 349 (37.7%) |
| Business & Financial | 160 (55.6%) | 128 (44.4%) |
| Computers, Engineering & Science | 93 (47.0%) | 105 (53.0%) |
| Computers & Mathematics | 53 (64.6%) | 29 (35.4%) |
| Architecture & Engineering | 29 (85.3%) | 5 (14.7%) |
| Life, Physical & Social Science | 11 (13.4%) | 71 (86.6%) |
| Community & Social Service | 373 (35.5%) | 678 (64.5%) |
| Education, Arts & Media | 43 (55.8%) | 34 (44.2%) |
| Legal Services & Support | 53 (23.6%) | 172 (76.4%) |
| Education Instruction & Library | 207 (36.6%) | 358 (63.4%) |
| Arts, Media & Entertainment | 70 (38.0%) | 114 (62.0%) |
| Health Diagnosing & Treating | 157 (26.3%) | 439 (73.7%) |
| Health Technologists | 157 (32.4%) | 327 (67.6%) |
| Total (Category) | 1,361 (44.5%) | 1,699 (55.5%) |
| Total (Overall) | 3,698 (49.8%) | 3,725 (50.2%) |
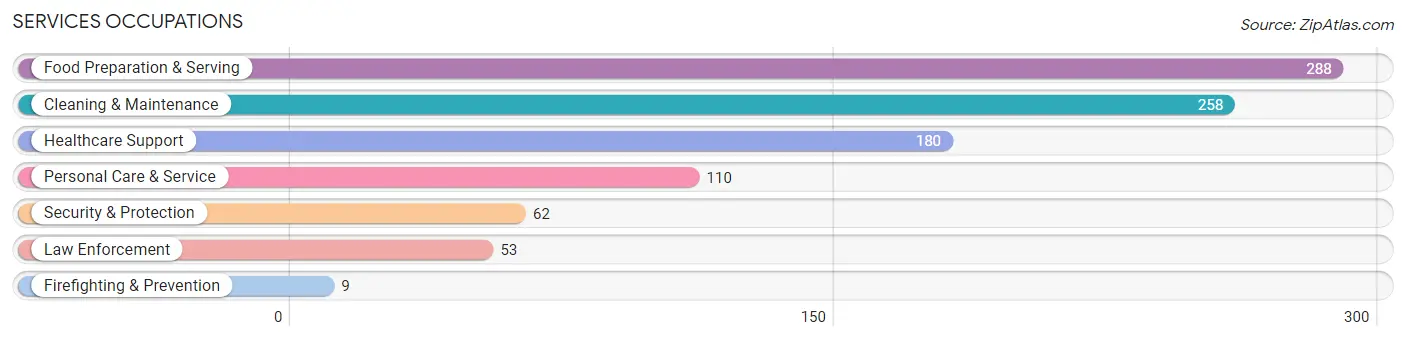
Services Occupations
The most common Services occupations in Vero Beach are Food Preparation & Serving (288 | 3.9%), Cleaning & Maintenance (258 | 3.5%), Healthcare Support (180 | 2.4%), Personal Care & Service (110 | 1.5%), and Security & Protection (62 | 0.8%).
Services Occupations by Sex
Within the Services occupations in Vero Beach, the most male-oriented occupations are Firefighting & Prevention (100.0%), Food Preparation & Serving (67.7%), and Cleaning & Maintenance (66.3%), while the most female-oriented occupations are Law Enforcement (100.0%), Healthcare Support (91.1%), and Security & Protection (85.5%).
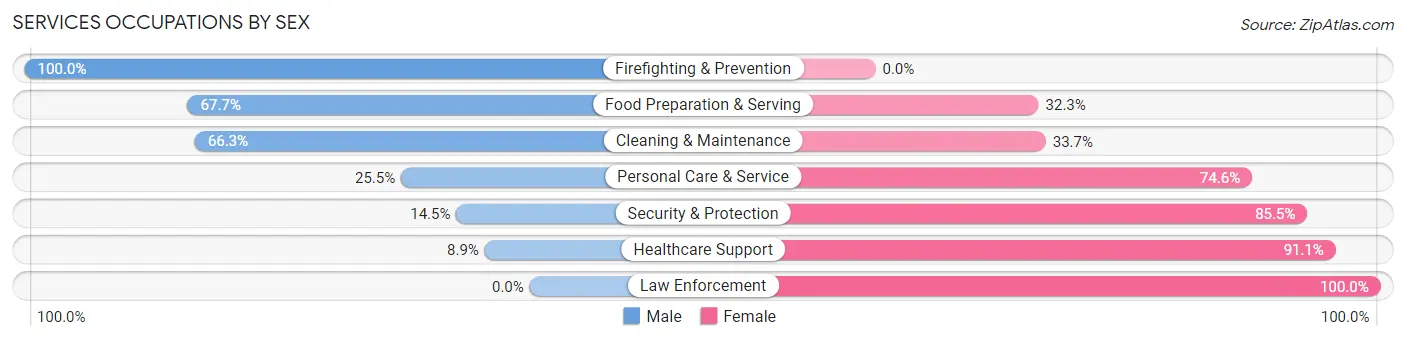
| Occupation | Male | Female |
| Healthcare Support | 16 (8.9%) | 164 (91.1%) |
| Security & Protection | 9 (14.5%) | 53 (85.5%) |
| Firefighting & Prevention | 9 (100.0%) | 0 (0.0%) |
| Law Enforcement | 0 (0.0%) | 53 (100.0%) |
| Food Preparation & Serving | 195 (67.7%) | 93 (32.3%) |
| Cleaning & Maintenance | 171 (66.3%) | 87 (33.7%) |
| Personal Care & Service | 28 (25.5%) | 82 (74.6%) |
| Total (Category) | 419 (46.7%) | 479 (53.3%) |
| Total (Overall) | 3,698 (49.8%) | 3,725 (50.2%) |
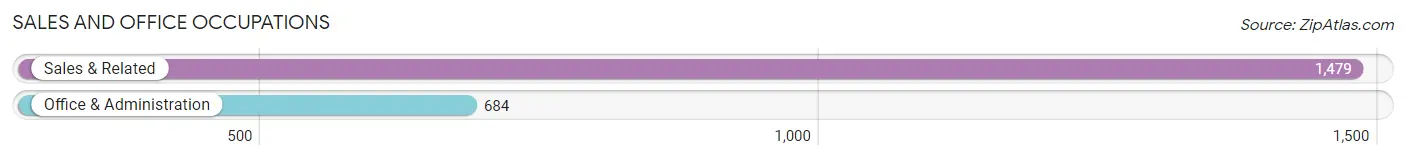
Sales and Office Occupations
The most common Sales and Office occupations in Vero Beach are Sales & Related (1,479 | 19.9%), and Office & Administration (684 | 9.2%).
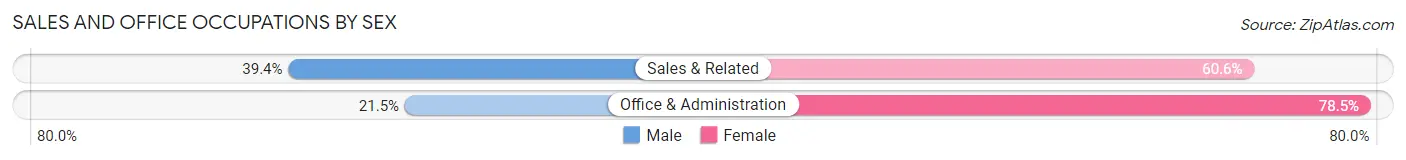
Sales and Office Occupations by Sex
| Occupation | Male | Female |
| Sales & Related | 583 (39.4%) | 896 (60.6%) |
| Office & Administration | 147 (21.5%) | 537 (78.5%) |
| Total (Category) | 730 (33.8%) | 1,433 (66.2%) |
| Total (Overall) | 3,698 (49.8%) | 3,725 (50.2%) |
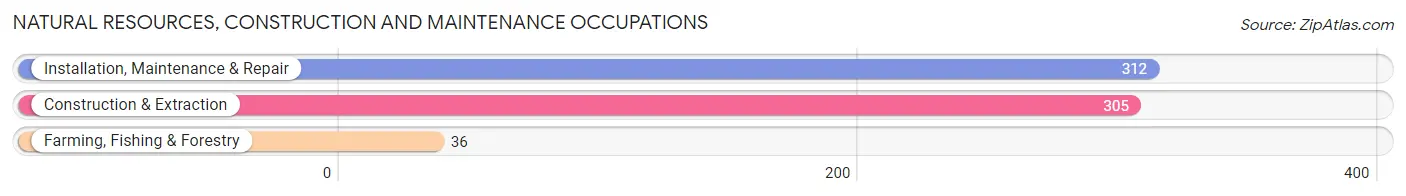
Natural Resources, Construction and Maintenance Occupations
The most common Natural Resources, Construction and Maintenance occupations in Vero Beach are Installation, Maintenance & Repair (312 | 4.2%), Construction & Extraction (305 | 4.1%), and Farming, Fishing & Forestry (36 | 0.5%).
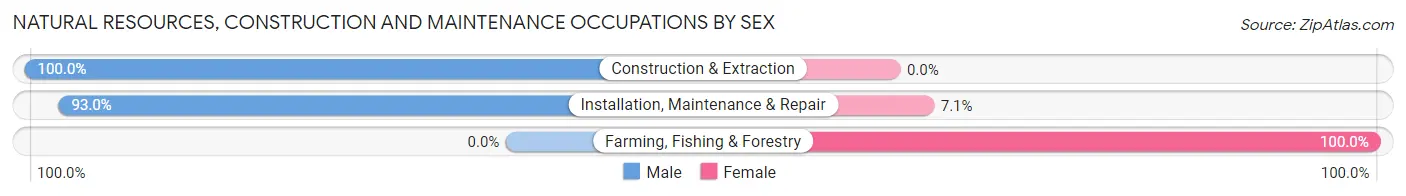
Natural Resources, Construction and Maintenance Occupations by Sex
| Occupation | Male | Female |
| Farming, Fishing & Forestry | 0 (0.0%) | 36 (100.0%) |
| Construction & Extraction | 305 (100.0%) | 0 (0.0%) |
| Installation, Maintenance & Repair | 290 (92.9%) | 22 (7.0%) |
| Total (Category) | 595 (91.1%) | 58 (8.9%) |
| Total (Overall) | 3,698 (49.8%) | 3,725 (50.2%) |
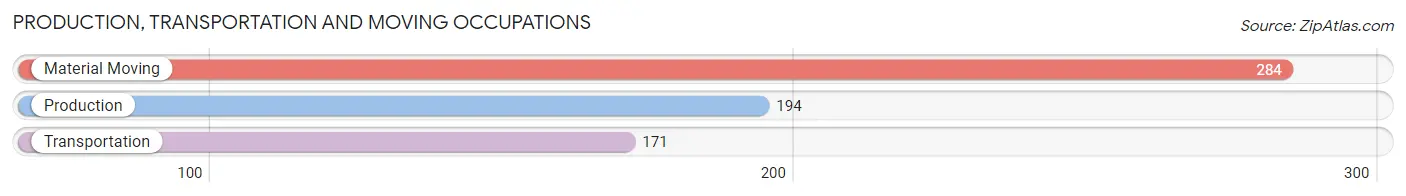
Production, Transportation and Moving Occupations
The most common Production, Transportation and Moving occupations in Vero Beach are Material Moving (284 | 3.8%), Production (194 | 2.6%), and Transportation (171 | 2.3%).
Production, Transportation and Moving Occupations by Sex
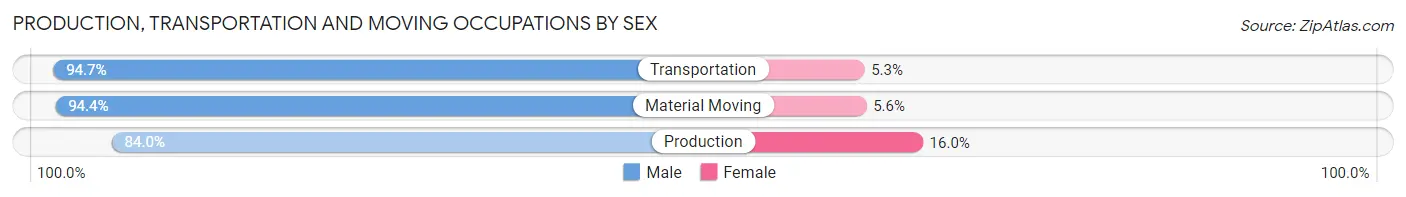
| Occupation | Male | Female |
| Production | 163 (84.0%) | 31 (16.0%) |
| Transportation | 162 (94.7%) | 9 (5.3%) |
| Material Moving | 268 (94.4%) | 16 (5.6%) |
| Total (Category) | 593 (91.4%) | 56 (8.6%) |
| Total (Overall) | 3,698 (49.8%) | 3,725 (50.2%) |
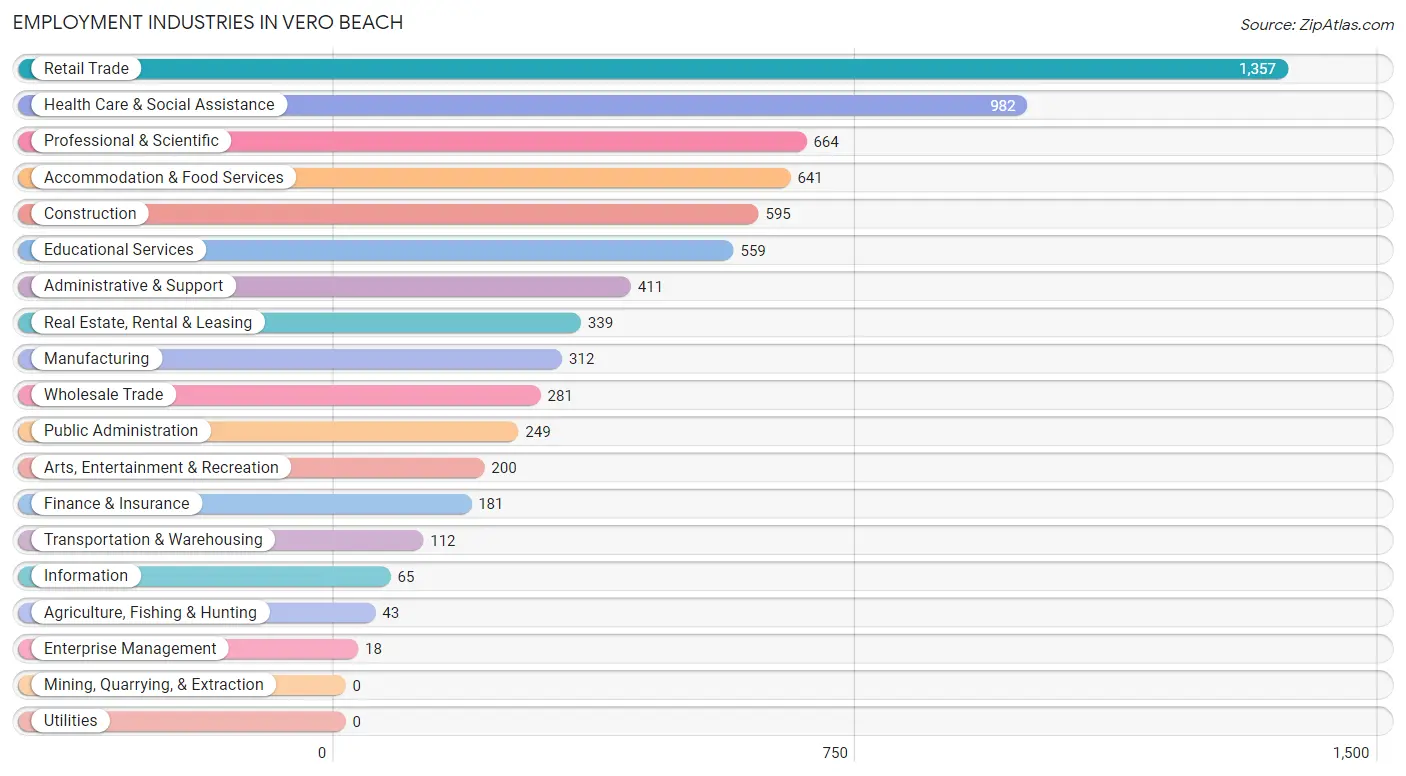
Employment Industries by Sex in Vero Beach
Employment Industries in Vero Beach
The major employment industries in Vero Beach include Retail Trade (1,357 | 18.3%), Health Care & Social Assistance (982 | 13.2%), Professional & Scientific (664 | 8.9%), Accommodation & Food Services (641 | 8.6%), and Construction (595 | 8.0%).
Employment Industries by Sex in Vero Beach
The Vero Beach industries that see more men than women are Wholesale Trade (97.9%), Construction (76.3%), and Transportation & Warehousing (75.0%), whereas the industries that tend to have a higher number of women are Enterprise Management (100.0%), Information (72.3%), and Health Care & Social Assistance (67.5%).
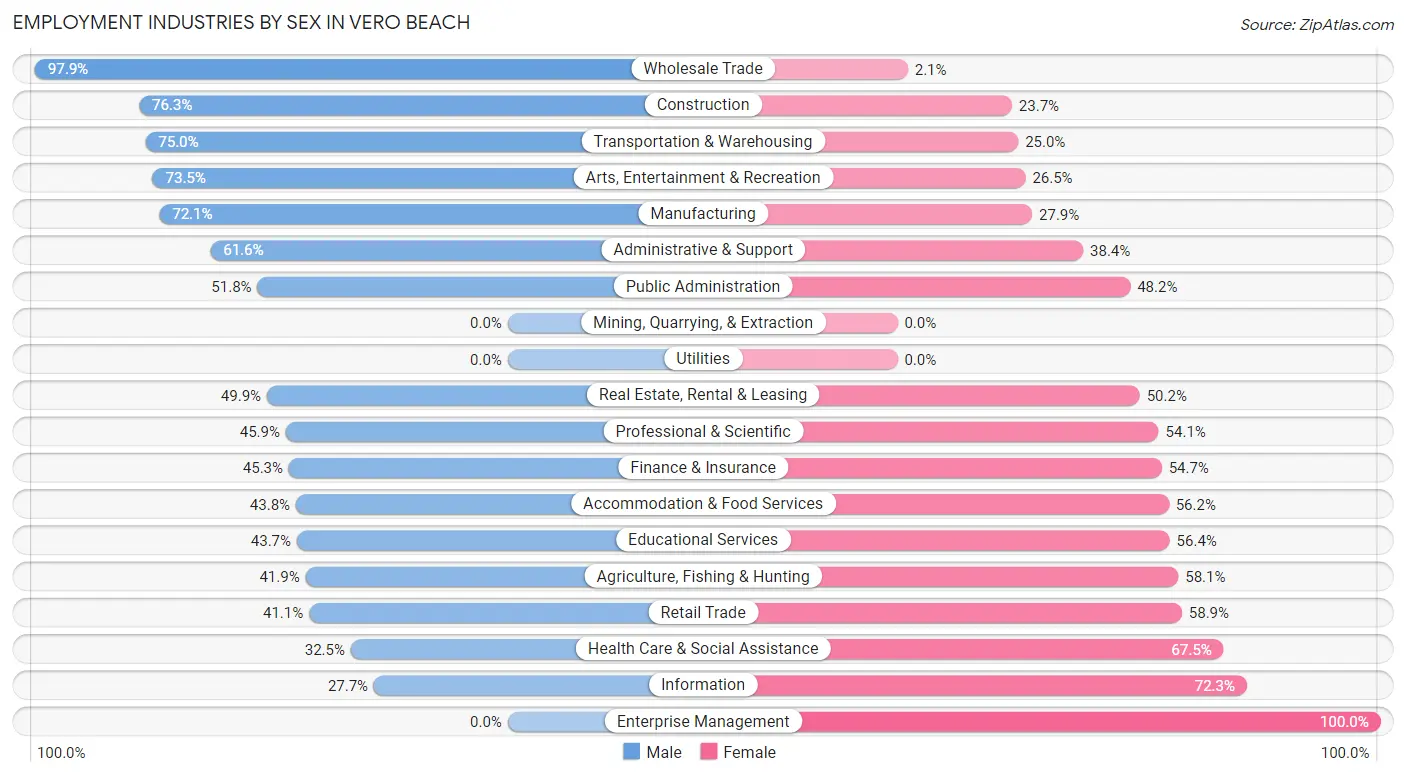
| Industry | Male | Female |
| Agriculture, Fishing & Hunting | 18 (41.9%) | 25 (58.1%) |
| Mining, Quarrying, & Extraction | 0 (0.0%) | 0 (0.0%) |
| Construction | 454 (76.3%) | 141 (23.7%) |
| Manufacturing | 225 (72.1%) | 87 (27.9%) |
| Wholesale Trade | 275 (97.9%) | 6 (2.1%) |
| Retail Trade | 558 (41.1%) | 799 (58.9%) |
| Transportation & Warehousing | 84 (75.0%) | 28 (25.0%) |
| Utilities | 0 (0.0%) | 0 (0.0%) |
| Information | 18 (27.7%) | 47 (72.3%) |
| Finance & Insurance | 82 (45.3%) | 99 (54.7%) |
| Real Estate, Rental & Leasing | 169 (49.8%) | 170 (50.1%) |
| Professional & Scientific | 305 (45.9%) | 359 (54.1%) |
| Enterprise Management | 0 (0.0%) | 18 (100.0%) |
| Administrative & Support | 253 (61.6%) | 158 (38.4%) |
| Educational Services | 244 (43.6%) | 315 (56.4%) |
| Health Care & Social Assistance | 319 (32.5%) | 663 (67.5%) |
| Arts, Entertainment & Recreation | 147 (73.5%) | 53 (26.5%) |
| Accommodation & Food Services | 281 (43.8%) | 360 (56.2%) |
| Public Administration | 129 (51.8%) | 120 (48.2%) |
| Total | 3,698 (49.8%) | 3,725 (50.2%) |
Education in Vero Beach
School Enrollment in Vero Beach
The most common levels of schooling among the 2,751 students in Vero Beach are college / undergraduate (836 | 30.4%), middle school (513 | 18.6%), and high school (506 | 18.4%).
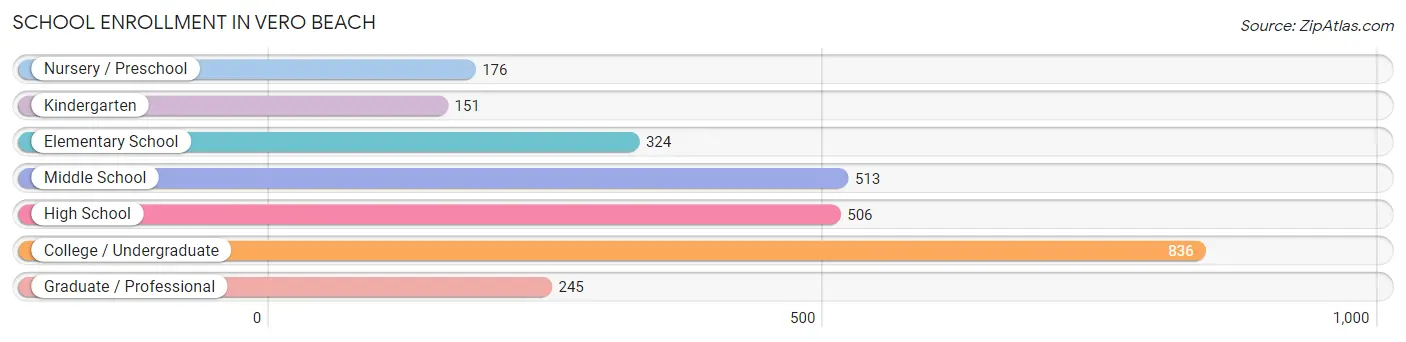
| School Level | # Students | % Students |
| Nursery / Preschool | 176 | 6.4% |
| Kindergarten | 151 | 5.5% |
| Elementary School | 324 | 11.8% |
| Middle School | 513 | 18.6% |
| High School | 506 | 18.4% |
| College / Undergraduate | 836 | 30.4% |
| Graduate / Professional | 245 | 8.9% |
| Total | 2,751 | 100.0% |
School Enrollment by Age by Funding Source in Vero Beach
Out of a total of 2,751 students who are enrolled in schools in Vero Beach, 1,202 (43.7%) attend a private institution, while the remaining 1,549 (56.3%) are enrolled in public schools. The age group of 3 to 4 year olds has the highest likelihood of being enrolled in private schools, with 138 (87.3% in the age bracket) enrolled. Conversely, the age group of 10 to 14 year olds has the lowest likelihood of being enrolled in a private school, with 461 (86.5% in the age bracket) attending a public institution.
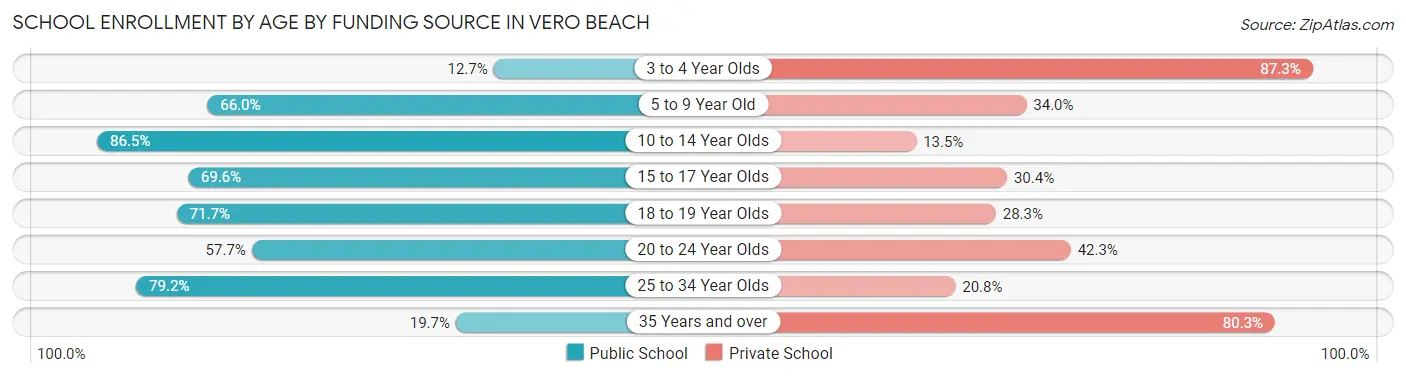
| Age Bracket | Public School | Private School |
| 3 to 4 Year Olds | 20 (12.7%) | 138 (87.3%) |
| 5 to 9 Year Old | 349 (66.0%) | 180 (34.0%) |
| 10 to 14 Year Olds | 461 (86.5%) | 72 (13.5%) |
| 15 to 17 Year Olds | 199 (69.6%) | 87 (30.4%) |
| 18 to 19 Year Olds | 129 (71.7%) | 51 (28.3%) |
| 20 to 24 Year Olds | 116 (57.7%) | 85 (42.3%) |
| 25 to 34 Year Olds | 141 (79.2%) | 37 (20.8%) |
| 35 Years and over | 135 (19.7%) | 551 (80.3%) |
| Total | 1,549 (56.3%) | 1,202 (43.7%) |
Educational Attainment by Field of Study in Vero Beach
Business (1,359 | 24.9%), social sciences (662 | 12.1%), education (584 | 10.7%), science & technology (527 | 9.7%), and psychology (424 | 7.8%) are the most common fields of study among 5,462 individuals in Vero Beach who have obtained a bachelor's degree or higher.
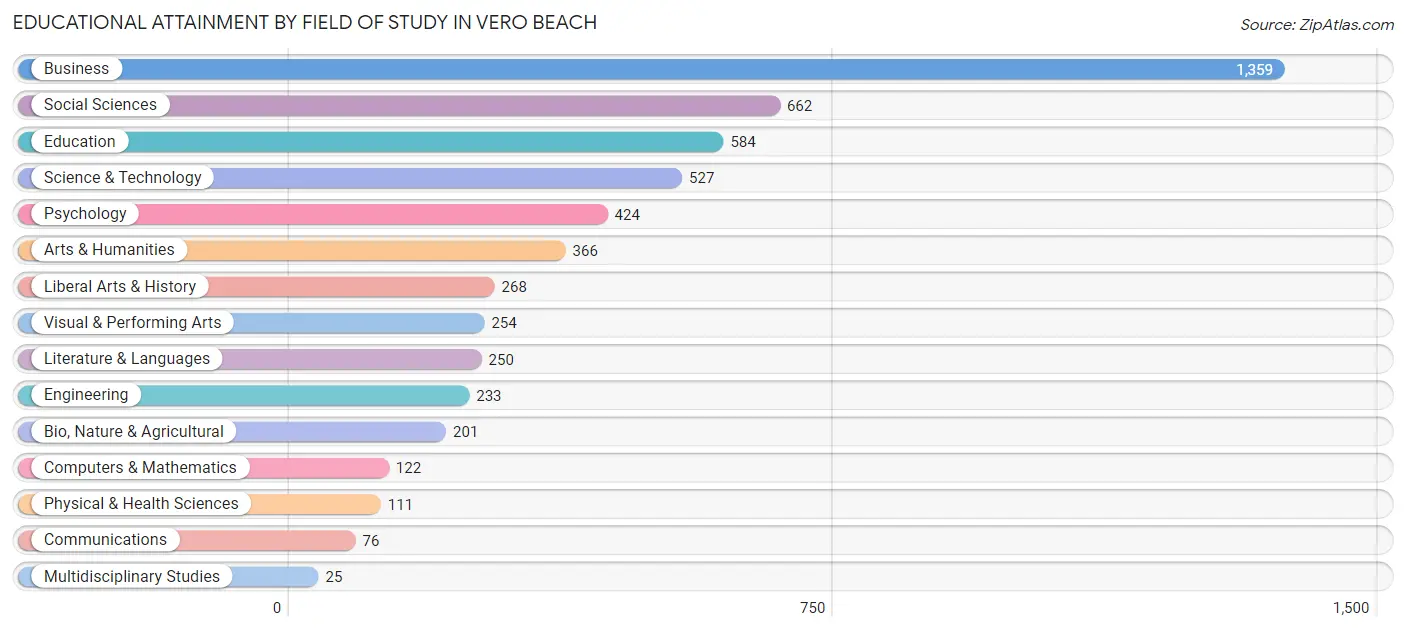
| Field of Study | # Graduates | % Graduates |
| Computers & Mathematics | 122 | 2.2% |
| Bio, Nature & Agricultural | 201 | 3.7% |
| Physical & Health Sciences | 111 | 2.0% |
| Psychology | 424 | 7.8% |
| Social Sciences | 662 | 12.1% |
| Engineering | 233 | 4.3% |
| Multidisciplinary Studies | 25 | 0.5% |
| Science & Technology | 527 | 9.7% |
| Business | 1,359 | 24.9% |
| Education | 584 | 10.7% |
| Literature & Languages | 250 | 4.6% |
| Liberal Arts & History | 268 | 4.9% |
| Visual & Performing Arts | 254 | 4.6% |
| Communications | 76 | 1.4% |
| Arts & Humanities | 366 | 6.7% |
| Total | 5,462 | 100.0% |
Transportation & Commute in Vero Beach
Vehicle Availability by Sex in Vero Beach
The most prevalent vehicle ownership categories in Vero Beach are males with 2 vehicles (2,023, accounting for 49.6%) and females with 2 vehicles (1,546, making up 56.1%).
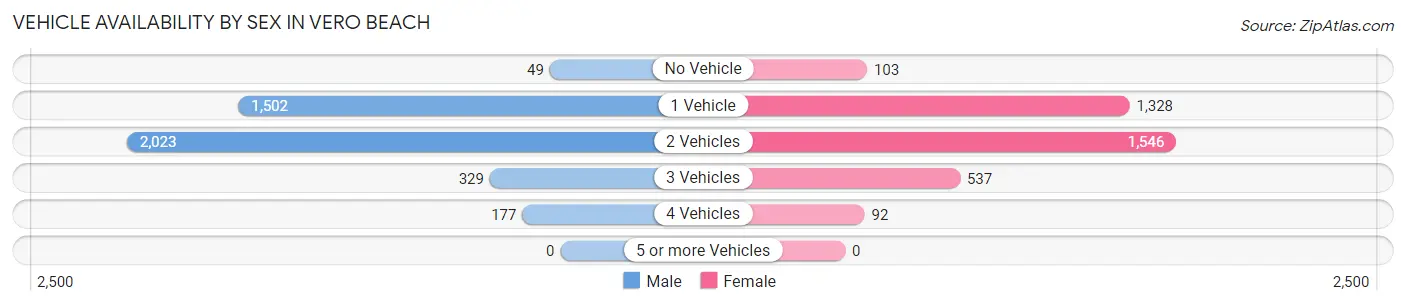
| Vehicles Available | Male | Female |
| No Vehicle | 49 (1.2%) | 103 (2.9%) |
| 1 Vehicle | 1,502 (36.8%) | 1,328 (36.8%) |
| 2 Vehicles | 2,023 (49.6%) | 1,546 (42.9%) |
| 3 Vehicles | 329 (8.1%) | 537 (14.9%) |
| 4 Vehicles | 177 (4.3%) | 92 (2.5%) |
| 5 or more Vehicles | 0 (0.0%) | 0 (0.0%) |
| Total | 4,080 (100.0%) | 3,606 (100.0%) |
Commute Time in Vero Beach
The most frequently occuring commute durations in Vero Beach are 10 to 14 minutes (2,123 commuters, 30.4%), 5 to 9 minutes (1,678 commuters, 24.0%), and 15 to 19 minutes (1,236 commuters, 17.7%).
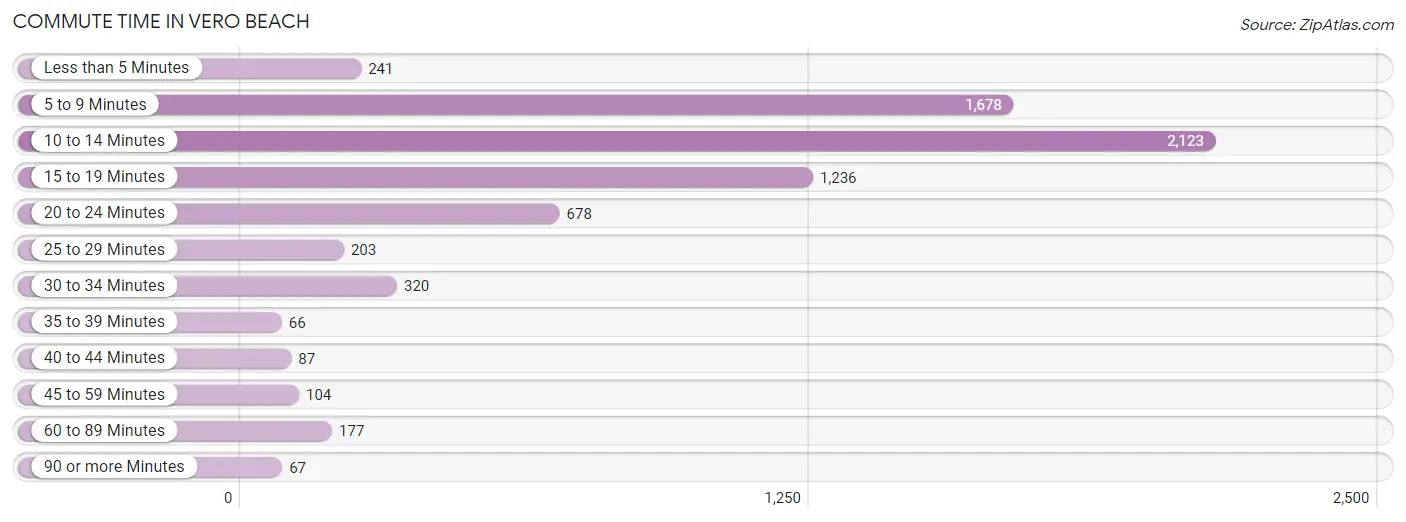
| Commute Time | # Commuters | % Commuters |
| Less than 5 Minutes | 241 | 3.5% |
| 5 to 9 Minutes | 1,678 | 24.0% |
| 10 to 14 Minutes | 2,123 | 30.4% |
| 15 to 19 Minutes | 1,236 | 17.7% |
| 20 to 24 Minutes | 678 | 9.7% |
| 25 to 29 Minutes | 203 | 2.9% |
| 30 to 34 Minutes | 320 | 4.6% |
| 35 to 39 Minutes | 66 | 0.9% |
| 40 to 44 Minutes | 87 | 1.3% |
| 45 to 59 Minutes | 104 | 1.5% |
| 60 to 89 Minutes | 177 | 2.5% |
| 90 or more Minutes | 67 | 1.0% |
Commute Time by Sex in Vero Beach
The most common commute times in Vero Beach are 10 to 14 minutes (1,318 commuters, 35.2%) for males and 5 to 9 minutes (853 commuters, 26.4%) for females.
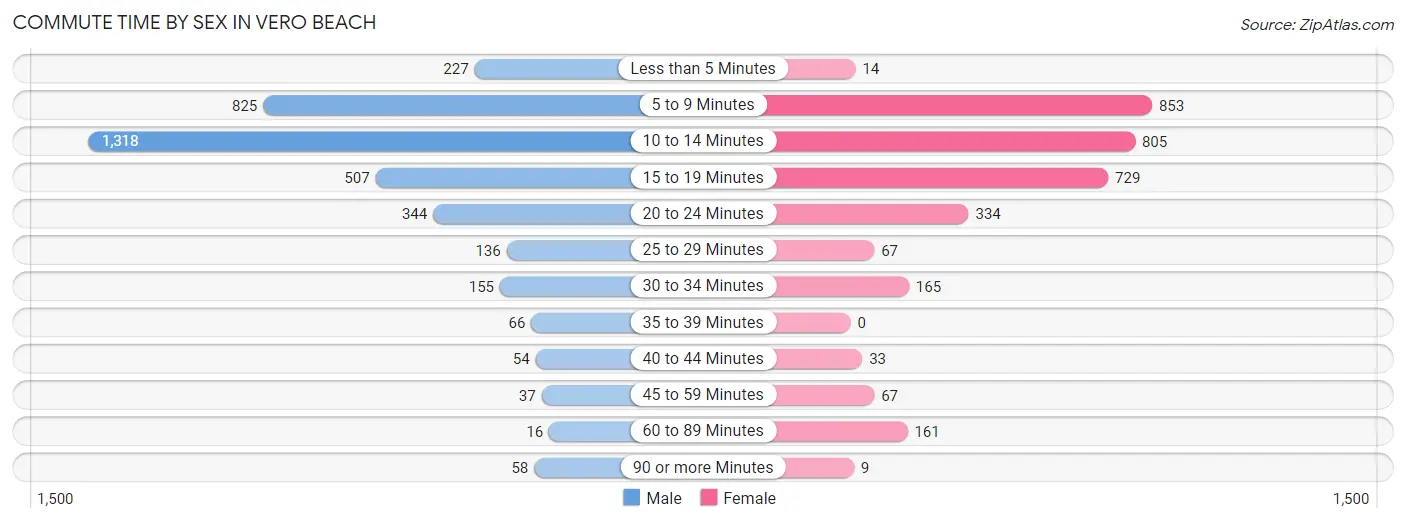
| Commute Time | Male | Female |
| Less than 5 Minutes | 227 (6.1%) | 14 (0.4%) |
| 5 to 9 Minutes | 825 (22.0%) | 853 (26.4%) |
| 10 to 14 Minutes | 1,318 (35.2%) | 805 (24.9%) |
| 15 to 19 Minutes | 507 (13.6%) | 729 (22.5%) |
| 20 to 24 Minutes | 344 (9.2%) | 334 (10.3%) |
| 25 to 29 Minutes | 136 (3.6%) | 67 (2.1%) |
| 30 to 34 Minutes | 155 (4.1%) | 165 (5.1%) |
| 35 to 39 Minutes | 66 (1.8%) | 0 (0.0%) |
| 40 to 44 Minutes | 54 (1.4%) | 33 (1.0%) |
| 45 to 59 Minutes | 37 (1.0%) | 67 (2.1%) |
| 60 to 89 Minutes | 16 (0.4%) | 161 (5.0%) |
| 90 or more Minutes | 58 (1.5%) | 9 (0.3%) |
Time of Departure to Work by Sex in Vero Beach
The most frequent times of departure to work in Vero Beach are 9:00 AM to 9:59 AM (570, 15.2%) for males and 7:30 AM to 7:59 AM (476, 14.7%) for females.
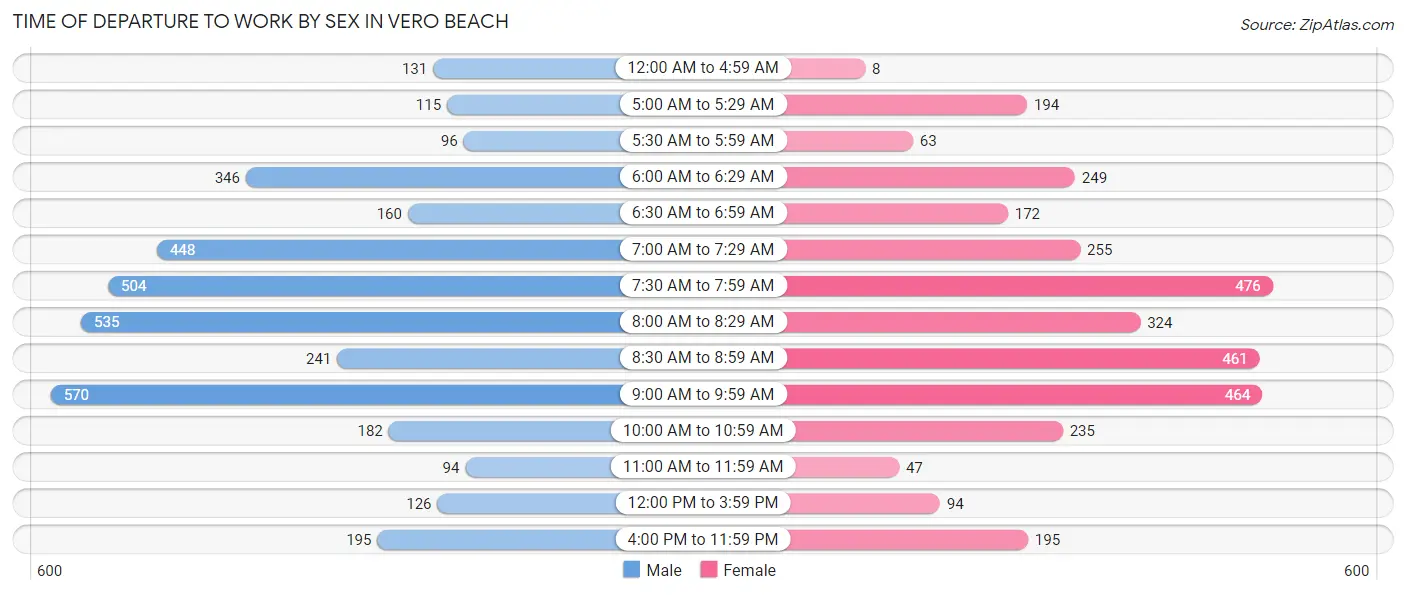
| Time of Departure | Male | Female |
| 12:00 AM to 4:59 AM | 131 (3.5%) | 8 (0.3%) |
| 5:00 AM to 5:29 AM | 115 (3.1%) | 194 (6.0%) |
| 5:30 AM to 5:59 AM | 96 (2.6%) | 63 (1.9%) |
| 6:00 AM to 6:29 AM | 346 (9.2%) | 249 (7.7%) |
| 6:30 AM to 6:59 AM | 160 (4.3%) | 172 (5.3%) |
| 7:00 AM to 7:29 AM | 448 (12.0%) | 255 (7.9%) |
| 7:30 AM to 7:59 AM | 504 (13.5%) | 476 (14.7%) |
| 8:00 AM to 8:29 AM | 535 (14.3%) | 324 (10.0%) |
| 8:30 AM to 8:59 AM | 241 (6.4%) | 461 (14.2%) |
| 9:00 AM to 9:59 AM | 570 (15.2%) | 464 (14.3%) |
| 10:00 AM to 10:59 AM | 182 (4.9%) | 235 (7.3%) |
| 11:00 AM to 11:59 AM | 94 (2.5%) | 47 (1.5%) |
| 12:00 PM to 3:59 PM | 126 (3.4%) | 94 (2.9%) |
| 4:00 PM to 11:59 PM | 195 (5.2%) | 195 (6.0%) |
| Total | 3,743 (100.0%) | 3,237 (100.0%) |
Housing Occupancy in Vero Beach
Occupancy by Ownership in Vero Beach
Of the total 7,725 dwellings in Vero Beach, owner-occupied units account for 5,134 (66.5%), while renter-occupied units make up 2,591 (33.5%).
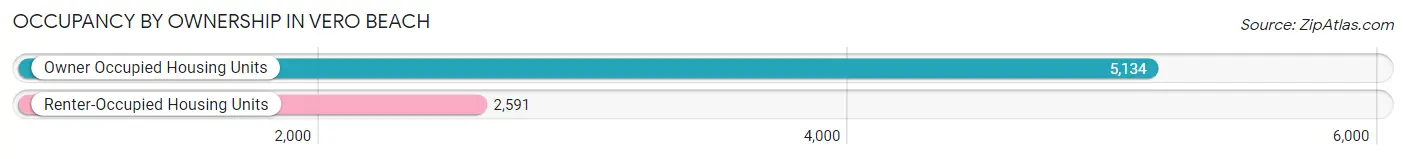
| Occupancy | # Housing Units | % Housing Units |
| Owner Occupied Housing Units | 5,134 | 66.5% |
| Renter-Occupied Housing Units | 2,591 | 33.5% |
| Total Occupied Housing Units | 7,725 | 100.0% |
Occupancy by Household Size in Vero Beach
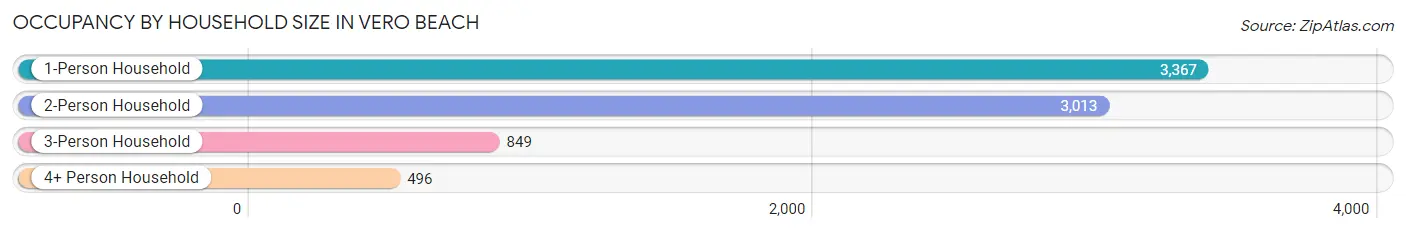
| Household Size | # Housing Units | % Housing Units |
| 1-Person Household | 3,367 | 43.6% |
| 2-Person Household | 3,013 | 39.0% |
| 3-Person Household | 849 | 11.0% |
| 4+ Person Household | 496 | 6.4% |
| Total Housing Units | 7,725 | 100.0% |
Occupancy by Ownership by Household Size in Vero Beach
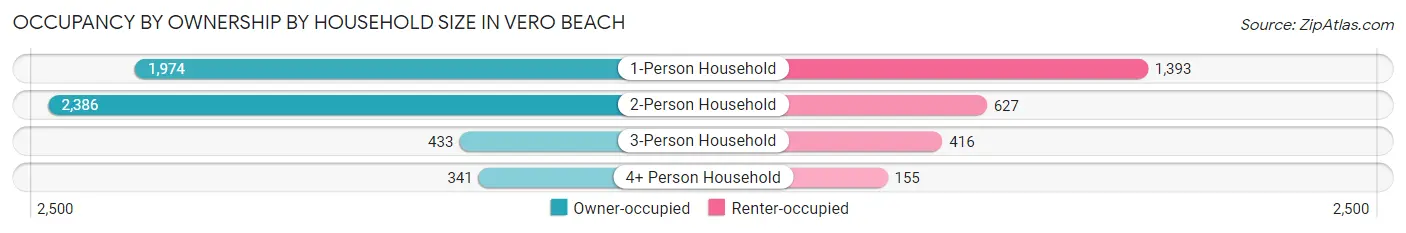
| Household Size | Owner-occupied | Renter-occupied |
| 1-Person Household | 1,974 (58.6%) | 1,393 (41.4%) |
| 2-Person Household | 2,386 (79.2%) | 627 (20.8%) |
| 3-Person Household | 433 (51.0%) | 416 (49.0%) |
| 4+ Person Household | 341 (68.8%) | 155 (31.2%) |
| Total Housing Units | 5,134 (66.5%) | 2,591 (33.5%) |
Occupancy by Educational Attainment in Vero Beach
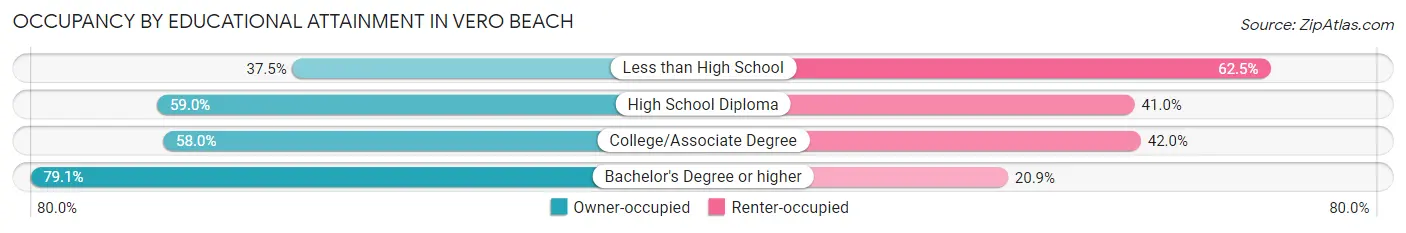
| Household Size | Owner-occupied | Renter-occupied |
| Less than High School | 132 (37.5%) | 220 (62.5%) |
| High School Diploma | 836 (59.0%) | 581 (41.0%) |
| College/Associate Degree | 1,503 (58.0%) | 1,087 (42.0%) |
| Bachelor's Degree or higher | 2,663 (79.1%) | 703 (20.9%) |
Occupancy by Age of Householder in Vero Beach
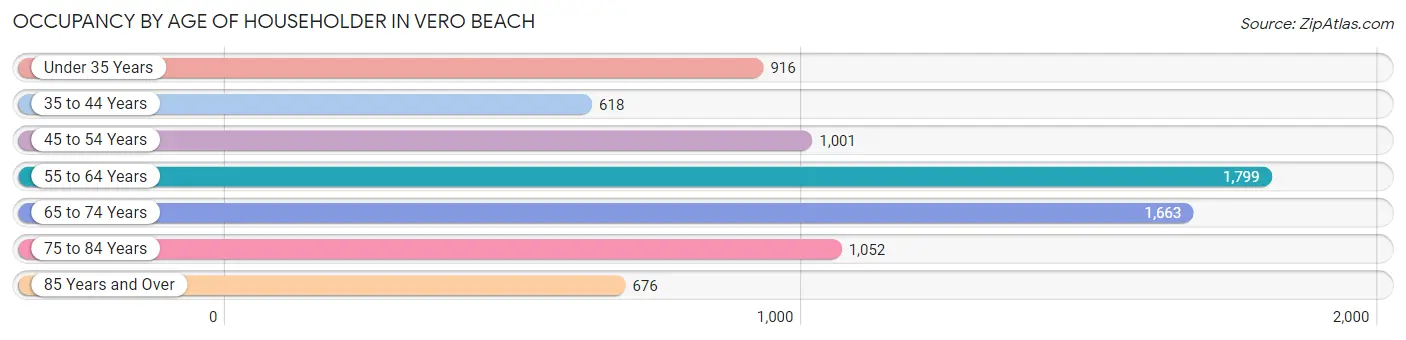
| Age Bracket | # Households | % Households |
| Under 35 Years | 916 | 11.9% |
| 35 to 44 Years | 618 | 8.0% |
| 45 to 54 Years | 1,001 | 13.0% |
| 55 to 64 Years | 1,799 | 23.3% |
| 65 to 74 Years | 1,663 | 21.5% |
| 75 to 84 Years | 1,052 | 13.6% |
| 85 Years and Over | 676 | 8.7% |
| Total | 7,725 | 100.0% |
Housing Finances in Vero Beach
Median Income by Occupancy in Vero Beach
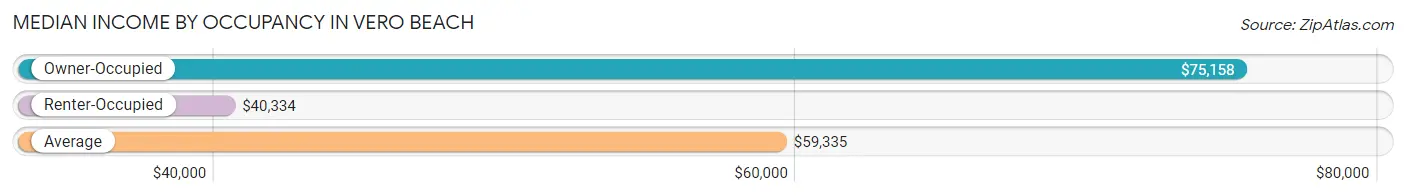
| Occupancy Type | # Households | Median Income |
| Owner-Occupied | 5,134 (66.5%) | $75,158 |
| Renter-Occupied | 2,591 (33.5%) | $40,334 |
| Average | 7,725 (100.0%) | $59,335 |
Occupancy by Householder Income Bracket in Vero Beach
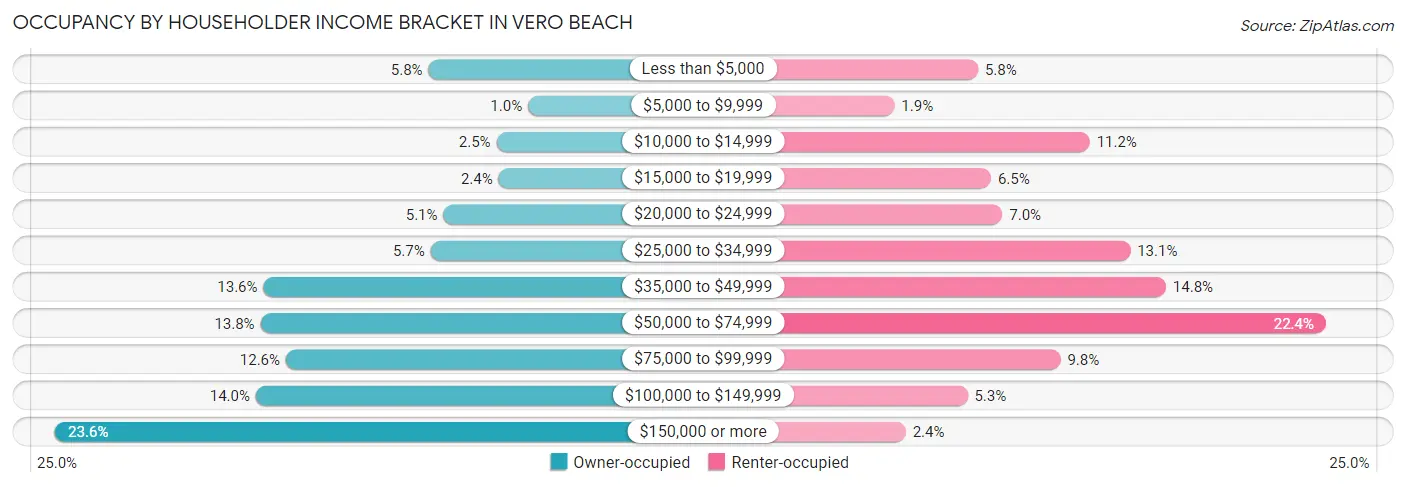
| Income Bracket | Owner-occupied | Renter-occupied |
| Less than $5,000 | 296 (5.8%) | 151 (5.8%) |
| $5,000 to $9,999 | 53 (1.0%) | 48 (1.8%) |
| $10,000 to $14,999 | 130 (2.5%) | 289 (11.2%) |
| $15,000 to $19,999 | 125 (2.4%) | 167 (6.5%) |
| $20,000 to $24,999 | 260 (5.1%) | 181 (7.0%) |
| $25,000 to $34,999 | 291 (5.7%) | 339 (13.1%) |
| $35,000 to $49,999 | 700 (13.6%) | 383 (14.8%) |
| $50,000 to $74,999 | 707 (13.8%) | 580 (22.4%) |
| $75,000 to $99,999 | 645 (12.6%) | 253 (9.8%) |
| $100,000 to $149,999 | 718 (14.0%) | 138 (5.3%) |
| $150,000 or more | 1,209 (23.5%) | 62 (2.4%) |
| Total | 5,134 (100.0%) | 2,591 (100.0%) |
Monthly Housing Cost Tiers in Vero Beach
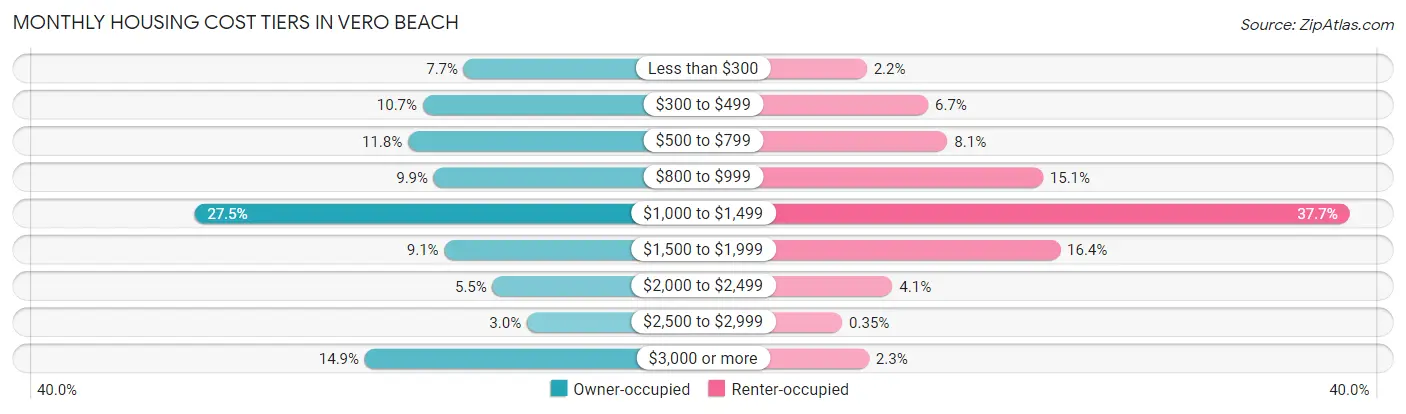
| Monthly Cost | Owner-occupied | Renter-occupied |
| Less than $300 | 393 (7.6%) | 56 (2.2%) |
| $300 to $499 | 548 (10.7%) | 173 (6.7%) |
| $500 to $799 | 604 (11.8%) | 210 (8.1%) |
| $800 to $999 | 506 (9.9%) | 392 (15.1%) |
| $1,000 to $1,499 | 1,412 (27.5%) | 977 (37.7%) |
| $1,500 to $1,999 | 466 (9.1%) | 425 (16.4%) |
| $2,000 to $2,499 | 284 (5.5%) | 105 (4.1%) |
| $2,500 to $2,999 | 154 (3.0%) | 9 (0.4%) |
| $3,000 or more | 767 (14.9%) | 60 (2.3%) |
| Total | 5,134 (100.0%) | 2,591 (100.0%) |
Physical Housing Characteristics in Vero Beach
Housing Structures in Vero Beach
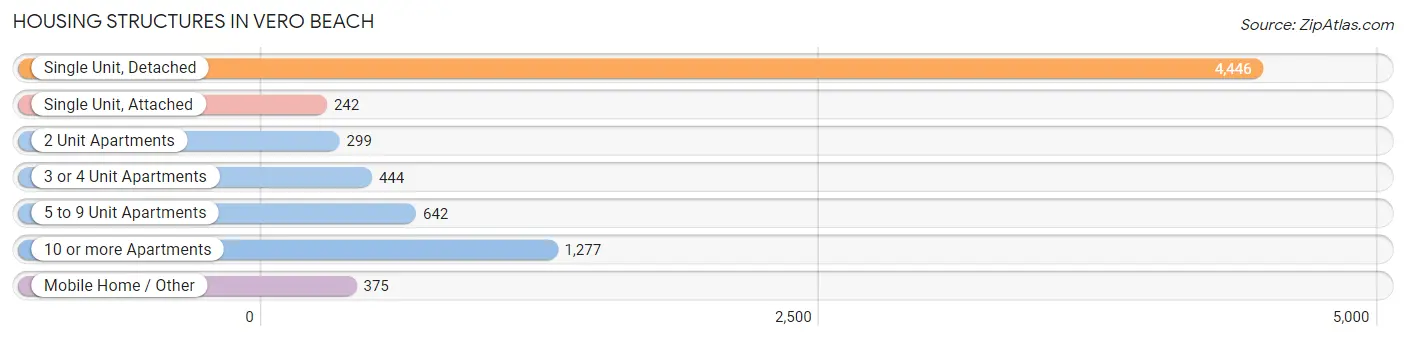
| Structure Type | # Housing Units | % Housing Units |
| Single Unit, Detached | 4,446 | 57.6% |
| Single Unit, Attached | 242 | 3.1% |
| 2 Unit Apartments | 299 | 3.9% |
| 3 or 4 Unit Apartments | 444 | 5.8% |
| 5 to 9 Unit Apartments | 642 | 8.3% |
| 10 or more Apartments | 1,277 | 16.5% |
| Mobile Home / Other | 375 | 4.9% |
| Total | 7,725 | 100.0% |
Housing Structures by Occupancy in Vero Beach
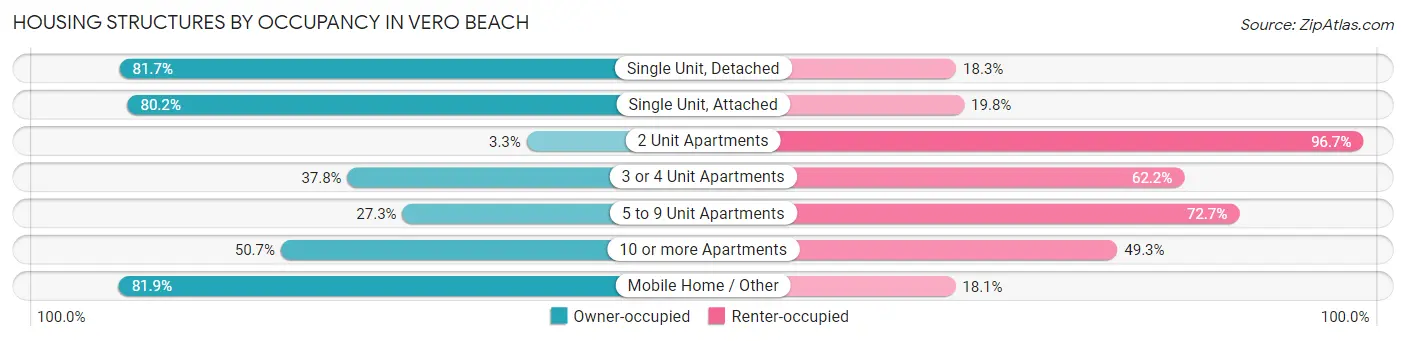
| Structure Type | Owner-occupied | Renter-occupied |
| Single Unit, Detached | 3,633 (81.7%) | 813 (18.3%) |
| Single Unit, Attached | 194 (80.2%) | 48 (19.8%) |
| 2 Unit Apartments | 10 (3.3%) | 289 (96.7%) |
| 3 or 4 Unit Apartments | 168 (37.8%) | 276 (62.2%) |
| 5 to 9 Unit Apartments | 175 (27.3%) | 467 (72.7%) |
| 10 or more Apartments | 647 (50.7%) | 630 (49.3%) |
| Mobile Home / Other | 307 (81.9%) | 68 (18.1%) |
| Total | 5,134 (66.5%) | 2,591 (33.5%) |
Housing Structures by Number of Rooms in Vero Beach
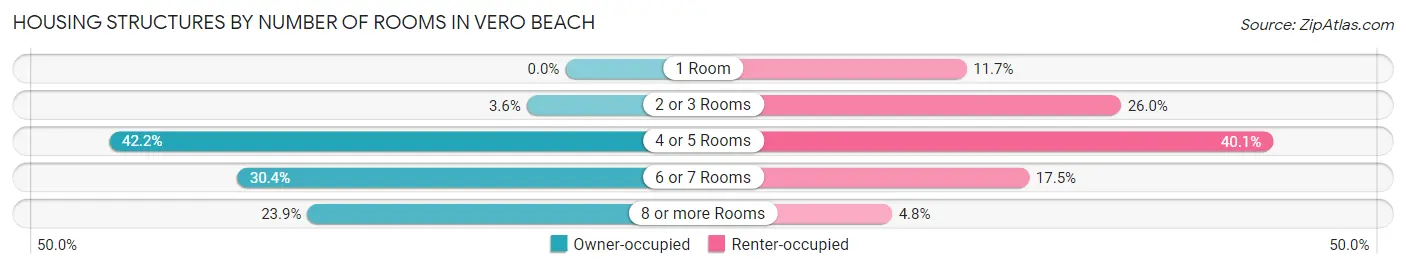
| Number of Rooms | Owner-occupied | Renter-occupied |
| 1 Room | 0 (0.0%) | 303 (11.7%) |
| 2 or 3 Rooms | 184 (3.6%) | 673 (26.0%) |
| 4 or 5 Rooms | 2,166 (42.2%) | 1,038 (40.1%) |
| 6 or 7 Rooms | 1,559 (30.4%) | 453 (17.5%) |
| 8 or more Rooms | 1,225 (23.9%) | 124 (4.8%) |
| Total | 5,134 (100.0%) | 2,591 (100.0%) |
Housing Structure by Heating Type in Vero Beach
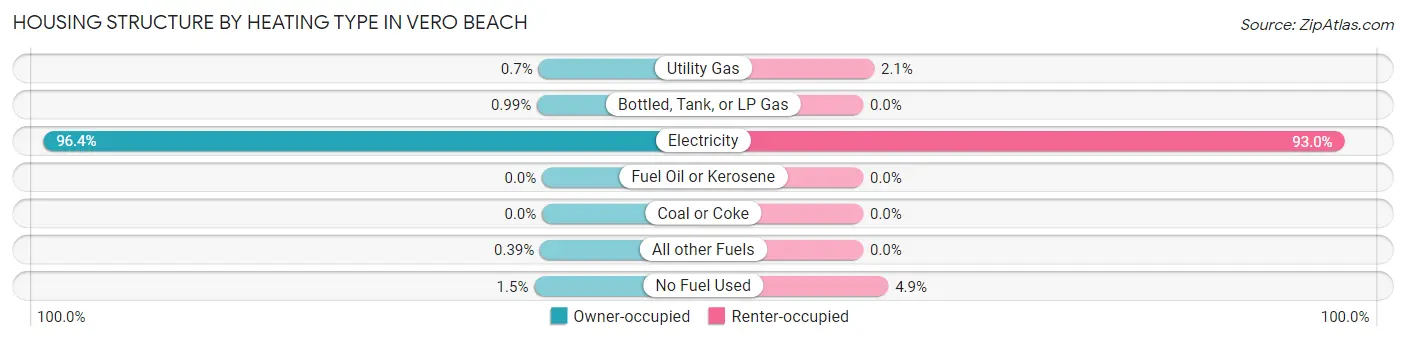
| Heating Type | Owner-occupied | Renter-occupied |
| Utility Gas | 36 (0.7%) | 55 (2.1%) |
| Bottled, Tank, or LP Gas | 51 (1.0%) | 0 (0.0%) |
| Electricity | 4,949 (96.4%) | 2,410 (93.0%) |
| Fuel Oil or Kerosene | 0 (0.0%) | 0 (0.0%) |
| Coal or Coke | 0 (0.0%) | 0 (0.0%) |
| All other Fuels | 20 (0.4%) | 0 (0.0%) |
| No Fuel Used | 78 (1.5%) | 126 (4.9%) |
| Total | 5,134 (100.0%) | 2,591 (100.0%) |
Household Vehicle Usage in Vero Beach
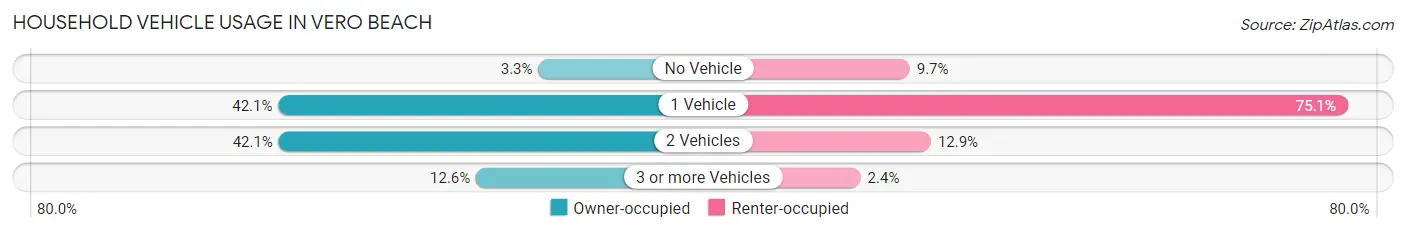
| Vehicles per Household | Owner-occupied | Renter-occupied |
| No Vehicle | 168 (3.3%) | 251 (9.7%) |
| 1 Vehicle | 2,162 (42.1%) | 1,946 (75.1%) |
| 2 Vehicles | 2,159 (42.0%) | 333 (12.9%) |
| 3 or more Vehicles | 645 (12.6%) | 61 (2.4%) |
| Total | 5,134 (100.0%) | 2,591 (100.0%) |
Real Estate & Mortgages in Vero Beach
Real Estate and Mortgage Overview in Vero Beach
| Characteristic | Without Mortgage | With Mortgage |
| Housing Units | 2,988 | 2,146 |
| Median Property Value | $373,000 | $297,000 |
| Median Household Income | $64,103 | $566 |
| Monthly Housing Costs | $864 | $692 |
| Real Estate Taxes | $3,457 | $50 |
Property Value by Mortgage Status in Vero Beach
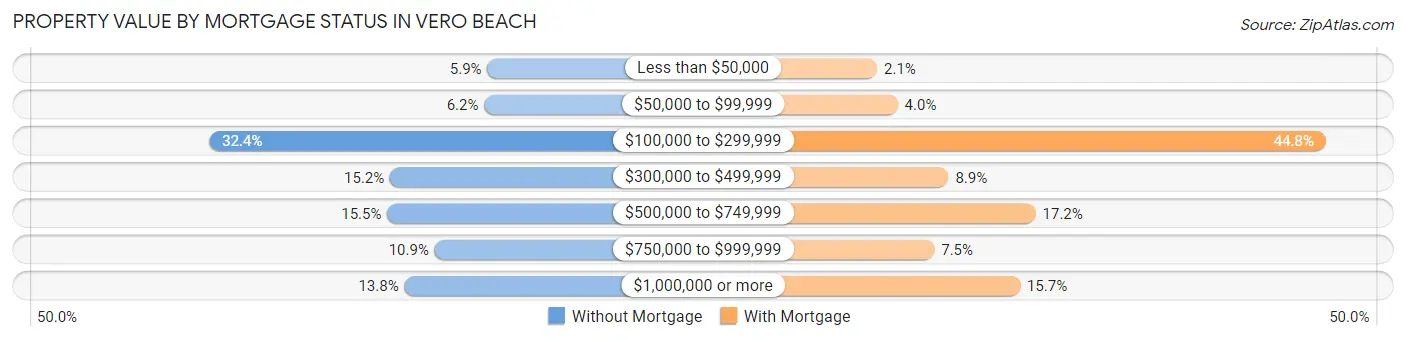
| Property Value | Without Mortgage | With Mortgage |
| Less than $50,000 | 177 (5.9%) | 44 (2.1%) |
| $50,000 to $99,999 | 186 (6.2%) | 86 (4.0%) |
| $100,000 to $299,999 | 969 (32.4%) | 961 (44.8%) |
| $300,000 to $499,999 | 454 (15.2%) | 190 (8.8%) |
| $500,000 to $749,999 | 462 (15.5%) | 368 (17.2%) |
| $750,000 to $999,999 | 327 (10.9%) | 161 (7.5%) |
| $1,000,000 or more | 413 (13.8%) | 336 (15.7%) |
| Total | 2,988 (100.0%) | 2,146 (100.0%) |
Household Income by Mortgage Status in Vero Beach
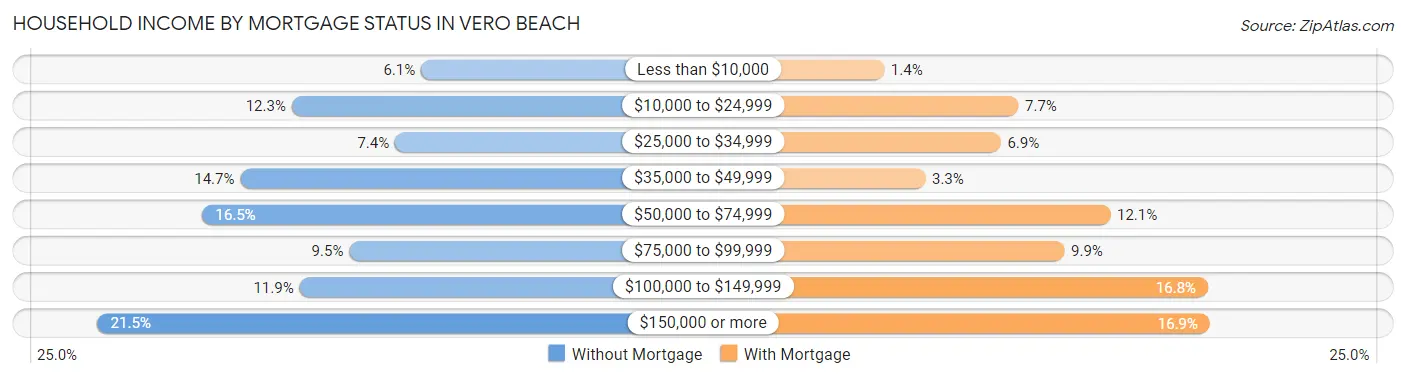
| Household Income | Without Mortgage | With Mortgage |
| Less than $10,000 | 183 (6.1%) | 29 (1.3%) |
| $10,000 to $24,999 | 367 (12.3%) | 166 (7.7%) |
| $25,000 to $34,999 | 220 (7.4%) | 148 (6.9%) |
| $35,000 to $49,999 | 440 (14.7%) | 71 (3.3%) |
| $50,000 to $74,999 | 494 (16.5%) | 260 (12.1%) |
| $75,000 to $99,999 | 285 (9.5%) | 213 (9.9%) |
| $100,000 to $149,999 | 356 (11.9%) | 360 (16.8%) |
| $150,000 or more | 643 (21.5%) | 362 (16.9%) |
| Total | 2,988 (100.0%) | 2,146 (100.0%) |
Property Value to Household Income Ratio in Vero Beach
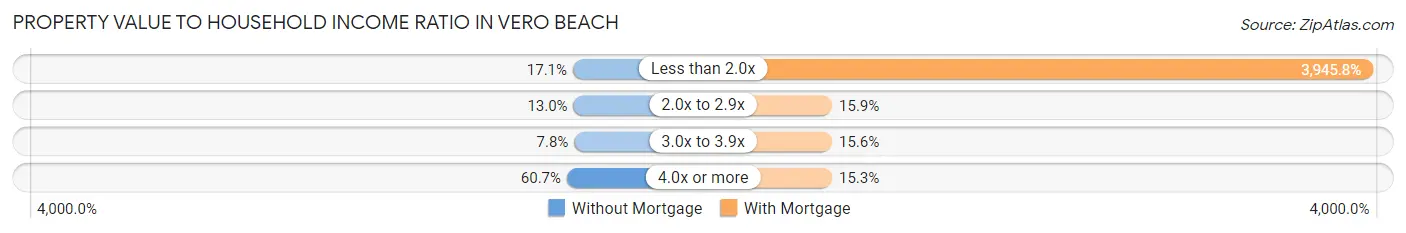
| Value-to-Income Ratio | Without Mortgage | With Mortgage |
| Less than 2.0x | 511 (17.1%) | 84,677 (3,945.8%) |
| 2.0x to 2.9x | 388 (13.0%) | 341 (15.9%) |
| 3.0x to 3.9x | 233 (7.8%) | 334 (15.6%) |
| 4.0x or more | 1,813 (60.7%) | 328 (15.3%) |
| Total | 2,988 (100.0%) | 2,146 (100.0%) |
Real Estate Taxes by Mortgage Status in Vero Beach
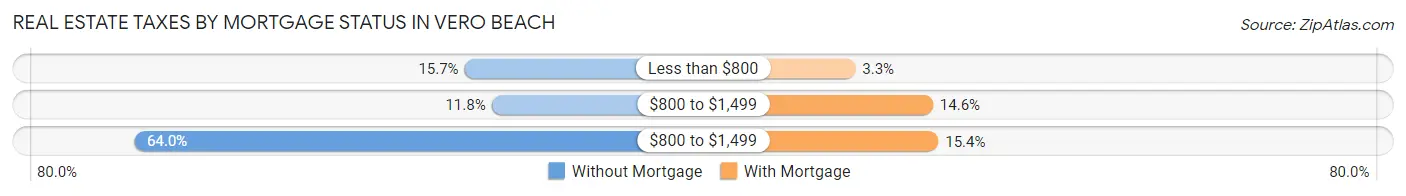
| Property Taxes | Without Mortgage | With Mortgage |
| Less than $800 | 470 (15.7%) | 70 (3.3%) |
| $800 to $1,499 | 352 (11.8%) | 313 (14.6%) |
| $800 to $1,499 | 1,913 (64.0%) | 330 (15.4%) |
| Total | 2,988 (100.0%) | 2,146 (100.0%) |
Health & Disability in Vero Beach
Health Insurance Coverage by Age in Vero Beach
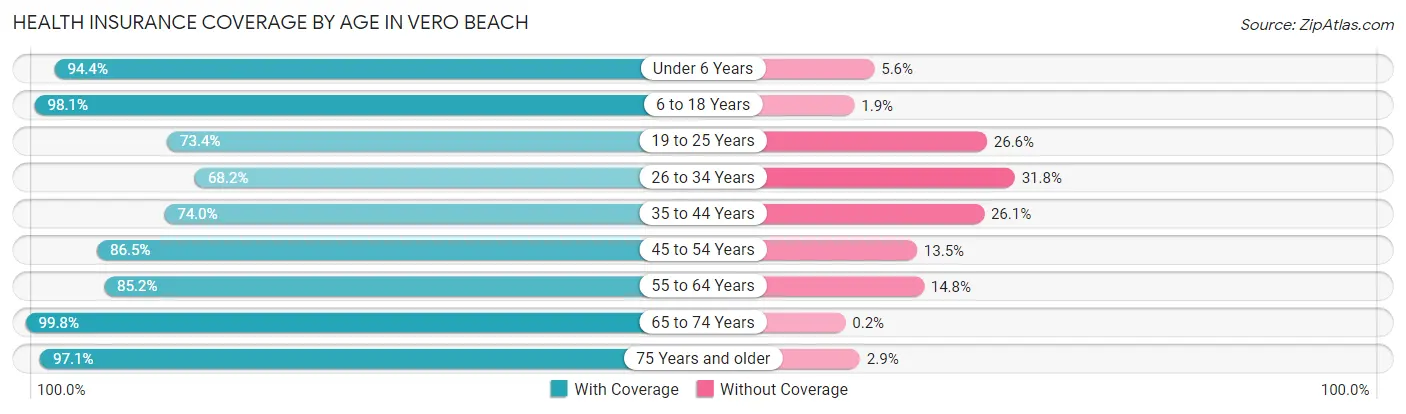
| Age Bracket | With Coverage | Without Coverage |
| Under 6 Years | 777 (94.4%) | 46 (5.6%) |
| 6 to 18 Years | 1,419 (98.1%) | 27 (1.9%) |
| 19 to 25 Years | 657 (73.4%) | 238 (26.6%) |
| 26 to 34 Years | 1,155 (68.2%) | 538 (31.8%) |
| 35 to 44 Years | 1,019 (74.0%) | 359 (26.1%) |
| 45 to 54 Years | 1,571 (86.5%) | 246 (13.5%) |
| 55 to 64 Years | 2,662 (85.2%) | 463 (14.8%) |
| 65 to 74 Years | 2,517 (99.8%) | 5 (0.2%) |
| 75 Years and older | 2,267 (97.1%) | 68 (2.9%) |
| Total | 14,044 (87.6%) | 1,990 (12.4%) |
Health Insurance Coverage by Citizenship Status in Vero Beach
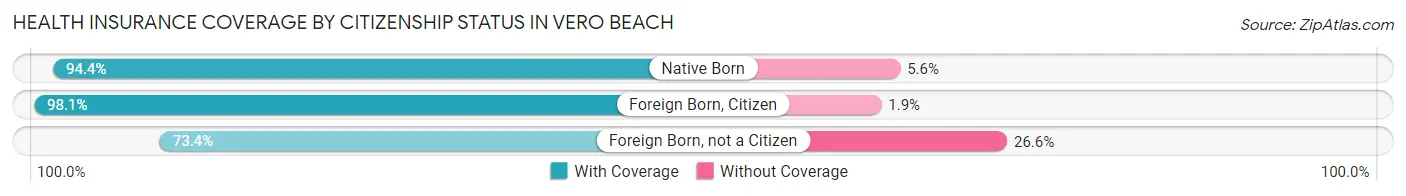
| Citizenship Status | With Coverage | Without Coverage |
| Native Born | 777 (94.4%) | 46 (5.6%) |
| Foreign Born, Citizen | 1,419 (98.1%) | 27 (1.9%) |
| Foreign Born, not a Citizen | 657 (73.4%) | 238 (26.6%) |
Health Insurance Coverage by Household Income in Vero Beach
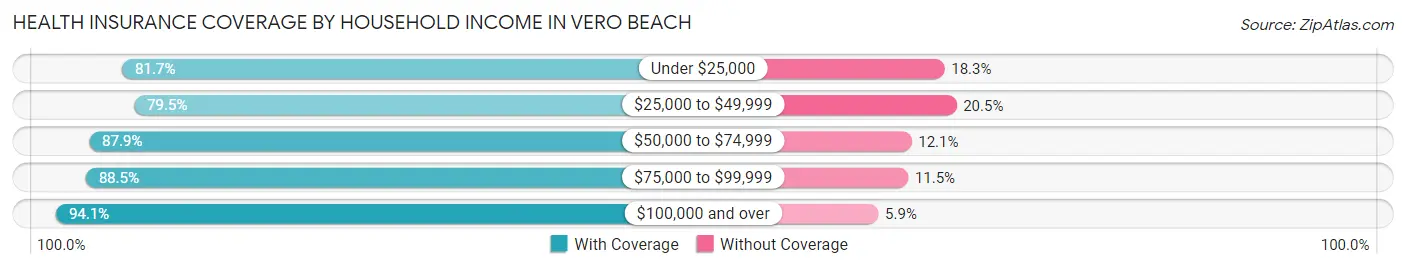
| Household Income | With Coverage | Without Coverage |
| Under $25,000 | 2,103 (81.7%) | 470 (18.3%) |
| $25,000 to $49,999 | 2,242 (79.5%) | 578 (20.5%) |
| $50,000 to $74,999 | 2,378 (87.9%) | 327 (12.1%) |
| $75,000 to $99,999 | 2,457 (88.5%) | 318 (11.5%) |
| $100,000 and over | 4,741 (94.1%) | 296 (5.9%) |
Public vs Private Health Insurance Coverage by Age in Vero Beach
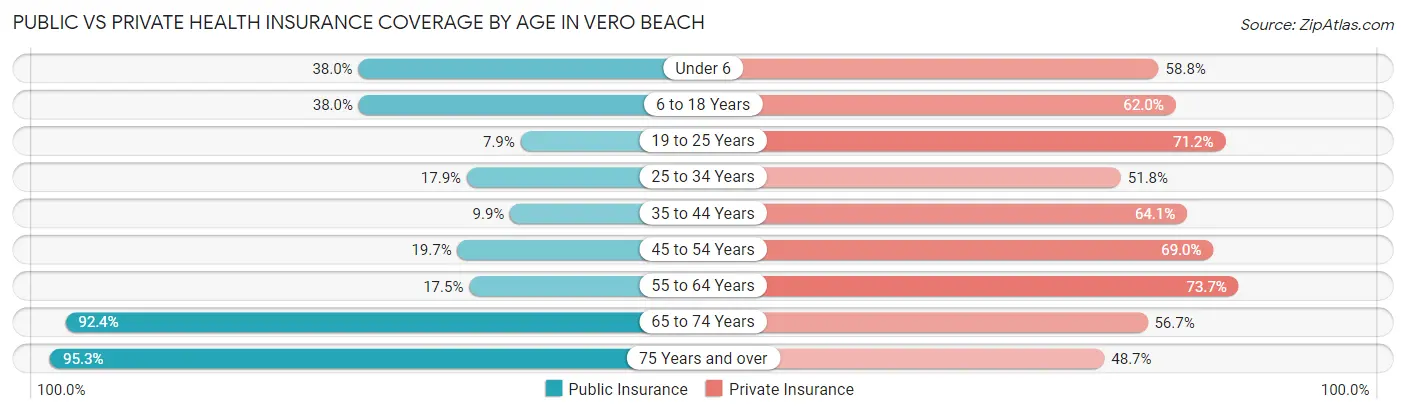
| Age Bracket | Public Insurance | Private Insurance |
| Under 6 | 313 (38.0%) | 484 (58.8%) |
| 6 to 18 Years | 549 (38.0%) | 896 (62.0%) |
| 19 to 25 Years | 71 (7.9%) | 637 (71.2%) |
| 25 to 34 Years | 303 (17.9%) | 877 (51.8%) |
| 35 to 44 Years | 136 (9.9%) | 883 (64.1%) |
| 45 to 54 Years | 357 (19.7%) | 1,253 (69.0%) |
| 55 to 64 Years | 546 (17.5%) | 2,302 (73.7%) |
| 65 to 74 Years | 2,331 (92.4%) | 1,431 (56.7%) |
| 75 Years and over | 2,224 (95.3%) | 1,138 (48.7%) |
| Total | 6,830 (42.6%) | 9,901 (61.8%) |
Disability Status by Sex by Age in Vero Beach
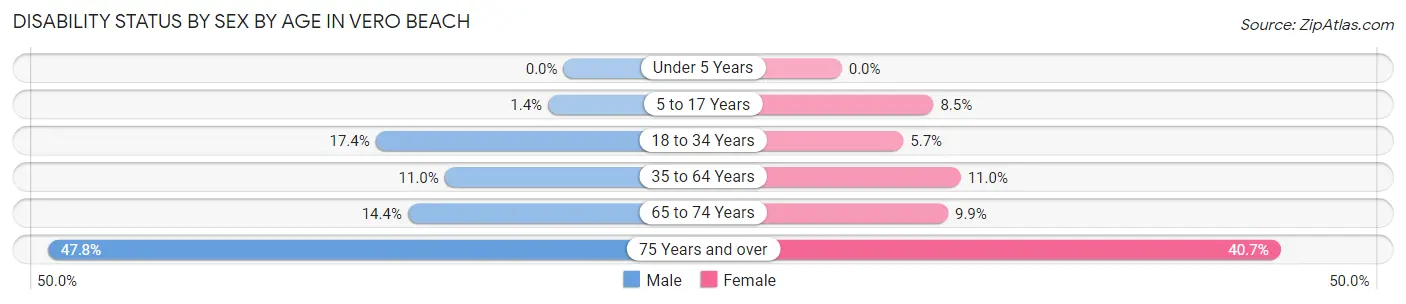
| Age Bracket | Male | Female |
| Under 5 Years | 0 (0.0%) | 0 (0.0%) |
| 5 to 17 Years | 12 (1.4%) | 49 (8.5%) |
| 18 to 34 Years | 227 (17.4%) | 86 (5.7%) |
| 35 to 64 Years | 322 (11.0%) | 375 (11.0%) |
| 65 to 74 Years | 162 (14.4%) | 138 (9.9%) |
| 75 Years and over | 466 (47.8%) | 554 (40.7%) |
Disability Class by Sex by Age in Vero Beach
Disability Class: Hearing Difficulty
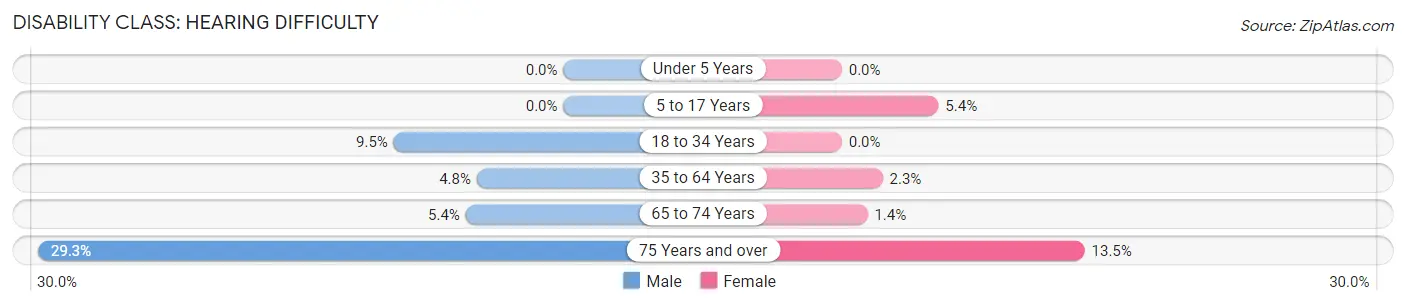
| Age Bracket | Male | Female |
| Under 5 Years | 0 (0.0%) | 0 (0.0%) |
| 5 to 17 Years | 0 (0.0%) | 31 (5.4%) |
| 18 to 34 Years | 123 (9.5%) | 0 (0.0%) |
| 35 to 64 Years | 141 (4.8%) | 77 (2.3%) |
| 65 to 74 Years | 61 (5.4%) | 20 (1.4%) |
| 75 Years and over | 285 (29.3%) | 184 (13.5%) |
Disability Class: Vision Difficulty
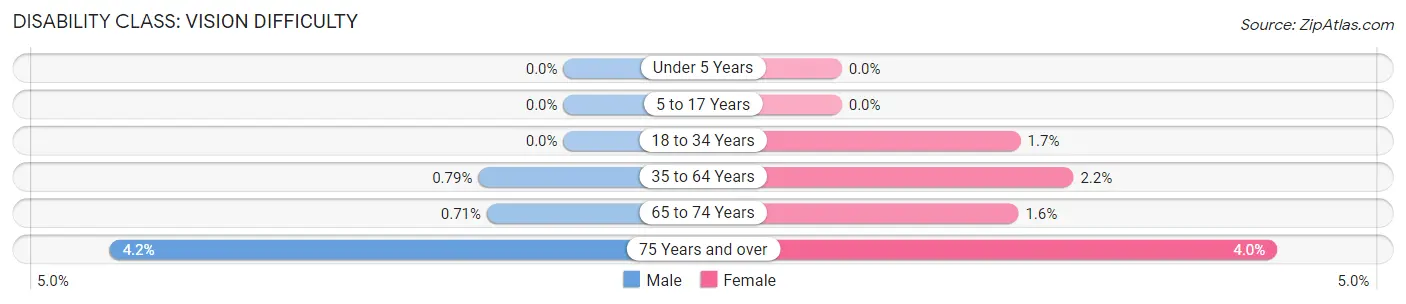
| Age Bracket | Male | Female |
| Under 5 Years | 0 (0.0%) | 0 (0.0%) |
| 5 to 17 Years | 0 (0.0%) | 0 (0.0%) |
| 18 to 34 Years | 0 (0.0%) | 25 (1.7%) |
| 35 to 64 Years | 23 (0.8%) | 73 (2.1%) |
| 65 to 74 Years | 8 (0.7%) | 23 (1.6%) |
| 75 Years and over | 41 (4.2%) | 55 (4.0%) |
Disability Class: Cognitive Difficulty
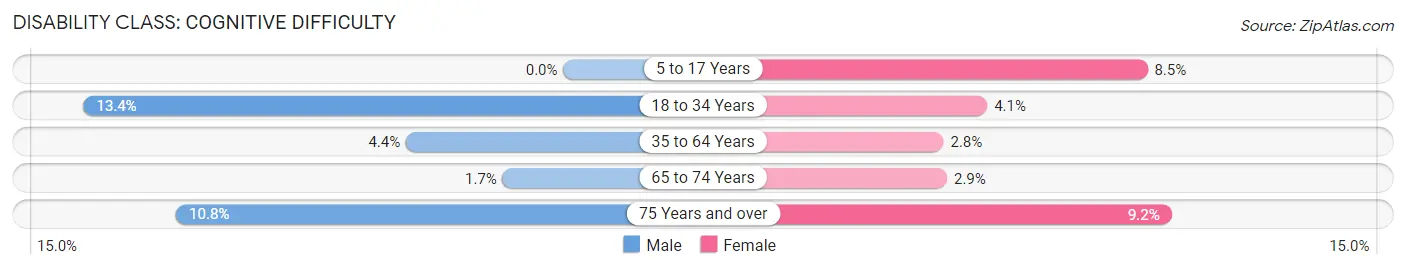
| Age Bracket | Male | Female |
| 5 to 17 Years | 0 (0.0%) | 49 (8.5%) |
| 18 to 34 Years | 174 (13.4%) | 61 (4.1%) |
| 35 to 64 Years | 128 (4.4%) | 96 (2.8%) |
| 65 to 74 Years | 19 (1.7%) | 41 (2.9%) |
| 75 Years and over | 105 (10.8%) | 125 (9.2%) |
Disability Class: Ambulatory Difficulty
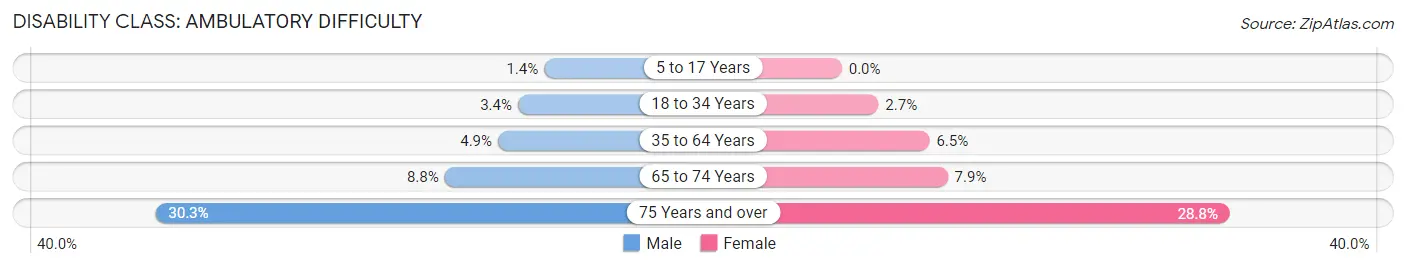
| Age Bracket | Male | Female |
| 5 to 17 Years | 12 (1.4%) | 0 (0.0%) |
| 18 to 34 Years | 44 (3.4%) | 41 (2.7%) |
| 35 to 64 Years | 142 (4.9%) | 221 (6.5%) |
| 65 to 74 Years | 99 (8.8%) | 110 (7.9%) |
| 75 Years and over | 295 (30.3%) | 392 (28.8%) |
Disability Class: Self-Care Difficulty
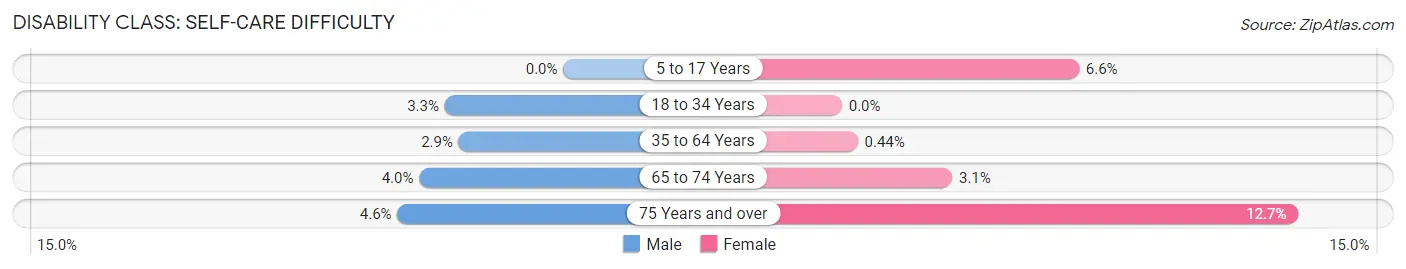
| Age Bracket | Male | Female |
| 5 to 17 Years | 0 (0.0%) | 38 (6.6%) |
| 18 to 34 Years | 43 (3.3%) | 0 (0.0%) |
| 35 to 64 Years | 85 (2.9%) | 15 (0.4%) |
| 65 to 74 Years | 45 (4.0%) | 43 (3.1%) |
| 75 Years and over | 45 (4.6%) | 173 (12.7%) |
Technology Access in Vero Beach
Computing Device Access in Vero Beach
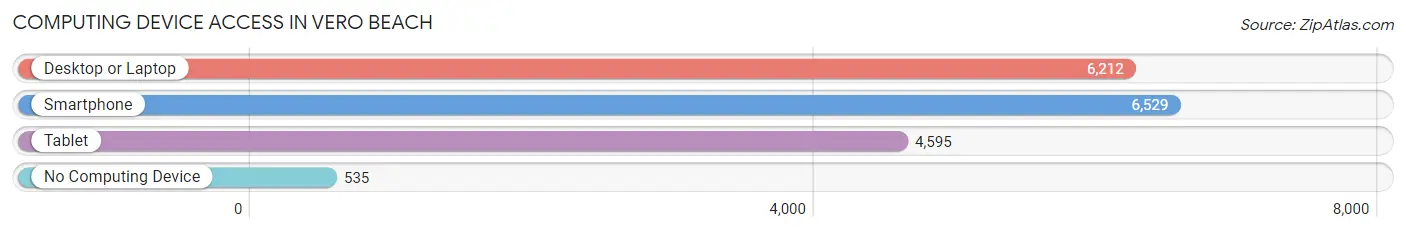
| Device Type | # Households | % Households |
| Desktop or Laptop | 6,212 | 80.4% |
| Smartphone | 6,529 | 84.5% |
| Tablet | 4,595 | 59.5% |
| No Computing Device | 535 | 6.9% |
| Total | 7,725 | 100.0% |
Internet Access in Vero Beach
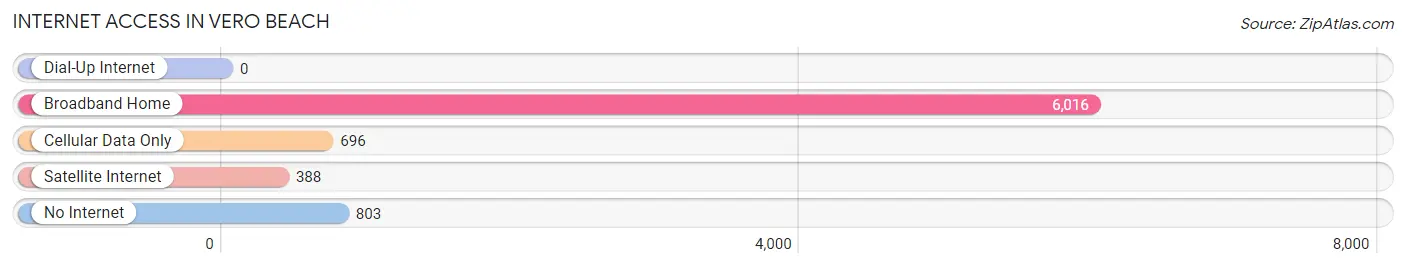
| Internet Type | # Households | % Households |
| Dial-Up Internet | 0 | 0.0% |
| Broadband Home | 6,016 | 77.9% |
| Cellular Data Only | 696 | 9.0% |
| Satellite Internet | 388 | 5.0% |
| No Internet | 803 | 10.4% |
| Total | 7,725 | 100.0% |
Vero Beach Summary
Vero Beach is a city located in Indian River County, Florida, United States. It is a principal city of the Sebastian-Vero Beach Metropolitan Statistical Area. According to the 2010 United States Census, the city had a population of 15,220. It is the county seat of Indian River County.
Geography
Vero Beach is located at 27°40'N 80°25'W (27.6667, -80.4167). It is situated along the Indian River Lagoon, which is part of the Atlantic Intracoastal Waterway. The city is located approximately halfway between Miami and Jacksonville.
Vero Beach is located on the Atlantic Coast of Florida, approximately halfway between Miami and Jacksonville. The city is situated along the Indian River Lagoon, which is part of the Atlantic Intracoastal Waterway. The city is bordered by the Indian River to the east, the St. Lucie Canal to the west, and the Atlantic Ocean to the south.
The city has a total area of 15.3 square miles, of which 14.9 square miles is land and 0.4 square miles is water.
History
Vero Beach was founded in 1872 by Captain Allen W. Estes as a small fishing village. The town was named after the Latin word for “true”, as Estes believed the area to be the “true” Florida. The town grew slowly until the arrival of the Florida East Coast Railway in the 1890s, which brought an influx of settlers and tourists.
In 1925, the city was incorporated and the population had grown to 1,500. The city continued to grow throughout the 20th century, and by 2000, the population had reached 15,220.
Economy
Vero Beach is a major tourist destination, with a variety of attractions and activities. The city is home to several golf courses, tennis courts, and beaches. The city is also home to the Vero Beach Museum of Art, the Riverside Theatre, and the Vero Beach Outlets.
The city is also home to several major employers, including Piper Aircraft, the Indian River Medical Center, and the Indian River County School District. The city is also home to several smaller businesses, including retail stores, restaurants, and professional services.
Demographics
As of the 2010 United States Census, there were 15,220 people, 6,845 households, and 4,072 families residing in the city. The population density was 1,006.3 people per square mile. The racial makeup of the city was 87.2% White, 8.2% African American, 0.3% Native American, 1.2% Asian, 0.1% Pacific Islander, 1.3% from other races, and 1.7% from two or more races. Hispanic or Latino of any race were 5.3% of the population.
The median income for a household in the city was $41,945, and the median income for a family was $50,919. The per capita income for the city was $25,945. About 8.7% of families and 11.2% of the population were below the poverty line, including 15.2% of those under age 18 and 6.2% of those age 65 or over.
Common Questions
What is Per Capita Income in Vero Beach?
Per Capita income in Vero Beach is $51,610.
What is the Median Family Income in Vero Beach?
Median Family Income in Vero Beach is $81,828.
What is the Median Household income in Vero Beach?
Median Household Income in Vero Beach is $59,335.
What is Income or Wage Gap in Vero Beach?
Income or Wage Gap in Vero Beach is 44.3%.
Women in Vero Beach earn 55.7 cents for every dollar earned by a man.
What is Family Income Deficit in Vero Beach?
Family Income Deficit in Vero Beach is $11,034.
Families that are below poverty line in Vero Beach earn $11,034 less on average than the poverty threshold level.
What is Inequality or Gini Index in Vero Beach?
Inequality or Gini Index in Vero Beach is 0.57.
What is the Total Population of Vero Beach?
Total Population of Vero Beach is 16,531.
What is the Total Male Population of Vero Beach?
Total Male Population of Vero Beach is 7,776.
What is the Total Female Population of Vero Beach?
Total Female Population of Vero Beach is 8,755.
What is the Ratio of Males per 100 Females in Vero Beach?
There are 88.82 Males per 100 Females in Vero Beach.
What is the Ratio of Females per 100 Males in Vero Beach?
There are 112.59 Females per 100 Males in Vero Beach.
What is the Median Population Age in Vero Beach?
Median Population Age in Vero Beach is 54.3 Years.
What is the Average Family Size in Vero Beach
Average Family Size in Vero Beach is 2.9 People.
What is the Average Household Size in Vero Beach
Average Household Size in Vero Beach is 2.1 People.
How Large is the Labor Force in Vero Beach?
There are 8,108 People in the Labor Forcein in Vero Beach.
What is the Percentage of People in the Labor Force in Vero Beach?
55.4% of People are in the Labor Force in Vero Beach.
What is the Unemployment Rate in Vero Beach?
Unemployment Rate in Vero Beach is 3.5%.