Daytona Beach, FL Map & Demographics
Daytona Beach Map

Daytona Beach Overview
$29,368
PER CAPITA INCOME
$59,266
AVG FAMILY INCOME
$47,608
AVG HOUSEHOLD INCOME
5.0%
WAGE / INCOME GAP [ % ]
95.0¢/ $1
WAGE / INCOME GAP [ $ ]
$11,747
FAMILY INCOME DEFICIT
0.47
INEQUALITY / GINI INDEX
73,329
TOTAL POPULATION
36,619
MALE POPULATION
36,710
FEMALE POPULATION
99.75
MALES / 100 FEMALES
100.25
FEMALES / 100 MALES
40.2
MEDIAN AGE
2.8
AVG FAMILY SIZE
2.1
AVG HOUSEHOLD SIZE
33,546
LABOR FORCE [ PEOPLE ]
52.7%
PERCENT IN LABOR FORCE
5.0%
UNEMPLOYMENT RATE
Daytona Beach Area Codes
Income in Daytona Beach
Income Overview in Daytona Beach
Per Capita Income in Daytona Beach is $29,368, while median incomes of families and households are $59,266 and $47,608 respectively.
| Characteristic | Number | Measure |
| Per Capita Income | 73,329 | $29,368 |
| Median Family Income | 15,871 | $59,266 |
| Mean Family Income | 15,871 | $76,191 |
| Median Household Income | 32,216 | $47,608 |
| Mean Household Income | 32,216 | $64,442 |
| Income Deficit | 15,871 | $11,747 |
| Wage / Income Gap (%) | 73,329 | 5.00% |
| Wage / Income Gap ($) | 73,329 | 95.00¢ per $1 |
| Gini / Inequality Index | 73,329 | 0.47 |
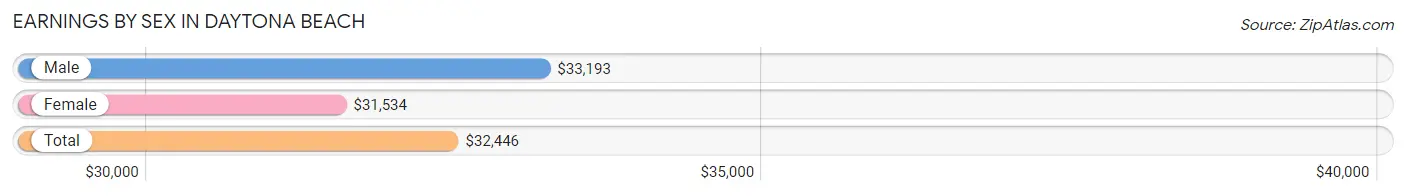
Earnings by Sex in Daytona Beach
Average Earnings in Daytona Beach are $32,446, $33,193 for men and $31,534 for women, a difference of 5.0%.
| Sex | Number | Average Earnings |
| Male | 18,857 (54.2%) | $33,193 |
| Female | 15,910 (45.8%) | $31,534 |
| Total | 34,767 (100.0%) | $32,446 |
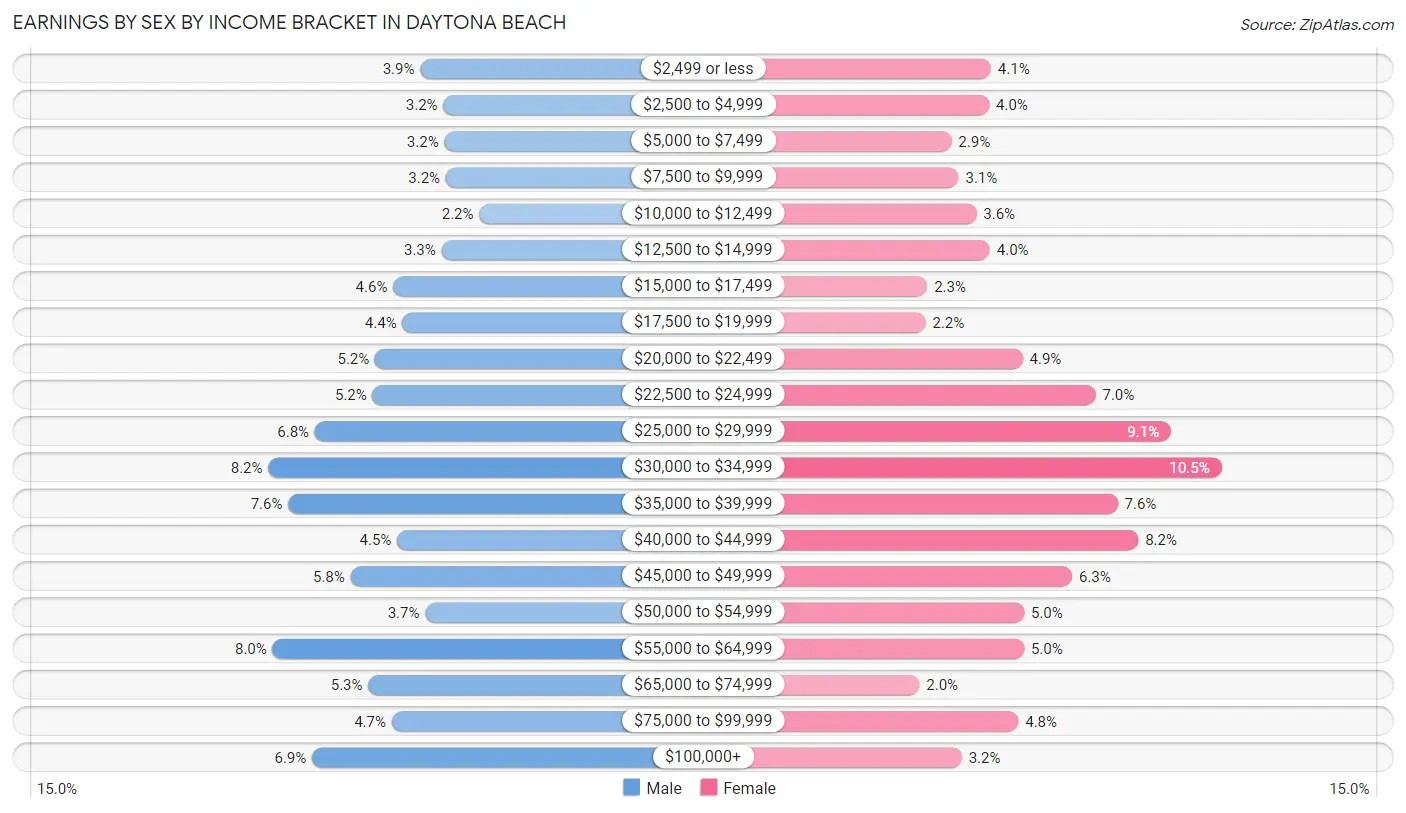
Earnings by Sex by Income Bracket in Daytona Beach
The most common earnings brackets in Daytona Beach are $30,000 to $34,999 for men (1,536 | 8.2%) and $30,000 to $34,999 for women (1,675 | 10.5%).
| Income | Male | Female |
| $2,499 or less | 731 (3.9%) | 644 (4.1%) |
| $2,500 to $4,999 | 609 (3.2%) | 636 (4.0%) |
| $5,000 to $7,499 | 604 (3.2%) | 468 (2.9%) |
| $7,500 to $9,999 | 595 (3.2%) | 500 (3.1%) |
| $10,000 to $12,499 | 418 (2.2%) | 579 (3.6%) |
| $12,500 to $14,999 | 619 (3.3%) | 640 (4.0%) |
| $15,000 to $17,499 | 875 (4.6%) | 359 (2.3%) |
| $17,500 to $19,999 | 825 (4.4%) | 352 (2.2%) |
| $20,000 to $22,499 | 971 (5.1%) | 786 (4.9%) |
| $22,500 to $24,999 | 985 (5.2%) | 1,112 (7.0%) |
| $25,000 to $29,999 | 1,290 (6.8%) | 1,449 (9.1%) |
| $30,000 to $34,999 | 1,536 (8.2%) | 1,675 (10.5%) |
| $35,000 to $39,999 | 1,431 (7.6%) | 1,211 (7.6%) |
| $40,000 to $44,999 | 855 (4.5%) | 1,303 (8.2%) |
| $45,000 to $49,999 | 1,101 (5.8%) | 1,007 (6.3%) |
| $50,000 to $54,999 | 705 (3.7%) | 792 (5.0%) |
| $55,000 to $64,999 | 1,514 (8.0%) | 792 (5.0%) |
| $65,000 to $74,999 | 1,007 (5.3%) | 324 (2.0%) |
| $75,000 to $99,999 | 882 (4.7%) | 767 (4.8%) |
| $100,000+ | 1,304 (6.9%) | 514 (3.2%) |
| Total | 18,857 (100.0%) | 15,910 (100.0%) |
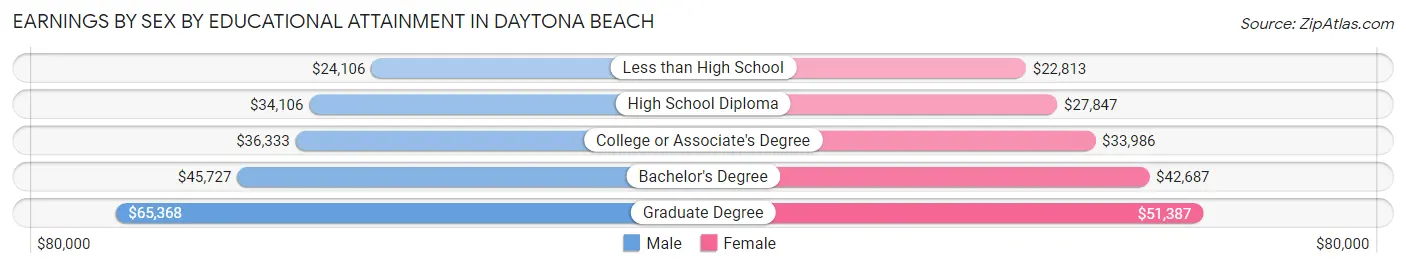
Earnings by Sex by Educational Attainment in Daytona Beach
Average earnings in Daytona Beach are $36,105 for men and $33,877 for women, a difference of 6.2%. Men with an educational attainment of graduate degree enjoy the highest average annual earnings of $65,368, while those with less than high school education earn the least with $24,106. Women with an educational attainment of graduate degree earn the most with the average annual earnings of $51,387, while those with less than high school education have the smallest earnings of $22,813.
| Educational Attainment | Male Income | Female Income |
| Less than High School | $24,106 | $22,813 |
| High School Diploma | $34,106 | $27,847 |
| College or Associate's Degree | $36,333 | $33,986 |
| Bachelor's Degree | $45,727 | $42,687 |
| Graduate Degree | $65,368 | $51,387 |
| Total | $36,105 | $33,877 |
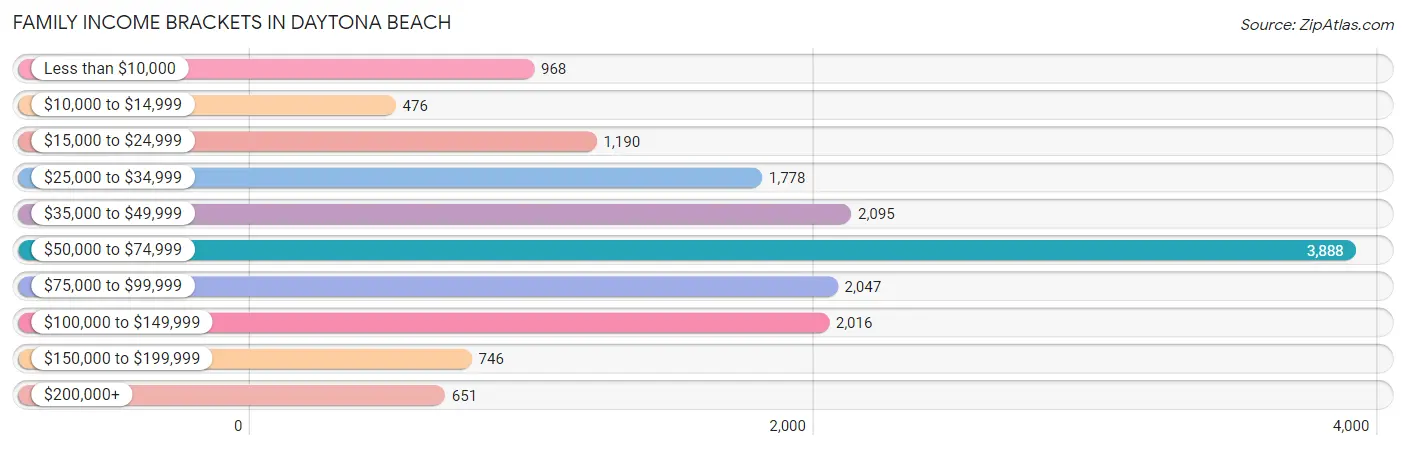
Family Income in Daytona Beach
Family Income Brackets in Daytona Beach
According to the Daytona Beach family income data, there are 3,888 families falling into the $50,000 to $74,999 income range, which is the most common income bracket and makes up 24.5% of all families. Conversely, the $10,000 to $14,999 income bracket is the least frequent group with only 476 families (3.0%) belonging to this category.
| Income Bracket | # Families | % Families |
| Less than $10,000 | 968 | 6.1% |
| $10,000 to $14,999 | 476 | 3.0% |
| $15,000 to $24,999 | 1,190 | 7.5% |
| $25,000 to $34,999 | 1,778 | 11.2% |
| $35,000 to $49,999 | 2,095 | 13.2% |
| $50,000 to $74,999 | 3,888 | 24.5% |
| $75,000 to $99,999 | 2,047 | 12.9% |
| $100,000 to $149,999 | 2,016 | 12.7% |
| $150,000 to $199,999 | 746 | 4.7% |
| $200,000+ | 651 | 4.1% |
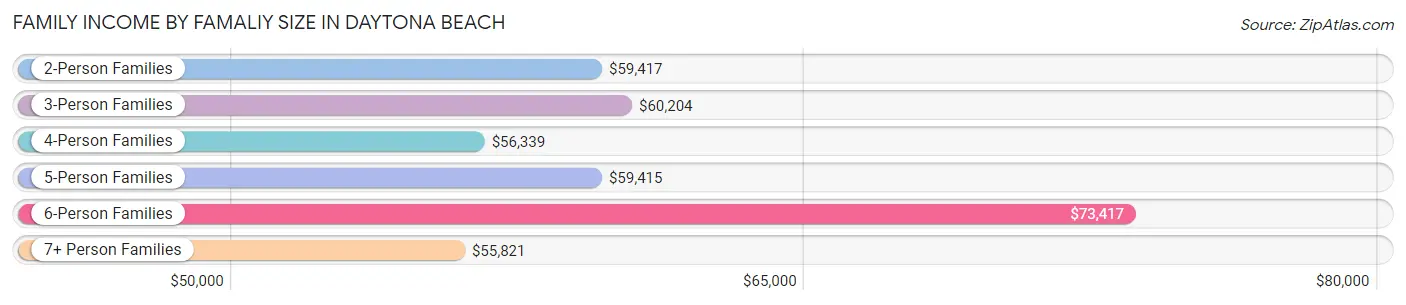
Family Income by Famaliy Size in Daytona Beach
6-person families (187 | 1.2%) account for the highest median family income in Daytona Beach with $73,417 per family, while 2-person families (9,452 | 59.6%) have the highest median income of $29,708 per family member.
| Income Bracket | # Families | Median Income |
| 2-Person Families | 9,452 (59.6%) | $59,417 |
| 3-Person Families | 3,352 (21.1%) | $60,204 |
| 4-Person Families | 1,869 (11.8%) | $56,339 |
| 5-Person Families | 894 (5.6%) | $59,415 |
| 6-Person Families | 187 (1.2%) | $73,417 |
| 7+ Person Families | 117 (0.7%) | $55,821 |
| Total | 15,871 (100.0%) | $59,266 |
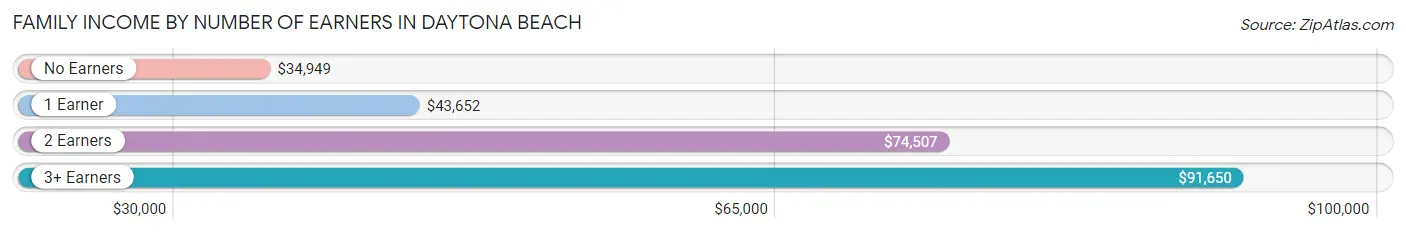
Family Income by Number of Earners in Daytona Beach
The median family income in Daytona Beach is $59,266, with families comprising 3+ earners (988) having the highest median family income of $91,650, while families with no earners (3,909) have the lowest median family income of $34,949, accounting for 6.2% and 24.6% of families, respectively.
| Number of Earners | # Families | Median Income |
| No Earners | 3,909 (24.6%) | $34,949 |
| 1 Earner | 5,618 (35.4%) | $43,652 |
| 2 Earners | 5,356 (33.8%) | $74,507 |
| 3+ Earners | 988 (6.2%) | $91,650 |
| Total | 15,871 (100.0%) | $59,266 |
Household Income in Daytona Beach
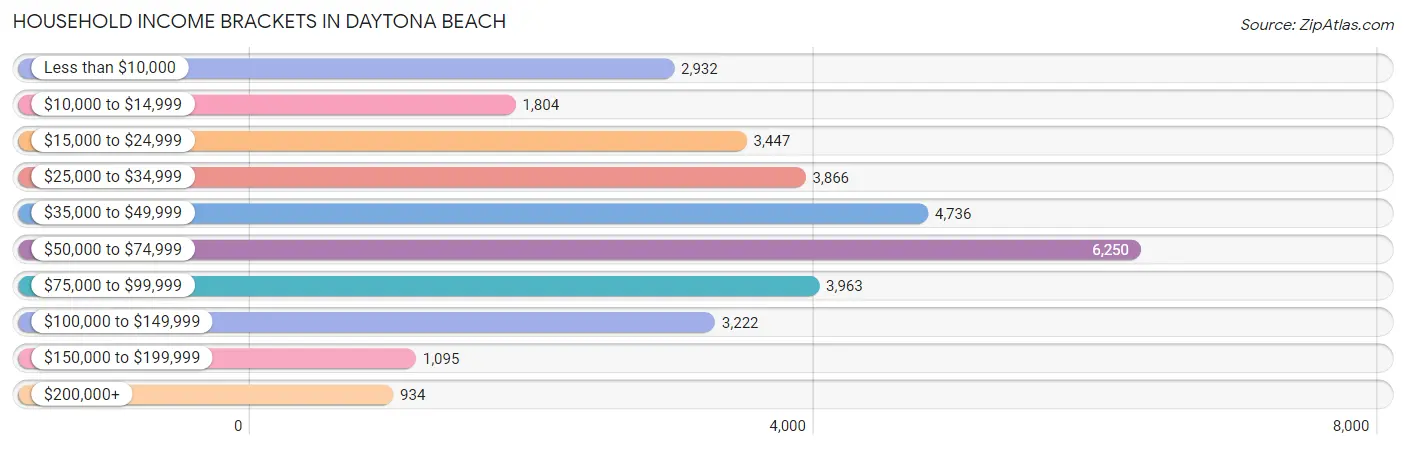
Household Income Brackets in Daytona Beach
With 6,250 households falling in the category, the $50,000 to $74,999 income range is the most frequent in Daytona Beach, accounting for 19.4% of all households. In contrast, only 934 households (2.9%) fall into the $200,000+ income bracket, making it the least populous group.
| Income Bracket | # Households | % Households |
| Less than $10,000 | 2,932 | 9.1% |
| $10,000 to $14,999 | 1,804 | 5.6% |
| $15,000 to $24,999 | 3,447 | 10.7% |
| $25,000 to $34,999 | 3,866 | 12.0% |
| $35,000 to $49,999 | 4,736 | 14.7% |
| $50,000 to $74,999 | 6,250 | 19.4% |
| $75,000 to $99,999 | 3,963 | 12.3% |
| $100,000 to $149,999 | 3,222 | 10.0% |
| $150,000 to $199,999 | 1,095 | 3.4% |
| $200,000+ | 934 | 2.9% |
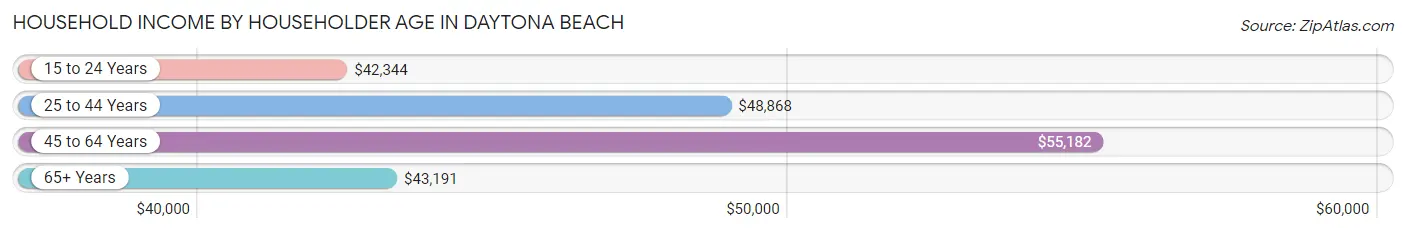
Household Income by Householder Age in Daytona Beach
The median household income in Daytona Beach is $47,608, with the highest median household income of $55,182 found in the 45 to 64 years age bracket for the primary householder. A total of 10,660 households (33.1%) fall into this category. Meanwhile, the 15 to 24 years age bracket for the primary householder has the lowest median household income of $42,344, with 2,219 households (6.9%) in this group.
| Income Bracket | # Households | Median Income |
| 15 to 24 Years | 2,219 (6.9%) | $42,344 |
| 25 to 44 Years | 9,637 (29.9%) | $48,868 |
| 45 to 64 Years | 10,660 (33.1%) | $55,182 |
| 65+ Years | 9,700 (30.1%) | $43,191 |
| Total | 32,216 (100.0%) | $47,608 |
Poverty in Daytona Beach
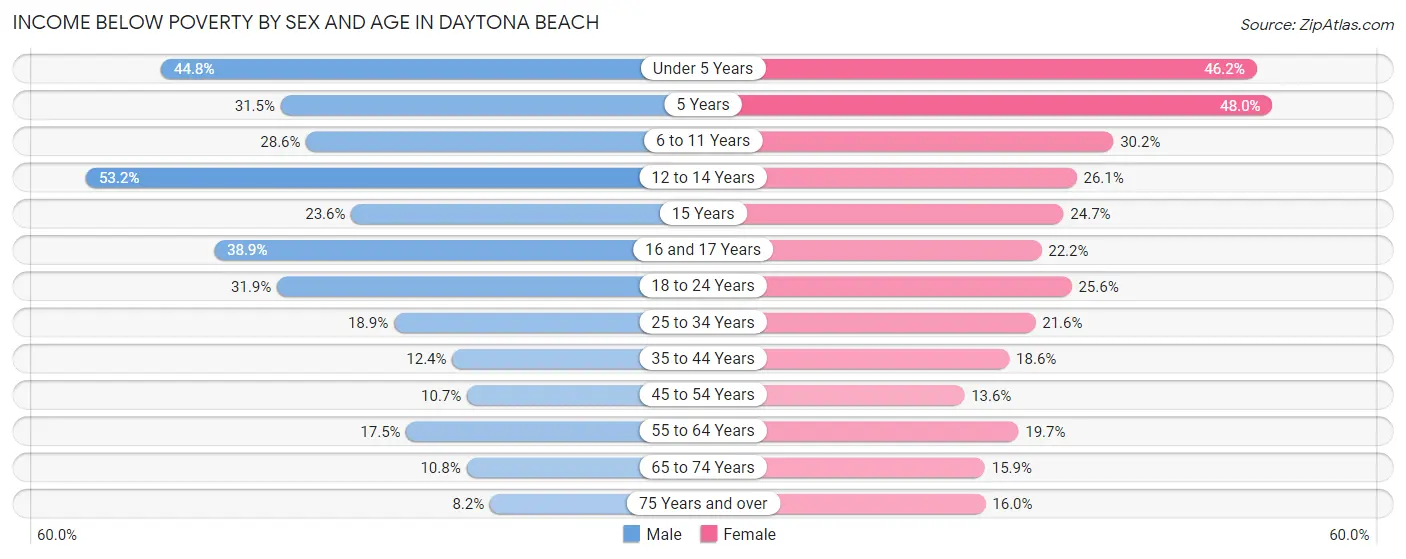
Income Below Poverty by Sex and Age in Daytona Beach
With 19.5% poverty level for males and 21.2% for females among the residents of Daytona Beach, 12 to 14 year old males and 5 year old females are the most vulnerable to poverty, with 286 males (53.2%) and 117 females (47.9%) in their respective age groups living below the poverty level.
| Age Bracket | Male | Female |
| Under 5 Years | 685 (44.8%) | 677 (46.2%) |
| 5 Years | 62 (31.5%) | 117 (47.9%) |
| 6 to 11 Years | 535 (28.6%) | 741 (30.2%) |
| 12 to 14 Years | 286 (53.2%) | 149 (26.1%) |
| 15 Years | 94 (23.6%) | 58 (24.7%) |
| 16 and 17 Years | 161 (38.9%) | 90 (22.2%) |
| 18 to 24 Years | 1,346 (31.9%) | 835 (25.6%) |
| 25 to 34 Years | 1,097 (18.9%) | 1,075 (21.5%) |
| 35 to 44 Years | 476 (12.4%) | 705 (18.6%) |
| 45 to 54 Years | 404 (10.7%) | 487 (13.6%) |
| 55 to 64 Years | 821 (17.5%) | 1,040 (19.7%) |
| 65 to 74 Years | 483 (10.8%) | 679 (15.9%) |
| 75 Years and over | 193 (8.2%) | 545 (16.0%) |
| Total | 6,643 (19.5%) | 7,198 (21.2%) |
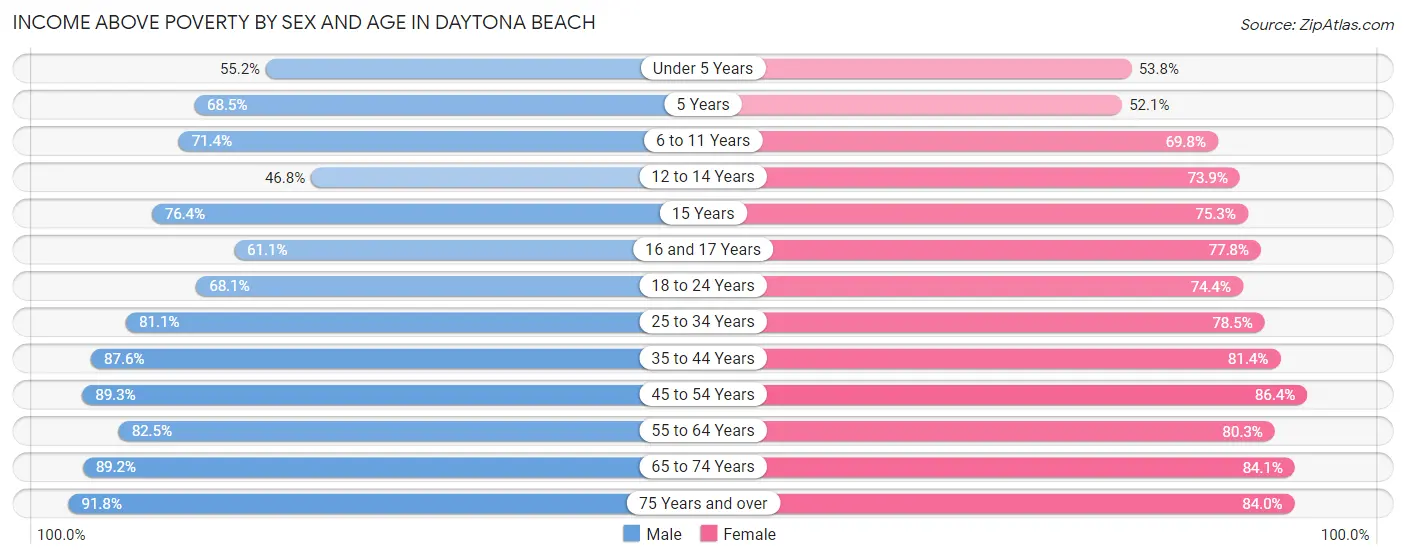
Income Above Poverty by Sex and Age in Daytona Beach
According to the poverty statistics in Daytona Beach, males aged 75 years and over and females aged 45 to 54 years are the age groups that are most secure financially, with 91.8% of males and 86.4% of females in these age groups living above the poverty line.
| Age Bracket | Male | Female |
| Under 5 Years | 844 (55.2%) | 789 (53.8%) |
| 5 Years | 135 (68.5%) | 127 (52.0%) |
| 6 to 11 Years | 1,334 (71.4%) | 1,710 (69.8%) |
| 12 to 14 Years | 252 (46.8%) | 421 (73.9%) |
| 15 Years | 304 (76.4%) | 177 (75.3%) |
| 16 and 17 Years | 253 (61.1%) | 315 (77.8%) |
| 18 to 24 Years | 2,876 (68.1%) | 2,429 (74.4%) |
| 25 to 34 Years | 4,719 (81.1%) | 3,914 (78.4%) |
| 35 to 44 Years | 3,375 (87.6%) | 3,077 (81.4%) |
| 45 to 54 Years | 3,364 (89.3%) | 3,085 (86.4%) |
| 55 to 64 Years | 3,875 (82.5%) | 4,250 (80.3%) |
| 65 to 74 Years | 3,993 (89.2%) | 3,584 (84.1%) |
| 75 Years and over | 2,173 (91.8%) | 2,864 (84.0%) |
| Total | 27,497 (80.5%) | 26,742 (78.8%) |
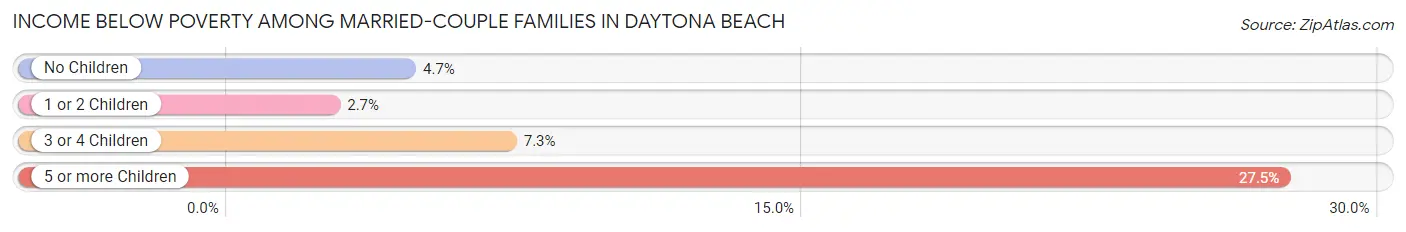
Income Below Poverty Among Married-Couple Families in Daytona Beach
The poverty statistics for married-couple families in Daytona Beach show that 4.5% or 423 of the total 9,455 families live below the poverty line. Families with 5 or more children have the highest poverty rate of 27.5%, comprising of 11 families. On the other hand, families with 1 or 2 children have the lowest poverty rate of 2.7%, which includes 46 families.
| Children | Above Poverty | Below Poverty |
| No Children | 7,048 (95.4%) | 344 (4.6%) |
| 1 or 2 Children | 1,675 (97.3%) | 46 (2.7%) |
| 3 or 4 Children | 280 (92.7%) | 22 (7.3%) |
| 5 or more Children | 29 (72.5%) | 11 (27.5%) |
| Total | 9,032 (95.5%) | 423 (4.5%) |
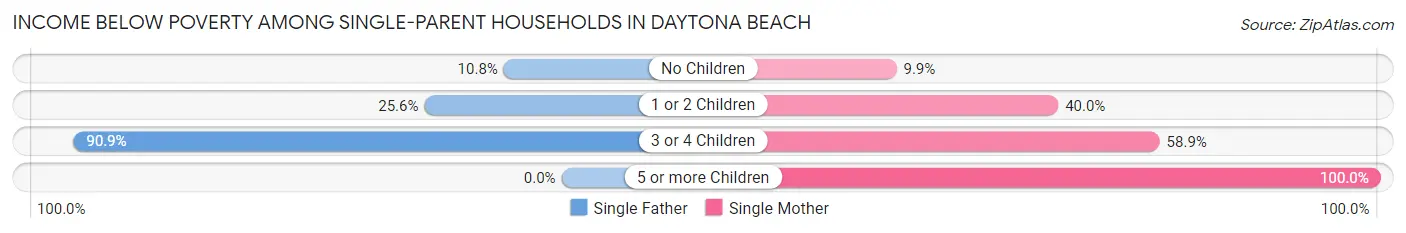
Income Below Poverty Among Single-Parent Households in Daytona Beach
According to the poverty data in Daytona Beach, 20.5% or 403 single-father households and 31.4% or 1,397 single-mother households are living below the poverty line. Among single-father households, those with 3 or 4 children have the highest poverty rate, with 80 households (90.9%) experiencing poverty. Likewise, among single-mother households, those with 5 or more children have the highest poverty rate, with 49 households (100.0%) falling below the poverty line.
| Children | Single Father | Single Mother |
| No Children | 115 (10.8%) | 162 (9.9%) |
| 1 or 2 Children | 208 (25.6%) | 917 (40.0%) |
| 3 or 4 Children | 80 (90.9%) | 269 (58.9%) |
| 5 or more Children | 0 (0.0%) | 49 (100.0%) |
| Total | 403 (20.5%) | 1,397 (31.4%) |
Income Below Poverty Among Married-Couple vs Single-Parent Households in Daytona Beach
The poverty data for Daytona Beach shows that 423 of the married-couple family households (4.5%) and 1,800 of the single-parent households (28.1%) are living below the poverty level. Within the married-couple family households, those with 5 or more children have the highest poverty rate, with 11 households (27.5%) falling below the poverty line. Among the single-parent households, those with 5 or more children have the highest poverty rate, with 49 household (100.0%) living below poverty.
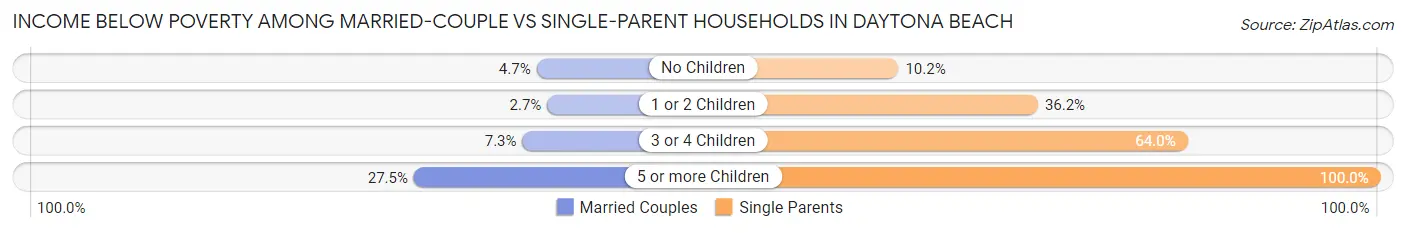
| Children | Married-Couple Families | Single-Parent Households |
| No Children | 344 (4.6%) | 277 (10.2%) |
| 1 or 2 Children | 46 (2.7%) | 1,125 (36.2%) |
| 3 or 4 Children | 22 (7.3%) | 349 (64.0%) |
| 5 or more Children | 11 (27.5%) | 49 (100.0%) |
| Total | 423 (4.5%) | 1,800 (28.1%) |
Race in Daytona Beach
The most populous races in Daytona Beach are White / Caucasian (40,212 | 54.8%), Black / African American (23,446 | 32.0%), and Hispanic or Latino (7,550 | 10.3%).
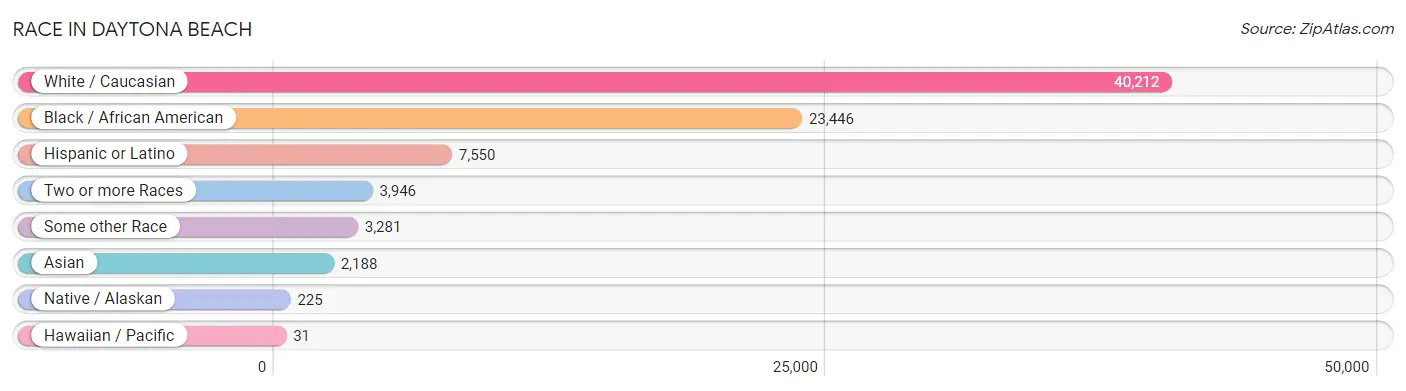
| Race | # Population | % Population |
| Asian | 2,188 | 3.0% |
| Black / African American | 23,446 | 32.0% |
| Hawaiian / Pacific | 31 | 0.0% |
| Hispanic or Latino | 7,550 | 10.3% |
| Native / Alaskan | 225 | 0.3% |
| White / Caucasian | 40,212 | 54.8% |
| Two or more Races | 3,946 | 5.4% |
| Some other Race | 3,281 | 4.5% |
| Total | 73,329 | 100.0% |
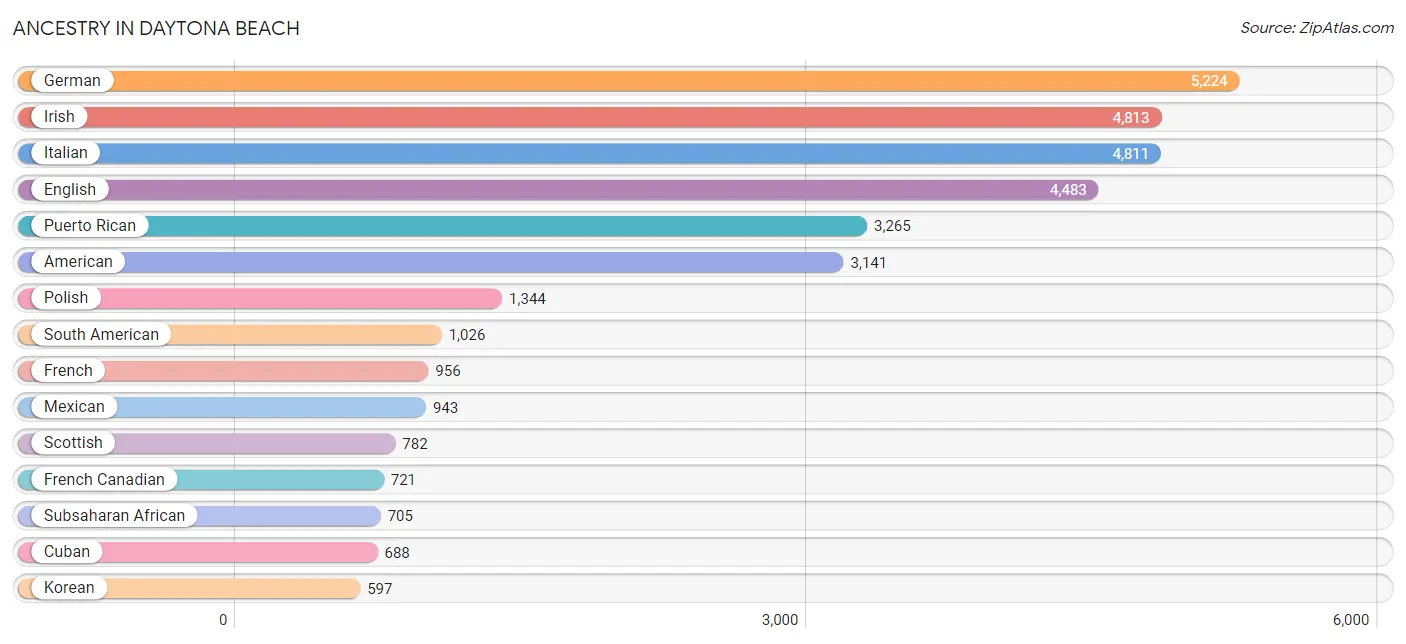
Ancestry in Daytona Beach
The most populous ancestries reported in Daytona Beach are German (5,224 | 7.1%), Irish (4,813 | 6.6%), Italian (4,811 | 6.6%), English (4,483 | 6.1%), and Puerto Rican (3,265 | 4.4%), together accounting for 30.8% of all Daytona Beach residents.
| Ancestry | # Population | % Population |
| African | 328 | 0.4% |
| Albanian | 32 | 0.0% |
| American | 3,141 | 4.3% |
| Apache | 18 | 0.0% |
| Arab | 379 | 0.5% |
| Argentinean | 67 | 0.1% |
| Armenian | 14 | 0.0% |
| Australian | 17 | 0.0% |
| Austrian | 114 | 0.2% |
| Bangladeshi | 32 | 0.0% |
| Barbadian | 26 | 0.0% |
| Basque | 9 | 0.0% |
| Belgian | 17 | 0.0% |
| Belizean | 44 | 0.1% |
| Bermudan | 26 | 0.0% |
| Bhutanese | 158 | 0.2% |
| Brazilian | 132 | 0.2% |
| British | 527 | 0.7% |
| British West Indian | 64 | 0.1% |
| Burmese | 260 | 0.4% |
| Canadian | 372 | 0.5% |
| Cape Verdean | 224 | 0.3% |
| Celtic | 10 | 0.0% |
| Central American | 422 | 0.6% |
| Central American Indian | 31 | 0.0% |
| Cherokee | 133 | 0.2% |
| Colombian | 253 | 0.4% |
| Costa Rican | 46 | 0.1% |
| Croatian | 257 | 0.4% |
| Cuban | 688 | 0.9% |
| Czech | 143 | 0.2% |
| Czechoslovakian | 34 | 0.1% |
| Danish | 81 | 0.1% |
| Dominican | 175 | 0.2% |
| Dutch | 315 | 0.4% |
| Eastern European | 161 | 0.2% |
| Ecuadorian | 196 | 0.3% |
| Egyptian | 56 | 0.1% |
| English | 4,483 | 6.1% |
| European | 474 | 0.6% |
| Finnish | 39 | 0.1% |
| French | 956 | 1.3% |
| French American Indian | 7 | 0.0% |
| French Canadian | 721 | 1.0% |
| German | 5,224 | 7.1% |
| Greek | 304 | 0.4% |
| Guatemalan | 39 | 0.1% |
| Guyanese | 63 | 0.1% |
| Haitian | 160 | 0.2% |
| Honduran | 111 | 0.2% |
| Hungarian | 401 | 0.5% |
| Icelander | 39 | 0.1% |
| Indian (Asian) | 237 | 0.3% |
| Indonesian | 134 | 0.2% |
| Iranian | 106 | 0.1% |
| Irish | 4,813 | 6.6% |
| Iroquois | 21 | 0.0% |
| Italian | 4,811 | 6.6% |
| Jamaican | 393 | 0.5% |
| Korean | 597 | 0.8% |
| Latvian | 28 | 0.0% |
| Lebanese | 44 | 0.1% |
| Lithuanian | 83 | 0.1% |
| Maltese | 10 | 0.0% |
| Mexican | 943 | 1.3% |
| Mexican American Indian | 106 | 0.1% |
| Moroccan | 41 | 0.1% |
| Native Hawaiian | 11 | 0.0% |
| Navajo | 15 | 0.0% |
| Nicaraguan | 150 | 0.2% |
| Nigerian | 40 | 0.1% |
| Northern European | 121 | 0.2% |
| Norwegian | 194 | 0.3% |
| Ottawa | 14 | 0.0% |
| Pakistani | 48 | 0.1% |
| Palestinian | 17 | 0.0% |
| Pennsylvania German | 101 | 0.1% |
| Peruvian | 185 | 0.3% |
| Polish | 1,344 | 1.8% |
| Portuguese | 112 | 0.2% |
| Puerto Rican | 3,265 | 4.4% |
| Romanian | 177 | 0.2% |
| Russian | 557 | 0.8% |
| Salvadoran | 76 | 0.1% |
| Samoan | 10 | 0.0% |
| Scandinavian | 226 | 0.3% |
| Scotch-Irish | 287 | 0.4% |
| Scottish | 782 | 1.1% |
| Serbian | 48 | 0.1% |
| Slavic | 88 | 0.1% |
| Slovak | 51 | 0.1% |
| Slovene | 24 | 0.0% |
| South African | 41 | 0.1% |
| South American | 1,026 | 1.4% |
| Spaniard | 107 | 0.2% |
| Spanish | 67 | 0.1% |
| Sri Lankan | 589 | 0.8% |
| Subsaharan African | 705 | 1.0% |
| Swedish | 375 | 0.5% |
| Swiss | 108 | 0.2% |
| Syrian | 53 | 0.1% |
| Thai | 489 | 0.7% |
| Ukrainian | 114 | 0.2% |
| Uruguayan | 10 | 0.0% |
| Venezuelan | 306 | 0.4% |
| Vietnamese | 2 | 0.0% |
| Welsh | 423 | 0.6% |
| West Indian | 127 | 0.2% |
| Yugoslavian | 4 | 0.0% | View All 109 Rows |
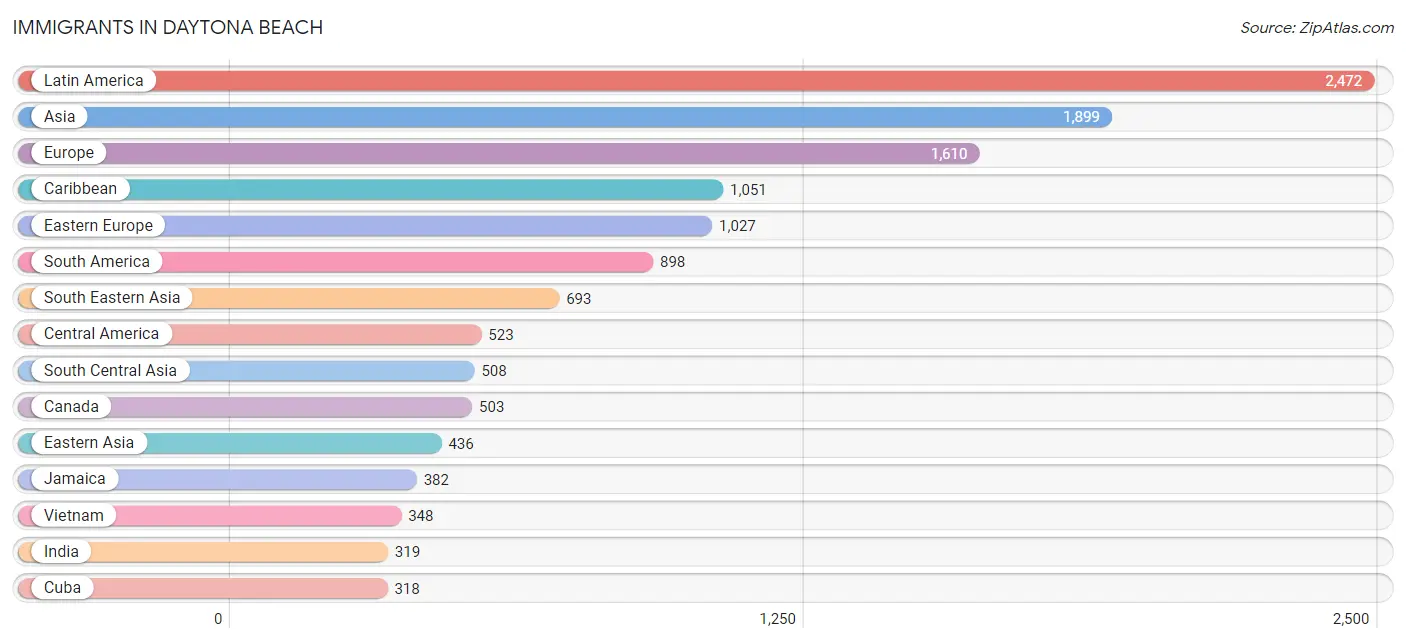
Immigrants in Daytona Beach
The most numerous immigrant groups reported in Daytona Beach came from Latin America (2,472 | 3.4%), Asia (1,899 | 2.6%), Europe (1,610 | 2.2%), Caribbean (1,051 | 1.4%), and Eastern Europe (1,027 | 1.4%), together accounting for 11.0% of all Daytona Beach residents.
| Immigration Origin | # Population | % Population |
| Africa | 312 | 0.4% |
| Albania | 23 | 0.0% |
| Argentina | 72 | 0.1% |
| Asia | 1,899 | 2.6% |
| Austria | 5 | 0.0% |
| Bahamas | 90 | 0.1% |
| Bangladesh | 13 | 0.0% |
| Barbados | 4 | 0.0% |
| Belgium | 37 | 0.1% |
| Brazil | 159 | 0.2% |
| Canada | 503 | 0.7% |
| Caribbean | 1,051 | 1.4% |
| Central America | 523 | 0.7% |
| China | 90 | 0.1% |
| Colombia | 156 | 0.2% |
| Croatia | 243 | 0.3% |
| Cuba | 318 | 0.4% |
| Czechoslovakia | 23 | 0.0% |
| Dominica | 86 | 0.1% |
| Dominican Republic | 67 | 0.1% |
| Eastern Africa | 18 | 0.0% |
| Eastern Asia | 436 | 0.6% |
| Eastern Europe | 1,027 | 1.4% |
| Ecuador | 39 | 0.1% |
| Egypt | 65 | 0.1% |
| El Salvador | 50 | 0.1% |
| England | 73 | 0.1% |
| Europe | 1,610 | 2.2% |
| France | 10 | 0.0% |
| Germany | 209 | 0.3% |
| Greece | 10 | 0.0% |
| Grenada | 20 | 0.0% |
| Guatemala | 10 | 0.0% |
| Guyana | 63 | 0.1% |
| Haiti | 13 | 0.0% |
| Honduras | 96 | 0.1% |
| Hong Kong | 30 | 0.0% |
| Hungary | 158 | 0.2% |
| India | 319 | 0.4% |
| Iran | 106 | 0.1% |
| Ireland | 10 | 0.0% |
| Israel | 10 | 0.0% |
| Italy | 50 | 0.1% |
| Jamaica | 382 | 0.5% |
| Japan | 96 | 0.1% |
| Jordan | 14 | 0.0% |
| Korea | 250 | 0.3% |
| Latin America | 2,472 | 3.4% |
| Lebanon | 16 | 0.0% |
| Lithuania | 13 | 0.0% |
| Mexico | 245 | 0.3% |
| Middle Africa | 72 | 0.1% |
| Morocco | 23 | 0.0% |
| Nicaragua | 97 | 0.1% |
| Nigeria | 36 | 0.1% |
| Northern Africa | 94 | 0.1% |
| Northern Europe | 213 | 0.3% |
| Oceania | 10 | 0.0% |
| Pakistan | 29 | 0.0% |
| Panama | 25 | 0.0% |
| Peru | 138 | 0.2% |
| Philippines | 268 | 0.4% |
| Poland | 128 | 0.2% |
| Portugal | 25 | 0.0% |
| Romania | 98 | 0.1% |
| Russia | 216 | 0.3% |
| Saudi Arabia | 211 | 0.3% |
| Sierra Leone | 28 | 0.0% |
| South Africa | 15 | 0.0% |
| South America | 898 | 1.2% |
| South Central Asia | 508 | 0.7% |
| South Eastern Asia | 693 | 0.9% |
| Southern Europe | 94 | 0.1% |
| Spain | 9 | 0.0% |
| Sri Lanka | 22 | 0.0% |
| Sweden | 6 | 0.0% |
| Switzerland | 15 | 0.0% |
| Syria | 11 | 0.0% |
| Taiwan | 23 | 0.0% |
| Thailand | 46 | 0.1% |
| Trinidad and Tobago | 35 | 0.1% |
| Ukraine | 125 | 0.2% |
| Uruguay | 13 | 0.0% |
| Uzbekistan | 19 | 0.0% |
| Venezuela | 258 | 0.4% |
| Vietnam | 348 | 0.5% |
| Western Africa | 109 | 0.2% |
| Western Asia | 262 | 0.4% |
| Western Europe | 276 | 0.4% | View All 89 Rows |
Sex and Age in Daytona Beach
Sex and Age in Daytona Beach
The most populous age groups in Daytona Beach are 20 to 24 Years (3,886 | 10.6%) for men and 20 to 24 Years (3,608 | 9.8%) for women.
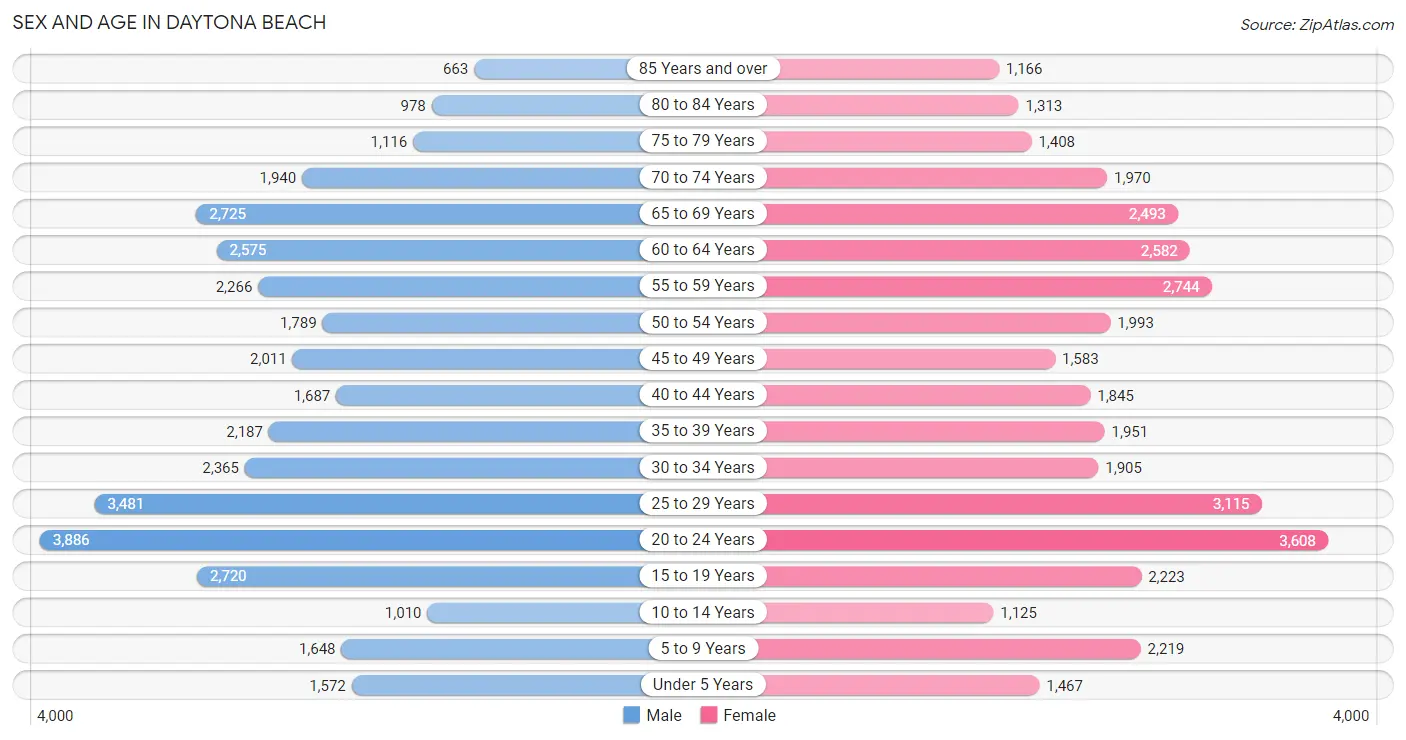
| Age Bracket | Male | Female |
| Under 5 Years | 1,572 (4.3%) | 1,467 (4.0%) |
| 5 to 9 Years | 1,648 (4.5%) | 2,219 (6.0%) |
| 10 to 14 Years | 1,010 (2.8%) | 1,125 (3.1%) |
| 15 to 19 Years | 2,720 (7.4%) | 2,223 (6.1%) |
| 20 to 24 Years | 3,886 (10.6%) | 3,608 (9.8%) |
| 25 to 29 Years | 3,481 (9.5%) | 3,115 (8.5%) |
| 30 to 34 Years | 2,365 (6.5%) | 1,905 (5.2%) |
| 35 to 39 Years | 2,187 (6.0%) | 1,951 (5.3%) |
| 40 to 44 Years | 1,687 (4.6%) | 1,845 (5.0%) |
| 45 to 49 Years | 2,011 (5.5%) | 1,583 (4.3%) |
| 50 to 54 Years | 1,789 (4.9%) | 1,993 (5.4%) |
| 55 to 59 Years | 2,266 (6.2%) | 2,744 (7.5%) |
| 60 to 64 Years | 2,575 (7.0%) | 2,582 (7.0%) |
| 65 to 69 Years | 2,725 (7.4%) | 2,493 (6.8%) |
| 70 to 74 Years | 1,940 (5.3%) | 1,970 (5.4%) |
| 75 to 79 Years | 1,116 (3.0%) | 1,408 (3.8%) |
| 80 to 84 Years | 978 (2.7%) | 1,313 (3.6%) |
| 85 Years and over | 663 (1.8%) | 1,166 (3.2%) |
| Total | 36,619 (100.0%) | 36,710 (100.0%) |
Families and Households in Daytona Beach
Median Family Size in Daytona Beach
The median family size in Daytona Beach is 2.81 persons per family, with single female/mother families (4,446 | 28.0%) accounting for the largest median family size of 3.1 persons per family. On the other hand, single male/father families (1,970 | 12.4%) represent the smallest median family size with 2.52 persons per family.
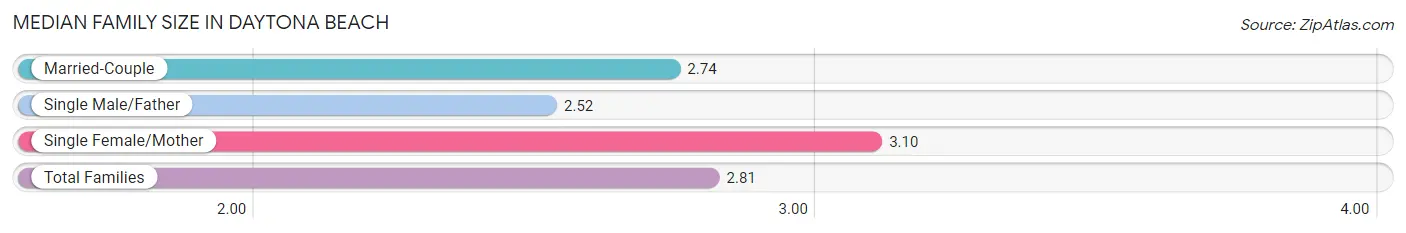
| Family Type | # Families | Family Size |
| Married-Couple | 9,455 (59.6%) | 2.74 |
| Single Male/Father | 1,970 (12.4%) | 2.52 |
| Single Female/Mother | 4,446 (28.0%) | 3.10 |
| Total Families | 15,871 (100.0%) | 2.81 |
Median Household Size in Daytona Beach
The median household size in Daytona Beach is 2.11 persons per household, with single female/mother households (4,446 | 13.8%) accounting for the largest median household size of 3.28 persons per household. non-family households (16,345 | 50.7%) represent the smallest median household size with 1.31 persons per household.
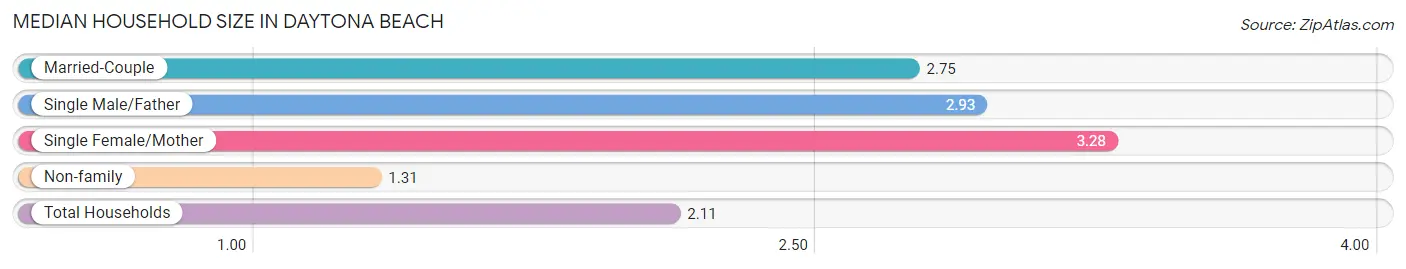
| Household Type | # Households | Household Size |
| Married-Couple | 9,455 (29.3%) | 2.75 |
| Single Male/Father | 1,970 (6.1%) | 2.93 |
| Single Female/Mother | 4,446 (13.8%) | 3.28 |
| Non-family | 16,345 (50.7%) | 1.31 |
| Total Households | 32,216 (100.0%) | 2.11 |
Household Size by Marriage Status in Daytona Beach
Out of a total of 32,216 households in Daytona Beach, 15,871 (49.3%) are family households, while 16,345 (50.7%) are nonfamily households. The most numerous type of family households are 2-person households, comprising 8,494, and the most common type of nonfamily households are 1-person households, comprising 12,405.
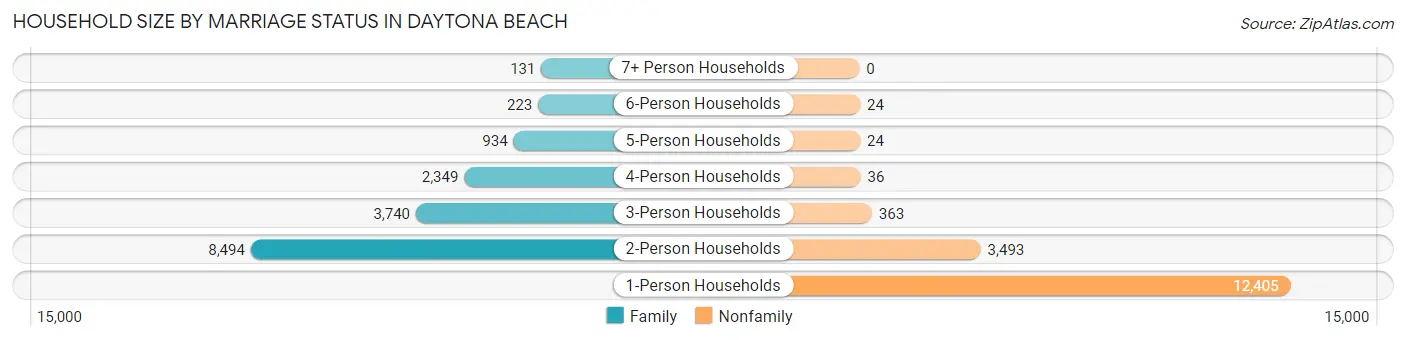
| Household Size | Family Households | Nonfamily Households |
| 1-Person Households | - | 12,405 (38.5%) |
| 2-Person Households | 8,494 (26.4%) | 3,493 (10.8%) |
| 3-Person Households | 3,740 (11.6%) | 363 (1.1%) |
| 4-Person Households | 2,349 (7.3%) | 36 (0.1%) |
| 5-Person Households | 934 (2.9%) | 24 (0.1%) |
| 6-Person Households | 223 (0.7%) | 24 (0.1%) |
| 7+ Person Households | 131 (0.4%) | 0 (0.0%) |
| Total | 15,871 (49.3%) | 16,345 (50.7%) |
Female Fertility in Daytona Beach
Fertility by Age in Daytona Beach
Average fertility rate in Daytona Beach is 34.0 births per 1,000 women. Women in the age bracket of 20 to 34 years have the highest fertility rate with 56.0 births per 1,000 women. Women in the age bracket of 20 to 34 years acount for 85.7% of all women with births.
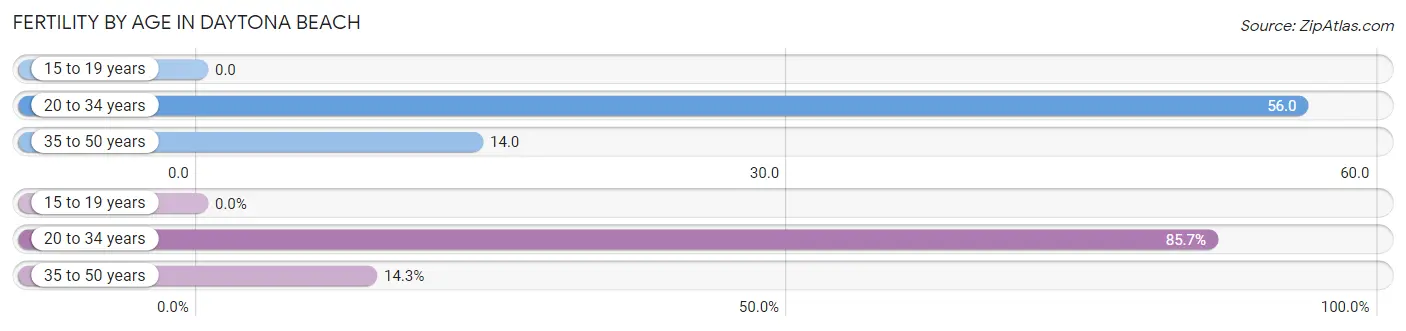
| Age Bracket | Women with Births | Births / 1,000 Women |
| 15 to 19 years | 0 (0.0%) | 0.0 |
| 20 to 34 years | 484 (85.7%) | 56.0 |
| 35 to 50 years | 81 (14.3%) | 14.0 |
| Total | 565 (100.0%) | 34.0 |
Fertility by Age by Marriage Status in Daytona Beach
34.5% of women with births (565) in Daytona Beach are married. The highest percentage of unmarried women with births falls into 35 to 50 years age bracket with 75.3% of them unmarried at the time of birth, while the lowest percentage of unmarried women with births belong to 20 to 34 years age bracket with 63.8% of them unmarried.
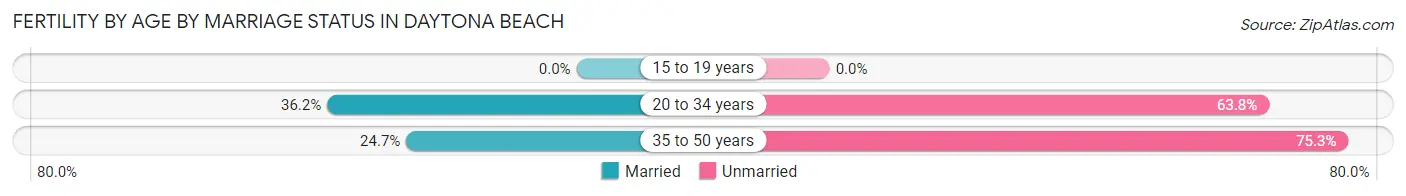
| Age Bracket | Married | Unmarried |
| 15 to 19 years | 0 (0.0%) | 0 (0.0%) |
| 20 to 34 years | 175 (36.2%) | 309 (63.8%) |
| 35 to 50 years | 20 (24.7%) | 61 (75.3%) |
| Total | 195 (34.5%) | 370 (65.5%) |
Fertility by Education in Daytona Beach
Average fertility rate in Daytona Beach is 34.0 births per 1,000 women. Women with the education attainment of graduate degree have the highest fertility rate of 114.0 births per 1,000 women, while women with the education attainment of less than high school have the lowest fertility at 7.0 births per 1,000 women. Women with the education attainment of college or associate's degree represent 31.5% of all women with births.
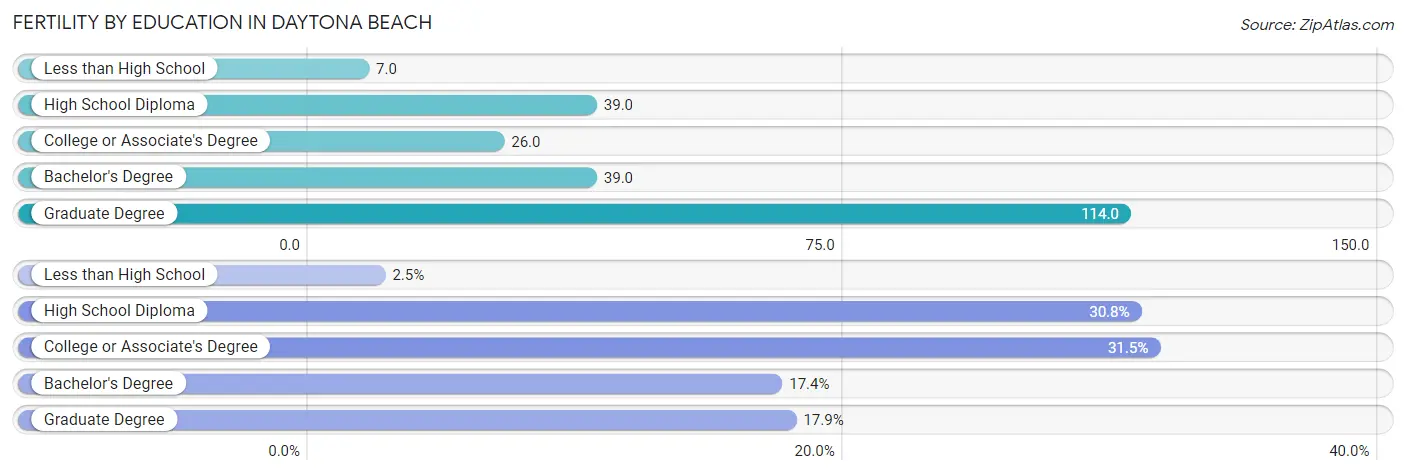
| Educational Attainment | Women with Births | Births / 1,000 Women |
| Less than High School | 14 (2.5%) | 7.0 |
| High School Diploma | 174 (30.8%) | 39.0 |
| College or Associate's Degree | 178 (31.5%) | 26.0 |
| Bachelor's Degree | 98 (17.3%) | 39.0 |
| Graduate Degree | 101 (17.9%) | 114.0 |
| Total | 565 (100.0%) | 34.0 |
Fertility by Education by Marriage Status in Daytona Beach
65.5% of women with births in Daytona Beach are unmarried. Women with the educational attainment of bachelor's degree are most likely to be married with 100.0% of them married at childbirth, while women with the educational attainment of less than high school are least likely to be married with 100.0% of them unmarried at childbirth.
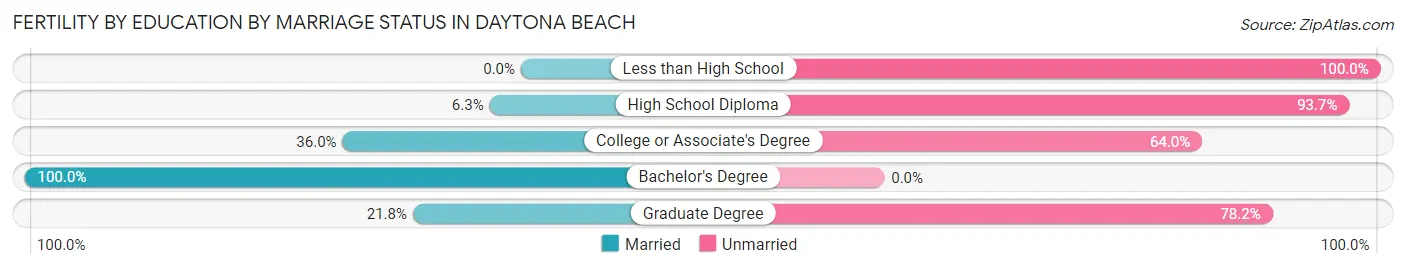
| Educational Attainment | Married | Unmarried |
| Less than High School | 0 (0.0%) | 14 (100.0%) |
| High School Diploma | 11 (6.3%) | 163 (93.7%) |
| College or Associate's Degree | 64 (36.0%) | 114 (64.0%) |
| Bachelor's Degree | 98 (100.0%) | 0 (0.0%) |
| Graduate Degree | 22 (21.8%) | 79 (78.2%) |
| Total | 195 (34.5%) | 370 (65.5%) |
Employment Characteristics in Daytona Beach
Employment by Class of Employer in Daytona Beach
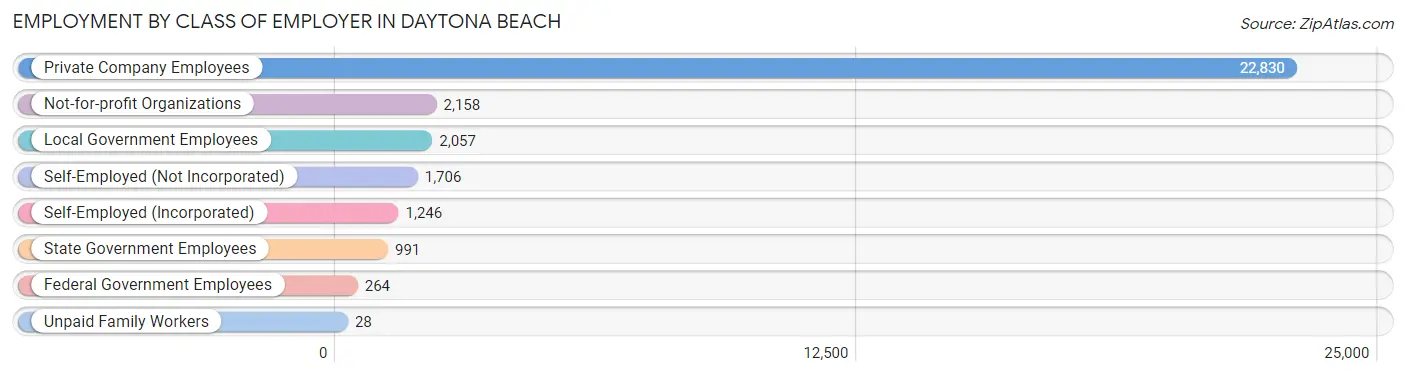
Among the 31,280 employed individuals in Daytona Beach, private company employees (22,830 | 73.0%), not-for-profit organizations (2,158 | 6.9%), and local government employees (2,057 | 6.6%) make up the most common classes of employment.
| Employer Class | # Employees | % Employees |
| Private Company Employees | 22,830 | 73.0% |
| Self-Employed (Incorporated) | 1,246 | 4.0% |
| Self-Employed (Not Incorporated) | 1,706 | 5.4% |
| Not-for-profit Organizations | 2,158 | 6.9% |
| Local Government Employees | 2,057 | 6.6% |
| State Government Employees | 991 | 3.2% |
| Federal Government Employees | 264 | 0.8% |
| Unpaid Family Workers | 28 | 0.1% |
| Total | 31,280 | 100.0% |
Employment Status by Age in Daytona Beach
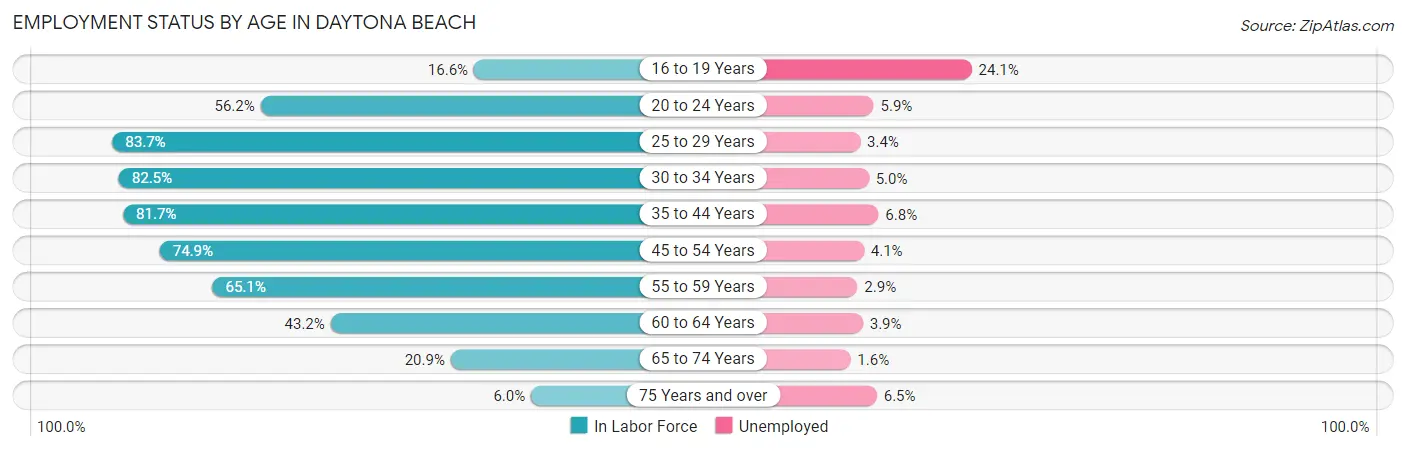
According to the labor force statistics for Daytona Beach, out of the total population over 16 years of age (63,655), 52.7% or 33,546 individuals are in the labor force, with 5.0% or 1,677 of them unemployed. The age group with the highest labor force participation rate is 25 to 29 years, with 83.7% or 5,521 individuals in the labor force. Within the labor force, the 16 to 19 years age range has the highest percentage of unemployed individuals, with 24.1% or 172 of them being unemployed.
| Age Bracket | In Labor Force | Unemployed |
| 16 to 19 Years | 715 (16.6%) | 172 (24.1%) |
| 20 to 24 Years | 4,212 (56.2%) | 249 (5.9%) |
| 25 to 29 Years | 5,521 (83.7%) | 188 (3.4%) |
| 30 to 34 Years | 3,523 (82.5%) | 176 (5.0%) |
| 35 to 44 Years | 6,266 (81.7%) | 426 (6.8%) |
| 45 to 54 Years | 5,525 (74.9%) | 227 (4.1%) |
| 55 to 59 Years | 3,262 (65.1%) | 95 (2.9%) |
| 60 to 64 Years | 2,228 (43.2%) | 87 (3.9%) |
| 65 to 74 Years | 1,908 (20.9%) | 31 (1.6%) |
| 75 Years and over | 399 (6.0%) | 26 (6.5%) |
| Total | 33,546 (52.7%) | 1,677 (5.0%) |
Employment Status by Educational Attainment in Daytona Beach
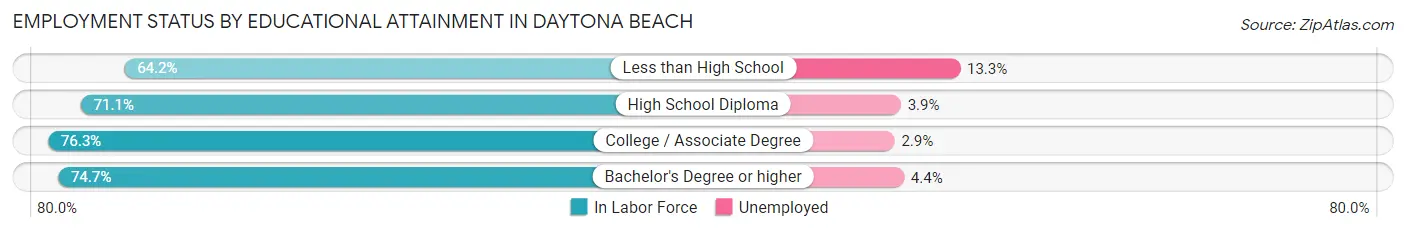
According to labor force statistics for Daytona Beach, 73.0% of individuals (26,338) out of the total population between 25 and 64 years of age (36,079) are in the labor force, with 4.6% or 1,212 of them being unemployed. The group with the highest labor force participation rate are those with the educational attainment of college / associate degree, with 76.3% or 9,185 individuals in the labor force. Within the labor force, individuals with less than high school education have the highest percentage of unemployment, with 13.3% or 330 of them being unemployed.
| Educational Attainment | In Labor Force | Unemployed |
| Less than High School | 2,483 (64.2%) | 514 (13.3%) |
| High School Diploma | 8,062 (71.1%) | 442 (3.9%) |
| College / Associate Degree | 9,185 (76.3%) | 349 (2.9%) |
| Bachelor's Degree or higher | 6,600 (74.7%) | 389 (4.4%) |
| Total | 26,338 (73.0%) | 1,660 (4.6%) |
Employment Occupations by Sex in Daytona Beach
Management, Business, Science and Arts Occupations
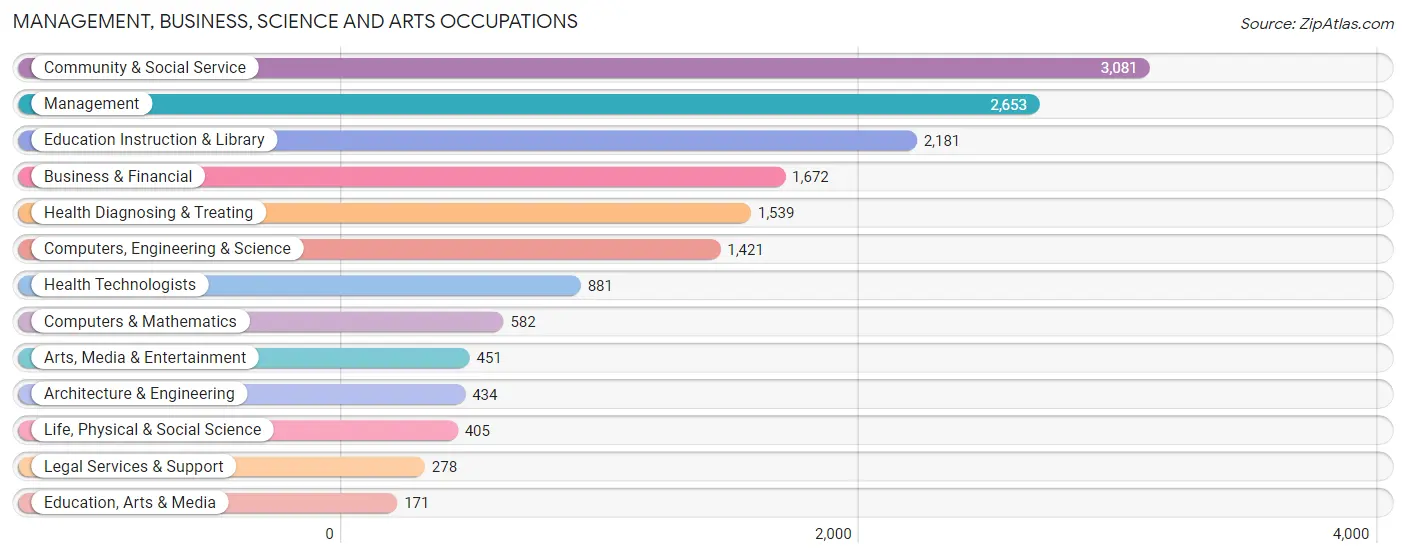
The most common Management, Business, Science and Arts occupations in Daytona Beach are Community & Social Service (3,081 | 9.7%), Management (2,653 | 8.3%), Education Instruction & Library (2,181 | 6.9%), Business & Financial (1,672 | 5.3%), and Health Diagnosing & Treating (1,539 | 4.8%).
Management, Business, Science and Arts Occupations by Sex
Within the Management, Business, Science and Arts occupations in Daytona Beach, the most male-oriented occupations are Architecture & Engineering (93.1%), Computers & Mathematics (76.8%), and Computers, Engineering & Science (68.3%), while the most female-oriented occupations are Legal Services & Support (74.1%), Health Diagnosing & Treating (72.1%), and Education, Arts & Media (70.8%).
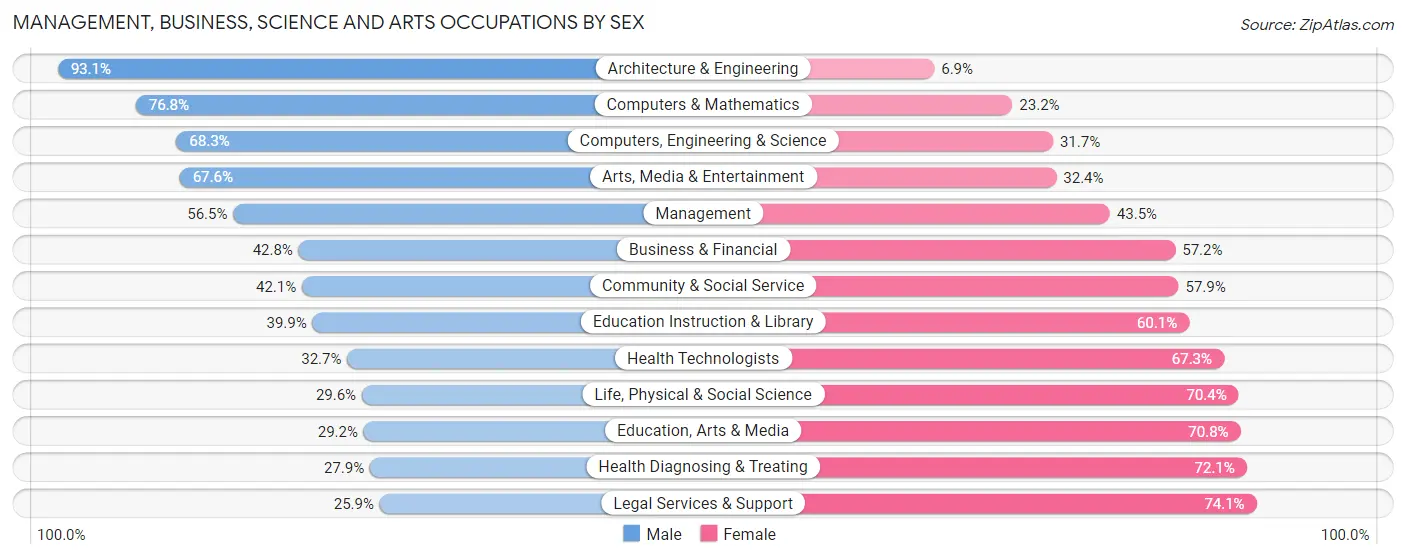
| Occupation | Male | Female |
| Management | 1,498 (56.5%) | 1,155 (43.5%) |
| Business & Financial | 716 (42.8%) | 956 (57.2%) |
| Computers, Engineering & Science | 971 (68.3%) | 450 (31.7%) |
| Computers & Mathematics | 447 (76.8%) | 135 (23.2%) |
| Architecture & Engineering | 404 (93.1%) | 30 (6.9%) |
| Life, Physical & Social Science | 120 (29.6%) | 285 (70.4%) |
| Community & Social Service | 1,298 (42.1%) | 1,783 (57.9%) |
| Education, Arts & Media | 50 (29.2%) | 121 (70.8%) |
| Legal Services & Support | 72 (25.9%) | 206 (74.1%) |
| Education Instruction & Library | 871 (39.9%) | 1,310 (60.1%) |
| Arts, Media & Entertainment | 305 (67.6%) | 146 (32.4%) |
| Health Diagnosing & Treating | 430 (27.9%) | 1,109 (72.1%) |
| Health Technologists | 288 (32.7%) | 593 (67.3%) |
| Total (Category) | 4,913 (47.4%) | 5,453 (52.6%) |
| Total (Overall) | 16,982 (53.4%) | 14,824 (46.6%) |
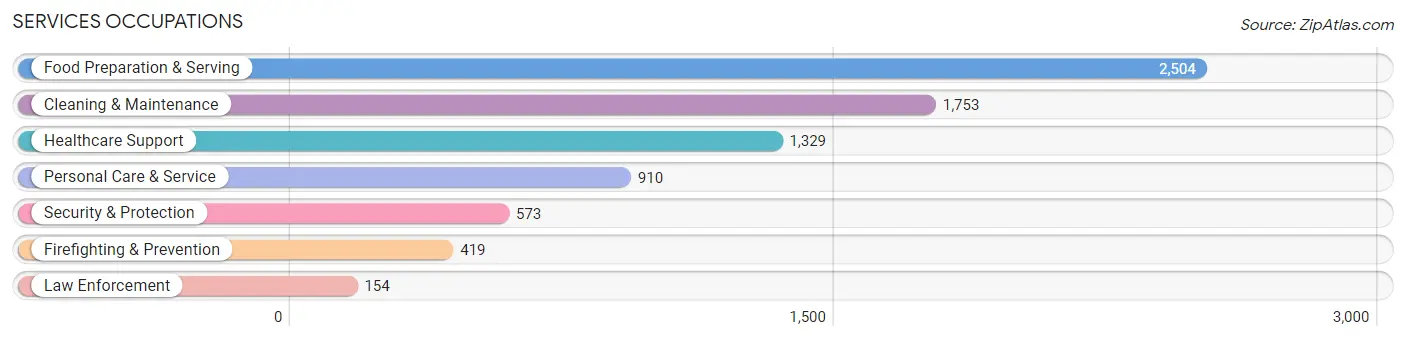
Services Occupations
The most common Services occupations in Daytona Beach are Food Preparation & Serving (2,504 | 7.9%), Cleaning & Maintenance (1,753 | 5.5%), Healthcare Support (1,329 | 4.2%), Personal Care & Service (910 | 2.9%), and Security & Protection (573 | 1.8%).
Services Occupations by Sex
Within the Services occupations in Daytona Beach, the most male-oriented occupations are Firefighting & Prevention (85.4%), Security & Protection (80.6%), and Law Enforcement (67.5%), while the most female-oriented occupations are Healthcare Support (86.5%), Personal Care & Service (61.3%), and Food Preparation & Serving (43.4%).
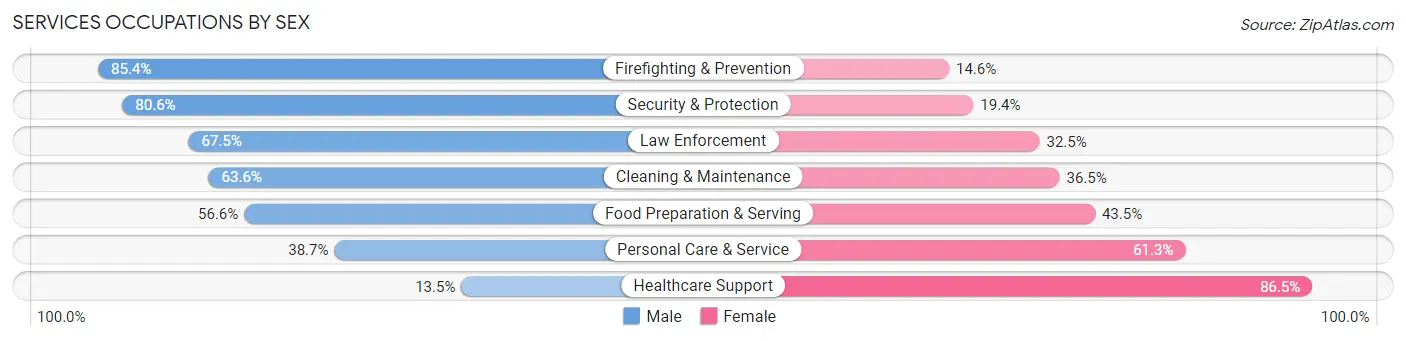
| Occupation | Male | Female |
| Healthcare Support | 180 (13.5%) | 1,149 (86.5%) |
| Security & Protection | 462 (80.6%) | 111 (19.4%) |
| Firefighting & Prevention | 358 (85.4%) | 61 (14.6%) |
| Law Enforcement | 104 (67.5%) | 50 (32.5%) |
| Food Preparation & Serving | 1,416 (56.6%) | 1,088 (43.4%) |
| Cleaning & Maintenance | 1,114 (63.5%) | 639 (36.4%) |
| Personal Care & Service | 352 (38.7%) | 558 (61.3%) |
| Total (Category) | 3,524 (49.8%) | 3,545 (50.1%) |
| Total (Overall) | 16,982 (53.4%) | 14,824 (46.6%) |
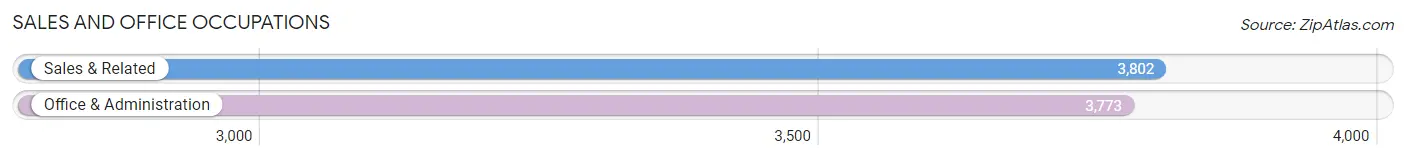
Sales and Office Occupations
The most common Sales and Office occupations in Daytona Beach are Sales & Related (3,802 | 11.9%), and Office & Administration (3,773 | 11.9%).
Sales and Office Occupations by Sex
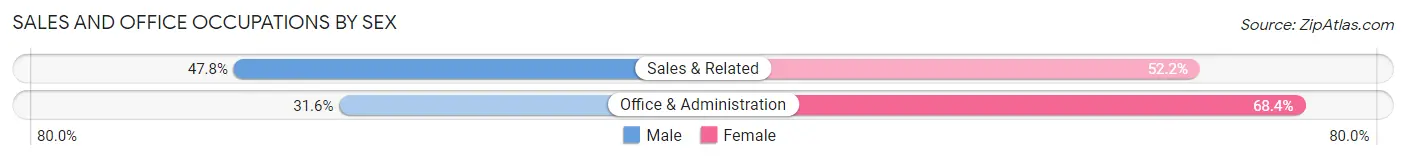
| Occupation | Male | Female |
| Sales & Related | 1,818 (47.8%) | 1,984 (52.2%) |
| Office & Administration | 1,192 (31.6%) | 2,581 (68.4%) |
| Total (Category) | 3,010 (39.7%) | 4,565 (60.3%) |
| Total (Overall) | 16,982 (53.4%) | 14,824 (46.6%) |
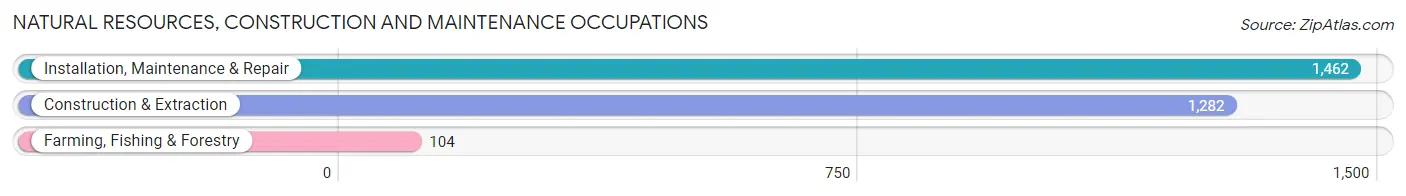
Natural Resources, Construction and Maintenance Occupations
The most common Natural Resources, Construction and Maintenance occupations in Daytona Beach are Installation, Maintenance & Repair (1,462 | 4.6%), Construction & Extraction (1,282 | 4.0%), and Farming, Fishing & Forestry (104 | 0.3%).
Natural Resources, Construction and Maintenance Occupations by Sex
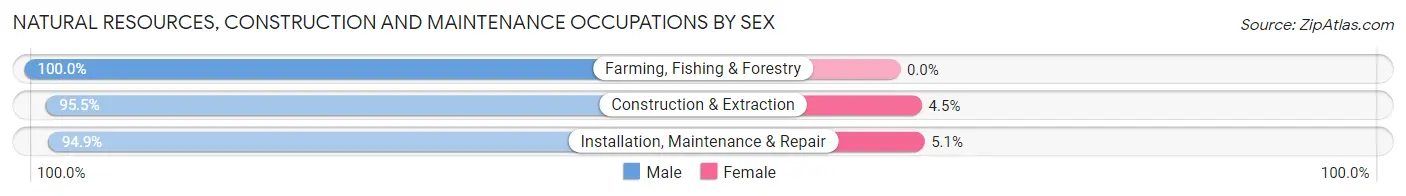
| Occupation | Male | Female |
| Farming, Fishing & Forestry | 104 (100.0%) | 0 (0.0%) |
| Construction & Extraction | 1,224 (95.5%) | 58 (4.5%) |
| Installation, Maintenance & Repair | 1,388 (94.9%) | 74 (5.1%) |
| Total (Category) | 2,716 (95.4%) | 132 (4.6%) |
| Total (Overall) | 16,982 (53.4%) | 14,824 (46.6%) |
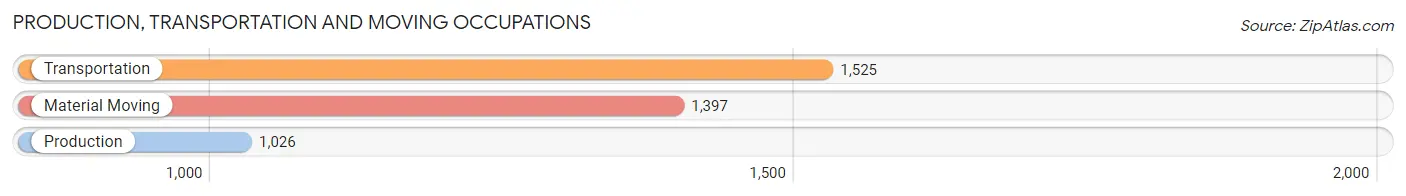
Production, Transportation and Moving Occupations
The most common Production, Transportation and Moving occupations in Daytona Beach are Transportation (1,525 | 4.8%), Material Moving (1,397 | 4.4%), and Production (1,026 | 3.2%).
Production, Transportation and Moving Occupations by Sex
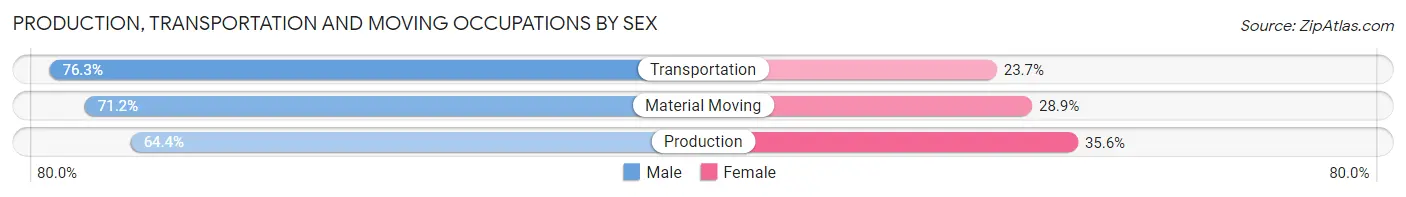
| Occupation | Male | Female |
| Production | 661 (64.4%) | 365 (35.6%) |
| Transportation | 1,164 (76.3%) | 361 (23.7%) |
| Material Moving | 994 (71.2%) | 403 (28.8%) |
| Total (Category) | 2,819 (71.4%) | 1,129 (28.6%) |
| Total (Overall) | 16,982 (53.4%) | 14,824 (46.6%) |
Employment Industries by Sex in Daytona Beach
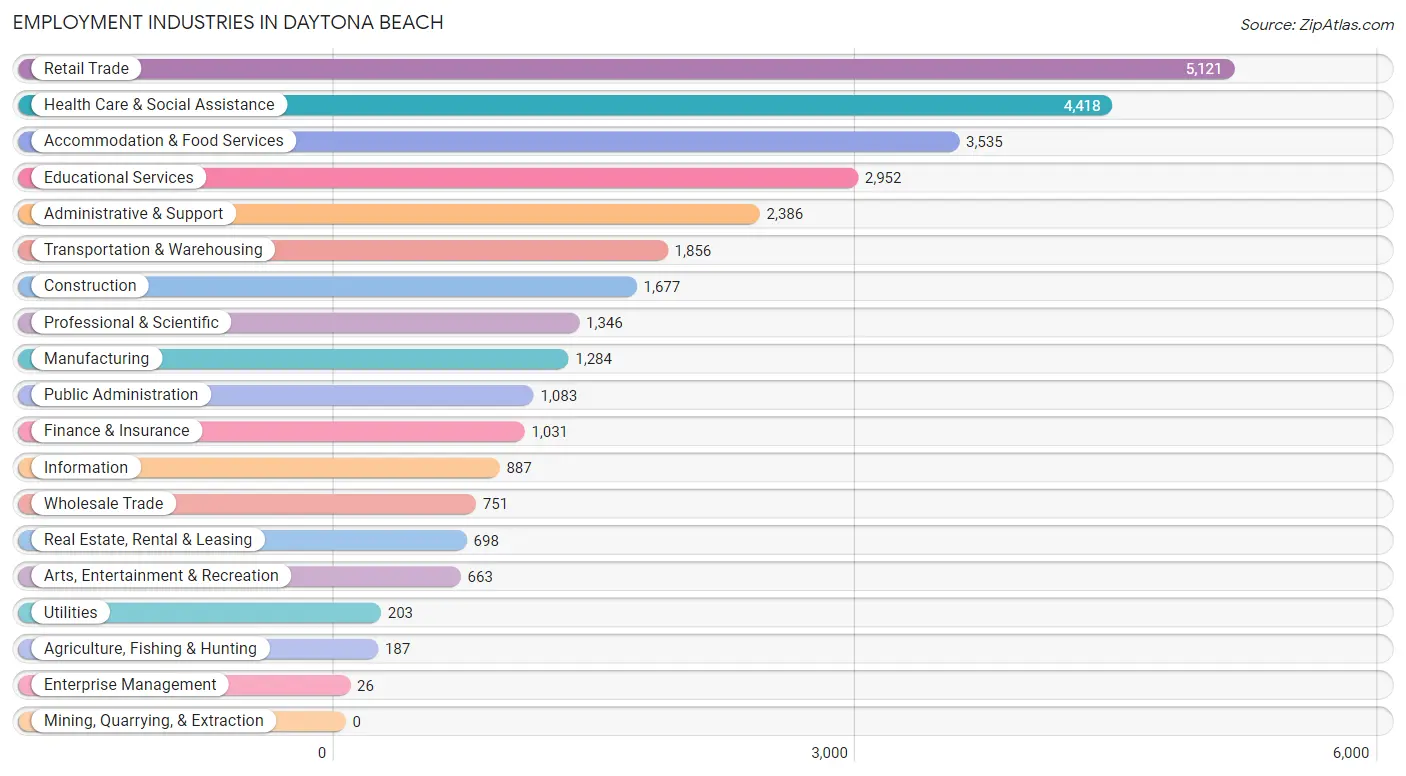
Employment Industries in Daytona Beach
The major employment industries in Daytona Beach include Retail Trade (5,121 | 16.1%), Health Care & Social Assistance (4,418 | 13.9%), Accommodation & Food Services (3,535 | 11.1%), Educational Services (2,952 | 9.3%), and Administrative & Support (2,386 | 7.5%).
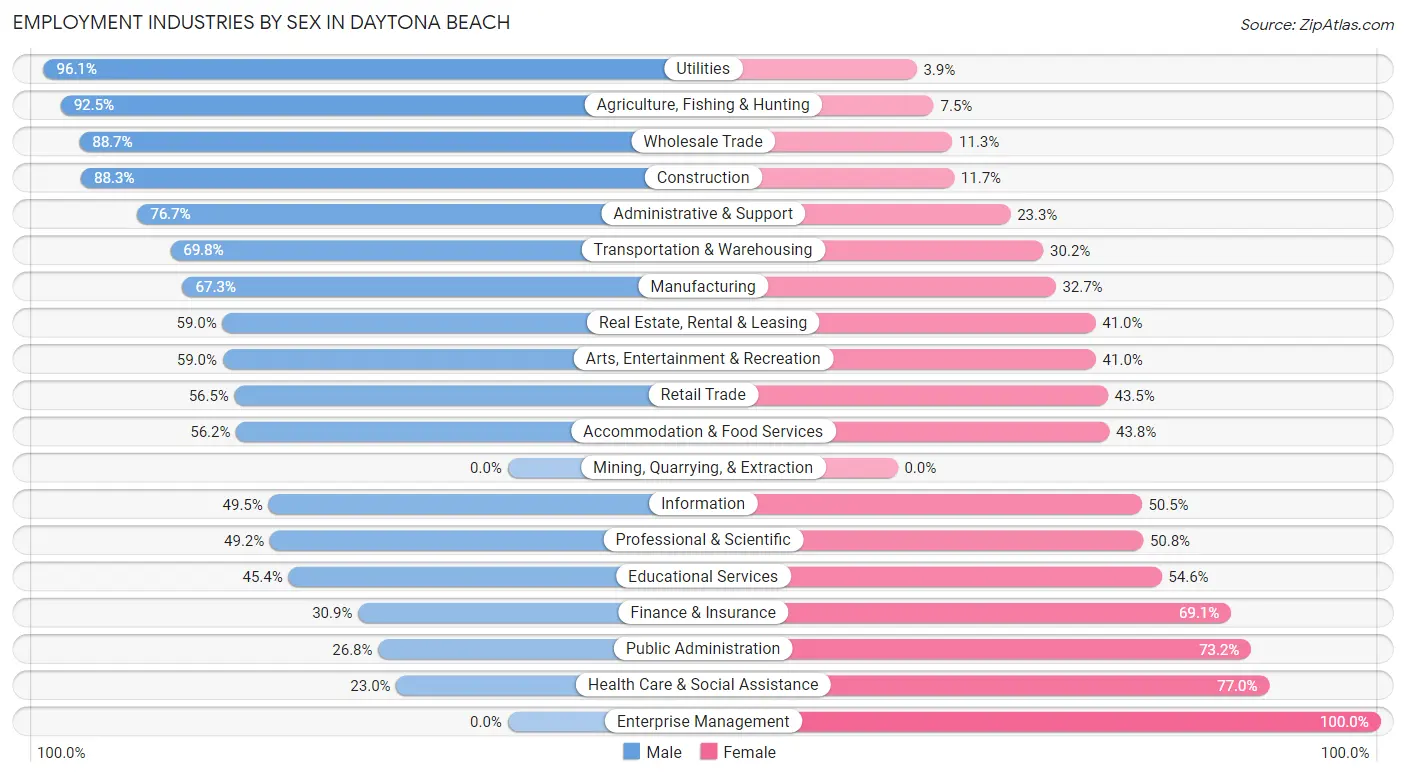
Employment Industries by Sex in Daytona Beach
The Daytona Beach industries that see more men than women are Utilities (96.1%), Agriculture, Fishing & Hunting (92.5%), and Wholesale Trade (88.7%), whereas the industries that tend to have a higher number of women are Enterprise Management (100.0%), Health Care & Social Assistance (77.0%), and Public Administration (73.2%).
| Industry | Male | Female |
| Agriculture, Fishing & Hunting | 173 (92.5%) | 14 (7.5%) |
| Mining, Quarrying, & Extraction | 0 (0.0%) | 0 (0.0%) |
| Construction | 1,481 (88.3%) | 196 (11.7%) |
| Manufacturing | 864 (67.3%) | 420 (32.7%) |
| Wholesale Trade | 666 (88.7%) | 85 (11.3%) |
| Retail Trade | 2,894 (56.5%) | 2,227 (43.5%) |
| Transportation & Warehousing | 1,296 (69.8%) | 560 (30.2%) |
| Utilities | 195 (96.1%) | 8 (3.9%) |
| Information | 439 (49.5%) | 448 (50.5%) |
| Finance & Insurance | 319 (30.9%) | 712 (69.1%) |
| Real Estate, Rental & Leasing | 412 (59.0%) | 286 (41.0%) |
| Professional & Scientific | 662 (49.2%) | 684 (50.8%) |
| Enterprise Management | 0 (0.0%) | 26 (100.0%) |
| Administrative & Support | 1,829 (76.7%) | 557 (23.3%) |
| Educational Services | 1,339 (45.4%) | 1,613 (54.6%) |
| Health Care & Social Assistance | 1,018 (23.0%) | 3,400 (77.0%) |
| Arts, Entertainment & Recreation | 391 (59.0%) | 272 (41.0%) |
| Accommodation & Food Services | 1,986 (56.2%) | 1,549 (43.8%) |
| Public Administration | 290 (26.8%) | 793 (73.2%) |
| Total | 16,982 (53.4%) | 14,824 (46.6%) |
Education in Daytona Beach
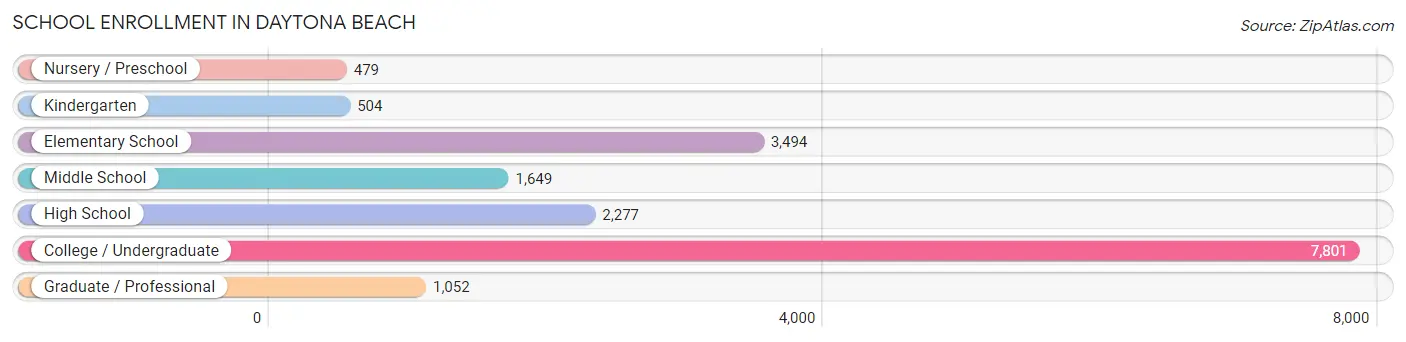
School Enrollment in Daytona Beach
The most common levels of schooling among the 17,256 students in Daytona Beach are college / undergraduate (7,801 | 45.2%), elementary school (3,494 | 20.3%), and high school (2,277 | 13.2%).
| School Level | # Students | % Students |
| Nursery / Preschool | 479 | 2.8% |
| Kindergarten | 504 | 2.9% |
| Elementary School | 3,494 | 20.3% |
| Middle School | 1,649 | 9.6% |
| High School | 2,277 | 13.2% |
| College / Undergraduate | 7,801 | 45.2% |
| Graduate / Professional | 1,052 | 6.1% |
| Total | 17,256 | 100.0% |
School Enrollment by Age by Funding Source in Daytona Beach
Out of a total of 17,256 students who are enrolled in schools in Daytona Beach, 7,092 (41.1%) attend a private institution, while the remaining 10,164 (58.9%) are enrolled in public schools. The age group of 20 to 24 year olds has the highest likelihood of being enrolled in private schools, with 2,782 (68.7% in the age bracket) enrolled. Conversely, the age group of 15 to 17 year olds has the lowest likelihood of being enrolled in a private school, with 1,264 (90.0% in the age bracket) attending a public institution.
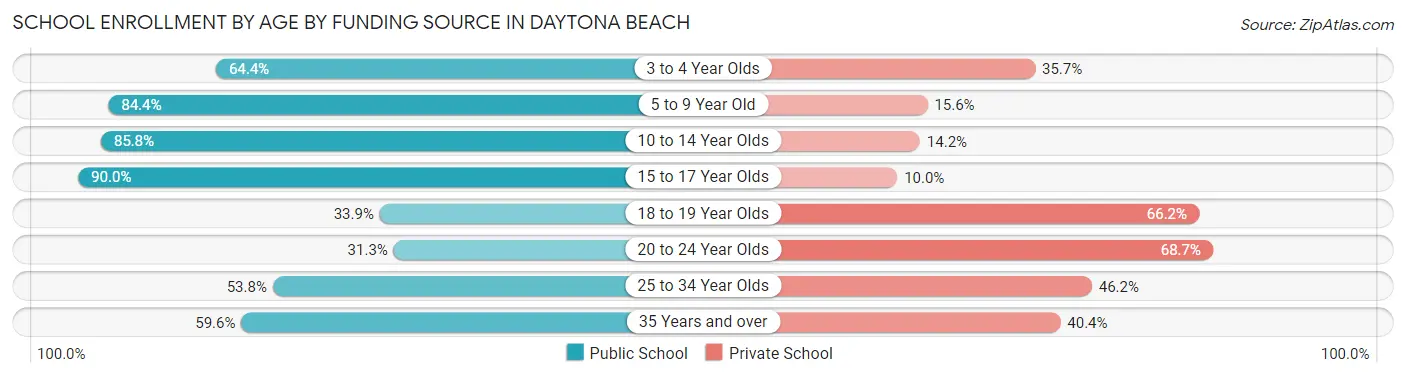
| Age Bracket | Public School | Private School |
| 3 to 4 Year Olds | 269 (64.3%) | 149 (35.6%) |
| 5 to 9 Year Old | 3,128 (84.4%) | 578 (15.6%) |
| 10 to 14 Year Olds | 1,818 (85.8%) | 301 (14.2%) |
| 15 to 17 Year Olds | 1,264 (90.0%) | 140 (10.0%) |
| 18 to 19 Year Olds | 1,066 (33.9%) | 2,083 (66.1%) |
| 20 to 24 Year Olds | 1,265 (31.3%) | 2,782 (68.7%) |
| 25 to 34 Year Olds | 754 (53.8%) | 648 (46.2%) |
| 35 Years and over | 603 (59.6%) | 408 (40.4%) |
| Total | 10,164 (58.9%) | 7,092 (41.1%) |
Educational Attainment by Field of Study in Daytona Beach
Business (3,233 | 23.5%), education (1,720 | 12.5%), science & technology (1,216 | 8.9%), engineering (1,077 | 7.9%), and arts & humanities (1,015 | 7.4%) are the most common fields of study among 13,726 individuals in Daytona Beach who have obtained a bachelor's degree or higher.
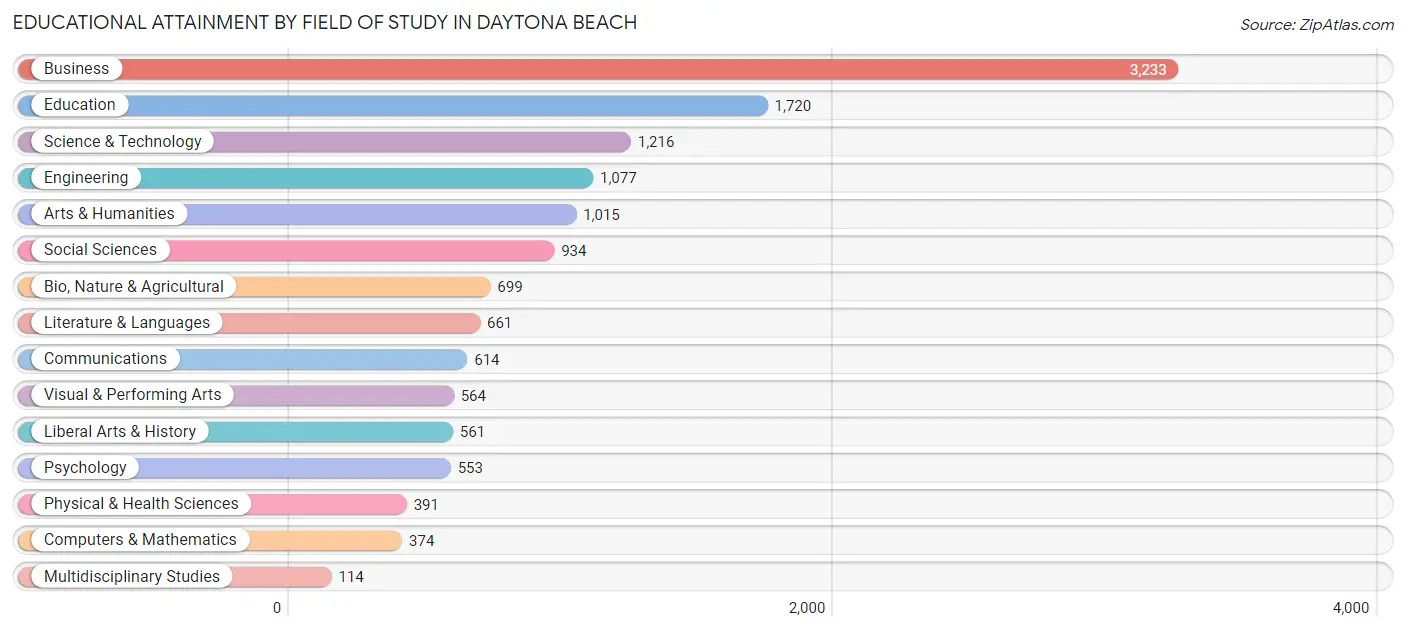
| Field of Study | # Graduates | % Graduates |
| Computers & Mathematics | 374 | 2.7% |
| Bio, Nature & Agricultural | 699 | 5.1% |
| Physical & Health Sciences | 391 | 2.9% |
| Psychology | 553 | 4.0% |
| Social Sciences | 934 | 6.8% |
| Engineering | 1,077 | 7.9% |
| Multidisciplinary Studies | 114 | 0.8% |
| Science & Technology | 1,216 | 8.9% |
| Business | 3,233 | 23.5% |
| Education | 1,720 | 12.5% |
| Literature & Languages | 661 | 4.8% |
| Liberal Arts & History | 561 | 4.1% |
| Visual & Performing Arts | 564 | 4.1% |
| Communications | 614 | 4.5% |
| Arts & Humanities | 1,015 | 7.4% |
| Total | 13,726 | 100.0% |
Transportation & Commute in Daytona Beach
Vehicle Availability by Sex in Daytona Beach
The most prevalent vehicle ownership categories in Daytona Beach are males with 2 vehicles (6,259, accounting for 37.4%) and females with 2 vehicles (5,145, making up 43.3%).
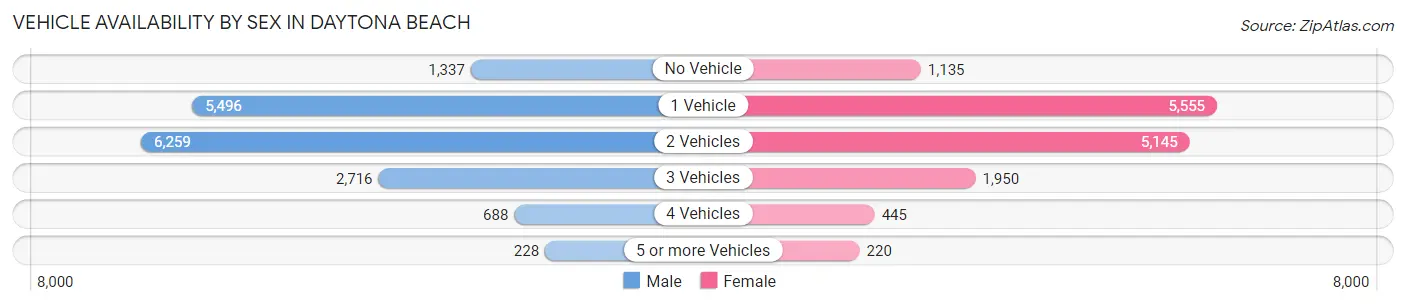
| Vehicles Available | Male | Female |
| No Vehicle | 1,337 (8.0%) | 1,135 (7.9%) |
| 1 Vehicle | 5,496 (32.9%) | 5,555 (38.4%) |
| 2 Vehicles | 6,259 (37.4%) | 5,145 (35.6%) |
| 3 Vehicles | 2,716 (16.2%) | 1,950 (13.5%) |
| 4 Vehicles | 688 (4.1%) | 445 (3.1%) |
| 5 or more Vehicles | 228 (1.4%) | 220 (1.5%) |
| Total | 16,724 (100.0%) | 14,450 (100.0%) |
Commute Time in Daytona Beach
The most frequently occuring commute durations in Daytona Beach are 15 to 19 minutes (6,666 commuters, 23.0%), 10 to 14 minutes (6,152 commuters, 21.2%), and 5 to 9 minutes (4,028 commuters, 13.9%).
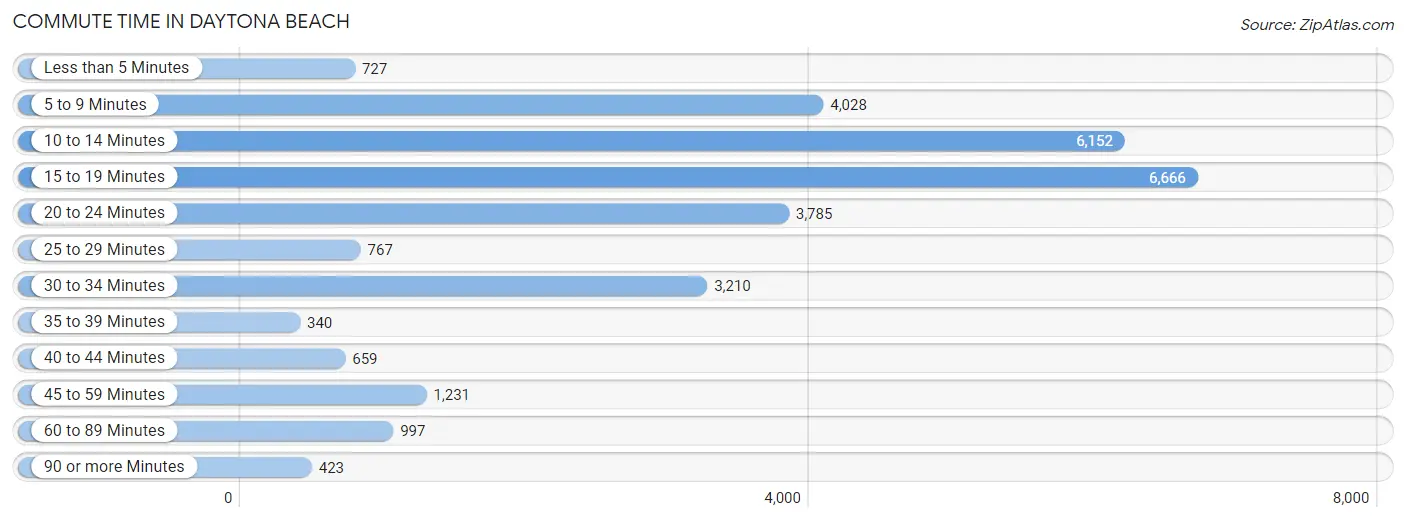
| Commute Time | # Commuters | % Commuters |
| Less than 5 Minutes | 727 | 2.5% |
| 5 to 9 Minutes | 4,028 | 13.9% |
| 10 to 14 Minutes | 6,152 | 21.2% |
| 15 to 19 Minutes | 6,666 | 23.0% |
| 20 to 24 Minutes | 3,785 | 13.1% |
| 25 to 29 Minutes | 767 | 2.6% |
| 30 to 34 Minutes | 3,210 | 11.1% |
| 35 to 39 Minutes | 340 | 1.2% |
| 40 to 44 Minutes | 659 | 2.3% |
| 45 to 59 Minutes | 1,231 | 4.3% |
| 60 to 89 Minutes | 997 | 3.4% |
| 90 or more Minutes | 423 | 1.5% |
Commute Time by Sex in Daytona Beach
The most common commute times in Daytona Beach are 15 to 19 minutes (3,580 commuters, 23.0%) for males and 15 to 19 minutes (3,086 commuters, 23.0%) for females.
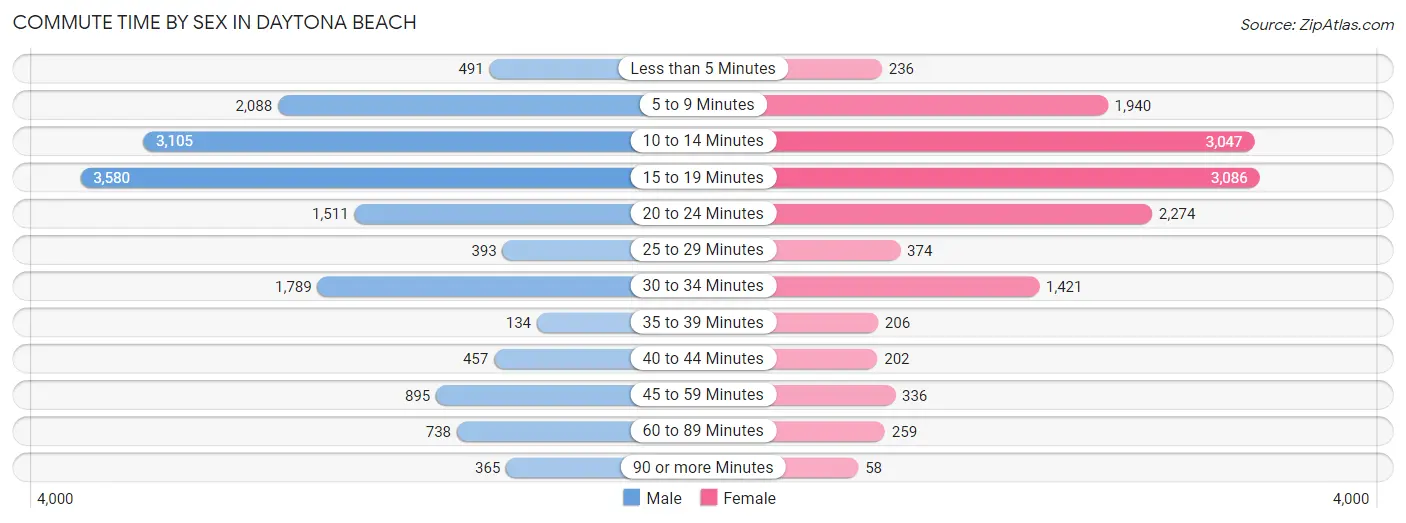
| Commute Time | Male | Female |
| Less than 5 Minutes | 491 (3.2%) | 236 (1.8%) |
| 5 to 9 Minutes | 2,088 (13.4%) | 1,940 (14.4%) |
| 10 to 14 Minutes | 3,105 (20.0%) | 3,047 (22.7%) |
| 15 to 19 Minutes | 3,580 (23.0%) | 3,086 (23.0%) |
| 20 to 24 Minutes | 1,511 (9.7%) | 2,274 (16.9%) |
| 25 to 29 Minutes | 393 (2.5%) | 374 (2.8%) |
| 30 to 34 Minutes | 1,789 (11.5%) | 1,421 (10.6%) |
| 35 to 39 Minutes | 134 (0.9%) | 206 (1.5%) |
| 40 to 44 Minutes | 457 (2.9%) | 202 (1.5%) |
| 45 to 59 Minutes | 895 (5.8%) | 336 (2.5%) |
| 60 to 89 Minutes | 738 (4.8%) | 259 (1.9%) |
| 90 or more Minutes | 365 (2.4%) | 58 (0.4%) |
Time of Departure to Work by Sex in Daytona Beach
The most frequent times of departure to work in Daytona Beach are 7:00 AM to 7:29 AM (2,086, 13.4%) for males and 8:00 AM to 8:29 AM (1,812, 13.5%) for females.
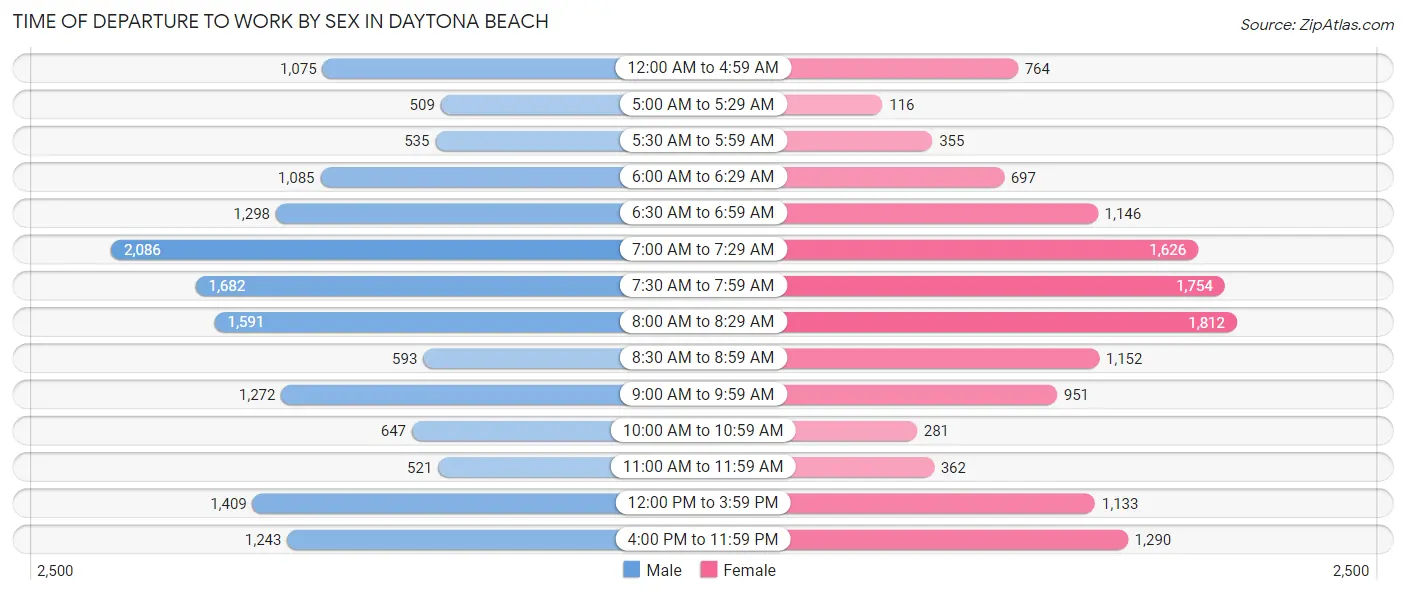
| Time of Departure | Male | Female |
| 12:00 AM to 4:59 AM | 1,075 (6.9%) | 764 (5.7%) |
| 5:00 AM to 5:29 AM | 509 (3.3%) | 116 (0.9%) |
| 5:30 AM to 5:59 AM | 535 (3.4%) | 355 (2.6%) |
| 6:00 AM to 6:29 AM | 1,085 (7.0%) | 697 (5.2%) |
| 6:30 AM to 6:59 AM | 1,298 (8.4%) | 1,146 (8.5%) |
| 7:00 AM to 7:29 AM | 2,086 (13.4%) | 1,626 (12.1%) |
| 7:30 AM to 7:59 AM | 1,682 (10.8%) | 1,754 (13.1%) |
| 8:00 AM to 8:29 AM | 1,591 (10.2%) | 1,812 (13.5%) |
| 8:30 AM to 8:59 AM | 593 (3.8%) | 1,152 (8.6%) |
| 9:00 AM to 9:59 AM | 1,272 (8.2%) | 951 (7.1%) |
| 10:00 AM to 10:59 AM | 647 (4.2%) | 281 (2.1%) |
| 11:00 AM to 11:59 AM | 521 (3.4%) | 362 (2.7%) |
| 12:00 PM to 3:59 PM | 1,409 (9.1%) | 1,133 (8.4%) |
| 4:00 PM to 11:59 PM | 1,243 (8.0%) | 1,290 (9.6%) |
| Total | 15,546 (100.0%) | 13,439 (100.0%) |
Housing Occupancy in Daytona Beach
Occupancy by Ownership in Daytona Beach
Of the total 32,216 dwellings in Daytona Beach, owner-occupied units account for 14,770 (45.9%), while renter-occupied units make up 17,446 (54.1%).
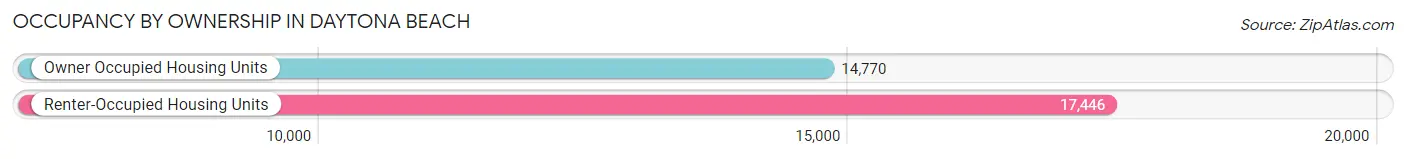
| Occupancy | # Housing Units | % Housing Units |
| Owner Occupied Housing Units | 14,770 | 45.9% |
| Renter-Occupied Housing Units | 17,446 | 54.1% |
| Total Occupied Housing Units | 32,216 | 100.0% |
Occupancy by Household Size in Daytona Beach
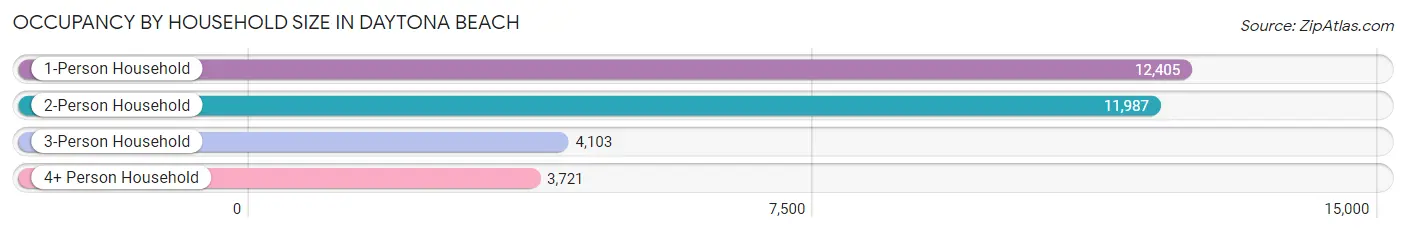
| Household Size | # Housing Units | % Housing Units |
| 1-Person Household | 12,405 | 38.5% |
| 2-Person Household | 11,987 | 37.2% |
| 3-Person Household | 4,103 | 12.7% |
| 4+ Person Household | 3,721 | 11.6% |
| Total Housing Units | 32,216 | 100.0% |
Occupancy by Ownership by Household Size in Daytona Beach
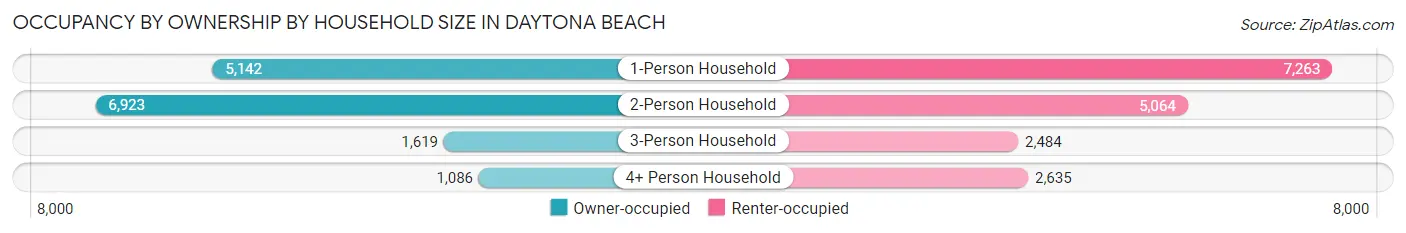
| Household Size | Owner-occupied | Renter-occupied |
| 1-Person Household | 5,142 (41.4%) | 7,263 (58.6%) |
| 2-Person Household | 6,923 (57.8%) | 5,064 (42.2%) |
| 3-Person Household | 1,619 (39.5%) | 2,484 (60.5%) |
| 4+ Person Household | 1,086 (29.2%) | 2,635 (70.8%) |
| Total Housing Units | 14,770 (45.9%) | 17,446 (54.1%) |
Occupancy by Educational Attainment in Daytona Beach
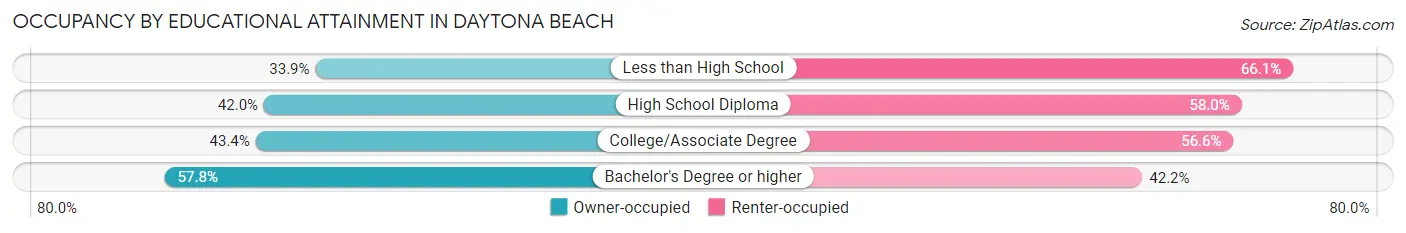
| Household Size | Owner-occupied | Renter-occupied |
| Less than High School | 1,144 (33.9%) | 2,233 (66.1%) |
| High School Diploma | 3,816 (42.0%) | 5,261 (58.0%) |
| College/Associate Degree | 4,835 (43.4%) | 6,317 (56.6%) |
| Bachelor's Degree or higher | 4,975 (57.8%) | 3,635 (42.2%) |
Occupancy by Age of Householder in Daytona Beach
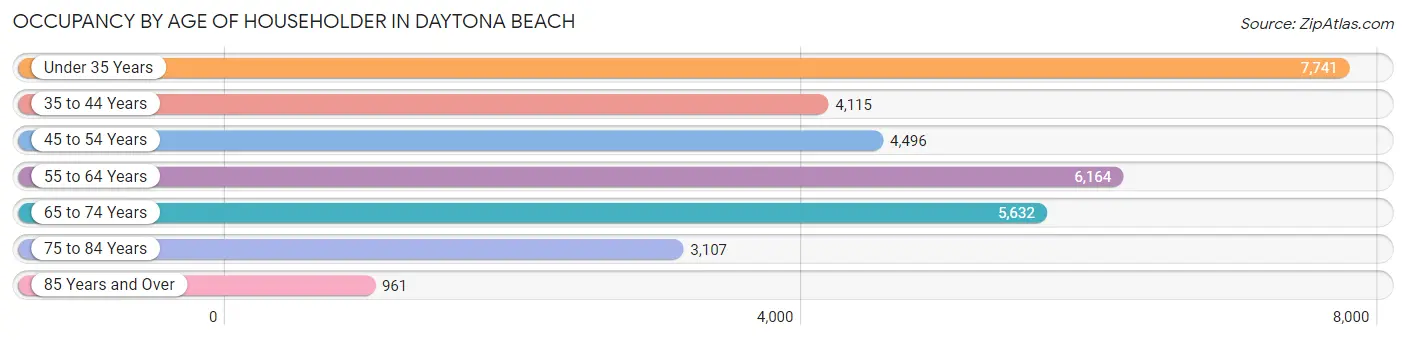
| Age Bracket | # Households | % Households |
| Under 35 Years | 7,741 | 24.0% |
| 35 to 44 Years | 4,115 | 12.8% |
| 45 to 54 Years | 4,496 | 14.0% |
| 55 to 64 Years | 6,164 | 19.1% |
| 65 to 74 Years | 5,632 | 17.5% |
| 75 to 84 Years | 3,107 | 9.6% |
| 85 Years and Over | 961 | 3.0% |
| Total | 32,216 | 100.0% |
Housing Finances in Daytona Beach
Median Income by Occupancy in Daytona Beach
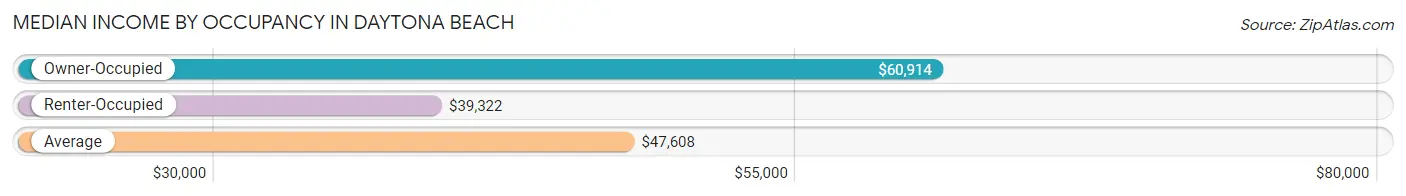
| Occupancy Type | # Households | Median Income |
| Owner-Occupied | 14,770 (45.9%) | $60,914 |
| Renter-Occupied | 17,446 (54.1%) | $39,322 |
| Average | 32,216 (100.0%) | $47,608 |
Occupancy by Householder Income Bracket in Daytona Beach
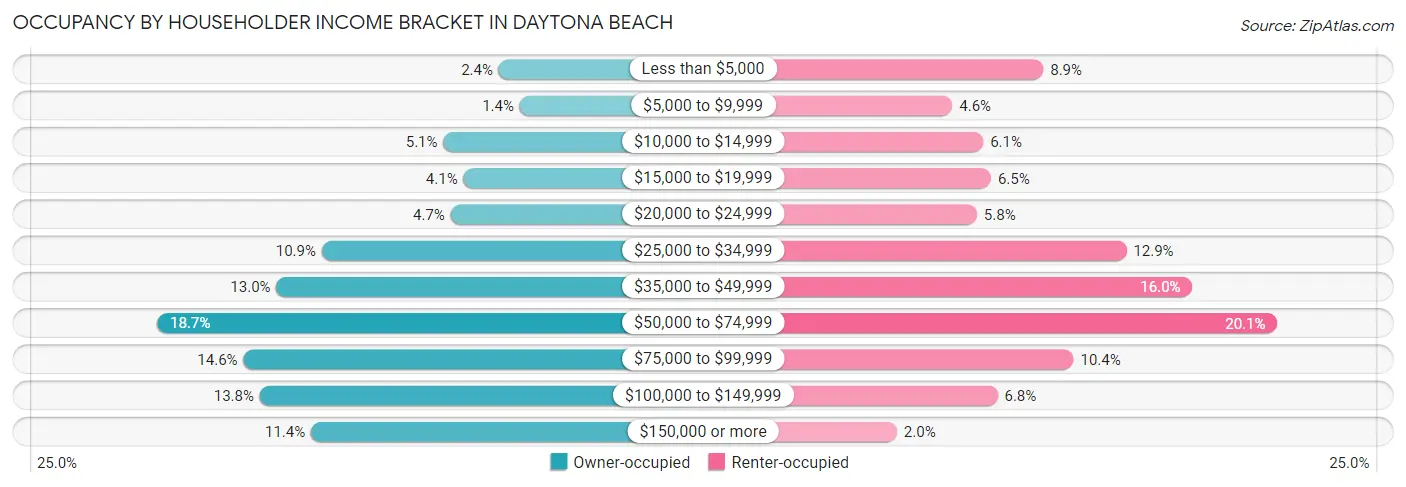
| Income Bracket | Owner-occupied | Renter-occupied |
| Less than $5,000 | 358 (2.4%) | 1,560 (8.9%) |
| $5,000 to $9,999 | 210 (1.4%) | 805 (4.6%) |
| $10,000 to $14,999 | 747 (5.1%) | 1,061 (6.1%) |
| $15,000 to $19,999 | 605 (4.1%) | 1,125 (6.5%) |
| $20,000 to $24,999 | 696 (4.7%) | 1,008 (5.8%) |
| $25,000 to $34,999 | 1,603 (10.8%) | 2,250 (12.9%) |
| $35,000 to $49,999 | 1,922 (13.0%) | 2,799 (16.0%) |
| $50,000 to $74,999 | 2,760 (18.7%) | 3,504 (20.1%) |
| $75,000 to $99,999 | 2,153 (14.6%) | 1,811 (10.4%) |
| $100,000 to $149,999 | 2,038 (13.8%) | 1,179 (6.8%) |
| $150,000 or more | 1,678 (11.4%) | 344 (2.0%) |
| Total | 14,770 (100.0%) | 17,446 (100.0%) |
Monthly Housing Cost Tiers in Daytona Beach
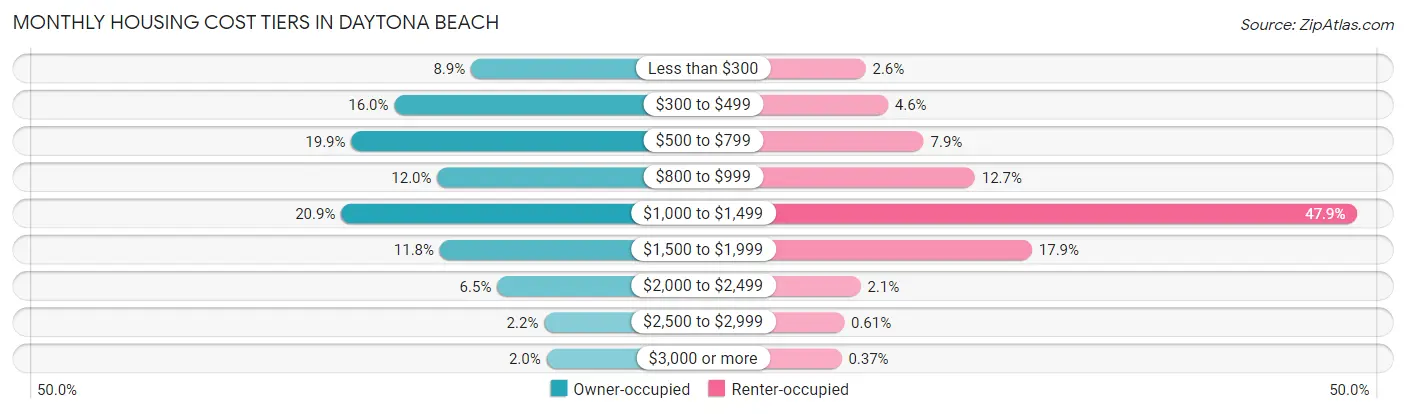
| Monthly Cost | Owner-occupied | Renter-occupied |
| Less than $300 | 1,314 (8.9%) | 451 (2.6%) |
| $300 to $499 | 2,358 (16.0%) | 809 (4.6%) |
| $500 to $799 | 2,942 (19.9%) | 1,383 (7.9%) |
| $800 to $999 | 1,773 (12.0%) | 2,207 (12.7%) |
| $1,000 to $1,499 | 3,080 (20.8%) | 8,350 (47.9%) |
| $1,500 to $1,999 | 1,738 (11.8%) | 3,123 (17.9%) |
| $2,000 to $2,499 | 958 (6.5%) | 370 (2.1%) |
| $2,500 to $2,999 | 319 (2.2%) | 106 (0.6%) |
| $3,000 or more | 288 (1.9%) | 64 (0.4%) |
| Total | 14,770 (100.0%) | 17,446 (100.0%) |
Physical Housing Characteristics in Daytona Beach
Housing Structures in Daytona Beach
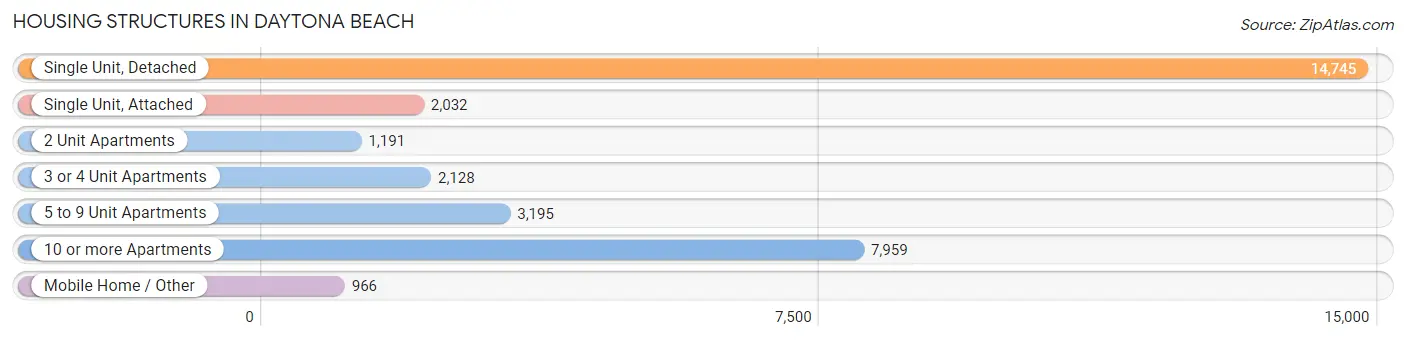
| Structure Type | # Housing Units | % Housing Units |
| Single Unit, Detached | 14,745 | 45.8% |
| Single Unit, Attached | 2,032 | 6.3% |
| 2 Unit Apartments | 1,191 | 3.7% |
| 3 or 4 Unit Apartments | 2,128 | 6.6% |
| 5 to 9 Unit Apartments | 3,195 | 9.9% |
| 10 or more Apartments | 7,959 | 24.7% |
| Mobile Home / Other | 966 | 3.0% |
| Total | 32,216 | 100.0% |
Housing Structures by Occupancy in Daytona Beach
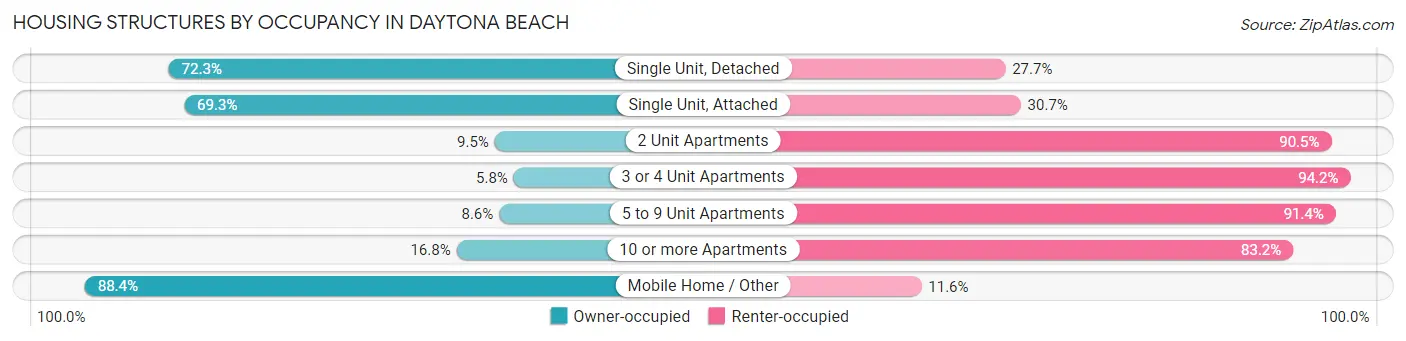
| Structure Type | Owner-occupied | Renter-occupied |
| Single Unit, Detached | 10,655 (72.3%) | 4,090 (27.7%) |
| Single Unit, Attached | 1,408 (69.3%) | 624 (30.7%) |
| 2 Unit Apartments | 113 (9.5%) | 1,078 (90.5%) |
| 3 or 4 Unit Apartments | 124 (5.8%) | 2,004 (94.2%) |
| 5 to 9 Unit Apartments | 276 (8.6%) | 2,919 (91.4%) |
| 10 or more Apartments | 1,340 (16.8%) | 6,619 (83.2%) |
| Mobile Home / Other | 854 (88.4%) | 112 (11.6%) |
| Total | 14,770 (45.9%) | 17,446 (54.1%) |
Housing Structures by Number of Rooms in Daytona Beach
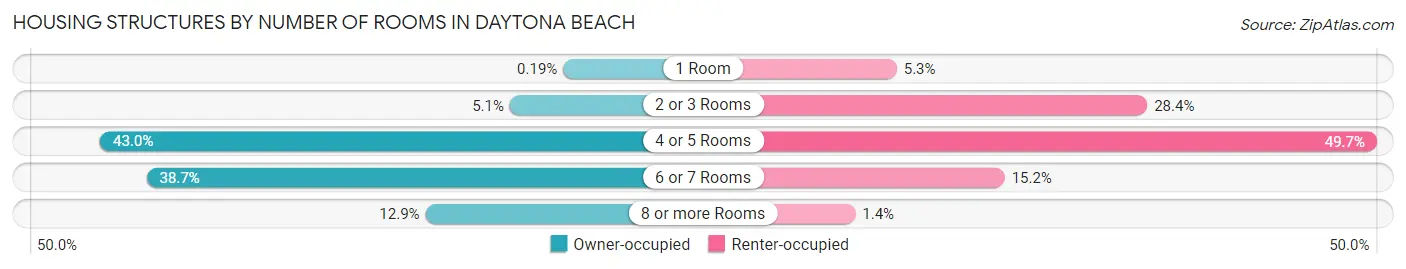
| Number of Rooms | Owner-occupied | Renter-occupied |
| 1 Room | 28 (0.2%) | 918 (5.3%) |
| 2 or 3 Rooms | 758 (5.1%) | 4,958 (28.4%) |
| 4 or 5 Rooms | 6,354 (43.0%) | 8,662 (49.6%) |
| 6 or 7 Rooms | 5,720 (38.7%) | 2,659 (15.2%) |
| 8 or more Rooms | 1,910 (12.9%) | 249 (1.4%) |
| Total | 14,770 (100.0%) | 17,446 (100.0%) |
Housing Structure by Heating Type in Daytona Beach
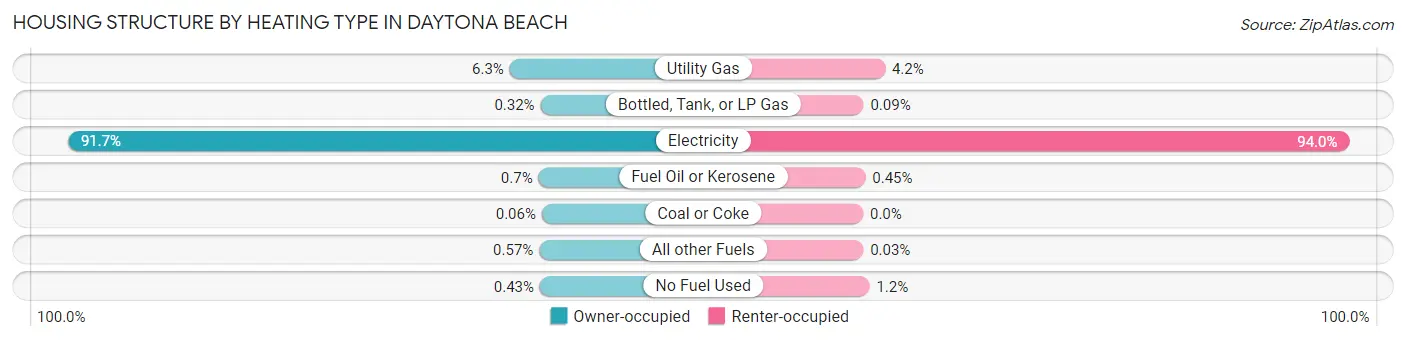
| Heating Type | Owner-occupied | Renter-occupied |
| Utility Gas | 924 (6.3%) | 739 (4.2%) |
| Bottled, Tank, or LP Gas | 47 (0.3%) | 15 (0.1%) |
| Electricity | 13,539 (91.7%) | 16,392 (94.0%) |
| Fuel Oil or Kerosene | 104 (0.7%) | 79 (0.4%) |
| Coal or Coke | 9 (0.1%) | 0 (0.0%) |
| All other Fuels | 84 (0.6%) | 5 (0.0%) |
| No Fuel Used | 63 (0.4%) | 216 (1.2%) |
| Total | 14,770 (100.0%) | 17,446 (100.0%) |
Household Vehicle Usage in Daytona Beach
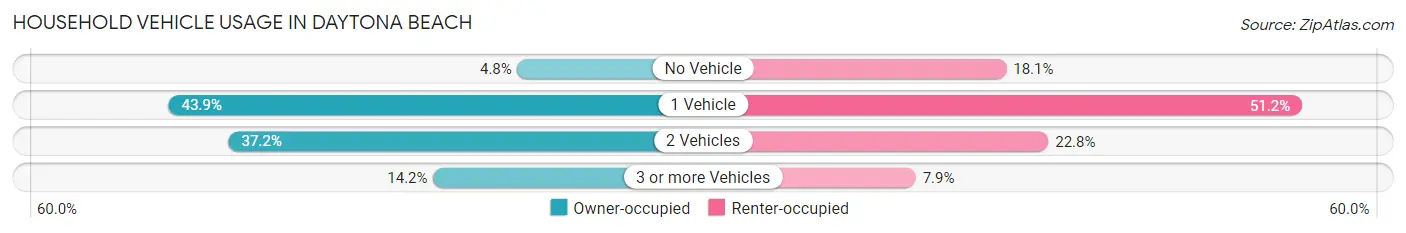
| Vehicles per Household | Owner-occupied | Renter-occupied |
| No Vehicle | 705 (4.8%) | 3,154 (18.1%) |
| 1 Vehicle | 6,479 (43.9%) | 8,933 (51.2%) |
| 2 Vehicles | 5,487 (37.1%) | 3,975 (22.8%) |
| 3 or more Vehicles | 2,099 (14.2%) | 1,384 (7.9%) |
| Total | 14,770 (100.0%) | 17,446 (100.0%) |
Real Estate & Mortgages in Daytona Beach
Real Estate and Mortgage Overview in Daytona Beach
| Characteristic | Without Mortgage | With Mortgage |
| Housing Units | 7,866 | 6,904 |
| Median Property Value | $192,400 | $236,200 |
| Median Household Income | $47,286 | $866 |
| Monthly Housing Costs | $524 | $249 |
| Real Estate Taxes | $1,463 | $203 |
Property Value by Mortgage Status in Daytona Beach
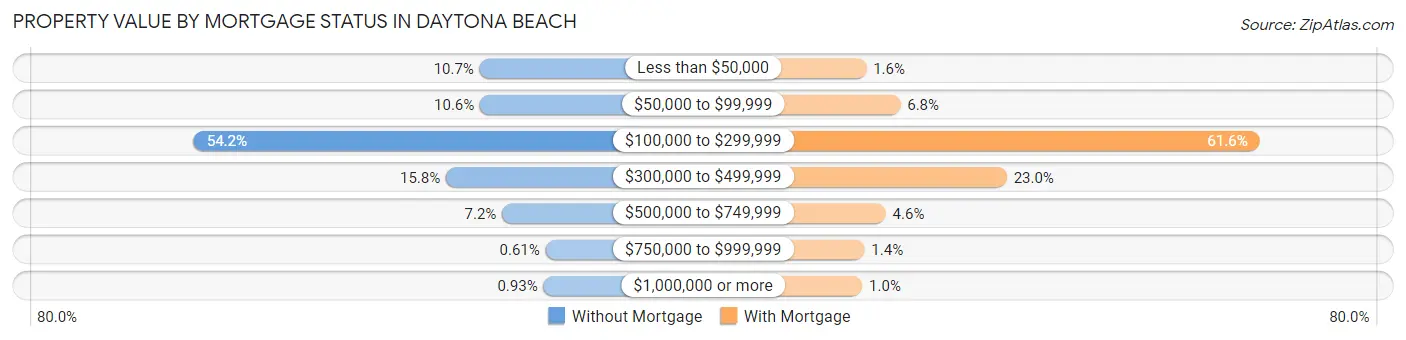
| Property Value | Without Mortgage | With Mortgage |
| Less than $50,000 | 838 (10.6%) | 112 (1.6%) |
| $50,000 to $99,999 | 833 (10.6%) | 471 (6.8%) |
| $100,000 to $299,999 | 4,264 (54.2%) | 4,251 (61.6%) |
| $300,000 to $499,999 | 1,241 (15.8%) | 1,590 (23.0%) |
| $500,000 to $749,999 | 569 (7.2%) | 317 (4.6%) |
| $750,000 to $999,999 | 48 (0.6%) | 93 (1.3%) |
| $1,000,000 or more | 73 (0.9%) | 70 (1.0%) |
| Total | 7,866 (100.0%) | 6,904 (100.0%) |
Household Income by Mortgage Status in Daytona Beach
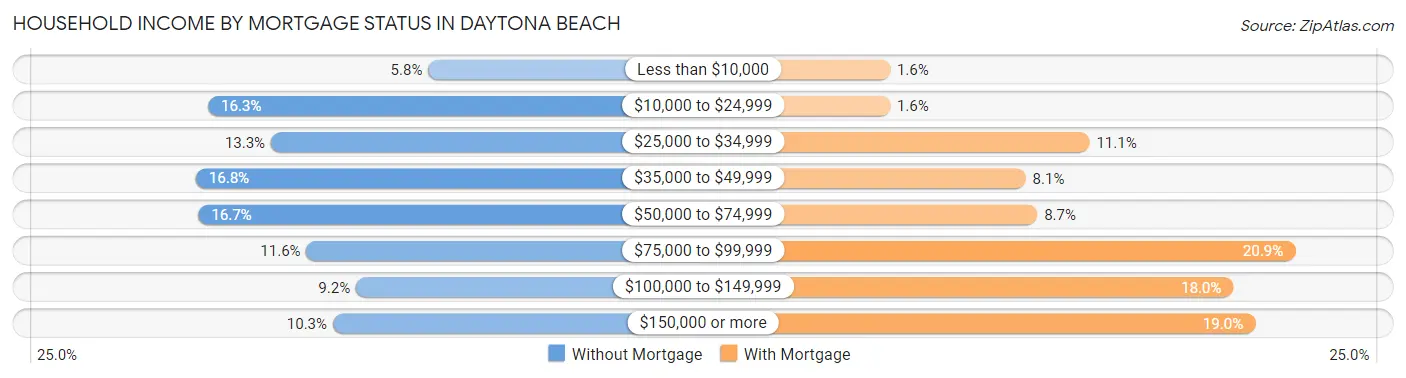
| Household Income | Without Mortgage | With Mortgage |
| Less than $10,000 | 455 (5.8%) | 113 (1.6%) |
| $10,000 to $24,999 | 1,279 (16.3%) | 113 (1.6%) |
| $25,000 to $34,999 | 1,044 (13.3%) | 769 (11.1%) |
| $35,000 to $49,999 | 1,325 (16.8%) | 559 (8.1%) |
| $50,000 to $74,999 | 1,315 (16.7%) | 597 (8.6%) |
| $75,000 to $99,999 | 911 (11.6%) | 1,445 (20.9%) |
| $100,000 to $149,999 | 725 (9.2%) | 1,242 (18.0%) |
| $150,000 or more | 812 (10.3%) | 1,313 (19.0%) |
| Total | 7,866 (100.0%) | 6,904 (100.0%) |
Property Value to Household Income Ratio in Daytona Beach
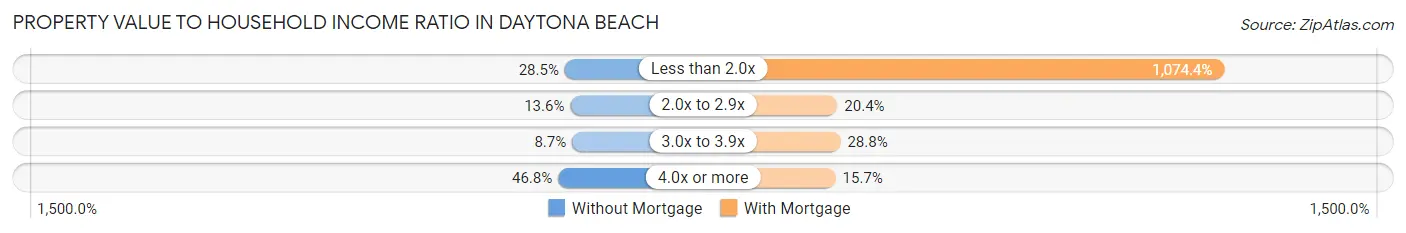
| Value-to-Income Ratio | Without Mortgage | With Mortgage |
| Less than 2.0x | 2,243 (28.5%) | 74,176 (1,074.4%) |
| 2.0x to 2.9x | 1,073 (13.6%) | 1,409 (20.4%) |
| 3.0x to 3.9x | 683 (8.7%) | 1,987 (28.8%) |
| 4.0x or more | 3,683 (46.8%) | 1,081 (15.7%) |
| Total | 7,866 (100.0%) | 6,904 (100.0%) |
Real Estate Taxes by Mortgage Status in Daytona Beach
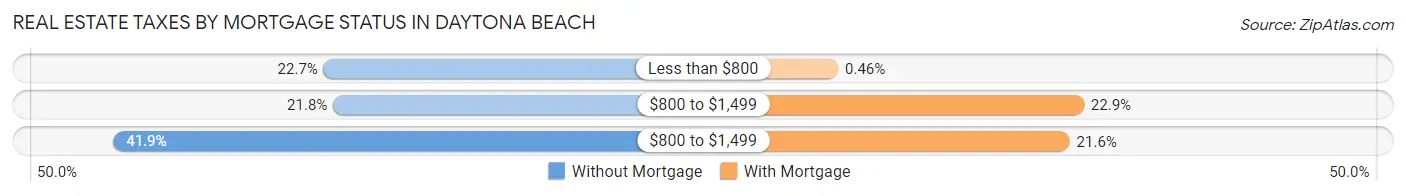
| Property Taxes | Without Mortgage | With Mortgage |
| Less than $800 | 1,785 (22.7%) | 32 (0.5%) |
| $800 to $1,499 | 1,716 (21.8%) | 1,582 (22.9%) |
| $800 to $1,499 | 3,296 (41.9%) | 1,492 (21.6%) |
| Total | 7,866 (100.0%) | 6,904 (100.0%) |
Health & Disability in Daytona Beach
Health Insurance Coverage by Age in Daytona Beach
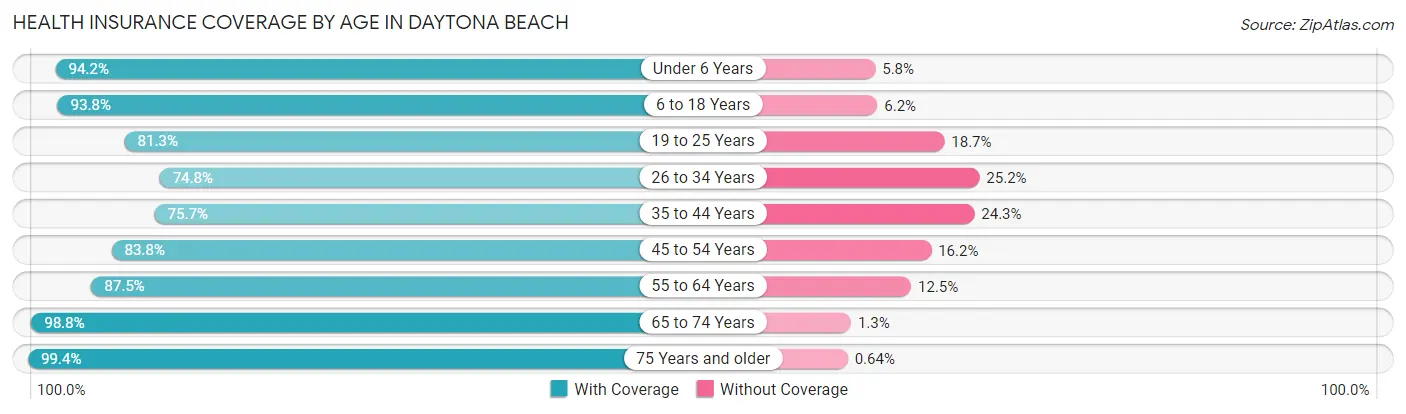
| Age Bracket | With Coverage | Without Coverage |
| Under 6 Years | 3,292 (94.2%) | 202 (5.8%) |
| 6 to 18 Years | 8,327 (93.8%) | 547 (6.2%) |
| 19 to 25 Years | 8,463 (81.3%) | 1,942 (18.7%) |
| 26 to 34 Years | 7,073 (74.8%) | 2,383 (25.2%) |
| 35 to 44 Years | 5,773 (75.7%) | 1,849 (24.3%) |
| 45 to 54 Years | 6,150 (83.8%) | 1,190 (16.2%) |
| 55 to 64 Years | 8,742 (87.5%) | 1,244 (12.5%) |
| 65 to 74 Years | 8,630 (98.8%) | 109 (1.3%) |
| 75 Years and older | 5,738 (99.4%) | 37 (0.6%) |
| Total | 62,188 (86.7%) | 9,503 (13.3%) |
Health Insurance Coverage by Citizenship Status in Daytona Beach
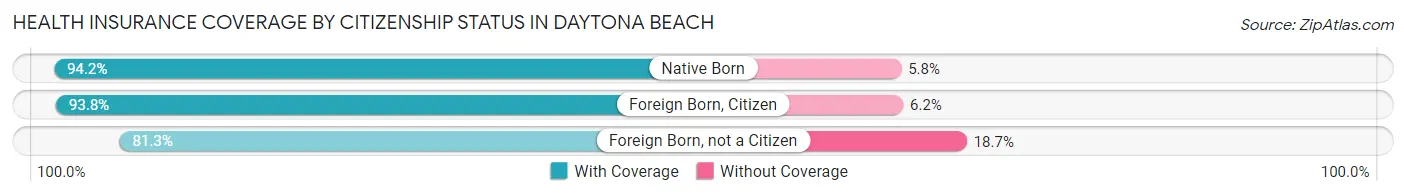
| Citizenship Status | With Coverage | Without Coverage |
| Native Born | 3,292 (94.2%) | 202 (5.8%) |
| Foreign Born, Citizen | 8,327 (93.8%) | 547 (6.2%) |
| Foreign Born, not a Citizen | 8,463 (81.3%) | 1,942 (18.7%) |
Health Insurance Coverage by Household Income in Daytona Beach
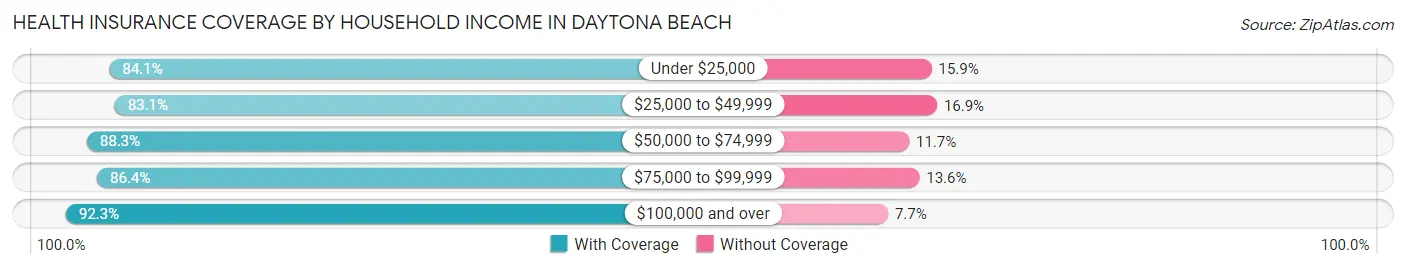
| Household Income | With Coverage | Without Coverage |
| Under $25,000 | 11,535 (84.1%) | 2,177 (15.9%) |
| $25,000 to $49,999 | 13,436 (83.1%) | 2,730 (16.9%) |
| $50,000 to $74,999 | 12,876 (88.3%) | 1,701 (11.7%) |
| $75,000 to $99,999 | 8,560 (86.4%) | 1,346 (13.6%) |
| $100,000 and over | 12,375 (92.3%) | 1,035 (7.7%) |
Public vs Private Health Insurance Coverage by Age in Daytona Beach
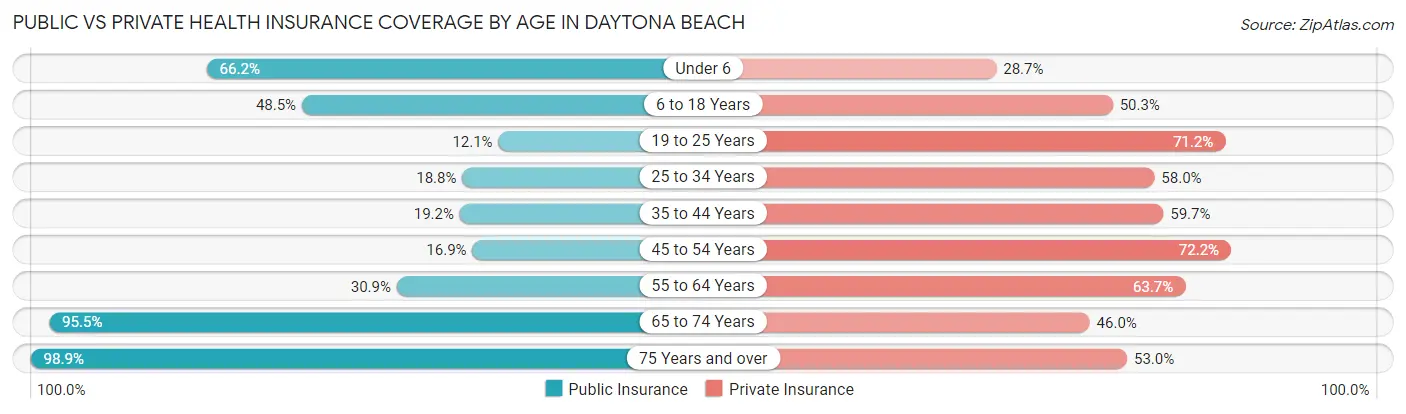
| Age Bracket | Public Insurance | Private Insurance |
| Under 6 | 2,313 (66.2%) | 1,002 (28.7%) |
| 6 to 18 Years | 4,306 (48.5%) | 4,462 (50.3%) |
| 19 to 25 Years | 1,254 (12.0%) | 7,404 (71.2%) |
| 25 to 34 Years | 1,774 (18.8%) | 5,487 (58.0%) |
| 35 to 44 Years | 1,465 (19.2%) | 4,549 (59.7%) |
| 45 to 54 Years | 1,239 (16.9%) | 5,301 (72.2%) |
| 55 to 64 Years | 3,088 (30.9%) | 6,363 (63.7%) |
| 65 to 74 Years | 8,342 (95.5%) | 4,021 (46.0%) |
| 75 Years and over | 5,710 (98.9%) | 3,058 (52.9%) |
| Total | 29,491 (41.1%) | 41,647 (58.1%) |
Disability Status by Sex by Age in Daytona Beach
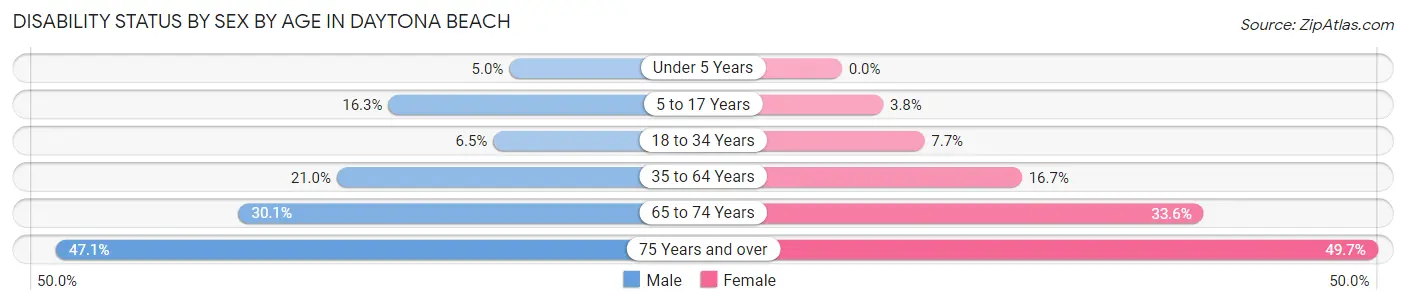
| Age Bracket | Male | Female |
| Under 5 Years | 79 (5.0%) | 0 (0.0%) |
| 5 to 17 Years | 565 (16.3%) | 153 (3.8%) |
| 18 to 34 Years | 752 (6.5%) | 779 (7.7%) |
| 35 to 64 Years | 2,588 (21.0%) | 2,112 (16.7%) |
| 65 to 74 Years | 1,349 (30.1%) | 1,431 (33.6%) |
| 75 Years and over | 1,114 (47.1%) | 1,695 (49.7%) |
Disability Class by Sex by Age in Daytona Beach
Disability Class: Hearing Difficulty
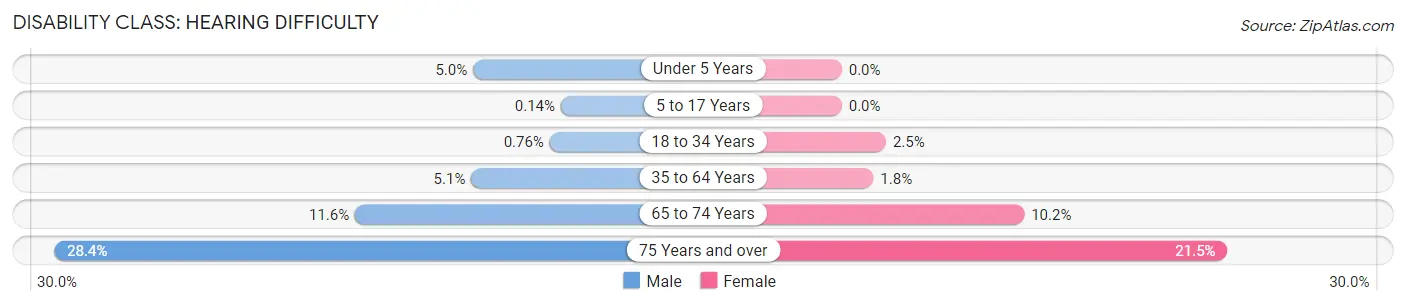
| Age Bracket | Male | Female |
| Under 5 Years | 79 (5.0%) | 0 (0.0%) |
| 5 to 17 Years | 5 (0.1%) | 0 (0.0%) |
| 18 to 34 Years | 88 (0.8%) | 250 (2.5%) |
| 35 to 64 Years | 631 (5.1%) | 223 (1.8%) |
| 65 to 74 Years | 519 (11.6%) | 433 (10.2%) |
| 75 Years and over | 671 (28.4%) | 732 (21.5%) |
Disability Class: Vision Difficulty
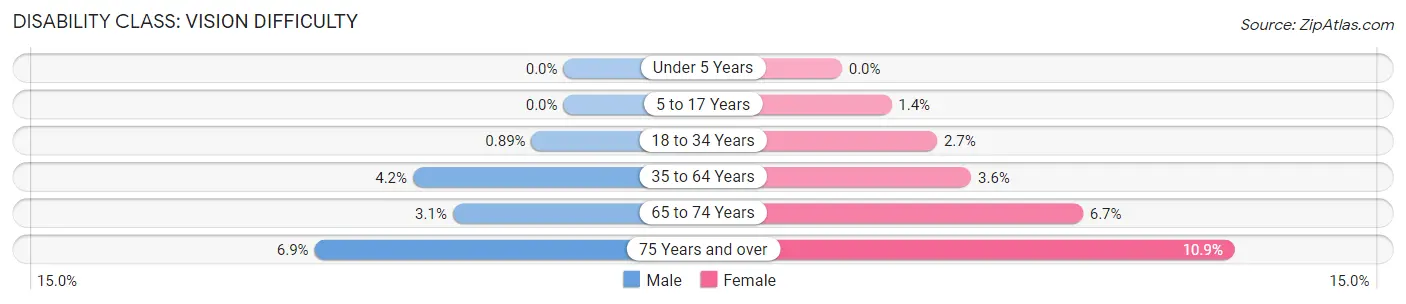
| Age Bracket | Male | Female |
| Under 5 Years | 0 (0.0%) | 0 (0.0%) |
| 5 to 17 Years | 0 (0.0%) | 55 (1.4%) |
| 18 to 34 Years | 103 (0.9%) | 270 (2.6%) |
| 35 to 64 Years | 516 (4.2%) | 455 (3.6%) |
| 65 to 74 Years | 138 (3.1%) | 286 (6.7%) |
| 75 Years and over | 164 (6.9%) | 373 (10.9%) |
Disability Class: Cognitive Difficulty
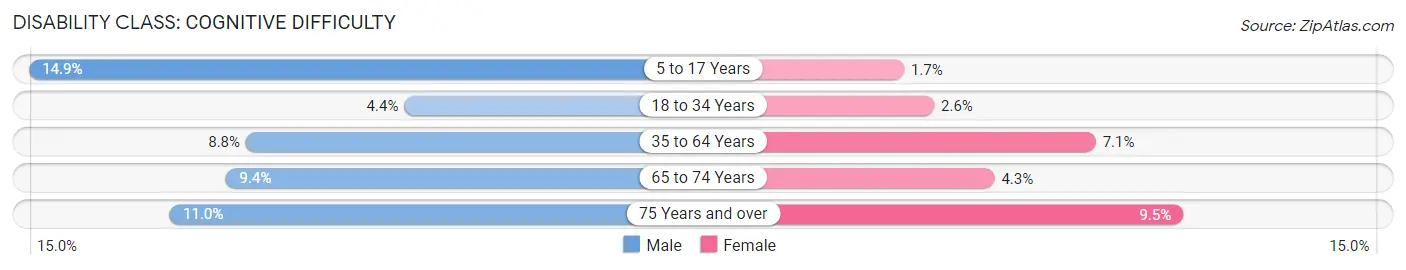
| Age Bracket | Male | Female |
| 5 to 17 Years | 517 (14.9%) | 69 (1.7%) |
| 18 to 34 Years | 511 (4.4%) | 261 (2.6%) |
| 35 to 64 Years | 1,088 (8.8%) | 894 (7.1%) |
| 65 to 74 Years | 420 (9.4%) | 181 (4.3%) |
| 75 Years and over | 259 (11.0%) | 324 (9.5%) |
Disability Class: Ambulatory Difficulty
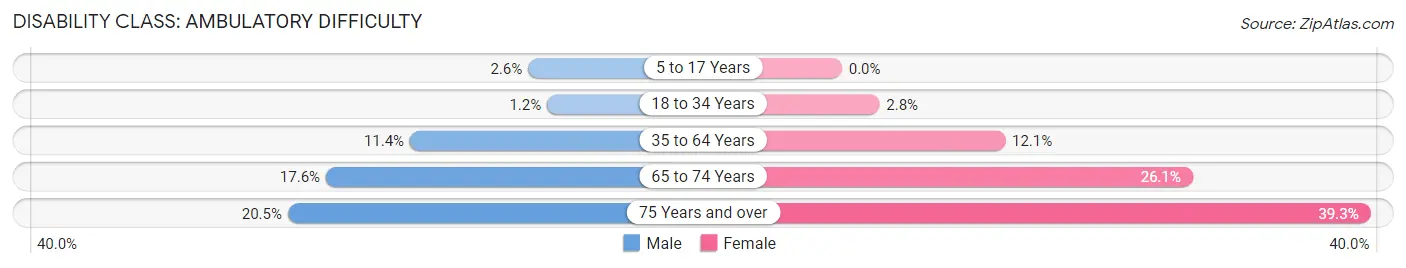
| Age Bracket | Male | Female |
| 5 to 17 Years | 91 (2.6%) | 0 (0.0%) |
| 18 to 34 Years | 140 (1.2%) | 284 (2.8%) |
| 35 to 64 Years | 1,402 (11.4%) | 1,533 (12.1%) |
| 65 to 74 Years | 789 (17.6%) | 1,111 (26.1%) |
| 75 Years and over | 484 (20.5%) | 1,338 (39.3%) |
Disability Class: Self-Care Difficulty
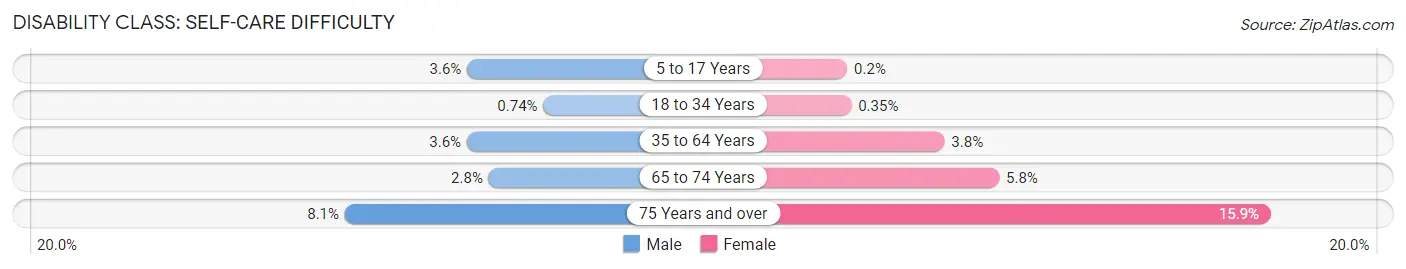
| Age Bracket | Male | Female |
| 5 to 17 Years | 124 (3.6%) | 8 (0.2%) |
| 18 to 34 Years | 85 (0.7%) | 36 (0.4%) |
| 35 to 64 Years | 441 (3.6%) | 482 (3.8%) |
| 65 to 74 Years | 124 (2.8%) | 249 (5.8%) |
| 75 Years and over | 192 (8.1%) | 543 (15.9%) |
Technology Access in Daytona Beach
Computing Device Access in Daytona Beach
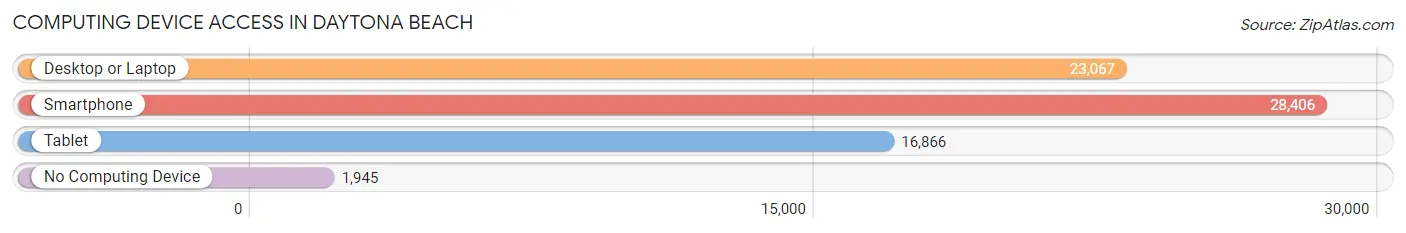
| Device Type | # Households | % Households |
| Desktop or Laptop | 23,067 | 71.6% |
| Smartphone | 28,406 | 88.2% |
| Tablet | 16,866 | 52.3% |
| No Computing Device | 1,945 | 6.0% |
| Total | 32,216 | 100.0% |
Internet Access in Daytona Beach
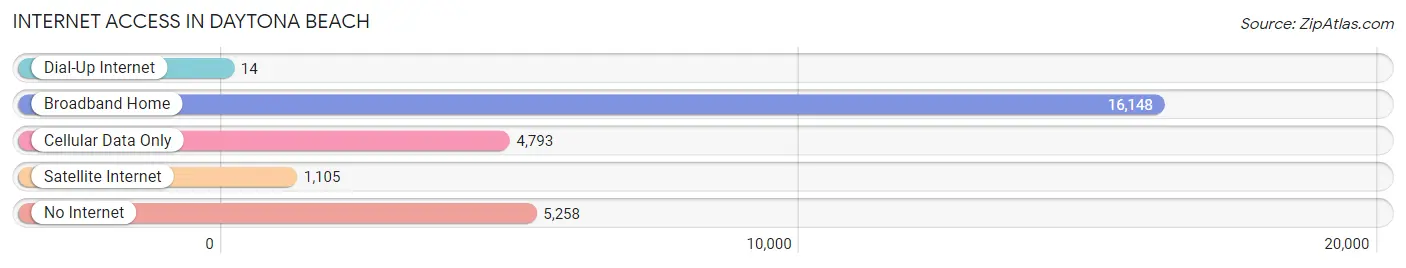
| Internet Type | # Households | % Households |
| Dial-Up Internet | 14 | 0.0% |
| Broadband Home | 16,148 | 50.1% |
| Cellular Data Only | 4,793 | 14.9% |
| Satellite Internet | 1,105 | 3.4% |
| No Internet | 5,258 | 16.3% |
| Total | 32,216 | 100.0% |
Daytona Beach Summary
Daytona Beach is a city located in Volusia County, Florida, United States. It is the county seat of Volusia County and is located on the Atlantic Ocean coast of central Florida. The city is known for its beaches, motorsports, and cultural attractions. Daytona Beach is also home to the Daytona International Speedway, the world's most famous motorsports venue.
Geography
Daytona Beach is located on the east coast of Florida, approximately halfway between Jacksonville and Miami. It is situated on the Halifax River, which is part of the Intracoastal Waterway. The city is bordered by the Atlantic Ocean to the east, the Halifax River to the west, and the Tomoka River to the north. The city covers an area of approximately 58 square miles and has a population of 64,000.
Climate
Daytona Beach has a humid subtropical climate, with hot, humid summers and mild, dry winters. The average temperature in the summer is around 90°F, while in the winter it is around 60°F. The city receives an average of 54 inches of rain per year, with most of it falling in the summer months.
Demographics
As of the 2010 census, the population of Daytona Beach was 64,112. The racial makeup of the city was 57.2% White, 28.3% African American, 0.4% Native American, 2.2% Asian, 0.1% Pacific Islander, 8.2% from other races, and 3.7% from two or more races. Hispanic or Latino of any race were 16.2% of the population.
Economy
Daytona Beach is a major tourist destination, with millions of visitors each year. The city is home to the Daytona International Speedway, which hosts the Daytona 500, the most prestigious race in NASCAR. The city is also home to the Daytona Beach Boardwalk, a popular tourist attraction. Other major industries in the city include manufacturing, healthcare, and education.
History
Daytona Beach was first settled in the late 1800s by settlers from the British Isles. The city was incorporated in 1876 and was named after its founder, Mathias Day. The city quickly became a popular tourist destination, with visitors coming to enjoy the beaches and the nearby Daytona International Speedway. In the early 1900s, the city was known as the "birthplace of speed," as it was the site of the first land speed record set by Henry Ford in 1904.
In the 1950s, Daytona Beach became a popular destination for college students on spring break. The city was also the site of the first NASCAR race in 1959. In the 1970s, the city began to focus on developing its tourism industry, and today it is one of the most popular tourist destinations in Florida.
Common Questions
What is Per Capita Income in Daytona Beach?
Per Capita income in Daytona Beach is $29,368.
What is the Median Family Income in Daytona Beach?
Median Family Income in Daytona Beach is $59,266.
What is the Median Household income in Daytona Beach?
Median Household Income in Daytona Beach is $47,608.
What is Income or Wage Gap in Daytona Beach?
Income or Wage Gap in Daytona Beach is 5.0%.
Women in Daytona Beach earn 95.0 cents for every dollar earned by a man.
What is Family Income Deficit in Daytona Beach?
Family Income Deficit in Daytona Beach is $11,747.
Families that are below poverty line in Daytona Beach earn $11,747 less on average than the poverty threshold level.
What is Inequality or Gini Index in Daytona Beach?
Inequality or Gini Index in Daytona Beach is 0.47.
What is the Total Population of Daytona Beach?
Total Population of Daytona Beach is 73,329.
What is the Total Male Population of Daytona Beach?
Total Male Population of Daytona Beach is 36,619.
What is the Total Female Population of Daytona Beach?
Total Female Population of Daytona Beach is 36,710.
What is the Ratio of Males per 100 Females in Daytona Beach?
There are 99.75 Males per 100 Females in Daytona Beach.
What is the Ratio of Females per 100 Males in Daytona Beach?
There are 100.25 Females per 100 Males in Daytona Beach.
What is the Median Population Age in Daytona Beach?
Median Population Age in Daytona Beach is 40.2 Years.
What is the Average Family Size in Daytona Beach
Average Family Size in Daytona Beach is 2.8 People.
What is the Average Household Size in Daytona Beach
Average Household Size in Daytona Beach is 2.1 People.
How Large is the Labor Force in Daytona Beach?
There are 33,546 People in the Labor Forcein in Daytona Beach.
What is the Percentage of People in the Labor Force in Daytona Beach?
52.7% of People are in the Labor Force in Daytona Beach.
What is the Unemployment Rate in Daytona Beach?
Unemployment Rate in Daytona Beach is 5.0%.