Bonita Springs, FL Map & Demographics
Bonita Springs Map
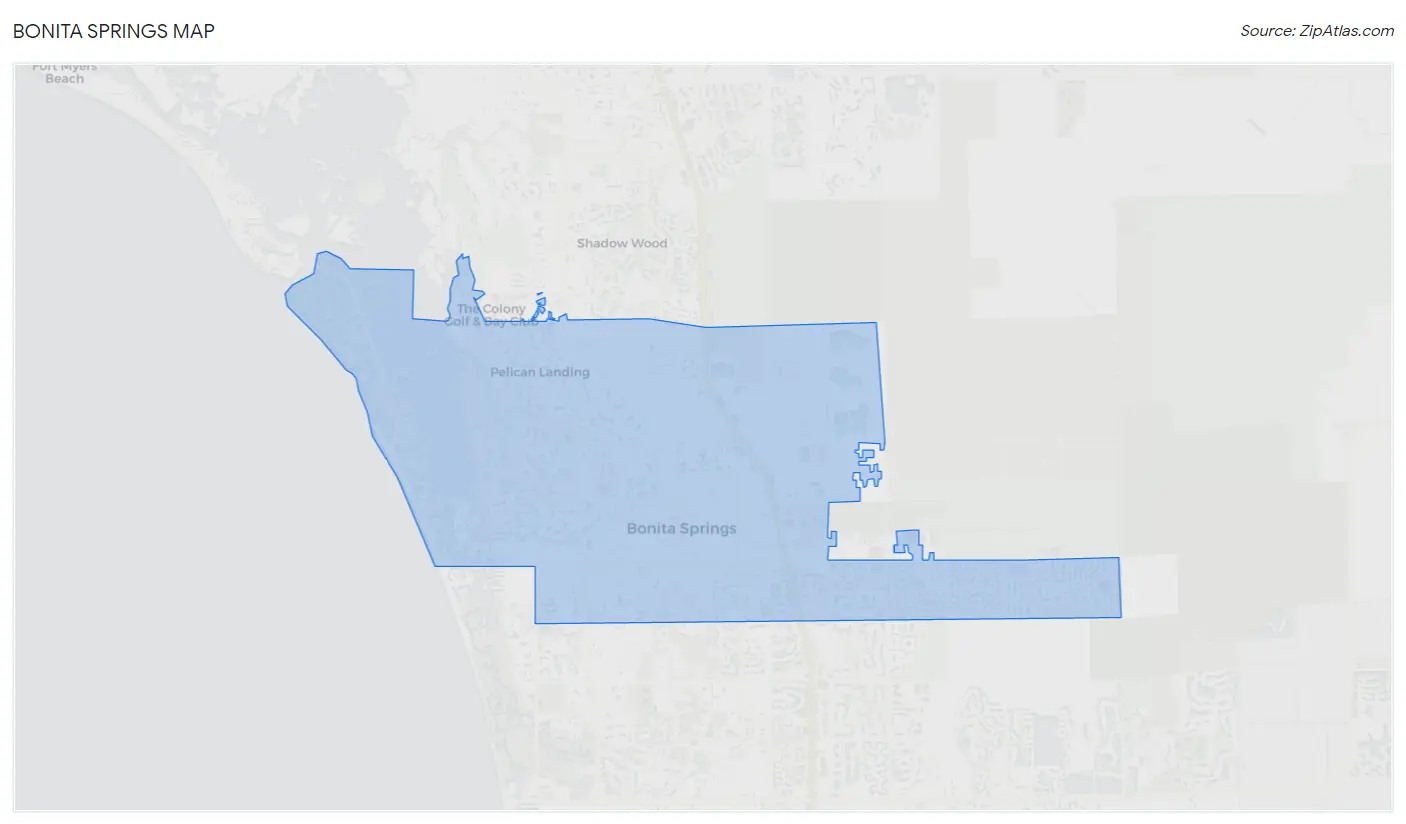
Bonita Springs Overview
$59,284
PER CAPITA INCOME
$104,480
AVG FAMILY INCOME
$84,668
AVG HOUSEHOLD INCOME
18.4%
WAGE / INCOME GAP [ % ]
81.6¢/ $1
WAGE / INCOME GAP [ $ ]
$9,896
FAMILY INCOME DEFICIT
0.51
INEQUALITY / GINI INDEX
53,945
TOTAL POPULATION
27,007
MALE POPULATION
26,938
FEMALE POPULATION
100.26
MALES / 100 FEMALES
99.74
FEMALES / 100 MALES
60.2
MEDIAN AGE
2.7
AVG FAMILY SIZE
2.2
AVG HOUSEHOLD SIZE
21,529
LABOR FORCE [ PEOPLE ]
44.8%
PERCENT IN LABOR FORCE
3.6%
UNEMPLOYMENT RATE
Bonita Springs Area Codes
Income in Bonita Springs
Income Overview in Bonita Springs
Per Capita Income in Bonita Springs is $59,284, while median incomes of families and households are $104,480 and $84,668 respectively.
| Characteristic | Number | Measure |
| Per Capita Income | 53,945 | $59,284 |
| Median Family Income | 16,101 | $104,480 |
| Mean Family Income | 16,101 | $150,106 |
| Median Household Income | 23,979 | $84,668 |
| Mean Household Income | 23,979 | $128,892 |
| Income Deficit | 16,101 | $9,896 |
| Wage / Income Gap (%) | 53,945 | 18.38% |
| Wage / Income Gap ($) | 53,945 | 81.62¢ per $1 |
| Gini / Inequality Index | 53,945 | 0.51 |
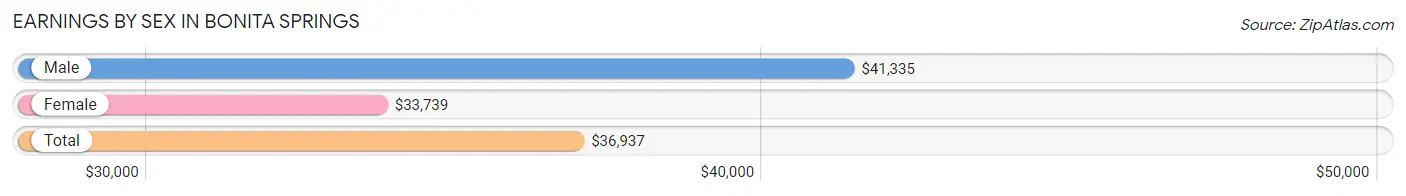
Earnings by Sex in Bonita Springs
Average Earnings in Bonita Springs are $36,937, $41,335 for men and $33,739 for women, a difference of 18.4%.
| Sex | Number | Average Earnings |
| Male | 13,030 (56.6%) | $41,335 |
| Female | 9,988 (43.4%) | $33,739 |
| Total | 23,018 (100.0%) | $36,937 |
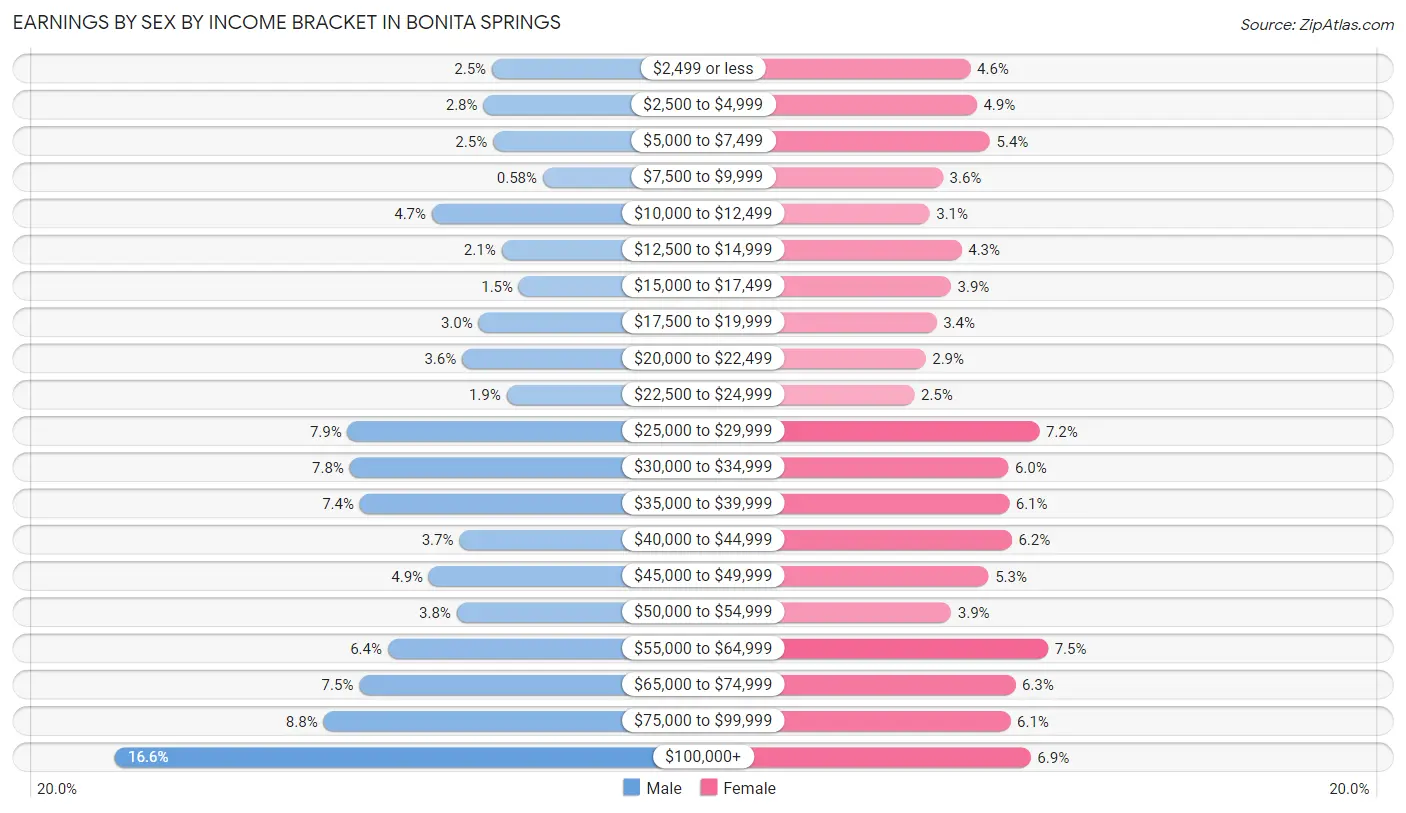
Earnings by Sex by Income Bracket in Bonita Springs
The most common earnings brackets in Bonita Springs are $100,000+ for men (2,164 | 16.6%) and $55,000 to $64,999 for women (752 | 7.5%).
| Income | Male | Female |
| $2,499 or less | 324 (2.5%) | 461 (4.6%) |
| $2,500 to $4,999 | 366 (2.8%) | 485 (4.9%) |
| $5,000 to $7,499 | 319 (2.5%) | 534 (5.3%) |
| $7,500 to $9,999 | 75 (0.6%) | 359 (3.6%) |
| $10,000 to $12,499 | 617 (4.7%) | 309 (3.1%) |
| $12,500 to $14,999 | 278 (2.1%) | 428 (4.3%) |
| $15,000 to $17,499 | 193 (1.5%) | 389 (3.9%) |
| $17,500 to $19,999 | 390 (3.0%) | 335 (3.4%) |
| $20,000 to $22,499 | 470 (3.6%) | 294 (2.9%) |
| $22,500 to $24,999 | 253 (1.9%) | 252 (2.5%) |
| $25,000 to $29,999 | 1,029 (7.9%) | 719 (7.2%) |
| $30,000 to $34,999 | 1,019 (7.8%) | 603 (6.0%) |
| $35,000 to $39,999 | 969 (7.4%) | 606 (6.1%) |
| $40,000 to $44,999 | 484 (3.7%) | 616 (6.2%) |
| $45,000 to $49,999 | 632 (4.9%) | 529 (5.3%) |
| $50,000 to $54,999 | 497 (3.8%) | 390 (3.9%) |
| $55,000 to $64,999 | 833 (6.4%) | 752 (7.5%) |
| $65,000 to $74,999 | 972 (7.5%) | 629 (6.3%) |
| $75,000 to $99,999 | 1,146 (8.8%) | 611 (6.1%) |
| $100,000+ | 2,164 (16.6%) | 687 (6.9%) |
| Total | 13,030 (100.0%) | 9,988 (100.0%) |
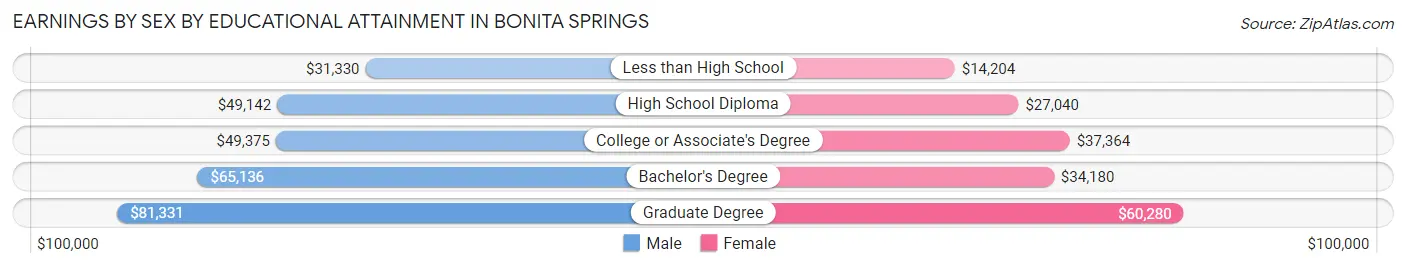
Earnings by Sex by Educational Attainment in Bonita Springs
Average earnings in Bonita Springs are $46,162 for men and $35,661 for women, a difference of 22.8%. Men with an educational attainment of graduate degree enjoy the highest average annual earnings of $81,331, while those with less than high school education earn the least with $31,330. Women with an educational attainment of graduate degree earn the most with the average annual earnings of $60,280, while those with less than high school education have the smallest earnings of $14,204.
| Educational Attainment | Male Income | Female Income |
| Less than High School | $31,330 | $14,204 |
| High School Diploma | $49,142 | $27,040 |
| College or Associate's Degree | $49,375 | $37,364 |
| Bachelor's Degree | $65,136 | $34,180 |
| Graduate Degree | $81,331 | $60,280 |
| Total | $46,162 | $35,661 |
Family Income in Bonita Springs
Family Income Brackets in Bonita Springs
According to the Bonita Springs family income data, there are 3,655 families falling into the $100,000 to $149,999 income range, which is the most common income bracket and makes up 22.7% of all families. Conversely, the $10,000 to $14,999 income bracket is the least frequent group with only 129 families (0.8%) belonging to this category.
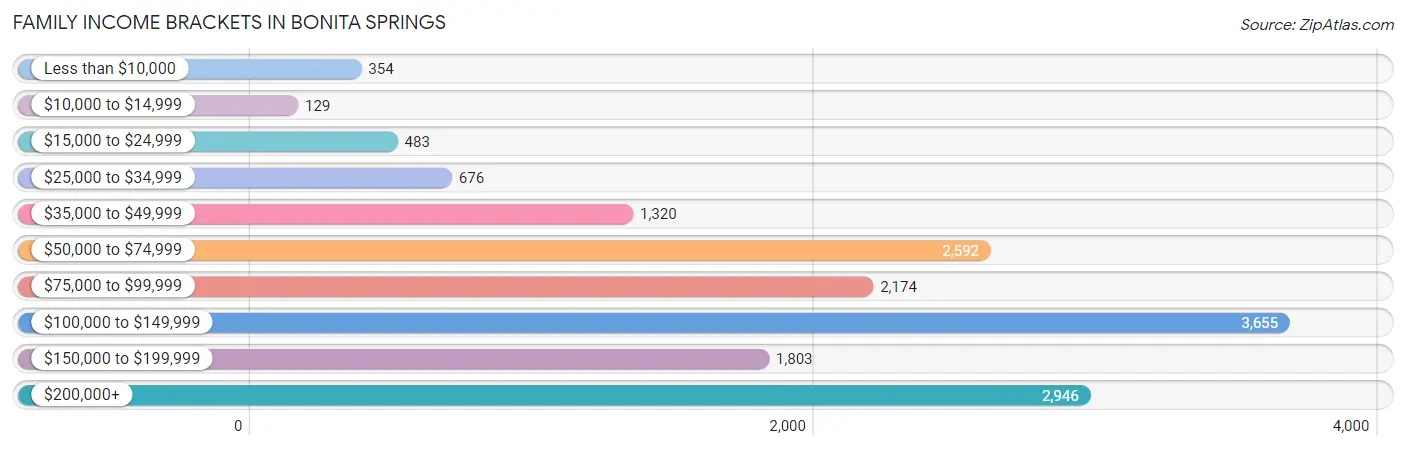
| Income Bracket | # Families | % Families |
| Less than $10,000 | 354 | 2.2% |
| $10,000 to $14,999 | 129 | 0.8% |
| $15,000 to $24,999 | 483 | 3.0% |
| $25,000 to $34,999 | 676 | 4.2% |
| $35,000 to $49,999 | 1,320 | 8.2% |
| $50,000 to $74,999 | 2,592 | 16.1% |
| $75,000 to $99,999 | 2,174 | 13.5% |
| $100,000 to $149,999 | 3,655 | 22.7% |
| $150,000 to $199,999 | 1,803 | 11.2% |
| $200,000+ | 2,946 | 18.3% |
Family Income by Famaliy Size in Bonita Springs
2-person families (11,830 | 73.5%) account for the highest median family income in Bonita Springs with $113,686 per family, while 2-person families (11,830 | 73.5%) have the highest median income of $56,843 per family member.
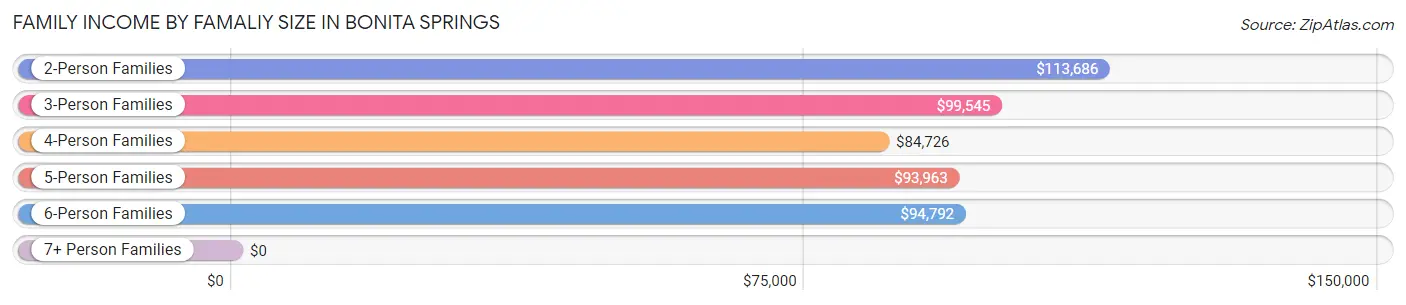
| Income Bracket | # Families | Median Income |
| 2-Person Families | 11,830 (73.5%) | $113,686 |
| 3-Person Families | 1,824 (11.3%) | $99,545 |
| 4-Person Families | 1,627 (10.1%) | $84,726 |
| 5-Person Families | 578 (3.6%) | $93,963 |
| 6-Person Families | 209 (1.3%) | $94,792 |
| 7+ Person Families | 33 (0.2%) | $0 |
| Total | 16,101 (100.0%) | $104,480 |
Family Income by Number of Earners in Bonita Springs
The median family income in Bonita Springs is $104,480, with families comprising 3+ earners (570) having the highest median family income of $138,333, while families with 1 earner (3,981) have the lowest median family income of $79,562, accounting for 3.5% and 24.7% of families, respectively.
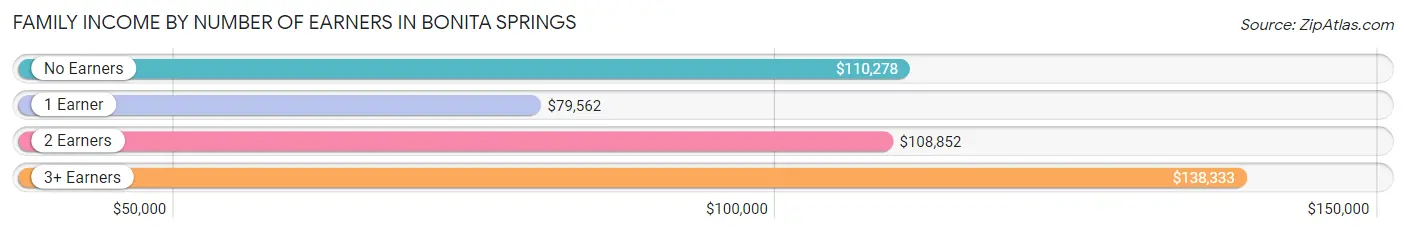
| Number of Earners | # Families | Median Income |
| No Earners | 6,780 (42.1%) | $110,278 |
| 1 Earner | 3,981 (24.7%) | $79,562 |
| 2 Earners | 4,770 (29.6%) | $108,852 |
| 3+ Earners | 570 (3.5%) | $138,333 |
| Total | 16,101 (100.0%) | $104,480 |
Household Income in Bonita Springs
Household Income Brackets in Bonita Springs
With 4,436 households falling in the category, the $100,000 to $149,999 income range is the most frequent in Bonita Springs, accounting for 18.5% of all households. In contrast, only 384 households (1.6%) fall into the $10,000 to $14,999 income bracket, making it the least populous group.
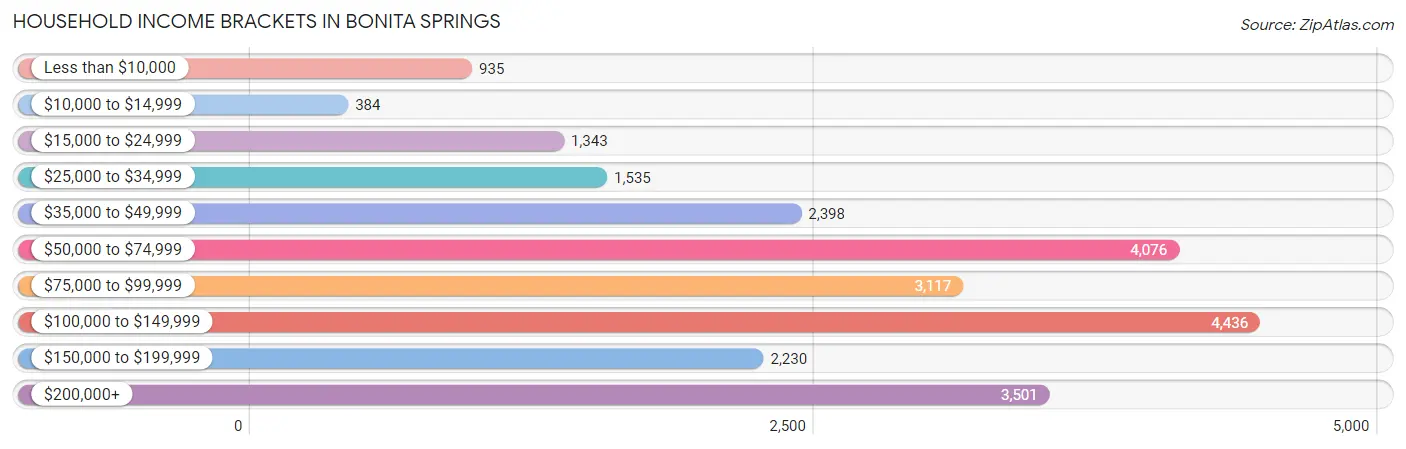
| Income Bracket | # Households | % Households |
| Less than $10,000 | 935 | 3.9% |
| $10,000 to $14,999 | 384 | 1.6% |
| $15,000 to $24,999 | 1,343 | 5.6% |
| $25,000 to $34,999 | 1,535 | 6.4% |
| $35,000 to $49,999 | 2,398 | 10.0% |
| $50,000 to $74,999 | 4,076 | 17.0% |
| $75,000 to $99,999 | 3,117 | 13.0% |
| $100,000 to $149,999 | 4,436 | 18.5% |
| $150,000 to $199,999 | 2,230 | 9.3% |
| $200,000+ | 3,501 | 14.6% |
Household Income by Householder Age in Bonita Springs
The median household income in Bonita Springs is $84,668, with the highest median household income of $95,076 found in the 45 to 64 years age bracket for the primary householder. A total of 6,164 households (25.7%) fall into this category. Meanwhile, the 15 to 24 years age bracket for the primary householder has the lowest median household income of $54,063, with 257 households (1.1%) in this group.
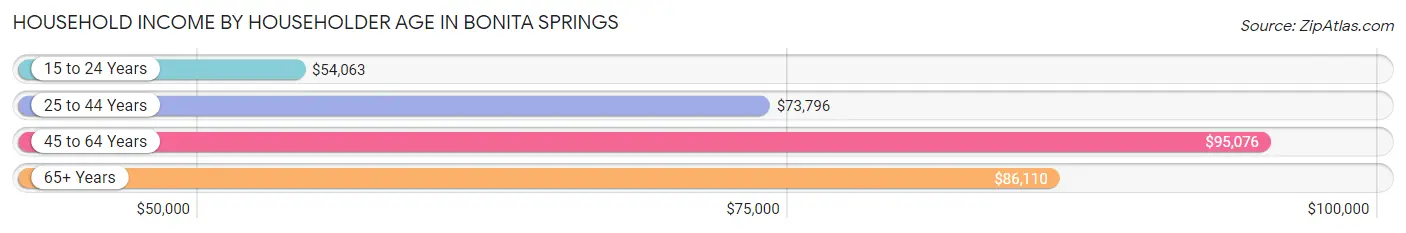
| Income Bracket | # Households | Median Income |
| 15 to 24 Years | 257 (1.1%) | $54,063 |
| 25 to 44 Years | 4,336 (18.1%) | $73,796 |
| 45 to 64 Years | 6,164 (25.7%) | $95,076 |
| 65+ Years | 13,222 (55.1%) | $86,110 |
| Total | 23,979 (100.0%) | $84,668 |
Poverty in Bonita Springs
Income Below Poverty by Sex and Age in Bonita Springs
With 8.1% poverty level for males and 7.8% for females among the residents of Bonita Springs, 16 and 17 year old males and 16 and 17 year old females are the most vulnerable to poverty, with 182 males (41.9%) and 36 females (15.5%) in their respective age groups living below the poverty level.
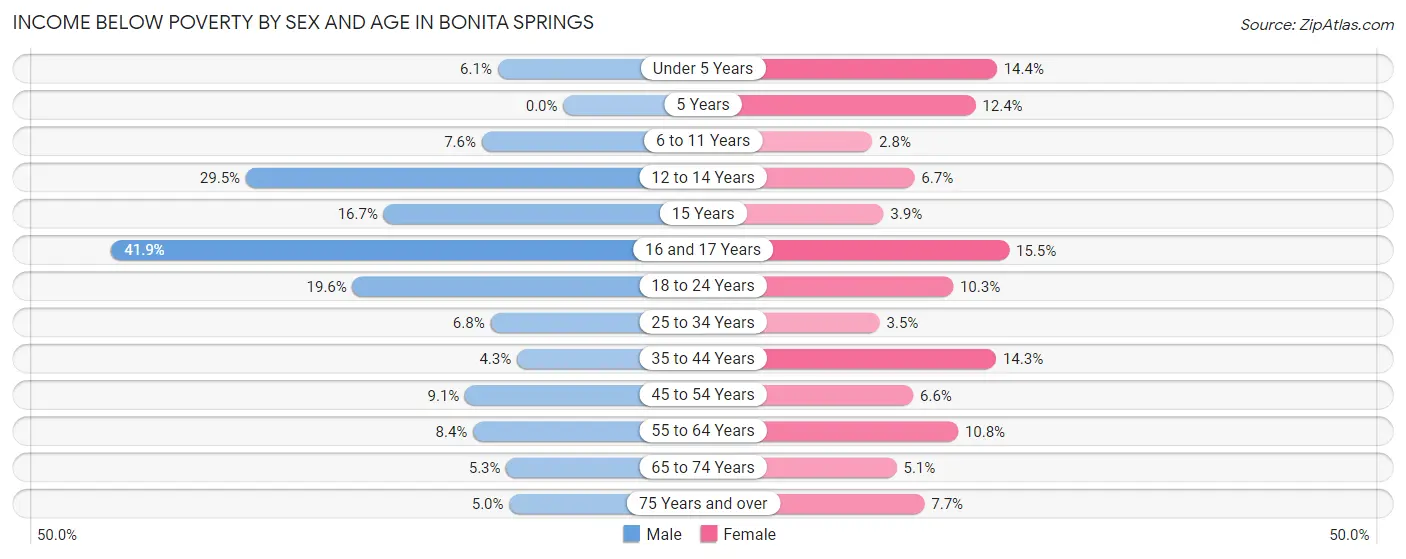
| Age Bracket | Male | Female |
| Under 5 Years | 60 (6.1%) | 83 (14.4%) |
| 5 Years | 0 (0.0%) | 30 (12.4%) |
| 6 to 11 Years | 71 (7.6%) | 42 (2.8%) |
| 12 to 14 Years | 147 (29.5%) | 37 (6.7%) |
| 15 Years | 33 (16.7%) | 11 (3.9%) |
| 16 and 17 Years | 182 (41.9%) | 36 (15.5%) |
| 18 to 24 Years | 296 (19.6%) | 99 (10.3%) |
| 25 to 34 Years | 163 (6.8%) | 74 (3.5%) |
| 35 to 44 Years | 120 (4.3%) | 327 (14.3%) |
| 45 to 54 Years | 215 (9.1%) | 136 (6.6%) |
| 55 to 64 Years | 328 (8.4%) | 506 (10.8%) |
| 65 to 74 Years | 281 (5.3%) | 308 (5.1%) |
| 75 Years and over | 276 (5.0%) | 411 (7.7%) |
| Total | 2,172 (8.1%) | 2,100 (7.8%) |
Income Above Poverty by Sex and Age in Bonita Springs
According to the poverty statistics in Bonita Springs, males aged 5 years and females aged 6 to 11 years are the age groups that are most secure financially, with 100.0% of males and 97.2% of females in these age groups living above the poverty line.
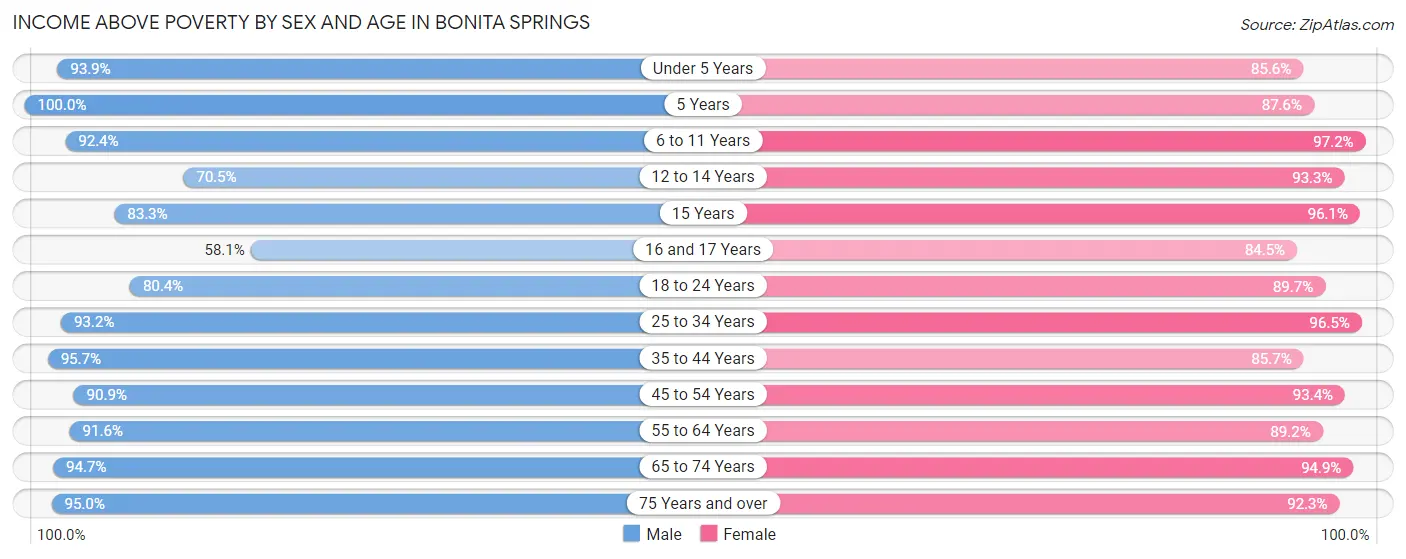
| Age Bracket | Male | Female |
| Under 5 Years | 925 (93.9%) | 494 (85.6%) |
| 5 Years | 125 (100.0%) | 212 (87.6%) |
| 6 to 11 Years | 867 (92.4%) | 1,446 (97.2%) |
| 12 to 14 Years | 352 (70.5%) | 512 (93.3%) |
| 15 Years | 165 (83.3%) | 274 (96.1%) |
| 16 and 17 Years | 252 (58.1%) | 196 (84.5%) |
| 18 to 24 Years | 1,217 (80.4%) | 860 (89.7%) |
| 25 to 34 Years | 2,249 (93.2%) | 2,036 (96.5%) |
| 35 to 44 Years | 2,669 (95.7%) | 1,958 (85.7%) |
| 45 to 54 Years | 2,146 (90.9%) | 1,918 (93.4%) |
| 55 to 64 Years | 3,589 (91.6%) | 4,190 (89.2%) |
| 65 to 74 Years | 5,026 (94.7%) | 5,751 (94.9%) |
| 75 Years and over | 5,236 (95.0%) | 4,956 (92.3%) |
| Total | 24,818 (91.9%) | 24,803 (92.2%) |
Income Below Poverty Among Married-Couple Families in Bonita Springs
The poverty statistics for married-couple families in Bonita Springs show that 3.9% or 555 of the total 14,151 families live below the poverty line. Families with 3 or 4 children have the highest poverty rate of 24.2%, comprising of 83 families. On the other hand, families with 1 or 2 children have the lowest poverty rate of 0.0%, which includes 0 families.
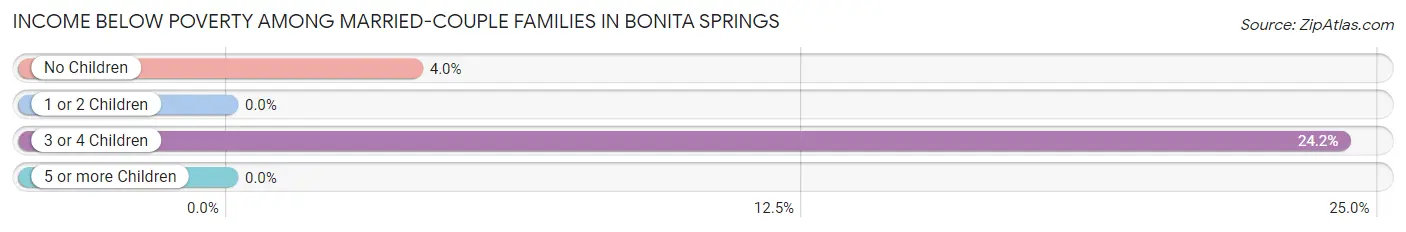
| Children | Above Poverty | Below Poverty |
| No Children | 11,260 (96.0%) | 472 (4.0%) |
| 1 or 2 Children | 2,046 (100.0%) | 0 (0.0%) |
| 3 or 4 Children | 260 (75.8%) | 83 (24.2%) |
| 5 or more Children | 30 (100.0%) | 0 (0.0%) |
| Total | 13,596 (96.1%) | 555 (3.9%) |
Income Below Poverty Among Single-Parent Households in Bonita Springs
According to the poverty data in Bonita Springs, 8.0% or 44 single-father households and 16.5% or 230 single-mother households are living below the poverty line. Among single-father households, those with no children have the highest poverty rate, with 44 households (12.0%) experiencing poverty. Likewise, among single-mother households, those with 1 or 2 children have the highest poverty rate, with 214 households (38.3%) falling below the poverty line.
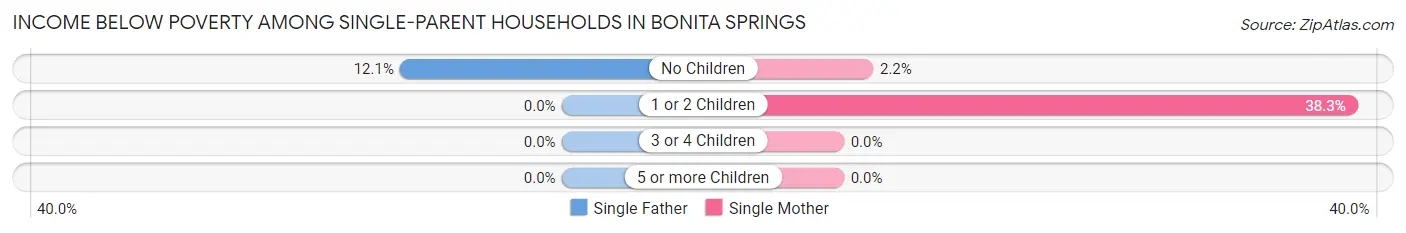
| Children | Single Father | Single Mother |
| No Children | 44 (12.0%) | 16 (2.2%) |
| 1 or 2 Children | 0 (0.0%) | 214 (38.3%) |
| 3 or 4 Children | 0 (0.0%) | 0 (0.0%) |
| 5 or more Children | 0 (0.0%) | 0 (0.0%) |
| Total | 44 (8.0%) | 230 (16.5%) |
Income Below Poverty Among Married-Couple vs Single-Parent Households in Bonita Springs
The poverty data for Bonita Springs shows that 555 of the married-couple family households (3.9%) and 274 of the single-parent households (14.1%) are living below the poverty level. Within the married-couple family households, those with 3 or 4 children have the highest poverty rate, with 83 households (24.2%) falling below the poverty line. Among the single-parent households, those with 1 or 2 children have the highest poverty rate, with 214 household (32.7%) living below poverty.
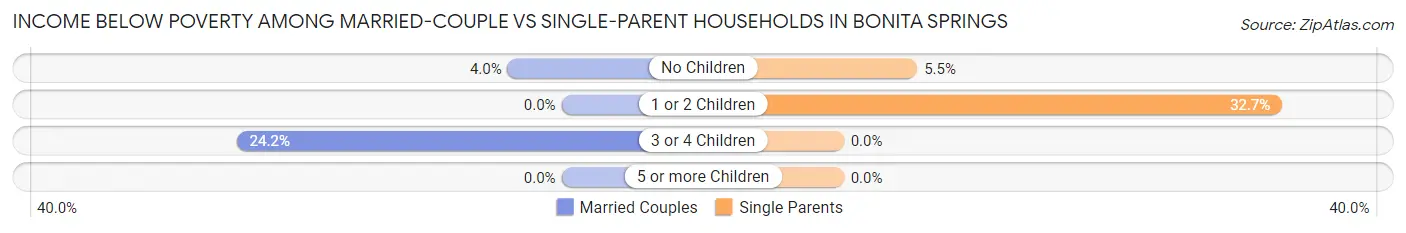
| Children | Married-Couple Families | Single-Parent Households |
| No Children | 472 (4.0%) | 60 (5.5%) |
| 1 or 2 Children | 0 (0.0%) | 214 (32.7%) |
| 3 or 4 Children | 83 (24.2%) | 0 (0.0%) |
| 5 or more Children | 0 (0.0%) | 0 (0.0%) |
| Total | 555 (3.9%) | 274 (14.1%) |
Race in Bonita Springs
The most populous races in Bonita Springs are White / Caucasian (44,786 | 83.0%), Hispanic or Latino (11,994 | 22.2%), and Two or more Races (4,687 | 8.7%).
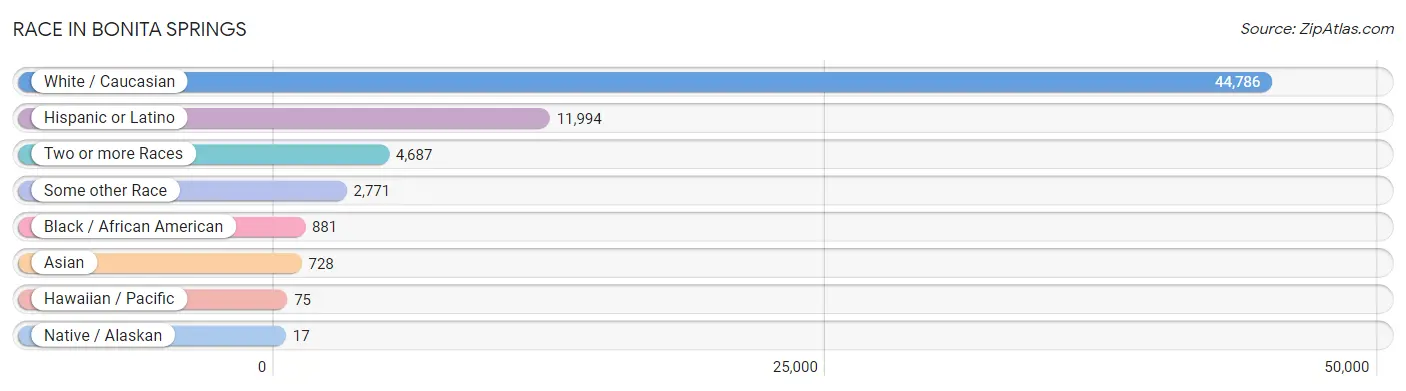
| Race | # Population | % Population |
| Asian | 728 | 1.3% |
| Black / African American | 881 | 1.6% |
| Hawaiian / Pacific | 75 | 0.1% |
| Hispanic or Latino | 11,994 | 22.2% |
| Native / Alaskan | 17 | 0.0% |
| White / Caucasian | 44,786 | 83.0% |
| Two or more Races | 4,687 | 8.7% |
| Some other Race | 2,771 | 5.1% |
| Total | 53,945 | 100.0% |
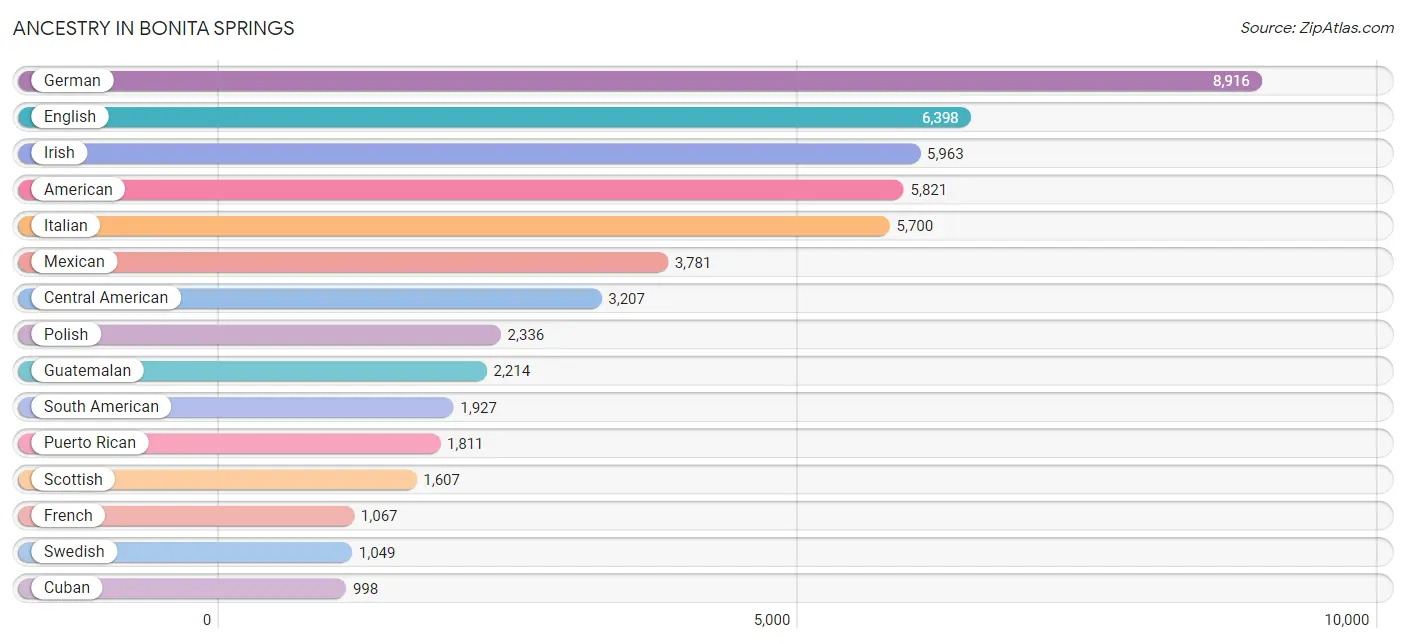
Ancestry in Bonita Springs
The most populous ancestries reported in Bonita Springs are German (8,916 | 16.5%), English (6,398 | 11.9%), Irish (5,963 | 11.1%), American (5,821 | 10.8%), and Italian (5,700 | 10.6%), together accounting for 60.8% of all Bonita Springs residents.
| Ancestry | # Population | % Population |
| Albanian | 41 | 0.1% |
| American | 5,821 | 10.8% |
| Apache | 5 | 0.0% |
| Arab | 279 | 0.5% |
| Argentinean | 110 | 0.2% |
| Armenian | 35 | 0.1% |
| Austrian | 252 | 0.5% |
| Belgian | 66 | 0.1% |
| Bhutanese | 23 | 0.0% |
| Brazilian | 67 | 0.1% |
| British | 488 | 0.9% |
| Burmese | 70 | 0.1% |
| Canadian | 346 | 0.6% |
| Cape Verdean | 16 | 0.0% |
| Central American | 3,207 | 5.9% |
| Central American Indian | 13 | 0.0% |
| Cherokee | 14 | 0.0% |
| Chippewa | 10 | 0.0% |
| Colombian | 837 | 1.5% |
| Costa Rican | 202 | 0.4% |
| Croatian | 110 | 0.2% |
| Cuban | 998 | 1.8% |
| Czech | 510 | 0.9% |
| Czechoslovakian | 33 | 0.1% |
| Danish | 190 | 0.4% |
| Dominican | 59 | 0.1% |
| Dutch | 677 | 1.3% |
| Eastern European | 183 | 0.3% |
| Ecuadorian | 262 | 0.5% |
| English | 6,398 | 11.9% |
| European | 630 | 1.2% |
| Filipino | 70 | 0.1% |
| Finnish | 35 | 0.1% |
| French | 1,067 | 2.0% |
| French Canadian | 272 | 0.5% |
| German | 8,916 | 16.5% |
| Greek | 193 | 0.4% |
| Guamanian / Chamorro | 11 | 0.0% |
| Guatemalan | 2,214 | 4.1% |
| Guyanese | 7 | 0.0% |
| Haitian | 93 | 0.2% |
| Honduran | 364 | 0.7% |
| Hungarian | 320 | 0.6% |
| Indian (Asian) | 146 | 0.3% |
| Iranian | 83 | 0.2% |
| Iraqi | 7 | 0.0% |
| Irish | 5,963 | 11.1% |
| Israeli | 12 | 0.0% |
| Italian | 5,700 | 10.6% |
| Jamaican | 206 | 0.4% |
| Japanese | 140 | 0.3% |
| Korean | 145 | 0.3% |
| Laotian | 97 | 0.2% |
| Latvian | 12 | 0.0% |
| Lebanese | 175 | 0.3% |
| Lithuanian | 175 | 0.3% |
| Macedonian | 29 | 0.1% |
| Mexican | 3,781 | 7.0% |
| Nicaraguan | 121 | 0.2% |
| Northern European | 103 | 0.2% |
| Norwegian | 507 | 0.9% |
| Palestinian | 13 | 0.0% |
| Panamanian | 72 | 0.1% |
| Peruvian | 153 | 0.3% |
| Polish | 2,336 | 4.3% |
| Portuguese | 210 | 0.4% |
| Puerto Rican | 1,811 | 3.4% |
| Romanian | 65 | 0.1% |
| Russian | 389 | 0.7% |
| Salvadoran | 234 | 0.4% |
| Scandinavian | 180 | 0.3% |
| Scotch-Irish | 387 | 0.7% |
| Scottish | 1,607 | 3.0% |
| Serbian | 15 | 0.0% |
| Slavic | 25 | 0.1% |
| Slovak | 87 | 0.2% |
| Slovene | 80 | 0.2% |
| South American | 1,927 | 3.6% |
| South American Indian | 95 | 0.2% |
| Spaniard | 19 | 0.0% |
| Sri Lankan | 133 | 0.3% |
| Subsaharan African | 16 | 0.0% |
| Swedish | 1,049 | 1.9% |
| Swiss | 79 | 0.2% |
| Syrian | 84 | 0.2% |
| Thai | 221 | 0.4% |
| Turkish | 116 | 0.2% |
| Ukrainian | 299 | 0.5% |
| Uruguayan | 37 | 0.1% |
| Venezuelan | 528 | 1.0% |
| Welsh | 285 | 0.5% |
| Yugoslavian | 35 | 0.1% | View All 92 Rows |
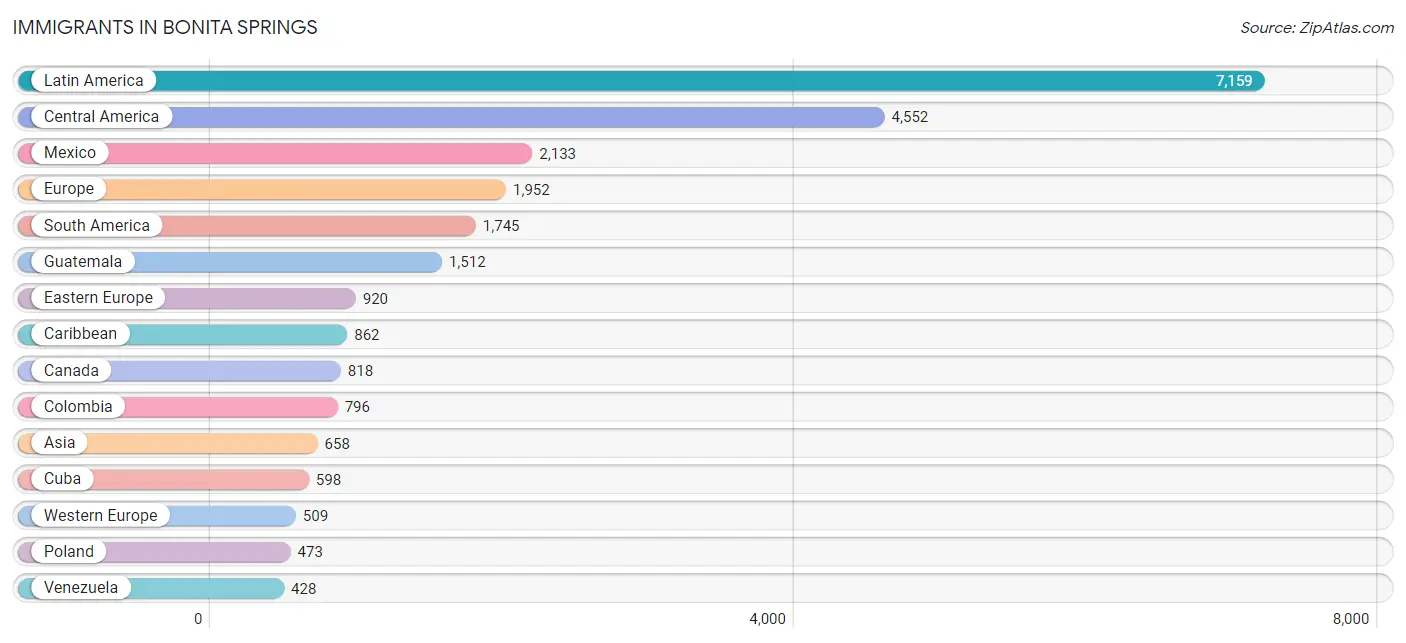
Immigrants in Bonita Springs
The most numerous immigrant groups reported in Bonita Springs came from Latin America (7,159 | 13.3%), Central America (4,552 | 8.4%), Mexico (2,133 | 4.0%), Europe (1,952 | 3.6%), and South America (1,745 | 3.2%), together accounting for 32.5% of all Bonita Springs residents.
| Immigration Origin | # Population | % Population |
| Africa | 7 | 0.0% |
| Albania | 81 | 0.2% |
| Argentina | 18 | 0.0% |
| Asia | 658 | 1.2% |
| Bahamas | 12 | 0.0% |
| Belgium | 7 | 0.0% |
| Belize | 3 | 0.0% |
| Brazil | 126 | 0.2% |
| Canada | 818 | 1.5% |
| Caribbean | 862 | 1.6% |
| Central America | 4,552 | 8.4% |
| China | 75 | 0.1% |
| Colombia | 796 | 1.5% |
| Costa Rica | 202 | 0.4% |
| Cuba | 598 | 1.1% |
| Czechoslovakia | 196 | 0.4% |
| Dominican Republic | 28 | 0.1% |
| Eastern Asia | 145 | 0.3% |
| Eastern Europe | 920 | 1.7% |
| Ecuador | 195 | 0.4% |
| El Salvador | 237 | 0.4% |
| England | 107 | 0.2% |
| Europe | 1,952 | 3.6% |
| France | 16 | 0.0% |
| Germany | 404 | 0.7% |
| Greece | 11 | 0.0% |
| Guatemala | 1,512 | 2.8% |
| Haiti | 78 | 0.1% |
| Honduras | 293 | 0.5% |
| Hong Kong | 9 | 0.0% |
| Hungary | 22 | 0.0% |
| India | 214 | 0.4% |
| Iran | 83 | 0.2% |
| Iraq | 7 | 0.0% |
| Ireland | 59 | 0.1% |
| Israel | 34 | 0.1% |
| Italy | 168 | 0.3% |
| Jamaica | 84 | 0.2% |
| Korea | 70 | 0.1% |
| Latin America | 7,159 | 13.3% |
| Latvia | 48 | 0.1% |
| Lithuania | 6 | 0.0% |
| Mexico | 2,133 | 4.0% |
| Netherlands | 76 | 0.1% |
| Nicaragua | 100 | 0.2% |
| Northern Africa | 7 | 0.0% |
| Northern Europe | 301 | 0.6% |
| Norway | 12 | 0.0% |
| Panama | 72 | 0.1% |
| Peru | 145 | 0.3% |
| Philippines | 81 | 0.2% |
| Poland | 473 | 0.9% |
| Portugal | 43 | 0.1% |
| Scotland | 7 | 0.0% |
| Serbia | 6 | 0.0% |
| South America | 1,745 | 3.2% |
| South Central Asia | 332 | 0.6% |
| South Eastern Asia | 109 | 0.2% |
| Southern Europe | 222 | 0.4% |
| Switzerland | 6 | 0.0% |
| Taiwan | 40 | 0.1% |
| Turkey | 26 | 0.1% |
| Ukraine | 65 | 0.1% |
| Uruguay | 37 | 0.1% |
| Uzbekistan | 35 | 0.1% |
| Venezuela | 428 | 0.8% |
| Vietnam | 28 | 0.1% |
| Western Asia | 72 | 0.1% |
| Western Europe | 509 | 0.9% | View All 69 Rows |
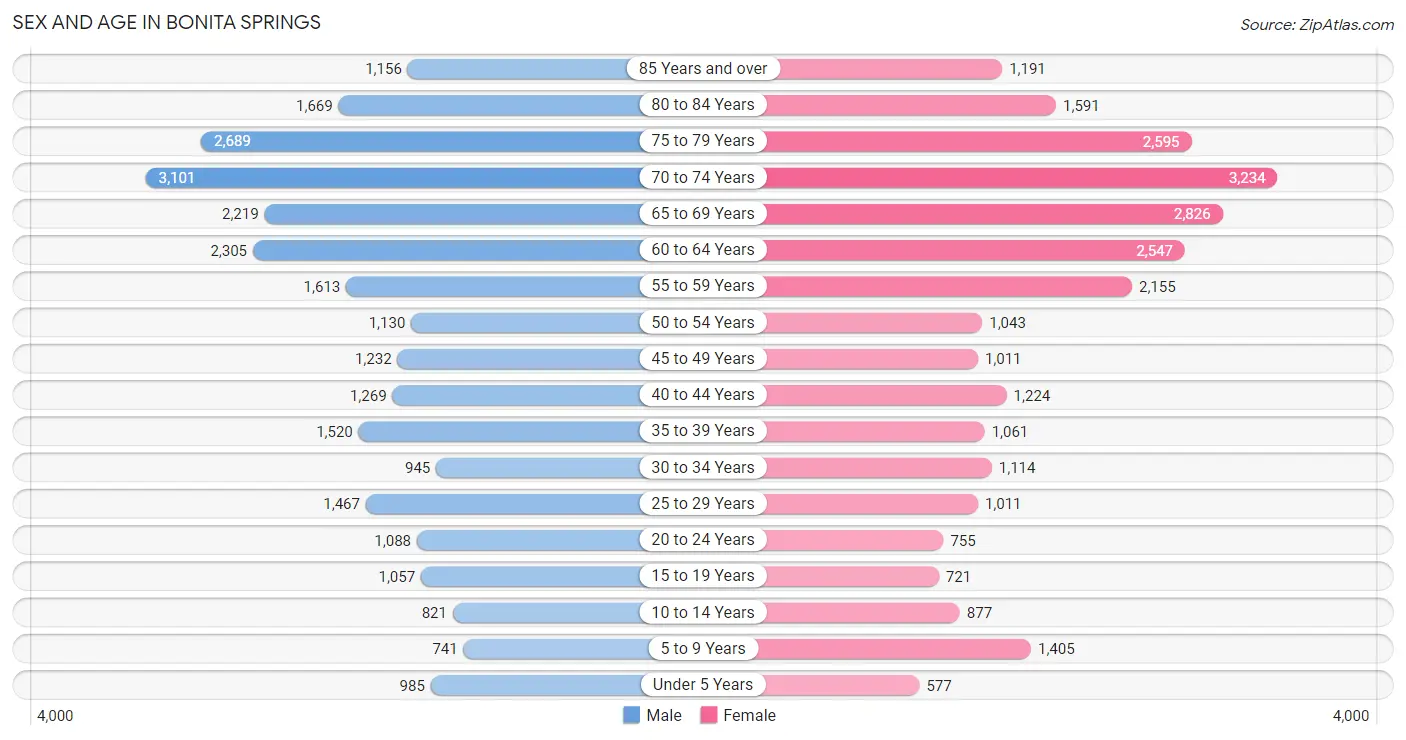
Sex and Age in Bonita Springs
Sex and Age in Bonita Springs
The most populous age groups in Bonita Springs are 70 to 74 Years (3,101 | 11.5%) for men and 70 to 74 Years (3,234 | 12.0%) for women.
| Age Bracket | Male | Female |
| Under 5 Years | 985 (3.6%) | 577 (2.1%) |
| 5 to 9 Years | 741 (2.7%) | 1,405 (5.2%) |
| 10 to 14 Years | 821 (3.0%) | 877 (3.3%) |
| 15 to 19 Years | 1,057 (3.9%) | 721 (2.7%) |
| 20 to 24 Years | 1,088 (4.0%) | 755 (2.8%) |
| 25 to 29 Years | 1,467 (5.4%) | 1,011 (3.7%) |
| 30 to 34 Years | 945 (3.5%) | 1,114 (4.1%) |
| 35 to 39 Years | 1,520 (5.6%) | 1,061 (3.9%) |
| 40 to 44 Years | 1,269 (4.7%) | 1,224 (4.5%) |
| 45 to 49 Years | 1,232 (4.6%) | 1,011 (3.7%) |
| 50 to 54 Years | 1,130 (4.2%) | 1,043 (3.9%) |
| 55 to 59 Years | 1,613 (6.0%) | 2,155 (8.0%) |
| 60 to 64 Years | 2,305 (8.5%) | 2,547 (9.5%) |
| 65 to 69 Years | 2,219 (8.2%) | 2,826 (10.5%) |
| 70 to 74 Years | 3,101 (11.5%) | 3,234 (12.0%) |
| 75 to 79 Years | 2,689 (10.0%) | 2,595 (9.6%) |
| 80 to 84 Years | 1,669 (6.2%) | 1,591 (5.9%) |
| 85 Years and over | 1,156 (4.3%) | 1,191 (4.4%) |
| Total | 27,007 (100.0%) | 26,938 (100.0%) |
Families and Households in Bonita Springs
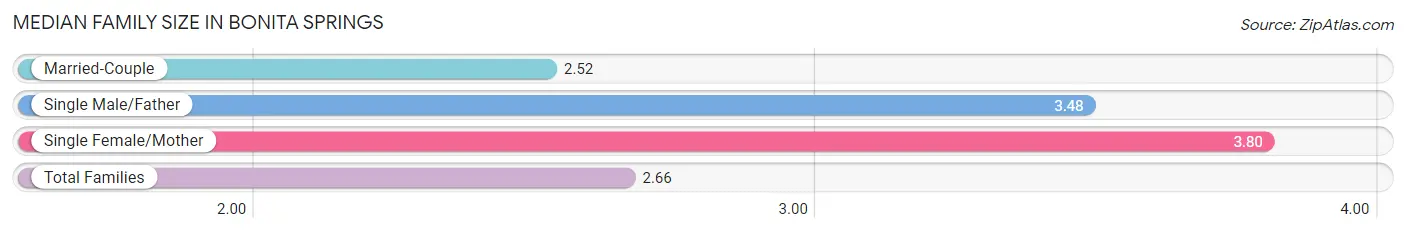
Median Family Size in Bonita Springs
The median family size in Bonita Springs is 2.66 persons per family, with single female/mother families (1,397 | 8.7%) accounting for the largest median family size of 3.8 persons per family. On the other hand, married-couple families (14,151 | 87.9%) represent the smallest median family size with 2.52 persons per family.
| Family Type | # Families | Family Size |
| Married-Couple | 14,151 (87.9%) | 2.52 |
| Single Male/Father | 553 (3.4%) | 3.48 |
| Single Female/Mother | 1,397 (8.7%) | 3.80 |
| Total Families | 16,101 (100.0%) | 2.66 |
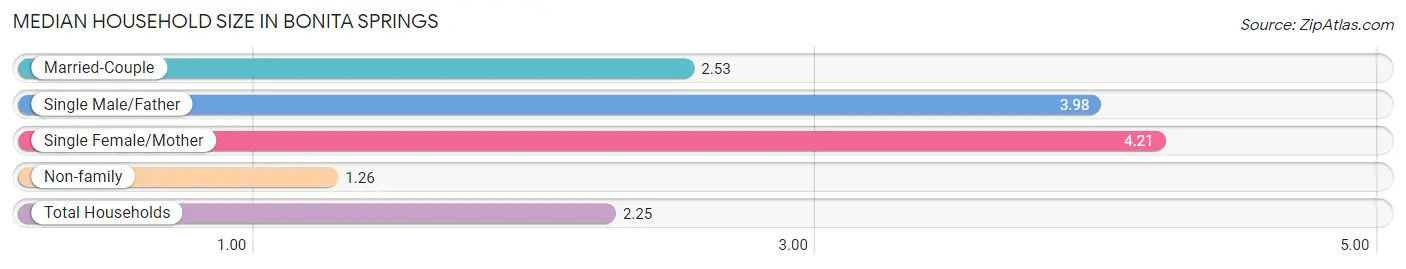
Median Household Size in Bonita Springs
The median household size in Bonita Springs is 2.25 persons per household, with single female/mother households (1,397 | 5.8%) accounting for the largest median household size of 4.21 persons per household. non-family households (7,878 | 32.9%) represent the smallest median household size with 1.26 persons per household.
| Household Type | # Households | Household Size |
| Married-Couple | 14,151 (59.0%) | 2.53 |
| Single Male/Father | 553 (2.3%) | 3.98 |
| Single Female/Mother | 1,397 (5.8%) | 4.21 |
| Non-family | 7,878 (32.9%) | 1.26 |
| Total Households | 23,979 (100.0%) | 2.25 |
Household Size by Marriage Status in Bonita Springs
Out of a total of 23,979 households in Bonita Springs, 16,101 (67.1%) are family households, while 7,878 (32.9%) are nonfamily households. The most numerous type of family households are 2-person households, comprising 11,596, and the most common type of nonfamily households are 1-person households, comprising 6,349.
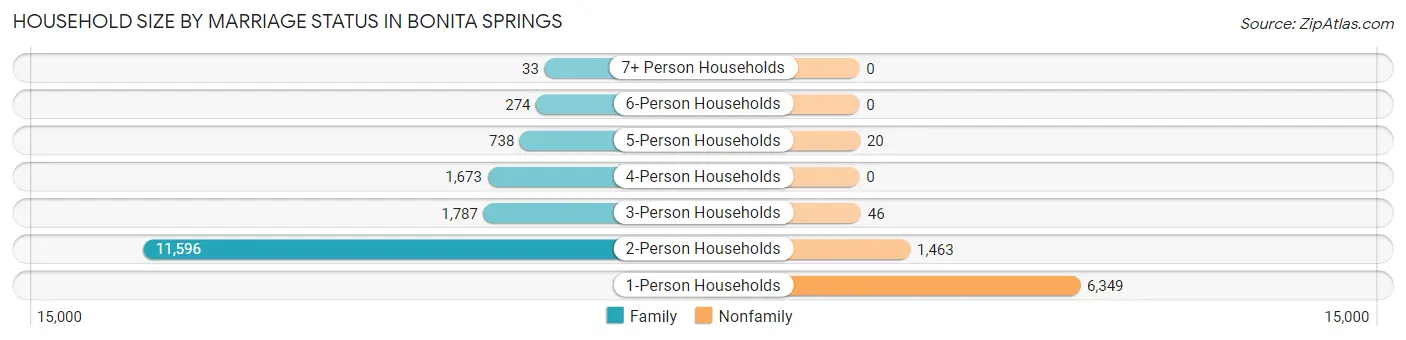
| Household Size | Family Households | Nonfamily Households |
| 1-Person Households | - | 6,349 (26.5%) |
| 2-Person Households | 11,596 (48.4%) | 1,463 (6.1%) |
| 3-Person Households | 1,787 (7.4%) | 46 (0.2%) |
| 4-Person Households | 1,673 (7.0%) | 0 (0.0%) |
| 5-Person Households | 738 (3.1%) | 20 (0.1%) |
| 6-Person Households | 274 (1.1%) | 0 (0.0%) |
| 7+ Person Households | 33 (0.1%) | 0 (0.0%) |
| Total | 16,101 (67.1%) | 7,878 (32.9%) |
Female Fertility in Bonita Springs
Fertility by Age in Bonita Springs
Average fertility rate in Bonita Springs is 38.0 births per 1,000 women. Women in the age bracket of 20 to 34 years have the highest fertility rate with 74.0 births per 1,000 women. Women in the age bracket of 20 to 34 years acount for 79.7% of all women with births.
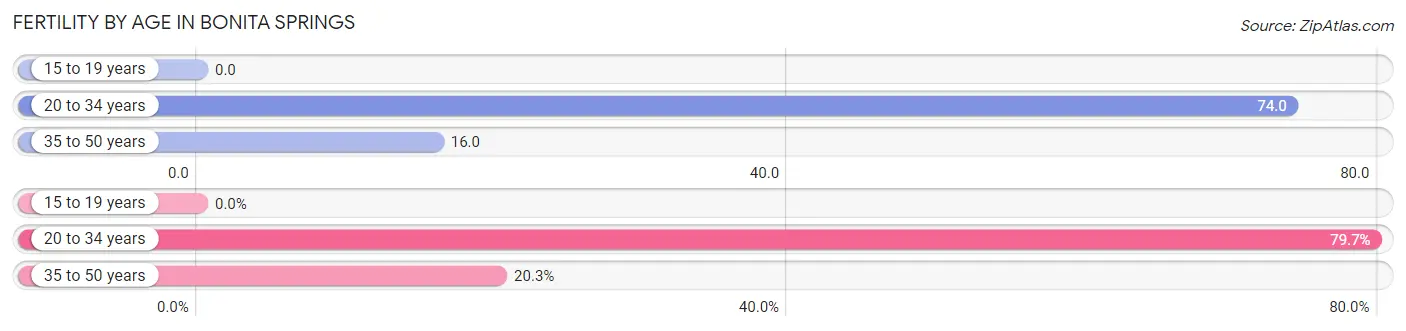
| Age Bracket | Women with Births | Births / 1,000 Women |
| 15 to 19 years | 0 (0.0%) | 0.0 |
| 20 to 34 years | 212 (79.7%) | 74.0 |
| 35 to 50 years | 54 (20.3%) | 16.0 |
| Total | 266 (100.0%) | 38.0 |
Fertility by Age by Marriage Status in Bonita Springs
65.0% of women with births (266) in Bonita Springs are married. The highest percentage of unmarried women with births falls into 20 to 34 years age bracket with 43.9% of them unmarried at the time of birth, while the lowest percentage of unmarried women with births belong to 35 to 50 years age bracket with 0.0% of them unmarried.
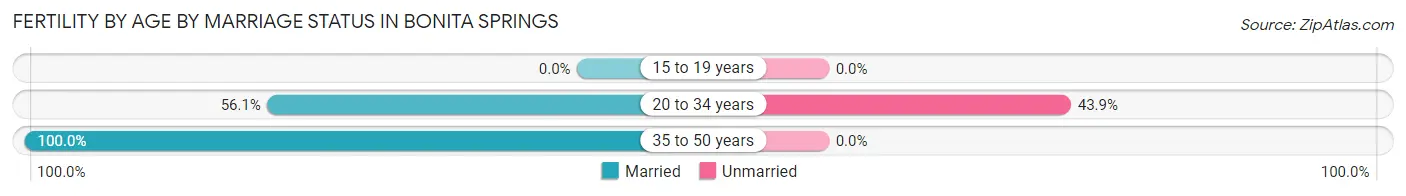
| Age Bracket | Married | Unmarried |
| 15 to 19 years | 0 (0.0%) | 0 (0.0%) |
| 20 to 34 years | 119 (56.1%) | 93 (43.9%) |
| 35 to 50 years | 54 (100.0%) | 0 (0.0%) |
| Total | 173 (65.0%) | 93 (35.0%) |
Fertility by Education in Bonita Springs
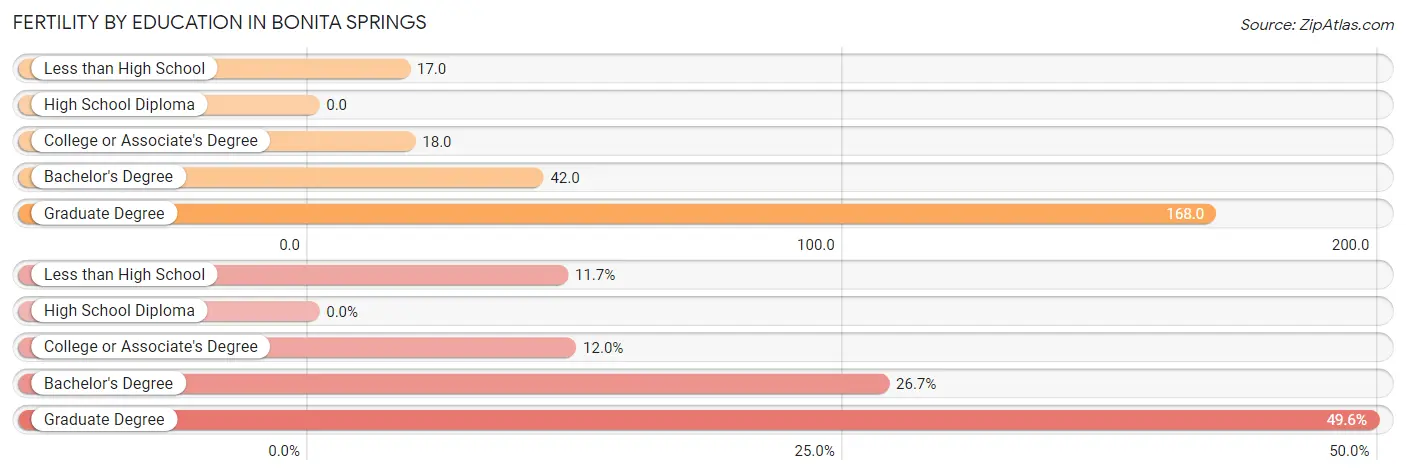
| Educational Attainment | Women with Births | Births / 1,000 Women |
| Less than High School | 31 (11.7%) | 17.0 |
| High School Diploma | 0 (0.0%) | 0.0 |
| College or Associate's Degree | 32 (12.0%) | 18.0 |
| Bachelor's Degree | 71 (26.7%) | 42.0 |
| Graduate Degree | 132 (49.6%) | 168.0 |
| Total | 266 (100.0%) | 38.0 |
Fertility by Education by Marriage Status in Bonita Springs
35.0% of women with births in Bonita Springs are unmarried. Women with the educational attainment of less than high school are most likely to be married with 100.0% of them married at childbirth, while women with the educational attainment of bachelor's degree are least likely to be married with 100.0% of them unmarried at childbirth.
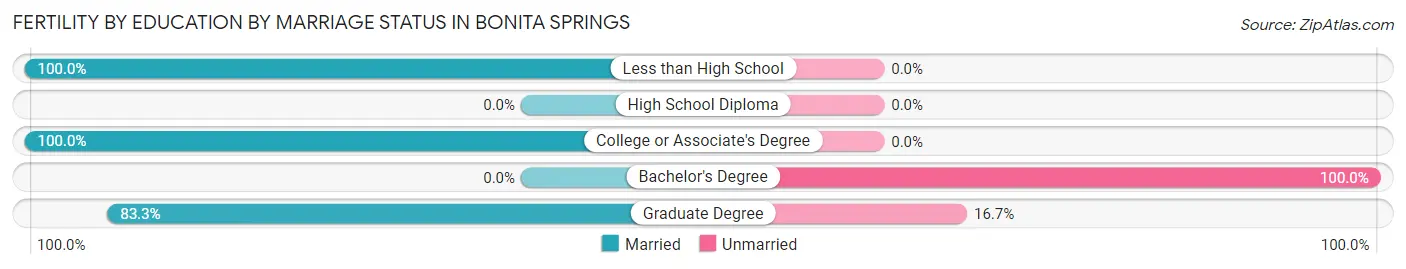
| Educational Attainment | Married | Unmarried |
| Less than High School | 31 (100.0%) | 0 (0.0%) |
| High School Diploma | 0 (0.0%) | 0 (0.0%) |
| College or Associate's Degree | 32 (100.0%) | 0 (0.0%) |
| Bachelor's Degree | 0 (0.0%) | 71 (100.0%) |
| Graduate Degree | 110 (83.3%) | 22 (16.7%) |
| Total | 173 (65.0%) | 93 (35.0%) |
Employment Characteristics in Bonita Springs
Employment by Class of Employer in Bonita Springs
Among the 20,413 employed individuals in Bonita Springs, private company employees (14,228 | 69.7%), self-employed (incorporated) (2,039 | 10.0%), and not-for-profit organizations (1,415 | 6.9%) make up the most common classes of employment.
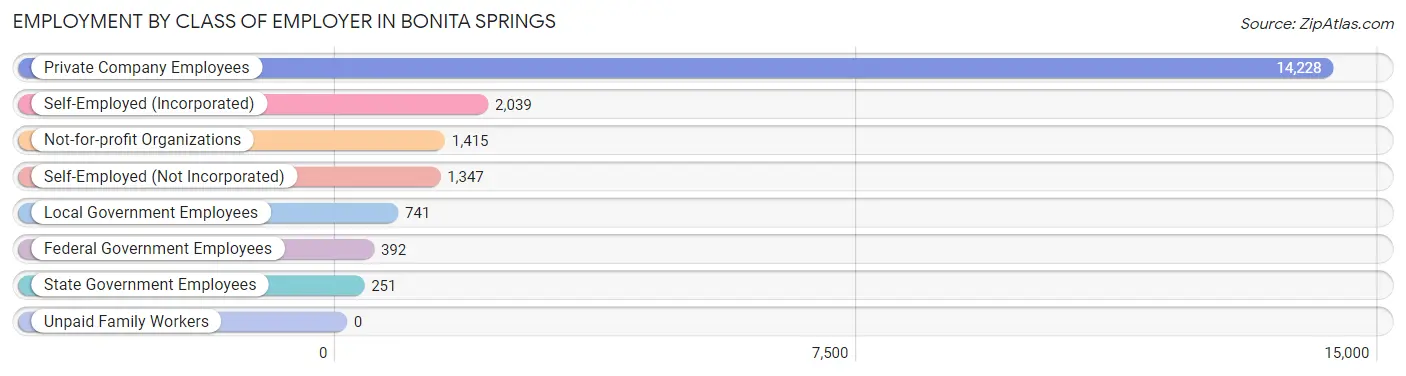
| Employer Class | # Employees | % Employees |
| Private Company Employees | 14,228 | 69.7% |
| Self-Employed (Incorporated) | 2,039 | 10.0% |
| Self-Employed (Not Incorporated) | 1,347 | 6.6% |
| Not-for-profit Organizations | 1,415 | 6.9% |
| Local Government Employees | 741 | 3.6% |
| State Government Employees | 251 | 1.2% |
| Federal Government Employees | 392 | 1.9% |
| Unpaid Family Workers | 0 | 0.0% |
| Total | 20,413 | 100.0% |
Employment Status by Age in Bonita Springs
According to the labor force statistics for Bonita Springs, out of the total population over 16 years of age (48,056), 44.8% or 21,529 individuals are in the labor force, with 3.6% or 775 of them unemployed. The age group with the highest labor force participation rate is 25 to 29 years, with 93.2% or 2,309 individuals in the labor force. Within the labor force, the 16 to 19 years age range has the highest percentage of unemployed individuals, with 17.4% or 42 of them being unemployed.
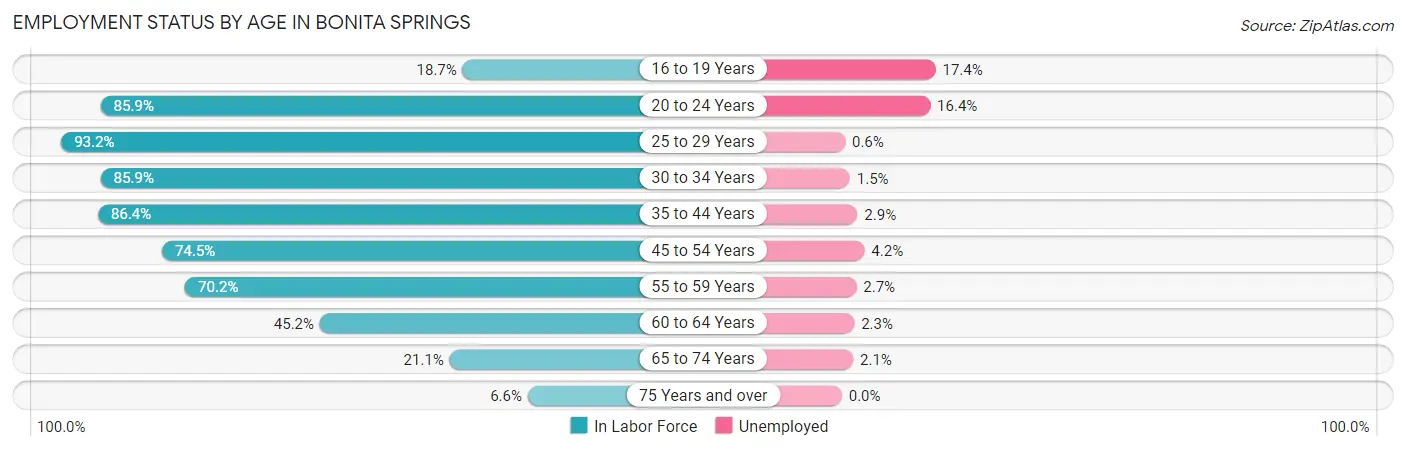
| Age Bracket | In Labor Force | Unemployed |
| 16 to 19 Years | 242 (18.7%) | 42 (17.4%) |
| 20 to 24 Years | 1,583 (85.9%) | 260 (16.4%) |
| 25 to 29 Years | 2,309 (93.2%) | 14 (0.6%) |
| 30 to 34 Years | 1,769 (85.9%) | 27 (1.5%) |
| 35 to 44 Years | 4,384 (86.4%) | 127 (2.9%) |
| 45 to 54 Years | 3,290 (74.5%) | 138 (4.2%) |
| 55 to 59 Years | 2,645 (70.2%) | 71 (2.7%) |
| 60 to 64 Years | 2,193 (45.2%) | 50 (2.3%) |
| 65 to 74 Years | 2,401 (21.1%) | 50 (2.1%) |
| 75 Years and over | 719 (6.6%) | 0 (0.0%) |
| Total | 21,529 (44.8%) | 775 (3.6%) |
Employment Status by Educational Attainment in Bonita Springs
According to labor force statistics for Bonita Springs, 73.3% of individuals (16,600) out of the total population between 25 and 64 years of age (22,647) are in the labor force, with 2.6% or 432 of them being unemployed. The group with the highest labor force participation rate are those with the educational attainment of college / associate degree, with 76.0% or 5,139 individuals in the labor force. Within the labor force, individuals with high school diploma education have the highest percentage of unemployment, with 5.0% or 176 of them being unemployed.
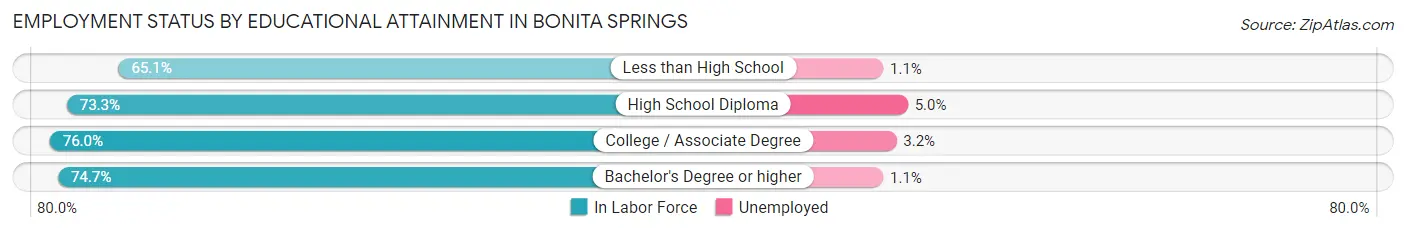
| Educational Attainment | In Labor Force | Unemployed |
| Less than High School | 2,310 (65.1%) | 39 (1.1%) |
| High School Diploma | 3,514 (73.3%) | 240 (5.0%) |
| College / Associate Degree | 5,139 (76.0%) | 216 (3.2%) |
| Bachelor's Degree or higher | 5,634 (74.7%) | 83 (1.1%) |
| Total | 16,600 (73.3%) | 589 (2.6%) |
Employment Occupations by Sex in Bonita Springs
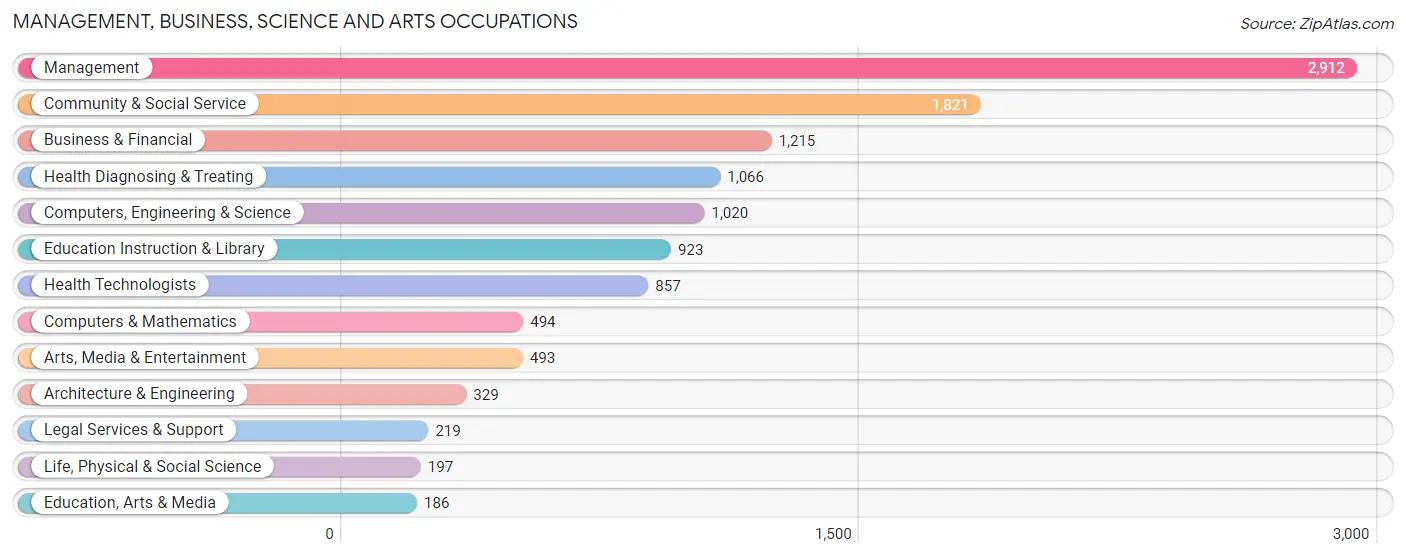
Management, Business, Science and Arts Occupations
The most common Management, Business, Science and Arts occupations in Bonita Springs are Management (2,912 | 14.0%), Community & Social Service (1,821 | 8.8%), Business & Financial (1,215 | 5.9%), Health Diagnosing & Treating (1,066 | 5.1%), and Computers, Engineering & Science (1,020 | 4.9%).
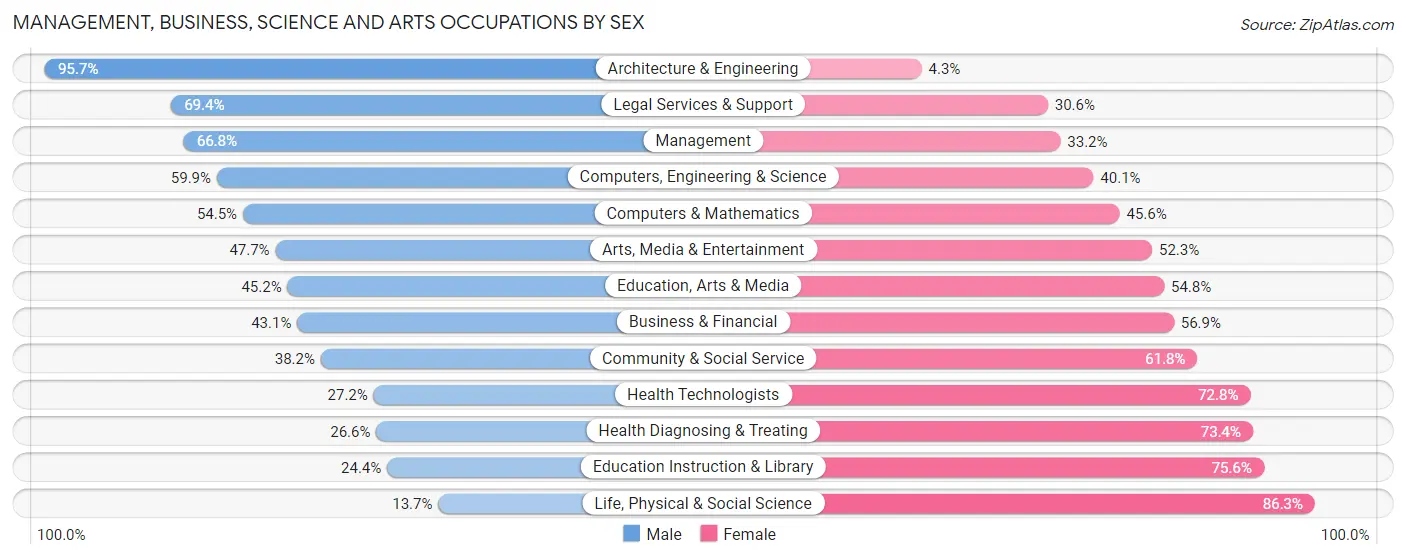
Management, Business, Science and Arts Occupations by Sex
Within the Management, Business, Science and Arts occupations in Bonita Springs, the most male-oriented occupations are Architecture & Engineering (95.7%), Legal Services & Support (69.4%), and Management (66.8%), while the most female-oriented occupations are Life, Physical & Social Science (86.3%), Education Instruction & Library (75.6%), and Health Diagnosing & Treating (73.4%).
| Occupation | Male | Female |
| Management | 1,945 (66.8%) | 967 (33.2%) |
| Business & Financial | 524 (43.1%) | 691 (56.9%) |
| Computers, Engineering & Science | 611 (59.9%) | 409 (40.1%) |
| Computers & Mathematics | 269 (54.4%) | 225 (45.6%) |
| Architecture & Engineering | 315 (95.7%) | 14 (4.3%) |
| Life, Physical & Social Science | 27 (13.7%) | 170 (86.3%) |
| Community & Social Service | 696 (38.2%) | 1,125 (61.8%) |
| Education, Arts & Media | 84 (45.2%) | 102 (54.8%) |
| Legal Services & Support | 152 (69.4%) | 67 (30.6%) |
| Education Instruction & Library | 225 (24.4%) | 698 (75.6%) |
| Arts, Media & Entertainment | 235 (47.7%) | 258 (52.3%) |
| Health Diagnosing & Treating | 284 (26.6%) | 782 (73.4%) |
| Health Technologists | 233 (27.2%) | 624 (72.8%) |
| Total (Category) | 4,060 (50.5%) | 3,974 (49.5%) |
| Total (Overall) | 12,254 (59.0%) | 8,512 (41.0%) |
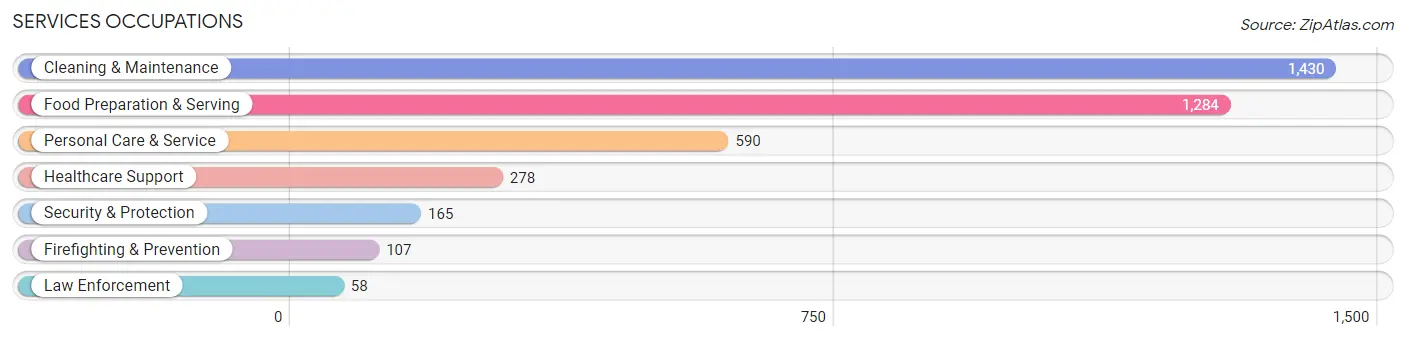
Services Occupations
The most common Services occupations in Bonita Springs are Cleaning & Maintenance (1,430 | 6.9%), Food Preparation & Serving (1,284 | 6.2%), Personal Care & Service (590 | 2.8%), Healthcare Support (278 | 1.3%), and Security & Protection (165 | 0.8%).
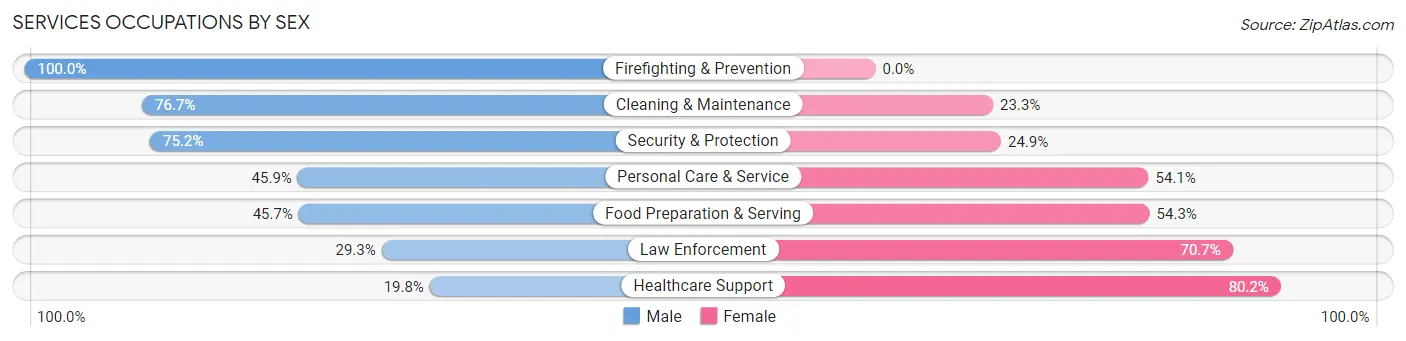
Services Occupations by Sex
Within the Services occupations in Bonita Springs, the most male-oriented occupations are Firefighting & Prevention (100.0%), Cleaning & Maintenance (76.7%), and Security & Protection (75.1%), while the most female-oriented occupations are Healthcare Support (80.2%), Law Enforcement (70.7%), and Food Preparation & Serving (54.3%).
| Occupation | Male | Female |
| Healthcare Support | 55 (19.8%) | 223 (80.2%) |
| Security & Protection | 124 (75.1%) | 41 (24.8%) |
| Firefighting & Prevention | 107 (100.0%) | 0 (0.0%) |
| Law Enforcement | 17 (29.3%) | 41 (70.7%) |
| Food Preparation & Serving | 587 (45.7%) | 697 (54.3%) |
| Cleaning & Maintenance | 1,097 (76.7%) | 333 (23.3%) |
| Personal Care & Service | 271 (45.9%) | 319 (54.1%) |
| Total (Category) | 2,134 (57.0%) | 1,613 (43.0%) |
| Total (Overall) | 12,254 (59.0%) | 8,512 (41.0%) |
Sales and Office Occupations
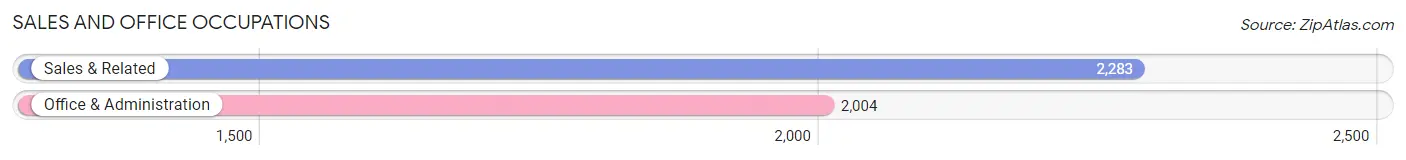
The most common Sales and Office occupations in Bonita Springs are Sales & Related (2,283 | 11.0%), and Office & Administration (2,004 | 9.7%).
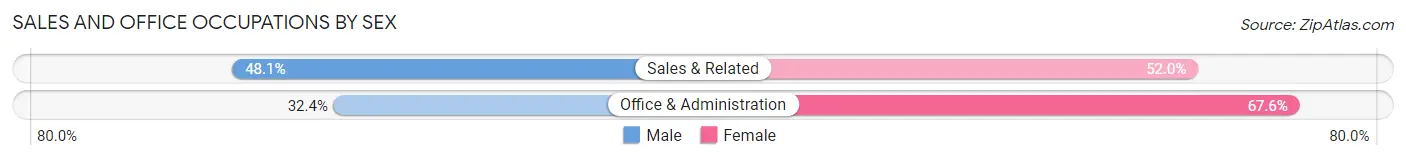
Sales and Office Occupations by Sex
| Occupation | Male | Female |
| Sales & Related | 1,097 (48.0%) | 1,186 (51.9%) |
| Office & Administration | 650 (32.4%) | 1,354 (67.6%) |
| Total (Category) | 1,747 (40.7%) | 2,540 (59.3%) |
| Total (Overall) | 12,254 (59.0%) | 8,512 (41.0%) |
Natural Resources, Construction and Maintenance Occupations
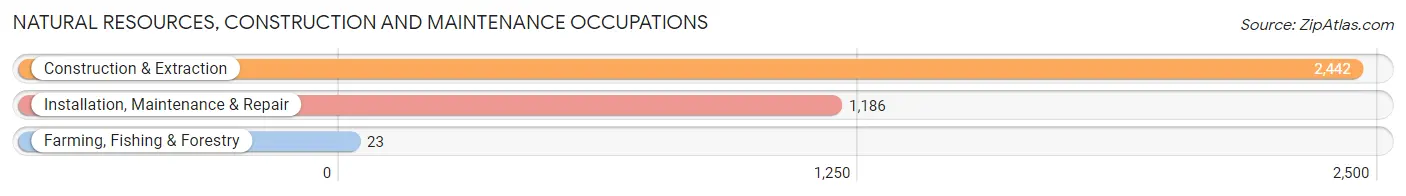
The most common Natural Resources, Construction and Maintenance occupations in Bonita Springs are Construction & Extraction (2,442 | 11.8%), Installation, Maintenance & Repair (1,186 | 5.7%), and Farming, Fishing & Forestry (23 | 0.1%).
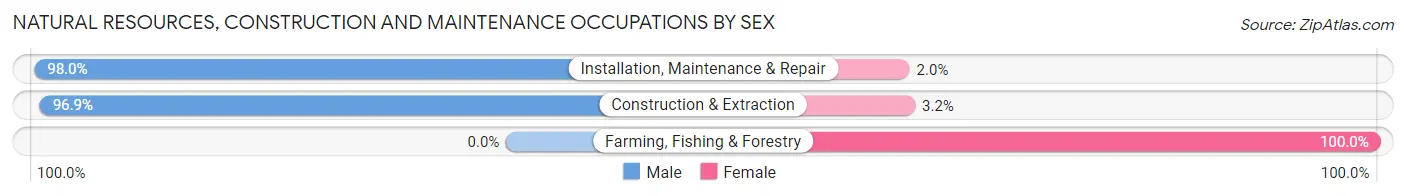
Natural Resources, Construction and Maintenance Occupations by Sex
| Occupation | Male | Female |
| Farming, Fishing & Forestry | 0 (0.0%) | 23 (100.0%) |
| Construction & Extraction | 2,365 (96.9%) | 77 (3.2%) |
| Installation, Maintenance & Repair | 1,162 (98.0%) | 24 (2.0%) |
| Total (Category) | 3,527 (96.6%) | 124 (3.4%) |
| Total (Overall) | 12,254 (59.0%) | 8,512 (41.0%) |
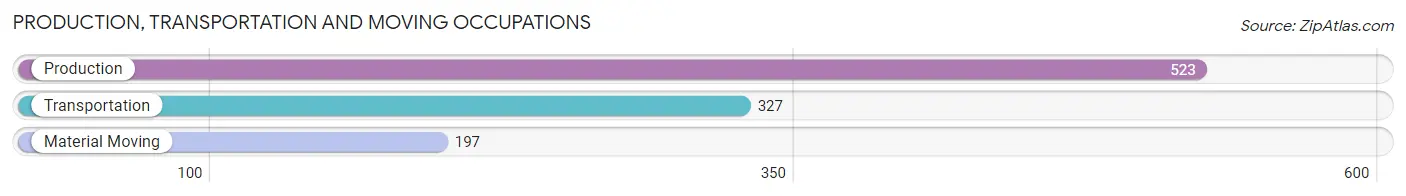
Production, Transportation and Moving Occupations
The most common Production, Transportation and Moving occupations in Bonita Springs are Production (523 | 2.5%), Transportation (327 | 1.6%), and Material Moving (197 | 0.9%).
Production, Transportation and Moving Occupations by Sex
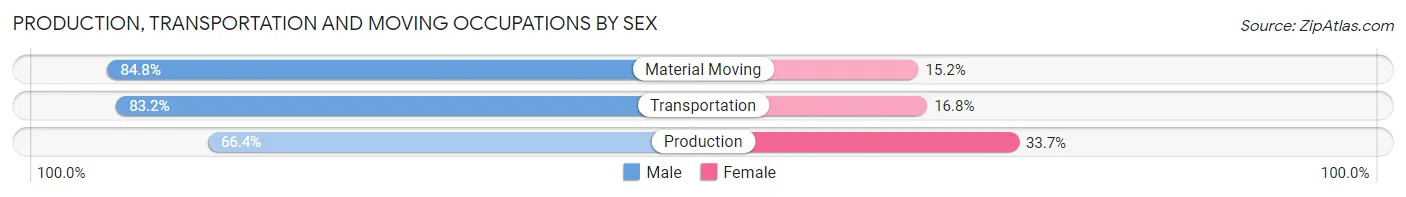
| Occupation | Male | Female |
| Production | 347 (66.3%) | 176 (33.7%) |
| Transportation | 272 (83.2%) | 55 (16.8%) |
| Material Moving | 167 (84.8%) | 30 (15.2%) |
| Total (Category) | 786 (75.1%) | 261 (24.9%) |
| Total (Overall) | 12,254 (59.0%) | 8,512 (41.0%) |
Employment Industries by Sex in Bonita Springs
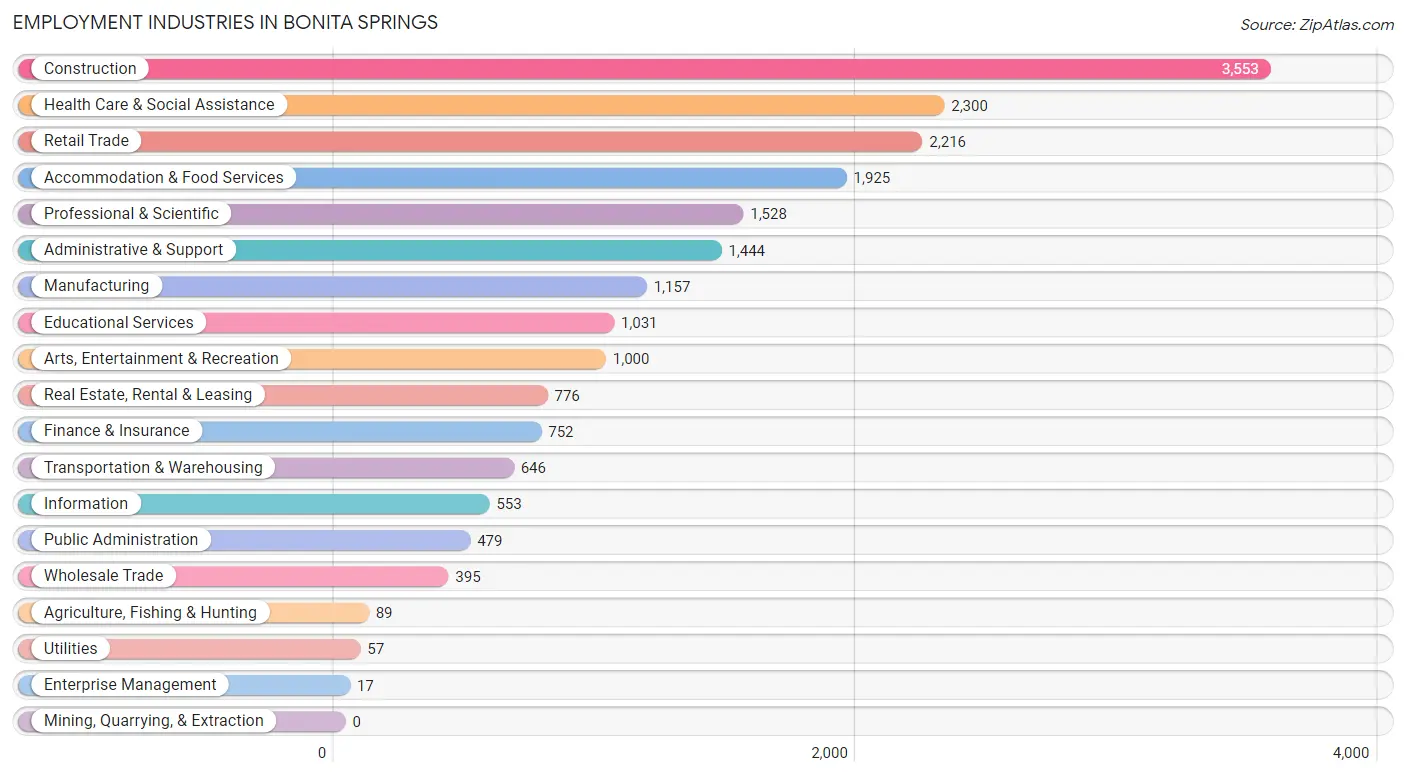
Employment Industries in Bonita Springs
The major employment industries in Bonita Springs include Construction (3,553 | 17.1%), Health Care & Social Assistance (2,300 | 11.1%), Retail Trade (2,216 | 10.7%), Accommodation & Food Services (1,925 | 9.3%), and Professional & Scientific (1,528 | 7.4%).
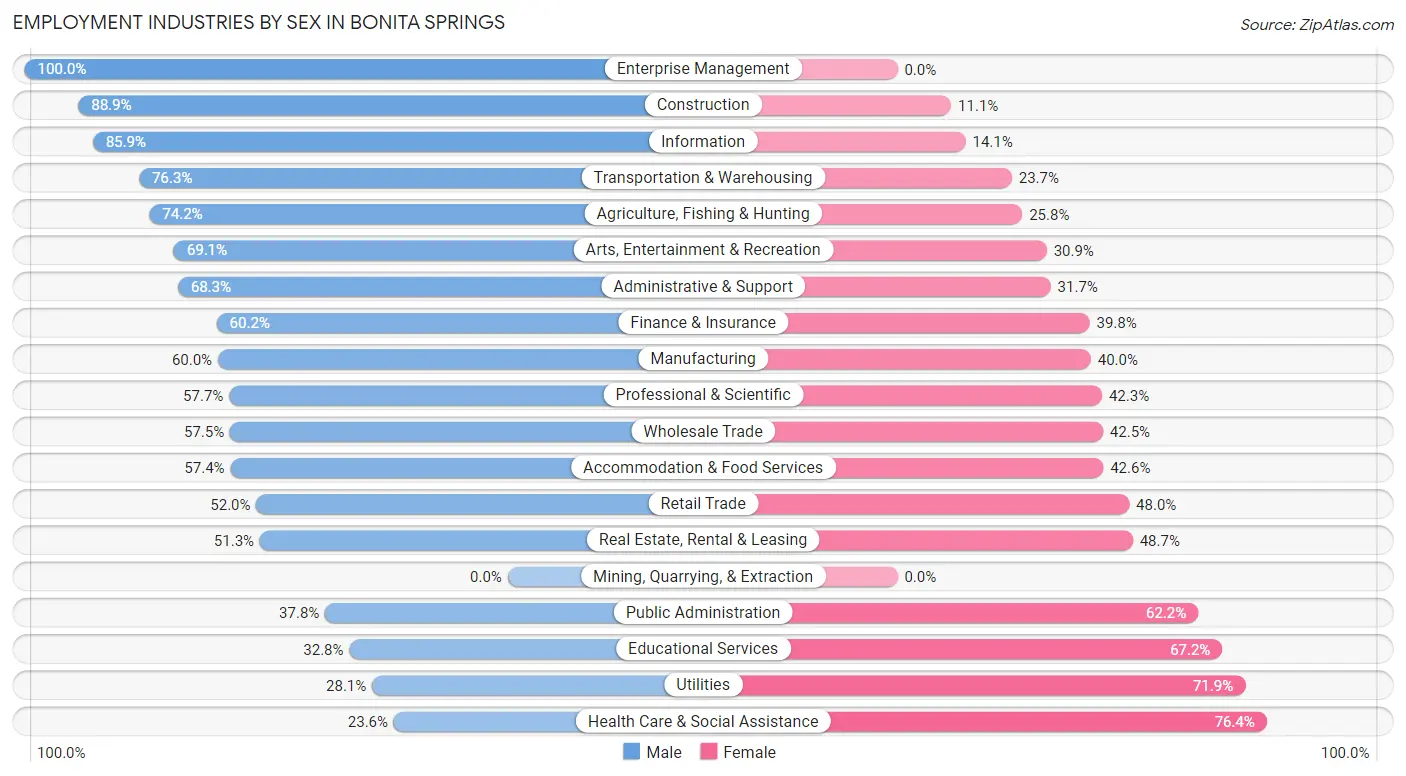
Employment Industries by Sex in Bonita Springs
The Bonita Springs industries that see more men than women are Enterprise Management (100.0%), Construction (88.9%), and Information (85.9%), whereas the industries that tend to have a higher number of women are Health Care & Social Assistance (76.4%), Utilities (71.9%), and Educational Services (67.2%).
| Industry | Male | Female |
| Agriculture, Fishing & Hunting | 66 (74.2%) | 23 (25.8%) |
| Mining, Quarrying, & Extraction | 0 (0.0%) | 0 (0.0%) |
| Construction | 3,158 (88.9%) | 395 (11.1%) |
| Manufacturing | 694 (60.0%) | 463 (40.0%) |
| Wholesale Trade | 227 (57.5%) | 168 (42.5%) |
| Retail Trade | 1,153 (52.0%) | 1,063 (48.0%) |
| Transportation & Warehousing | 493 (76.3%) | 153 (23.7%) |
| Utilities | 16 (28.1%) | 41 (71.9%) |
| Information | 475 (85.9%) | 78 (14.1%) |
| Finance & Insurance | 453 (60.2%) | 299 (39.8%) |
| Real Estate, Rental & Leasing | 398 (51.3%) | 378 (48.7%) |
| Professional & Scientific | 881 (57.7%) | 647 (42.3%) |
| Enterprise Management | 17 (100.0%) | 0 (0.0%) |
| Administrative & Support | 986 (68.3%) | 458 (31.7%) |
| Educational Services | 338 (32.8%) | 693 (67.2%) |
| Health Care & Social Assistance | 542 (23.6%) | 1,758 (76.4%) |
| Arts, Entertainment & Recreation | 691 (69.1%) | 309 (30.9%) |
| Accommodation & Food Services | 1,105 (57.4%) | 820 (42.6%) |
| Public Administration | 181 (37.8%) | 298 (62.2%) |
| Total | 12,254 (59.0%) | 8,512 (41.0%) |
Education in Bonita Springs
School Enrollment in Bonita Springs
The most common levels of schooling among the 6,836 students in Bonita Springs are high school (1,883 | 27.6%), elementary school (1,632 | 23.9%), and college / undergraduate (1,166 | 17.1%).
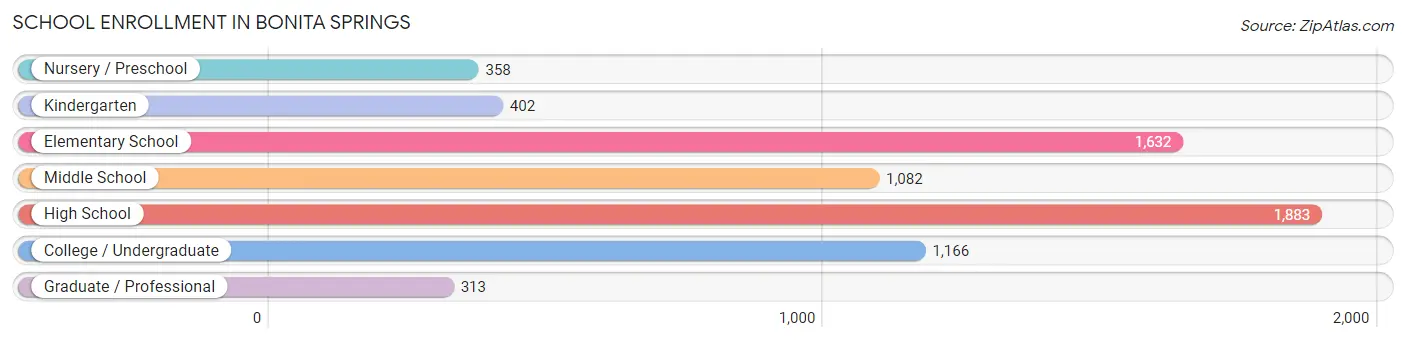
| School Level | # Students | % Students |
| Nursery / Preschool | 358 | 5.2% |
| Kindergarten | 402 | 5.9% |
| Elementary School | 1,632 | 23.9% |
| Middle School | 1,082 | 15.8% |
| High School | 1,883 | 27.6% |
| College / Undergraduate | 1,166 | 17.1% |
| Graduate / Professional | 313 | 4.6% |
| Total | 6,836 | 100.0% |
School Enrollment by Age by Funding Source in Bonita Springs
Out of a total of 6,836 students who are enrolled in schools in Bonita Springs, 1,066 (15.6%) attend a private institution, while the remaining 5,770 (84.4%) are enrolled in public schools. The age group of 3 to 4 year olds has the highest likelihood of being enrolled in private schools, with 104 (51.2% in the age bracket) enrolled. Conversely, the age group of 25 to 34 year olds has the lowest likelihood of being enrolled in a private school, with 319 (95.8% in the age bracket) attending a public institution.
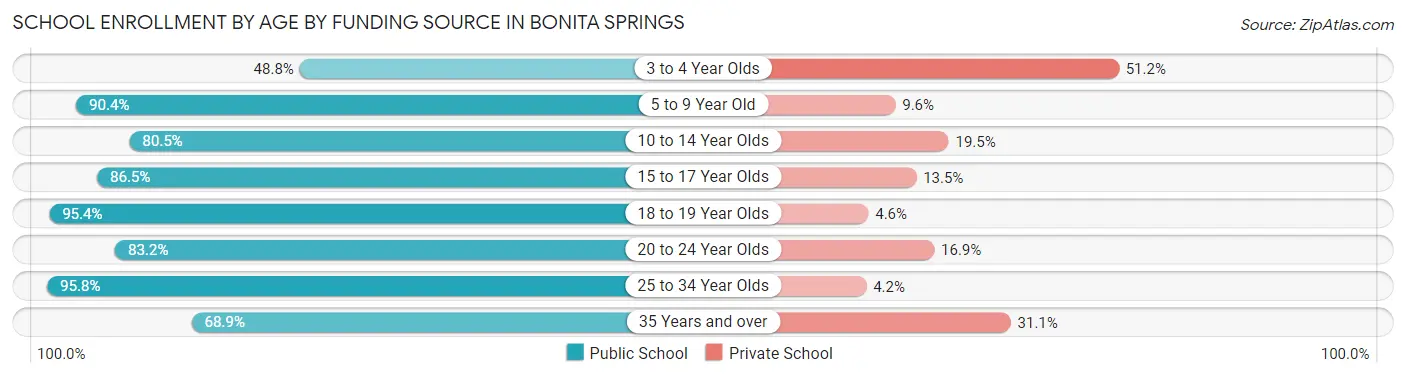
| Age Bracket | Public School | Private School |
| 3 to 4 Year Olds | 99 (48.8%) | 104 (51.2%) |
| 5 to 9 Year Old | 1,665 (90.4%) | 177 (9.6%) |
| 10 to 14 Year Olds | 1,314 (80.5%) | 319 (19.5%) |
| 15 to 17 Year Olds | 967 (86.5%) | 151 (13.5%) |
| 18 to 19 Year Olds | 499 (95.4%) | 24 (4.6%) |
| 20 to 24 Year Olds | 538 (83.2%) | 109 (16.9%) |
| 25 to 34 Year Olds | 319 (95.8%) | 14 (4.2%) |
| 35 Years and over | 370 (68.9%) | 167 (31.1%) |
| Total | 5,770 (84.4%) | 1,066 (15.6%) |
Educational Attainment by Field of Study in Bonita Springs
Business (4,923 | 24.8%), education (3,230 | 16.3%), science & technology (1,817 | 9.2%), engineering (1,393 | 7.0%), and social sciences (1,376 | 6.9%) are the most common fields of study among 19,844 individuals in Bonita Springs who have obtained a bachelor's degree or higher.
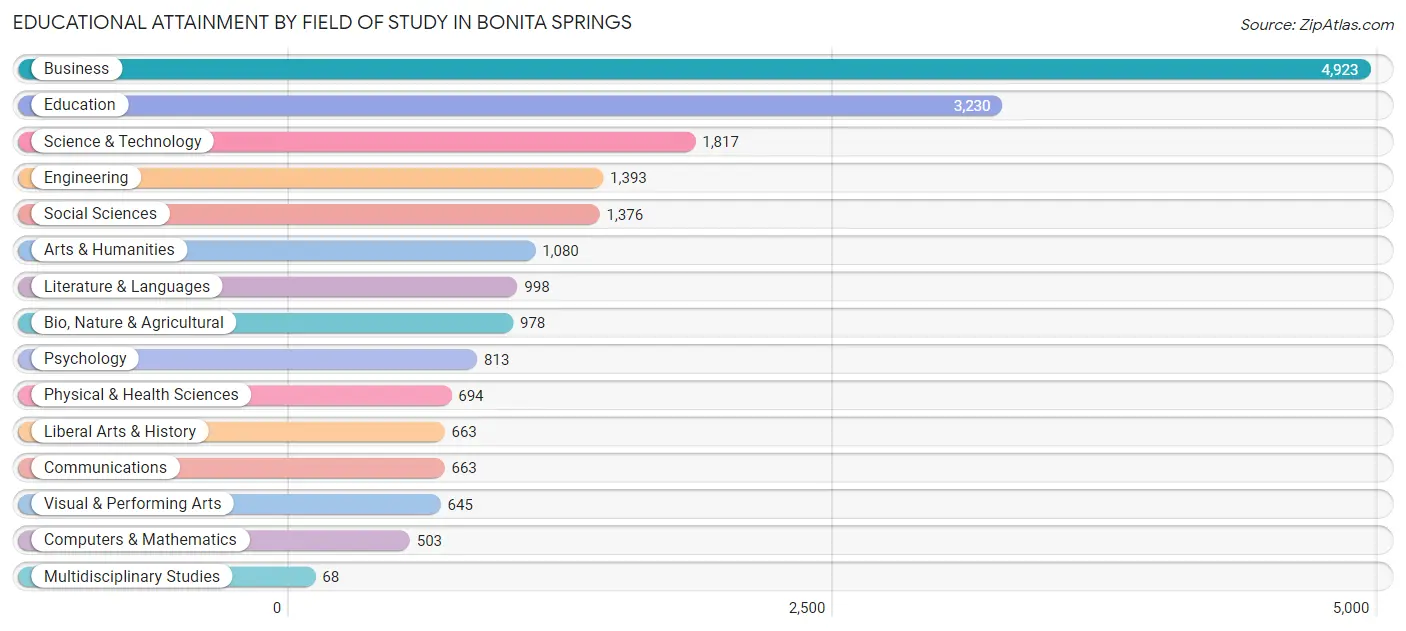
| Field of Study | # Graduates | % Graduates |
| Computers & Mathematics | 503 | 2.5% |
| Bio, Nature & Agricultural | 978 | 4.9% |
| Physical & Health Sciences | 694 | 3.5% |
| Psychology | 813 | 4.1% |
| Social Sciences | 1,376 | 6.9% |
| Engineering | 1,393 | 7.0% |
| Multidisciplinary Studies | 68 | 0.3% |
| Science & Technology | 1,817 | 9.2% |
| Business | 4,923 | 24.8% |
| Education | 3,230 | 16.3% |
| Literature & Languages | 998 | 5.0% |
| Liberal Arts & History | 663 | 3.3% |
| Visual & Performing Arts | 645 | 3.3% |
| Communications | 663 | 3.3% |
| Arts & Humanities | 1,080 | 5.4% |
| Total | 19,844 | 100.0% |
Transportation & Commute in Bonita Springs
Vehicle Availability by Sex in Bonita Springs
The most prevalent vehicle ownership categories in Bonita Springs are males with 2 vehicles (5,495, accounting for 45.6%) and females with 2 vehicles (4,153, making up 65.7%).
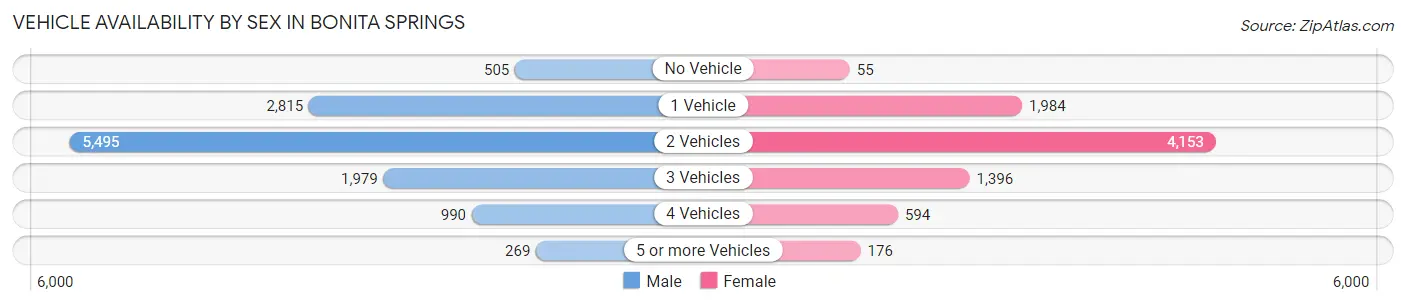
| Vehicles Available | Male | Female |
| No Vehicle | 505 (4.2%) | 55 (0.7%) |
| 1 Vehicle | 2,815 (23.4%) | 1,984 (23.7%) |
| 2 Vehicles | 5,495 (45.6%) | 4,153 (49.7%) |
| 3 Vehicles | 1,979 (16.4%) | 1,396 (16.7%) |
| 4 Vehicles | 990 (8.2%) | 594 (7.1%) |
| 5 or more Vehicles | 269 (2.2%) | 176 (2.1%) |
| Total | 12,053 (100.0%) | 8,358 (100.0%) |
Commute Time in Bonita Springs
The most frequently occuring commute durations in Bonita Springs are 30 to 34 minutes (3,132 commuters, 18.2%), 15 to 19 minutes (2,610 commuters, 15.1%), and 20 to 24 minutes (2,536 commuters, 14.7%).
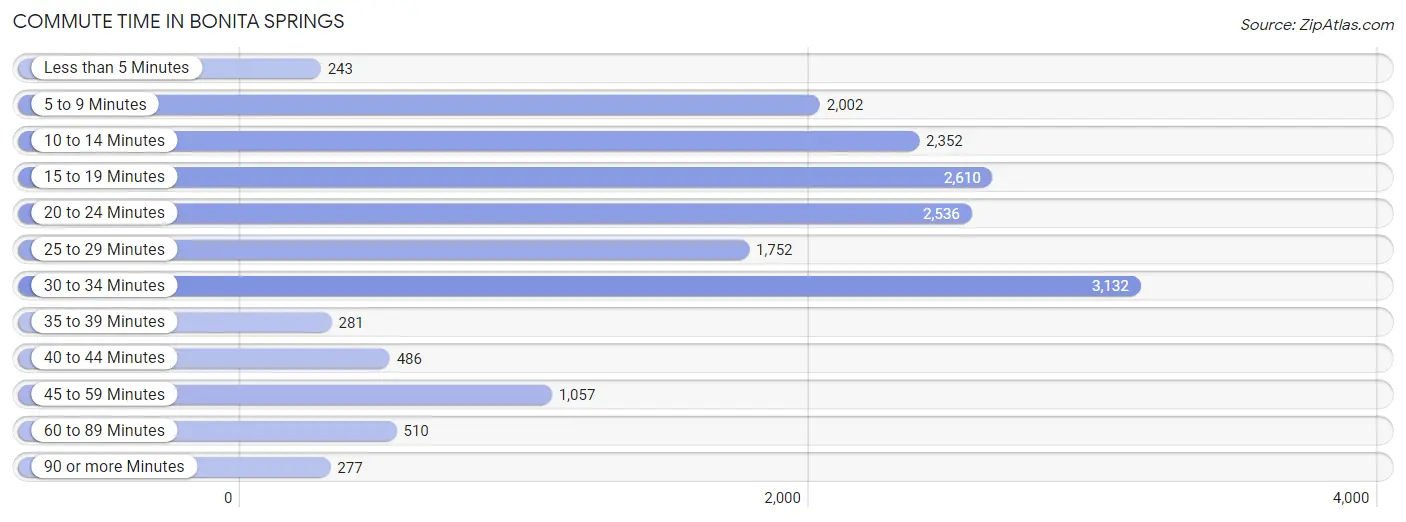
| Commute Time | # Commuters | % Commuters |
| Less than 5 Minutes | 243 | 1.4% |
| 5 to 9 Minutes | 2,002 | 11.6% |
| 10 to 14 Minutes | 2,352 | 13.6% |
| 15 to 19 Minutes | 2,610 | 15.1% |
| 20 to 24 Minutes | 2,536 | 14.7% |
| 25 to 29 Minutes | 1,752 | 10.2% |
| 30 to 34 Minutes | 3,132 | 18.2% |
| 35 to 39 Minutes | 281 | 1.6% |
| 40 to 44 Minutes | 486 | 2.8% |
| 45 to 59 Minutes | 1,057 | 6.1% |
| 60 to 89 Minutes | 510 | 3.0% |
| 90 or more Minutes | 277 | 1.6% |
Commute Time by Sex in Bonita Springs
The most common commute times in Bonita Springs are 30 to 34 minutes (2,065 commuters, 20.3%) for males and 10 to 14 minutes (1,258 commuters, 17.8%) for females.
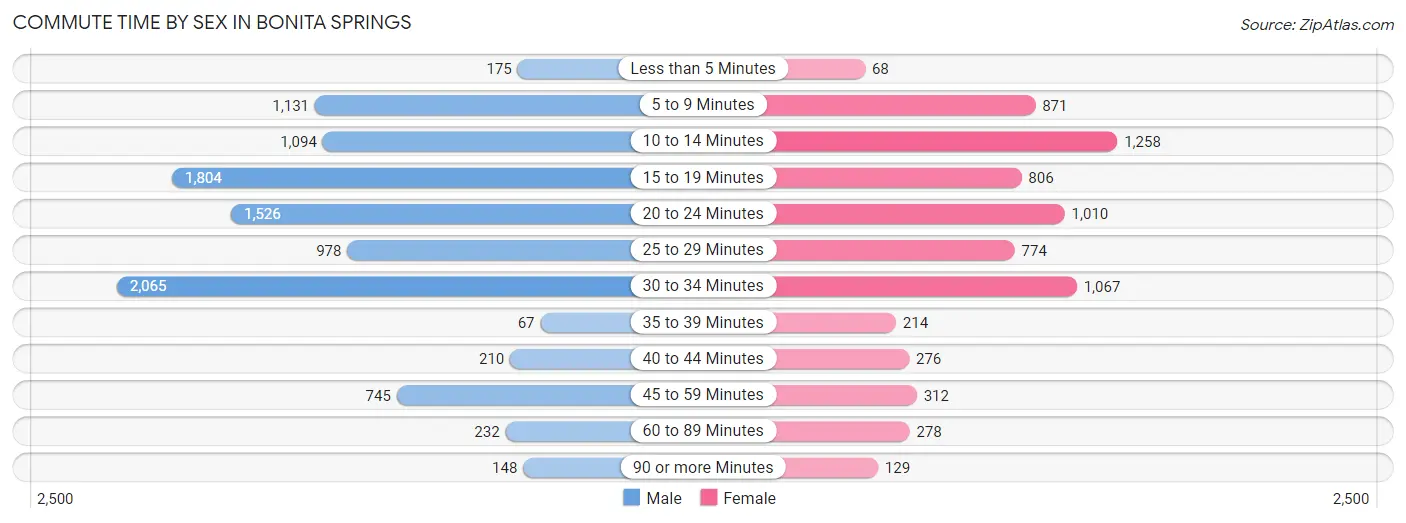
| Commute Time | Male | Female |
| Less than 5 Minutes | 175 (1.7%) | 68 (1.0%) |
| 5 to 9 Minutes | 1,131 (11.1%) | 871 (12.3%) |
| 10 to 14 Minutes | 1,094 (10.7%) | 1,258 (17.8%) |
| 15 to 19 Minutes | 1,804 (17.7%) | 806 (11.4%) |
| 20 to 24 Minutes | 1,526 (15.0%) | 1,010 (14.3%) |
| 25 to 29 Minutes | 978 (9.6%) | 774 (11.0%) |
| 30 to 34 Minutes | 2,065 (20.3%) | 1,067 (15.1%) |
| 35 to 39 Minutes | 67 (0.7%) | 214 (3.0%) |
| 40 to 44 Minutes | 210 (2.1%) | 276 (3.9%) |
| 45 to 59 Minutes | 745 (7.3%) | 312 (4.4%) |
| 60 to 89 Minutes | 232 (2.3%) | 278 (3.9%) |
| 90 or more Minutes | 148 (1.5%) | 129 (1.8%) |
Time of Departure to Work by Sex in Bonita Springs
The most frequent times of departure to work in Bonita Springs are 6:30 AM to 6:59 AM (1,743, 17.1%) for males and 7:30 AM to 7:59 AM (1,325, 18.8%) for females.
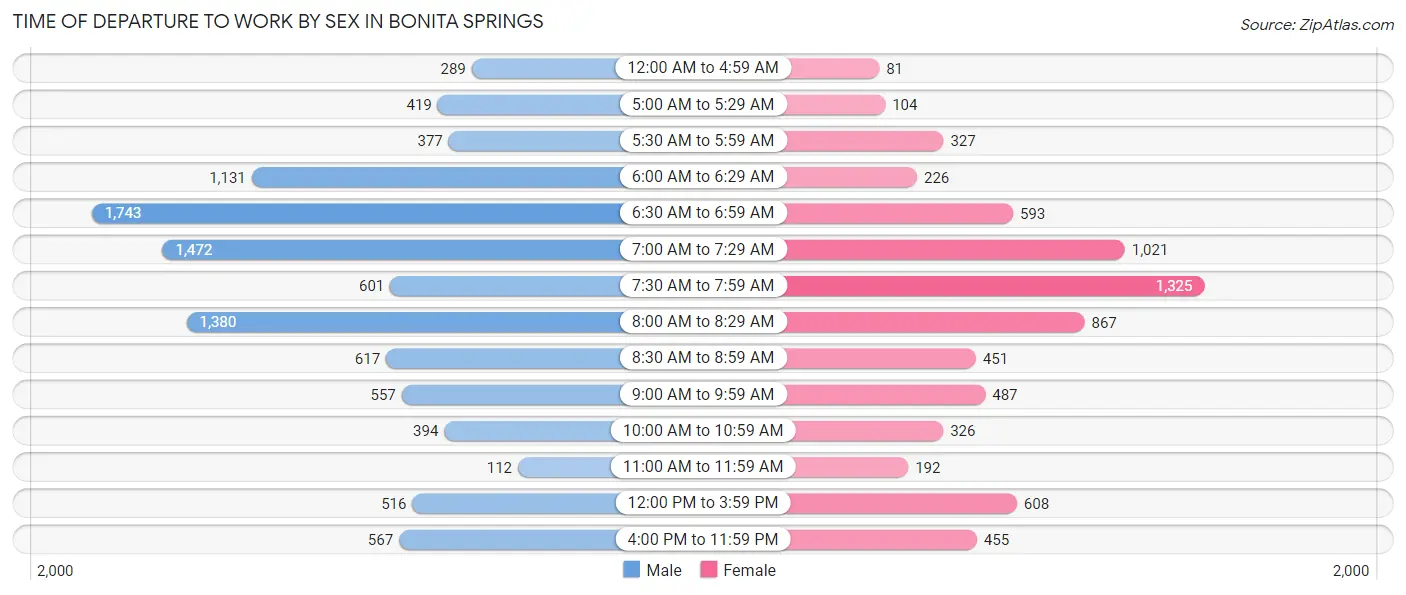
| Time of Departure | Male | Female |
| 12:00 AM to 4:59 AM | 289 (2.8%) | 81 (1.1%) |
| 5:00 AM to 5:29 AM | 419 (4.1%) | 104 (1.5%) |
| 5:30 AM to 5:59 AM | 377 (3.7%) | 327 (4.6%) |
| 6:00 AM to 6:29 AM | 1,131 (11.1%) | 226 (3.2%) |
| 6:30 AM to 6:59 AM | 1,743 (17.1%) | 593 (8.4%) |
| 7:00 AM to 7:29 AM | 1,472 (14.5%) | 1,021 (14.5%) |
| 7:30 AM to 7:59 AM | 601 (5.9%) | 1,325 (18.8%) |
| 8:00 AM to 8:29 AM | 1,380 (13.6%) | 867 (12.3%) |
| 8:30 AM to 8:59 AM | 617 (6.1%) | 451 (6.4%) |
| 9:00 AM to 9:59 AM | 557 (5.5%) | 487 (6.9%) |
| 10:00 AM to 10:59 AM | 394 (3.9%) | 326 (4.6%) |
| 11:00 AM to 11:59 AM | 112 (1.1%) | 192 (2.7%) |
| 12:00 PM to 3:59 PM | 516 (5.1%) | 608 (8.6%) |
| 4:00 PM to 11:59 PM | 567 (5.6%) | 455 (6.4%) |
| Total | 10,175 (100.0%) | 7,063 (100.0%) |
Housing Occupancy in Bonita Springs
Occupancy by Ownership in Bonita Springs
Of the total 23,979 dwellings in Bonita Springs, owner-occupied units account for 19,022 (79.3%), while renter-occupied units make up 4,957 (20.7%).
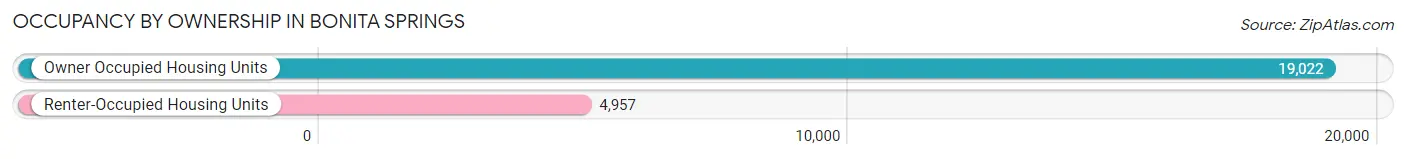
| Occupancy | # Housing Units | % Housing Units |
| Owner Occupied Housing Units | 19,022 | 79.3% |
| Renter-Occupied Housing Units | 4,957 | 20.7% |
| Total Occupied Housing Units | 23,979 | 100.0% |
Occupancy by Household Size in Bonita Springs
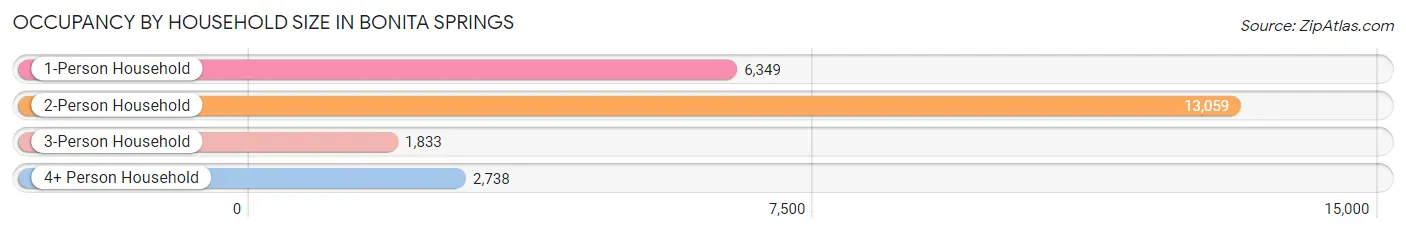
| Household Size | # Housing Units | % Housing Units |
| 1-Person Household | 6,349 | 26.5% |
| 2-Person Household | 13,059 | 54.5% |
| 3-Person Household | 1,833 | 7.6% |
| 4+ Person Household | 2,738 | 11.4% |
| Total Housing Units | 23,979 | 100.0% |
Occupancy by Ownership by Household Size in Bonita Springs
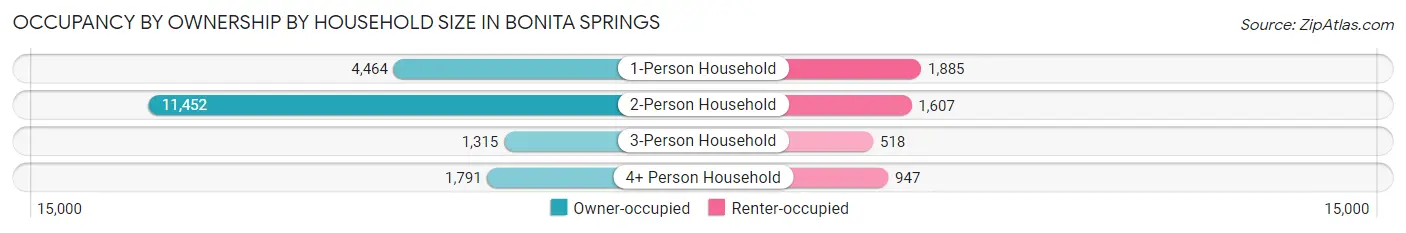
| Household Size | Owner-occupied | Renter-occupied |
| 1-Person Household | 4,464 (70.3%) | 1,885 (29.7%) |
| 2-Person Household | 11,452 (87.7%) | 1,607 (12.3%) |
| 3-Person Household | 1,315 (71.7%) | 518 (28.3%) |
| 4+ Person Household | 1,791 (65.4%) | 947 (34.6%) |
| Total Housing Units | 19,022 (79.3%) | 4,957 (20.7%) |
Occupancy by Educational Attainment in Bonita Springs
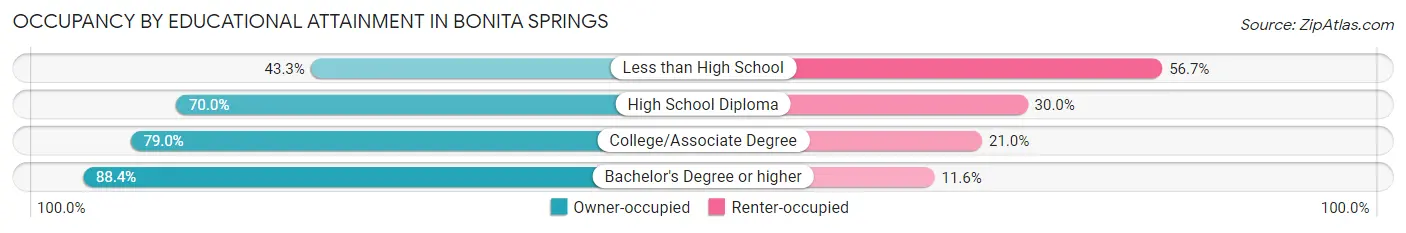
| Household Size | Owner-occupied | Renter-occupied |
| Less than High School | 610 (43.3%) | 799 (56.7%) |
| High School Diploma | 3,369 (70.0%) | 1,445 (30.0%) |
| College/Associate Degree | 5,523 (79.0%) | 1,467 (21.0%) |
| Bachelor's Degree or higher | 9,520 (88.4%) | 1,246 (11.6%) |
Occupancy by Age of Householder in Bonita Springs
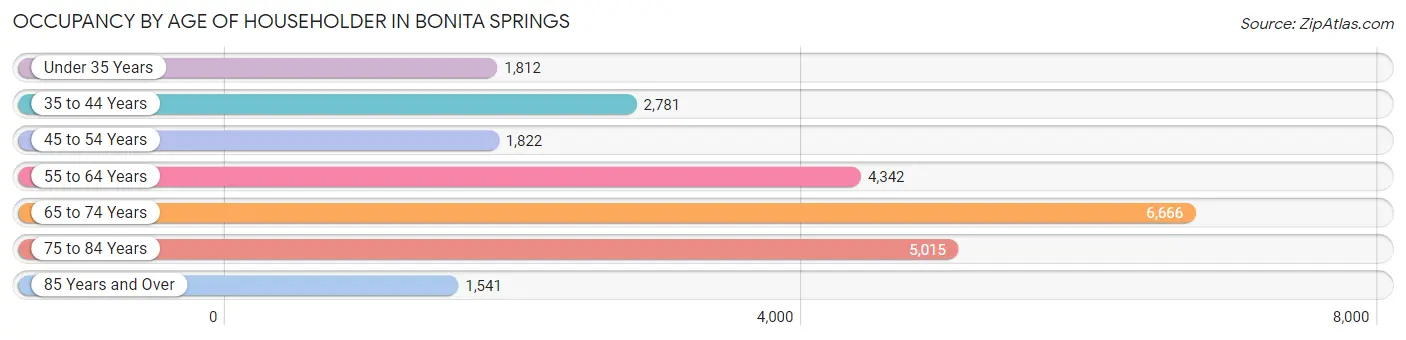
| Age Bracket | # Households | % Households |
| Under 35 Years | 1,812 | 7.6% |
| 35 to 44 Years | 2,781 | 11.6% |
| 45 to 54 Years | 1,822 | 7.6% |
| 55 to 64 Years | 4,342 | 18.1% |
| 65 to 74 Years | 6,666 | 27.8% |
| 75 to 84 Years | 5,015 | 20.9% |
| 85 Years and Over | 1,541 | 6.4% |
| Total | 23,979 | 100.0% |
Housing Finances in Bonita Springs
Median Income by Occupancy in Bonita Springs
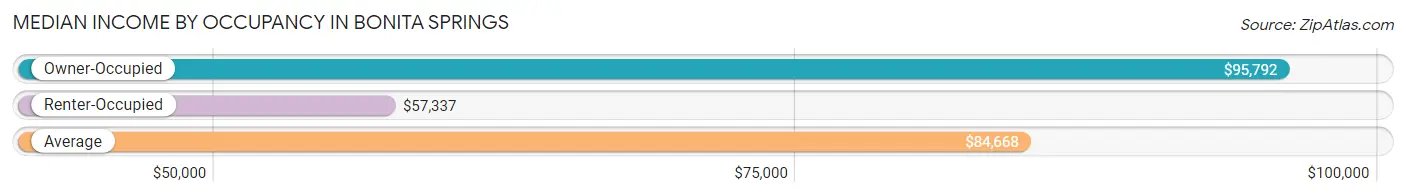
| Occupancy Type | # Households | Median Income |
| Owner-Occupied | 19,022 (79.3%) | $95,792 |
| Renter-Occupied | 4,957 (20.7%) | $57,337 |
| Average | 23,979 (100.0%) | $84,668 |
Occupancy by Householder Income Bracket in Bonita Springs
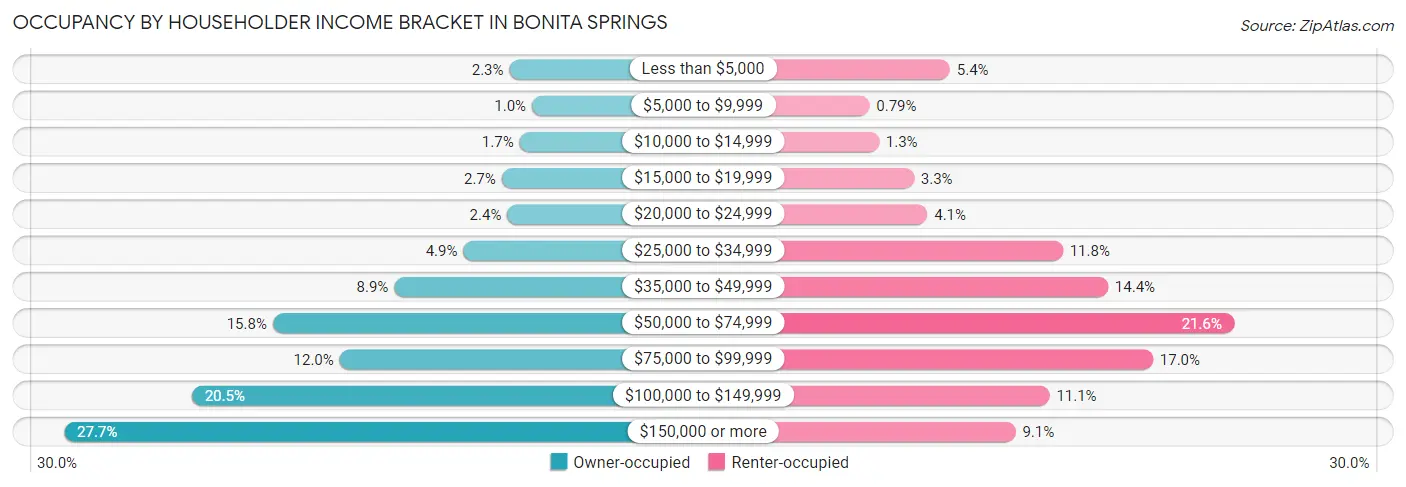
| Income Bracket | Owner-occupied | Renter-occupied |
| Less than $5,000 | 437 (2.3%) | 267 (5.4%) |
| $5,000 to $9,999 | 192 (1.0%) | 39 (0.8%) |
| $10,000 to $14,999 | 327 (1.7%) | 66 (1.3%) |
| $15,000 to $19,999 | 521 (2.7%) | 165 (3.3%) |
| $20,000 to $24,999 | 460 (2.4%) | 203 (4.1%) |
| $25,000 to $34,999 | 937 (4.9%) | 587 (11.8%) |
| $35,000 to $49,999 | 1,690 (8.9%) | 715 (14.4%) |
| $50,000 to $74,999 | 3,009 (15.8%) | 1,071 (21.6%) |
| $75,000 to $99,999 | 2,282 (12.0%) | 842 (17.0%) |
| $100,000 to $149,999 | 3,890 (20.4%) | 549 (11.1%) |
| $150,000 or more | 5,277 (27.7%) | 453 (9.1%) |
| Total | 19,022 (100.0%) | 4,957 (100.0%) |
Monthly Housing Cost Tiers in Bonita Springs
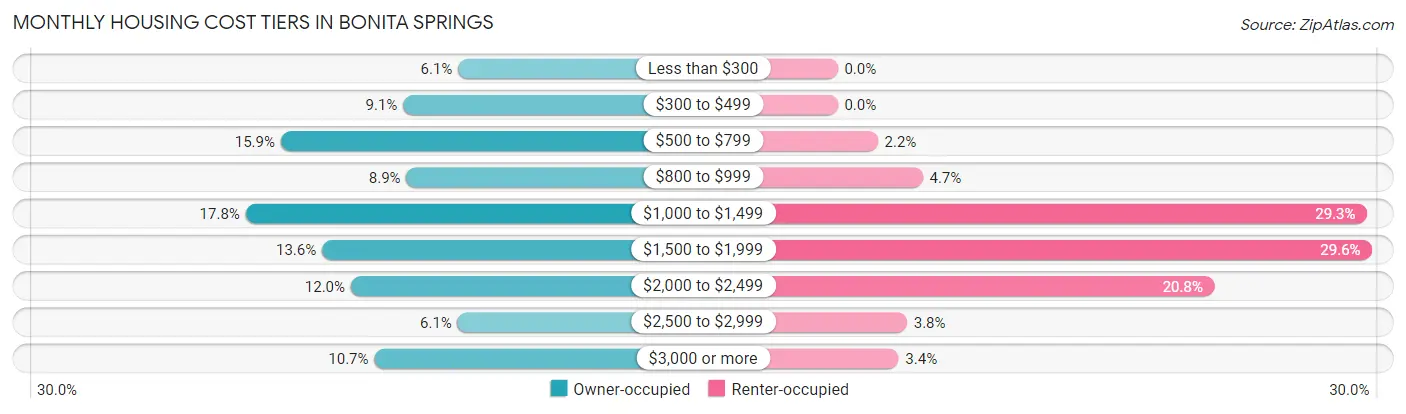
| Monthly Cost | Owner-occupied | Renter-occupied |
| Less than $300 | 1,151 (6.0%) | 0 (0.0%) |
| $300 to $499 | 1,730 (9.1%) | 0 (0.0%) |
| $500 to $799 | 3,015 (15.9%) | 110 (2.2%) |
| $800 to $999 | 1,694 (8.9%) | 233 (4.7%) |
| $1,000 to $1,499 | 3,384 (17.8%) | 1,451 (29.3%) |
| $1,500 to $1,999 | 2,581 (13.6%) | 1,465 (29.5%) |
| $2,000 to $2,499 | 2,278 (12.0%) | 1,033 (20.8%) |
| $2,500 to $2,999 | 1,157 (6.1%) | 190 (3.8%) |
| $3,000 or more | 2,032 (10.7%) | 167 (3.4%) |
| Total | 19,022 (100.0%) | 4,957 (100.0%) |
Physical Housing Characteristics in Bonita Springs
Housing Structures in Bonita Springs
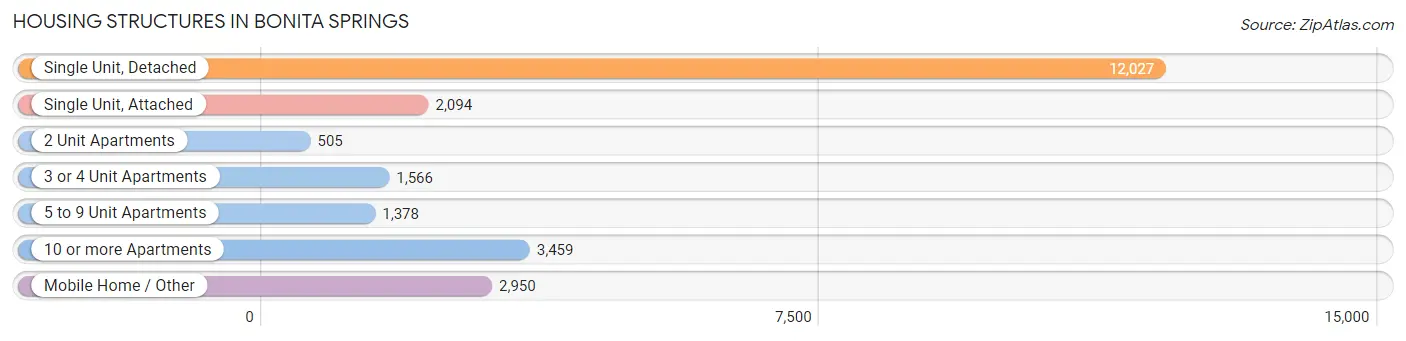
| Structure Type | # Housing Units | % Housing Units |
| Single Unit, Detached | 12,027 | 50.2% |
| Single Unit, Attached | 2,094 | 8.7% |
| 2 Unit Apartments | 505 | 2.1% |
| 3 or 4 Unit Apartments | 1,566 | 6.5% |
| 5 to 9 Unit Apartments | 1,378 | 5.8% |
| 10 or more Apartments | 3,459 | 14.4% |
| Mobile Home / Other | 2,950 | 12.3% |
| Total | 23,979 | 100.0% |
Housing Structures by Occupancy in Bonita Springs
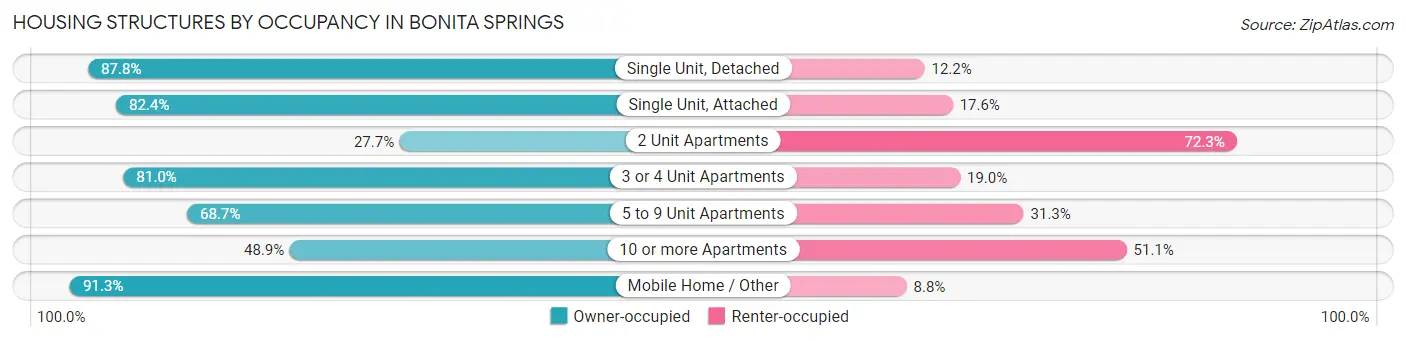
| Structure Type | Owner-occupied | Renter-occupied |
| Single Unit, Detached | 10,559 (87.8%) | 1,468 (12.2%) |
| Single Unit, Attached | 1,725 (82.4%) | 369 (17.6%) |
| 2 Unit Apartments | 140 (27.7%) | 365 (72.3%) |
| 3 or 4 Unit Apartments | 1,268 (81.0%) | 298 (19.0%) |
| 5 to 9 Unit Apartments | 947 (68.7%) | 431 (31.3%) |
| 10 or more Apartments | 1,691 (48.9%) | 1,768 (51.1%) |
| Mobile Home / Other | 2,692 (91.2%) | 258 (8.7%) |
| Total | 19,022 (79.3%) | 4,957 (20.7%) |
Housing Structures by Number of Rooms in Bonita Springs
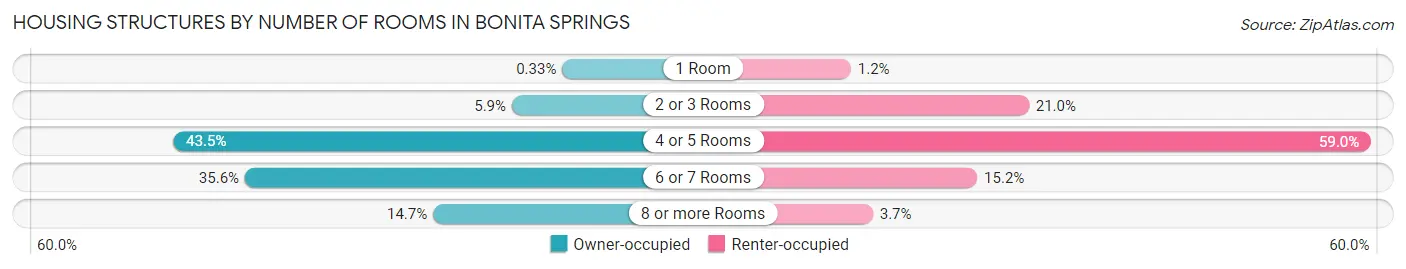
| Number of Rooms | Owner-occupied | Renter-occupied |
| 1 Room | 63 (0.3%) | 60 (1.2%) |
| 2 or 3 Rooms | 1,127 (5.9%) | 1,039 (21.0%) |
| 4 or 5 Rooms | 8,279 (43.5%) | 2,922 (59.0%) |
| 6 or 7 Rooms | 6,763 (35.5%) | 755 (15.2%) |
| 8 or more Rooms | 2,790 (14.7%) | 181 (3.6%) |
| Total | 19,022 (100.0%) | 4,957 (100.0%) |
Housing Structure by Heating Type in Bonita Springs
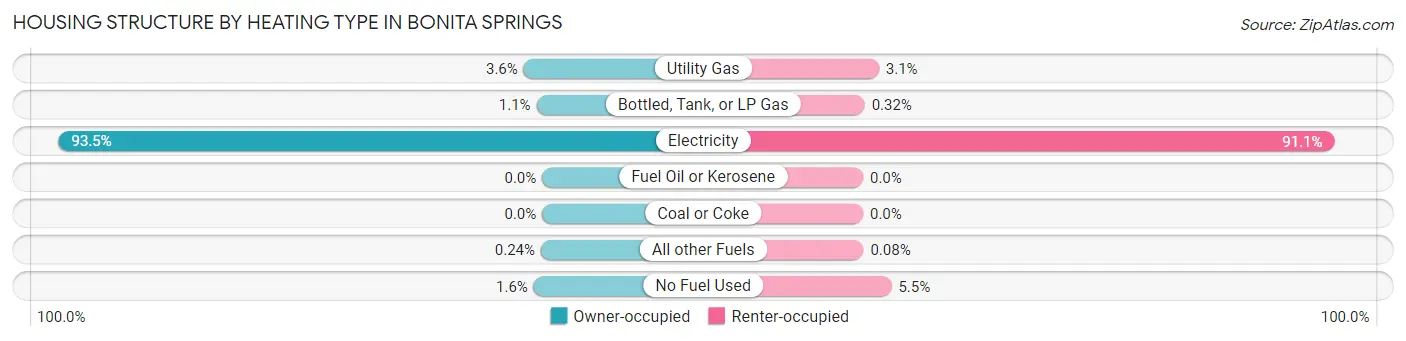
| Heating Type | Owner-occupied | Renter-occupied |
| Utility Gas | 679 (3.6%) | 151 (3.0%) |
| Bottled, Tank, or LP Gas | 207 (1.1%) | 16 (0.3%) |
| Electricity | 17,779 (93.5%) | 4,514 (91.1%) |
| Fuel Oil or Kerosene | 0 (0.0%) | 0 (0.0%) |
| Coal or Coke | 0 (0.0%) | 0 (0.0%) |
| All other Fuels | 46 (0.2%) | 4 (0.1%) |
| No Fuel Used | 311 (1.6%) | 272 (5.5%) |
| Total | 19,022 (100.0%) | 4,957 (100.0%) |
Household Vehicle Usage in Bonita Springs
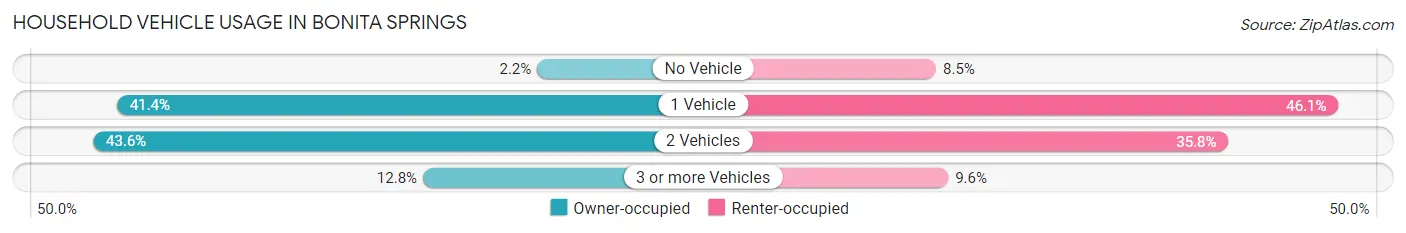
| Vehicles per Household | Owner-occupied | Renter-occupied |
| No Vehicle | 410 (2.2%) | 422 (8.5%) |
| 1 Vehicle | 7,876 (41.4%) | 2,283 (46.1%) |
| 2 Vehicles | 8,297 (43.6%) | 1,774 (35.8%) |
| 3 or more Vehicles | 2,439 (12.8%) | 478 (9.6%) |
| Total | 19,022 (100.0%) | 4,957 (100.0%) |
Real Estate & Mortgages in Bonita Springs
Real Estate and Mortgage Overview in Bonita Springs
| Characteristic | Without Mortgage | With Mortgage |
| Housing Units | 11,291 | 7,731 |
| Median Property Value | $408,800 | $435,600 |
| Median Household Income | $91,351 | $2,011 |
| Monthly Housing Costs | $784 | $1,659 |
| Real Estate Taxes | $3,788 | $146 |
Property Value by Mortgage Status in Bonita Springs
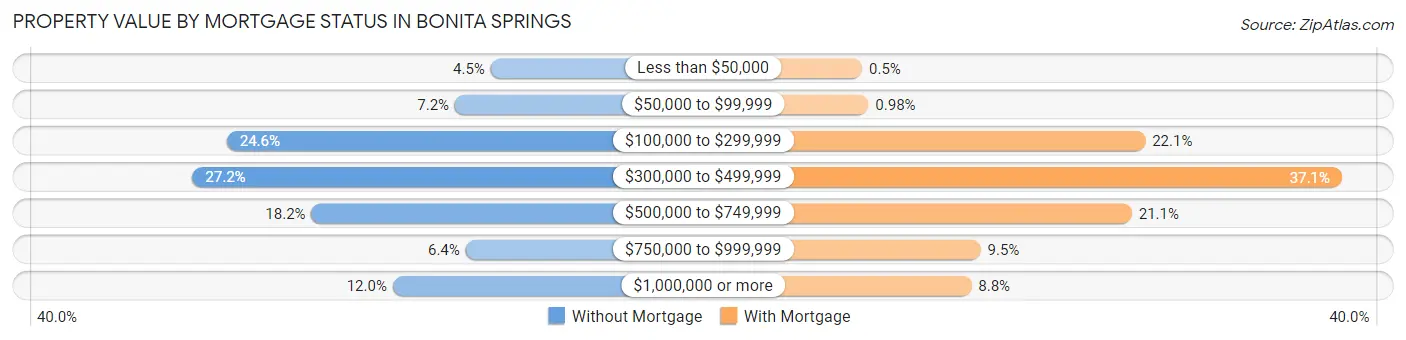
| Property Value | Without Mortgage | With Mortgage |
| Less than $50,000 | 507 (4.5%) | 39 (0.5%) |
| $50,000 to $99,999 | 814 (7.2%) | 76 (1.0%) |
| $100,000 to $299,999 | 2,777 (24.6%) | 1,706 (22.1%) |
| $300,000 to $499,999 | 3,072 (27.2%) | 2,864 (37.0%) |
| $500,000 to $749,999 | 2,049 (18.1%) | 1,627 (21.0%) |
| $750,000 to $999,999 | 723 (6.4%) | 737 (9.5%) |
| $1,000,000 or more | 1,349 (11.9%) | 682 (8.8%) |
| Total | 11,291 (100.0%) | 7,731 (100.0%) |
Household Income by Mortgage Status in Bonita Springs
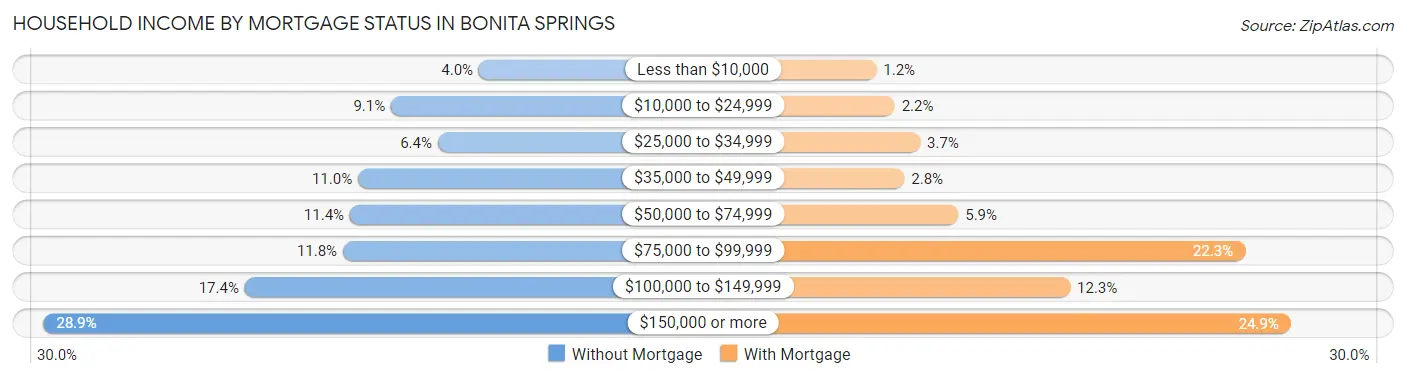
| Household Income | Without Mortgage | With Mortgage |
| Less than $10,000 | 456 (4.0%) | 92 (1.2%) |
| $10,000 to $24,999 | 1,023 (9.1%) | 173 (2.2%) |
| $25,000 to $34,999 | 721 (6.4%) | 285 (3.7%) |
| $35,000 to $49,999 | 1,236 (11.0%) | 216 (2.8%) |
| $50,000 to $74,999 | 1,288 (11.4%) | 454 (5.9%) |
| $75,000 to $99,999 | 1,334 (11.8%) | 1,721 (22.3%) |
| $100,000 to $149,999 | 1,967 (17.4%) | 948 (12.3%) |
| $150,000 or more | 3,266 (28.9%) | 1,923 (24.9%) |
| Total | 11,291 (100.0%) | 7,731 (100.0%) |
Property Value to Household Income Ratio in Bonita Springs
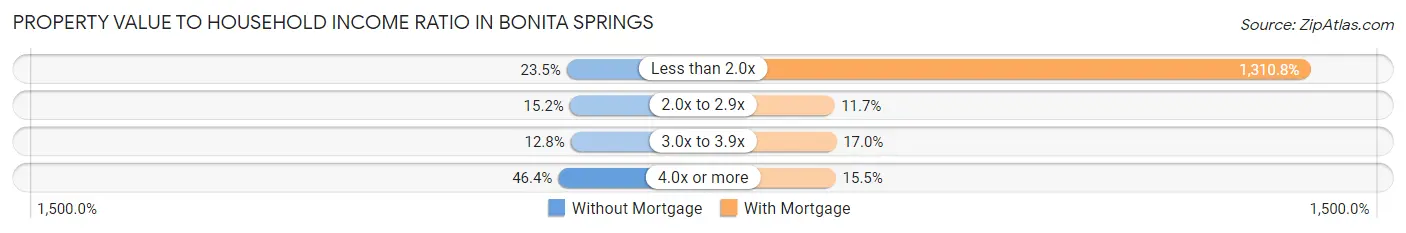
| Value-to-Income Ratio | Without Mortgage | With Mortgage |
| Less than 2.0x | 2,651 (23.5%) | 101,338 (1,310.8%) |
| 2.0x to 2.9x | 1,715 (15.2%) | 904 (11.7%) |
| 3.0x to 3.9x | 1,440 (12.8%) | 1,317 (17.0%) |
| 4.0x or more | 5,237 (46.4%) | 1,195 (15.5%) |
| Total | 11,291 (100.0%) | 7,731 (100.0%) |
Real Estate Taxes by Mortgage Status in Bonita Springs
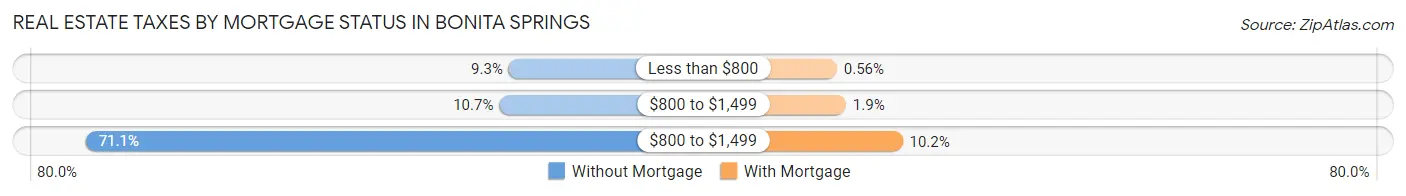
| Property Taxes | Without Mortgage | With Mortgage |
| Less than $800 | 1,045 (9.3%) | 43 (0.6%) |
| $800 to $1,499 | 1,202 (10.6%) | 145 (1.9%) |
| $800 to $1,499 | 8,025 (71.1%) | 785 (10.2%) |
| Total | 11,291 (100.0%) | 7,731 (100.0%) |
Health & Disability in Bonita Springs
Health Insurance Coverage by Age in Bonita Springs
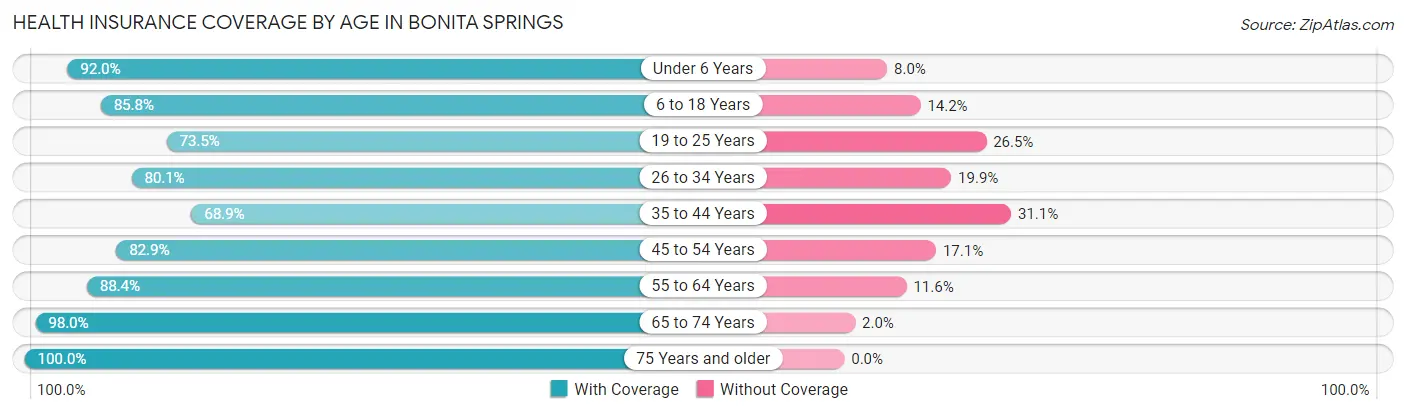
| Age Bracket | With Coverage | Without Coverage |
| Under 6 Years | 1,775 (92.0%) | 154 (8.0%) |
| 6 to 18 Years | 4,307 (85.8%) | 713 (14.2%) |
| 19 to 25 Years | 1,701 (73.5%) | 612 (26.5%) |
| 26 to 34 Years | 3,430 (80.1%) | 854 (19.9%) |
| 35 to 44 Years | 3,496 (68.9%) | 1,578 (31.1%) |
| 45 to 54 Years | 3,660 (82.9%) | 755 (17.1%) |
| 55 to 64 Years | 7,614 (88.4%) | 999 (11.6%) |
| 65 to 74 Years | 11,137 (98.0%) | 229 (2.0%) |
| 75 Years and older | 10,879 (100.0%) | 0 (0.0%) |
| Total | 47,999 (89.1%) | 5,894 (10.9%) |
Health Insurance Coverage by Citizenship Status in Bonita Springs
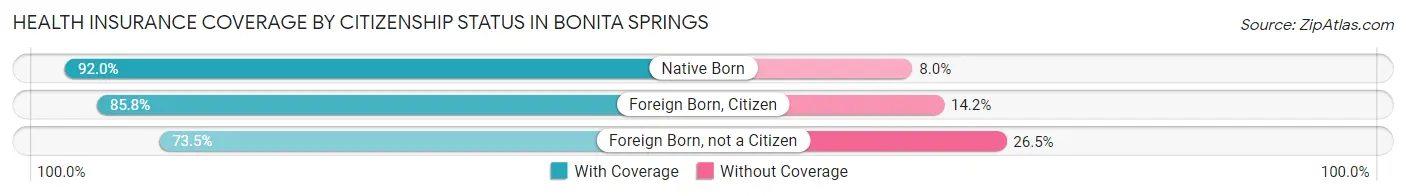
| Citizenship Status | With Coverage | Without Coverage |
| Native Born | 1,775 (92.0%) | 154 (8.0%) |
| Foreign Born, Citizen | 4,307 (85.8%) | 713 (14.2%) |
| Foreign Born, not a Citizen | 1,701 (73.5%) | 612 (26.5%) |
Health Insurance Coverage by Household Income in Bonita Springs
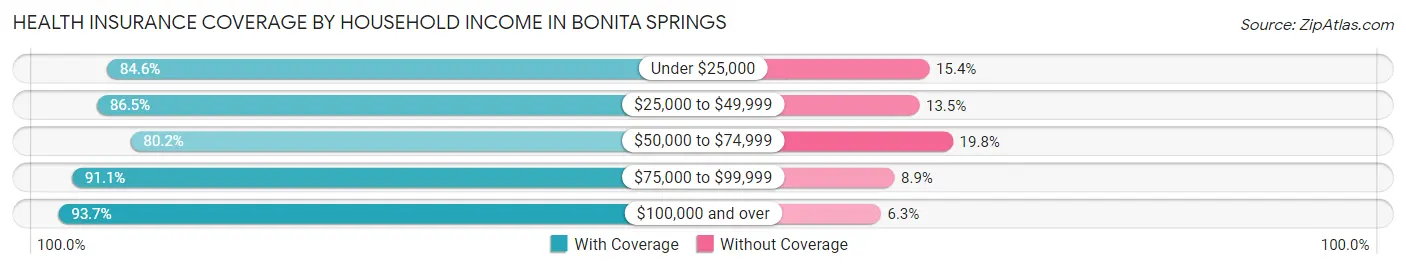
| Household Income | With Coverage | Without Coverage |
| Under $25,000 | 3,277 (84.6%) | 598 (15.4%) |
| $25,000 to $49,999 | 6,437 (86.5%) | 1,008 (13.5%) |
| $50,000 to $74,999 | 8,375 (80.2%) | 2,071 (19.8%) |
| $75,000 to $99,999 | 6,651 (91.1%) | 647 (8.9%) |
| $100,000 and over | 23,247 (93.7%) | 1,568 (6.3%) |
Public vs Private Health Insurance Coverage by Age in Bonita Springs
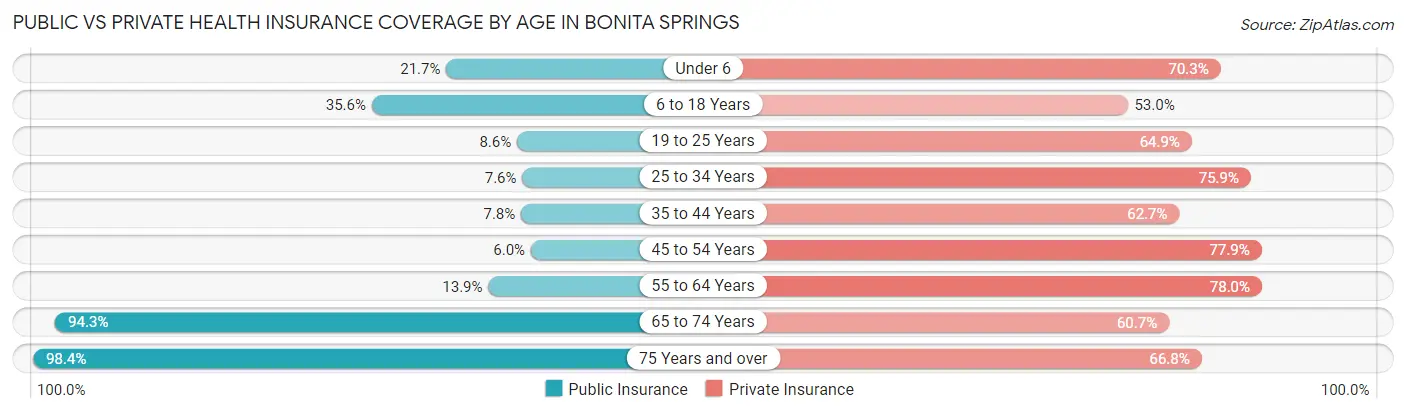
| Age Bracket | Public Insurance | Private Insurance |
| Under 6 | 419 (21.7%) | 1,356 (70.3%) |
| 6 to 18 Years | 1,785 (35.6%) | 2,662 (53.0%) |
| 19 to 25 Years | 199 (8.6%) | 1,502 (64.9%) |
| 25 to 34 Years | 326 (7.6%) | 3,252 (75.9%) |
| 35 to 44 Years | 398 (7.8%) | 3,179 (62.6%) |
| 45 to 54 Years | 266 (6.0%) | 3,440 (77.9%) |
| 55 to 64 Years | 1,199 (13.9%) | 6,715 (78.0%) |
| 65 to 74 Years | 10,722 (94.3%) | 6,902 (60.7%) |
| 75 Years and over | 10,709 (98.4%) | 7,263 (66.8%) |
| Total | 26,023 (48.3%) | 36,271 (67.3%) |
Disability Status by Sex by Age in Bonita Springs
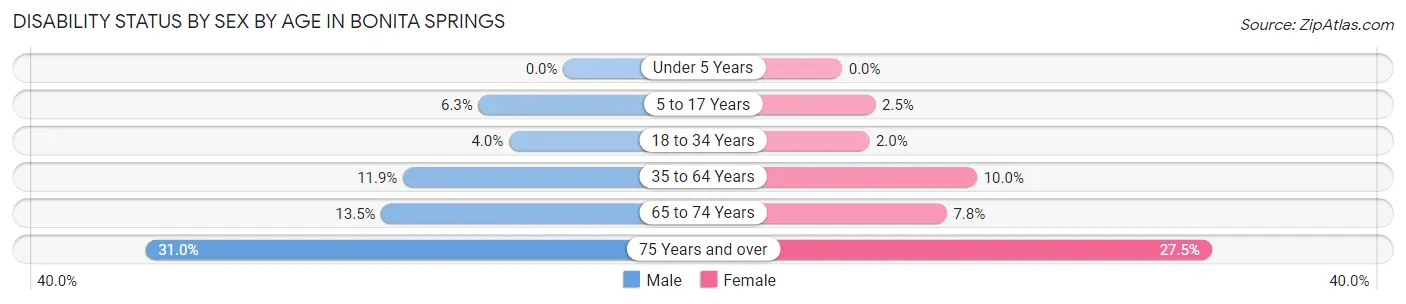
| Age Bracket | Male | Female |
| Under 5 Years | 0 (0.0%) | 0 (0.0%) |
| 5 to 17 Years | 138 (6.3%) | 69 (2.5%) |
| 18 to 34 Years | 158 (4.0%) | 62 (2.0%) |
| 35 to 64 Years | 1,078 (11.9%) | 905 (10.0%) |
| 65 to 74 Years | 717 (13.5%) | 471 (7.8%) |
| 75 Years and over | 1,711 (31.0%) | 1,474 (27.5%) |
Disability Class by Sex by Age in Bonita Springs
Disability Class: Hearing Difficulty
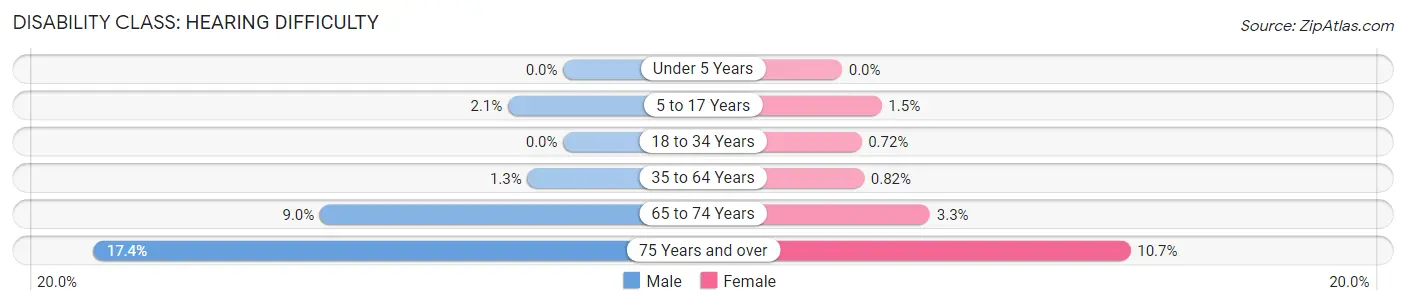
| Age Bracket | Male | Female |
| Under 5 Years | 0 (0.0%) | 0 (0.0%) |
| 5 to 17 Years | 45 (2.1%) | 41 (1.5%) |
| 18 to 34 Years | 0 (0.0%) | 22 (0.7%) |
| 35 to 64 Years | 121 (1.3%) | 74 (0.8%) |
| 65 to 74 Years | 479 (9.0%) | 198 (3.3%) |
| 75 Years and over | 961 (17.4%) | 575 (10.7%) |
Disability Class: Vision Difficulty
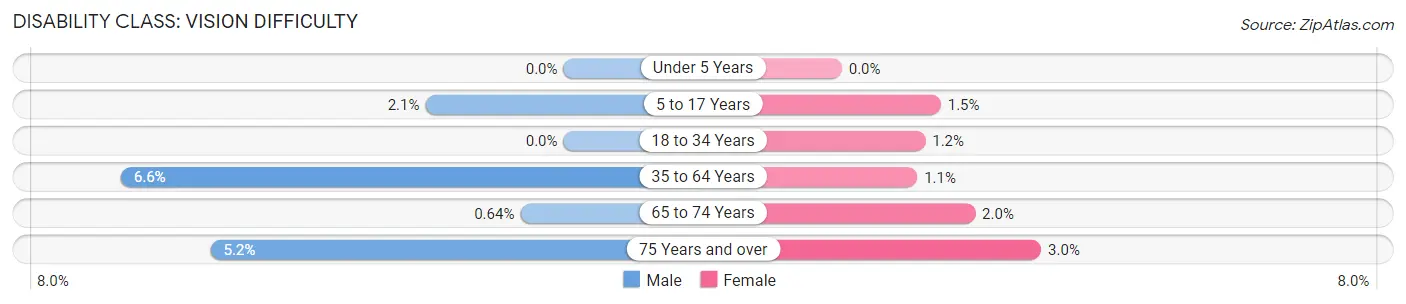
| Age Bracket | Male | Female |
| Under 5 Years | 0 (0.0%) | 0 (0.0%) |
| 5 to 17 Years | 45 (2.1%) | 41 (1.5%) |
| 18 to 34 Years | 0 (0.0%) | 38 (1.2%) |
| 35 to 64 Years | 596 (6.6%) | 101 (1.1%) |
| 65 to 74 Years | 34 (0.6%) | 120 (2.0%) |
| 75 Years and over | 289 (5.2%) | 159 (3.0%) |
Disability Class: Cognitive Difficulty
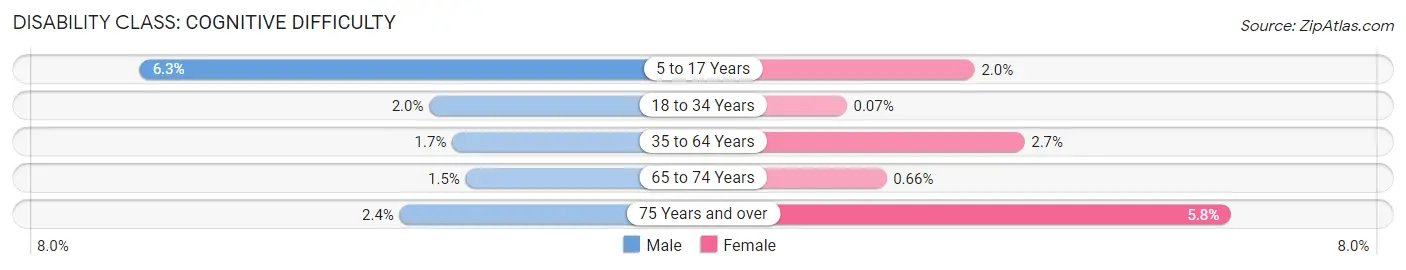
| Age Bracket | Male | Female |
| 5 to 17 Years | 138 (6.3%) | 55 (2.0%) |
| 18 to 34 Years | 78 (2.0%) | 2 (0.1%) |
| 35 to 64 Years | 150 (1.7%) | 245 (2.7%) |
| 65 to 74 Years | 77 (1.5%) | 40 (0.7%) |
| 75 Years and over | 134 (2.4%) | 310 (5.8%) |
Disability Class: Ambulatory Difficulty
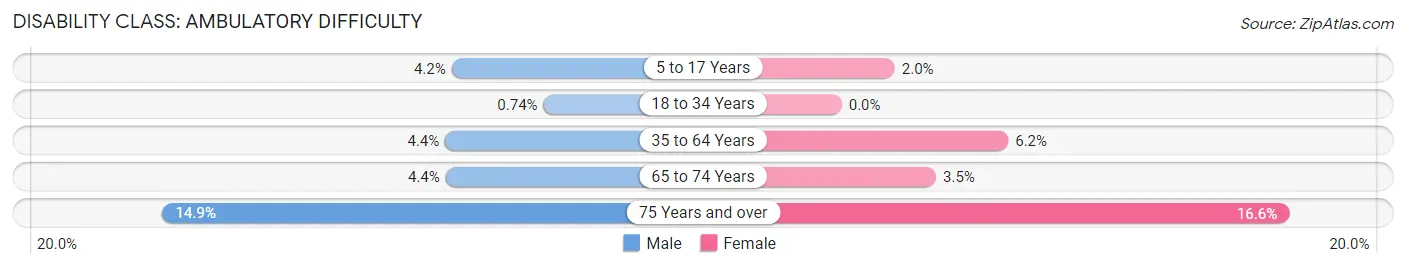
| Age Bracket | Male | Female |
| 5 to 17 Years | 91 (4.2%) | 55 (2.0%) |
| 18 to 34 Years | 29 (0.7%) | 0 (0.0%) |
| 35 to 64 Years | 398 (4.4%) | 558 (6.2%) |
| 65 to 74 Years | 232 (4.4%) | 212 (3.5%) |
| 75 Years and over | 820 (14.9%) | 891 (16.6%) |
Disability Class: Self-Care Difficulty
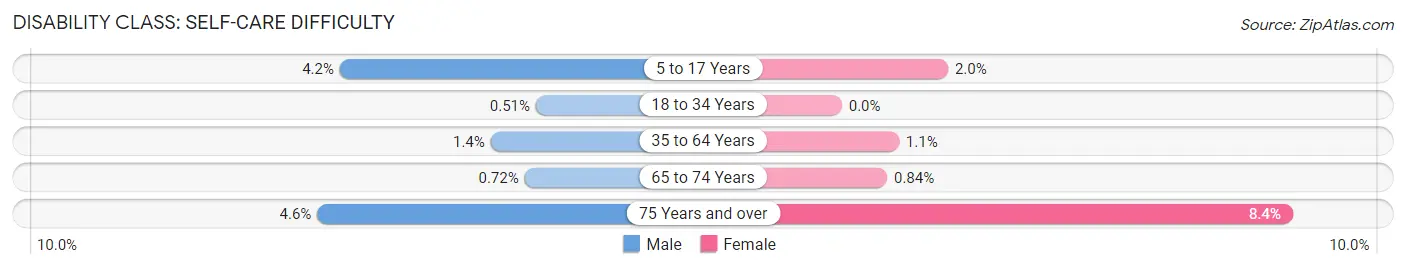
| Age Bracket | Male | Female |
| 5 to 17 Years | 91 (4.2%) | 55 (2.0%) |
| 18 to 34 Years | 20 (0.5%) | 0 (0.0%) |
| 35 to 64 Years | 122 (1.3%) | 96 (1.1%) |
| 65 to 74 Years | 38 (0.7%) | 51 (0.8%) |
| 75 Years and over | 252 (4.6%) | 449 (8.4%) |
Technology Access in Bonita Springs
Computing Device Access in Bonita Springs
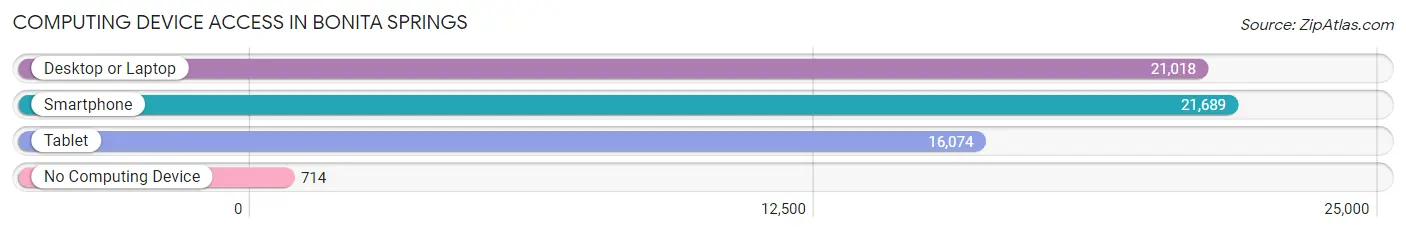
| Device Type | # Households | % Households |
| Desktop or Laptop | 21,018 | 87.6% |
| Smartphone | 21,689 | 90.4% |
| Tablet | 16,074 | 67.0% |
| No Computing Device | 714 | 3.0% |
| Total | 23,979 | 100.0% |
Internet Access in Bonita Springs
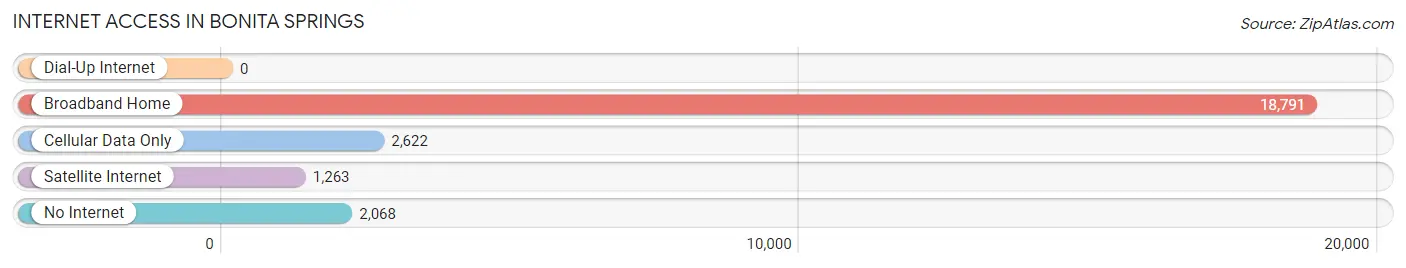
| Internet Type | # Households | % Households |
| Dial-Up Internet | 0 | 0.0% |
| Broadband Home | 18,791 | 78.4% |
| Cellular Data Only | 2,622 | 10.9% |
| Satellite Internet | 1,263 | 5.3% |
| No Internet | 2,068 | 8.6% |
| Total | 23,979 | 100.0% |
Bonita Springs Summary
Bonita Springs is a city located in Lee County, Florida, United States. The population was 43,914 at the 2010 census. It is part of the Cape Coral-Fort Myers, Florida Metropolitan Statistical Area. The city is located on the southwest coast of the state, south of Fort Myers and north of Naples.
History
The area of Bonita Springs was first settled by the Calusa Indians, who were the first inhabitants of the area. The Calusa were a Native American tribe that lived in the area for thousands of years before the arrival of the Europeans. The Calusa were known for their fishing and shellfish gathering skills, and they left behind many artifacts that can still be found in the area today.
In the late 1800s, the area was settled by homesteaders from the north, who were attracted to the area by the abundance of fish and wildlife. The first post office in the area was established in 1895, and the town was officially incorporated in 1950.
Geography
Bonita Springs is located in Lee County, Florida, on the southwest coast of the state. It is located south of Fort Myers and north of Naples. The city is situated on the Gulf of Mexico, and is bordered by the Imperial River to the east and the Estero Bay to the west. The city covers an area of approximately 25 square miles, and has a population of 43,914 as of the 2010 census.
The city is located in a humid subtropical climate zone, with hot, humid summers and mild winters. The average temperature in the summer is around 90 degrees Fahrenheit, and the average temperature in the winter is around 70 degrees Fahrenheit.
Economy
Bonita Springs is a popular tourist destination, and the city's economy is largely based on tourism. The city is home to several resorts and hotels, as well as a variety of restaurants, shops, and other attractions. The city is also home to several corporate headquarters, including Chico's FAS, Inc., and Hertz Corporation.
The city is also home to several manufacturing and technology companies, including Arthrex, Inc., and Gartner, Inc. The city is also home to several medical facilities, including the NCH Healthcare System and the Lee Memorial Health System.
Demographics
As of the 2010 census, the population of Bonita Springs was 43,914. The racial makeup of the city was 87.3% White, 5.2% African American, 0.4% Native American, 2.2% Asian, 0.1% Pacific Islander, 2.3% from other races, and 2.5% from two or more races. Hispanic or Latino of any race were 11.2% of the population.
The median income for a household in the city was $50,945, and the median income for a family was $60,945. The per capita income for the city was $30,945. About 8.2% of families and 10.3% of the population were below the poverty line, including 14.2% of those under age 18 and 5.2% of those age 65 or over.
Common Questions
What is Per Capita Income in Bonita Springs?
Per Capita income in Bonita Springs is $59,284.
What is the Median Family Income in Bonita Springs?
Median Family Income in Bonita Springs is $104,480.
What is the Median Household income in Bonita Springs?
Median Household Income in Bonita Springs is $84,668.
What is Income or Wage Gap in Bonita Springs?
Income or Wage Gap in Bonita Springs is 18.4%.
Women in Bonita Springs earn 81.6 cents for every dollar earned by a man.
What is Family Income Deficit in Bonita Springs?
Family Income Deficit in Bonita Springs is $9,896.
Families that are below poverty line in Bonita Springs earn $9,896 less on average than the poverty threshold level.
What is Inequality or Gini Index in Bonita Springs?
Inequality or Gini Index in Bonita Springs is 0.51.
What is the Total Population of Bonita Springs?
Total Population of Bonita Springs is 53,945.
What is the Total Male Population of Bonita Springs?
Total Male Population of Bonita Springs is 27,007.
What is the Total Female Population of Bonita Springs?
Total Female Population of Bonita Springs is 26,938.
What is the Ratio of Males per 100 Females in Bonita Springs?
There are 100.26 Males per 100 Females in Bonita Springs.
What is the Ratio of Females per 100 Males in Bonita Springs?
There are 99.74 Females per 100 Males in Bonita Springs.
What is the Median Population Age in Bonita Springs?
Median Population Age in Bonita Springs is 60.2 Years.
What is the Average Family Size in Bonita Springs
Average Family Size in Bonita Springs is 2.7 People.
What is the Average Household Size in Bonita Springs
Average Household Size in Bonita Springs is 2.2 People.
How Large is the Labor Force in Bonita Springs?
There are 21,529 People in the Labor Forcein in Bonita Springs.
What is the Percentage of People in the Labor Force in Bonita Springs?
44.8% of People are in the Labor Force in Bonita Springs.
What is the Unemployment Rate in Bonita Springs?
Unemployment Rate in Bonita Springs is 3.6%.