Wright, FL Map & Demographics
Wright Map
Wright Overview
$33,020
PER CAPITA INCOME
$69,356
AVG FAMILY INCOME
$61,256
AVG HOUSEHOLD INCOME
37.3%
WAGE / INCOME GAP [ % ]
62.7¢/ $1
WAGE / INCOME GAP [ $ ]
$8,719
FAMILY INCOME DEFICIT
0.38
INEQUALITY / GINI INDEX
26,272
TOTAL POPULATION
13,183
MALE POPULATION
13,089
FEMALE POPULATION
100.72
MALES / 100 FEMALES
99.29
FEMALES / 100 MALES
36.4
MEDIAN AGE
3.0
AVG FAMILY SIZE
2.3
AVG HOUSEHOLD SIZE
14,857
LABOR FORCE [ PEOPLE ]
68.8%
PERCENT IN LABOR FORCE
3.5%
UNEMPLOYMENT RATE
Income in Wright
Income Overview in Wright
Per Capita Income in Wright is $33,020, while median incomes of families and households are $69,356 and $61,256 respectively.
| Characteristic | Number | Measure |
| Per Capita Income | 26,272 | $33,020 |
| Median Family Income | 6,257 | $69,356 |
| Mean Family Income | 6,257 | $81,854 |
| Median Household Income | 11,296 | $61,256 |
| Mean Household Income | 11,296 | $71,685 |
| Income Deficit | 6,257 | $8,719 |
| Wage / Income Gap (%) | 26,272 | 37.33% |
| Wage / Income Gap ($) | 26,272 | 62.67¢ per $1 |
| Gini / Inequality Index | 26,272 | 0.38 |
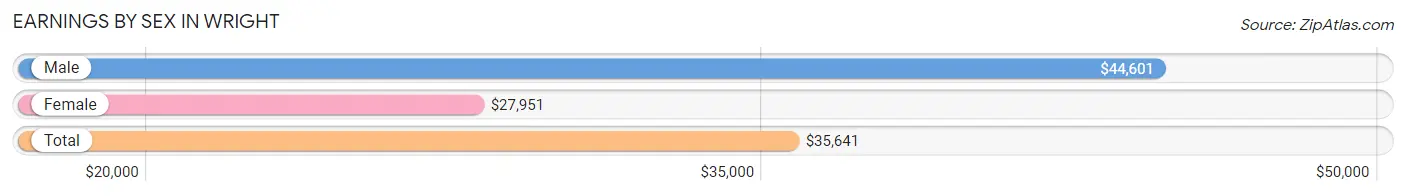
Earnings by Sex in Wright
Average Earnings in Wright are $35,641, $44,601 for men and $27,951 for women, a difference of 37.3%.
| Sex | Number | Average Earnings |
| Male | 8,672 (56.9%) | $44,601 |
| Female | 6,575 (43.1%) | $27,951 |
| Total | 15,247 (100.0%) | $35,641 |
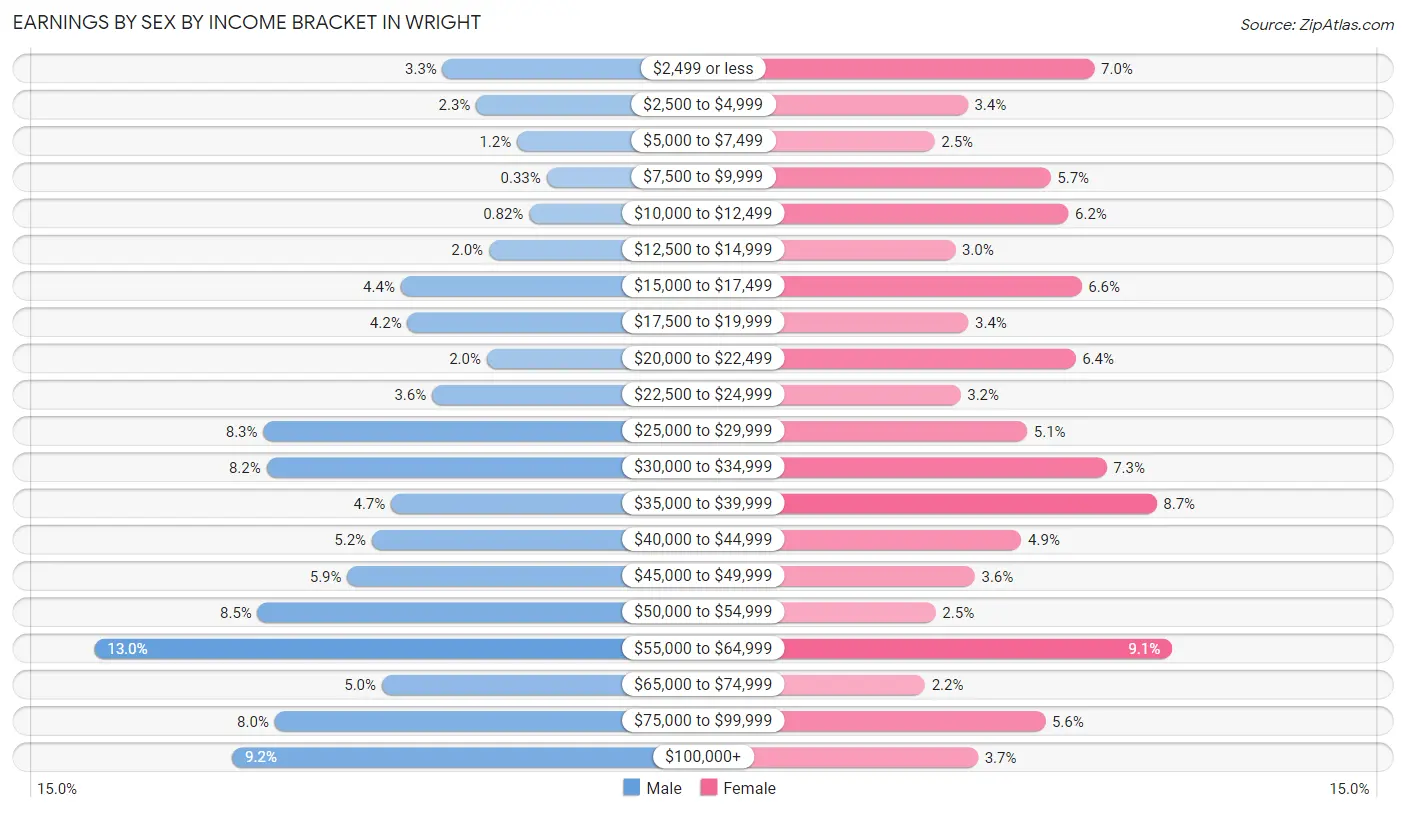
Earnings by Sex by Income Bracket in Wright
The most common earnings brackets in Wright are $55,000 to $64,999 for men (1,131 | 13.0%) and $55,000 to $64,999 for women (601 | 9.1%).
| Income | Male | Female |
| $2,499 or less | 282 (3.3%) | 457 (7.0%) |
| $2,500 to $4,999 | 200 (2.3%) | 223 (3.4%) |
| $5,000 to $7,499 | 101 (1.2%) | 162 (2.5%) |
| $7,500 to $9,999 | 29 (0.3%) | 376 (5.7%) |
| $10,000 to $12,499 | 71 (0.8%) | 409 (6.2%) |
| $12,500 to $14,999 | 169 (1.9%) | 200 (3.0%) |
| $15,000 to $17,499 | 384 (4.4%) | 433 (6.6%) |
| $17,500 to $19,999 | 368 (4.2%) | 224 (3.4%) |
| $20,000 to $22,499 | 174 (2.0%) | 422 (6.4%) |
| $22,500 to $24,999 | 308 (3.5%) | 210 (3.2%) |
| $25,000 to $29,999 | 719 (8.3%) | 333 (5.1%) |
| $30,000 to $34,999 | 711 (8.2%) | 479 (7.3%) |
| $35,000 to $39,999 | 408 (4.7%) | 572 (8.7%) |
| $40,000 to $44,999 | 454 (5.2%) | 322 (4.9%) |
| $45,000 to $49,999 | 514 (5.9%) | 236 (3.6%) |
| $50,000 to $54,999 | 733 (8.5%) | 164 (2.5%) |
| $55,000 to $64,999 | 1,131 (13.0%) | 601 (9.1%) |
| $65,000 to $74,999 | 430 (5.0%) | 144 (2.2%) |
| $75,000 to $99,999 | 691 (8.0%) | 366 (5.6%) |
| $100,000+ | 795 (9.2%) | 242 (3.7%) |
| Total | 8,672 (100.0%) | 6,575 (100.0%) |
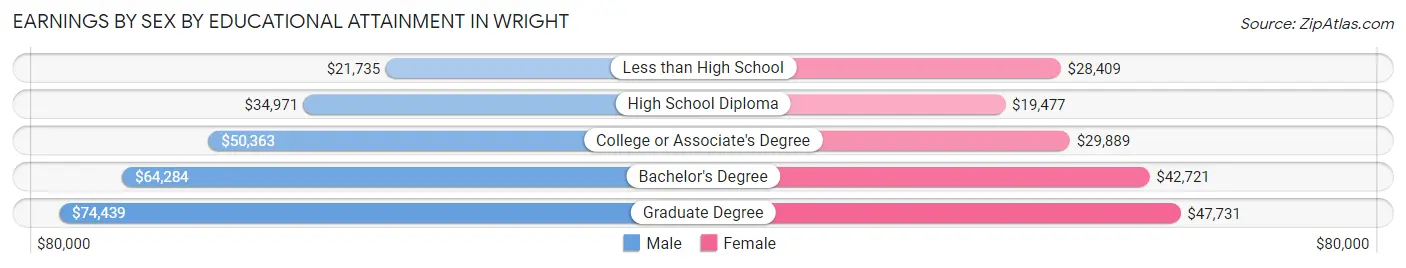
Earnings by Sex by Educational Attainment in Wright
Average earnings in Wright are $46,872 for men and $31,000 for women, a difference of 33.9%. Men with an educational attainment of graduate degree enjoy the highest average annual earnings of $74,439, while those with less than high school education earn the least with $21,735. Women with an educational attainment of graduate degree earn the most with the average annual earnings of $47,731, while those with high school diploma education have the smallest earnings of $19,477.
| Educational Attainment | Male Income | Female Income |
| Less than High School | $21,735 | $28,409 |
| High School Diploma | $34,971 | $19,477 |
| College or Associate's Degree | $50,363 | $29,889 |
| Bachelor's Degree | $64,284 | $42,721 |
| Graduate Degree | $74,439 | $47,731 |
| Total | $46,872 | $31,000 |
Family Income in Wright
Family Income Brackets in Wright
According to the Wright family income data, there are 1,533 families falling into the $50,000 to $74,999 income range, which is the most common income bracket and makes up 24.5% of all families. Conversely, the $10,000 to $14,999 income bracket is the least frequent group with only 150 families (2.4%) belonging to this category.
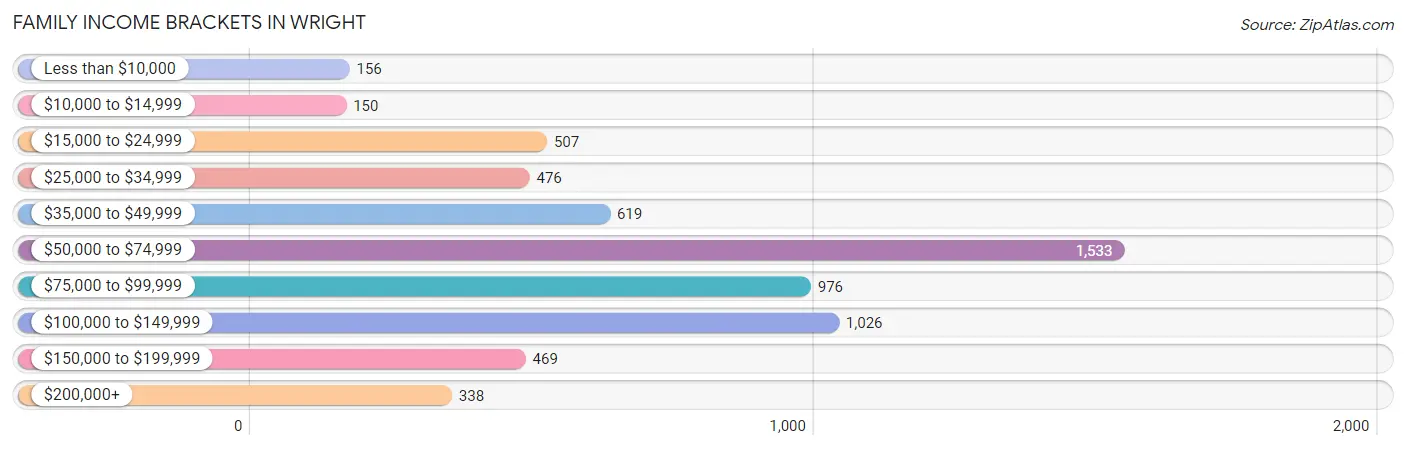
| Income Bracket | # Families | % Families |
| Less than $10,000 | 156 | 2.5% |
| $10,000 to $14,999 | 150 | 2.4% |
| $15,000 to $24,999 | 507 | 8.1% |
| $25,000 to $34,999 | 476 | 7.6% |
| $35,000 to $49,999 | 619 | 9.9% |
| $50,000 to $74,999 | 1,533 | 24.5% |
| $75,000 to $99,999 | 976 | 15.6% |
| $100,000 to $149,999 | 1,026 | 16.4% |
| $150,000 to $199,999 | 469 | 7.5% |
| $200,000+ | 338 | 5.4% |
Family Income by Famaliy Size in Wright
3-person families (1,217 | 19.5%) account for the highest median family income in Wright with $85,938 per family, while 2-person families (3,481 | 55.6%) have the highest median income of $35,291 per family member.
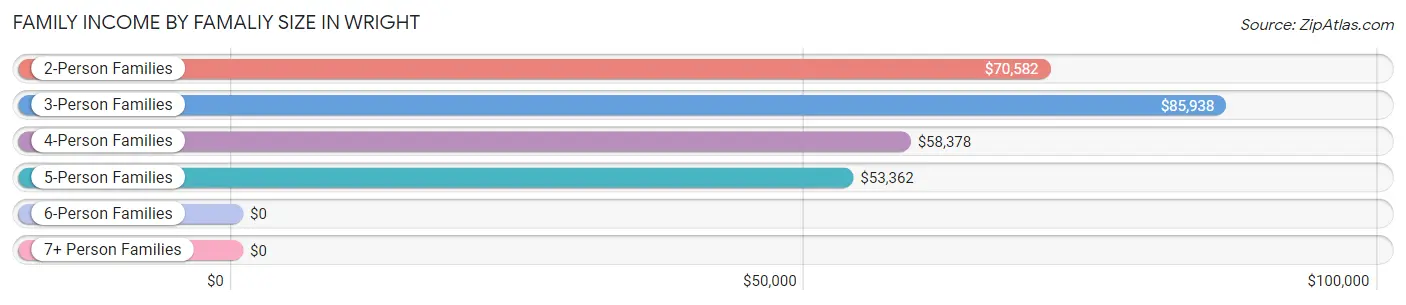
| Income Bracket | # Families | Median Income |
| 2-Person Families | 3,481 (55.6%) | $70,582 |
| 3-Person Families | 1,217 (19.5%) | $85,938 |
| 4-Person Families | 1,123 (17.9%) | $58,378 |
| 5-Person Families | 210 (3.4%) | $53,362 |
| 6-Person Families | 173 (2.8%) | $0 |
| 7+ Person Families | 53 (0.9%) | $0 |
| Total | 6,257 (100.0%) | $69,356 |
Family Income by Number of Earners in Wright
The median family income in Wright is $69,356, with families comprising 3+ earners (478) having the highest median family income of $91,563, while families with 1 earner (2,285) have the lowest median family income of $44,729, accounting for 7.6% and 36.5% of families, respectively.
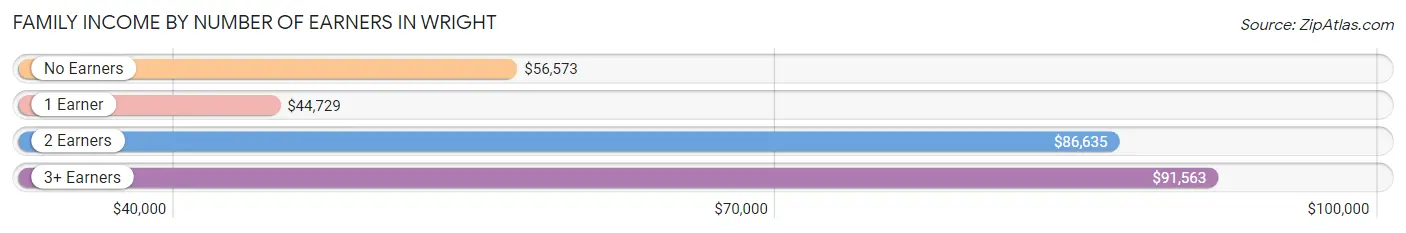
| Number of Earners | # Families | Median Income |
| No Earners | 883 (14.1%) | $56,573 |
| 1 Earner | 2,285 (36.5%) | $44,729 |
| 2 Earners | 2,611 (41.7%) | $86,635 |
| 3+ Earners | 478 (7.6%) | $91,563 |
| Total | 6,257 (100.0%) | $69,356 |
Household Income in Wright
Household Income Brackets in Wright
With 2,722 households falling in the category, the $50,000 to $74,999 income range is the most frequent in Wright, accounting for 24.1% of all households. In contrast, only 395 households (3.5%) fall into the $200,000+ income bracket, making it the least populous group.
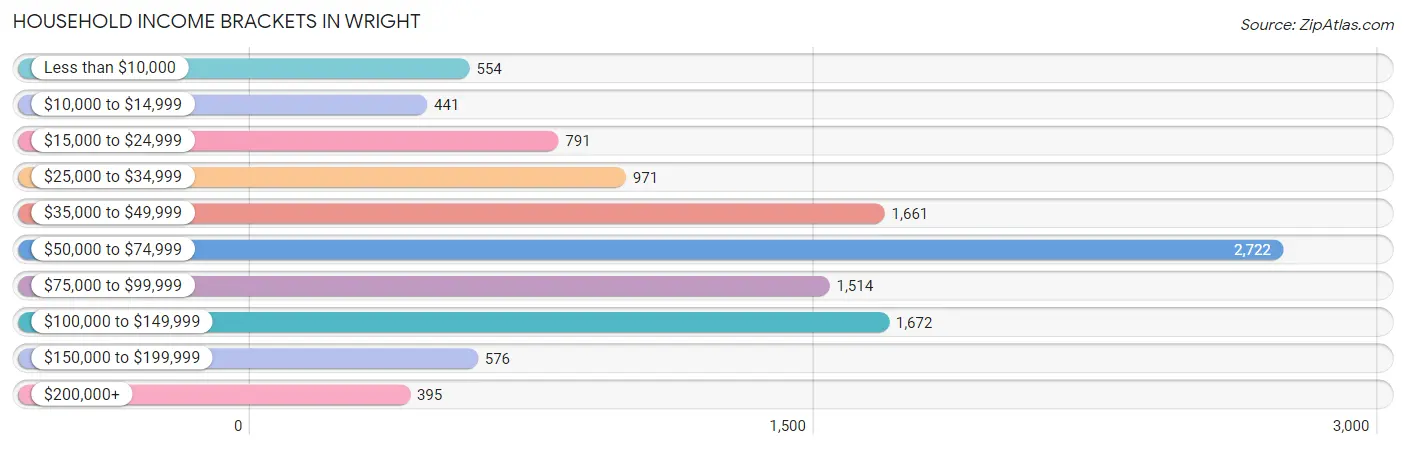
| Income Bracket | # Households | % Households |
| Less than $10,000 | 554 | 4.9% |
| $10,000 to $14,999 | 441 | 3.9% |
| $15,000 to $24,999 | 791 | 7.0% |
| $25,000 to $34,999 | 971 | 8.6% |
| $35,000 to $49,999 | 1,661 | 14.7% |
| $50,000 to $74,999 | 2,722 | 24.1% |
| $75,000 to $99,999 | 1,514 | 13.4% |
| $100,000 to $149,999 | 1,672 | 14.8% |
| $150,000 to $199,999 | 576 | 5.1% |
| $200,000+ | 395 | 3.5% |
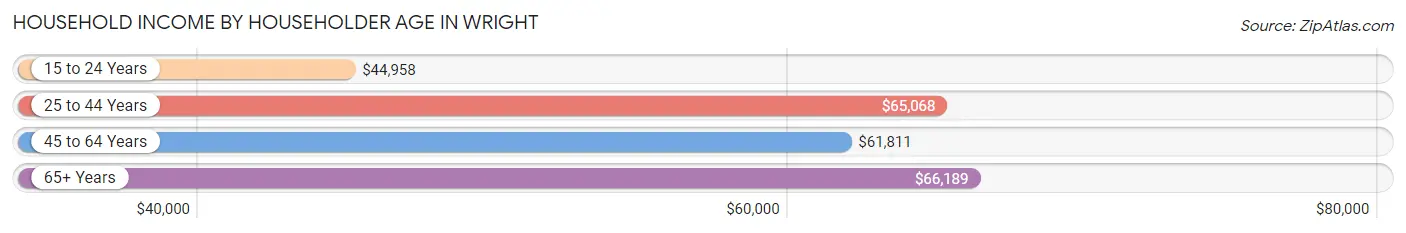
Household Income by Householder Age in Wright
The median household income in Wright is $61,256, with the highest median household income of $66,189 found in the 65+ years age bracket for the primary householder. A total of 2,432 households (21.5%) fall into this category. Meanwhile, the 15 to 24 years age bracket for the primary householder has the lowest median household income of $44,958, with 1,036 households (9.2%) in this group.
| Income Bracket | # Households | Median Income |
| 15 to 24 Years | 1,036 (9.2%) | $44,958 |
| 25 to 44 Years | 4,323 (38.3%) | $65,068 |
| 45 to 64 Years | 3,505 (31.0%) | $61,811 |
| 65+ Years | 2,432 (21.5%) | $66,189 |
| Total | 11,296 (100.0%) | $61,256 |
Poverty in Wright
Income Below Poverty by Sex and Age in Wright
With 14.6% poverty level for males and 20.3% for females among the residents of Wright, 5 year old males and 5 year old females are the most vulnerable to poverty, with 23 males (51.1%) and 163 females (73.8%) in their respective age groups living below the poverty level.
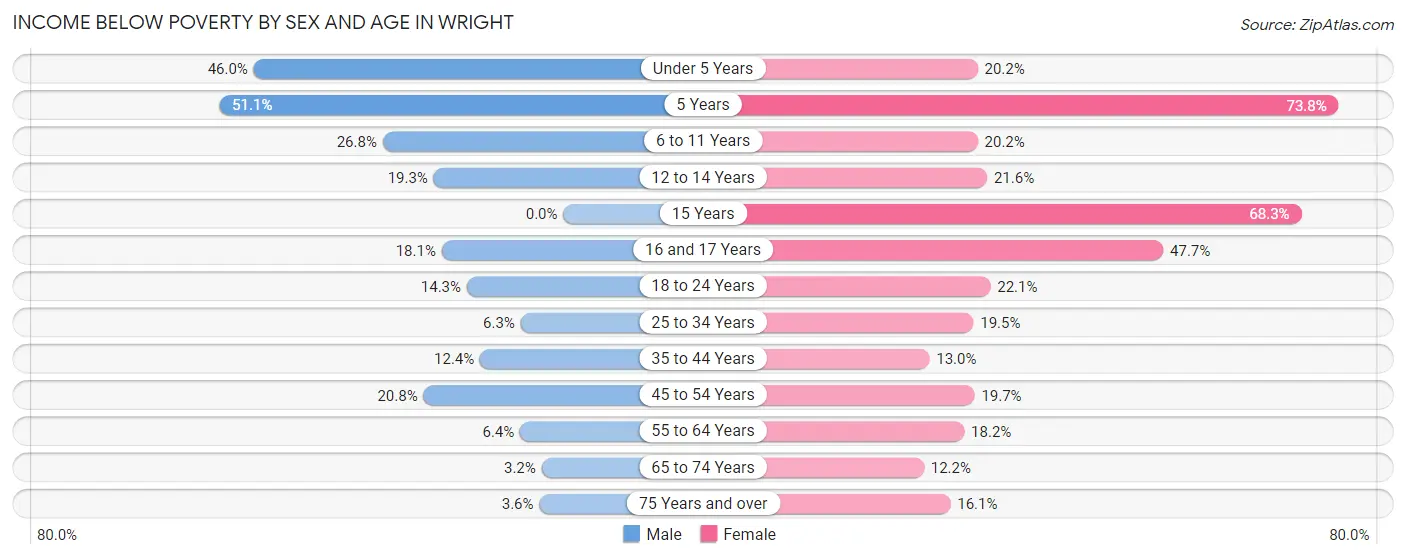
| Age Bracket | Male | Female |
| Under 5 Years | 555 (46.0%) | 151 (20.2%) |
| 5 Years | 23 (51.1%) | 163 (73.8%) |
| 6 to 11 Years | 199 (26.8%) | 185 (20.2%) |
| 12 to 14 Years | 41 (19.3%) | 58 (21.6%) |
| 15 Years | 0 (0.0%) | 144 (68.2%) |
| 16 and 17 Years | 54 (18.1%) | 146 (47.7%) |
| 18 to 24 Years | 173 (14.3%) | 234 (22.1%) |
| 25 to 34 Years | 172 (6.3%) | 399 (19.5%) |
| 35 to 44 Years | 249 (12.4%) | 225 (13.0%) |
| 45 to 54 Years | 291 (20.8%) | 315 (19.7%) |
| 55 to 64 Years | 101 (6.4%) | 288 (18.2%) |
| 65 to 74 Years | 38 (3.2%) | 136 (12.2%) |
| 75 Years and over | 16 (3.6%) | 175 (16.1%) |
| Total | 1,912 (14.6%) | 2,619 (20.3%) |
Income Above Poverty by Sex and Age in Wright
According to the poverty statistics in Wright, males aged 15 years and females aged 65 to 74 years are the age groups that are most secure financially, with 100.0% of males and 87.8% of females in these age groups living above the poverty line.
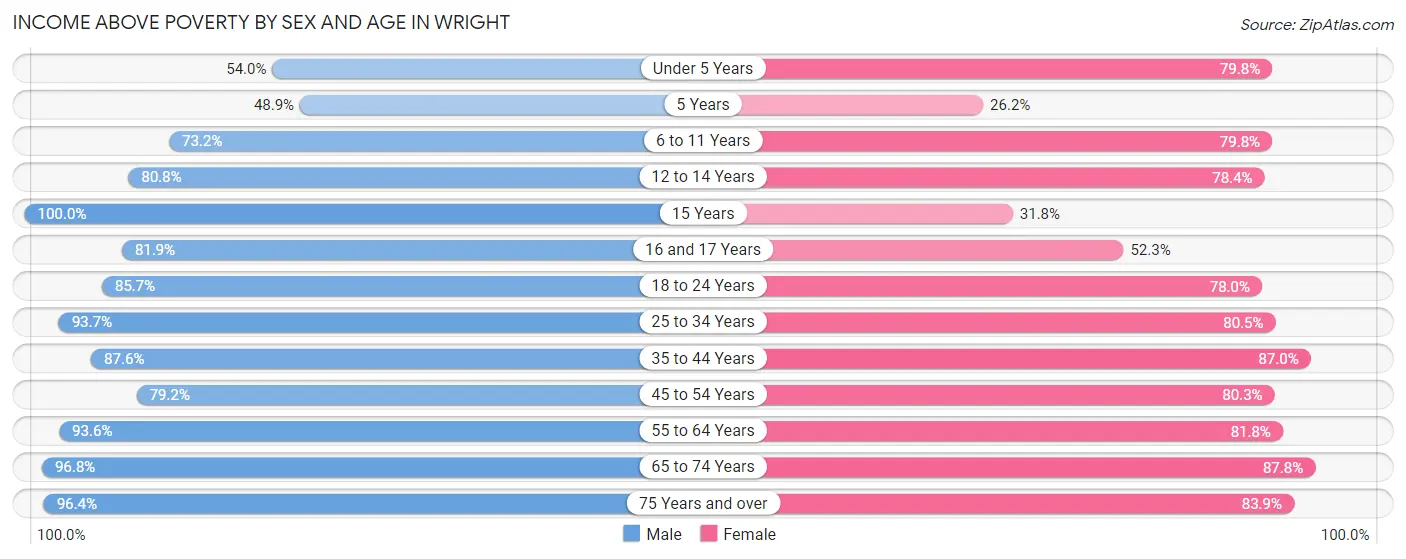
| Age Bracket | Male | Female |
| Under 5 Years | 652 (54.0%) | 598 (79.8%) |
| 5 Years | 22 (48.9%) | 58 (26.2%) |
| 6 to 11 Years | 543 (73.2%) | 732 (79.8%) |
| 12 to 14 Years | 172 (80.7%) | 211 (78.4%) |
| 15 Years | 36 (100.0%) | 67 (31.8%) |
| 16 and 17 Years | 245 (81.9%) | 160 (52.3%) |
| 18 to 24 Years | 1,034 (85.7%) | 827 (77.9%) |
| 25 to 34 Years | 2,542 (93.7%) | 1,644 (80.5%) |
| 35 to 44 Years | 1,765 (87.6%) | 1,507 (87.0%) |
| 45 to 54 Years | 1,110 (79.2%) | 1,284 (80.3%) |
| 55 to 64 Years | 1,473 (93.6%) | 1,297 (81.8%) |
| 65 to 74 Years | 1,138 (96.8%) | 981 (87.8%) |
| 75 Years and over | 434 (96.4%) | 911 (83.9%) |
| Total | 11,166 (85.4%) | 10,277 (79.7%) |
Income Below Poverty Among Married-Couple Families in Wright
The poverty statistics for married-couple families in Wright show that 5.3% or 244 of the total 4,604 families live below the poverty line. Families with 1 or 2 children have the highest poverty rate of 12.7%, comprising of 187 families. On the other hand, families with 5 or more children have the lowest poverty rate of 0.0%, which includes 0 families.
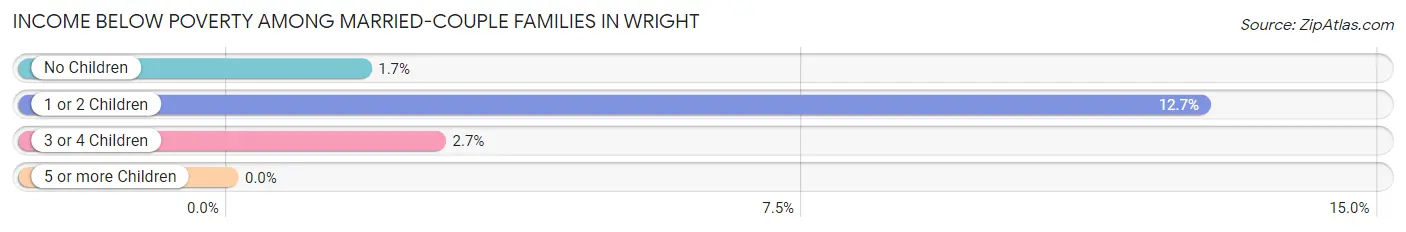
| Children | Above Poverty | Below Poverty |
| No Children | 2,819 (98.3%) | 50 (1.7%) |
| 1 or 2 Children | 1,285 (87.3%) | 187 (12.7%) |
| 3 or 4 Children | 251 (97.3%) | 7 (2.7%) |
| 5 or more Children | 5 (100.0%) | 0 (0.0%) |
| Total | 4,360 (94.7%) | 244 (5.3%) |
Income Below Poverty Among Single-Parent Households in Wright
According to the poverty data in Wright, 24.3% or 107 single-father households and 36.4% or 441 single-mother households are living below the poverty line. Among single-father households, those with 3 or 4 children have the highest poverty rate, with 48 households (100.0%) experiencing poverty. Likewise, among single-mother households, those with 3 or 4 children have the highest poverty rate, with 148 households (84.1%) falling below the poverty line.
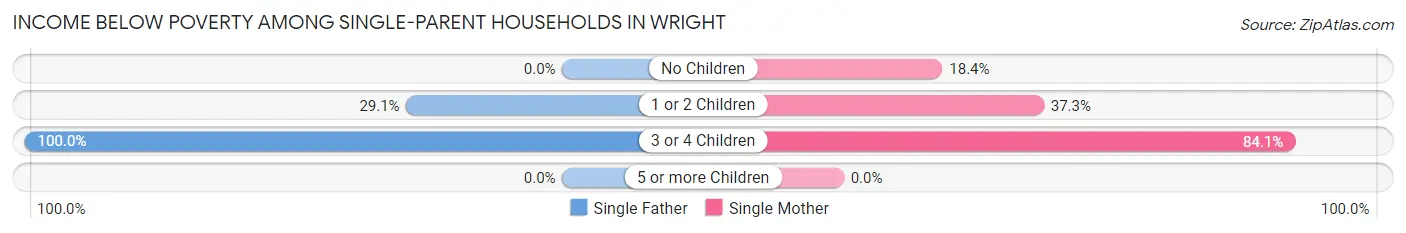
| Children | Single Father | Single Mother |
| No Children | 0 (0.0%) | 91 (18.4%) |
| 1 or 2 Children | 59 (29.1%) | 202 (37.3%) |
| 3 or 4 Children | 48 (100.0%) | 148 (84.1%) |
| 5 or more Children | 0 (0.0%) | 0 (0.0%) |
| Total | 107 (24.3%) | 441 (36.4%) |
Income Below Poverty Among Married-Couple vs Single-Parent Households in Wright
The poverty data for Wright shows that 244 of the married-couple family households (5.3%) and 548 of the single-parent households (33.2%) are living below the poverty level. Within the married-couple family households, those with 1 or 2 children have the highest poverty rate, with 187 households (12.7%) falling below the poverty line. Among the single-parent households, those with 3 or 4 children have the highest poverty rate, with 196 household (87.5%) living below poverty.
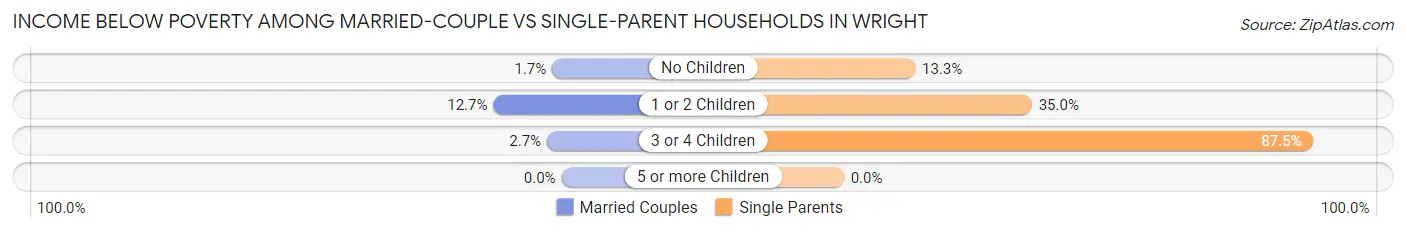
| Children | Married-Couple Families | Single-Parent Households |
| No Children | 50 (1.7%) | 91 (13.3%) |
| 1 or 2 Children | 187 (12.7%) | 261 (35.0%) |
| 3 or 4 Children | 7 (2.7%) | 196 (87.5%) |
| 5 or more Children | 0 (0.0%) | 0 (0.0%) |
| Total | 244 (5.3%) | 548 (33.2%) |
Race in Wright
The most populous races in Wright are White / Caucasian (15,740 | 59.9%), Hispanic or Latino (4,658 | 17.7%), and Two or more Races (3,920 | 14.9%).
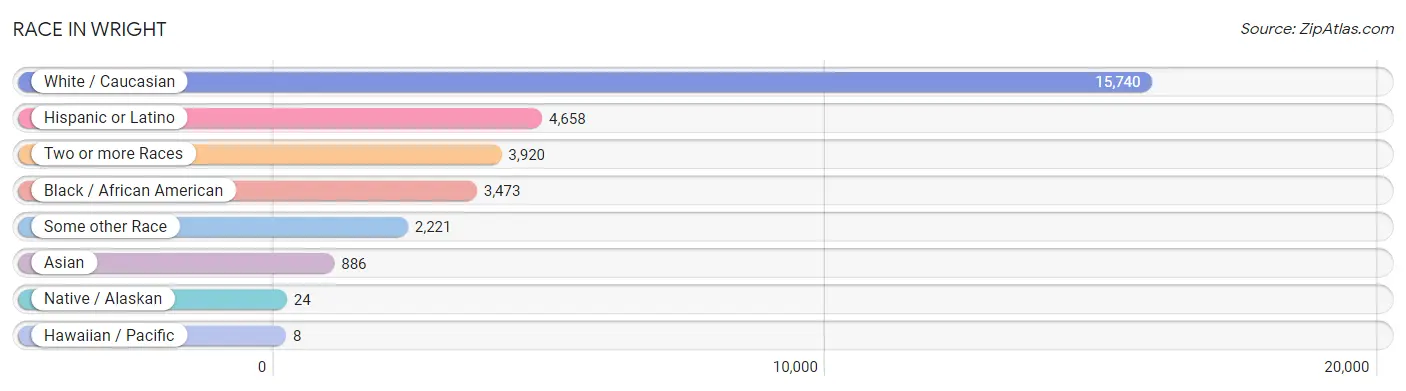
| Race | # Population | % Population |
| Asian | 886 | 3.4% |
| Black / African American | 3,473 | 13.2% |
| Hawaiian / Pacific | 8 | 0.0% |
| Hispanic or Latino | 4,658 | 17.7% |
| Native / Alaskan | 24 | 0.1% |
| White / Caucasian | 15,740 | 59.9% |
| Two or more Races | 3,920 | 14.9% |
| Some other Race | 2,221 | 8.5% |
| Total | 26,272 | 100.0% |
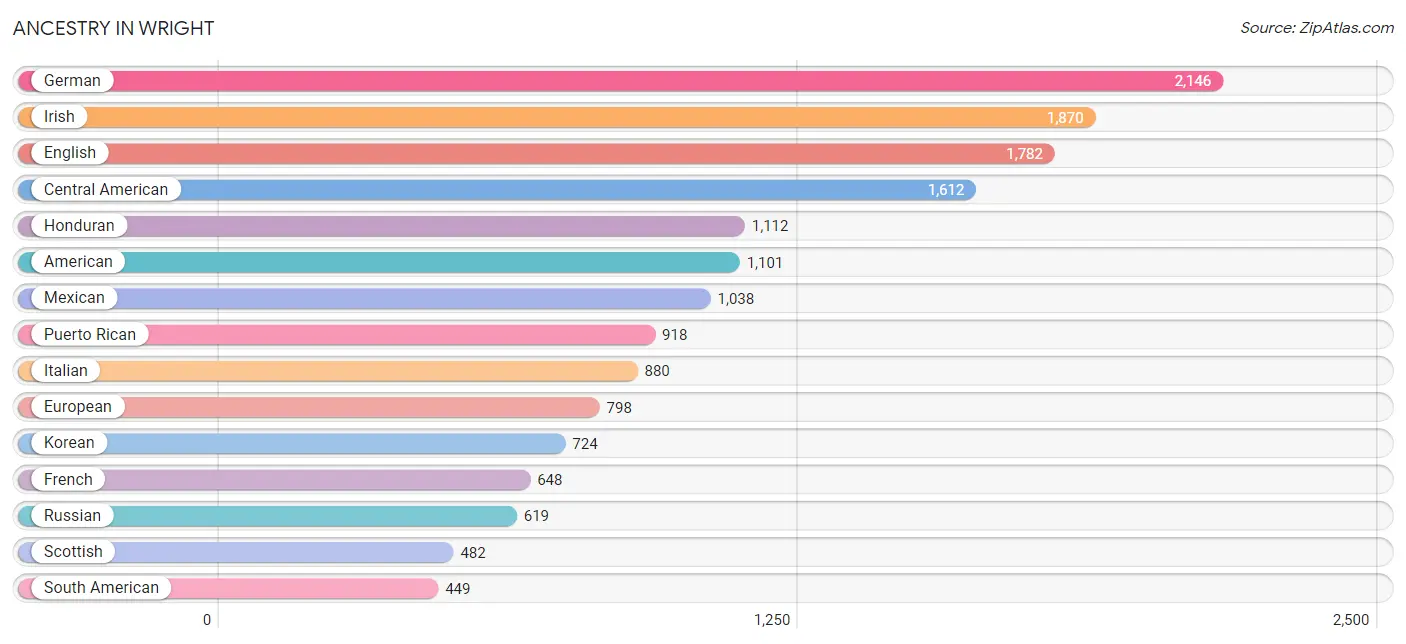
Ancestry in Wright
The most populous ancestries reported in Wright are German (2,146 | 8.2%), Irish (1,870 | 7.1%), English (1,782 | 6.8%), Central American (1,612 | 6.1%), and Honduran (1,112 | 4.2%), together accounting for 32.4% of all Wright residents.
| Ancestry | # Population | % Population |
| African | 268 | 1.0% |
| American | 1,101 | 4.2% |
| Austrian | 15 | 0.1% |
| Bangladeshi | 6 | 0.0% |
| Belizean | 40 | 0.2% |
| Bhutanese | 47 | 0.2% |
| Bolivian | 66 | 0.3% |
| Brazilian | 227 | 0.9% |
| British | 162 | 0.6% |
| Burmese | 92 | 0.4% |
| Canadian | 10 | 0.0% |
| Cape Verdean | 29 | 0.1% |
| Celtic | 13 | 0.1% |
| Central American | 1,612 | 6.1% |
| Cherokee | 178 | 0.7% |
| Chilean | 21 | 0.1% |
| Chinese | 10 | 0.0% |
| Chippewa | 7 | 0.0% |
| Colombian | 333 | 1.3% |
| Costa Rican | 18 | 0.1% |
| Creek | 29 | 0.1% |
| Crow | 33 | 0.1% |
| Cuban | 76 | 0.3% |
| Czech | 58 | 0.2% |
| Danish | 22 | 0.1% |
| Dominican | 382 | 1.5% |
| Dutch | 231 | 0.9% |
| English | 1,782 | 6.8% |
| Ethiopian | 37 | 0.1% |
| European | 798 | 3.0% |
| Finnish | 144 | 0.5% |
| French | 648 | 2.5% |
| French Canadian | 142 | 0.5% |
| German | 2,146 | 8.2% |
| Greek | 36 | 0.1% |
| Guamanian / Chamorro | 12 | 0.1% |
| Guatemalan | 153 | 0.6% |
| Honduran | 1,112 | 4.2% |
| Hungarian | 135 | 0.5% |
| Indian (Asian) | 42 | 0.2% |
| Iranian | 46 | 0.2% |
| Irish | 1,870 | 7.1% |
| Italian | 880 | 3.4% |
| Jamaican | 357 | 1.4% |
| Korean | 724 | 2.8% |
| Laotian | 9 | 0.0% |
| Mexican | 1,038 | 4.0% |
| Mexican American Indian | 12 | 0.1% |
| Native Hawaiian | 64 | 0.2% |
| Nicaraguan | 80 | 0.3% |
| Nigerian | 23 | 0.1% |
| Norwegian | 107 | 0.4% |
| Osage | 23 | 0.1% |
| Pakistani | 181 | 0.7% |
| Panamanian | 39 | 0.2% |
| Polish | 365 | 1.4% |
| Portuguese | 63 | 0.2% |
| Pueblo | 21 | 0.1% |
| Puerto Rican | 918 | 3.5% |
| Russian | 619 | 2.4% |
| Salvadoran | 210 | 0.8% |
| Samoan | 13 | 0.1% |
| Scandinavian | 59 | 0.2% |
| Scotch-Irish | 156 | 0.6% |
| Scottish | 482 | 1.8% |
| Sioux | 35 | 0.1% |
| Somali | 23 | 0.1% |
| South American | 449 | 1.7% |
| Spaniard | 54 | 0.2% |
| Sri Lankan | 58 | 0.2% |
| Subsaharan African | 373 | 1.4% |
| Swedish | 78 | 0.3% |
| Swiss | 94 | 0.4% |
| Thai | 338 | 1.3% |
| Turkish | 13 | 0.1% |
| Ukrainian | 51 | 0.2% |
| Venezuelan | 29 | 0.1% |
| Welsh | 243 | 0.9% | View All 78 Rows |
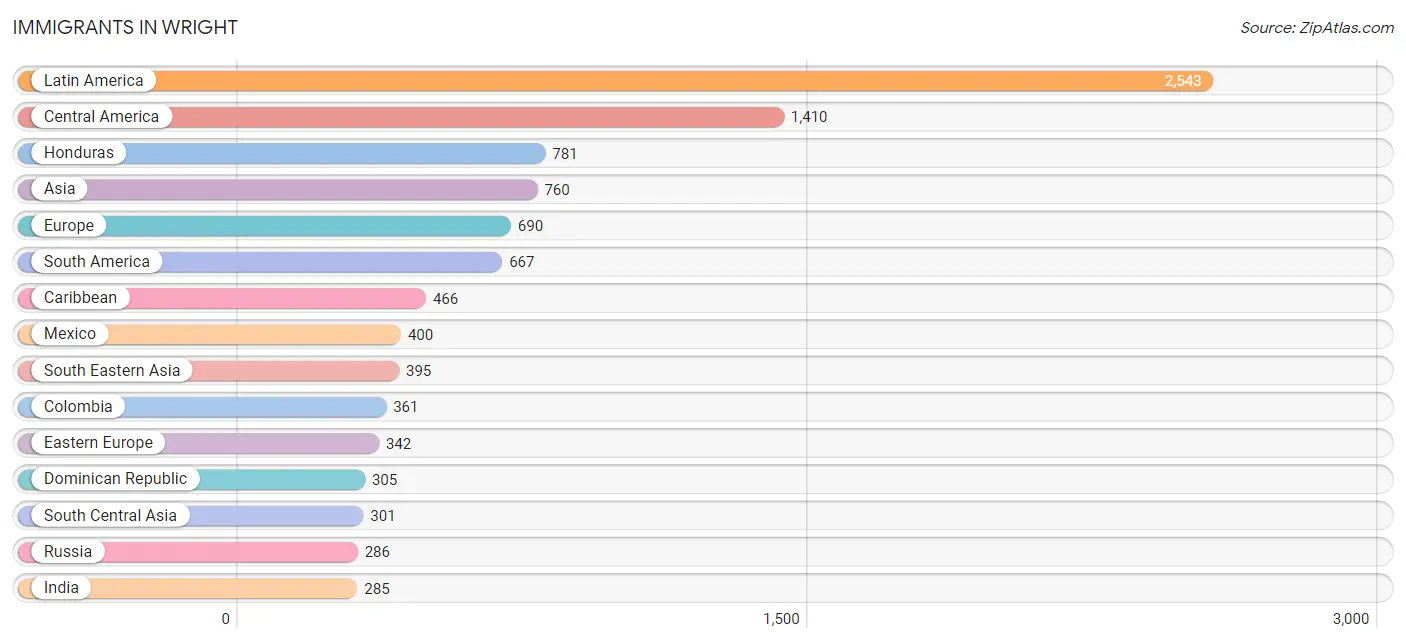
Immigrants in Wright
The most numerous immigrant groups reported in Wright came from Latin America (2,543 | 9.7%), Central America (1,410 | 5.4%), Honduras (781 | 3.0%), Asia (760 | 2.9%), and Europe (690 | 2.6%), together accounting for 23.5% of all Wright residents.
| Immigration Origin | # Population | % Population |
| Africa | 46 | 0.2% |
| Asia | 760 | 2.9% |
| Brazil | 277 | 1.1% |
| Canada | 10 | 0.0% |
| Caribbean | 466 | 1.8% |
| Central America | 1,410 | 5.4% |
| China | 13 | 0.1% |
| Colombia | 361 | 1.4% |
| Cuba | 32 | 0.1% |
| Dominican Republic | 305 | 1.2% |
| Eastern Africa | 37 | 0.1% |
| Eastern Asia | 59 | 0.2% |
| Eastern Europe | 342 | 1.3% |
| El Salvador | 99 | 0.4% |
| England | 24 | 0.1% |
| Ethiopia | 37 | 0.1% |
| Europe | 690 | 2.6% |
| France | 52 | 0.2% |
| Germany | 49 | 0.2% |
| Guatemala | 73 | 0.3% |
| Honduras | 781 | 3.0% |
| Hungary | 8 | 0.0% |
| India | 285 | 1.1% |
| Iran | 16 | 0.1% |
| Jamaica | 129 | 0.5% |
| Japan | 29 | 0.1% |
| Korea | 17 | 0.1% |
| Latin America | 2,543 | 9.7% |
| Mexico | 400 | 1.5% |
| Morocco | 9 | 0.0% |
| Nicaragua | 57 | 0.2% |
| Northern Africa | 9 | 0.0% |
| Northern Europe | 236 | 0.9% |
| Philippines | 193 | 0.7% |
| Russia | 286 | 1.1% |
| South America | 667 | 2.5% |
| South Central Asia | 301 | 1.1% |
| South Eastern Asia | 395 | 1.5% |
| Southern Europe | 11 | 0.0% |
| Spain | 11 | 0.0% |
| Taiwan | 13 | 0.1% |
| Thailand | 178 | 0.7% |
| Turkey | 5 | 0.0% |
| Ukraine | 41 | 0.2% |
| Venezuela | 29 | 0.1% |
| Vietnam | 24 | 0.1% |
| Western Asia | 5 | 0.0% |
| Western Europe | 101 | 0.4% | View All 48 Rows |
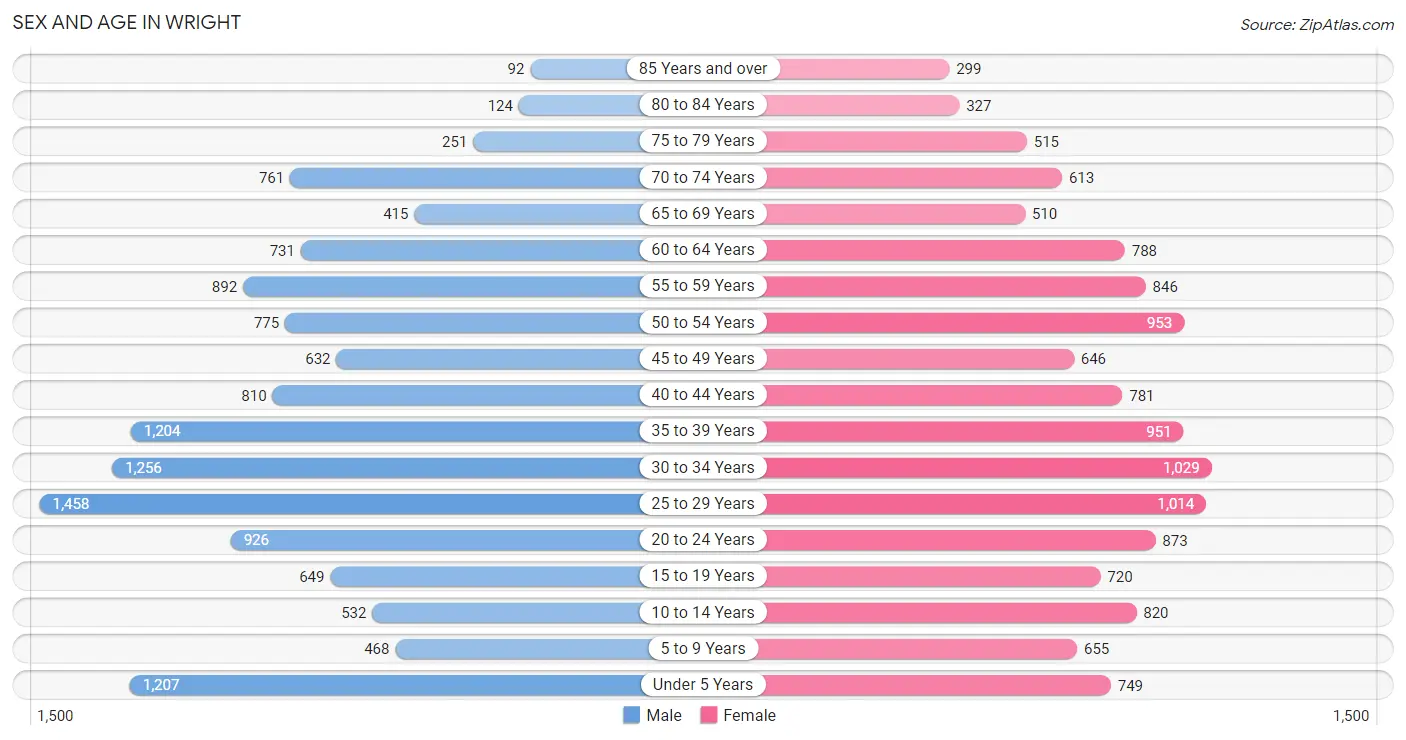
Sex and Age in Wright
Sex and Age in Wright
The most populous age groups in Wright are 25 to 29 Years (1,458 | 11.1%) for men and 30 to 34 Years (1,029 | 7.9%) for women.
| Age Bracket | Male | Female |
| Under 5 Years | 1,207 (9.2%) | 749 (5.7%) |
| 5 to 9 Years | 468 (3.5%) | 655 (5.0%) |
| 10 to 14 Years | 532 (4.0%) | 820 (6.3%) |
| 15 to 19 Years | 649 (4.9%) | 720 (5.5%) |
| 20 to 24 Years | 926 (7.0%) | 873 (6.7%) |
| 25 to 29 Years | 1,458 (11.1%) | 1,014 (7.7%) |
| 30 to 34 Years | 1,256 (9.5%) | 1,029 (7.9%) |
| 35 to 39 Years | 1,204 (9.1%) | 951 (7.3%) |
| 40 to 44 Years | 810 (6.1%) | 781 (6.0%) |
| 45 to 49 Years | 632 (4.8%) | 646 (4.9%) |
| 50 to 54 Years | 775 (5.9%) | 953 (7.3%) |
| 55 to 59 Years | 892 (6.8%) | 846 (6.5%) |
| 60 to 64 Years | 731 (5.6%) | 788 (6.0%) |
| 65 to 69 Years | 415 (3.2%) | 510 (3.9%) |
| 70 to 74 Years | 761 (5.8%) | 613 (4.7%) |
| 75 to 79 Years | 251 (1.9%) | 515 (3.9%) |
| 80 to 84 Years | 124 (0.9%) | 327 (2.5%) |
| 85 Years and over | 92 (0.7%) | 299 (2.3%) |
| Total | 13,183 (100.0%) | 13,089 (100.0%) |
Families and Households in Wright
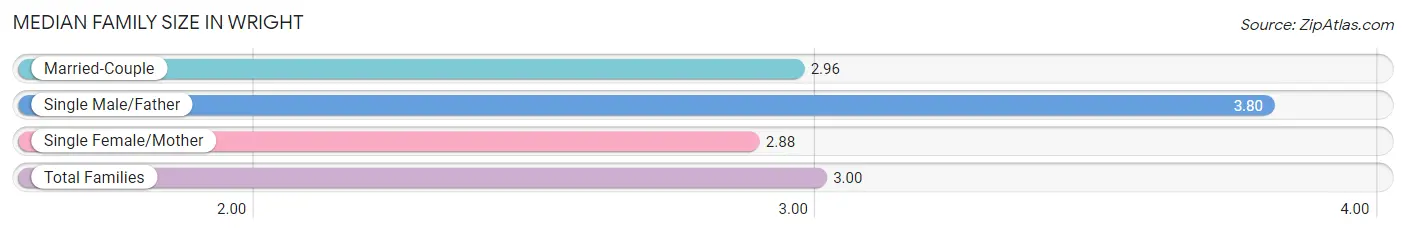
Median Family Size in Wright
The median family size in Wright is 3.00 persons per family, with single male/father families (440 | 7.0%) accounting for the largest median family size of 3.8 persons per family. On the other hand, single female/mother families (1,213 | 19.4%) represent the smallest median family size with 2.88 persons per family.
| Family Type | # Families | Family Size |
| Married-Couple | 4,604 (73.6%) | 2.96 |
| Single Male/Father | 440 (7.0%) | 3.80 |
| Single Female/Mother | 1,213 (19.4%) | 2.88 |
| Total Families | 6,257 (100.0%) | 3.00 |
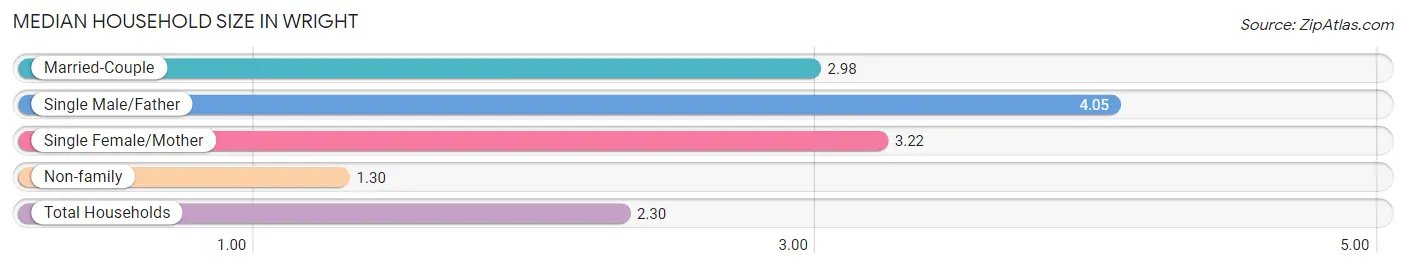
Median Household Size in Wright
The median household size in Wright is 2.30 persons per household, with single male/father households (440 | 3.9%) accounting for the largest median household size of 4.05 persons per household. non-family households (5,039 | 44.6%) represent the smallest median household size with 1.30 persons per household.
| Household Type | # Households | Household Size |
| Married-Couple | 4,604 (40.8%) | 2.98 |
| Single Male/Father | 440 (3.9%) | 4.05 |
| Single Female/Mother | 1,213 (10.7%) | 3.22 |
| Non-family | 5,039 (44.6%) | 1.30 |
| Total Households | 11,296 (100.0%) | 2.30 |
Household Size by Marriage Status in Wright
Out of a total of 11,296 households in Wright, 6,257 (55.4%) are family households, while 5,039 (44.6%) are nonfamily households. The most numerous type of family households are 2-person households, comprising 3,188, and the most common type of nonfamily households are 1-person households, comprising 4,010.
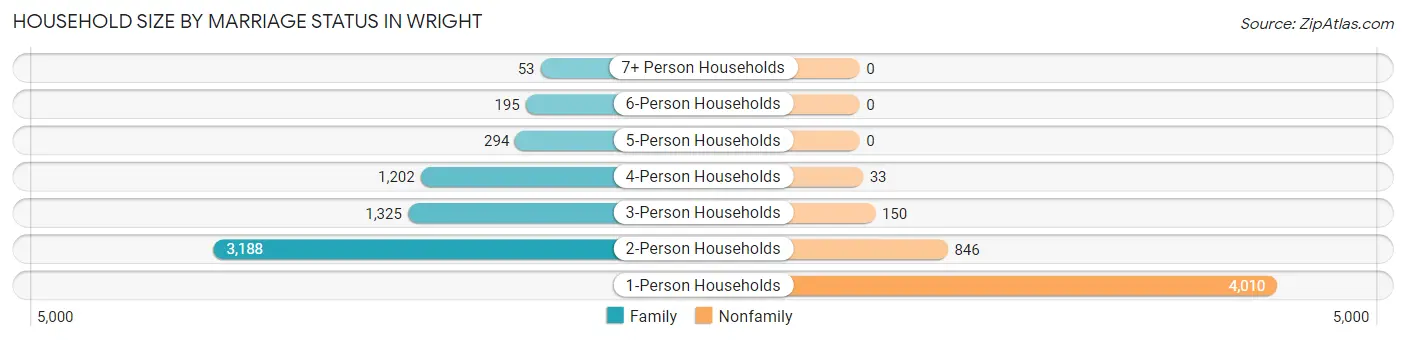
| Household Size | Family Households | Nonfamily Households |
| 1-Person Households | - | 4,010 (35.5%) |
| 2-Person Households | 3,188 (28.2%) | 846 (7.5%) |
| 3-Person Households | 1,325 (11.7%) | 150 (1.3%) |
| 4-Person Households | 1,202 (10.6%) | 33 (0.3%) |
| 5-Person Households | 294 (2.6%) | 0 (0.0%) |
| 6-Person Households | 195 (1.7%) | 0 (0.0%) |
| 7+ Person Households | 53 (0.5%) | 0 (0.0%) |
| Total | 6,257 (55.4%) | 5,039 (44.6%) |
Female Fertility in Wright
Fertility by Age in Wright
Average fertility rate in Wright is 86.0 births per 1,000 women. Women in the age bracket of 20 to 34 years have the highest fertility rate with 168.0 births per 1,000 women. Women in the age bracket of 20 to 34 years acount for 94.1% of all women with births.
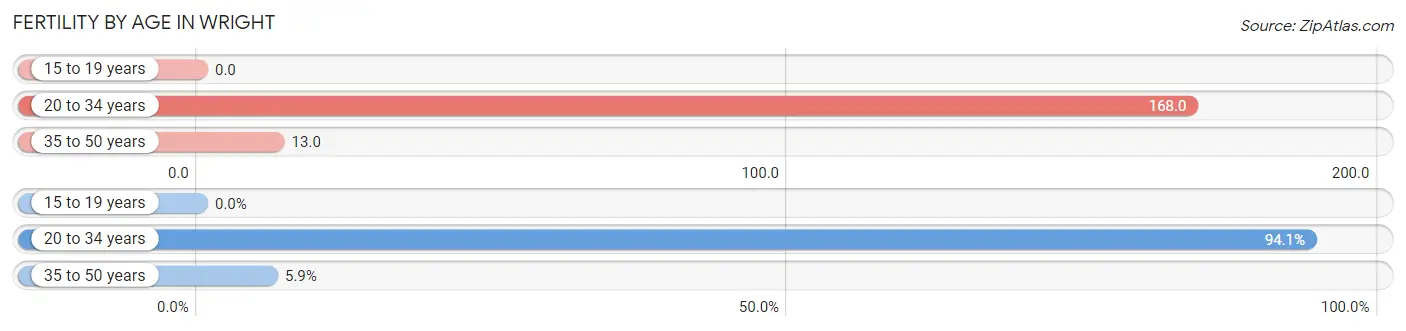
| Age Bracket | Women with Births | Births / 1,000 Women |
| 15 to 19 years | 0 (0.0%) | 0.0 |
| 20 to 34 years | 491 (94.1%) | 168.0 |
| 35 to 50 years | 31 (5.9%) | 13.0 |
| Total | 522 (100.0%) | 86.0 |
Fertility by Age by Marriage Status in Wright
78.5% of women with births (522) in Wright are married. The highest percentage of unmarried women with births falls into 35 to 50 years age bracket with 100.0% of them unmarried at the time of birth, while the lowest percentage of unmarried women with births belong to 20 to 34 years age bracket with 16.5% of them unmarried.
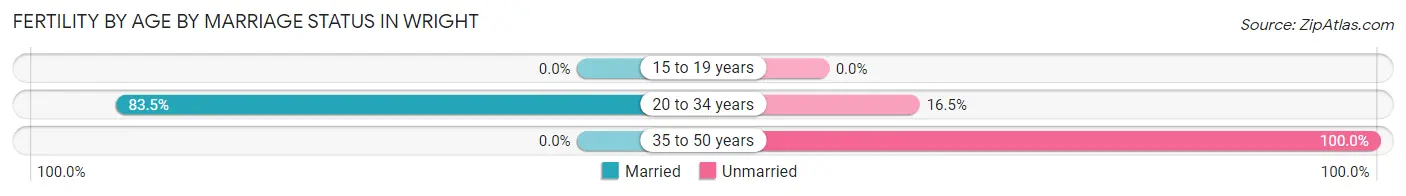
| Age Bracket | Married | Unmarried |
| 15 to 19 years | 0 (0.0%) | 0 (0.0%) |
| 20 to 34 years | 410 (83.5%) | 81 (16.5%) |
| 35 to 50 years | 0 (0.0%) | 31 (100.0%) |
| Total | 410 (78.5%) | 112 (21.5%) |
Fertility by Education in Wright
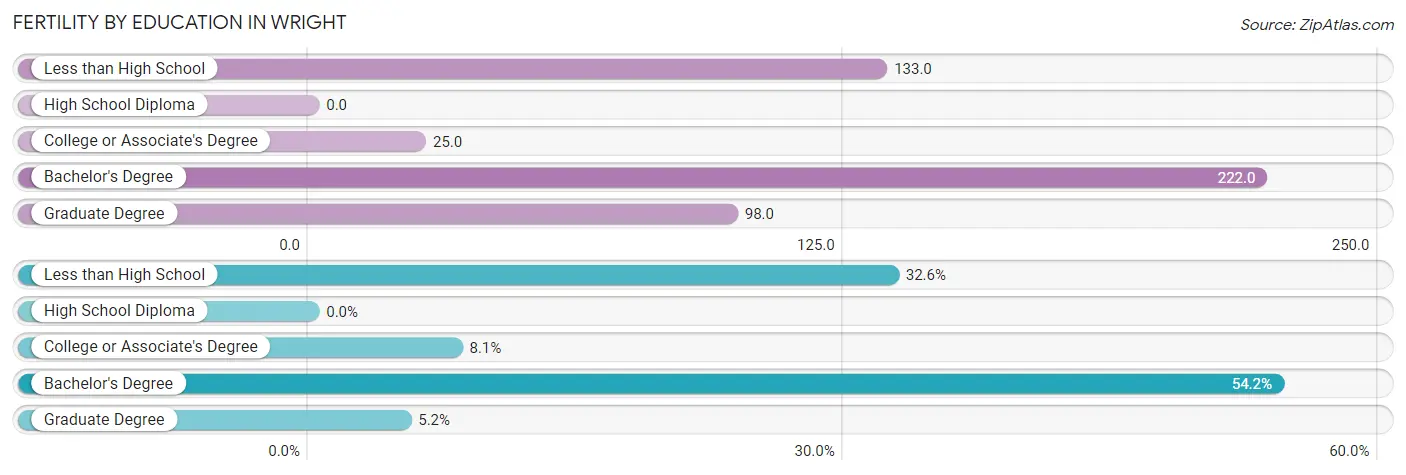
| Educational Attainment | Women with Births | Births / 1,000 Women |
| Less than High School | 170 (32.6%) | 133.0 |
| High School Diploma | 0 (0.0%) | 0.0 |
| College or Associate's Degree | 42 (8.1%) | 25.0 |
| Bachelor's Degree | 283 (54.2%) | 222.0 |
| Graduate Degree | 27 (5.2%) | 98.0 |
| Total | 522 (100.0%) | 86.0 |
Fertility by Education by Marriage Status in Wright
21.5% of women with births in Wright are unmarried. Women with the educational attainment of bachelor's degree are most likely to be married with 100.0% of them married at childbirth, while women with the educational attainment of college or associate's degree are least likely to be married with 73.8% of them unmarried at childbirth.
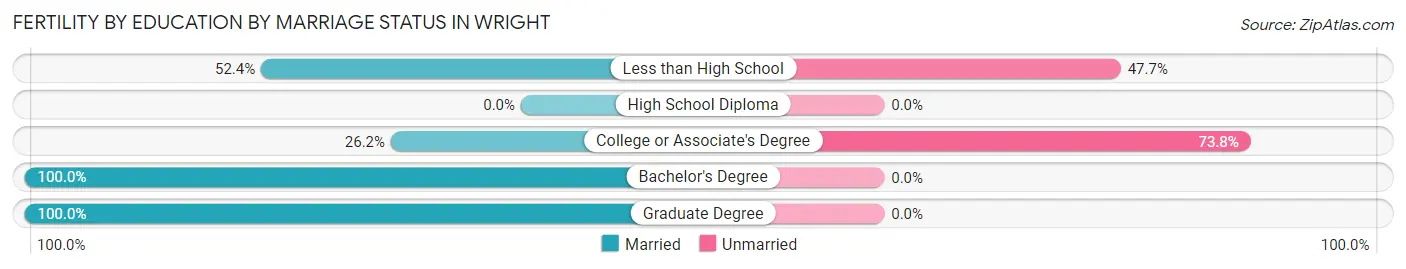
| Educational Attainment | Married | Unmarried |
| Less than High School | 89 (52.3%) | 81 (47.6%) |
| High School Diploma | 0 (0.0%) | 0 (0.0%) |
| College or Associate's Degree | 11 (26.2%) | 31 (73.8%) |
| Bachelor's Degree | 283 (100.0%) | 0 (0.0%) |
| Graduate Degree | 27 (100.0%) | 0 (0.0%) |
| Total | 410 (78.5%) | 112 (21.5%) |
Employment Characteristics in Wright
Employment by Class of Employer in Wright
Among the 14,296 employed individuals in Wright, private company employees (8,371 | 58.6%), federal government employees (2,939 | 20.6%), and local government employees (850 | 5.9%) make up the most common classes of employment.
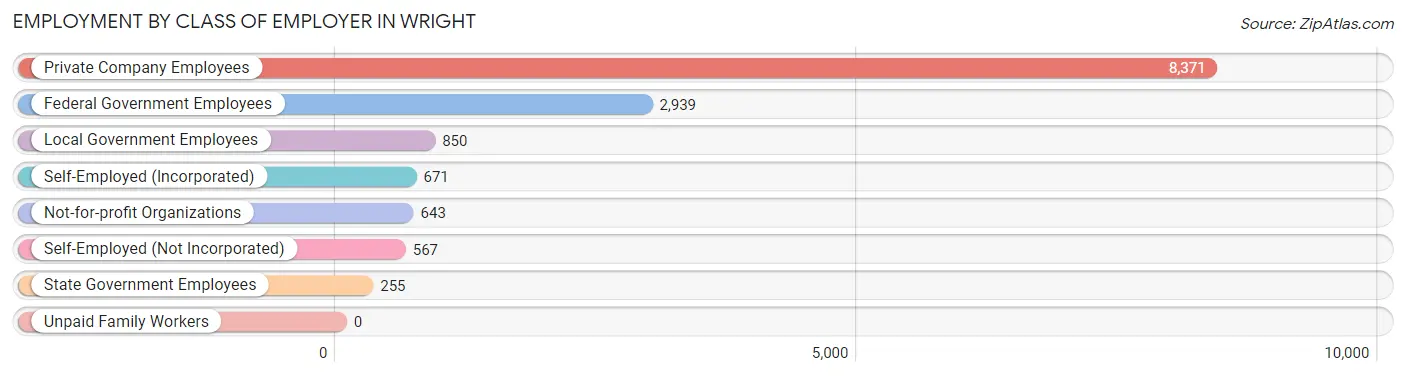
| Employer Class | # Employees | % Employees |
| Private Company Employees | 8,371 | 58.6% |
| Self-Employed (Incorporated) | 671 | 4.7% |
| Self-Employed (Not Incorporated) | 567 | 4.0% |
| Not-for-profit Organizations | 643 | 4.5% |
| Local Government Employees | 850 | 5.9% |
| State Government Employees | 255 | 1.8% |
| Federal Government Employees | 2,939 | 20.6% |
| Unpaid Family Workers | 0 | 0.0% |
| Total | 14,296 | 100.0% |
Employment Status by Age in Wright
According to the labor force statistics for Wright, out of the total population over 16 years of age (21,594), 68.8% or 14,857 individuals are in the labor force, with 3.5% or 520 of them unemployed. The age group with the highest labor force participation rate is 25 to 29 years, with 92.0% or 2,274 individuals in the labor force. Within the labor force, the 20 to 24 years age range has the highest percentage of unemployed individuals, with 7.4% or 113 of them being unemployed.
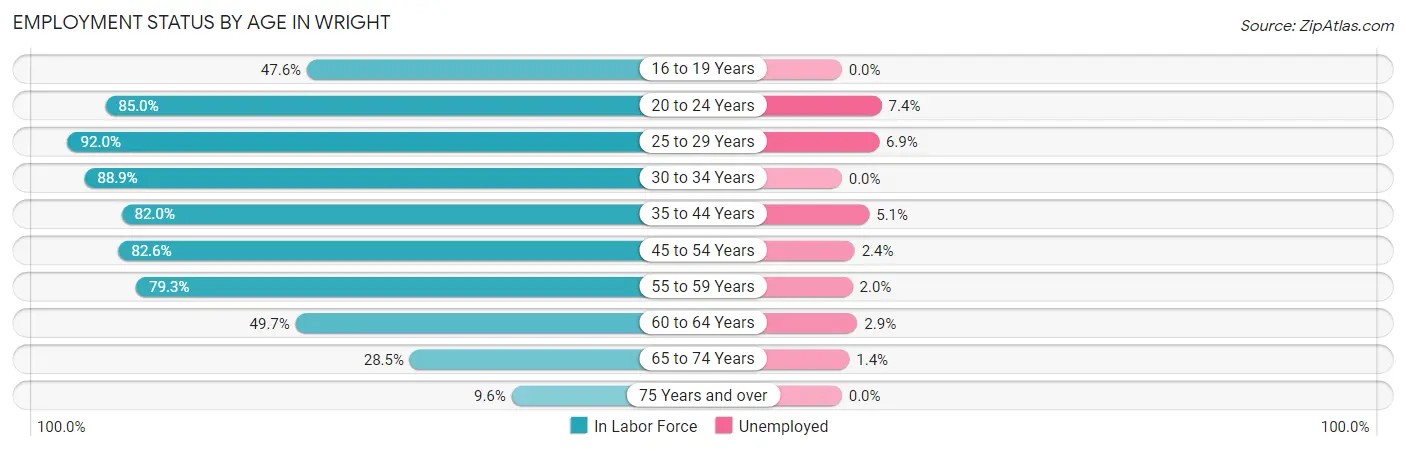
| Age Bracket | In Labor Force | Unemployed |
| 16 to 19 Years | 534 (47.6%) | 0 (0.0%) |
| 20 to 24 Years | 1,529 (85.0%) | 113 (7.4%) |
| 25 to 29 Years | 2,274 (92.0%) | 157 (6.9%) |
| 30 to 34 Years | 2,031 (88.9%) | 0 (0.0%) |
| 35 to 44 Years | 3,072 (82.0%) | 157 (5.1%) |
| 45 to 54 Years | 2,483 (82.6%) | 60 (2.4%) |
| 55 to 59 Years | 1,378 (79.3%) | 28 (2.0%) |
| 60 to 64 Years | 755 (49.7%) | 22 (2.9%) |
| 65 to 74 Years | 655 (28.5%) | 9 (1.4%) |
| 75 Years and over | 154 (9.6%) | 0 (0.0%) |
| Total | 14,857 (68.8%) | 520 (3.5%) |
Employment Status by Educational Attainment in Wright
According to labor force statistics for Wright, 81.2% of individuals (11,990) out of the total population between 25 and 64 years of age (14,766) are in the labor force, with 3.5% or 420 of them being unemployed. The group with the highest labor force participation rate are those with the educational attainment of bachelor's degree or higher, with 91.4% or 3,683 individuals in the labor force. Within the labor force, individuals with less than high school education have the highest percentage of unemployment, with 6.0% or 61 of them being unemployed.
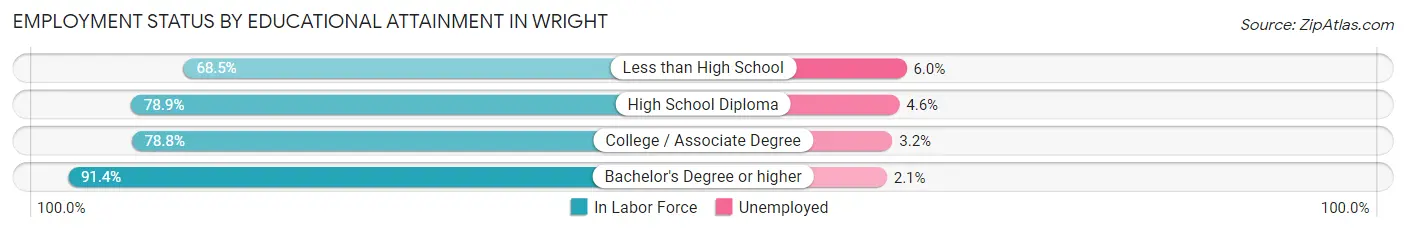
| Educational Attainment | In Labor Force | Unemployed |
| Less than High School | 1,021 (68.5%) | 89 (6.0%) |
| High School Diploma | 2,982 (78.9%) | 174 (4.6%) |
| College / Associate Degree | 4,309 (78.8%) | 175 (3.2%) |
| Bachelor's Degree or higher | 3,683 (91.4%) | 85 (2.1%) |
| Total | 11,990 (81.2%) | 517 (3.5%) |
Employment Occupations by Sex in Wright
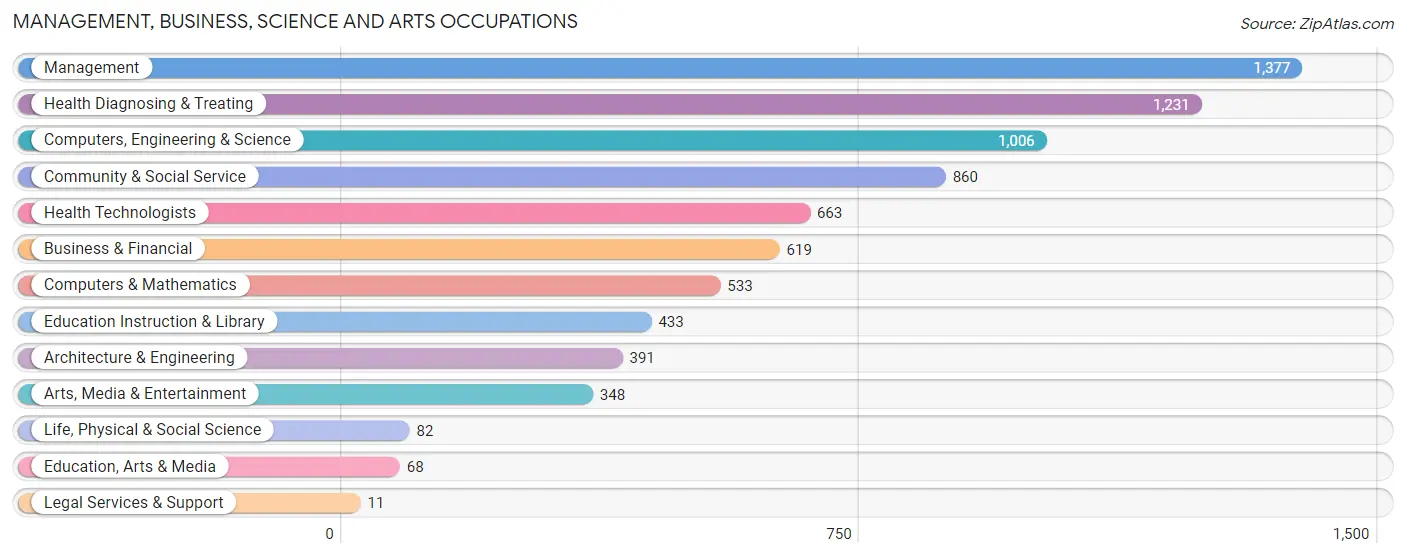
Management, Business, Science and Arts Occupations
The most common Management, Business, Science and Arts occupations in Wright are Management (1,377 | 11.2%), Health Diagnosing & Treating (1,231 | 10.0%), Computers, Engineering & Science (1,006 | 8.2%), Community & Social Service (860 | 7.0%), and Health Technologists (663 | 5.4%).
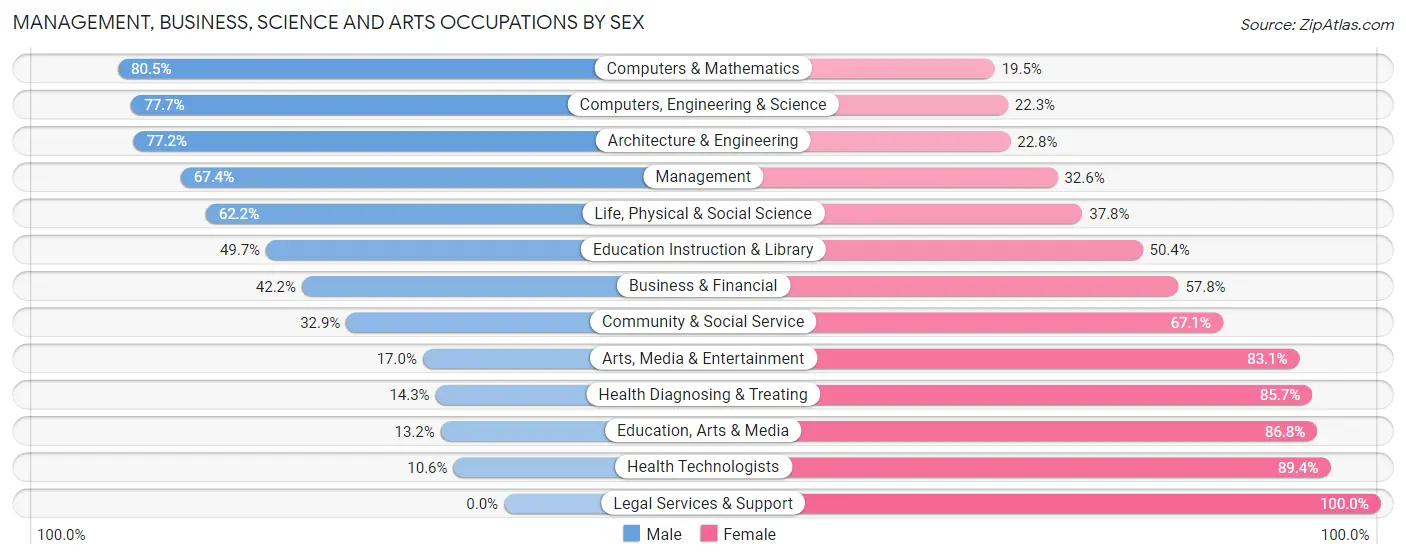
Management, Business, Science and Arts Occupations by Sex
Within the Management, Business, Science and Arts occupations in Wright, the most male-oriented occupations are Computers & Mathematics (80.5%), Computers, Engineering & Science (77.7%), and Architecture & Engineering (77.2%), while the most female-oriented occupations are Legal Services & Support (100.0%), Health Technologists (89.4%), and Education, Arts & Media (86.8%).
| Occupation | Male | Female |
| Management | 928 (67.4%) | 449 (32.6%) |
| Business & Financial | 261 (42.2%) | 358 (57.8%) |
| Computers, Engineering & Science | 782 (77.7%) | 224 (22.3%) |
| Computers & Mathematics | 429 (80.5%) | 104 (19.5%) |
| Architecture & Engineering | 302 (77.2%) | 89 (22.8%) |
| Life, Physical & Social Science | 51 (62.2%) | 31 (37.8%) |
| Community & Social Service | 283 (32.9%) | 577 (67.1%) |
| Education, Arts & Media | 9 (13.2%) | 59 (86.8%) |
| Legal Services & Support | 0 (0.0%) | 11 (100.0%) |
| Education Instruction & Library | 215 (49.6%) | 218 (50.3%) |
| Arts, Media & Entertainment | 59 (17.0%) | 289 (83.1%) |
| Health Diagnosing & Treating | 176 (14.3%) | 1,055 (85.7%) |
| Health Technologists | 70 (10.6%) | 593 (89.4%) |
| Total (Category) | 2,430 (47.7%) | 2,663 (52.3%) |
| Total (Overall) | 6,574 (53.4%) | 5,739 (46.6%) |
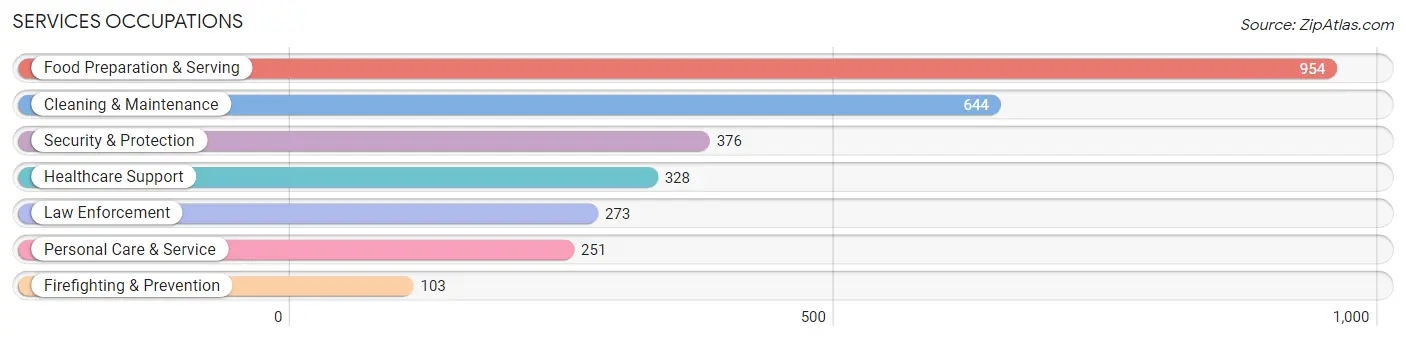
Services Occupations
The most common Services occupations in Wright are Food Preparation & Serving (954 | 7.7%), Cleaning & Maintenance (644 | 5.2%), Security & Protection (376 | 3.0%), Healthcare Support (328 | 2.7%), and Law Enforcement (273 | 2.2%).
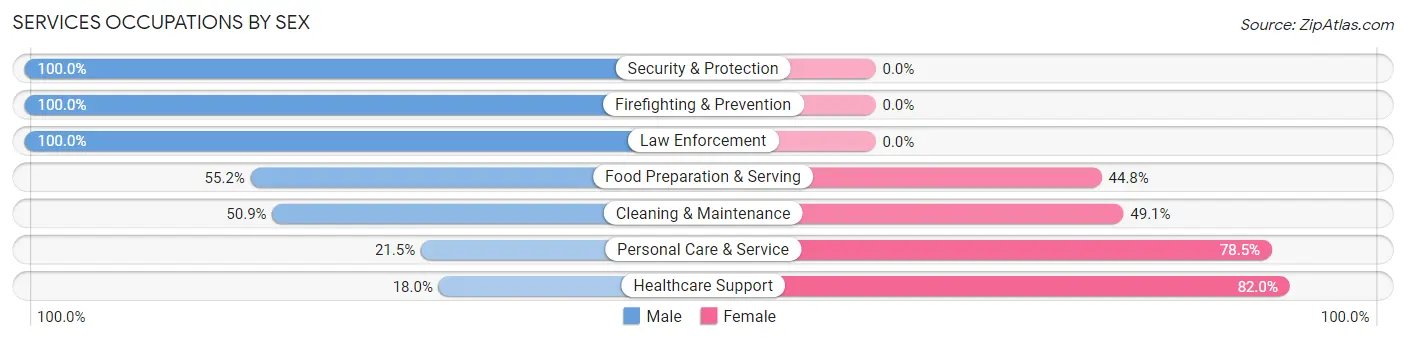
Services Occupations by Sex
Within the Services occupations in Wright, the most male-oriented occupations are Security & Protection (100.0%), Firefighting & Prevention (100.0%), and Law Enforcement (100.0%), while the most female-oriented occupations are Healthcare Support (82.0%), Personal Care & Service (78.5%), and Cleaning & Maintenance (49.1%).
| Occupation | Male | Female |
| Healthcare Support | 59 (18.0%) | 269 (82.0%) |
| Security & Protection | 376 (100.0%) | 0 (0.0%) |
| Firefighting & Prevention | 103 (100.0%) | 0 (0.0%) |
| Law Enforcement | 273 (100.0%) | 0 (0.0%) |
| Food Preparation & Serving | 527 (55.2%) | 427 (44.8%) |
| Cleaning & Maintenance | 328 (50.9%) | 316 (49.1%) |
| Personal Care & Service | 54 (21.5%) | 197 (78.5%) |
| Total (Category) | 1,344 (52.6%) | 1,209 (47.4%) |
| Total (Overall) | 6,574 (53.4%) | 5,739 (46.6%) |
Sales and Office Occupations
The most common Sales and Office occupations in Wright are Office & Administration (1,316 | 10.7%), and Sales & Related (850 | 6.9%).

Sales and Office Occupations by Sex
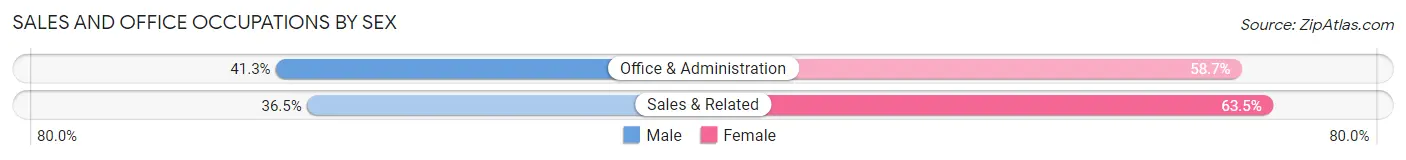
| Occupation | Male | Female |
| Sales & Related | 310 (36.5%) | 540 (63.5%) |
| Office & Administration | 543 (41.3%) | 773 (58.7%) |
| Total (Category) | 853 (39.4%) | 1,313 (60.6%) |
| Total (Overall) | 6,574 (53.4%) | 5,739 (46.6%) |
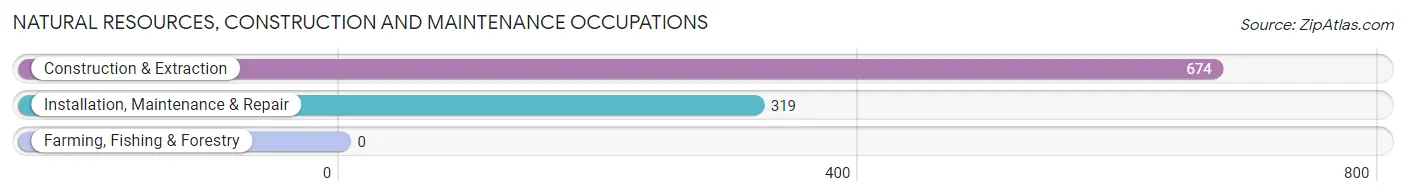
Natural Resources, Construction and Maintenance Occupations
The most common Natural Resources, Construction and Maintenance occupations in Wright are Construction & Extraction (674 | 5.5%), and Installation, Maintenance & Repair (319 | 2.6%).
Natural Resources, Construction and Maintenance Occupations by Sex
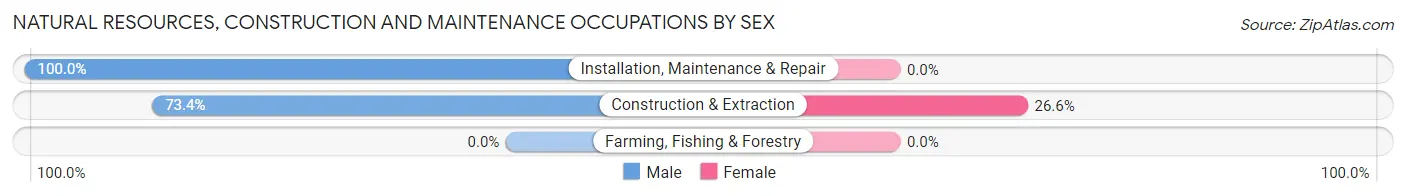
| Occupation | Male | Female |
| Farming, Fishing & Forestry | 0 (0.0%) | 0 (0.0%) |
| Construction & Extraction | 495 (73.4%) | 179 (26.6%) |
| Installation, Maintenance & Repair | 319 (100.0%) | 0 (0.0%) |
| Total (Category) | 814 (82.0%) | 179 (18.0%) |
| Total (Overall) | 6,574 (53.4%) | 5,739 (46.6%) |
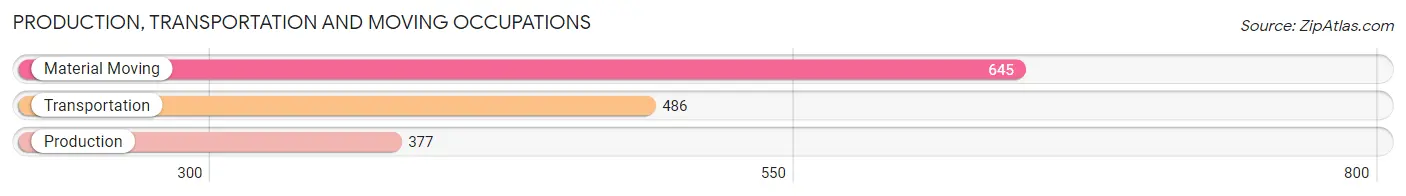
Production, Transportation and Moving Occupations
The most common Production, Transportation and Moving occupations in Wright are Material Moving (645 | 5.2%), Transportation (486 | 4.0%), and Production (377 | 3.1%).
Production, Transportation and Moving Occupations by Sex
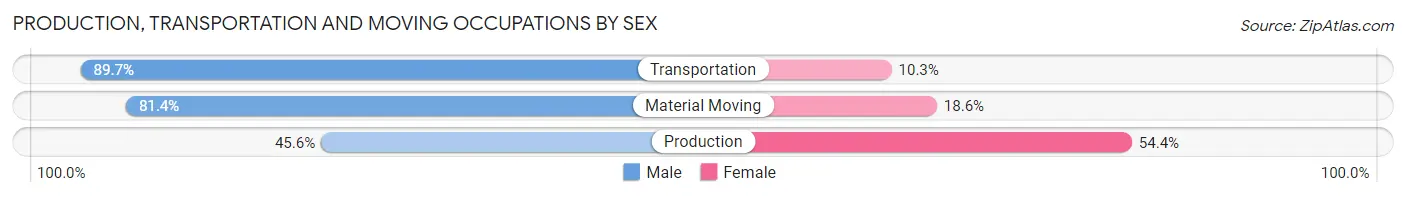
| Occupation | Male | Female |
| Production | 172 (45.6%) | 205 (54.4%) |
| Transportation | 436 (89.7%) | 50 (10.3%) |
| Material Moving | 525 (81.4%) | 120 (18.6%) |
| Total (Category) | 1,133 (75.1%) | 375 (24.9%) |
| Total (Overall) | 6,574 (53.4%) | 5,739 (46.6%) |
Employment Industries by Sex in Wright
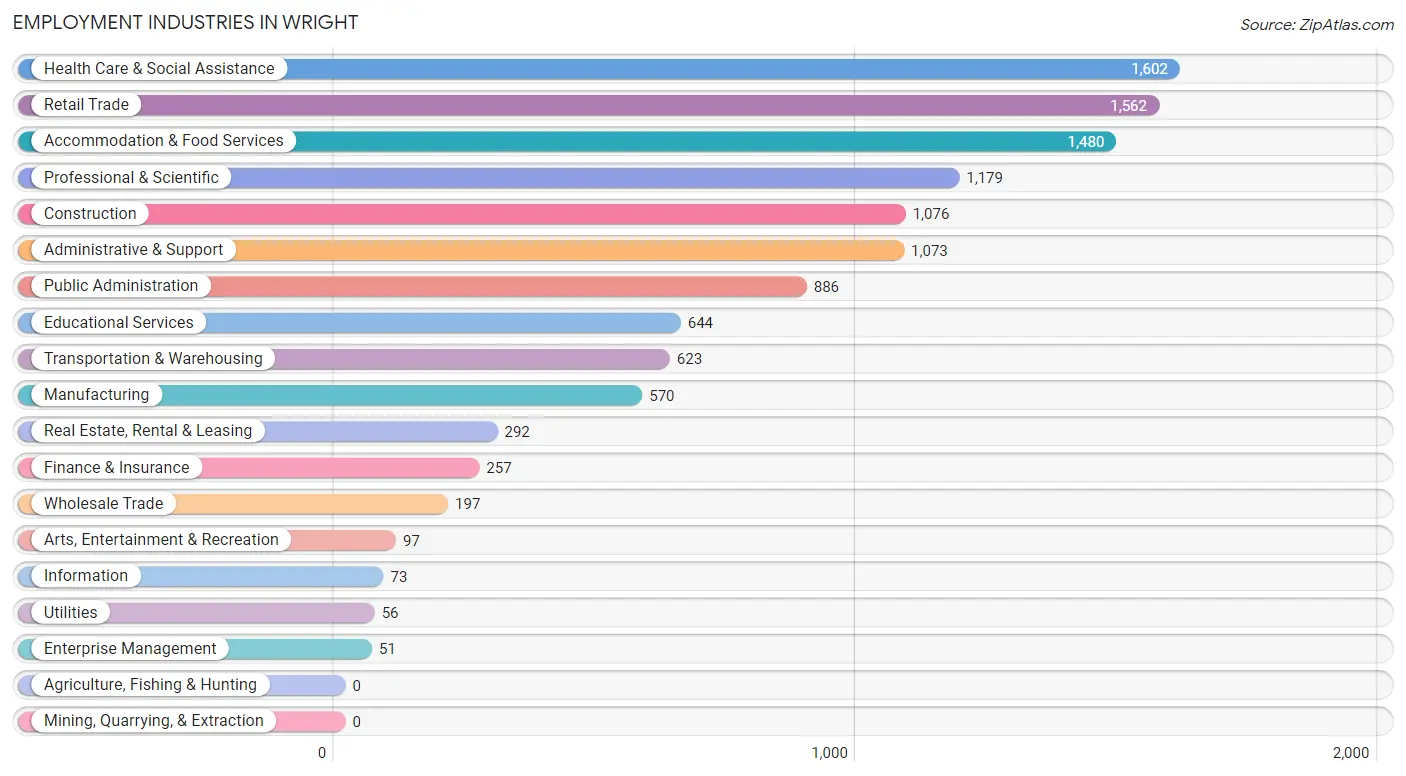
Employment Industries in Wright
The major employment industries in Wright include Health Care & Social Assistance (1,602 | 13.0%), Retail Trade (1,562 | 12.7%), Accommodation & Food Services (1,480 | 12.0%), Professional & Scientific (1,179 | 9.6%), and Construction (1,076 | 8.7%).
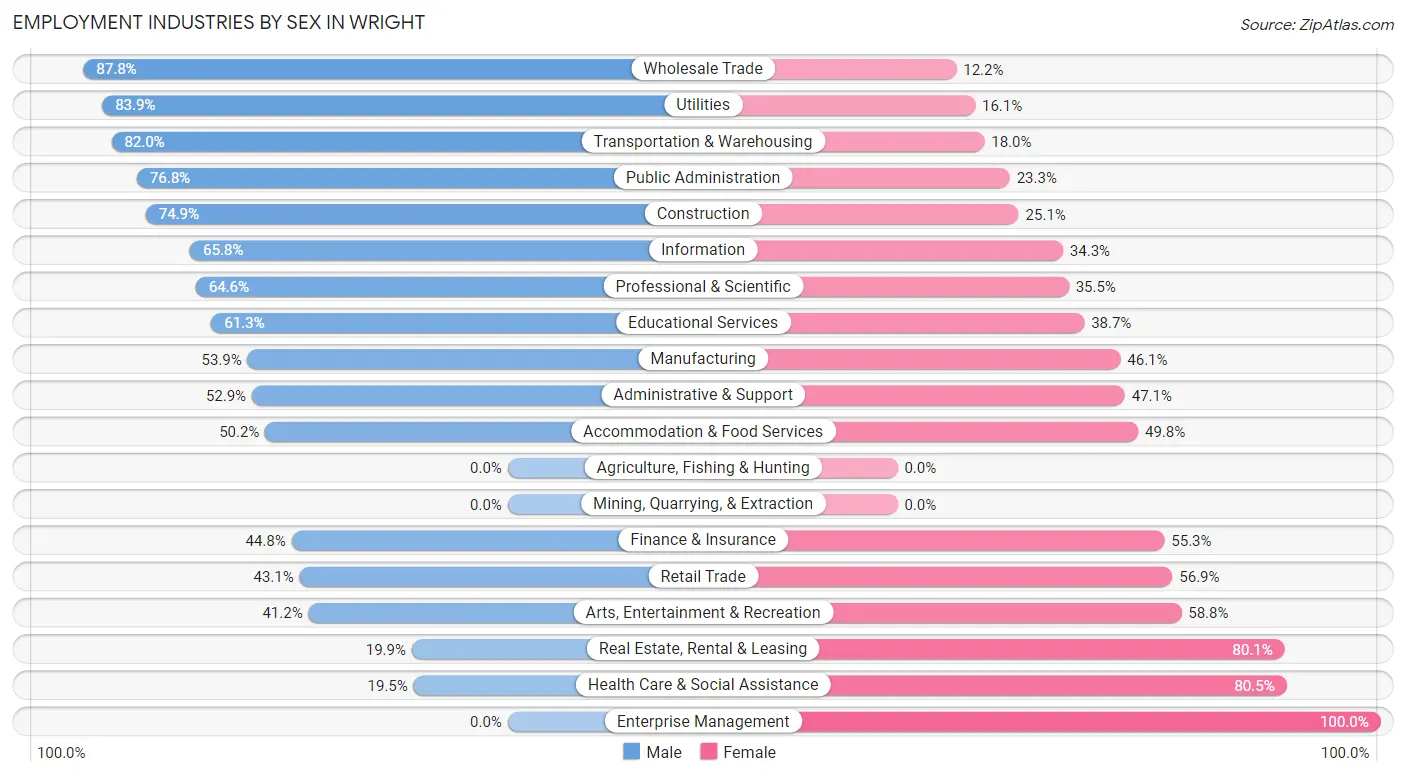
Employment Industries by Sex in Wright
The Wright industries that see more men than women are Wholesale Trade (87.8%), Utilities (83.9%), and Transportation & Warehousing (82.0%), whereas the industries that tend to have a higher number of women are Enterprise Management (100.0%), Health Care & Social Assistance (80.5%), and Real Estate, Rental & Leasing (80.1%).
| Industry | Male | Female |
| Agriculture, Fishing & Hunting | 0 (0.0%) | 0 (0.0%) |
| Mining, Quarrying, & Extraction | 0 (0.0%) | 0 (0.0%) |
| Construction | 806 (74.9%) | 270 (25.1%) |
| Manufacturing | 307 (53.9%) | 263 (46.1%) |
| Wholesale Trade | 173 (87.8%) | 24 (12.2%) |
| Retail Trade | 673 (43.1%) | 889 (56.9%) |
| Transportation & Warehousing | 511 (82.0%) | 112 (18.0%) |
| Utilities | 47 (83.9%) | 9 (16.1%) |
| Information | 48 (65.7%) | 25 (34.3%) |
| Finance & Insurance | 115 (44.8%) | 142 (55.2%) |
| Real Estate, Rental & Leasing | 58 (19.9%) | 234 (80.1%) |
| Professional & Scientific | 761 (64.5%) | 418 (35.4%) |
| Enterprise Management | 0 (0.0%) | 51 (100.0%) |
| Administrative & Support | 568 (52.9%) | 505 (47.1%) |
| Educational Services | 395 (61.3%) | 249 (38.7%) |
| Health Care & Social Assistance | 312 (19.5%) | 1,290 (80.5%) |
| Arts, Entertainment & Recreation | 40 (41.2%) | 57 (58.8%) |
| Accommodation & Food Services | 743 (50.2%) | 737 (49.8%) |
| Public Administration | 680 (76.7%) | 206 (23.3%) |
| Total | 6,574 (53.4%) | 5,739 (46.6%) |
Education in Wright
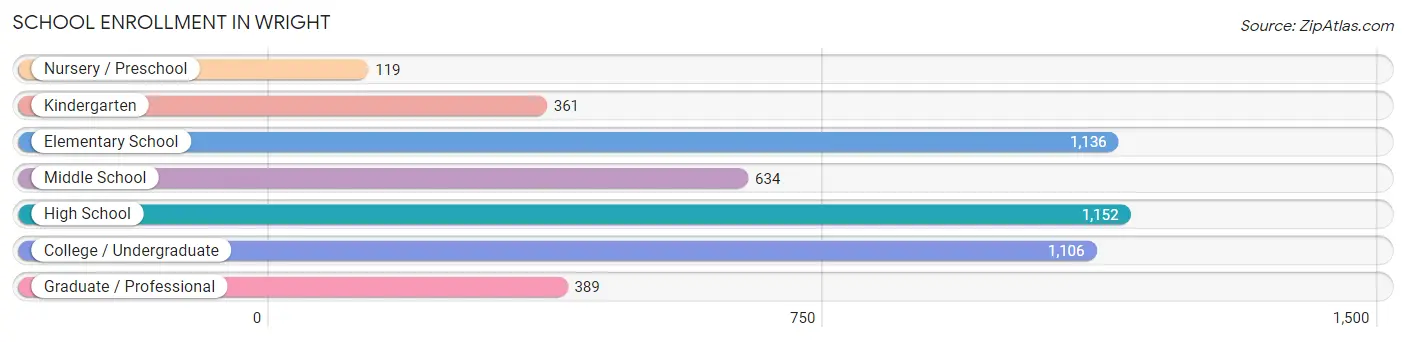
School Enrollment in Wright
The most common levels of schooling among the 4,897 students in Wright are high school (1,152 | 23.5%), elementary school (1,136 | 23.2%), and college / undergraduate (1,106 | 22.6%).
| School Level | # Students | % Students |
| Nursery / Preschool | 119 | 2.4% |
| Kindergarten | 361 | 7.4% |
| Elementary School | 1,136 | 23.2% |
| Middle School | 634 | 13.0% |
| High School | 1,152 | 23.5% |
| College / Undergraduate | 1,106 | 22.6% |
| Graduate / Professional | 389 | 7.9% |
| Total | 4,897 | 100.0% |
School Enrollment by Age by Funding Source in Wright
Out of a total of 4,897 students who are enrolled in schools in Wright, 514 (10.5%) attend a private institution, while the remaining 4,383 (89.5%) are enrolled in public schools. The age group of 10 to 14 year olds has the highest likelihood of being enrolled in private schools, with 272 (21.4% in the age bracket) enrolled. Conversely, the age group of 3 to 4 year olds has the lowest likelihood of being enrolled in a private school, with 96 (100.0% in the age bracket) attending a public institution.
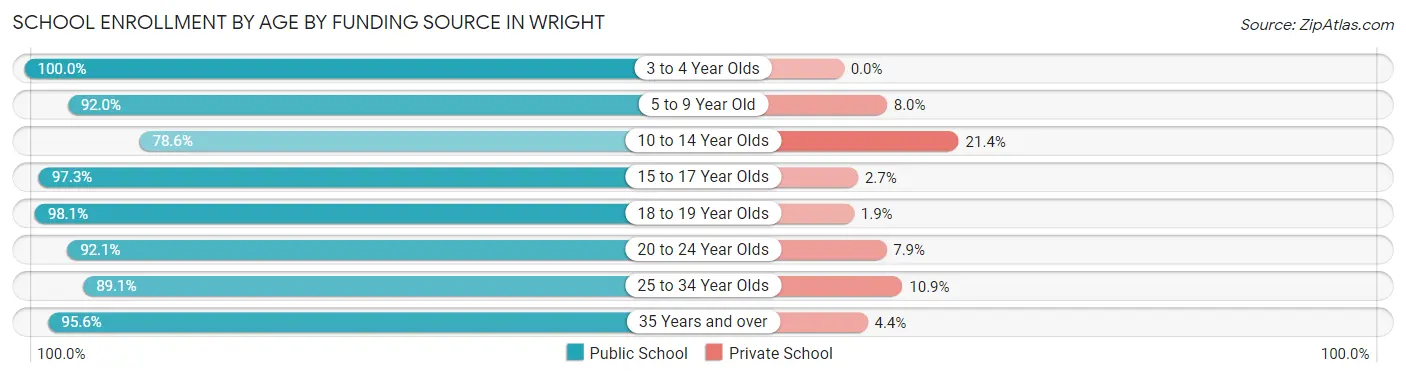
| Age Bracket | Public School | Private School |
| 3 to 4 Year Olds | 96 (100.0%) | 0 (0.0%) |
| 5 to 9 Year Old | 973 (92.0%) | 85 (8.0%) |
| 10 to 14 Year Olds | 998 (78.6%) | 272 (21.4%) |
| 15 to 17 Year Olds | 619 (97.3%) | 17 (2.7%) |
| 18 to 19 Year Olds | 309 (98.1%) | 6 (1.9%) |
| 20 to 24 Year Olds | 290 (92.1%) | 25 (7.9%) |
| 25 to 34 Year Olds | 774 (89.1%) | 95 (10.9%) |
| 35 Years and over | 323 (95.6%) | 15 (4.4%) |
| Total | 4,383 (89.5%) | 514 (10.5%) |
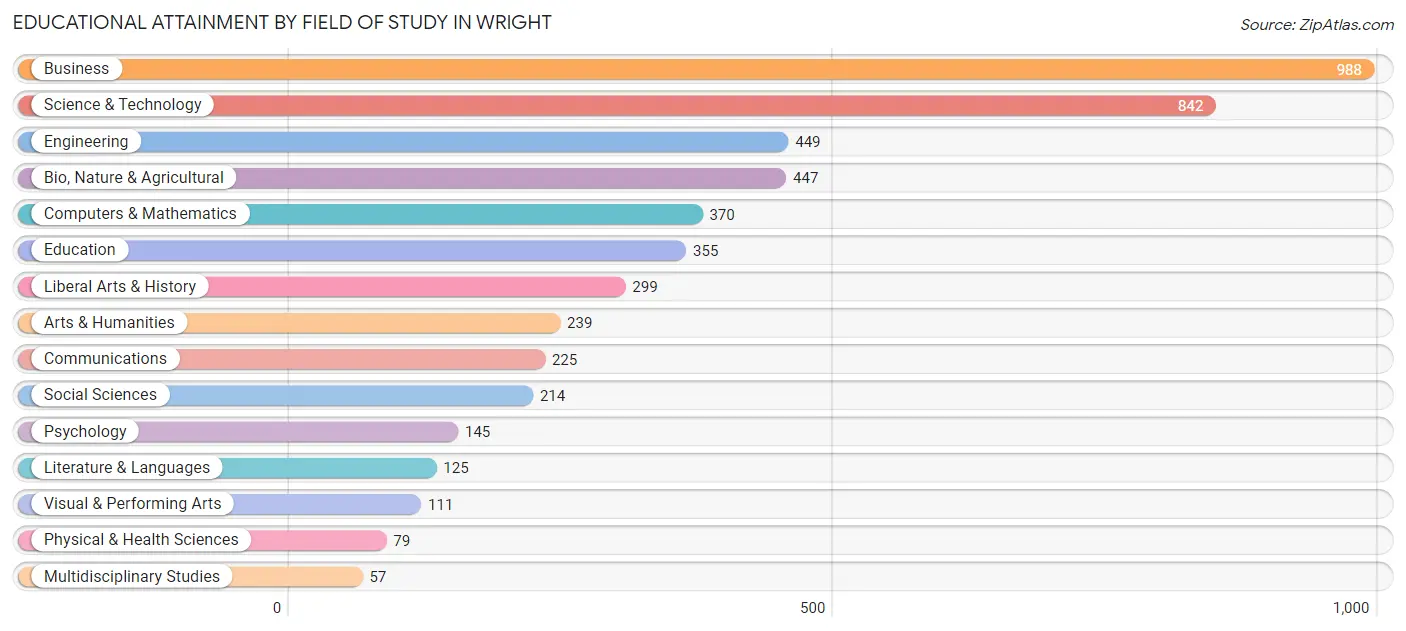
Educational Attainment by Field of Study in Wright
Business (988 | 20.0%), science & technology (842 | 17.0%), engineering (449 | 9.1%), bio, nature & agricultural (447 | 9.0%), and computers & mathematics (370 | 7.5%) are the most common fields of study among 4,945 individuals in Wright who have obtained a bachelor's degree or higher.
| Field of Study | # Graduates | % Graduates |
| Computers & Mathematics | 370 | 7.5% |
| Bio, Nature & Agricultural | 447 | 9.0% |
| Physical & Health Sciences | 79 | 1.6% |
| Psychology | 145 | 2.9% |
| Social Sciences | 214 | 4.3% |
| Engineering | 449 | 9.1% |
| Multidisciplinary Studies | 57 | 1.1% |
| Science & Technology | 842 | 17.0% |
| Business | 988 | 20.0% |
| Education | 355 | 7.2% |
| Literature & Languages | 125 | 2.5% |
| Liberal Arts & History | 299 | 6.0% |
| Visual & Performing Arts | 111 | 2.2% |
| Communications | 225 | 4.5% |
| Arts & Humanities | 239 | 4.8% |
| Total | 4,945 | 100.0% |
Transportation & Commute in Wright
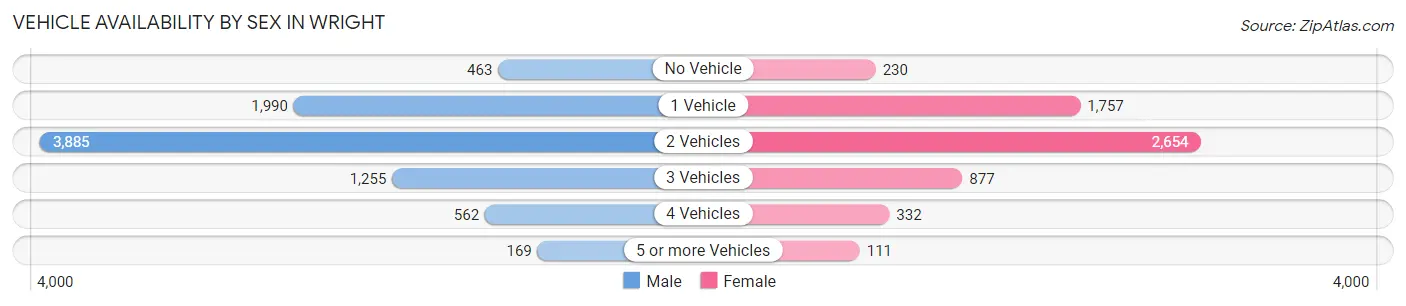
Vehicle Availability by Sex in Wright
The most prevalent vehicle ownership categories in Wright are males with 2 vehicles (3,885, accounting for 46.7%) and females with 2 vehicles (2,654, making up 65.2%).
| Vehicles Available | Male | Female |
| No Vehicle | 463 (5.6%) | 230 (3.9%) |
| 1 Vehicle | 1,990 (23.9%) | 1,757 (29.5%) |
| 2 Vehicles | 3,885 (46.7%) | 2,654 (44.5%) |
| 3 Vehicles | 1,255 (15.1%) | 877 (14.7%) |
| 4 Vehicles | 562 (6.8%) | 332 (5.6%) |
| 5 or more Vehicles | 169 (2.0%) | 111 (1.9%) |
| Total | 8,324 (100.0%) | 5,961 (100.0%) |
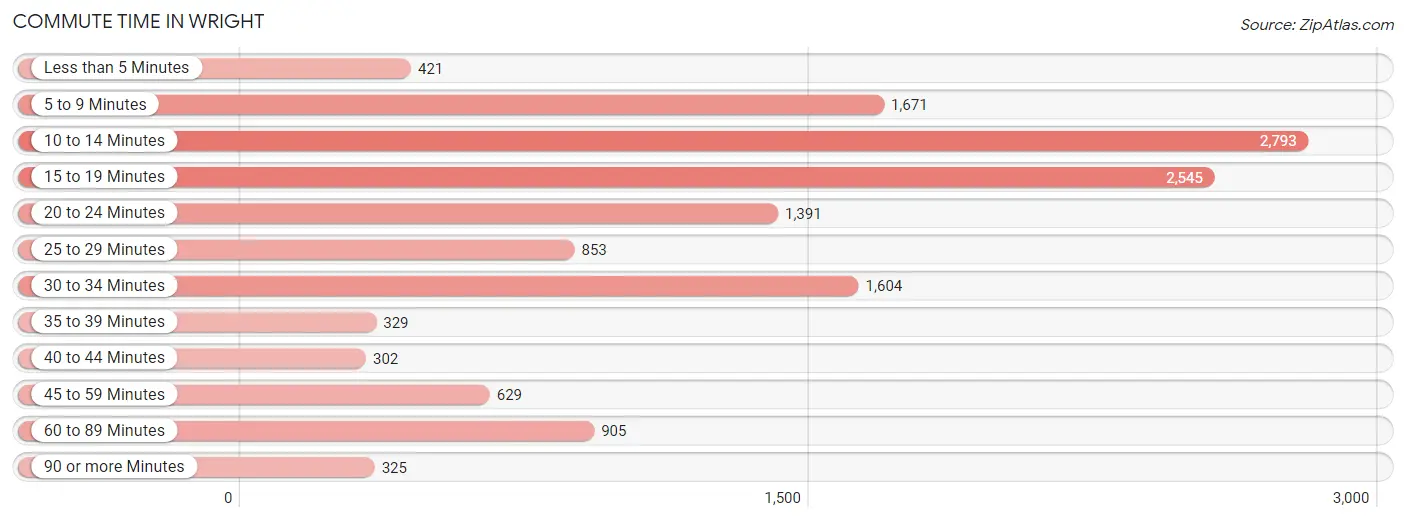
Commute Time in Wright
The most frequently occuring commute durations in Wright are 10 to 14 minutes (2,793 commuters, 20.3%), 15 to 19 minutes (2,545 commuters, 18.5%), and 5 to 9 minutes (1,671 commuters, 12.1%).
| Commute Time | # Commuters | % Commuters |
| Less than 5 Minutes | 421 | 3.1% |
| 5 to 9 Minutes | 1,671 | 12.1% |
| 10 to 14 Minutes | 2,793 | 20.3% |
| 15 to 19 Minutes | 2,545 | 18.5% |
| 20 to 24 Minutes | 1,391 | 10.1% |
| 25 to 29 Minutes | 853 | 6.2% |
| 30 to 34 Minutes | 1,604 | 11.7% |
| 35 to 39 Minutes | 329 | 2.4% |
| 40 to 44 Minutes | 302 | 2.2% |
| 45 to 59 Minutes | 629 | 4.6% |
| 60 to 89 Minutes | 905 | 6.6% |
| 90 or more Minutes | 325 | 2.4% |
Commute Time by Sex in Wright
The most common commute times in Wright are 10 to 14 minutes (1,548 commuters, 19.0%) for males and 10 to 14 minutes (1,245 commuters, 22.2%) for females.
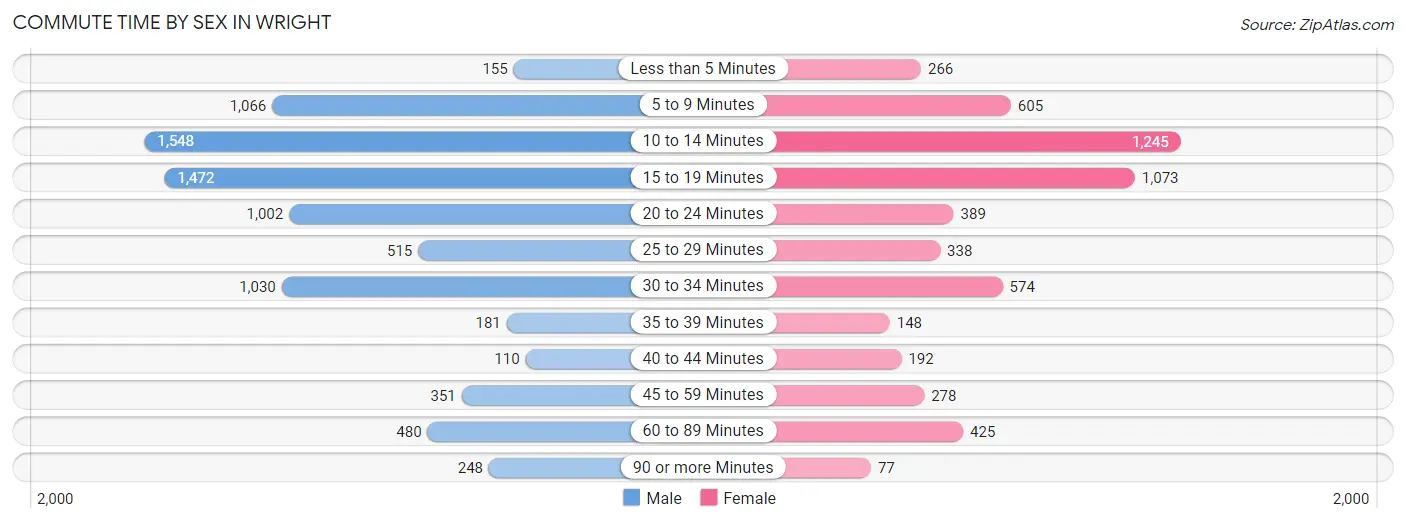
| Commute Time | Male | Female |
| Less than 5 Minutes | 155 (1.9%) | 266 (4.7%) |
| 5 to 9 Minutes | 1,066 (13.1%) | 605 (10.8%) |
| 10 to 14 Minutes | 1,548 (19.0%) | 1,245 (22.2%) |
| 15 to 19 Minutes | 1,472 (18.0%) | 1,073 (19.1%) |
| 20 to 24 Minutes | 1,002 (12.3%) | 389 (6.9%) |
| 25 to 29 Minutes | 515 (6.3%) | 338 (6.0%) |
| 30 to 34 Minutes | 1,030 (12.6%) | 574 (10.2%) |
| 35 to 39 Minutes | 181 (2.2%) | 148 (2.6%) |
| 40 to 44 Minutes | 110 (1.3%) | 192 (3.4%) |
| 45 to 59 Minutes | 351 (4.3%) | 278 (5.0%) |
| 60 to 89 Minutes | 480 (5.9%) | 425 (7.6%) |
| 90 or more Minutes | 248 (3.0%) | 77 (1.4%) |
Time of Departure to Work by Sex in Wright
The most frequent times of departure to work in Wright are 4:00 PM to 11:59 PM (1,171, 14.3%) for males and 6:30 AM to 6:59 AM (974, 17.4%) for females.
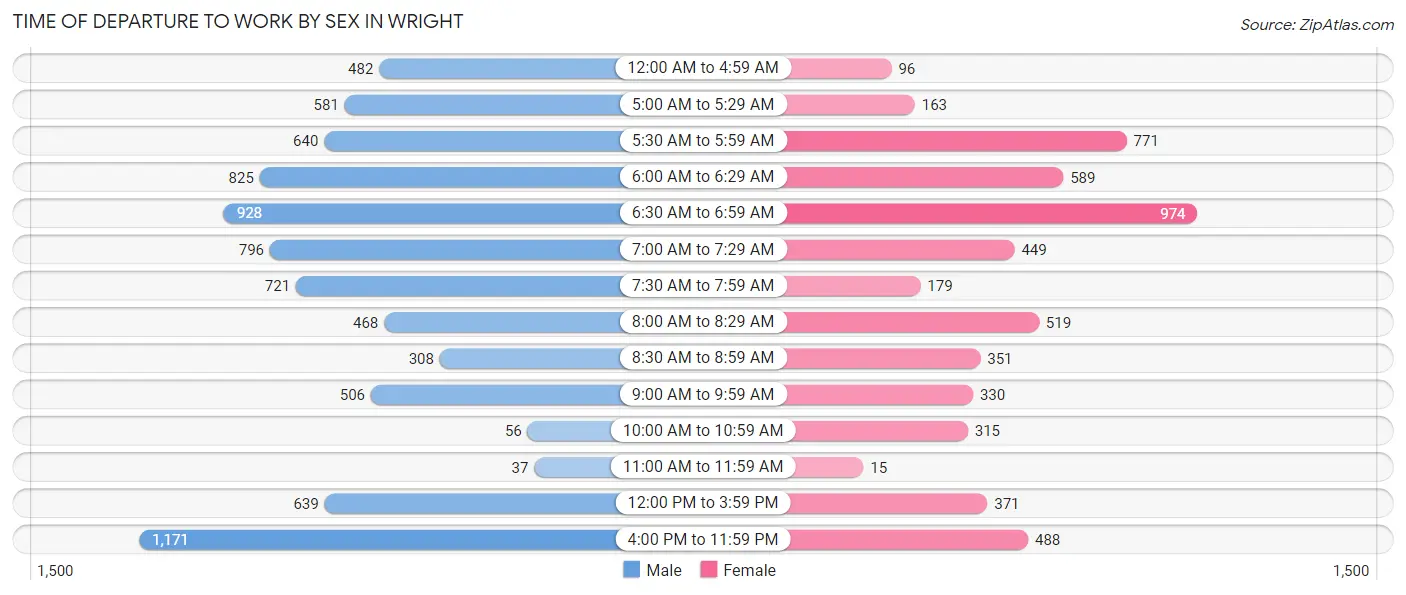
| Time of Departure | Male | Female |
| 12:00 AM to 4:59 AM | 482 (5.9%) | 96 (1.7%) |
| 5:00 AM to 5:29 AM | 581 (7.1%) | 163 (2.9%) |
| 5:30 AM to 5:59 AM | 640 (7.9%) | 771 (13.7%) |
| 6:00 AM to 6:29 AM | 825 (10.1%) | 589 (10.5%) |
| 6:30 AM to 6:59 AM | 928 (11.4%) | 974 (17.4%) |
| 7:00 AM to 7:29 AM | 796 (9.8%) | 449 (8.0%) |
| 7:30 AM to 7:59 AM | 721 (8.8%) | 179 (3.2%) |
| 8:00 AM to 8:29 AM | 468 (5.7%) | 519 (9.2%) |
| 8:30 AM to 8:59 AM | 308 (3.8%) | 351 (6.3%) |
| 9:00 AM to 9:59 AM | 506 (6.2%) | 330 (5.9%) |
| 10:00 AM to 10:59 AM | 56 (0.7%) | 315 (5.6%) |
| 11:00 AM to 11:59 AM | 37 (0.4%) | 15 (0.3%) |
| 12:00 PM to 3:59 PM | 639 (7.8%) | 371 (6.6%) |
| 4:00 PM to 11:59 PM | 1,171 (14.3%) | 488 (8.7%) |
| Total | 8,158 (100.0%) | 5,610 (100.0%) |
Housing Occupancy in Wright
Occupancy by Ownership in Wright
Of the total 11,296 dwellings in Wright, owner-occupied units account for 6,282 (55.6%), while renter-occupied units make up 5,014 (44.4%).
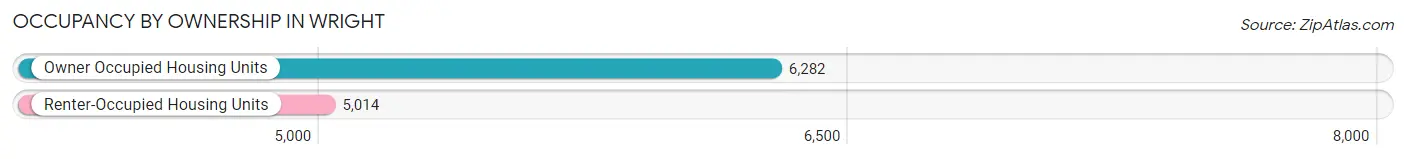
| Occupancy | # Housing Units | % Housing Units |
| Owner Occupied Housing Units | 6,282 | 55.6% |
| Renter-Occupied Housing Units | 5,014 | 44.4% |
| Total Occupied Housing Units | 11,296 | 100.0% |
Occupancy by Household Size in Wright
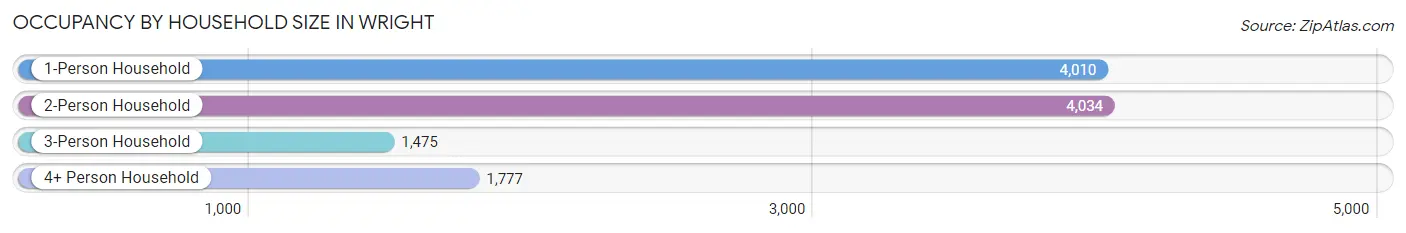
| Household Size | # Housing Units | % Housing Units |
| 1-Person Household | 4,010 | 35.5% |
| 2-Person Household | 4,034 | 35.7% |
| 3-Person Household | 1,475 | 13.1% |
| 4+ Person Household | 1,777 | 15.7% |
| Total Housing Units | 11,296 | 100.0% |
Occupancy by Ownership by Household Size in Wright
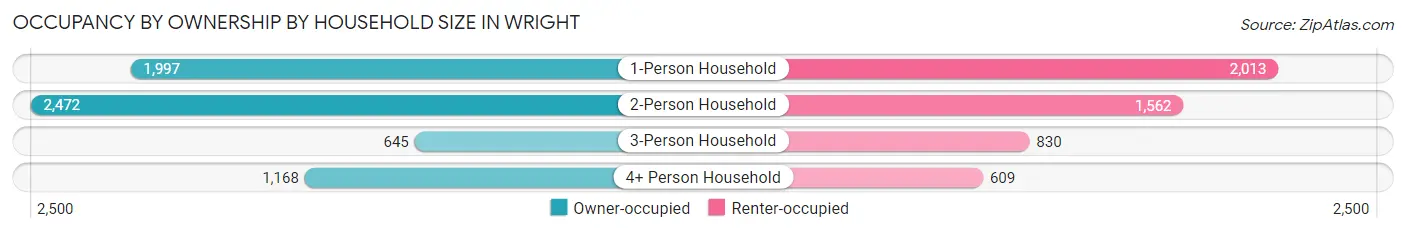
| Household Size | Owner-occupied | Renter-occupied |
| 1-Person Household | 1,997 (49.8%) | 2,013 (50.2%) |
| 2-Person Household | 2,472 (61.3%) | 1,562 (38.7%) |
| 3-Person Household | 645 (43.7%) | 830 (56.3%) |
| 4+ Person Household | 1,168 (65.7%) | 609 (34.3%) |
| Total Housing Units | 6,282 (55.6%) | 5,014 (44.4%) |
Occupancy by Educational Attainment in Wright
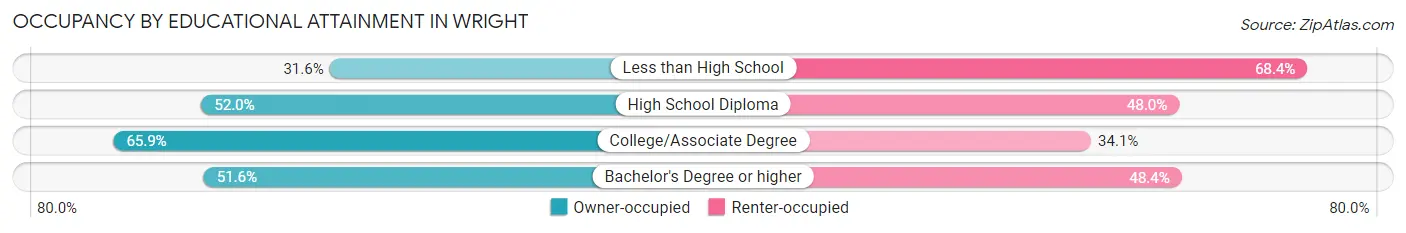
| Household Size | Owner-occupied | Renter-occupied |
| Less than High School | 361 (31.6%) | 780 (68.4%) |
| High School Diploma | 1,288 (52.0%) | 1,191 (48.0%) |
| College/Associate Degree | 3,103 (65.9%) | 1,606 (34.1%) |
| Bachelor's Degree or higher | 1,530 (51.6%) | 1,437 (48.4%) |
Occupancy by Age of Householder in Wright
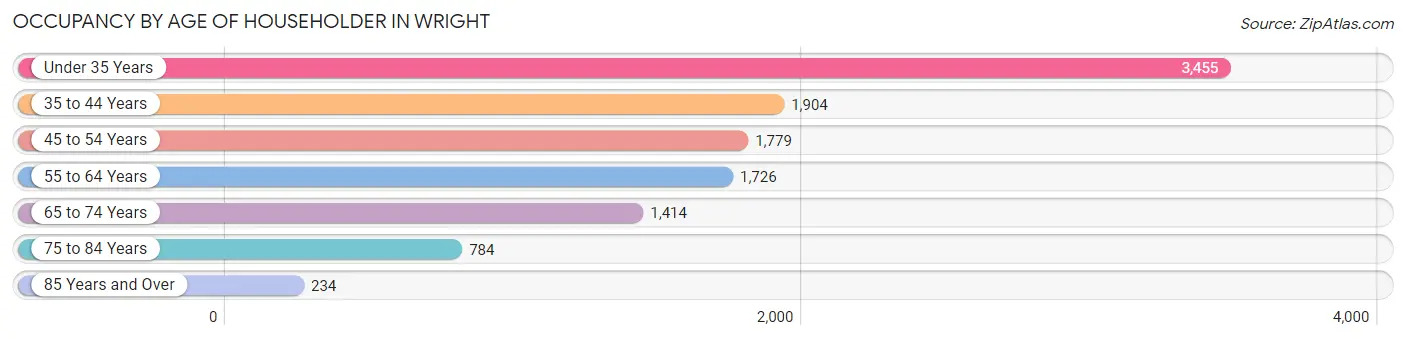
| Age Bracket | # Households | % Households |
| Under 35 Years | 3,455 | 30.6% |
| 35 to 44 Years | 1,904 | 16.9% |
| 45 to 54 Years | 1,779 | 15.8% |
| 55 to 64 Years | 1,726 | 15.3% |
| 65 to 74 Years | 1,414 | 12.5% |
| 75 to 84 Years | 784 | 6.9% |
| 85 Years and Over | 234 | 2.1% |
| Total | 11,296 | 100.0% |
Housing Finances in Wright
Median Income by Occupancy in Wright
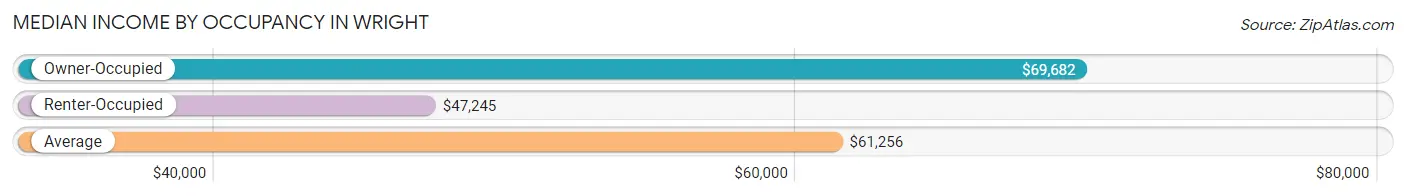
| Occupancy Type | # Households | Median Income |
| Owner-Occupied | 6,282 (55.6%) | $69,682 |
| Renter-Occupied | 5,014 (44.4%) | $47,245 |
| Average | 11,296 (100.0%) | $61,256 |
Occupancy by Householder Income Bracket in Wright
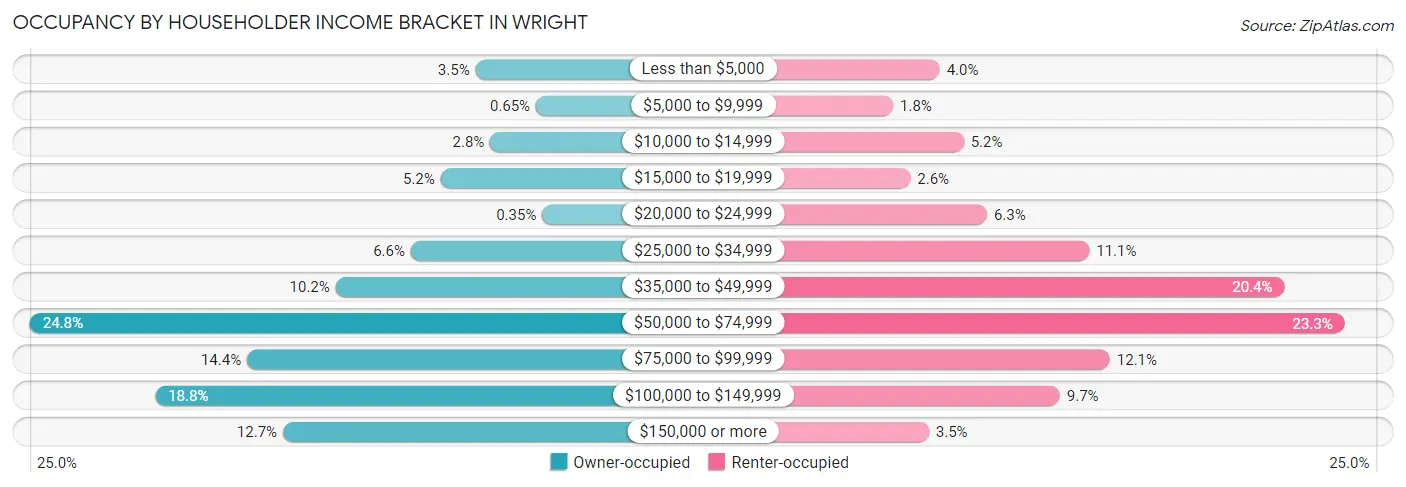
| Income Bracket | Owner-occupied | Renter-occupied |
| Less than $5,000 | 222 (3.5%) | 201 (4.0%) |
| $5,000 to $9,999 | 41 (0.6%) | 90 (1.8%) |
| $10,000 to $14,999 | 178 (2.8%) | 258 (5.1%) |
| $15,000 to $19,999 | 326 (5.2%) | 131 (2.6%) |
| $20,000 to $24,999 | 22 (0.4%) | 314 (6.3%) |
| $25,000 to $34,999 | 415 (6.6%) | 558 (11.1%) |
| $35,000 to $49,999 | 640 (10.2%) | 1,024 (20.4%) |
| $50,000 to $74,999 | 1,555 (24.7%) | 1,168 (23.3%) |
| $75,000 to $99,999 | 905 (14.4%) | 607 (12.1%) |
| $100,000 to $149,999 | 1,180 (18.8%) | 488 (9.7%) |
| $150,000 or more | 798 (12.7%) | 175 (3.5%) |
| Total | 6,282 (100.0%) | 5,014 (100.0%) |
Monthly Housing Cost Tiers in Wright
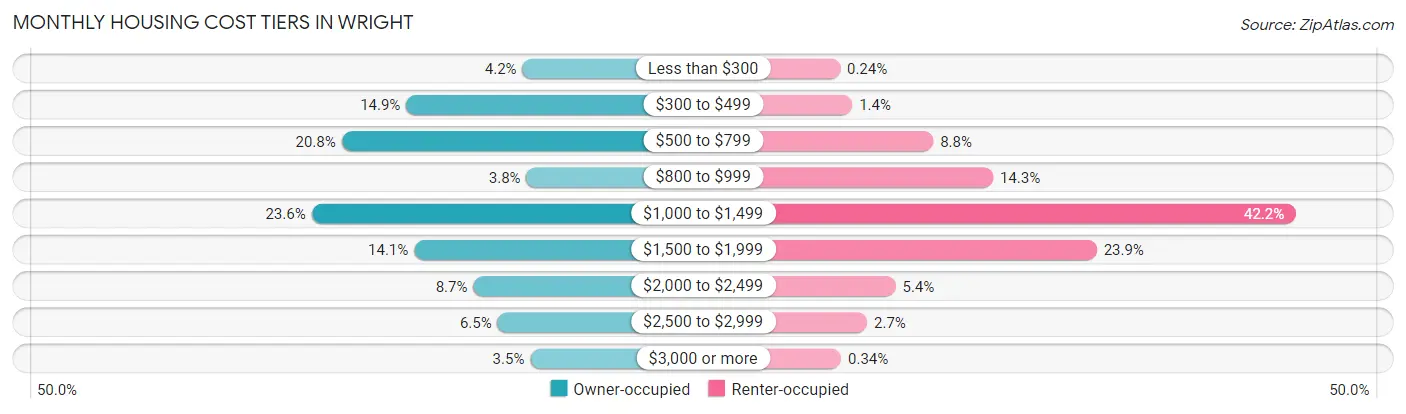
| Monthly Cost | Owner-occupied | Renter-occupied |
| Less than $300 | 262 (4.2%) | 12 (0.2%) |
| $300 to $499 | 934 (14.9%) | 68 (1.4%) |
| $500 to $799 | 1,308 (20.8%) | 442 (8.8%) |
| $800 to $999 | 239 (3.8%) | 718 (14.3%) |
| $1,000 to $1,499 | 1,482 (23.6%) | 2,117 (42.2%) |
| $1,500 to $1,999 | 888 (14.1%) | 1,197 (23.9%) |
| $2,000 to $2,499 | 546 (8.7%) | 268 (5.3%) |
| $2,500 to $2,999 | 406 (6.5%) | 137 (2.7%) |
| $3,000 or more | 217 (3.5%) | 17 (0.3%) |
| Total | 6,282 (100.0%) | 5,014 (100.0%) |
Physical Housing Characteristics in Wright
Housing Structures in Wright
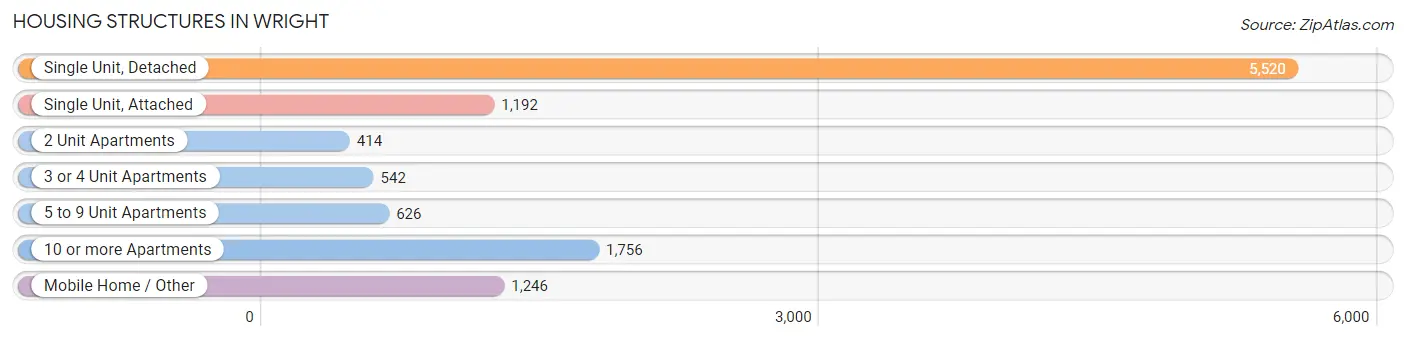
| Structure Type | # Housing Units | % Housing Units |
| Single Unit, Detached | 5,520 | 48.9% |
| Single Unit, Attached | 1,192 | 10.5% |
| 2 Unit Apartments | 414 | 3.7% |
| 3 or 4 Unit Apartments | 542 | 4.8% |
| 5 to 9 Unit Apartments | 626 | 5.5% |
| 10 or more Apartments | 1,756 | 15.5% |
| Mobile Home / Other | 1,246 | 11.0% |
| Total | 11,296 | 100.0% |
Housing Structures by Occupancy in Wright
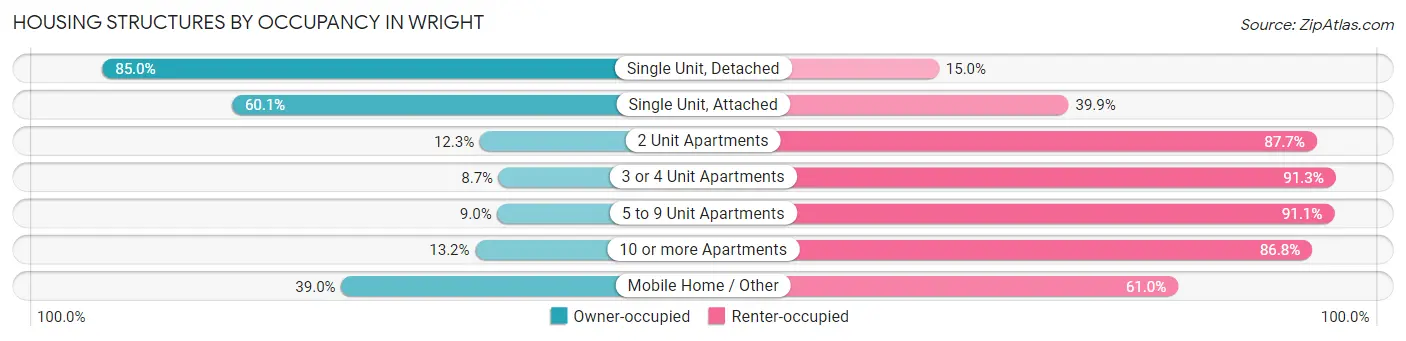
| Structure Type | Owner-occupied | Renter-occupied |
| Single Unit, Detached | 4,694 (85.0%) | 826 (15.0%) |
| Single Unit, Attached | 716 (60.1%) | 476 (39.9%) |
| 2 Unit Apartments | 51 (12.3%) | 363 (87.7%) |
| 3 or 4 Unit Apartments | 47 (8.7%) | 495 (91.3%) |
| 5 to 9 Unit Apartments | 56 (8.9%) | 570 (91.0%) |
| 10 or more Apartments | 232 (13.2%) | 1,524 (86.8%) |
| Mobile Home / Other | 486 (39.0%) | 760 (61.0%) |
| Total | 6,282 (55.6%) | 5,014 (44.4%) |
Housing Structures by Number of Rooms in Wright
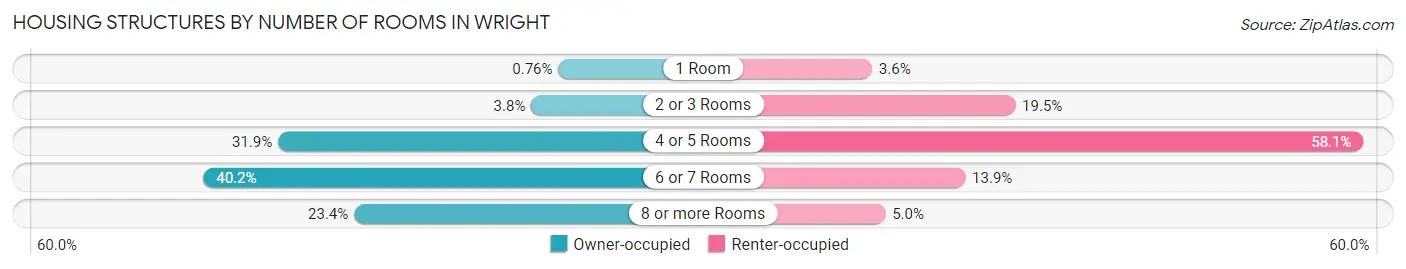
| Number of Rooms | Owner-occupied | Renter-occupied |
| 1 Room | 48 (0.8%) | 178 (3.5%) |
| 2 or 3 Rooms | 237 (3.8%) | 975 (19.5%) |
| 4 or 5 Rooms | 2,002 (31.9%) | 2,912 (58.1%) |
| 6 or 7 Rooms | 2,523 (40.2%) | 697 (13.9%) |
| 8 or more Rooms | 1,472 (23.4%) | 252 (5.0%) |
| Total | 6,282 (100.0%) | 5,014 (100.0%) |
Housing Structure by Heating Type in Wright
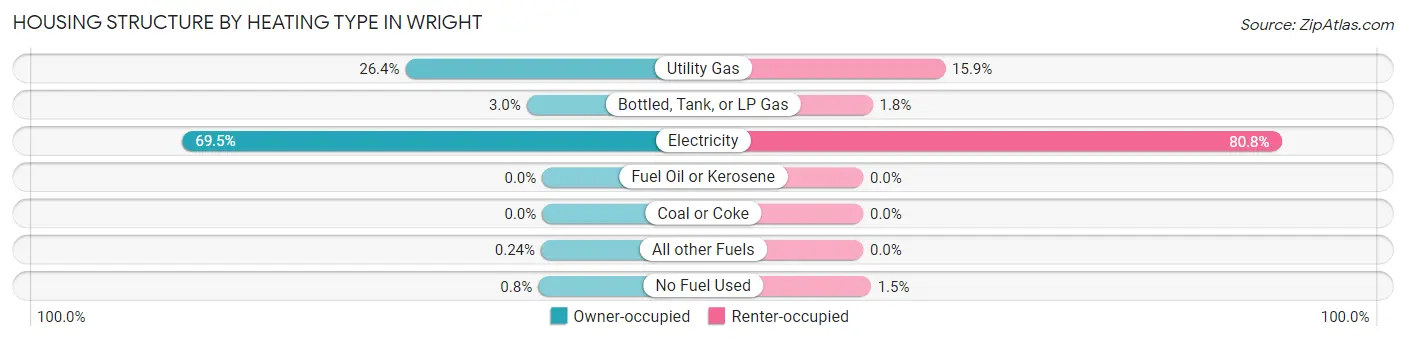
| Heating Type | Owner-occupied | Renter-occupied |
| Utility Gas | 1,661 (26.4%) | 795 (15.9%) |
| Bottled, Tank, or LP Gas | 189 (3.0%) | 92 (1.8%) |
| Electricity | 4,367 (69.5%) | 4,053 (80.8%) |
| Fuel Oil or Kerosene | 0 (0.0%) | 0 (0.0%) |
| Coal or Coke | 0 (0.0%) | 0 (0.0%) |
| All other Fuels | 15 (0.2%) | 0 (0.0%) |
| No Fuel Used | 50 (0.8%) | 74 (1.5%) |
| Total | 6,282 (100.0%) | 5,014 (100.0%) |
Household Vehicle Usage in Wright
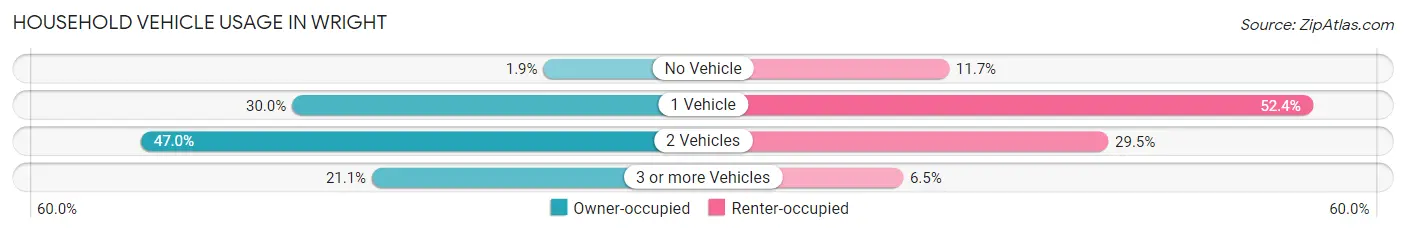
| Vehicles per Household | Owner-occupied | Renter-occupied |
| No Vehicle | 119 (1.9%) | 584 (11.7%) |
| 1 Vehicle | 1,887 (30.0%) | 2,626 (52.4%) |
| 2 Vehicles | 2,951 (47.0%) | 1,478 (29.5%) |
| 3 or more Vehicles | 1,325 (21.1%) | 326 (6.5%) |
| Total | 6,282 (100.0%) | 5,014 (100.0%) |
Real Estate & Mortgages in Wright
Real Estate and Mortgage Overview in Wright
| Characteristic | Without Mortgage | With Mortgage |
| Housing Units | 2,355 | 3,927 |
| Median Property Value | $213,300 | $266,000 |
| Median Household Income | $52,983 | $479 |
| Monthly Housing Costs | $497 | $217 |
| Real Estate Taxes | $1,212 | $188 |
Property Value by Mortgage Status in Wright
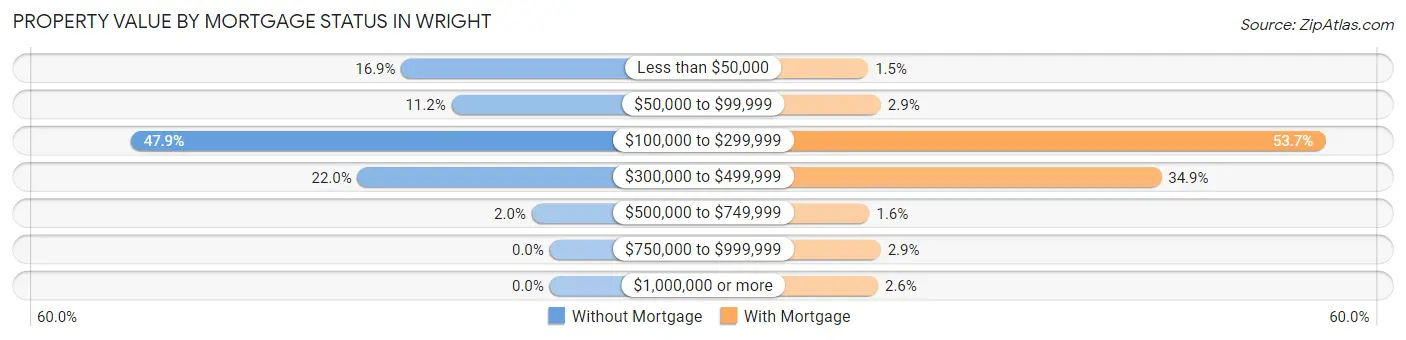
| Property Value | Without Mortgage | With Mortgage |
| Less than $50,000 | 399 (16.9%) | 57 (1.5%) |
| $50,000 to $99,999 | 264 (11.2%) | 114 (2.9%) |
| $100,000 to $299,999 | 1,127 (47.9%) | 2,107 (53.6%) |
| $300,000 to $499,999 | 517 (22.0%) | 1,372 (34.9%) |
| $500,000 to $749,999 | 48 (2.0%) | 63 (1.6%) |
| $750,000 to $999,999 | 0 (0.0%) | 113 (2.9%) |
| $1,000,000 or more | 0 (0.0%) | 101 (2.6%) |
| Total | 2,355 (100.0%) | 3,927 (100.0%) |
Household Income by Mortgage Status in Wright
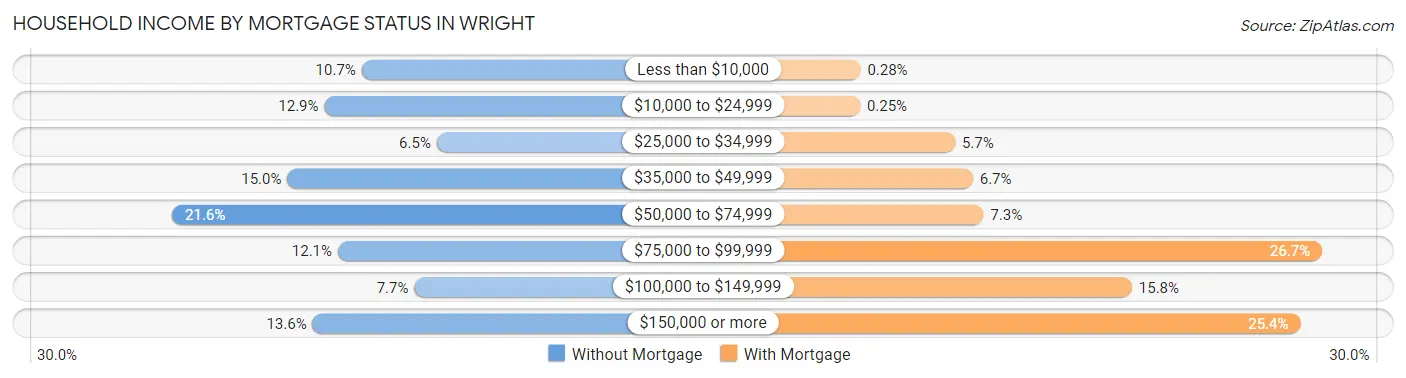
| Household Income | Without Mortgage | With Mortgage |
| Less than $10,000 | 253 (10.7%) | 11 (0.3%) |
| $10,000 to $24,999 | 303 (12.9%) | 10 (0.3%) |
| $25,000 to $34,999 | 152 (6.5%) | 223 (5.7%) |
| $35,000 to $49,999 | 353 (15.0%) | 263 (6.7%) |
| $50,000 to $74,999 | 508 (21.6%) | 287 (7.3%) |
| $75,000 to $99,999 | 285 (12.1%) | 1,047 (26.7%) |
| $100,000 to $149,999 | 182 (7.7%) | 620 (15.8%) |
| $150,000 or more | 319 (13.6%) | 998 (25.4%) |
| Total | 2,355 (100.0%) | 3,927 (100.0%) |
Property Value to Household Income Ratio in Wright
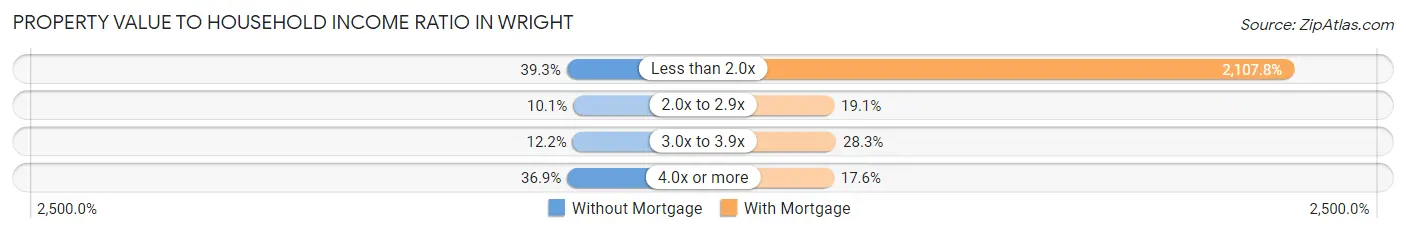
| Value-to-Income Ratio | Without Mortgage | With Mortgage |
| Less than 2.0x | 926 (39.3%) | 82,772 (2,107.8%) |
| 2.0x to 2.9x | 237 (10.1%) | 748 (19.1%) |
| 3.0x to 3.9x | 288 (12.2%) | 1,112 (28.3%) |
| 4.0x or more | 869 (36.9%) | 689 (17.5%) |
| Total | 2,355 (100.0%) | 3,927 (100.0%) |
Real Estate Taxes by Mortgage Status in Wright
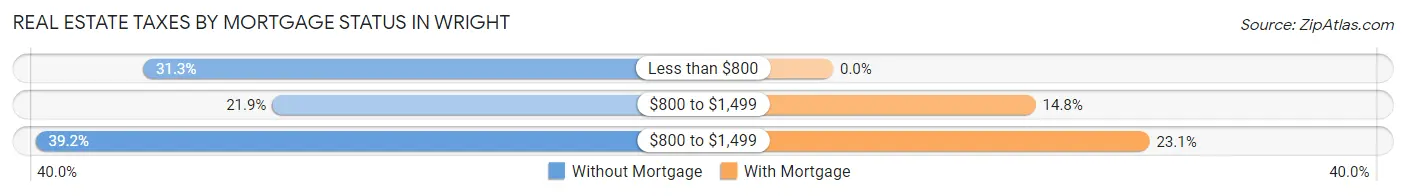
| Property Taxes | Without Mortgage | With Mortgage |
| Less than $800 | 738 (31.3%) | 0 (0.0%) |
| $800 to $1,499 | 516 (21.9%) | 581 (14.8%) |
| $800 to $1,499 | 923 (39.2%) | 908 (23.1%) |
| Total | 2,355 (100.0%) | 3,927 (100.0%) |
Health & Disability in Wright
Health Insurance Coverage by Age in Wright
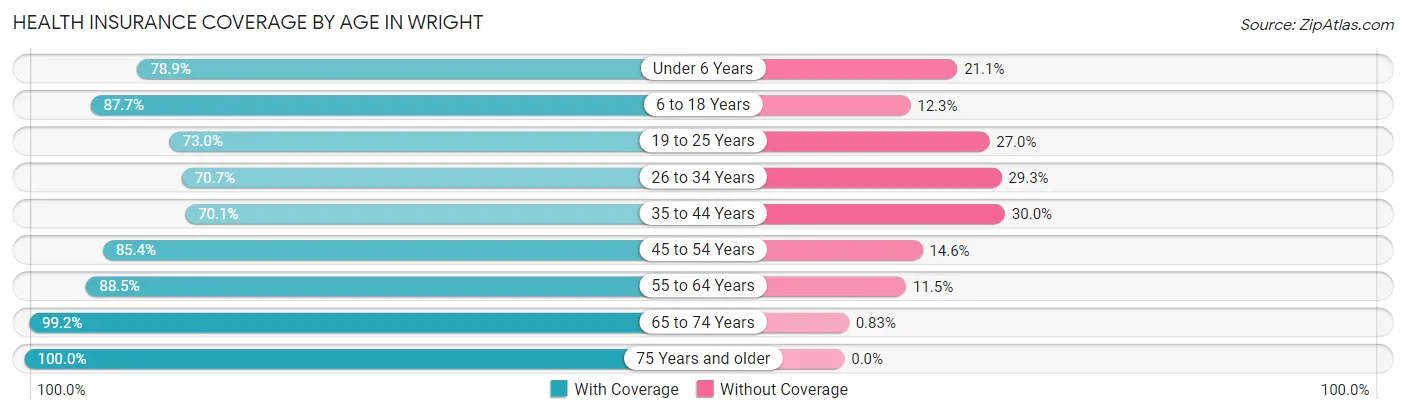
| Age Bracket | With Coverage | Without Coverage |
| Under 6 Years | 1,754 (78.9%) | 468 (21.1%) |
| 6 to 18 Years | 2,938 (87.7%) | 412 (12.3%) |
| 19 to 25 Years | 1,290 (73.0%) | 478 (27.0%) |
| 26 to 34 Years | 2,196 (70.7%) | 910 (29.3%) |
| 35 to 44 Years | 2,498 (70.1%) | 1,068 (29.9%) |
| 45 to 54 Years | 2,510 (85.4%) | 428 (14.6%) |
| 55 to 64 Years | 2,795 (88.5%) | 364 (11.5%) |
| 65 to 74 Years | 2,274 (99.2%) | 19 (0.8%) |
| 75 Years and older | 1,536 (100.0%) | 0 (0.0%) |
| Total | 19,791 (82.7%) | 4,147 (17.3%) |
Health Insurance Coverage by Citizenship Status in Wright

| Citizenship Status | With Coverage | Without Coverage |
| Native Born | 1,754 (78.9%) | 468 (21.1%) |
| Foreign Born, Citizen | 2,938 (87.7%) | 412 (12.3%) |
| Foreign Born, not a Citizen | 1,290 (73.0%) | 478 (27.0%) |
Health Insurance Coverage by Household Income in Wright
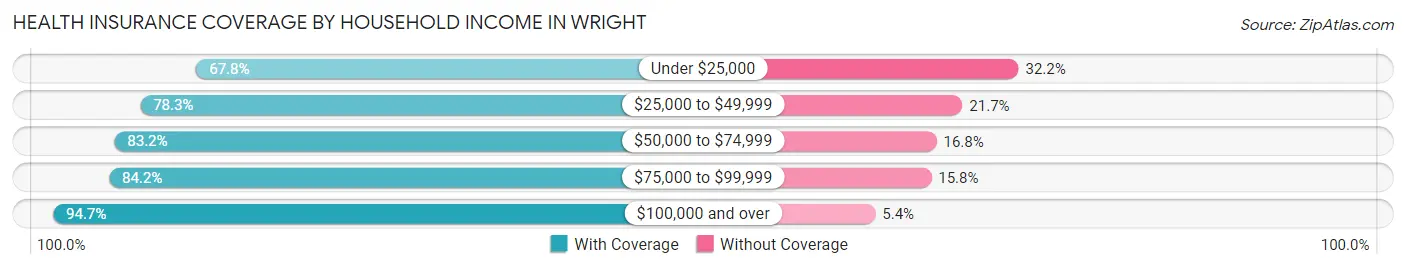
| Household Income | With Coverage | Without Coverage |
| Under $25,000 | 2,571 (67.8%) | 1,220 (32.2%) |
| $25,000 to $49,999 | 3,811 (78.3%) | 1,054 (21.7%) |
| $50,000 to $74,999 | 4,952 (83.2%) | 1,001 (16.8%) |
| $75,000 to $99,999 | 2,765 (84.2%) | 520 (15.8%) |
| $100,000 and over | 5,649 (94.7%) | 319 (5.3%) |
Public vs Private Health Insurance Coverage by Age in Wright
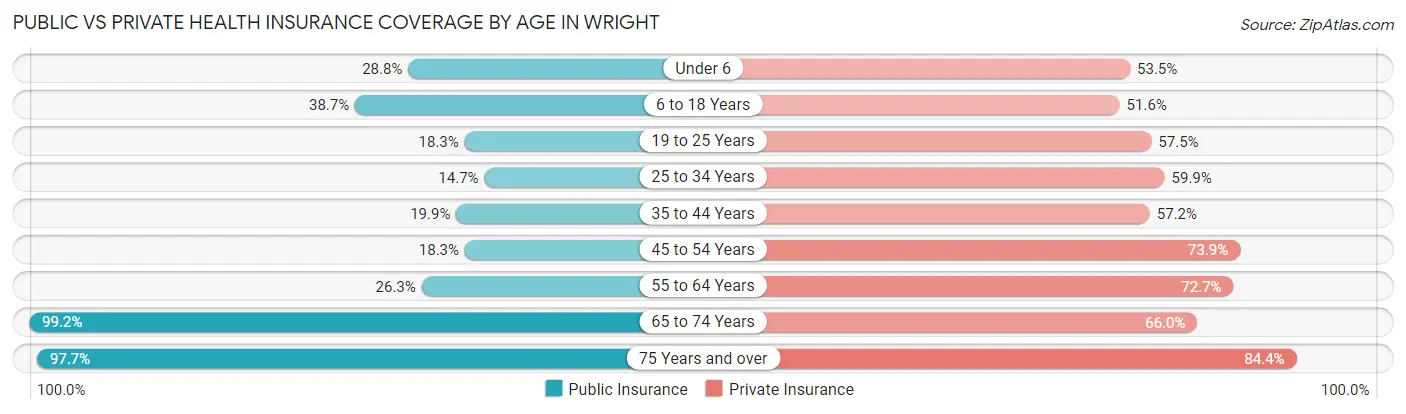
| Age Bracket | Public Insurance | Private Insurance |
| Under 6 | 640 (28.8%) | 1,189 (53.5%) |
| 6 to 18 Years | 1,295 (38.7%) | 1,728 (51.6%) |
| 19 to 25 Years | 324 (18.3%) | 1,016 (57.5%) |
| 25 to 34 Years | 455 (14.6%) | 1,861 (59.9%) |
| 35 to 44 Years | 709 (19.9%) | 2,039 (57.2%) |
| 45 to 54 Years | 537 (18.3%) | 2,172 (73.9%) |
| 55 to 64 Years | 831 (26.3%) | 2,296 (72.7%) |
| 65 to 74 Years | 2,274 (99.2%) | 1,513 (66.0%) |
| 75 Years and over | 1,501 (97.7%) | 1,296 (84.4%) |
| Total | 8,566 (35.8%) | 15,110 (63.1%) |
Disability Status by Sex by Age in Wright
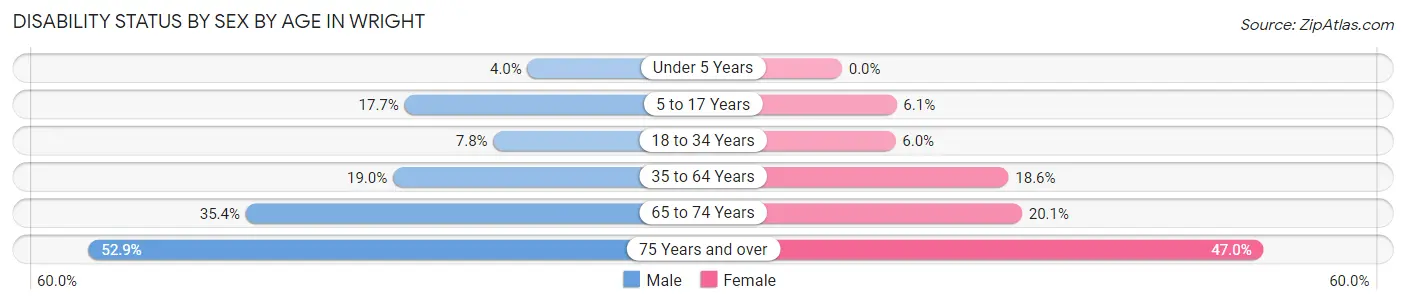
| Age Bracket | Male | Female |
| Under 5 Years | 48 (4.0%) | 0 (0.0%) |
| 5 to 17 Years | 236 (17.7%) | 121 (6.1%) |
| 18 to 34 Years | 179 (7.8%) | 171 (6.0%) |
| 35 to 64 Years | 912 (19.0%) | 901 (18.5%) |
| 65 to 74 Years | 416 (35.4%) | 224 (20.1%) |
| 75 Years and over | 238 (52.9%) | 510 (47.0%) |
Disability Class by Sex by Age in Wright
Disability Class: Hearing Difficulty
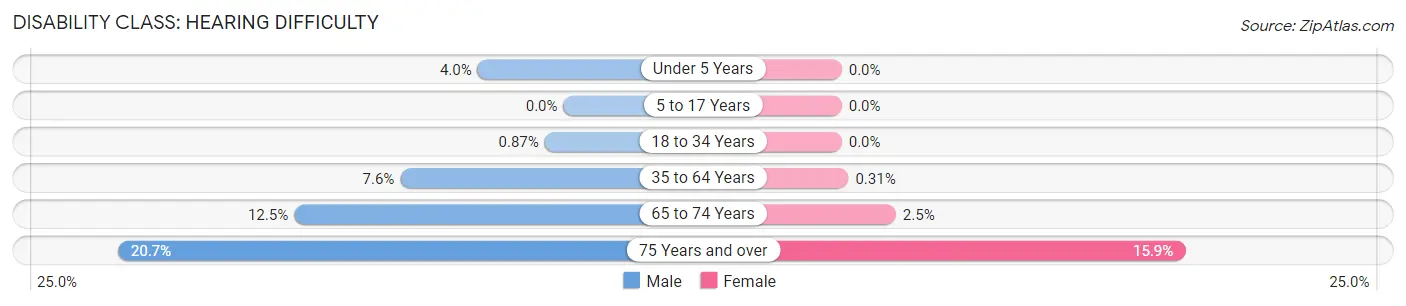
| Age Bracket | Male | Female |
| Under 5 Years | 48 (4.0%) | 0 (0.0%) |
| 5 to 17 Years | 0 (0.0%) | 0 (0.0%) |
| 18 to 34 Years | 20 (0.9%) | 0 (0.0%) |
| 35 to 64 Years | 364 (7.6%) | 15 (0.3%) |
| 65 to 74 Years | 147 (12.5%) | 28 (2.5%) |
| 75 Years and over | 93 (20.7%) | 173 (15.9%) |
Disability Class: Vision Difficulty
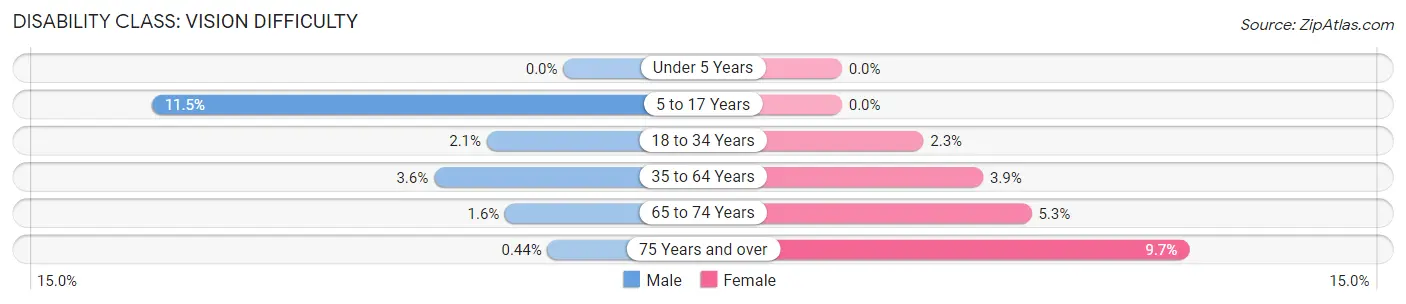
| Age Bracket | Male | Female |
| Under 5 Years | 0 (0.0%) | 0 (0.0%) |
| 5 to 17 Years | 153 (11.5%) | 0 (0.0%) |
| 18 to 34 Years | 49 (2.1%) | 65 (2.3%) |
| 35 to 64 Years | 173 (3.6%) | 191 (3.9%) |
| 65 to 74 Years | 19 (1.6%) | 59 (5.3%) |
| 75 Years and over | 2 (0.4%) | 105 (9.7%) |
Disability Class: Cognitive Difficulty
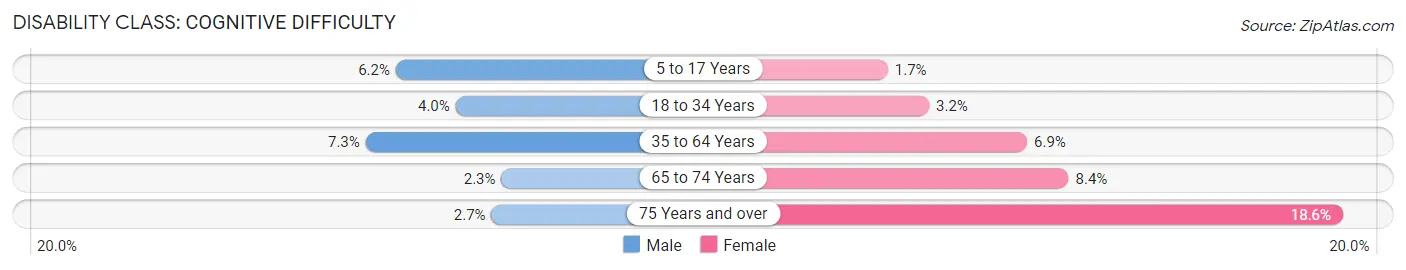
| Age Bracket | Male | Female |
| 5 to 17 Years | 83 (6.2%) | 34 (1.7%) |
| 18 to 34 Years | 92 (4.0%) | 93 (3.2%) |
| 35 to 64 Years | 353 (7.3%) | 334 (6.9%) |
| 65 to 74 Years | 27 (2.3%) | 94 (8.4%) |
| 75 Years and over | 12 (2.7%) | 202 (18.6%) |
Disability Class: Ambulatory Difficulty
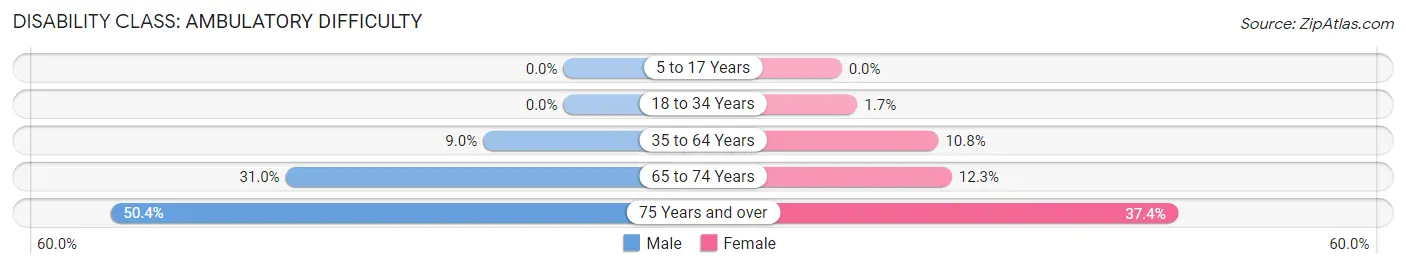
| Age Bracket | Male | Female |
| 5 to 17 Years | 0 (0.0%) | 0 (0.0%) |
| 18 to 34 Years | 0 (0.0%) | 50 (1.7%) |
| 35 to 64 Years | 430 (8.9%) | 523 (10.8%) |
| 65 to 74 Years | 364 (30.9%) | 137 (12.3%) |
| 75 Years and over | 227 (50.4%) | 406 (37.4%) |
Disability Class: Self-Care Difficulty
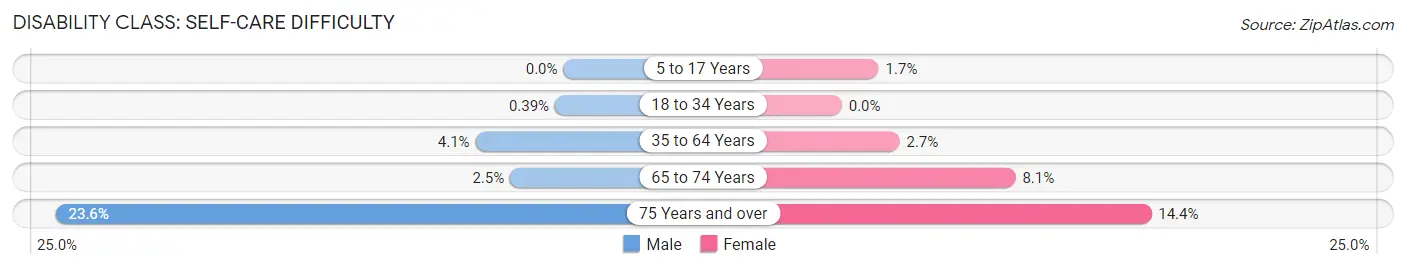
| Age Bracket | Male | Female |
| 5 to 17 Years | 0 (0.0%) | 34 (1.7%) |
| 18 to 34 Years | 9 (0.4%) | 0 (0.0%) |
| 35 to 64 Years | 196 (4.1%) | 130 (2.7%) |
| 65 to 74 Years | 29 (2.5%) | 90 (8.1%) |
| 75 Years and over | 106 (23.6%) | 156 (14.4%) |
Technology Access in Wright
Computing Device Access in Wright
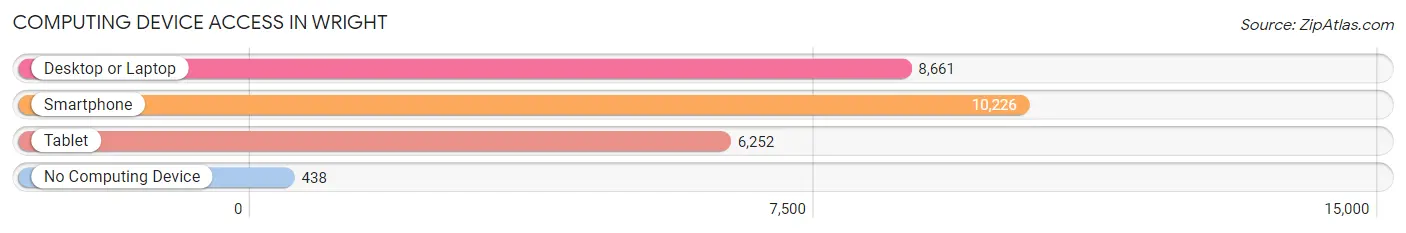
| Device Type | # Households | % Households |
| Desktop or Laptop | 8,661 | 76.7% |
| Smartphone | 10,226 | 90.5% |
| Tablet | 6,252 | 55.3% |
| No Computing Device | 438 | 3.9% |
| Total | 11,296 | 100.0% |
Internet Access in Wright
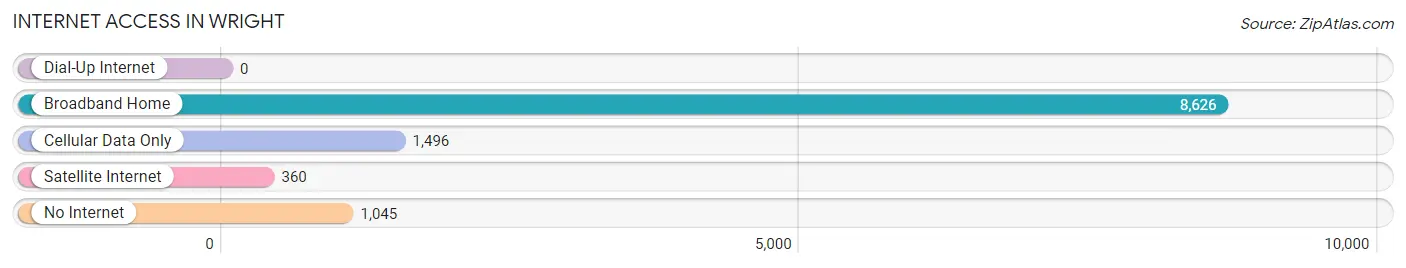
| Internet Type | # Households | % Households |
| Dial-Up Internet | 0 | 0.0% |
| Broadband Home | 8,626 | 76.4% |
| Cellular Data Only | 1,496 | 13.2% |
| Satellite Internet | 360 | 3.2% |
| No Internet | 1,045 | 9.2% |
| Total | 11,296 | 100.0% |
Wright Summary
Wright is a small town located in the state of Florida, in the United States. It is situated in the northern part of the state, in Escambia County. The town has a population of approximately 1,000 people, and is part of the Pensacola-Ferry Pass-Brent Metropolitan Statistical Area.
History
Wright was founded in 1883 by a group of settlers from Georgia. The town was named after the Wright family, who were among the first settlers. The town was originally a farming community, and the main crops grown were cotton, corn, and peanuts. In the early 1900s, the town began to grow and develop, and by the 1920s, it had become a thriving community.
In the 1950s, Wright began to experience a period of growth and development. The town was incorporated in 1956, and the population began to increase. In the 1960s, the town experienced a period of rapid growth, and the population increased to over 1,000 people.
Geography
Wright is located in the northern part of Escambia County, in the state of Florida. The town is situated on the banks of the Escambia River, and is surrounded by the Blackwater River to the east and the Perdido River to the west. The town is located approximately 25 miles north of Pensacola, and is part of the Pensacola-Ferry Pass-Brent Metropolitan Statistical Area.
The town has a total area of 1.2 square miles, all of which is land. The town is located at an elevation of 30 feet above sea level. The climate in Wright is classified as humid subtropical, with hot, humid summers and mild winters.
Economy
The economy of Wright is largely based on agriculture. The town is home to several farms, which produce a variety of crops, including cotton, corn, peanuts, and soybeans. The town is also home to several small businesses, including restaurants, retail stores, and service providers.
The town is also home to a number of manufacturing companies, which produce a variety of products, including furniture, clothing, and electronics. The town is also home to a number of government offices, including the Escambia County Courthouse and the Escambia County Sheriff's Office.
Demographics
As of the 2010 census, the population of Wright was 1,000 people. The racial makeup of the town was 94.2% White, 2.2% African American, 0.7% Native American, 0.7% Asian, 0.3% from other races, and 1.9% from two or more races. Hispanic or Latino of any race were 2.2% of the population.
The median income for a household in Wright was $37,500, and the median income for a family was $45,000. The per capita income for the town was $18,000. About 11.2% of families and 14.2% of the population were below the poverty line, including 18.2% of those under age 18 and 8.2% of those age 65 or over.
Common Questions
What is Per Capita Income in Wright?
Per Capita income in Wright is $33,020.
What is the Median Family Income in Wright?
Median Family Income in Wright is $69,356.
What is the Median Household income in Wright?
Median Household Income in Wright is $61,256.
What is Income or Wage Gap in Wright?
Income or Wage Gap in Wright is 37.3%.
Women in Wright earn 62.7 cents for every dollar earned by a man.
What is Family Income Deficit in Wright?
Family Income Deficit in Wright is $8,719.
Families that are below poverty line in Wright earn $8,719 less on average than the poverty threshold level.
What is Inequality or Gini Index in Wright?
Inequality or Gini Index in Wright is 0.38.
What is the Total Population of Wright?
Total Population of Wright is 26,272.
What is the Total Male Population of Wright?
Total Male Population of Wright is 13,183.
What is the Total Female Population of Wright?
Total Female Population of Wright is 13,089.
What is the Ratio of Males per 100 Females in Wright?
There are 100.72 Males per 100 Females in Wright.
What is the Ratio of Females per 100 Males in Wright?
There are 99.29 Females per 100 Males in Wright.
What is the Median Population Age in Wright?
Median Population Age in Wright is 36.4 Years.
What is the Average Family Size in Wright
Average Family Size in Wright is 3.0 People.
What is the Average Household Size in Wright
Average Household Size in Wright is 2.3 People.
How Large is the Labor Force in Wright?
There are 14,857 People in the Labor Forcein in Wright.
What is the Percentage of People in the Labor Force in Wright?
68.8% of People are in the Labor Force in Wright.
What is the Unemployment Rate in Wright?
Unemployment Rate in Wright is 3.5%.