Bee Ridge, FL Map & Demographics
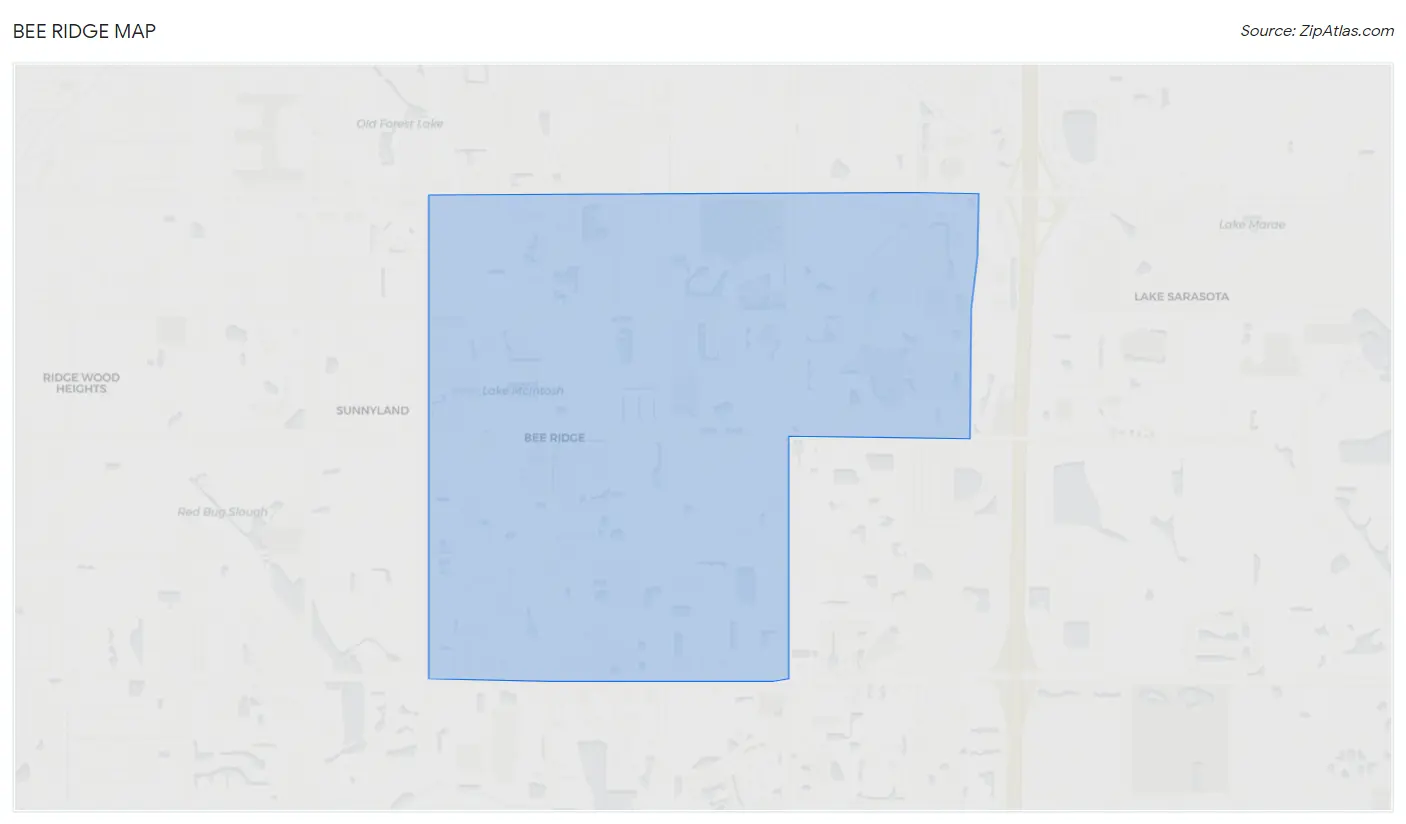
Bee Ridge Map
Bee Ridge Overview
$47,115
PER CAPITA INCOME
$90,877
AVG FAMILY INCOME
$75,718
AVG HOUSEHOLD INCOME
39.4%
WAGE / INCOME GAP [ % ]
60.6¢/ $1
WAGE / INCOME GAP [ $ ]
$8,520
FAMILY INCOME DEFICIT
0.47
INEQUALITY / GINI INDEX
10,069
TOTAL POPULATION
4,628
MALE POPULATION
5,441
FEMALE POPULATION
85.06
MALES / 100 FEMALES
117.57
FEMALES / 100 MALES
55.3
MEDIAN AGE
2.7
AVG FAMILY SIZE
2.1
AVG HOUSEHOLD SIZE
4,602
LABOR FORCE [ PEOPLE ]
53.2%
PERCENT IN LABOR FORCE
2.7%
UNEMPLOYMENT RATE
Income in Bee Ridge
Income Overview in Bee Ridge
Per Capita Income in Bee Ridge is $47,115, while median incomes of families and households are $90,877 and $75,718 respectively.
| Characteristic | Number | Measure |
| Per Capita Income | 10,069 | $47,115 |
| Median Family Income | 2,731 | $90,877 |
| Mean Family Income | 2,731 | $124,951 |
| Median Household Income | 4,670 | $75,718 |
| Mean Household Income | 4,670 | $99,529 |
| Income Deficit | 2,731 | $8,520 |
| Wage / Income Gap (%) | 10,069 | 39.42% |
| Wage / Income Gap ($) | 10,069 | 60.58¢ per $1 |
| Gini / Inequality Index | 10,069 | 0.47 |
Earnings by Sex in Bee Ridge
Average Earnings in Bee Ridge are $43,266, $53,423 for men and $32,363 for women, a difference of 39.4%.
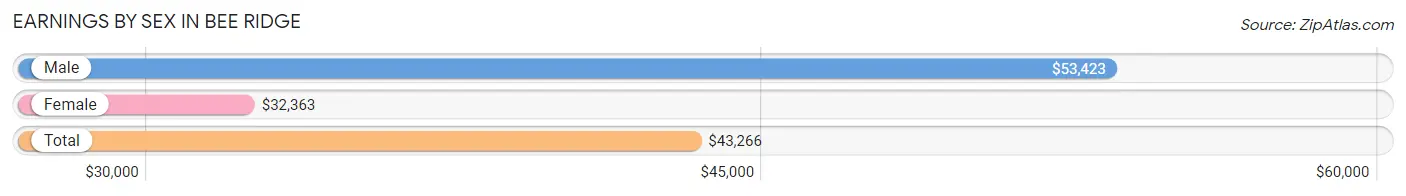
| Sex | Number | Average Earnings |
| Male | 2,367 (49.7%) | $53,423 |
| Female | 2,396 (50.3%) | $32,363 |
| Total | 4,763 (100.0%) | $43,266 |
Earnings by Sex by Income Bracket in Bee Ridge
The most common earnings brackets in Bee Ridge are $100,000+ for men (608 | 25.7%) and $100,000+ for women (277 | 11.6%).
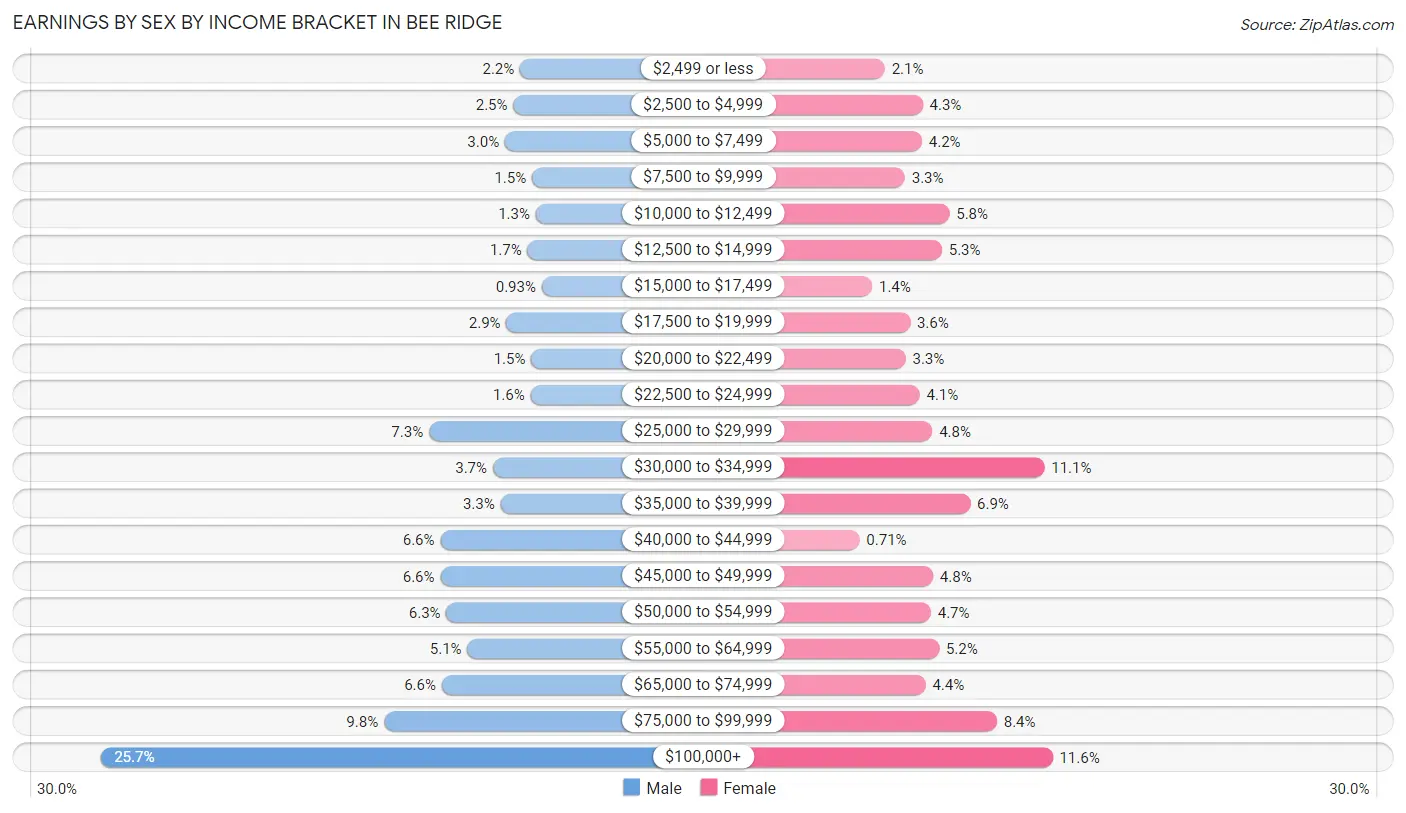
| Income | Male | Female |
| $2,499 or less | 51 (2.1%) | 51 (2.1%) |
| $2,500 to $4,999 | 60 (2.5%) | 102 (4.3%) |
| $5,000 to $7,499 | 71 (3.0%) | 101 (4.2%) |
| $7,500 to $9,999 | 35 (1.5%) | 78 (3.3%) |
| $10,000 to $12,499 | 30 (1.3%) | 138 (5.8%) |
| $12,500 to $14,999 | 41 (1.7%) | 128 (5.3%) |
| $15,000 to $17,499 | 22 (0.9%) | 34 (1.4%) |
| $17,500 to $19,999 | 69 (2.9%) | 85 (3.5%) |
| $20,000 to $22,499 | 36 (1.5%) | 79 (3.3%) |
| $22,500 to $24,999 | 37 (1.6%) | 98 (4.1%) |
| $25,000 to $29,999 | 172 (7.3%) | 115 (4.8%) |
| $30,000 to $34,999 | 87 (3.7%) | 266 (11.1%) |
| $35,000 to $39,999 | 77 (3.3%) | 166 (6.9%) |
| $40,000 to $44,999 | 157 (6.6%) | 17 (0.7%) |
| $45,000 to $49,999 | 157 (6.6%) | 116 (4.8%) |
| $50,000 to $54,999 | 149 (6.3%) | 113 (4.7%) |
| $55,000 to $64,999 | 121 (5.1%) | 124 (5.2%) |
| $65,000 to $74,999 | 155 (6.6%) | 106 (4.4%) |
| $75,000 to $99,999 | 232 (9.8%) | 202 (8.4%) |
| $100,000+ | 608 (25.7%) | 277 (11.6%) |
| Total | 2,367 (100.0%) | 2,396 (100.0%) |
Earnings by Sex by Educational Attainment in Bee Ridge
Average earnings in Bee Ridge are $54,416 for men and $35,493 for women, a difference of 34.8%. Men with an educational attainment of graduate degree enjoy the highest average annual earnings of $250,001, while those with less than high school education earn the least with $41,688. Women with an educational attainment of graduate degree earn the most with the average annual earnings of $54,607, while those with high school diploma education have the smallest earnings of $30,516.
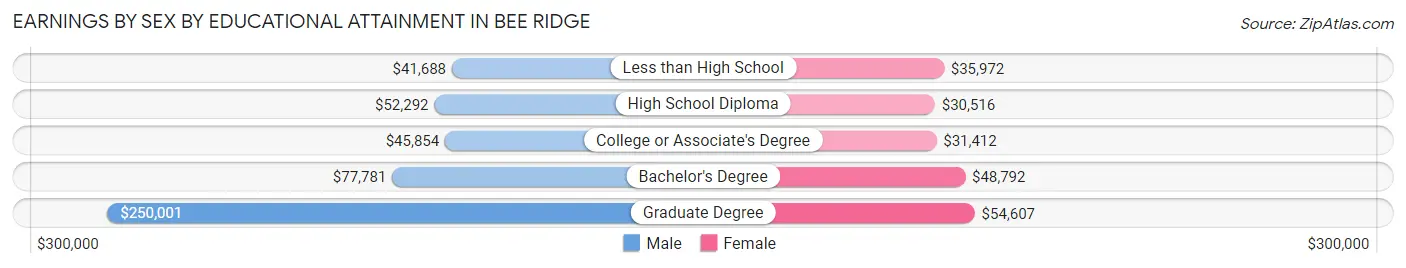
| Educational Attainment | Male Income | Female Income |
| Less than High School | $41,688 | $35,972 |
| High School Diploma | $52,292 | $30,516 |
| College or Associate's Degree | $45,854 | $31,412 |
| Bachelor's Degree | $77,781 | $48,792 |
| Graduate Degree | $250,001 | $54,607 |
| Total | $54,416 | $35,493 |
Family Income in Bee Ridge
Family Income Brackets in Bee Ridge
According to the Bee Ridge family income data, there are 516 families falling into the $75,000 to $99,999 income range, which is the most common income bracket and makes up 18.9% of all families. Conversely, the less than $10,000 income bracket is the least frequent group with only 41 families (1.5%) belonging to this category.
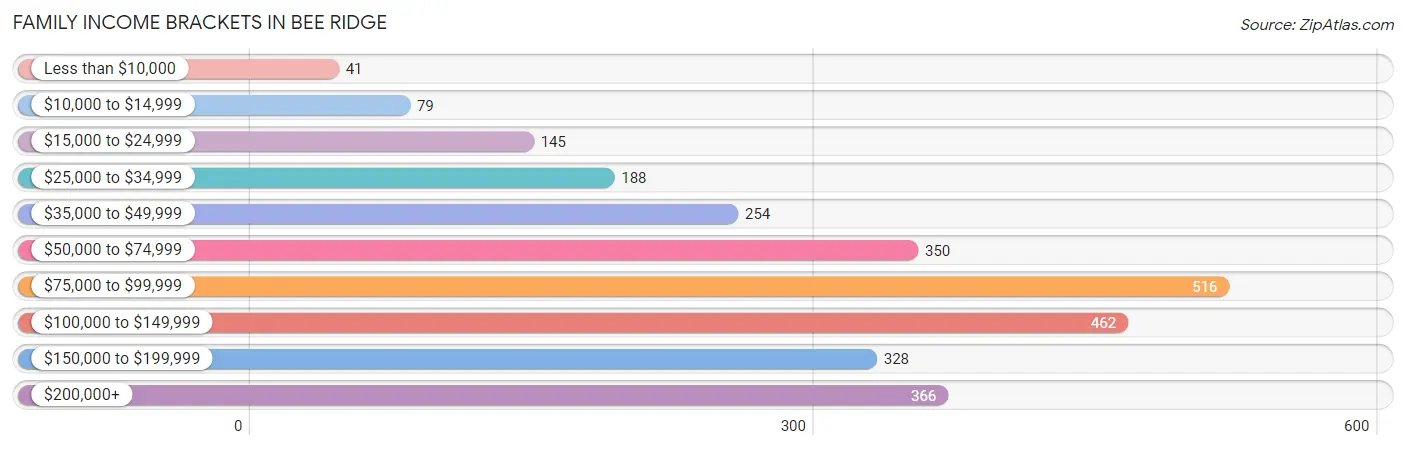
| Income Bracket | # Families | % Families |
| Less than $10,000 | 41 | 1.5% |
| $10,000 to $14,999 | 79 | 2.9% |
| $15,000 to $24,999 | 145 | 5.3% |
| $25,000 to $34,999 | 188 | 6.9% |
| $35,000 to $49,999 | 254 | 9.3% |
| $50,000 to $74,999 | 350 | 12.8% |
| $75,000 to $99,999 | 516 | 18.9% |
| $100,000 to $149,999 | 462 | 16.9% |
| $150,000 to $199,999 | 328 | 12.0% |
| $200,000+ | 366 | 13.4% |
Family Income by Famaliy Size in Bee Ridge
5-person families (102 | 3.7%) account for the highest median family income in Bee Ridge with $142,700 per family, while 2-person families (1,811 | 66.3%) have the highest median income of $45,052 per family member.
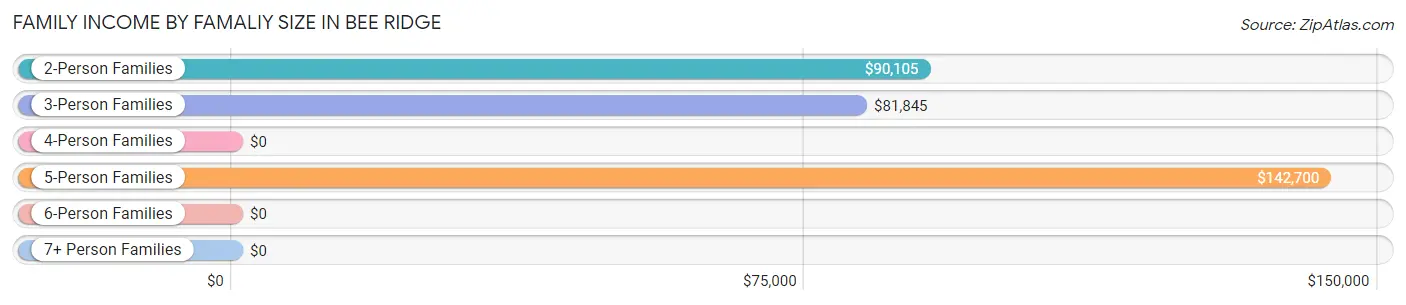
| Income Bracket | # Families | Median Income |
| 2-Person Families | 1,811 (66.3%) | $90,105 |
| 3-Person Families | 501 (18.3%) | $81,845 |
| 4-Person Families | 270 (9.9%) | $0 |
| 5-Person Families | 102 (3.7%) | $142,700 |
| 6-Person Families | 47 (1.7%) | $0 |
| 7+ Person Families | 0 (0.0%) | $0 |
| Total | 2,731 (100.0%) | $90,877 |
Family Income by Number of Earners in Bee Ridge
The median family income in Bee Ridge is $90,877, with families comprising 3+ earners (158) having the highest median family income of $159,662, while families with 1 earner (1,129) have the lowest median family income of $61,932, accounting for 5.8% and 41.3% of families, respectively.
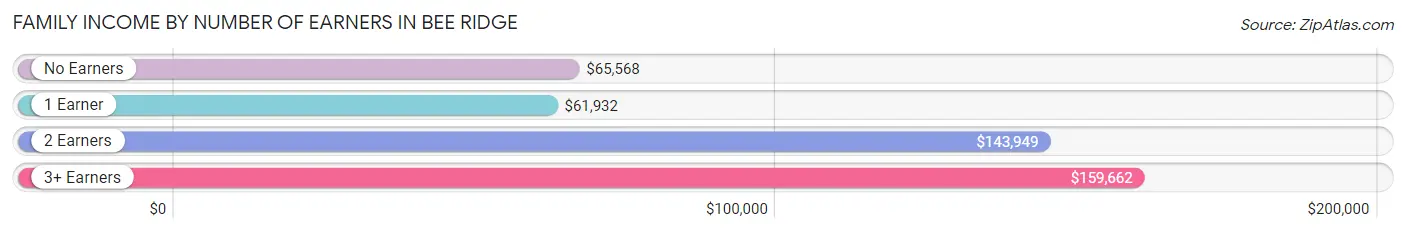
| Number of Earners | # Families | Median Income |
| No Earners | 476 (17.4%) | $65,568 |
| 1 Earner | 1,129 (41.3%) | $61,932 |
| 2 Earners | 968 (35.4%) | $143,949 |
| 3+ Earners | 158 (5.8%) | $159,662 |
| Total | 2,731 (100.0%) | $90,877 |
Household Income in Bee Ridge
Household Income Brackets in Bee Ridge
With 878 households falling in the category, the $100,000 to $149,999 income range is the most frequent in Bee Ridge, accounting for 18.8% of all households. In contrast, only 107 households (2.3%) fall into the less than $10,000 income bracket, making it the least populous group.
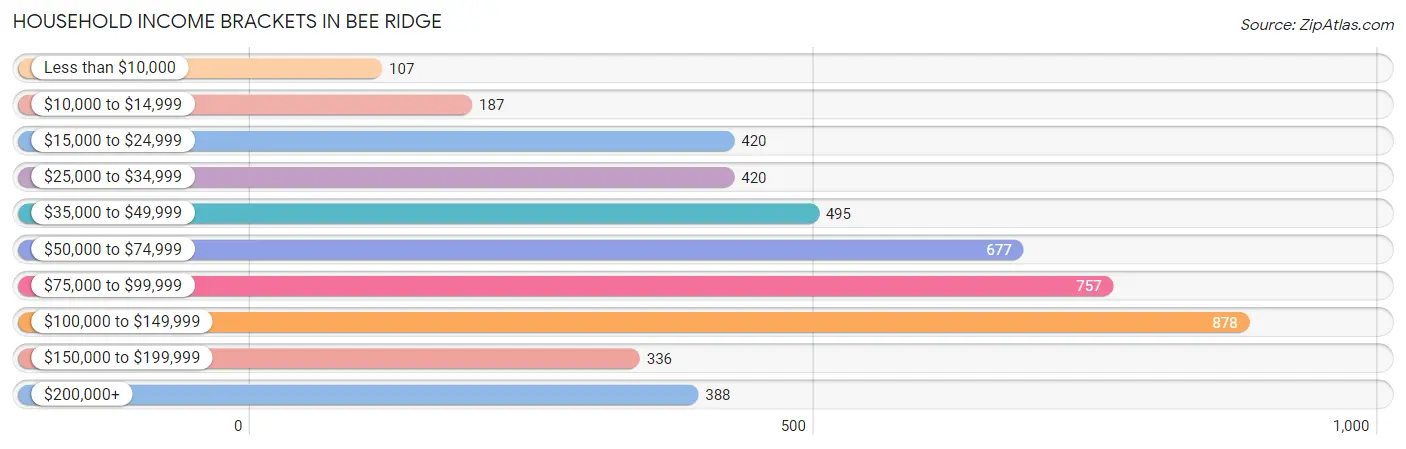
| Income Bracket | # Households | % Households |
| Less than $10,000 | 107 | 2.3% |
| $10,000 to $14,999 | 187 | 4.0% |
| $15,000 to $24,999 | 420 | 9.0% |
| $25,000 to $34,999 | 420 | 9.0% |
| $35,000 to $49,999 | 495 | 10.6% |
| $50,000 to $74,999 | 677 | 14.5% |
| $75,000 to $99,999 | 757 | 16.2% |
| $100,000 to $149,999 | 878 | 18.8% |
| $150,000 to $199,999 | 336 | 7.2% |
| $200,000+ | 388 | 8.3% |
Household Income by Householder Age in Bee Ridge
The median household income in Bee Ridge is $75,718, with the highest median household income of $104,222 found in the 25 to 44 years age bracket for the primary householder. A total of 859 households (18.4%) fall into this category.
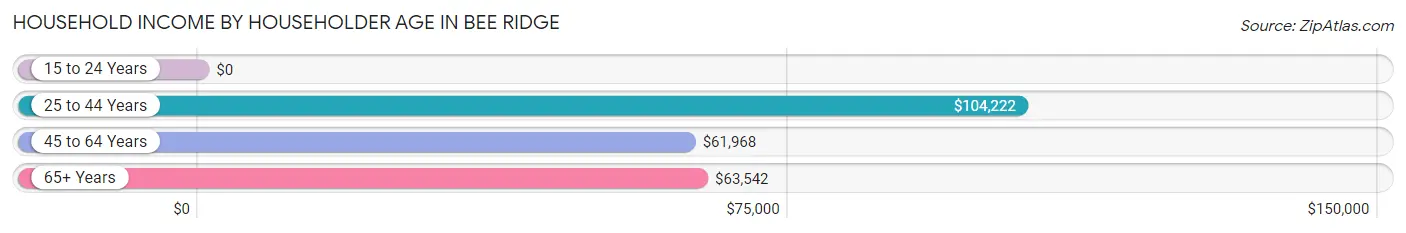
| Income Bracket | # Households | Median Income |
| 15 to 24 Years | 0 (0.0%) | $0 |
| 25 to 44 Years | 859 (18.4%) | $104,222 |
| 45 to 64 Years | 1,449 (31.0%) | $61,968 |
| 65+ Years | 2,362 (50.6%) | $63,542 |
| Total | 4,670 (100.0%) | $75,718 |
Poverty in Bee Ridge
Income Below Poverty by Sex and Age in Bee Ridge
With 10.9% poverty level for males and 11.8% for females among the residents of Bee Ridge, under 5 year old males and 16 and 17 year old females are the most vulnerable to poverty, with 80 males (38.1%) and 86 females (63.7%) in their respective age groups living below the poverty level.
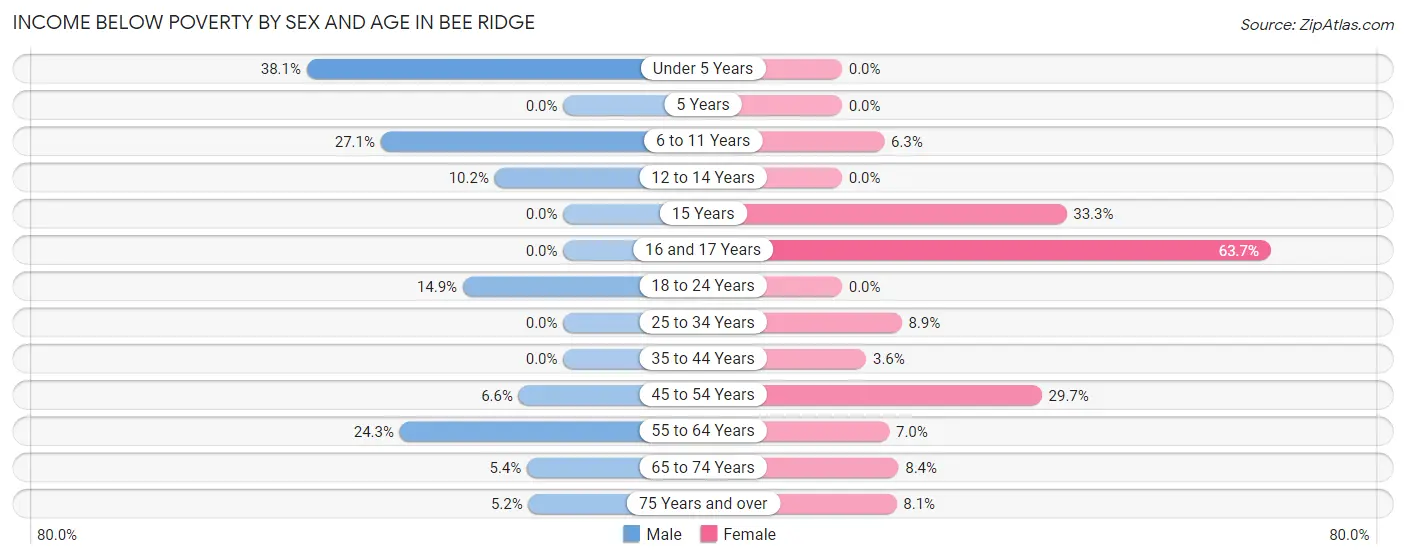
| Age Bracket | Male | Female |
| Under 5 Years | 80 (38.1%) | 0 (0.0%) |
| 5 Years | 0 (0.0%) | 0 (0.0%) |
| 6 to 11 Years | 90 (27.1%) | 17 (6.3%) |
| 12 to 14 Years | 16 (10.2%) | 0 (0.0%) |
| 15 Years | 0 (0.0%) | 17 (33.3%) |
| 16 and 17 Years | 0 (0.0%) | 86 (63.7%) |
| 18 to 24 Years | 17 (14.9%) | 0 (0.0%) |
| 25 to 34 Years | 0 (0.0%) | 35 (8.9%) |
| 35 to 44 Years | 0 (0.0%) | 16 (3.6%) |
| 45 to 54 Years | 34 (6.6%) | 240 (29.7%) |
| 55 to 64 Years | 188 (24.3%) | 50 (7.0%) |
| 65 to 74 Years | 46 (5.4%) | 71 (8.4%) |
| 75 Years and over | 32 (5.2%) | 94 (8.1%) |
| Total | 503 (10.9%) | 626 (11.8%) |
Income Above Poverty by Sex and Age in Bee Ridge
According to the poverty statistics in Bee Ridge, males aged 5 years and females aged under 5 years are the age groups that are most secure financially, with 100.0% of males and 100.0% of females in these age groups living above the poverty line.
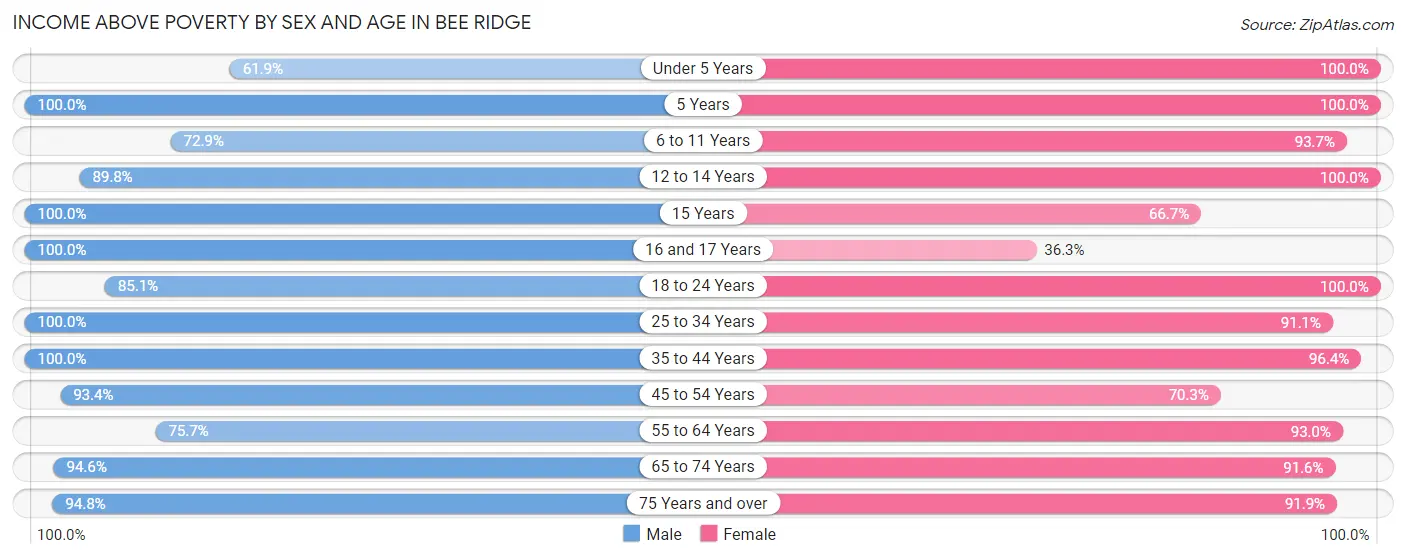
| Age Bracket | Male | Female |
| Under 5 Years | 130 (61.9%) | 183 (100.0%) |
| 5 Years | 25 (100.0%) | 16 (100.0%) |
| 6 to 11 Years | 242 (72.9%) | 254 (93.7%) |
| 12 to 14 Years | 141 (89.8%) | 87 (100.0%) |
| 15 Years | 86 (100.0%) | 34 (66.7%) |
| 16 and 17 Years | 49 (100.0%) | 49 (36.3%) |
| 18 to 24 Years | 97 (85.1%) | 196 (100.0%) |
| 25 to 34 Years | 438 (100.0%) | 360 (91.1%) |
| 35 to 44 Years | 425 (100.0%) | 428 (96.4%) |
| 45 to 54 Years | 480 (93.4%) | 569 (70.3%) |
| 55 to 64 Years | 586 (75.7%) | 663 (93.0%) |
| 65 to 74 Years | 809 (94.6%) | 775 (91.6%) |
| 75 Years and over | 587 (94.8%) | 1,066 (91.9%) |
| Total | 4,095 (89.1%) | 4,680 (88.2%) |
Income Below Poverty Among Married-Couple Families in Bee Ridge
The poverty statistics for married-couple families in Bee Ridge show that 8.5% or 188 of the total 2,209 families live below the poverty line. Families with 1 or 2 children have the highest poverty rate of 19.8%, comprising of 84 families. On the other hand, families with 3 or 4 children have the lowest poverty rate of 0.0%, which includes 0 families.
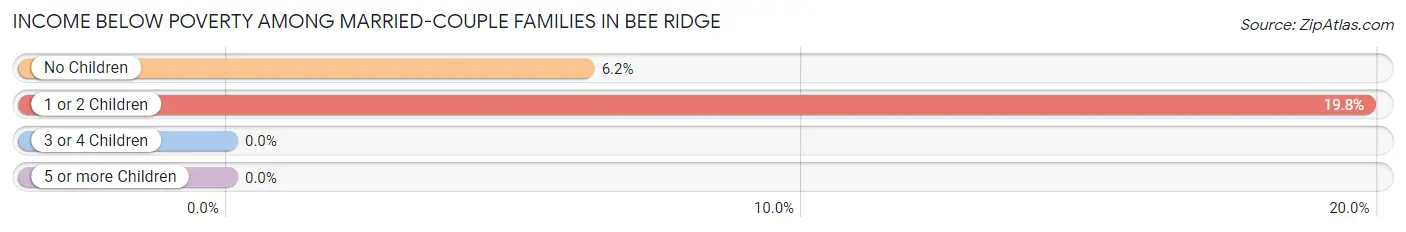
| Children | Above Poverty | Below Poverty |
| No Children | 1,571 (93.8%) | 104 (6.2%) |
| 1 or 2 Children | 340 (80.2%) | 84 (19.8%) |
| 3 or 4 Children | 110 (100.0%) | 0 (0.0%) |
| 5 or more Children | 0 (0.0%) | 0 (0.0%) |
| Total | 2,021 (91.5%) | 188 (8.5%) |
Income Below Poverty Among Single-Parent Households in Bee Ridge
| Children | Single Father | Single Mother |
| No Children | 0 (0.0%) | 12 (6.6%) |
| 1 or 2 Children | 0 (0.0%) | 55 (22.9%) |
| 3 or 4 Children | 0 (0.0%) | 0 (0.0%) |
| 5 or more Children | 0 (0.0%) | 0 (0.0%) |
| Total | 0 (0.0%) | 67 (15.9%) |
Income Below Poverty Among Married-Couple vs Single-Parent Households in Bee Ridge
The poverty data for Bee Ridge shows that 188 of the married-couple family households (8.5%) and 67 of the single-parent households (12.8%) are living below the poverty level. Within the married-couple family households, those with 1 or 2 children have the highest poverty rate, with 84 households (19.8%) falling below the poverty line. Among the single-parent households, those with 1 or 2 children have the highest poverty rate, with 55 household (17.9%) living below poverty.
| Children | Married-Couple Families | Single-Parent Households |
| No Children | 104 (6.2%) | 12 (5.6%) |
| 1 or 2 Children | 84 (19.8%) | 55 (17.9%) |
| 3 or 4 Children | 0 (0.0%) | 0 (0.0%) |
| 5 or more Children | 0 (0.0%) | 0 (0.0%) |
| Total | 188 (8.5%) | 67 (12.8%) |
Race in Bee Ridge
The most populous races in Bee Ridge are White / Caucasian (8,949 | 88.9%), Hispanic or Latino (1,202 | 11.9%), and Two or more Races (350 | 3.5%).
| Race | # Population | % Population |
| Asian | 293 | 2.9% |
| Black / African American | 207 | 2.1% |
| Hawaiian / Pacific | 0 | 0.0% |
| Hispanic or Latino | 1,202 | 11.9% |
| Native / Alaskan | 0 | 0.0% |
| White / Caucasian | 8,949 | 88.9% |
| Two or more Races | 350 | 3.5% |
| Some other Race | 270 | 2.7% |
| Total | 10,069 | 100.0% |
Ancestry in Bee Ridge
The most populous ancestries reported in Bee Ridge are American (1,900 | 18.9%), German (1,760 | 17.5%), English (1,493 | 14.8%), Irish (926 | 9.2%), and Italian (688 | 6.8%), together accounting for 67.2% of all Bee Ridge residents.
| Ancestry | # Population | % Population |
| American | 1,900 | 18.9% |
| Arab | 63 | 0.6% |
| Austrian | 110 | 1.1% |
| Bhutanese | 44 | 0.4% |
| British | 35 | 0.4% |
| Canadian | 69 | 0.7% |
| Central American | 40 | 0.4% |
| Colombian | 85 | 0.8% |
| Croatian | 52 | 0.5% |
| Cuban | 448 | 4.4% |
| Czech | 124 | 1.2% |
| Czechoslovakian | 21 | 0.2% |
| Danish | 96 | 0.9% |
| Dominican | 16 | 0.2% |
| Dutch | 241 | 2.4% |
| Eastern European | 17 | 0.2% |
| English | 1,493 | 14.8% |
| European | 71 | 0.7% |
| French | 293 | 2.9% |
| French Canadian | 14 | 0.1% |
| German | 1,760 | 17.5% |
| Greek | 55 | 0.5% |
| Haitian | 67 | 0.7% |
| Honduran | 19 | 0.2% |
| Hungarian | 95 | 0.9% |
| Indian (Asian) | 37 | 0.4% |
| Irish | 926 | 9.2% |
| Italian | 688 | 6.8% |
| Jordanian | 23 | 0.2% |
| Lebanese | 40 | 0.4% |
| Lithuanian | 242 | 2.4% |
| Mexican | 320 | 3.2% |
| Nicaraguan | 21 | 0.2% |
| Norwegian | 117 | 1.2% |
| Peruvian | 140 | 1.4% |
| Polish | 324 | 3.2% |
| Puerto Rican | 40 | 0.4% |
| Russian | 59 | 0.6% |
| Scandinavian | 37 | 0.4% |
| Scotch-Irish | 265 | 2.6% |
| Scottish | 102 | 1.0% |
| Serbian | 50 | 0.5% |
| Slovak | 66 | 0.7% |
| South American | 225 | 2.2% |
| Sri Lankan | 307 | 3.0% |
| Swedish | 150 | 1.5% |
| Swiss | 23 | 0.2% |
| Thai | 28 | 0.3% |
| Ukrainian | 55 | 0.5% |
| Welsh | 62 | 0.6% | View All 50 Rows |
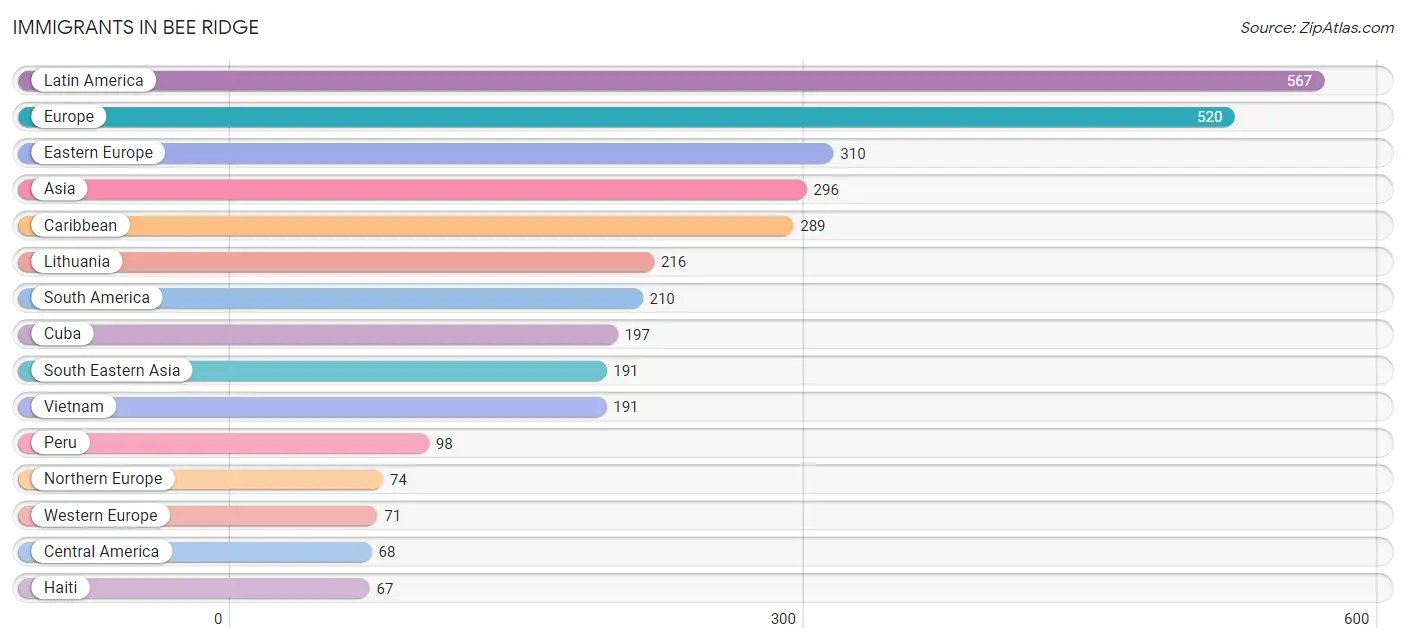
Immigrants in Bee Ridge
The most numerous immigrant groups reported in Bee Ridge came from Latin America (567 | 5.6%), Europe (520 | 5.2%), Eastern Europe (310 | 3.1%), Asia (296 | 2.9%), and Caribbean (289 | 2.9%), together accounting for 19.7% of all Bee Ridge residents.
| Immigration Origin | # Population | % Population |
| Asia | 296 | 2.9% |
| Brazil | 41 | 0.4% |
| Canada | 52 | 0.5% |
| Caribbean | 289 | 2.9% |
| Central America | 68 | 0.7% |
| China | 37 | 0.4% |
| Colombia | 35 | 0.4% |
| Cuba | 197 | 2.0% |
| Czechoslovakia | 30 | 0.3% |
| Denmark | 15 | 0.2% |
| Dominican Republic | 25 | 0.3% |
| Eastern Asia | 54 | 0.5% |
| Eastern Europe | 310 | 3.1% |
| Ecuador | 36 | 0.4% |
| El Salvador | 13 | 0.1% |
| England | 27 | 0.3% |
| Europe | 520 | 5.2% |
| Germany | 54 | 0.5% |
| Greece | 12 | 0.1% |
| Haiti | 67 | 0.7% |
| India | 28 | 0.3% |
| Italy | 34 | 0.3% |
| Japan | 17 | 0.2% |
| Jordan | 23 | 0.2% |
| Latin America | 567 | 5.6% |
| Lithuania | 216 | 2.1% |
| Mexico | 55 | 0.5% |
| Northern Europe | 74 | 0.7% |
| Peru | 98 | 1.0% |
| Poland | 28 | 0.3% |
| Serbia | 16 | 0.2% |
| South America | 210 | 2.1% |
| South Central Asia | 28 | 0.3% |
| South Eastern Asia | 191 | 1.9% |
| Southern Europe | 65 | 0.6% |
| Spain | 19 | 0.2% |
| Switzerland | 17 | 0.2% |
| Taiwan | 6 | 0.1% |
| Ukraine | 20 | 0.2% |
| Vietnam | 191 | 1.9% |
| Western Asia | 23 | 0.2% |
| Western Europe | 71 | 0.7% | View All 42 Rows |
Sex and Age in Bee Ridge
Sex and Age in Bee Ridge
The most populous age groups in Bee Ridge are 55 to 59 Years (545 | 11.8%) for men and 85 Years and over (551 | 10.1%) for women.
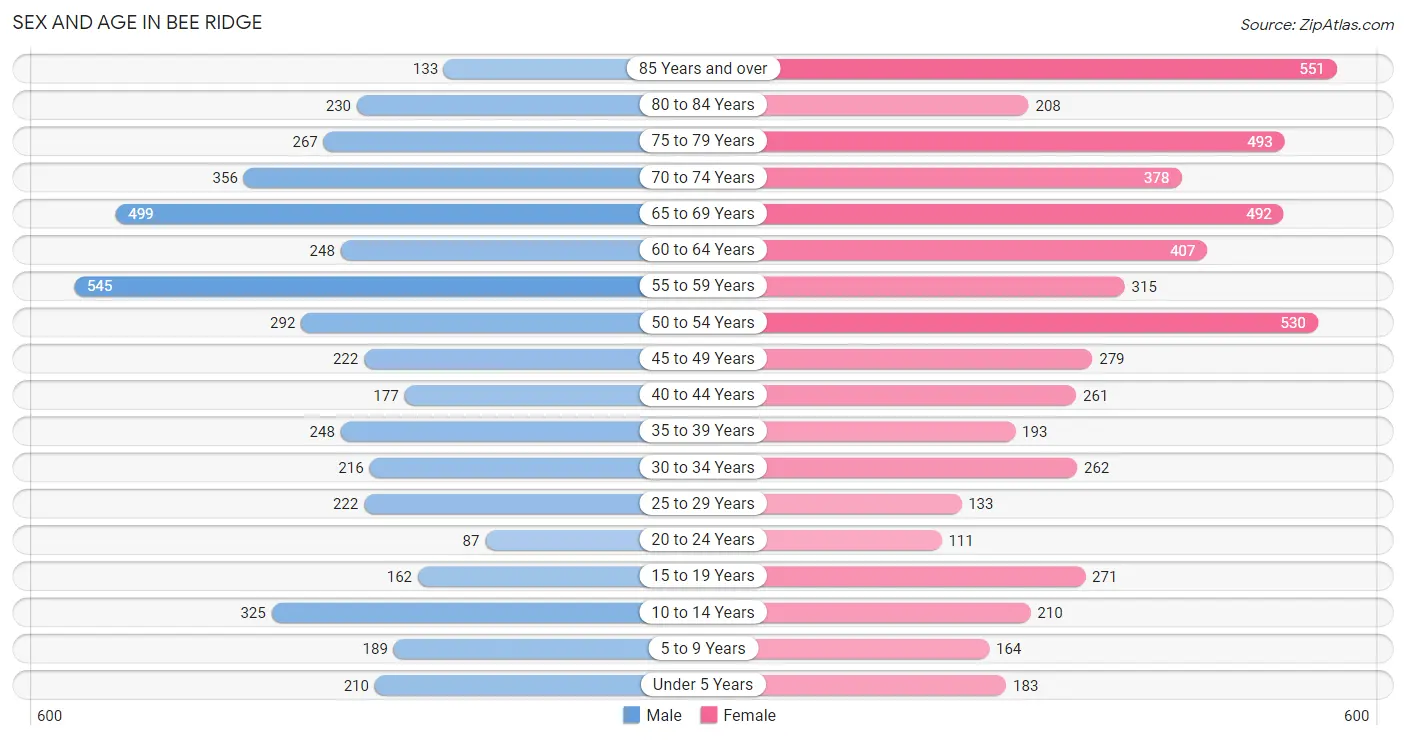
| Age Bracket | Male | Female |
| Under 5 Years | 210 (4.5%) | 183 (3.4%) |
| 5 to 9 Years | 189 (4.1%) | 164 (3.0%) |
| 10 to 14 Years | 325 (7.0%) | 210 (3.9%) |
| 15 to 19 Years | 162 (3.5%) | 271 (5.0%) |
| 20 to 24 Years | 87 (1.9%) | 111 (2.0%) |
| 25 to 29 Years | 222 (4.8%) | 133 (2.4%) |
| 30 to 34 Years | 216 (4.7%) | 262 (4.8%) |
| 35 to 39 Years | 248 (5.4%) | 193 (3.5%) |
| 40 to 44 Years | 177 (3.8%) | 261 (4.8%) |
| 45 to 49 Years | 222 (4.8%) | 279 (5.1%) |
| 50 to 54 Years | 292 (6.3%) | 530 (9.7%) |
| 55 to 59 Years | 545 (11.8%) | 315 (5.8%) |
| 60 to 64 Years | 248 (5.4%) | 407 (7.5%) |
| 65 to 69 Years | 499 (10.8%) | 492 (9.0%) |
| 70 to 74 Years | 356 (7.7%) | 378 (7.0%) |
| 75 to 79 Years | 267 (5.8%) | 493 (9.1%) |
| 80 to 84 Years | 230 (5.0%) | 208 (3.8%) |
| 85 Years and over | 133 (2.9%) | 551 (10.1%) |
| Total | 4,628 (100.0%) | 5,441 (100.0%) |
Families and Households in Bee Ridge
Median Family Size in Bee Ridge
The median family size in Bee Ridge is 2.67 persons per family, with married-couple families (2,209 | 80.9%) accounting for the largest median family size of 2.69 persons per family. On the other hand, single male/father families (101 | 3.7%) represent the smallest median family size with 2.09 persons per family.
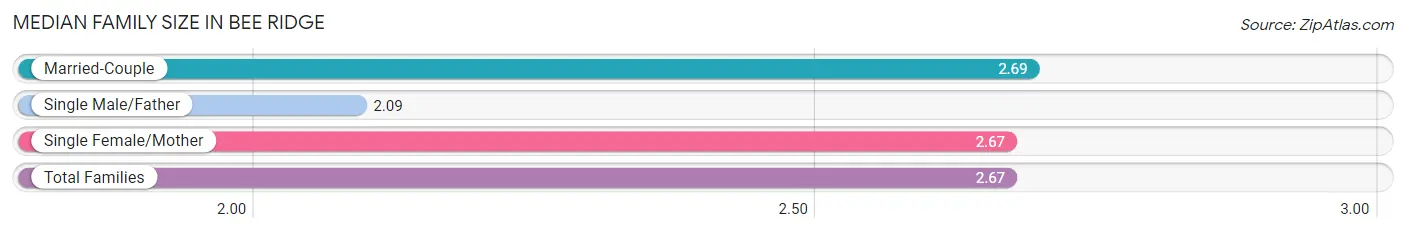
| Family Type | # Families | Family Size |
| Married-Couple | 2,209 (80.9%) | 2.69 |
| Single Male/Father | 101 (3.7%) | 2.09 |
| Single Female/Mother | 421 (15.4%) | 2.67 |
| Total Families | 2,731 (100.0%) | 2.67 |
Median Household Size in Bee Ridge
The median household size in Bee Ridge is 2.12 persons per household, with single female/mother households (421 | 9.0%) accounting for the largest median household size of 3.05 persons per household. non-family households (1,939 | 41.5%) represent the smallest median household size with 1.24 persons per household.
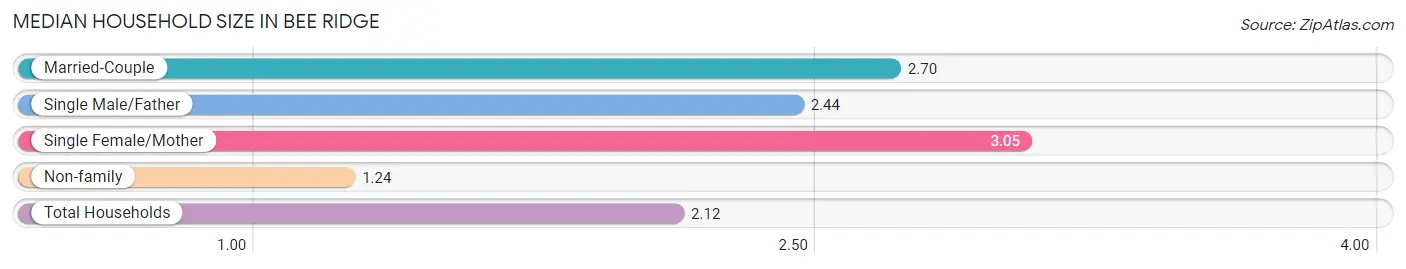
| Household Type | # Households | Household Size |
| Married-Couple | 2,209 (47.3%) | 2.70 |
| Single Male/Father | 101 (2.2%) | 2.44 |
| Single Female/Mother | 421 (9.0%) | 3.05 |
| Non-family | 1,939 (41.5%) | 1.24 |
| Total Households | 4,670 (100.0%) | 2.12 |
Household Size by Marriage Status in Bee Ridge
Out of a total of 4,670 households in Bee Ridge, 2,731 (58.5%) are family households, while 1,939 (41.5%) are nonfamily households. The most numerous type of family households are 2-person households, comprising 1,763, and the most common type of nonfamily households are 1-person households, comprising 1,632.
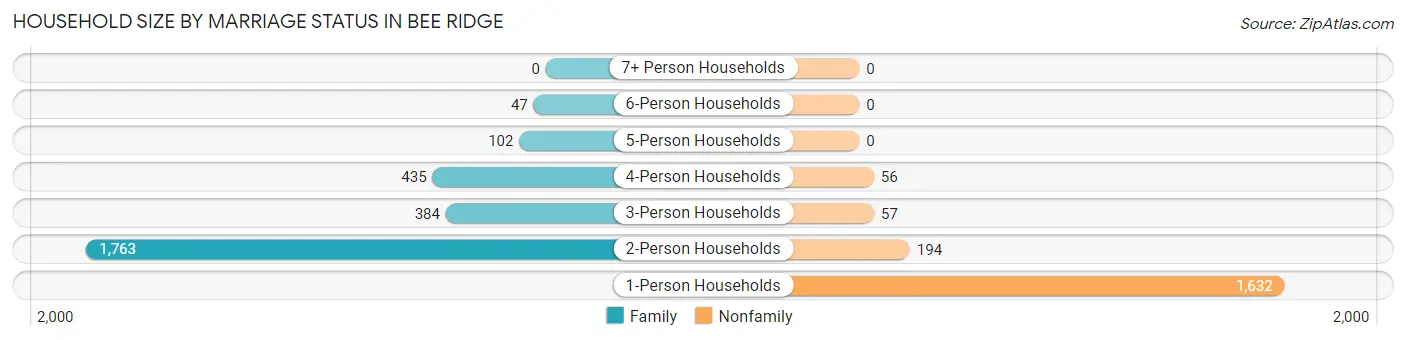
| Household Size | Family Households | Nonfamily Households |
| 1-Person Households | - | 1,632 (34.9%) |
| 2-Person Households | 1,763 (37.8%) | 194 (4.2%) |
| 3-Person Households | 384 (8.2%) | 57 (1.2%) |
| 4-Person Households | 435 (9.3%) | 56 (1.2%) |
| 5-Person Households | 102 (2.2%) | 0 (0.0%) |
| 6-Person Households | 47 (1.0%) | 0 (0.0%) |
| 7+ Person Households | 0 (0.0%) | 0 (0.0%) |
| Total | 2,731 (58.5%) | 1,939 (41.5%) |
Female Fertility in Bee Ridge
Fertility by Age in Bee Ridge
Average fertility rate in Bee Ridge is 38.0 births per 1,000 women. Women in the age bracket of 20 to 34 years have the highest fertility rate with 69.0 births per 1,000 women. Women in the age bracket of 20 to 34 years acount for 57.4% of all women with births.
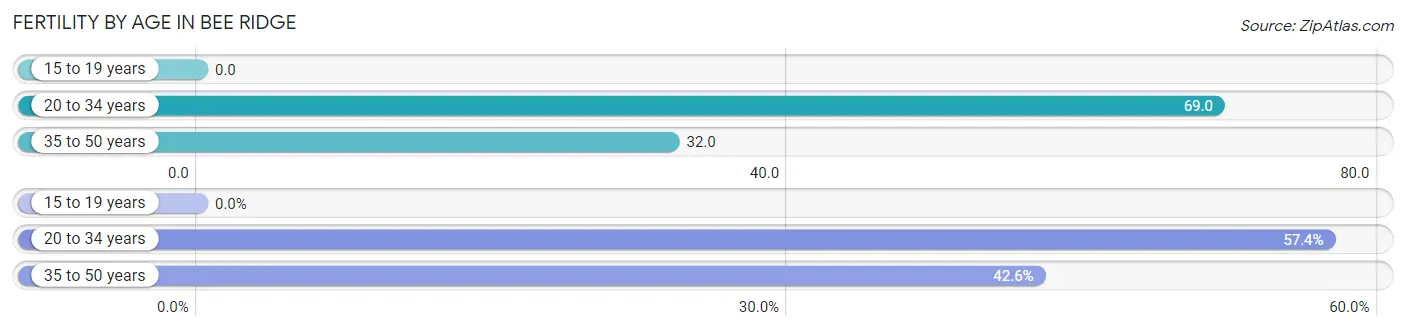
| Age Bracket | Women with Births | Births / 1,000 Women |
| 15 to 19 years | 0 (0.0%) | 0.0 |
| 20 to 34 years | 35 (57.4%) | 69.0 |
| 35 to 50 years | 26 (42.6%) | 32.0 |
| Total | 61 (100.0%) | 38.0 |
Fertility by Age by Marriage Status in Bee Ridge
42.6% of women with births (61) in Bee Ridge are married. The highest percentage of unmarried women with births falls into 20 to 34 years age bracket with 100.0% of them unmarried at the time of birth, while the lowest percentage of unmarried women with births belong to 35 to 50 years age bracket with 0.0% of them unmarried.
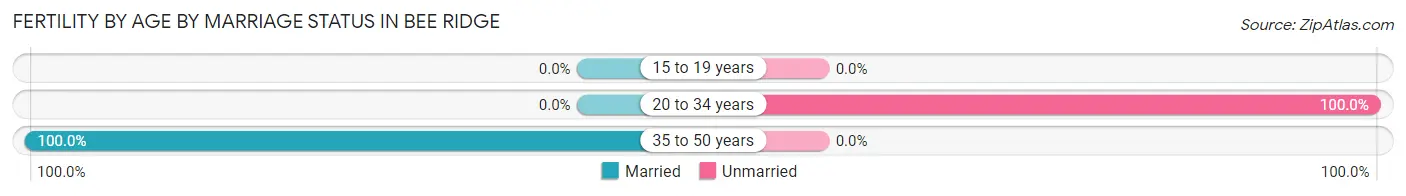
| Age Bracket | Married | Unmarried |
| 15 to 19 years | 0 (0.0%) | 0 (0.0%) |
| 20 to 34 years | 0 (0.0%) | 35 (100.0%) |
| 35 to 50 years | 26 (100.0%) | 0 (0.0%) |
| Total | 26 (42.6%) | 35 (57.4%) |
Fertility by Education in Bee Ridge
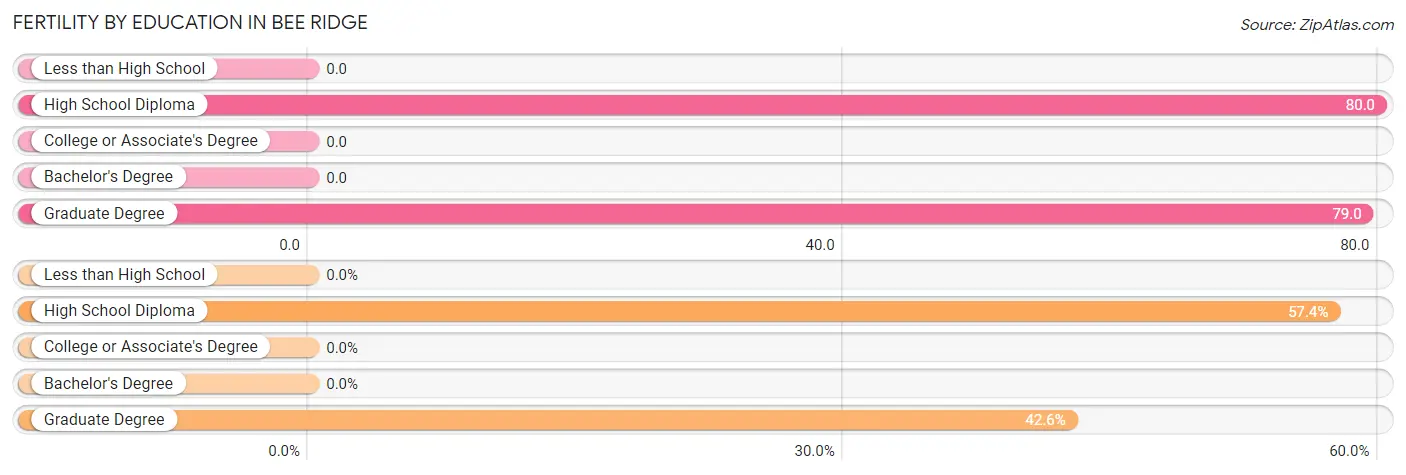
| Educational Attainment | Women with Births | Births / 1,000 Women |
| Less than High School | 0 (0.0%) | 0.0 |
| High School Diploma | 35 (57.4%) | 80.0 |
| College or Associate's Degree | 0 (0.0%) | 0.0 |
| Bachelor's Degree | 0 (0.0%) | 0.0 |
| Graduate Degree | 26 (42.6%) | 79.0 |
| Total | 61 (100.0%) | 38.0 |
Fertility by Education by Marriage Status in Bee Ridge
57.4% of women with births in Bee Ridge are unmarried. Women with the educational attainment of graduate degree are most likely to be married with 100.0% of them married at childbirth, while women with the educational attainment of high school diploma are least likely to be married with 100.0% of them unmarried at childbirth.
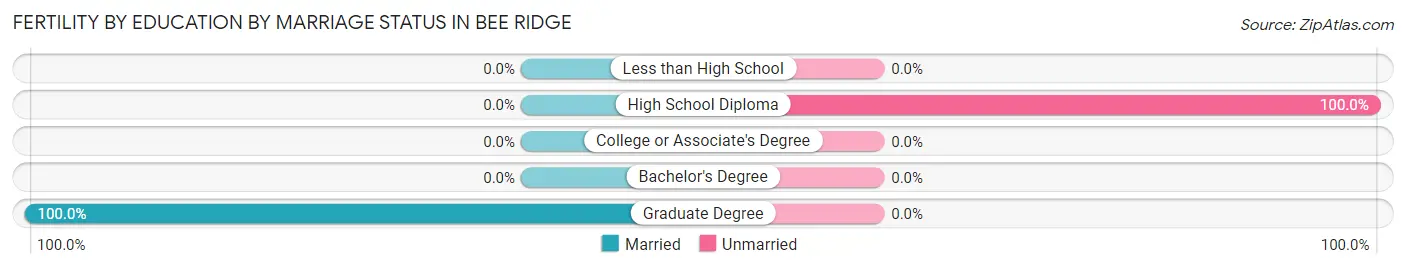
| Educational Attainment | Married | Unmarried |
| Less than High School | 0 (0.0%) | 0 (0.0%) |
| High School Diploma | 0 (0.0%) | 35 (100.0%) |
| College or Associate's Degree | 0 (0.0%) | 0 (0.0%) |
| Bachelor's Degree | 0 (0.0%) | 0 (0.0%) |
| Graduate Degree | 26 (100.0%) | 0 (0.0%) |
| Total | 26 (42.6%) | 35 (57.4%) |
Employment Characteristics in Bee Ridge
Employment by Class of Employer in Bee Ridge
Among the 4,451 employed individuals in Bee Ridge, private company employees (3,030 | 68.1%), self-employed (incorporated) (580 | 13.0%), and self-employed (not incorporated) (345 | 7.7%) make up the most common classes of employment.
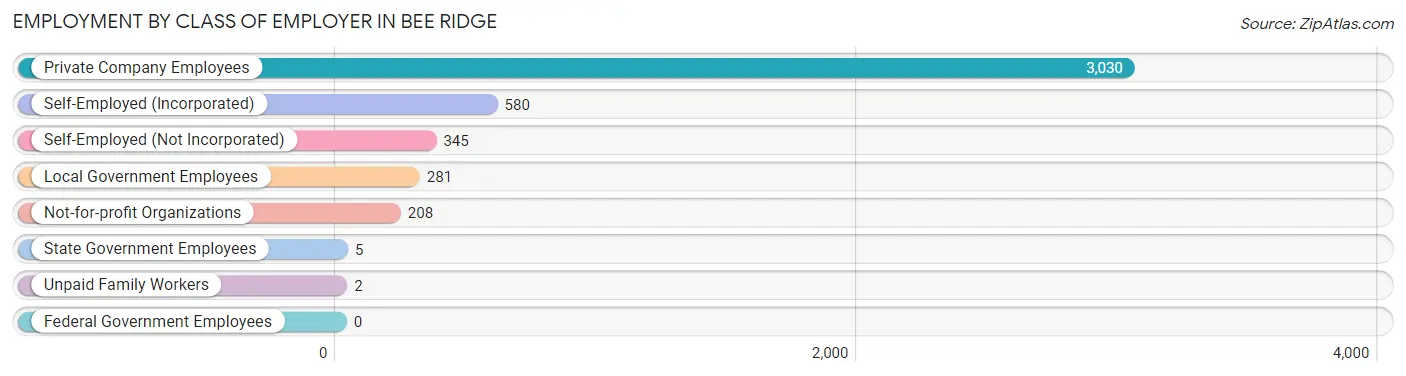
| Employer Class | # Employees | % Employees |
| Private Company Employees | 3,030 | 68.1% |
| Self-Employed (Incorporated) | 580 | 13.0% |
| Self-Employed (Not Incorporated) | 345 | 7.7% |
| Not-for-profit Organizations | 208 | 4.7% |
| Local Government Employees | 281 | 6.3% |
| State Government Employees | 5 | 0.1% |
| Federal Government Employees | 0 | 0.0% |
| Unpaid Family Workers | 2 | 0.0% |
| Total | 4,451 | 100.0% |
Employment Status by Age in Bee Ridge
According to the labor force statistics for Bee Ridge, out of the total population over 16 years of age (8,651), 53.2% or 4,602 individuals are in the labor force, with 2.7% or 124 of them unemployed. The age group with the highest labor force participation rate is 25 to 29 years, with 100.0% or 355 individuals in the labor force. Within the labor force, the 60 to 64 years age range has the highest percentage of unemployed individuals, with 9.1% or 42 of them being unemployed.
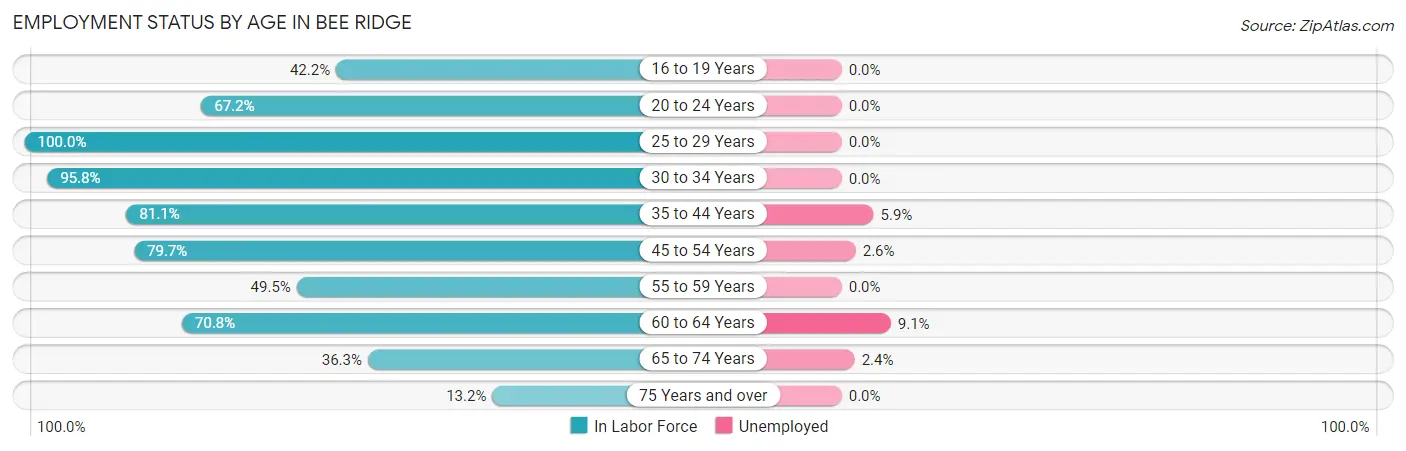
| Age Bracket | In Labor Force | Unemployed |
| 16 to 19 Years | 125 (42.2%) | 0 (0.0%) |
| 20 to 24 Years | 133 (67.2%) | 0 (0.0%) |
| 25 to 29 Years | 355 (100.0%) | 0 (0.0%) |
| 30 to 34 Years | 458 (95.8%) | 0 (0.0%) |
| 35 to 44 Years | 713 (81.1%) | 42 (5.9%) |
| 45 to 54 Years | 1,054 (79.7%) | 27 (2.6%) |
| 55 to 59 Years | 426 (49.5%) | 0 (0.0%) |
| 60 to 64 Years | 464 (70.8%) | 42 (9.1%) |
| 65 to 74 Years | 626 (36.3%) | 15 (2.4%) |
| 75 Years and over | 248 (13.2%) | 0 (0.0%) |
| Total | 4,602 (53.2%) | 124 (2.7%) |
Employment Status by Educational Attainment in Bee Ridge
According to labor force statistics for Bee Ridge, 76.3% of individuals (3,472) out of the total population between 25 and 64 years of age (4,550) are in the labor force, with 3.2% or 111 of them being unemployed. The group with the highest labor force participation rate are those with the educational attainment of less than high school, with 100.0% or 145 individuals in the labor force. Within the labor force, individuals with less than high school education have the highest percentage of unemployment, with 12.4% or 18 of them being unemployed.
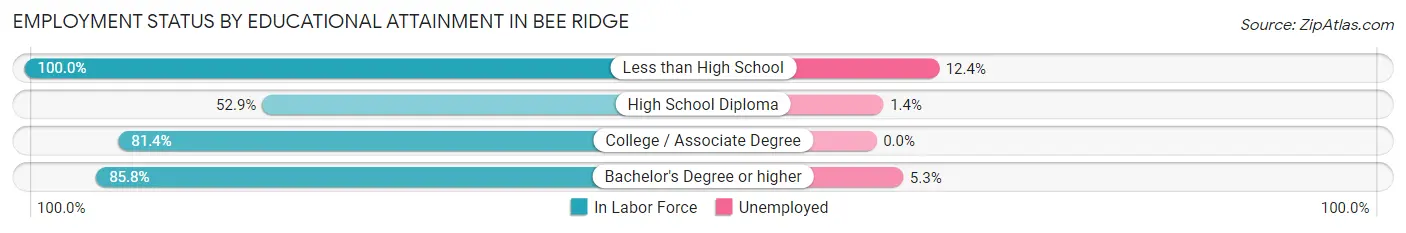
| Educational Attainment | In Labor Force | Unemployed |
| Less than High School | 145 (100.0%) | 18 (12.4%) |
| High School Diploma | 631 (52.9%) | 17 (1.4%) |
| College / Associate Degree | 1,123 (81.4%) | 0 (0.0%) |
| Bachelor's Degree or higher | 1,572 (85.8%) | 97 (5.3%) |
| Total | 3,472 (76.3%) | 146 (3.2%) |
Employment Occupations by Sex in Bee Ridge
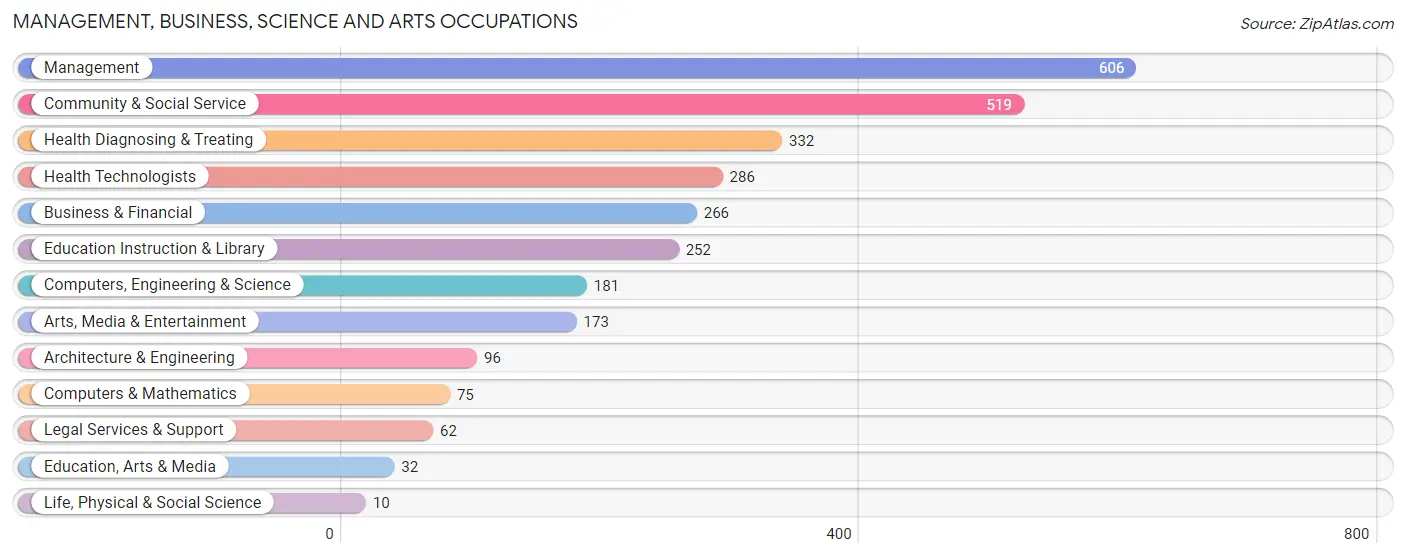
Management, Business, Science and Arts Occupations
The most common Management, Business, Science and Arts occupations in Bee Ridge are Management (606 | 13.5%), Community & Social Service (519 | 11.6%), Health Diagnosing & Treating (332 | 7.4%), Health Technologists (286 | 6.4%), and Business & Financial (266 | 5.9%).
Management, Business, Science and Arts Occupations by Sex
Within the Management, Business, Science and Arts occupations in Bee Ridge, the most male-oriented occupations are Architecture & Engineering (77.1%), Management (62.9%), and Arts, Media & Entertainment (62.4%), while the most female-oriented occupations are Life, Physical & Social Science (100.0%), Education, Arts & Media (100.0%), and Legal Services & Support (77.4%).
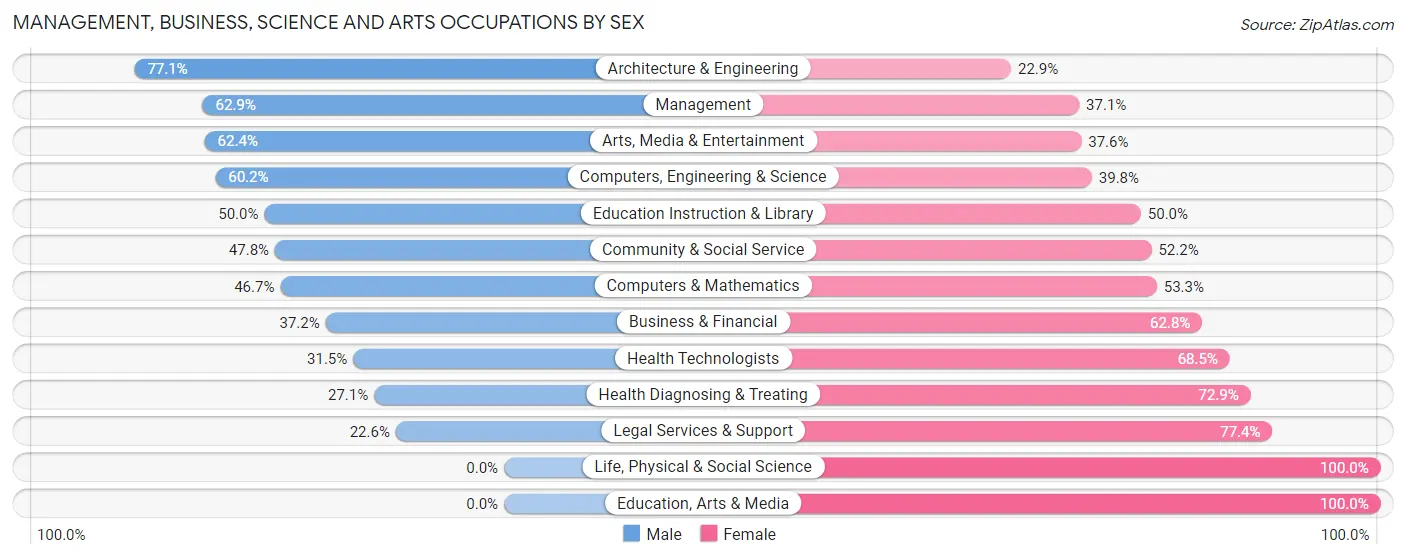
| Occupation | Male | Female |
| Management | 381 (62.9%) | 225 (37.1%) |
| Business & Financial | 99 (37.2%) | 167 (62.8%) |
| Computers, Engineering & Science | 109 (60.2%) | 72 (39.8%) |
| Computers & Mathematics | 35 (46.7%) | 40 (53.3%) |
| Architecture & Engineering | 74 (77.1%) | 22 (22.9%) |
| Life, Physical & Social Science | 0 (0.0%) | 10 (100.0%) |
| Community & Social Service | 248 (47.8%) | 271 (52.2%) |
| Education, Arts & Media | 0 (0.0%) | 32 (100.0%) |
| Legal Services & Support | 14 (22.6%) | 48 (77.4%) |
| Education Instruction & Library | 126 (50.0%) | 126 (50.0%) |
| Arts, Media & Entertainment | 108 (62.4%) | 65 (37.6%) |
| Health Diagnosing & Treating | 90 (27.1%) | 242 (72.9%) |
| Health Technologists | 90 (31.5%) | 196 (68.5%) |
| Total (Category) | 927 (48.7%) | 977 (51.3%) |
| Total (Overall) | 2,264 (50.6%) | 2,213 (49.4%) |
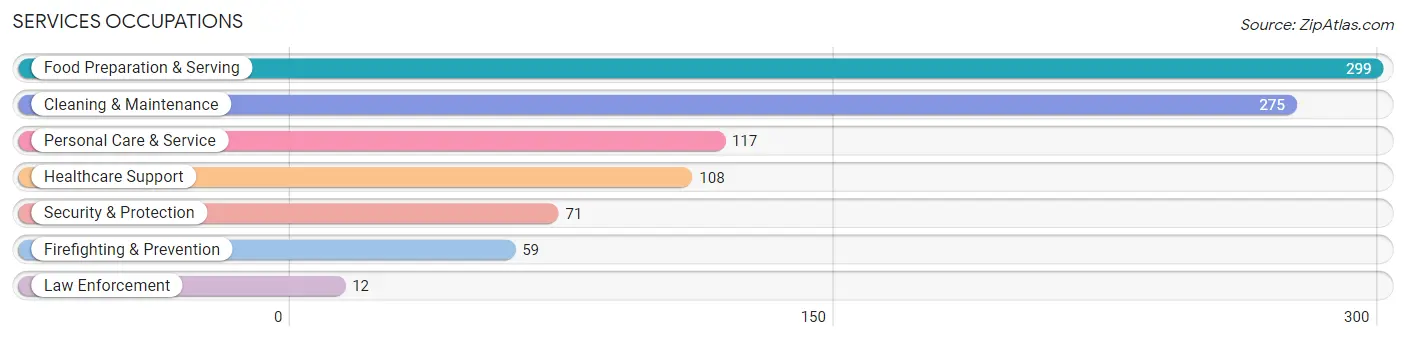
Services Occupations
The most common Services occupations in Bee Ridge are Food Preparation & Serving (299 | 6.7%), Cleaning & Maintenance (275 | 6.1%), Personal Care & Service (117 | 2.6%), Healthcare Support (108 | 2.4%), and Security & Protection (71 | 1.6%).
Services Occupations by Sex
Within the Services occupations in Bee Ridge, the most male-oriented occupations are Firefighting & Prevention (100.0%), Security & Protection (90.1%), and Food Preparation & Serving (45.5%), while the most female-oriented occupations are Healthcare Support (91.7%), Personal Care & Service (86.3%), and Law Enforcement (58.3%).
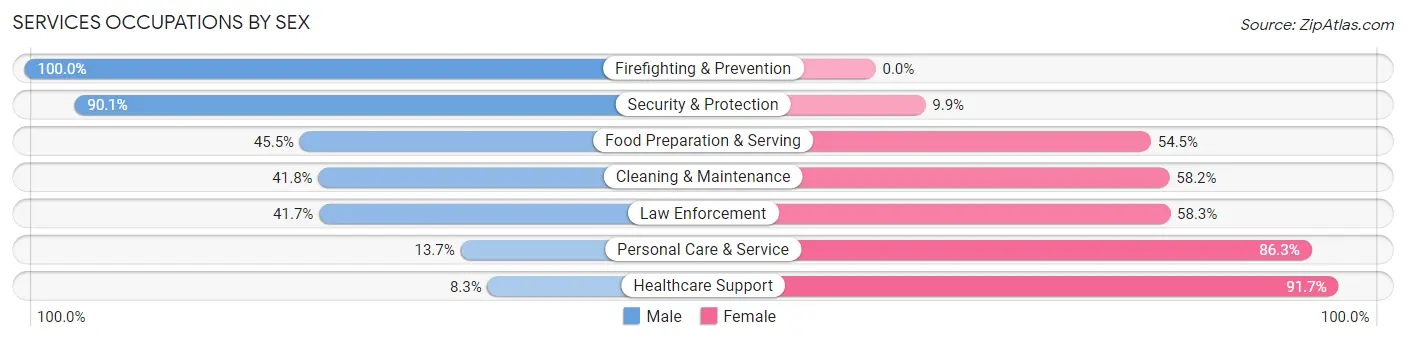
| Occupation | Male | Female |
| Healthcare Support | 9 (8.3%) | 99 (91.7%) |
| Security & Protection | 64 (90.1%) | 7 (9.9%) |
| Firefighting & Prevention | 59 (100.0%) | 0 (0.0%) |
| Law Enforcement | 5 (41.7%) | 7 (58.3%) |
| Food Preparation & Serving | 136 (45.5%) | 163 (54.5%) |
| Cleaning & Maintenance | 115 (41.8%) | 160 (58.2%) |
| Personal Care & Service | 16 (13.7%) | 101 (86.3%) |
| Total (Category) | 340 (39.1%) | 530 (60.9%) |
| Total (Overall) | 2,264 (50.6%) | 2,213 (49.4%) |
Sales and Office Occupations
The most common Sales and Office occupations in Bee Ridge are Office & Administration (558 | 12.5%), and Sales & Related (531 | 11.9%).

Sales and Office Occupations by Sex
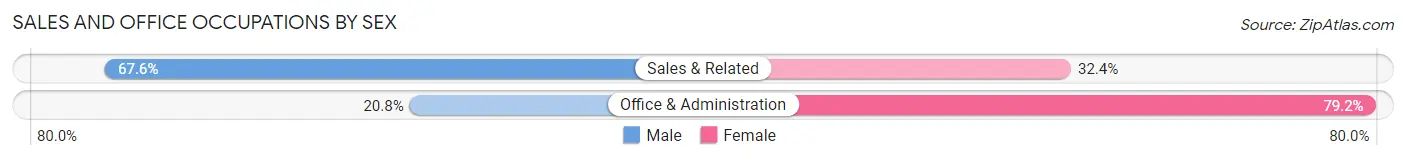
| Occupation | Male | Female |
| Sales & Related | 359 (67.6%) | 172 (32.4%) |
| Office & Administration | 116 (20.8%) | 442 (79.2%) |
| Total (Category) | 475 (43.6%) | 614 (56.4%) |
| Total (Overall) | 2,264 (50.6%) | 2,213 (49.4%) |
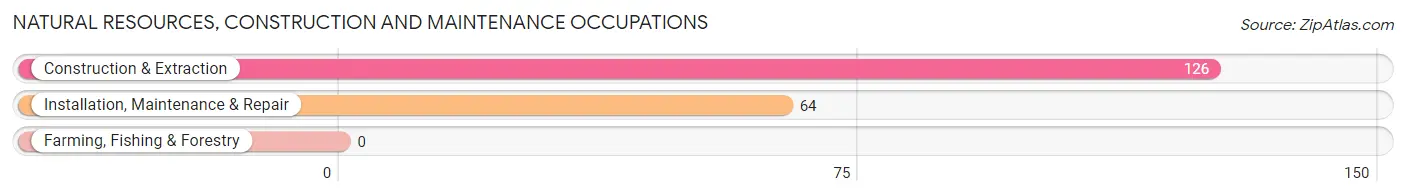
Natural Resources, Construction and Maintenance Occupations
The most common Natural Resources, Construction and Maintenance occupations in Bee Ridge are Construction & Extraction (126 | 2.8%), and Installation, Maintenance & Repair (64 | 1.4%).
Natural Resources, Construction and Maintenance Occupations by Sex
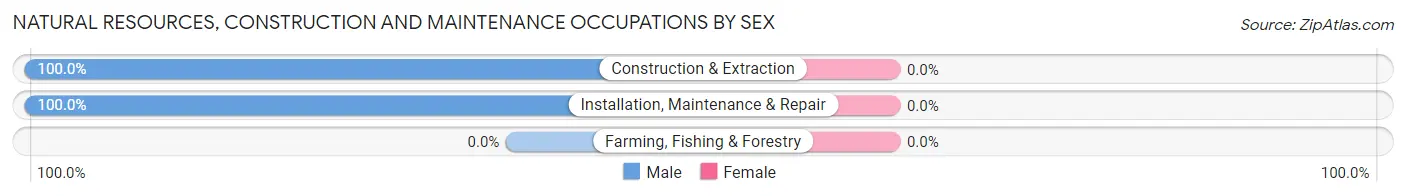
| Occupation | Male | Female |
| Farming, Fishing & Forestry | 0 (0.0%) | 0 (0.0%) |
| Construction & Extraction | 126 (100.0%) | 0 (0.0%) |
| Installation, Maintenance & Repair | 64 (100.0%) | 0 (0.0%) |
| Total (Category) | 190 (100.0%) | 0 (0.0%) |
| Total (Overall) | 2,264 (50.6%) | 2,213 (49.4%) |
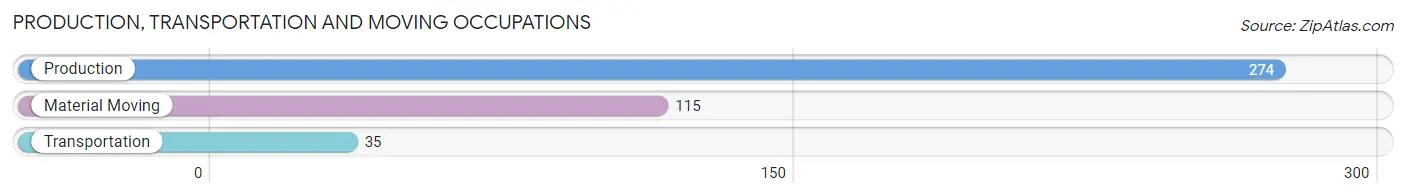
Production, Transportation and Moving Occupations
The most common Production, Transportation and Moving occupations in Bee Ridge are Production (274 | 6.1%), Material Moving (115 | 2.6%), and Transportation (35 | 0.8%).
Production, Transportation and Moving Occupations by Sex
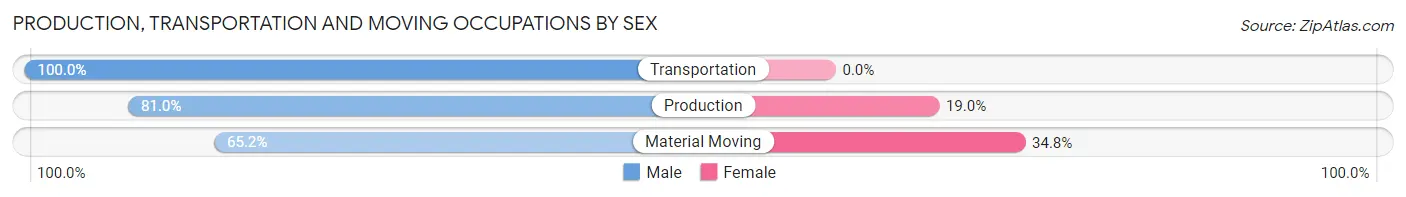
| Occupation | Male | Female |
| Production | 222 (81.0%) | 52 (19.0%) |
| Transportation | 35 (100.0%) | 0 (0.0%) |
| Material Moving | 75 (65.2%) | 40 (34.8%) |
| Total (Category) | 332 (78.3%) | 92 (21.7%) |
| Total (Overall) | 2,264 (50.6%) | 2,213 (49.4%) |
Employment Industries by Sex in Bee Ridge
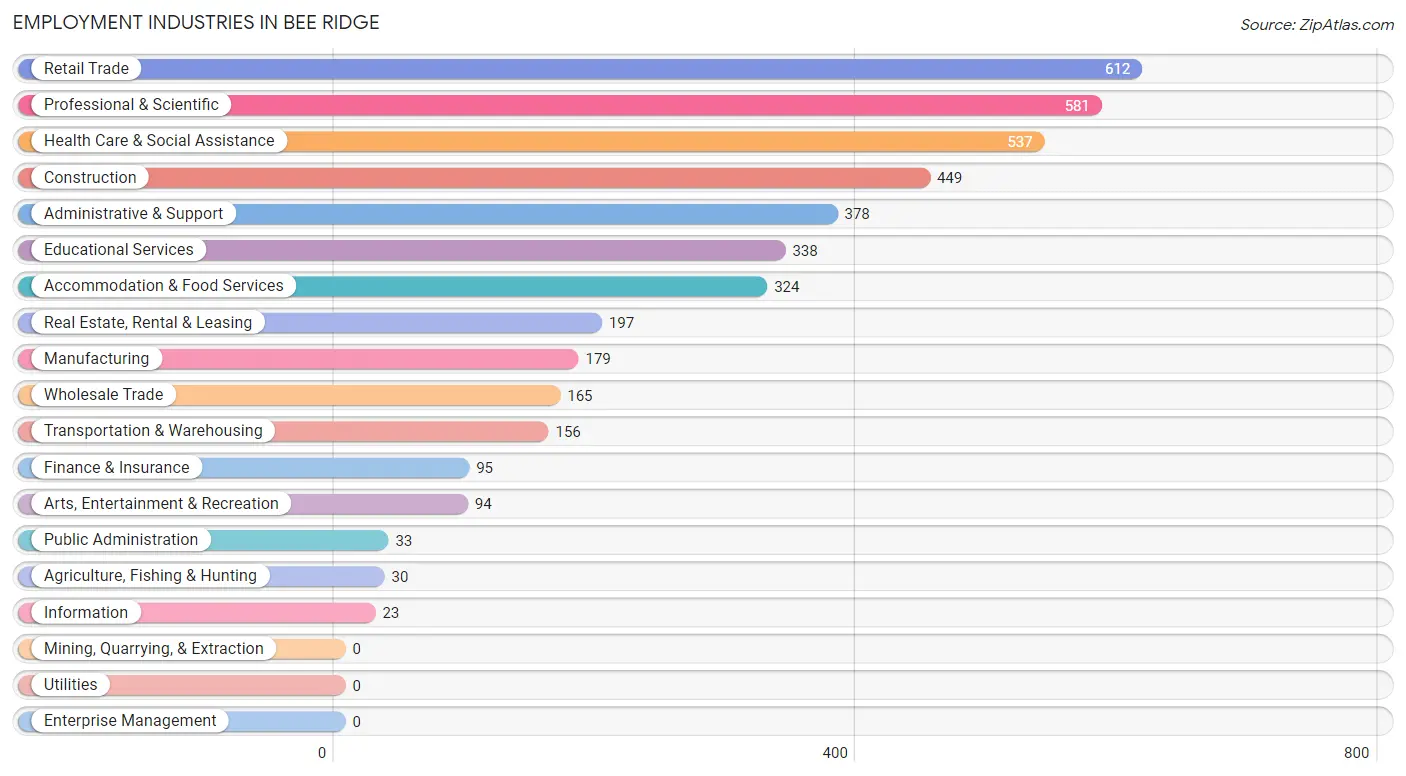
Employment Industries in Bee Ridge
The major employment industries in Bee Ridge include Retail Trade (612 | 13.7%), Professional & Scientific (581 | 13.0%), Health Care & Social Assistance (537 | 12.0%), Construction (449 | 10.0%), and Administrative & Support (378 | 8.4%).
Employment Industries by Sex in Bee Ridge
The Bee Ridge industries that see more men than women are Information (100.0%), Arts, Entertainment & Recreation (90.4%), and Manufacturing (84.9%), whereas the industries that tend to have a higher number of women are Agriculture, Fishing & Hunting (100.0%), Public Administration (84.9%), and Administrative & Support (79.6%).
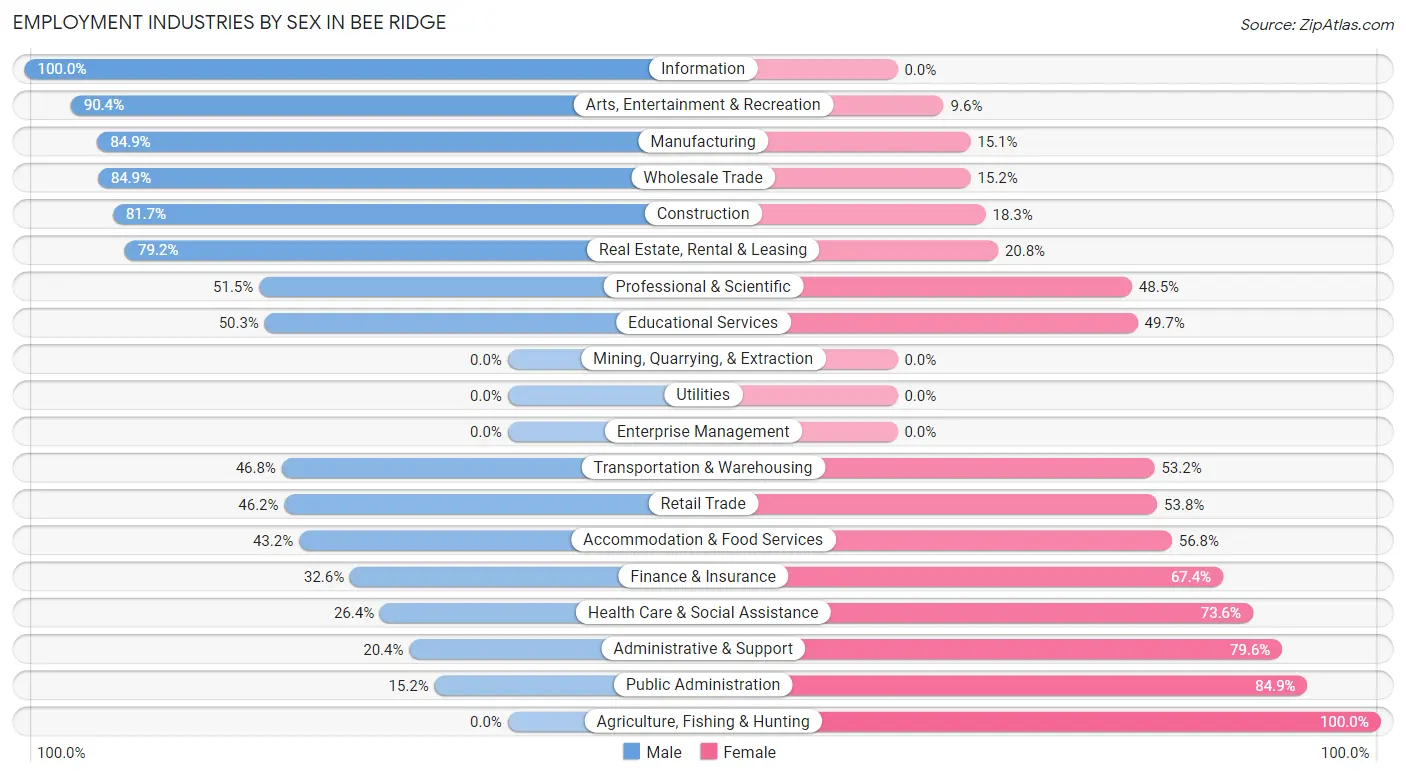
| Industry | Male | Female |
| Agriculture, Fishing & Hunting | 0 (0.0%) | 30 (100.0%) |
| Mining, Quarrying, & Extraction | 0 (0.0%) | 0 (0.0%) |
| Construction | 367 (81.7%) | 82 (18.3%) |
| Manufacturing | 152 (84.9%) | 27 (15.1%) |
| Wholesale Trade | 140 (84.9%) | 25 (15.1%) |
| Retail Trade | 283 (46.2%) | 329 (53.8%) |
| Transportation & Warehousing | 73 (46.8%) | 83 (53.2%) |
| Utilities | 0 (0.0%) | 0 (0.0%) |
| Information | 23 (100.0%) | 0 (0.0%) |
| Finance & Insurance | 31 (32.6%) | 64 (67.4%) |
| Real Estate, Rental & Leasing | 156 (79.2%) | 41 (20.8%) |
| Professional & Scientific | 299 (51.5%) | 282 (48.5%) |
| Enterprise Management | 0 (0.0%) | 0 (0.0%) |
| Administrative & Support | 77 (20.4%) | 301 (79.6%) |
| Educational Services | 170 (50.3%) | 168 (49.7%) |
| Health Care & Social Assistance | 142 (26.4%) | 395 (73.6%) |
| Arts, Entertainment & Recreation | 85 (90.4%) | 9 (9.6%) |
| Accommodation & Food Services | 140 (43.2%) | 184 (56.8%) |
| Public Administration | 5 (15.1%) | 28 (84.9%) |
| Total | 2,264 (50.6%) | 2,213 (49.4%) |
Education in Bee Ridge
School Enrollment in Bee Ridge
The most common levels of schooling among the 1,419 students in Bee Ridge are elementary school (382 | 26.9%), high school (363 | 25.6%), and middle school (335 | 23.6%).
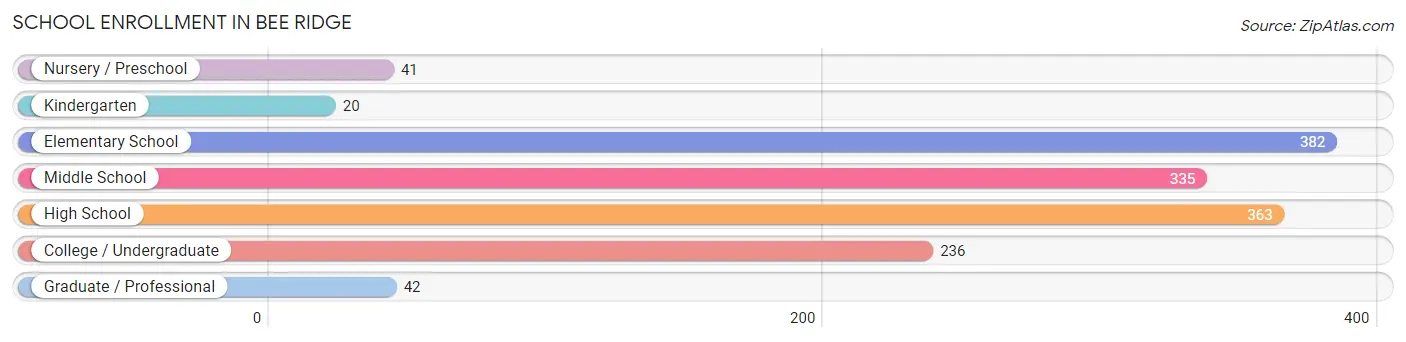
| School Level | # Students | % Students |
| Nursery / Preschool | 41 | 2.9% |
| Kindergarten | 20 | 1.4% |
| Elementary School | 382 | 26.9% |
| Middle School | 335 | 23.6% |
| High School | 363 | 25.6% |
| College / Undergraduate | 236 | 16.6% |
| Graduate / Professional | 42 | 3.0% |
| Total | 1,419 | 100.0% |
School Enrollment by Age by Funding Source in Bee Ridge
Out of a total of 1,419 students who are enrolled in schools in Bee Ridge, 324 (22.8%) attend a private institution, while the remaining 1,095 (77.2%) are enrolled in public schools. The age group of 10 to 14 year olds has the highest likelihood of being enrolled in private schools, with 249 (49.2% in the age bracket) enrolled. Conversely, the age group of 18 to 19 year olds has the lowest likelihood of being enrolled in a private school, with 63 (100.0% in the age bracket) attending a public institution.
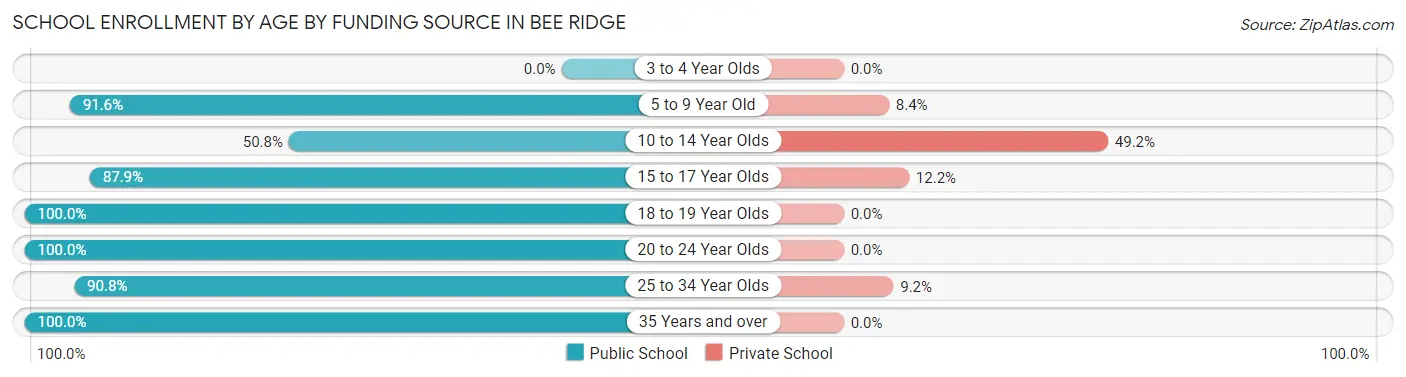
| Age Bracket | Public School | Private School |
| 3 to 4 Year Olds | 0 (0.0%) | 0 (0.0%) |
| 5 to 9 Year Old | 272 (91.6%) | 25 (8.4%) |
| 10 to 14 Year Olds | 257 (50.8%) | 249 (49.2%) |
| 15 to 17 Year Olds | 282 (87.8%) | 39 (12.1%) |
| 18 to 19 Year Olds | 63 (100.0%) | 0 (0.0%) |
| 20 to 24 Year Olds | 82 (100.0%) | 0 (0.0%) |
| 25 to 34 Year Olds | 108 (90.8%) | 11 (9.2%) |
| 35 Years and over | 31 (100.0%) | 0 (0.0%) |
| Total | 1,095 (77.2%) | 324 (22.8%) |
Educational Attainment by Field of Study in Bee Ridge
Business (809 | 26.4%), science & technology (401 | 13.1%), education (331 | 10.8%), arts & humanities (249 | 8.1%), and engineering (237 | 7.7%) are the most common fields of study among 3,064 individuals in Bee Ridge who have obtained a bachelor's degree or higher.
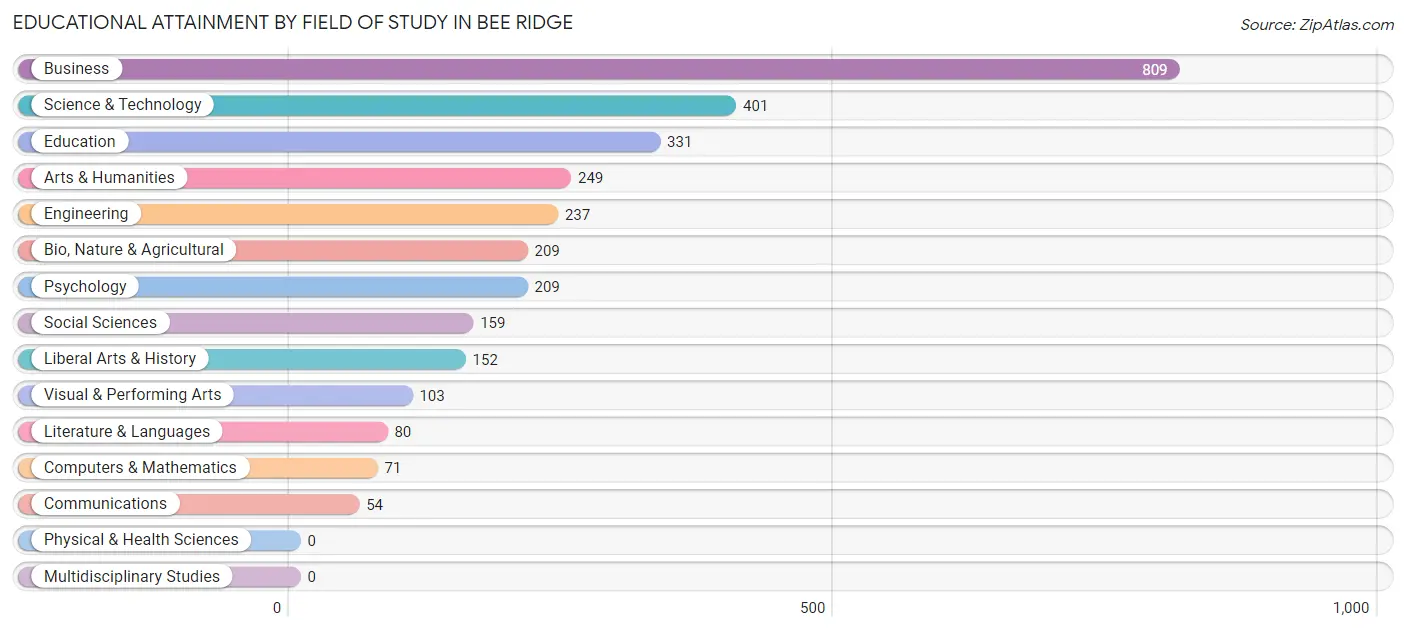
| Field of Study | # Graduates | % Graduates |
| Computers & Mathematics | 71 | 2.3% |
| Bio, Nature & Agricultural | 209 | 6.8% |
| Physical & Health Sciences | 0 | 0.0% |
| Psychology | 209 | 6.8% |
| Social Sciences | 159 | 5.2% |
| Engineering | 237 | 7.7% |
| Multidisciplinary Studies | 0 | 0.0% |
| Science & Technology | 401 | 13.1% |
| Business | 809 | 26.4% |
| Education | 331 | 10.8% |
| Literature & Languages | 80 | 2.6% |
| Liberal Arts & History | 152 | 5.0% |
| Visual & Performing Arts | 103 | 3.4% |
| Communications | 54 | 1.8% |
| Arts & Humanities | 249 | 8.1% |
| Total | 3,064 | 100.0% |
Transportation & Commute in Bee Ridge
Vehicle Availability by Sex in Bee Ridge
The most prevalent vehicle ownership categories in Bee Ridge are males with 2 vehicles (1,255, accounting for 55.8%) and females with 2 vehicles (1,195, making up 57.1%).
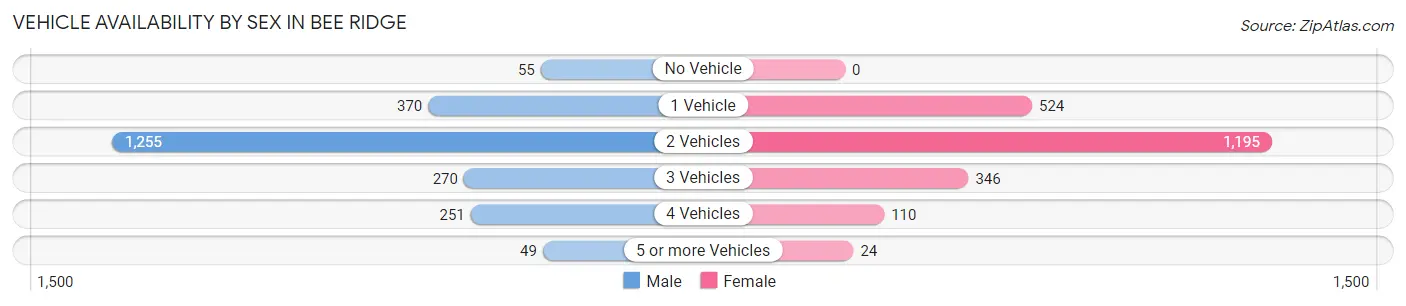
| Vehicles Available | Male | Female |
| No Vehicle | 55 (2.4%) | 0 (0.0%) |
| 1 Vehicle | 370 (16.4%) | 524 (23.8%) |
| 2 Vehicles | 1,255 (55.8%) | 1,195 (54.3%) |
| 3 Vehicles | 270 (12.0%) | 346 (15.7%) |
| 4 Vehicles | 251 (11.2%) | 110 (5.0%) |
| 5 or more Vehicles | 49 (2.2%) | 24 (1.1%) |
| Total | 2,250 (100.0%) | 2,199 (100.0%) |
Commute Time in Bee Ridge
The most frequently occuring commute durations in Bee Ridge are 20 to 24 minutes (1,259 commuters, 32.4%), 15 to 19 minutes (796 commuters, 20.5%), and 10 to 14 minutes (411 commuters, 10.6%).
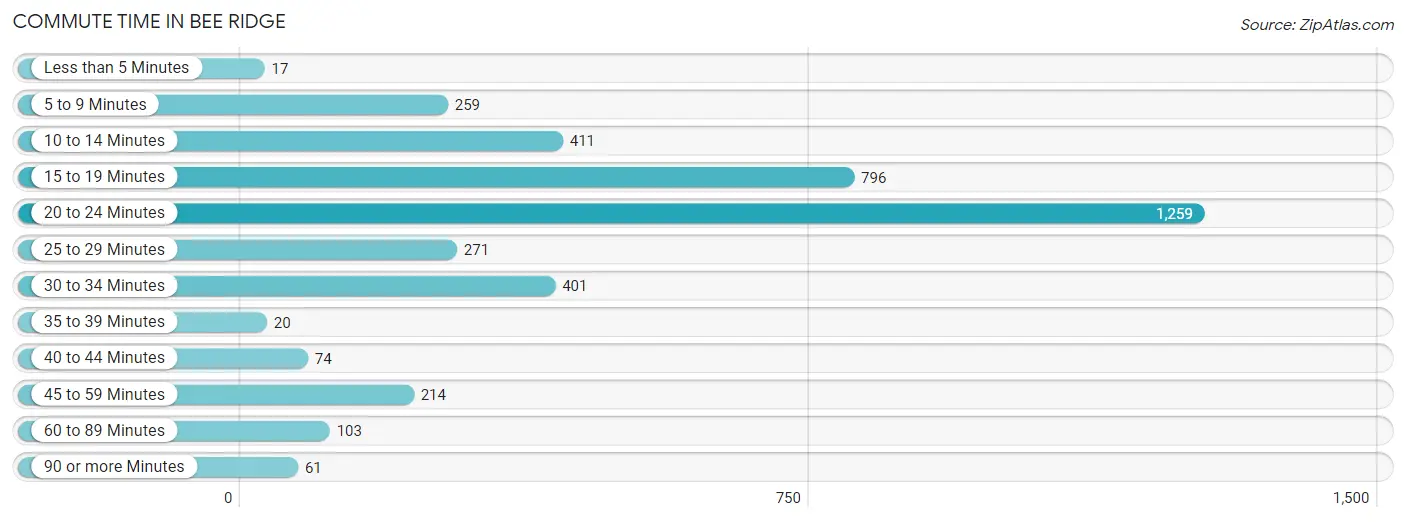
| Commute Time | # Commuters | % Commuters |
| Less than 5 Minutes | 17 | 0.4% |
| 5 to 9 Minutes | 259 | 6.7% |
| 10 to 14 Minutes | 411 | 10.6% |
| 15 to 19 Minutes | 796 | 20.5% |
| 20 to 24 Minutes | 1,259 | 32.4% |
| 25 to 29 Minutes | 271 | 7.0% |
| 30 to 34 Minutes | 401 | 10.3% |
| 35 to 39 Minutes | 20 | 0.5% |
| 40 to 44 Minutes | 74 | 1.9% |
| 45 to 59 Minutes | 214 | 5.5% |
| 60 to 89 Minutes | 103 | 2.6% |
| 90 or more Minutes | 61 | 1.6% |
Commute Time by Sex in Bee Ridge
The most common commute times in Bee Ridge are 20 to 24 minutes (568 commuters, 29.8%) for males and 20 to 24 minutes (691 commuters, 34.9%) for females.
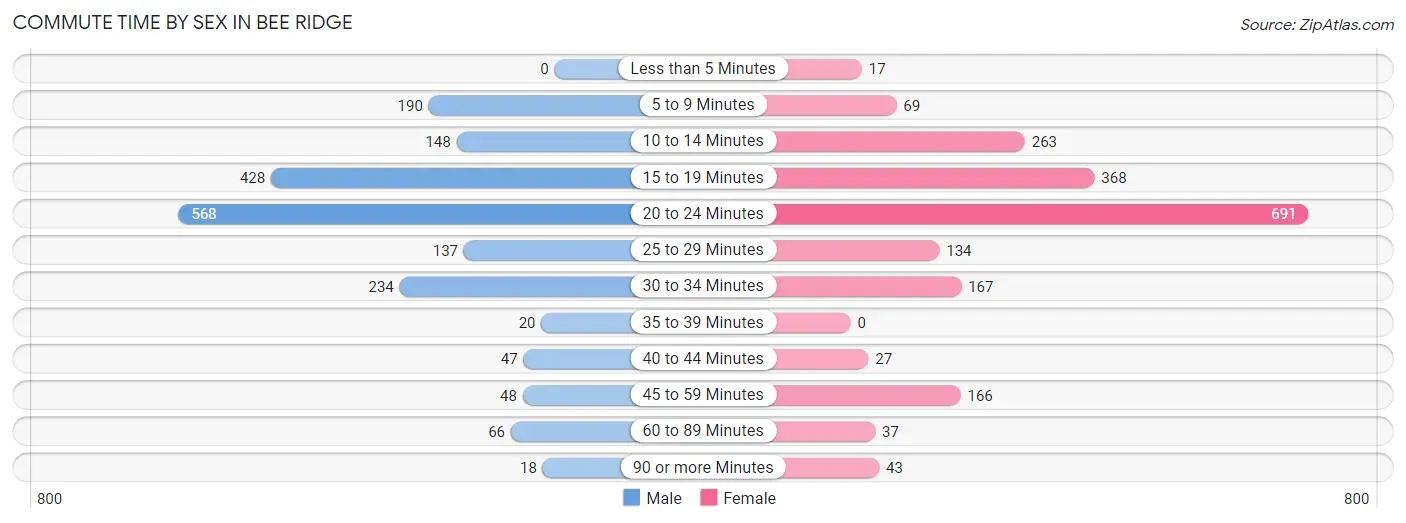
| Commute Time | Male | Female |
| Less than 5 Minutes | 0 (0.0%) | 17 (0.9%) |
| 5 to 9 Minutes | 190 (10.0%) | 69 (3.5%) |
| 10 to 14 Minutes | 148 (7.8%) | 263 (13.3%) |
| 15 to 19 Minutes | 428 (22.5%) | 368 (18.6%) |
| 20 to 24 Minutes | 568 (29.8%) | 691 (34.9%) |
| 25 to 29 Minutes | 137 (7.2%) | 134 (6.8%) |
| 30 to 34 Minutes | 234 (12.3%) | 167 (8.4%) |
| 35 to 39 Minutes | 20 (1.1%) | 0 (0.0%) |
| 40 to 44 Minutes | 47 (2.5%) | 27 (1.4%) |
| 45 to 59 Minutes | 48 (2.5%) | 166 (8.4%) |
| 60 to 89 Minutes | 66 (3.5%) | 37 (1.9%) |
| 90 or more Minutes | 18 (0.9%) | 43 (2.2%) |
Time of Departure to Work by Sex in Bee Ridge
The most frequent times of departure to work in Bee Ridge are 7:00 AM to 7:29 AM (261, 13.7%) for males and 7:30 AM to 7:59 AM (476, 24.0%) for females.
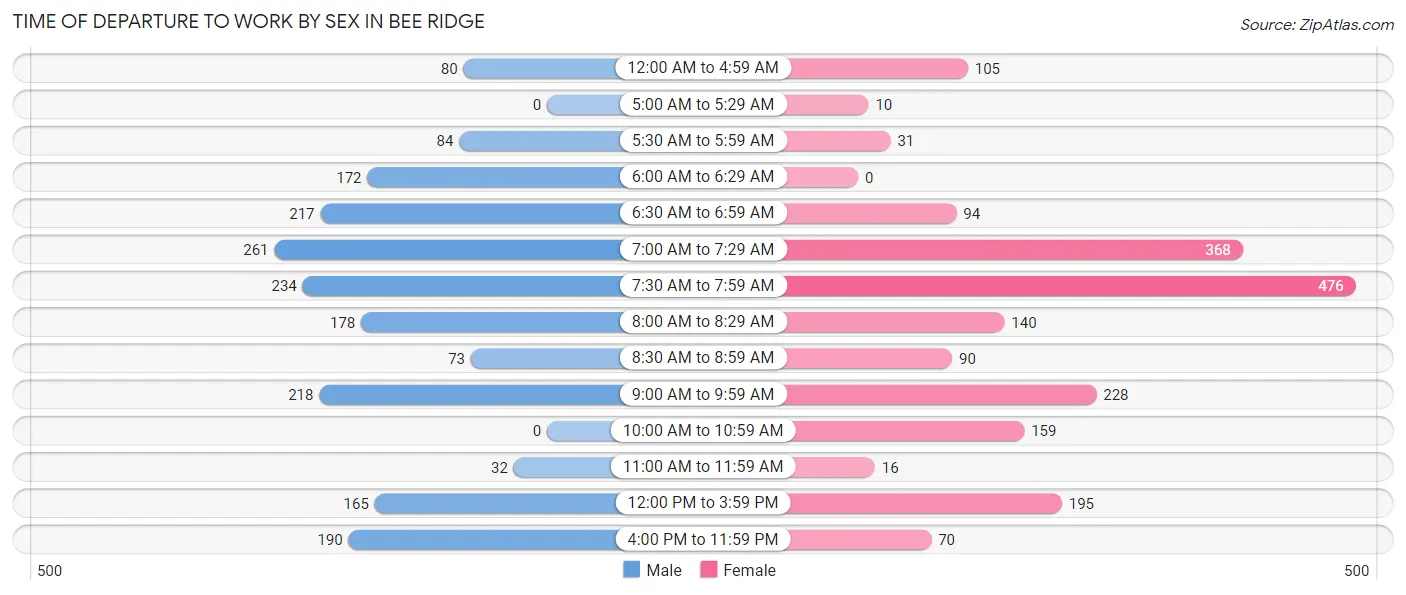
| Time of Departure | Male | Female |
| 12:00 AM to 4:59 AM | 80 (4.2%) | 105 (5.3%) |
| 5:00 AM to 5:29 AM | 0 (0.0%) | 10 (0.5%) |
| 5:30 AM to 5:59 AM | 84 (4.4%) | 31 (1.6%) |
| 6:00 AM to 6:29 AM | 172 (9.0%) | 0 (0.0%) |
| 6:30 AM to 6:59 AM | 217 (11.4%) | 94 (4.7%) |
| 7:00 AM to 7:29 AM | 261 (13.7%) | 368 (18.6%) |
| 7:30 AM to 7:59 AM | 234 (12.3%) | 476 (24.0%) |
| 8:00 AM to 8:29 AM | 178 (9.3%) | 140 (7.1%) |
| 8:30 AM to 8:59 AM | 73 (3.8%) | 90 (4.5%) |
| 9:00 AM to 9:59 AM | 218 (11.5%) | 228 (11.5%) |
| 10:00 AM to 10:59 AM | 0 (0.0%) | 159 (8.0%) |
| 11:00 AM to 11:59 AM | 32 (1.7%) | 16 (0.8%) |
| 12:00 PM to 3:59 PM | 165 (8.7%) | 195 (9.8%) |
| 4:00 PM to 11:59 PM | 190 (10.0%) | 70 (3.5%) |
| Total | 1,904 (100.0%) | 1,982 (100.0%) |
Housing Occupancy in Bee Ridge
Occupancy by Ownership in Bee Ridge
Of the total 4,670 dwellings in Bee Ridge, owner-occupied units account for 3,569 (76.4%), while renter-occupied units make up 1,101 (23.6%).
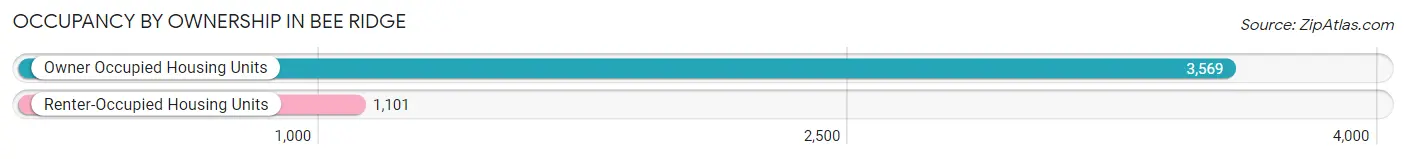
| Occupancy | # Housing Units | % Housing Units |
| Owner Occupied Housing Units | 3,569 | 76.4% |
| Renter-Occupied Housing Units | 1,101 | 23.6% |
| Total Occupied Housing Units | 4,670 | 100.0% |
Occupancy by Household Size in Bee Ridge
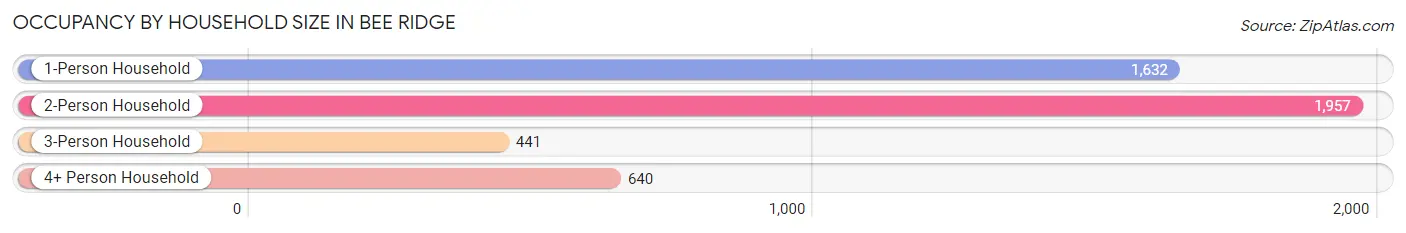
| Household Size | # Housing Units | % Housing Units |
| 1-Person Household | 1,632 | 34.9% |
| 2-Person Household | 1,957 | 41.9% |
| 3-Person Household | 441 | 9.4% |
| 4+ Person Household | 640 | 13.7% |
| Total Housing Units | 4,670 | 100.0% |
Occupancy by Ownership by Household Size in Bee Ridge
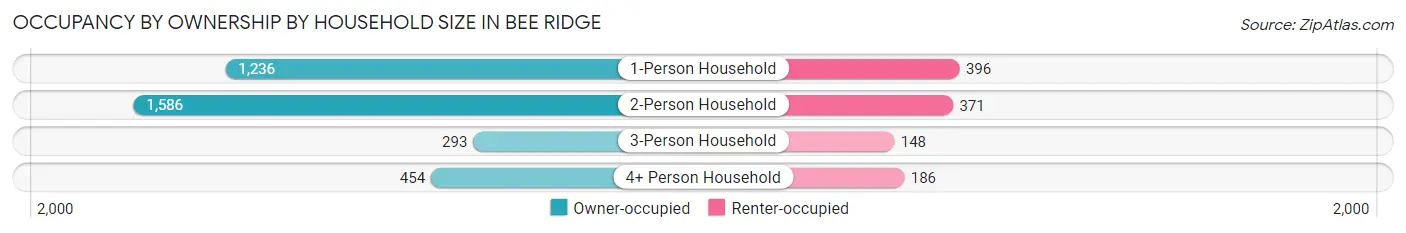
| Household Size | Owner-occupied | Renter-occupied |
| 1-Person Household | 1,236 (75.7%) | 396 (24.3%) |
| 2-Person Household | 1,586 (81.0%) | 371 (19.0%) |
| 3-Person Household | 293 (66.4%) | 148 (33.6%) |
| 4+ Person Household | 454 (70.9%) | 186 (29.1%) |
| Total Housing Units | 3,569 (76.4%) | 1,101 (23.6%) |
Occupancy by Educational Attainment in Bee Ridge
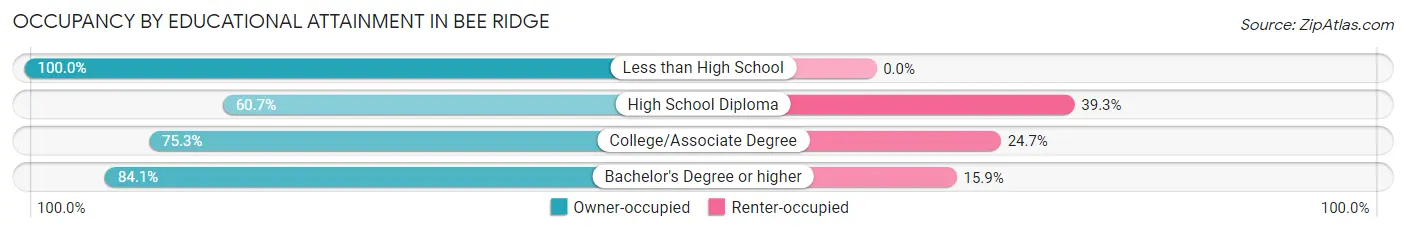
| Household Size | Owner-occupied | Renter-occupied |
| Less than High School | 132 (100.0%) | 0 (0.0%) |
| High School Diploma | 598 (60.7%) | 387 (39.3%) |
| College/Associate Degree | 1,272 (75.3%) | 417 (24.7%) |
| Bachelor's Degree or higher | 1,567 (84.1%) | 297 (15.9%) |
Occupancy by Age of Householder in Bee Ridge
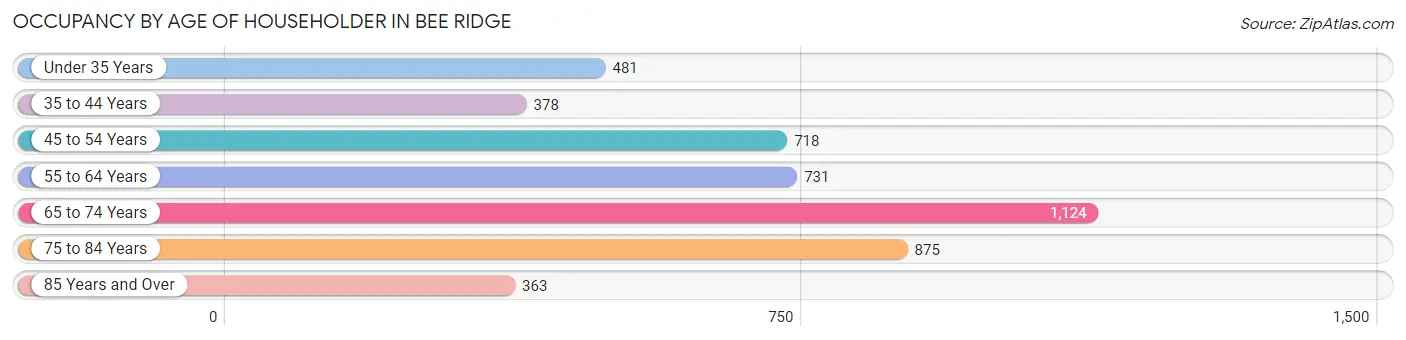
| Age Bracket | # Households | % Households |
| Under 35 Years | 481 | 10.3% |
| 35 to 44 Years | 378 | 8.1% |
| 45 to 54 Years | 718 | 15.4% |
| 55 to 64 Years | 731 | 15.7% |
| 65 to 74 Years | 1,124 | 24.1% |
| 75 to 84 Years | 875 | 18.7% |
| 85 Years and Over | 363 | 7.8% |
| Total | 4,670 | 100.0% |
Housing Finances in Bee Ridge
Median Income by Occupancy in Bee Ridge
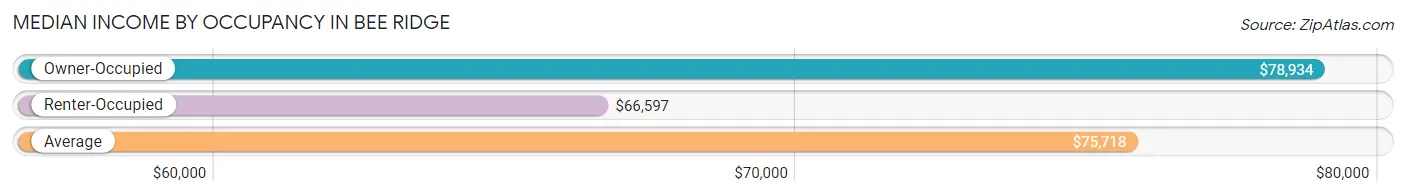
| Occupancy Type | # Households | Median Income |
| Owner-Occupied | 3,569 (76.4%) | $78,934 |
| Renter-Occupied | 1,101 (23.6%) | $66,597 |
| Average | 4,670 (100.0%) | $75,718 |
Occupancy by Householder Income Bracket in Bee Ridge
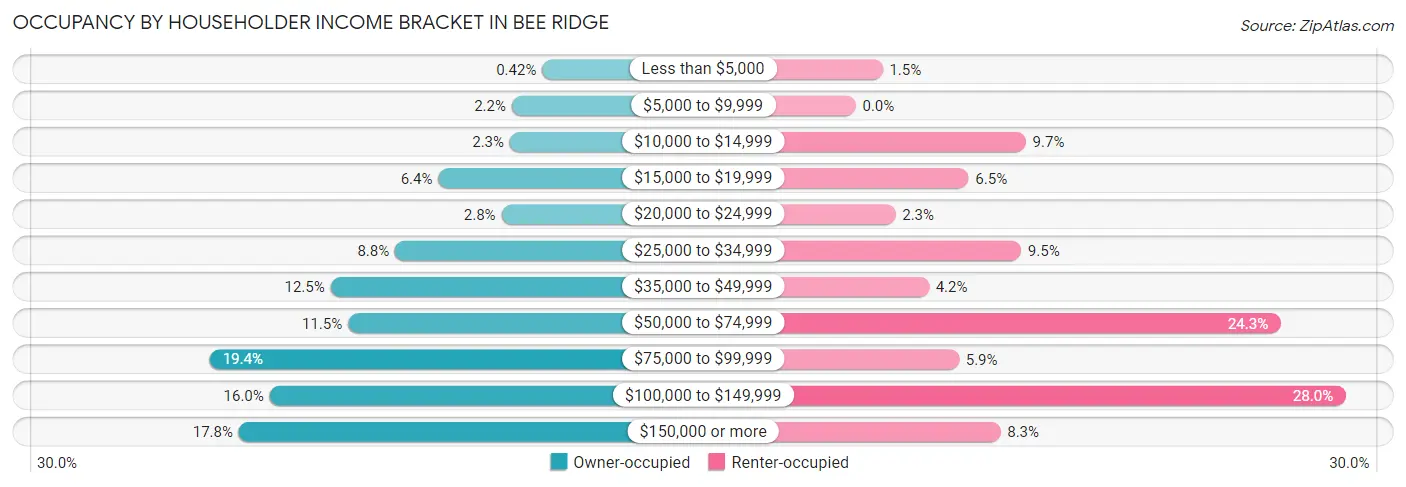
| Income Bracket | Owner-occupied | Renter-occupied |
| Less than $5,000 | 15 (0.4%) | 17 (1.5%) |
| $5,000 to $9,999 | 77 (2.2%) | 0 (0.0%) |
| $10,000 to $14,999 | 81 (2.3%) | 107 (9.7%) |
| $15,000 to $19,999 | 227 (6.4%) | 71 (6.5%) |
| $20,000 to $24,999 | 98 (2.8%) | 25 (2.3%) |
| $25,000 to $34,999 | 315 (8.8%) | 104 (9.5%) |
| $35,000 to $49,999 | 447 (12.5%) | 46 (4.2%) |
| $50,000 to $74,999 | 411 (11.5%) | 267 (24.2%) |
| $75,000 to $99,999 | 693 (19.4%) | 65 (5.9%) |
| $100,000 to $149,999 | 571 (16.0%) | 308 (28.0%) |
| $150,000 or more | 634 (17.8%) | 91 (8.3%) |
| Total | 3,569 (100.0%) | 1,101 (100.0%) |
Monthly Housing Cost Tiers in Bee Ridge
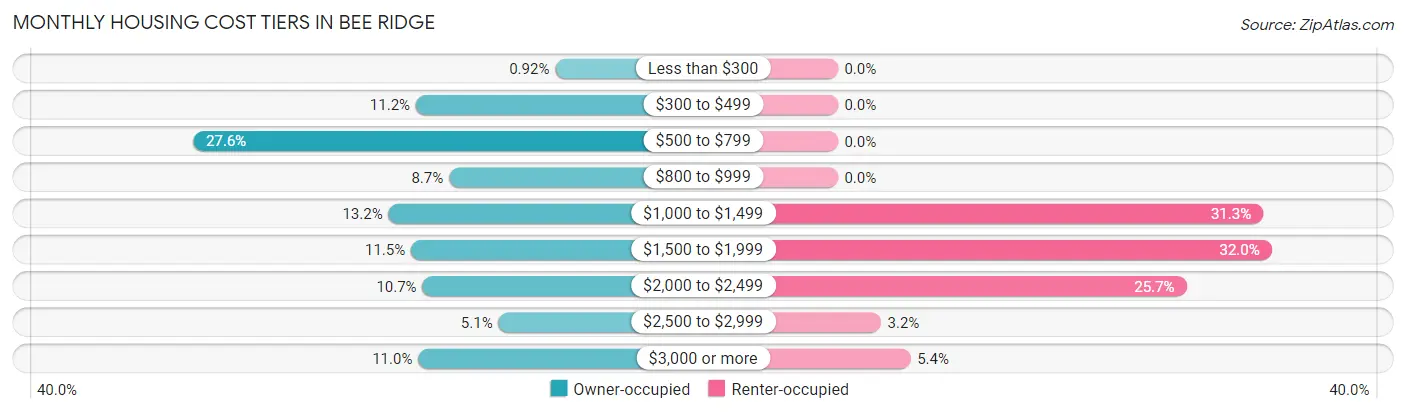
| Monthly Cost | Owner-occupied | Renter-occupied |
| Less than $300 | 33 (0.9%) | 0 (0.0%) |
| $300 to $499 | 399 (11.2%) | 0 (0.0%) |
| $500 to $799 | 985 (27.6%) | 0 (0.0%) |
| $800 to $999 | 312 (8.7%) | 0 (0.0%) |
| $1,000 to $1,499 | 471 (13.2%) | 345 (31.3%) |
| $1,500 to $1,999 | 412 (11.5%) | 352 (32.0%) |
| $2,000 to $2,499 | 382 (10.7%) | 283 (25.7%) |
| $2,500 to $2,999 | 182 (5.1%) | 35 (3.2%) |
| $3,000 or more | 393 (11.0%) | 59 (5.4%) |
| Total | 3,569 (100.0%) | 1,101 (100.0%) |
Physical Housing Characteristics in Bee Ridge
Housing Structures in Bee Ridge
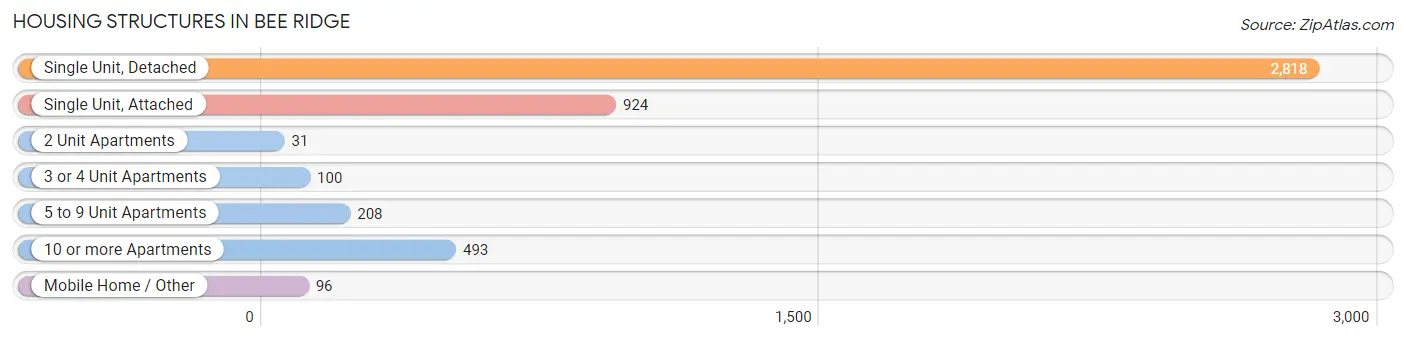
| Structure Type | # Housing Units | % Housing Units |
| Single Unit, Detached | 2,818 | 60.3% |
| Single Unit, Attached | 924 | 19.8% |
| 2 Unit Apartments | 31 | 0.7% |
| 3 or 4 Unit Apartments | 100 | 2.1% |
| 5 to 9 Unit Apartments | 208 | 4.4% |
| 10 or more Apartments | 493 | 10.6% |
| Mobile Home / Other | 96 | 2.1% |
| Total | 4,670 | 100.0% |
Housing Structures by Occupancy in Bee Ridge
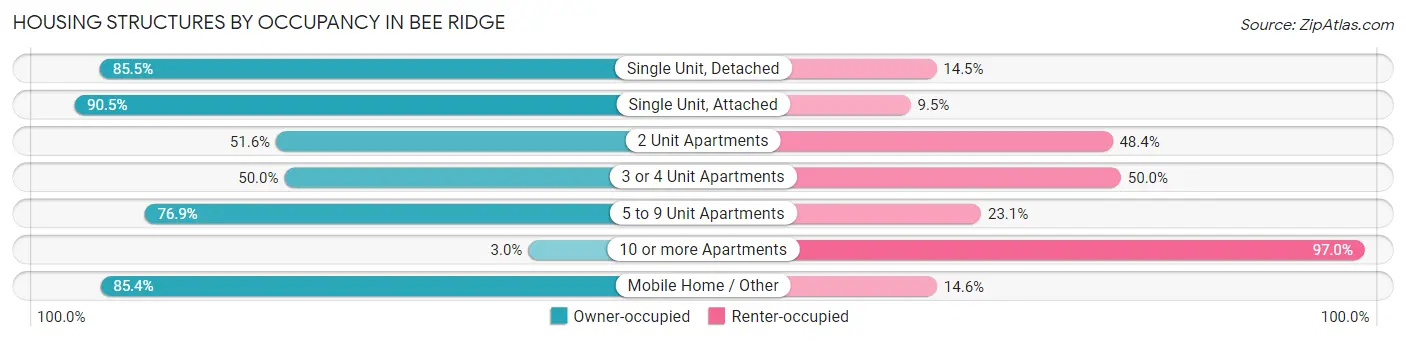
| Structure Type | Owner-occupied | Renter-occupied |
| Single Unit, Detached | 2,410 (85.5%) | 408 (14.5%) |
| Single Unit, Attached | 836 (90.5%) | 88 (9.5%) |
| 2 Unit Apartments | 16 (51.6%) | 15 (48.4%) |
| 3 or 4 Unit Apartments | 50 (50.0%) | 50 (50.0%) |
| 5 to 9 Unit Apartments | 160 (76.9%) | 48 (23.1%) |
| 10 or more Apartments | 15 (3.0%) | 478 (97.0%) |
| Mobile Home / Other | 82 (85.4%) | 14 (14.6%) |
| Total | 3,569 (76.4%) | 1,101 (23.6%) |
Housing Structures by Number of Rooms in Bee Ridge
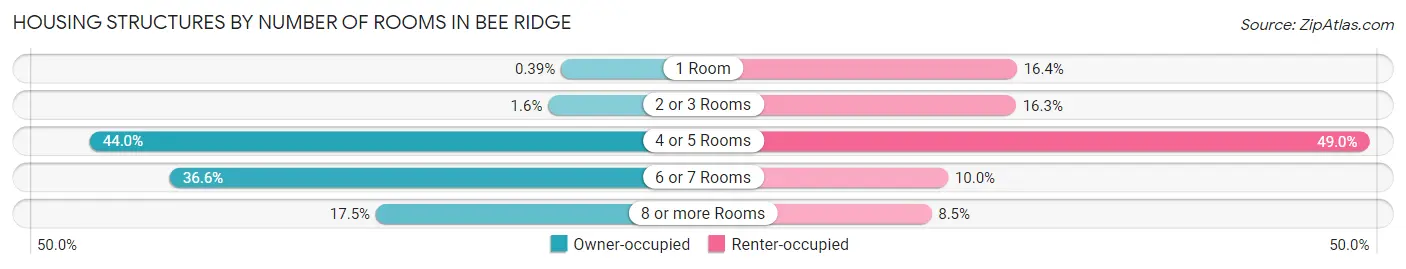
| Number of Rooms | Owner-occupied | Renter-occupied |
| 1 Room | 14 (0.4%) | 180 (16.4%) |
| 2 or 3 Rooms | 56 (1.6%) | 179 (16.3%) |
| 4 or 5 Rooms | 1,569 (44.0%) | 539 (49.0%) |
| 6 or 7 Rooms | 1,305 (36.6%) | 110 (10.0%) |
| 8 or more Rooms | 625 (17.5%) | 93 (8.5%) |
| Total | 3,569 (100.0%) | 1,101 (100.0%) |
Housing Structure by Heating Type in Bee Ridge
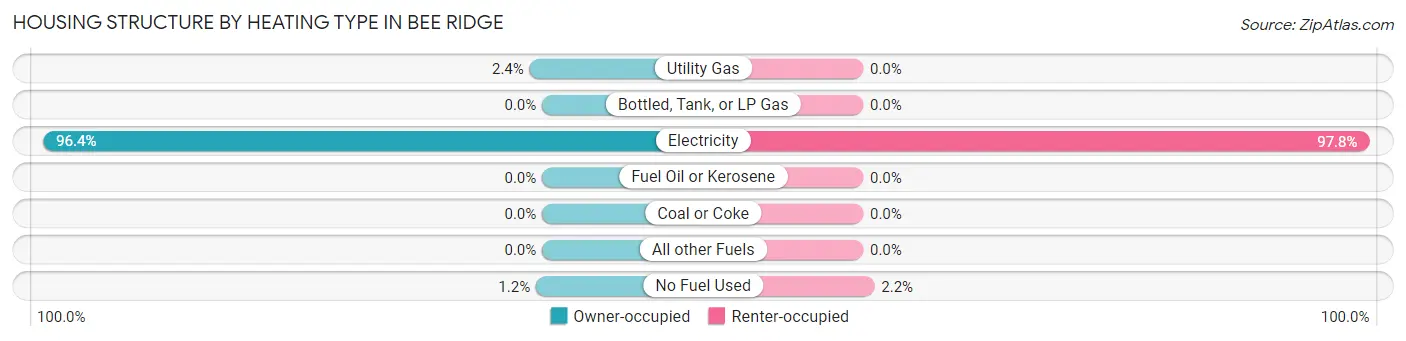
| Heating Type | Owner-occupied | Renter-occupied |
| Utility Gas | 86 (2.4%) | 0 (0.0%) |
| Bottled, Tank, or LP Gas | 0 (0.0%) | 0 (0.0%) |
| Electricity | 3,441 (96.4%) | 1,077 (97.8%) |
| Fuel Oil or Kerosene | 0 (0.0%) | 0 (0.0%) |
| Coal or Coke | 0 (0.0%) | 0 (0.0%) |
| All other Fuels | 0 (0.0%) | 0 (0.0%) |
| No Fuel Used | 42 (1.2%) | 24 (2.2%) |
| Total | 3,569 (100.0%) | 1,101 (100.0%) |
Household Vehicle Usage in Bee Ridge
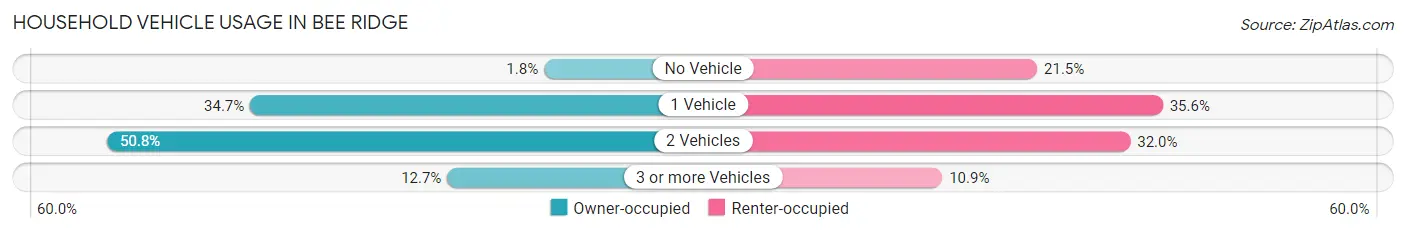
| Vehicles per Household | Owner-occupied | Renter-occupied |
| No Vehicle | 65 (1.8%) | 237 (21.5%) |
| 1 Vehicle | 1,240 (34.7%) | 392 (35.6%) |
| 2 Vehicles | 1,812 (50.8%) | 352 (32.0%) |
| 3 or more Vehicles | 452 (12.7%) | 120 (10.9%) |
| Total | 3,569 (100.0%) | 1,101 (100.0%) |
Real Estate & Mortgages in Bee Ridge
Real Estate and Mortgage Overview in Bee Ridge
| Characteristic | Without Mortgage | With Mortgage |
| Housing Units | 1,742 | 1,827 |
| Median Property Value | $262,400 | $412,500 |
| Median Household Income | $53,438 | $441 |
| Monthly Housing Costs | $641 | $377 |
| Real Estate Taxes | $2,150 | $0 |
Property Value by Mortgage Status in Bee Ridge
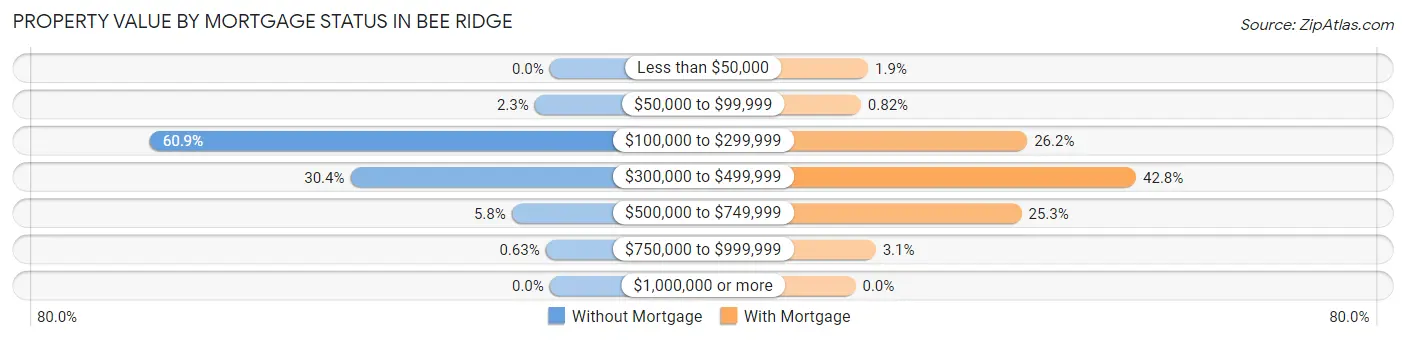
| Property Value | Without Mortgage | With Mortgage |
| Less than $50,000 | 0 (0.0%) | 35 (1.9%) |
| $50,000 to $99,999 | 40 (2.3%) | 15 (0.8%) |
| $100,000 to $299,999 | 1,061 (60.9%) | 478 (26.2%) |
| $300,000 to $499,999 | 529 (30.4%) | 781 (42.7%) |
| $500,000 to $749,999 | 101 (5.8%) | 462 (25.3%) |
| $750,000 to $999,999 | 11 (0.6%) | 56 (3.1%) |
| $1,000,000 or more | 0 (0.0%) | 0 (0.0%) |
| Total | 1,742 (100.0%) | 1,827 (100.0%) |
Household Income by Mortgage Status in Bee Ridge
| Household Income | Without Mortgage | With Mortgage |
| Less than $10,000 | 92 (5.3%) | 17 (0.9%) |
| $10,000 to $24,999 | 291 (16.7%) | 0 (0.0%) |
| $25,000 to $34,999 | 248 (14.2%) | 115 (6.3%) |
| $35,000 to $49,999 | 234 (13.4%) | 67 (3.7%) |
| $50,000 to $74,999 | 155 (8.9%) | 213 (11.7%) |
| $75,000 to $99,999 | 343 (19.7%) | 256 (14.0%) |
| $100,000 to $149,999 | 186 (10.7%) | 350 (19.2%) |
| $150,000 or more | 193 (11.1%) | 385 (21.1%) |
| Total | 1,742 (100.0%) | 1,827 (100.0%) |
Property Value to Household Income Ratio in Bee Ridge
| Value-to-Income Ratio | Without Mortgage | With Mortgage |
| Less than 2.0x | 284 (16.3%) | 90,694 (4,964.1%) |
| 2.0x to 2.9x | 295 (16.9%) | 284 (15.5%) |
| 3.0x to 3.9x | 113 (6.5%) | 365 (20.0%) |
| 4.0x or more | 1,050 (60.3%) | 223 (12.2%) |
| Total | 1,742 (100.0%) | 1,827 (100.0%) |
Real Estate Taxes by Mortgage Status in Bee Ridge
| Property Taxes | Without Mortgage | With Mortgage |
| Less than $800 | 93 (5.3%) | 0 (0.0%) |
| $800 to $1,499 | 383 (22.0%) | 83 (4.5%) |
| $800 to $1,499 | 1,266 (72.7%) | 344 (18.8%) |
| Total | 1,742 (100.0%) | 1,827 (100.0%) |
Health & Disability in Bee Ridge
Health Insurance Coverage by Age in Bee Ridge
| Age Bracket | With Coverage | Without Coverage |
| Under 6 Years | 329 (75.8%) | 105 (24.2%) |
| 6 to 18 Years | 880 (68.8%) | 400 (31.2%) |
| 19 to 25 Years | 221 (72.2%) | 85 (27.8%) |
| 26 to 34 Years | 548 (75.6%) | 177 (24.4%) |
| 35 to 44 Years | 731 (84.1%) | 138 (15.9%) |
| 45 to 54 Years | 1,027 (77.6%) | 296 (22.4%) |
| 55 to 64 Years | 1,112 (74.8%) | 375 (25.2%) |
| 65 to 74 Years | 1,701 (100.0%) | 0 (0.0%) |
| 75 Years and older | 1,768 (99.4%) | 11 (0.6%) |
| Total | 8,317 (84.0%) | 1,587 (16.0%) |
Health Insurance Coverage by Citizenship Status in Bee Ridge
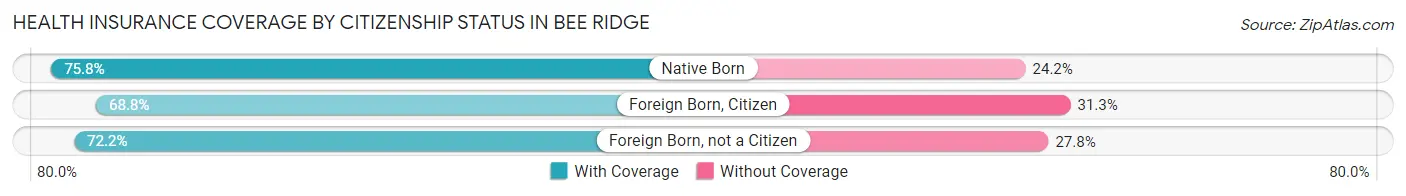
| Citizenship Status | With Coverage | Without Coverage |
| Native Born | 329 (75.8%) | 105 (24.2%) |
| Foreign Born, Citizen | 880 (68.8%) | 400 (31.2%) |
| Foreign Born, not a Citizen | 221 (72.2%) | 85 (27.8%) |
Health Insurance Coverage by Household Income in Bee Ridge
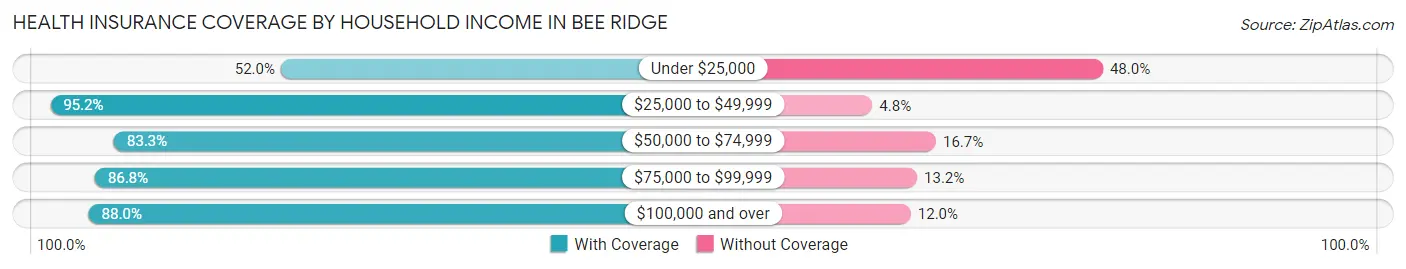
| Household Income | With Coverage | Without Coverage |
| Under $25,000 | 610 (52.0%) | 563 (48.0%) |
| $25,000 to $49,999 | 1,408 (95.2%) | 71 (4.8%) |
| $50,000 to $74,999 | 1,160 (83.3%) | 233 (16.7%) |
| $75,000 to $99,999 | 1,272 (86.8%) | 193 (13.2%) |
| $100,000 and over | 3,865 (88.0%) | 527 (12.0%) |
Public vs Private Health Insurance Coverage by Age in Bee Ridge
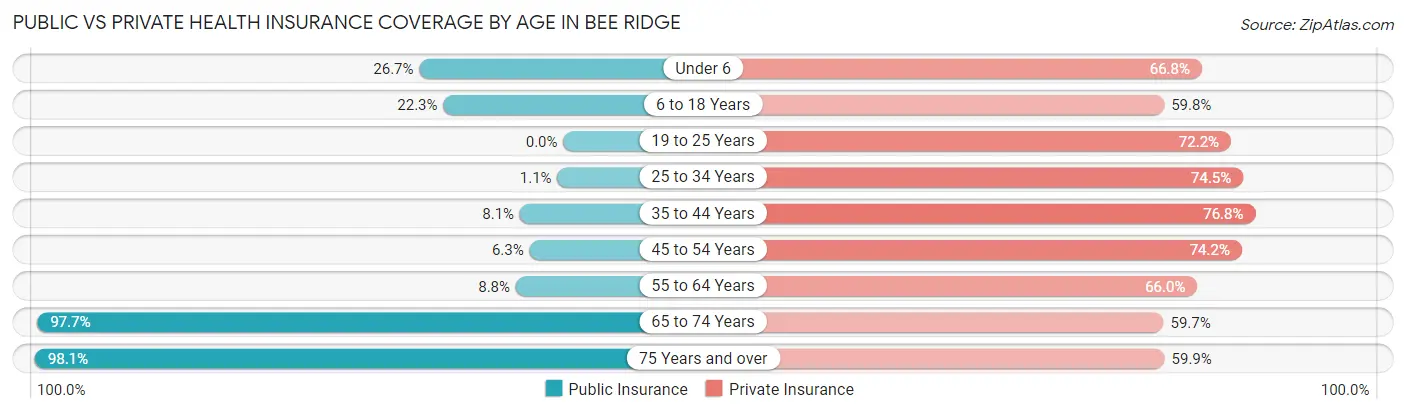
| Age Bracket | Public Insurance | Private Insurance |
| Under 6 | 116 (26.7%) | 290 (66.8%) |
| 6 to 18 Years | 285 (22.3%) | 766 (59.8%) |
| 19 to 25 Years | 0 (0.0%) | 221 (72.2%) |
| 25 to 34 Years | 8 (1.1%) | 540 (74.5%) |
| 35 to 44 Years | 70 (8.1%) | 667 (76.7%) |
| 45 to 54 Years | 83 (6.3%) | 982 (74.2%) |
| 55 to 64 Years | 131 (8.8%) | 981 (66.0%) |
| 65 to 74 Years | 1,661 (97.7%) | 1,016 (59.7%) |
| 75 Years and over | 1,745 (98.1%) | 1,066 (59.9%) |
| Total | 4,099 (41.4%) | 6,529 (65.9%) |
Disability Status by Sex by Age in Bee Ridge
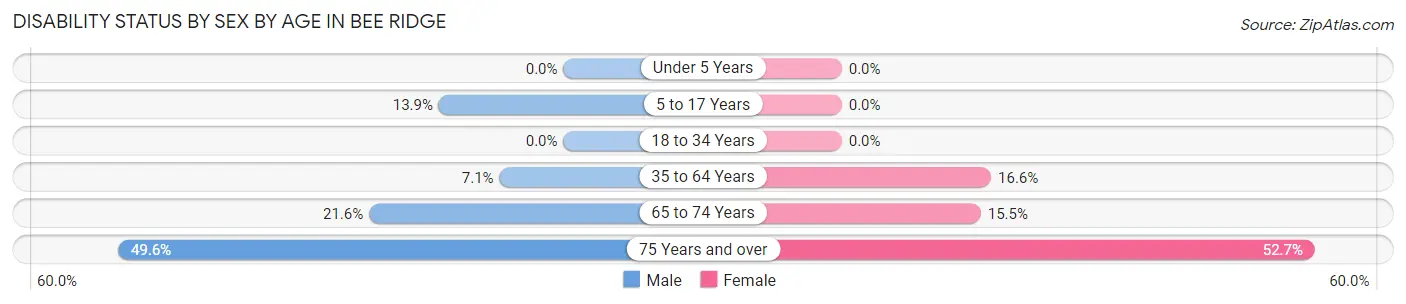
| Age Bracket | Male | Female |
| Under 5 Years | 0 (0.0%) | 0 (0.0%) |
| 5 to 17 Years | 90 (13.9%) | 0 (0.0%) |
| 18 to 34 Years | 0 (0.0%) | 0 (0.0%) |
| 35 to 64 Years | 122 (7.1%) | 327 (16.6%) |
| 65 to 74 Years | 185 (21.6%) | 131 (15.5%) |
| 75 Years and over | 307 (49.6%) | 611 (52.7%) |
Disability Class by Sex by Age in Bee Ridge
Disability Class: Hearing Difficulty
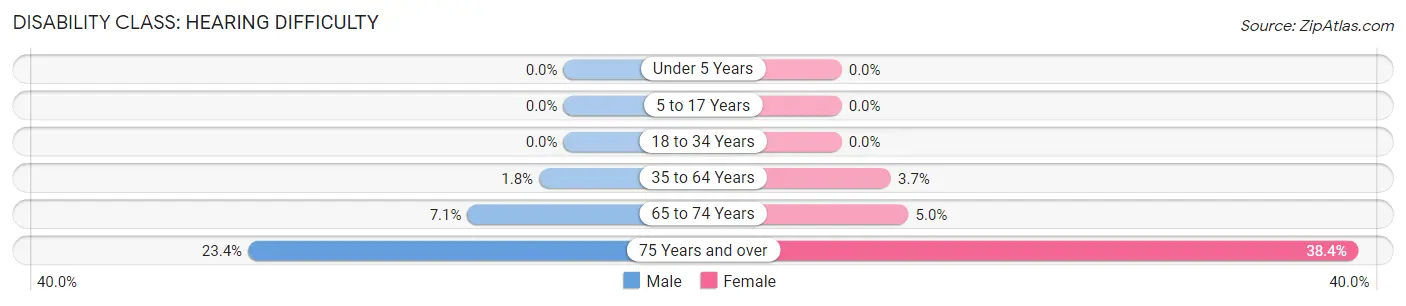
| Age Bracket | Male | Female |
| Under 5 Years | 0 (0.0%) | 0 (0.0%) |
| 5 to 17 Years | 0 (0.0%) | 0 (0.0%) |
| 18 to 34 Years | 0 (0.0%) | 0 (0.0%) |
| 35 to 64 Years | 31 (1.8%) | 72 (3.7%) |
| 65 to 74 Years | 61 (7.1%) | 42 (5.0%) |
| 75 Years and over | 145 (23.4%) | 445 (38.4%) |
Disability Class: Vision Difficulty
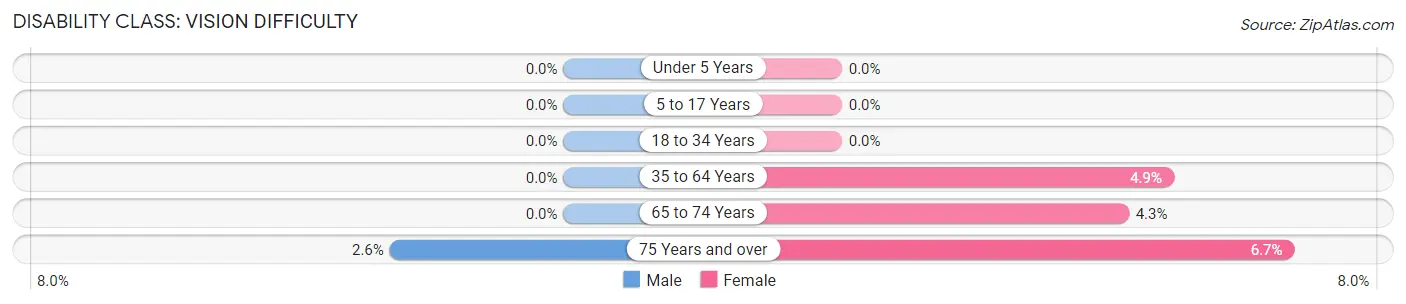
| Age Bracket | Male | Female |
| Under 5 Years | 0 (0.0%) | 0 (0.0%) |
| 5 to 17 Years | 0 (0.0%) | 0 (0.0%) |
| 18 to 34 Years | 0 (0.0%) | 0 (0.0%) |
| 35 to 64 Years | 0 (0.0%) | 97 (4.9%) |
| 65 to 74 Years | 0 (0.0%) | 36 (4.3%) |
| 75 Years and over | 16 (2.6%) | 78 (6.7%) |
Disability Class: Cognitive Difficulty
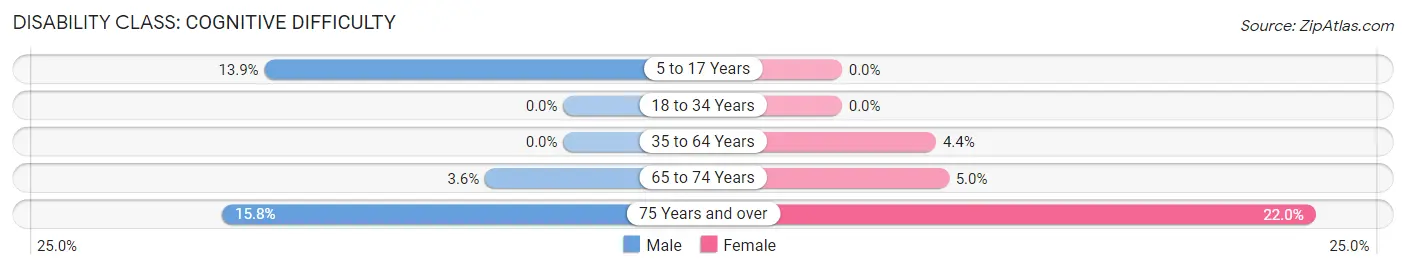
| Age Bracket | Male | Female |
| 5 to 17 Years | 90 (13.9%) | 0 (0.0%) |
| 18 to 34 Years | 0 (0.0%) | 0 (0.0%) |
| 35 to 64 Years | 0 (0.0%) | 86 (4.4%) |
| 65 to 74 Years | 31 (3.6%) | 42 (5.0%) |
| 75 Years and over | 98 (15.8%) | 255 (22.0%) |
Disability Class: Ambulatory Difficulty
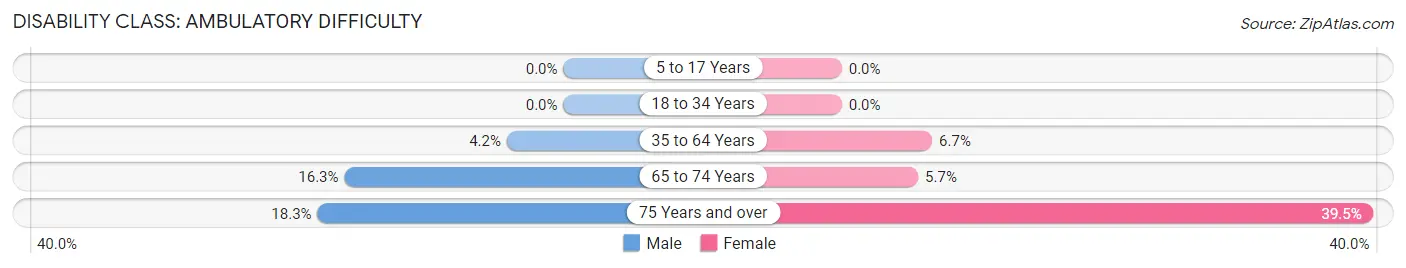
| Age Bracket | Male | Female |
| 5 to 17 Years | 0 (0.0%) | 0 (0.0%) |
| 18 to 34 Years | 0 (0.0%) | 0 (0.0%) |
| 35 to 64 Years | 72 (4.2%) | 132 (6.7%) |
| 65 to 74 Years | 139 (16.3%) | 48 (5.7%) |
| 75 Years and over | 113 (18.3%) | 458 (39.5%) |
Disability Class: Self-Care Difficulty
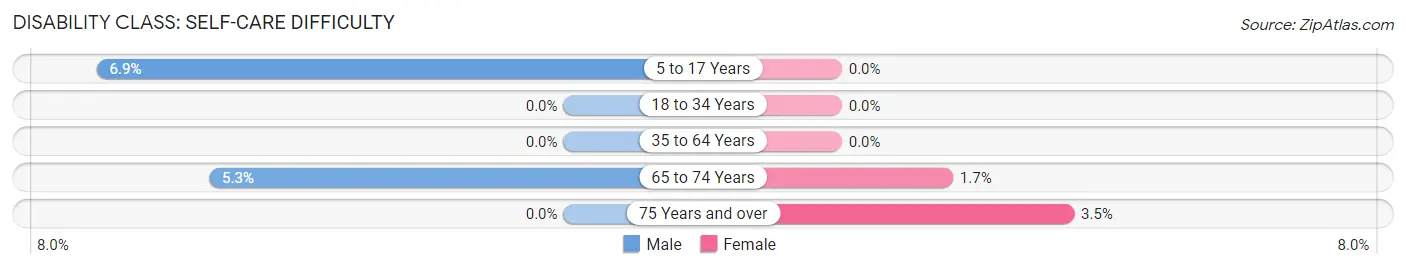
| Age Bracket | Male | Female |
| 5 to 17 Years | 45 (6.9%) | 0 (0.0%) |
| 18 to 34 Years | 0 (0.0%) | 0 (0.0%) |
| 35 to 64 Years | 0 (0.0%) | 0 (0.0%) |
| 65 to 74 Years | 45 (5.3%) | 14 (1.7%) |
| 75 Years and over | 0 (0.0%) | 40 (3.5%) |
Technology Access in Bee Ridge
Computing Device Access in Bee Ridge
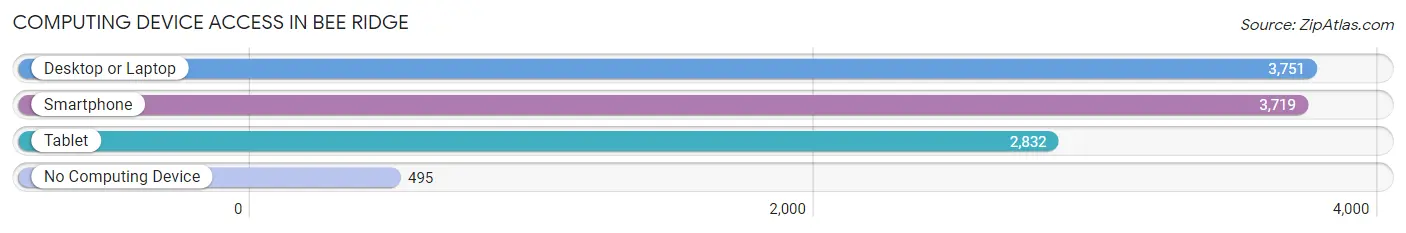
| Device Type | # Households | % Households |
| Desktop or Laptop | 3,751 | 80.3% |
| Smartphone | 3,719 | 79.6% |
| Tablet | 2,832 | 60.6% |
| No Computing Device | 495 | 10.6% |
| Total | 4,670 | 100.0% |
Internet Access in Bee Ridge
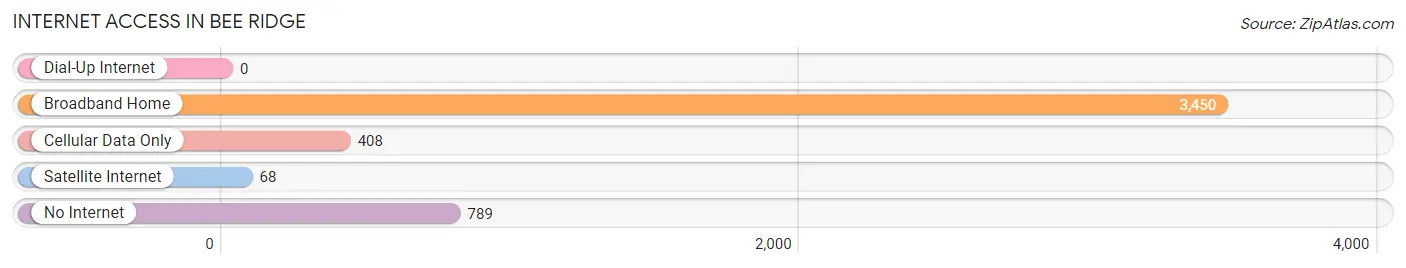
| Internet Type | # Households | % Households |
| Dial-Up Internet | 0 | 0.0% |
| Broadband Home | 3,450 | 73.9% |
| Cellular Data Only | 408 | 8.7% |
| Satellite Internet | 68 | 1.5% |
| No Internet | 789 | 16.9% |
| Total | 4,670 | 100.0% |
Bee Ridge Summary
Beach Ridge is a small unincorporated community located in Sarasota County, Florida. It is situated between the cities of Sarasota and Venice, and is part of the Bradenton-Sarasota-Venice Metropolitan Statistical Area. The population of Beach Ridge was estimated to be 1,845 in 2019.
History
Beach Ridge was first settled in the late 19th century by settlers from the nearby city of Sarasota. The area was originally known as "Sarasota Beach" and was home to a small fishing village. In the early 20th century, the area was renamed "Beach Ridge" and began to attract more settlers. The area was primarily used for farming and ranching, and the population slowly grew.
In the 1950s, the area began to experience rapid growth due to the development of the nearby cities of Sarasota and Venice. This growth led to the construction of several new homes and businesses in the area. In the late 1970s, the area was annexed by the city of Sarasota and became part of the city's urban area.
Geography
Beach Ridge is located in Sarasota County, Florida. It is situated between the cities of Sarasota and Venice, and is part of the Bradenton-Sarasota-Venice Metropolitan Statistical Area. The area is bordered by the Gulf of Mexico to the west, the Myakka River to the north, and the Sarasota Bay to the east. The area is mostly flat and is composed of sandy soil.
Economy
Beach Ridge is primarily a residential area, with most of the population employed in the nearby cities of Sarasota and Venice. The area is home to several small businesses, including restaurants, retail stores, and professional services. The area is also home to a number of tourist attractions, including the Myakka River State Park and the Sarasota Jungle Gardens.
Demographics
As of 2019, the population of Beach Ridge was estimated to be 1,845. The population is primarily white (90.2%), with the remaining population being made up of African Americans (4.2%), Hispanics (3.2%), and other races (2.4%). The median household income in Beach Ridge is $50,945, and the median home value is $220,000. The area is served by the Sarasota County School District.
Common Questions
What is Per Capita Income in Bee Ridge?
Per Capita income in Bee Ridge is $47,115.
What is the Median Family Income in Bee Ridge?
Median Family Income in Bee Ridge is $90,877.
What is the Median Household income in Bee Ridge?
Median Household Income in Bee Ridge is $75,718.
What is Income or Wage Gap in Bee Ridge?
Income or Wage Gap in Bee Ridge is 39.4%.
Women in Bee Ridge earn 60.6 cents for every dollar earned by a man.
What is Family Income Deficit in Bee Ridge?
Family Income Deficit in Bee Ridge is $8,520.
Families that are below poverty line in Bee Ridge earn $8,520 less on average than the poverty threshold level.
What is Inequality or Gini Index in Bee Ridge?
Inequality or Gini Index in Bee Ridge is 0.47.
What is the Total Population of Bee Ridge?
Total Population of Bee Ridge is 10,069.
What is the Total Male Population of Bee Ridge?
Total Male Population of Bee Ridge is 4,628.
What is the Total Female Population of Bee Ridge?
Total Female Population of Bee Ridge is 5,441.
What is the Ratio of Males per 100 Females in Bee Ridge?
There are 85.06 Males per 100 Females in Bee Ridge.
What is the Ratio of Females per 100 Males in Bee Ridge?
There are 117.57 Females per 100 Males in Bee Ridge.
What is the Median Population Age in Bee Ridge?
Median Population Age in Bee Ridge is 55.3 Years.
What is the Average Family Size in Bee Ridge
Average Family Size in Bee Ridge is 2.7 People.
What is the Average Household Size in Bee Ridge
Average Household Size in Bee Ridge is 2.1 People.
How Large is the Labor Force in Bee Ridge?
There are 4,602 People in the Labor Forcein in Bee Ridge.
What is the Percentage of People in the Labor Force in Bee Ridge?
53.2% of People are in the Labor Force in Bee Ridge.
What is the Unemployment Rate in Bee Ridge?
Unemployment Rate in Bee Ridge is 2.7%.