Pine Ridge CDP Citrus County, FL Map & Demographics
Pine Ridge CDP Citrus County Overview
$40,932
PER CAPITA INCOME
$75,233
AVG FAMILY INCOME
$65,522
AVG HOUSEHOLD INCOME
10.0%
WAGE / INCOME GAP [ % ]
90.0¢/ $1
WAGE / INCOME GAP [ $ ]
0.46
INEQUALITY / GINI INDEX
10,269
TOTAL POPULATION
5,013
MALE POPULATION
5,256
FEMALE POPULATION
95.38
MALES / 100 FEMALES
104.85
FEMALES / 100 MALES
65.0
MEDIAN AGE
2.5
AVG FAMILY SIZE
2.1
AVG HOUSEHOLD SIZE
2,838
LABOR FORCE [ PEOPLE ]
30.5%
PERCENT IN LABOR FORCE
5.1%
UNEMPLOYMENT RATE
Income in Pine Ridge CDP Citrus County
Income Overview in Pine Ridge CDP Citrus County
Per Capita Income in Pine Ridge CDP Citrus County is $40,932, while median incomes of families and households are $75,233 and $65,522 respectively.
| Characteristic | Number | Measure |
| Per Capita Income | 10,269 | $40,932 |
| Median Family Income | 3,435 | $75,233 |
| Mean Family Income | 3,435 | $96,762 |
| Median Household Income | 4,788 | $65,522 |
| Mean Household Income | 4,788 | $86,395 |
| Income Deficit | 3,435 | $0 |
| Wage / Income Gap (%) | 10,269 | 10.05% |
| Wage / Income Gap ($) | 10,269 | 89.95¢ per $1 |
| Gini / Inequality Index | 10,269 | 0.46 |
Earnings by Sex in Pine Ridge CDP Citrus County
Average Earnings in Pine Ridge CDP Citrus County are $39,167, $40,524 for men and $36,452 for women, a difference of 10.1%.
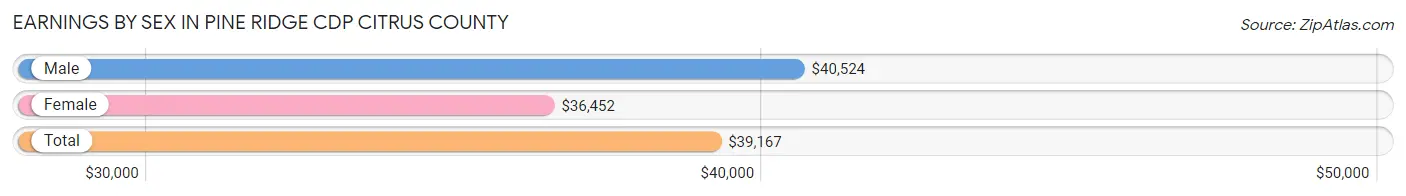
| Sex | Number | Average Earnings |
| Male | 1,622 (54.1%) | $40,524 |
| Female | 1,378 (45.9%) | $36,452 |
| Total | 3,000 (100.0%) | $39,167 |
Earnings by Sex by Income Bracket in Pine Ridge CDP Citrus County
The most common earnings brackets in Pine Ridge CDP Citrus County are $100,000+ for men (341 | 21.0%) and $22,500 to $24,999 for women (190 | 13.8%).
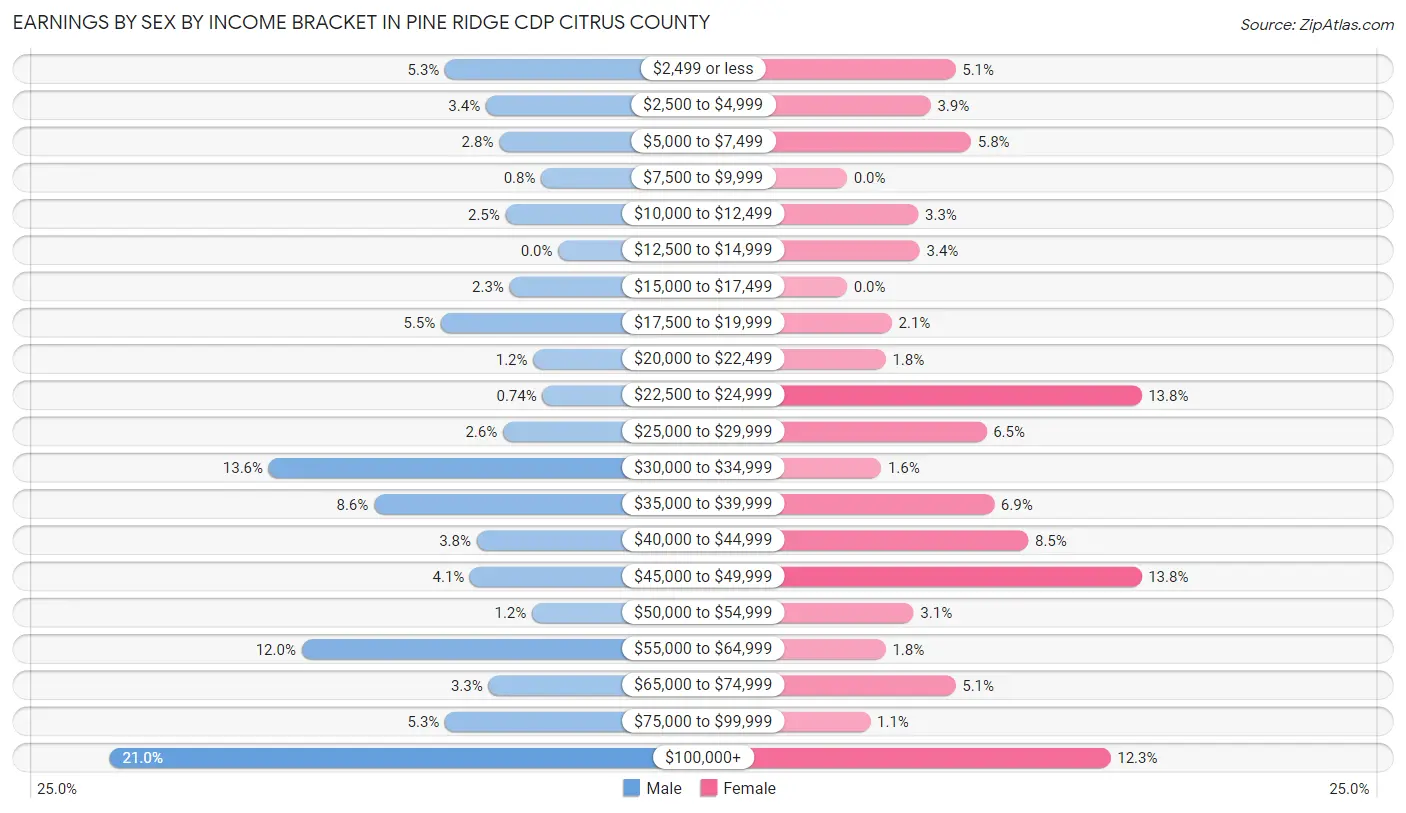
| Income | Male | Female |
| $2,499 or less | 86 (5.3%) | 70 (5.1%) |
| $2,500 to $4,999 | 55 (3.4%) | 54 (3.9%) |
| $5,000 to $7,499 | 45 (2.8%) | 80 (5.8%) |
| $7,500 to $9,999 | 13 (0.8%) | 0 (0.0%) |
| $10,000 to $12,499 | 40 (2.5%) | 46 (3.3%) |
| $12,500 to $14,999 | 0 (0.0%) | 47 (3.4%) |
| $15,000 to $17,499 | 37 (2.3%) | 0 (0.0%) |
| $17,500 to $19,999 | 89 (5.5%) | 29 (2.1%) |
| $20,000 to $22,499 | 19 (1.2%) | 25 (1.8%) |
| $22,500 to $24,999 | 12 (0.7%) | 190 (13.8%) |
| $25,000 to $29,999 | 42 (2.6%) | 90 (6.5%) |
| $30,000 to $34,999 | 220 (13.6%) | 22 (1.6%) |
| $35,000 to $39,999 | 140 (8.6%) | 95 (6.9%) |
| $40,000 to $44,999 | 62 (3.8%) | 117 (8.5%) |
| $45,000 to $49,999 | 67 (4.1%) | 190 (13.8%) |
| $50,000 to $54,999 | 20 (1.2%) | 43 (3.1%) |
| $55,000 to $64,999 | 195 (12.0%) | 25 (1.8%) |
| $65,000 to $74,999 | 53 (3.3%) | 70 (5.1%) |
| $75,000 to $99,999 | 86 (5.3%) | 15 (1.1%) |
| $100,000+ | 341 (21.0%) | 170 (12.3%) |
| Total | 1,622 (100.0%) | 1,378 (100.0%) |
Earnings by Sex by Educational Attainment in Pine Ridge CDP Citrus County
Average earnings in Pine Ridge CDP Citrus County are $47,780 for men and $37,500 for women, a difference of 21.5%. Men with an educational attainment of college or associate's degree enjoy the highest average annual earnings of $58,789, while those with high school diploma education earn the least with $34,624. Women with an educational attainment of bachelor's degree earn the most with the average annual earnings of $46,583, while those with less than high school education have the smallest earnings of $24,411.
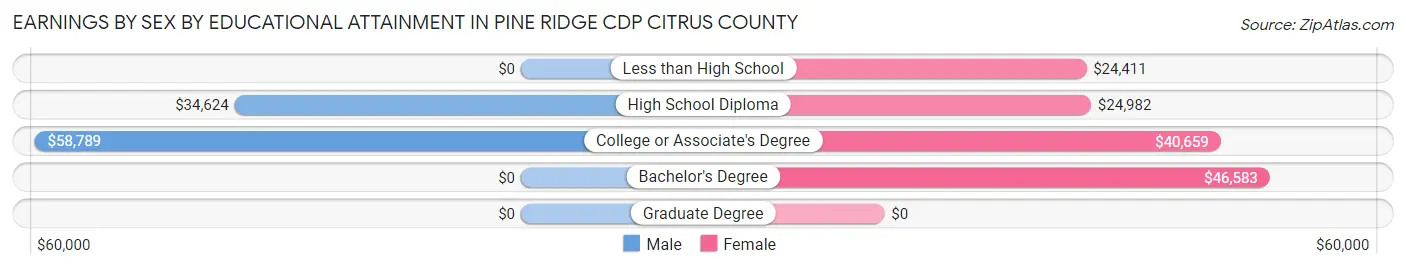
| Educational Attainment | Male Income | Female Income |
| Less than High School | - | - |
| High School Diploma | $34,624 | $24,982 |
| College or Associate's Degree | $58,789 | $40,659 |
| Bachelor's Degree | - | - |
| Graduate Degree | - | - |
| Total | $47,780 | $37,500 |
Family Income in Pine Ridge CDP Citrus County
Family Income Brackets in Pine Ridge CDP Citrus County
According to the Pine Ridge CDP Citrus County family income data, there are 824 families falling into the $50,000 to $74,999 income range, which is the most common income bracket and makes up 24.0% of all families. Conversely, the $15,000 to $24,999 income bracket is the least frequent group with only 41 families (1.2%) belonging to this category.
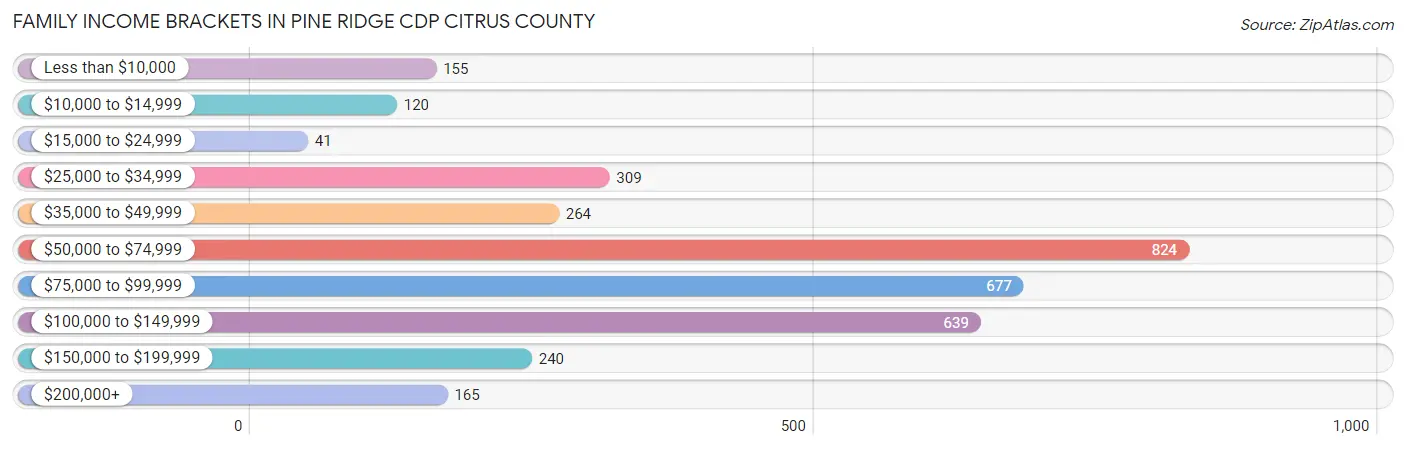
| Income Bracket | # Families | % Families |
| Less than $10,000 | 155 | 4.5% |
| $10,000 to $14,999 | 120 | 3.5% |
| $15,000 to $24,999 | 41 | 1.2% |
| $25,000 to $34,999 | 309 | 9.0% |
| $35,000 to $49,999 | 264 | 7.7% |
| $50,000 to $74,999 | 824 | 24.0% |
| $75,000 to $99,999 | 677 | 19.7% |
| $100,000 to $149,999 | 639 | 18.6% |
| $150,000 to $199,999 | 240 | 7.0% |
| $200,000+ | 165 | 4.8% |
Family Income by Famaliy Size in Pine Ridge CDP Citrus County
4-person families (174 | 5.1%) account for the highest median family income in Pine Ridge CDP Citrus County with $118,667 per family, while 2-person families (2,401 | 69.9%) have the highest median income of $36,652 per family member.
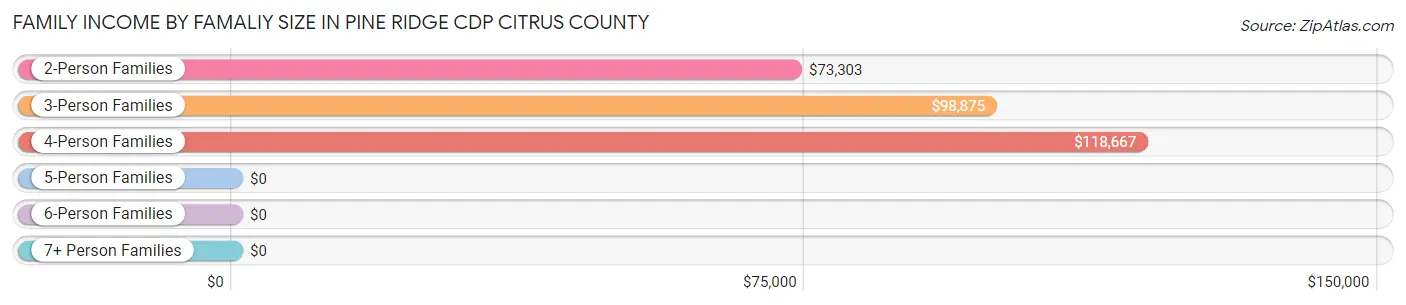
| Income Bracket | # Families | Median Income |
| 2-Person Families | 2,401 (69.9%) | $73,303 |
| 3-Person Families | 763 (22.2%) | $98,875 |
| 4-Person Families | 174 (5.1%) | $118,667 |
| 5-Person Families | 55 (1.6%) | $0 |
| 6-Person Families | 42 (1.2%) | $0 |
| 7+ Person Families | 0 (0.0%) | $0 |
| Total | 3,435 (100.0%) | $75,233 |
Family Income by Number of Earners in Pine Ridge CDP Citrus County
The median family income in Pine Ridge CDP Citrus County is $75,233, with families comprising 3+ earners (242) having the highest median family income of $115,892, while families with no earners (1,811) have the lowest median family income of $59,837, accounting for 7.0% and 52.7% of families, respectively.
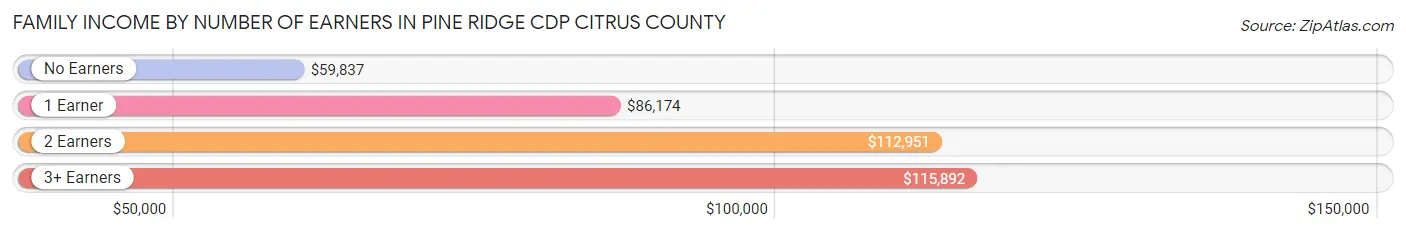
| Number of Earners | # Families | Median Income |
| No Earners | 1,811 (52.7%) | $59,837 |
| 1 Earner | 919 (26.8%) | $86,174 |
| 2 Earners | 463 (13.5%) | $112,951 |
| 3+ Earners | 242 (7.0%) | $115,892 |
| Total | 3,435 (100.0%) | $75,233 |
Household Income in Pine Ridge CDP Citrus County
Household Income Brackets in Pine Ridge CDP Citrus County
With 1,001 households falling in the category, the $50,000 to $74,999 income range is the most frequent in Pine Ridge CDP Citrus County, accounting for 20.9% of all households. In contrast, only 192 households (4.0%) fall into the $10,000 to $14,999 income bracket, making it the least populous group.
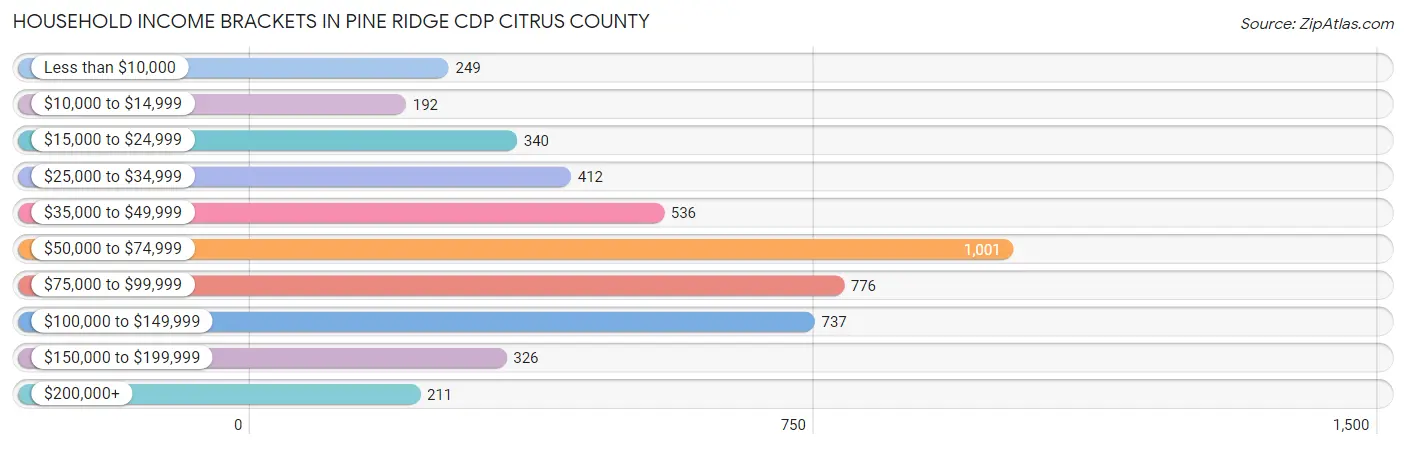
| Income Bracket | # Households | % Households |
| Less than $10,000 | 249 | 5.2% |
| $10,000 to $14,999 | 192 | 4.0% |
| $15,000 to $24,999 | 340 | 7.1% |
| $25,000 to $34,999 | 412 | 8.6% |
| $35,000 to $49,999 | 536 | 11.2% |
| $50,000 to $74,999 | 1,001 | 20.9% |
| $75,000 to $99,999 | 776 | 16.2% |
| $100,000 to $149,999 | 737 | 15.4% |
| $150,000 to $199,999 | 326 | 6.8% |
| $200,000+ | 211 | 4.4% |
Household Income by Householder Age in Pine Ridge CDP Citrus County
The median household income in Pine Ridge CDP Citrus County is $65,522, with the highest median household income of $88,241 found in the 45 to 64 years age bracket for the primary householder. A total of 1,480 households (30.9%) fall into this category. Meanwhile, the 15 to 24 years age bracket for the primary householder has the lowest median household income of $0, with 21 households (0.4%) in this group.
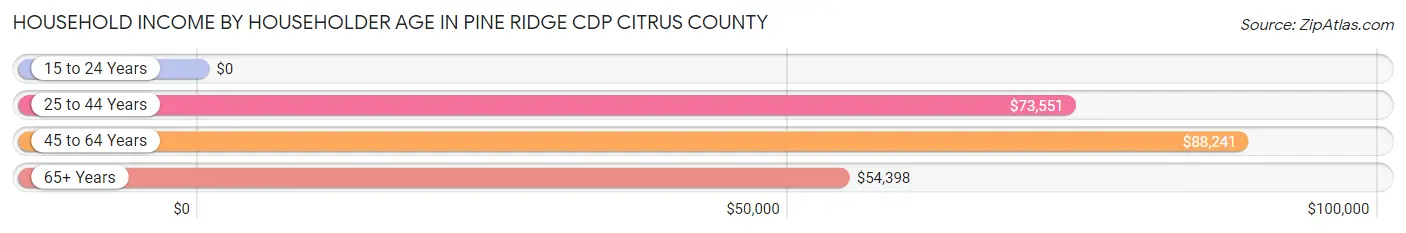
| Income Bracket | # Households | Median Income |
| 15 to 24 Years | 21 (0.4%) | $0 |
| 25 to 44 Years | 374 (7.8%) | $73,551 |
| 45 to 64 Years | 1,480 (30.9%) | $88,241 |
| 65+ Years | 2,913 (60.8%) | $54,398 |
| Total | 4,788 (100.0%) | $65,522 |
Poverty in Pine Ridge CDP Citrus County
Income Below Poverty by Sex and Age in Pine Ridge CDP Citrus County
With 8.1% poverty level for males and 12.4% for females among the residents of Pine Ridge CDP Citrus County, under 5 year old males and 6 to 11 year old females are the most vulnerable to poverty, with 80 males (100.0%) and 103 females (51.0%) in their respective age groups living below the poverty level.
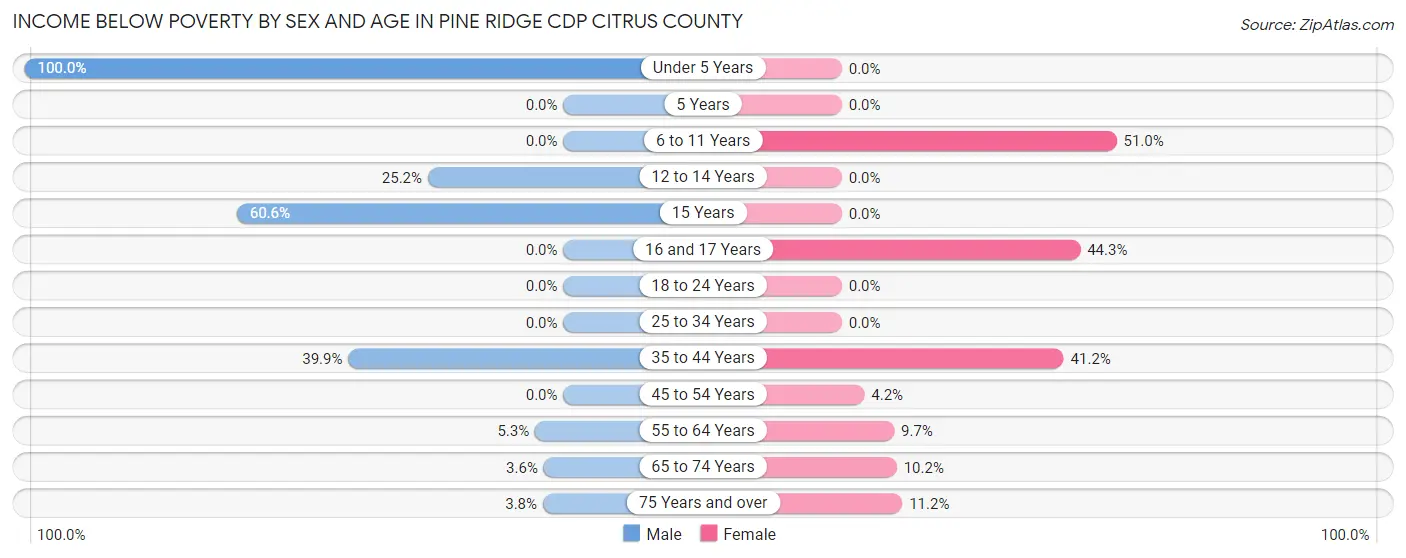
| Age Bracket | Male | Female |
| Under 5 Years | 80 (100.0%) | 0 (0.0%) |
| 5 Years | 0 (0.0%) | 0 (0.0%) |
| 6 to 11 Years | 0 (0.0%) | 103 (51.0%) |
| 12 to 14 Years | 42 (25.2%) | 0 (0.0%) |
| 15 Years | 40 (60.6%) | 0 (0.0%) |
| 16 and 17 Years | 0 (0.0%) | 54 (44.3%) |
| 18 to 24 Years | 0 (0.0%) | 0 (0.0%) |
| 25 to 34 Years | 0 (0.0%) | 0 (0.0%) |
| 35 to 44 Years | 99 (39.9%) | 84 (41.2%) |
| 45 to 54 Years | 0 (0.0%) | 19 (4.2%) |
| 55 to 64 Years | 43 (5.3%) | 112 (9.7%) |
| 65 to 74 Years | 42 (3.6%) | 121 (10.2%) |
| 75 Years and over | 51 (3.8%) | 158 (11.2%) |
| Total | 397 (8.1%) | 651 (12.4%) |
Income Above Poverty by Sex and Age in Pine Ridge CDP Citrus County
According to the poverty statistics in Pine Ridge CDP Citrus County, males aged 6 to 11 years and females aged under 5 years are the age groups that are most secure financially, with 100.0% of males and 100.0% of females in these age groups living above the poverty line.
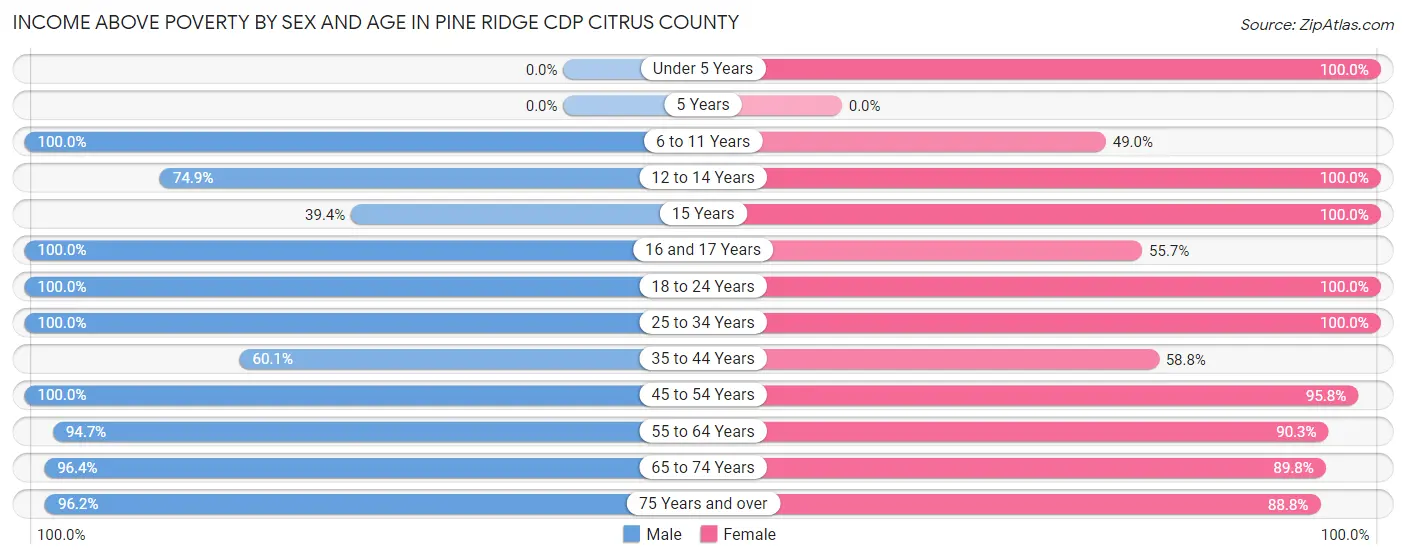
| Age Bracket | Male | Female |
| Under 5 Years | 0 (0.0%) | 182 (100.0%) |
| 5 Years | 0 (0.0%) | 0 (0.0%) |
| 6 to 11 Years | 179 (100.0%) | 99 (49.0%) |
| 12 to 14 Years | 125 (74.9%) | 21 (100.0%) |
| 15 Years | 26 (39.4%) | 25 (100.0%) |
| 16 and 17 Years | 80 (100.0%) | 68 (55.7%) |
| 18 to 24 Years | 155 (100.0%) | 61 (100.0%) |
| 25 to 34 Years | 327 (100.0%) | 214 (100.0%) |
| 35 to 44 Years | 149 (60.1%) | 120 (58.8%) |
| 45 to 54 Years | 298 (100.0%) | 436 (95.8%) |
| 55 to 64 Years | 774 (94.7%) | 1,042 (90.3%) |
| 65 to 74 Years | 1,112 (96.4%) | 1,065 (89.8%) |
| 75 Years and over | 1,291 (96.2%) | 1,250 (88.8%) |
| Total | 4,516 (91.9%) | 4,583 (87.6%) |
Income Below Poverty Among Married-Couple Families in Pine Ridge CDP Citrus County
The poverty statistics for married-couple families in Pine Ridge CDP Citrus County show that 7.0% or 233 of the total 3,327 families live below the poverty line. Families with 3 or 4 children have the highest poverty rate of 56.0%, comprising of 42 families. On the other hand, families with no children have the lowest poverty rate of 4.0%, which includes 112 families.
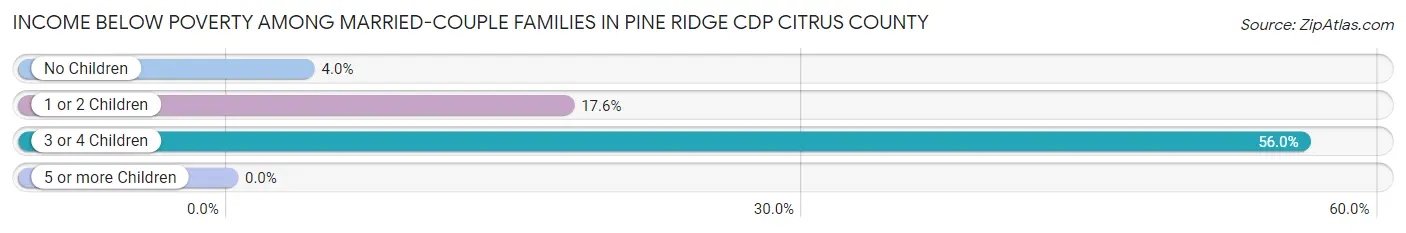
| Children | Above Poverty | Below Poverty |
| No Children | 2,690 (96.0%) | 112 (4.0%) |
| 1 or 2 Children | 371 (82.4%) | 79 (17.6%) |
| 3 or 4 Children | 33 (44.0%) | 42 (56.0%) |
| 5 or more Children | 0 (0.0%) | 0 (0.0%) |
| Total | 3,094 (93.0%) | 233 (7.0%) |
Income Below Poverty Among Single-Parent Households in Pine Ridge CDP Citrus County
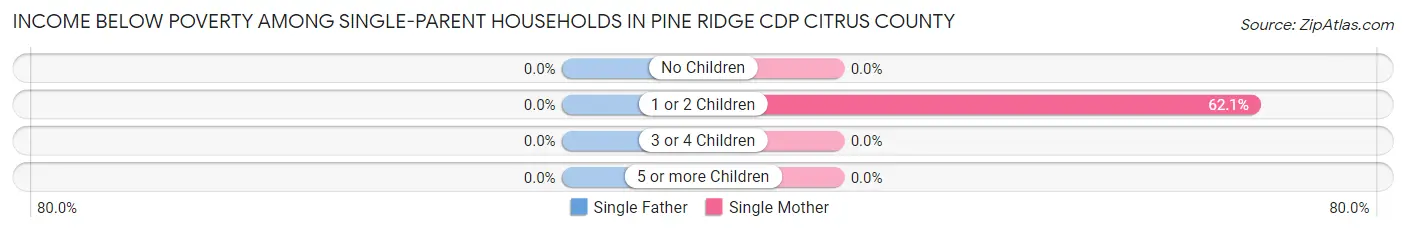
| Children | Single Father | Single Mother |
| No Children | 0 (0.0%) | 0 (0.0%) |
| 1 or 2 Children | 0 (0.0%) | 41 (62.1%) |
| 3 or 4 Children | 0 (0.0%) | 0 (0.0%) |
| 5 or more Children | 0 (0.0%) | 0 (0.0%) |
| Total | 0 (0.0%) | 41 (38.0%) |
Income Below Poverty Among Married-Couple vs Single-Parent Households in Pine Ridge CDP Citrus County
The poverty data for Pine Ridge CDP Citrus County shows that 233 of the married-couple family households (7.0%) and 41 of the single-parent households (38.0%) are living below the poverty level. Within the married-couple family households, those with 3 or 4 children have the highest poverty rate, with 42 households (56.0%) falling below the poverty line. Among the single-parent households, those with 1 or 2 children have the highest poverty rate, with 41 household (62.1%) living below poverty.
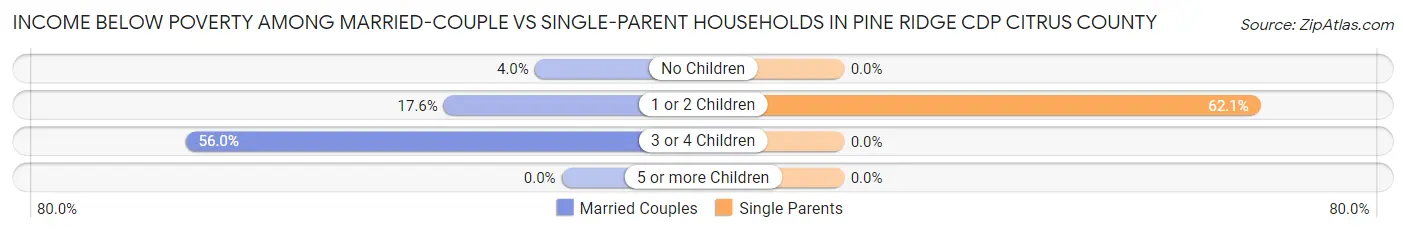
| Children | Married-Couple Families | Single-Parent Households |
| No Children | 112 (4.0%) | 0 (0.0%) |
| 1 or 2 Children | 79 (17.6%) | 41 (62.1%) |
| 3 or 4 Children | 42 (56.0%) | 0 (0.0%) |
| 5 or more Children | 0 (0.0%) | 0 (0.0%) |
| Total | 233 (7.0%) | 41 (38.0%) |
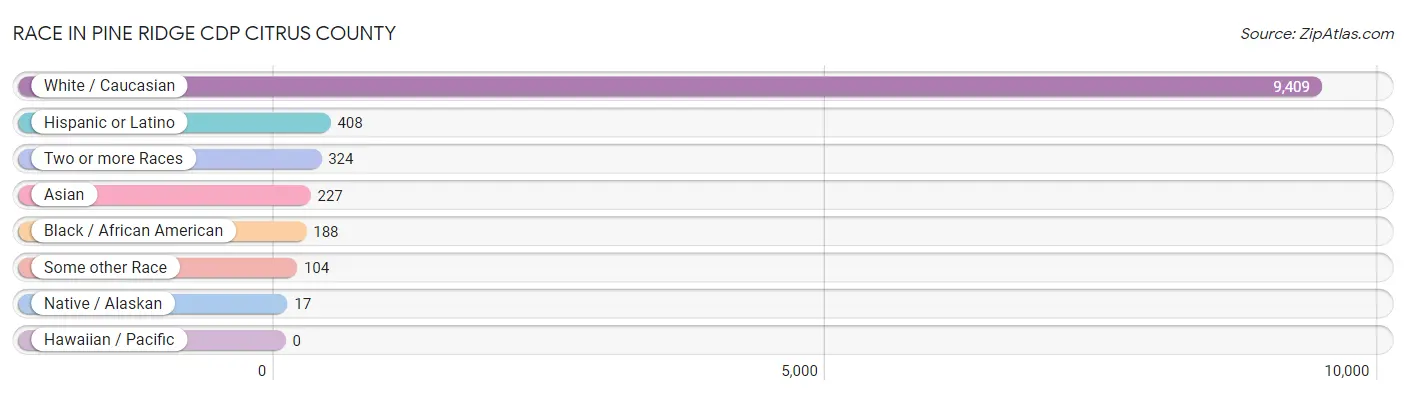
Race in Pine Ridge CDP Citrus County
The most populous races in Pine Ridge CDP Citrus County are White / Caucasian (9,409 | 91.6%), Hispanic or Latino (408 | 4.0%), and Two or more Races (324 | 3.2%).
| Race | # Population | % Population |
| Asian | 227 | 2.2% |
| Black / African American | 188 | 1.8% |
| Hawaiian / Pacific | 0 | 0.0% |
| Hispanic or Latino | 408 | 4.0% |
| Native / Alaskan | 17 | 0.2% |
| White / Caucasian | 9,409 | 91.6% |
| Two or more Races | 324 | 3.2% |
| Some other Race | 104 | 1.0% |
| Total | 10,269 | 100.0% |
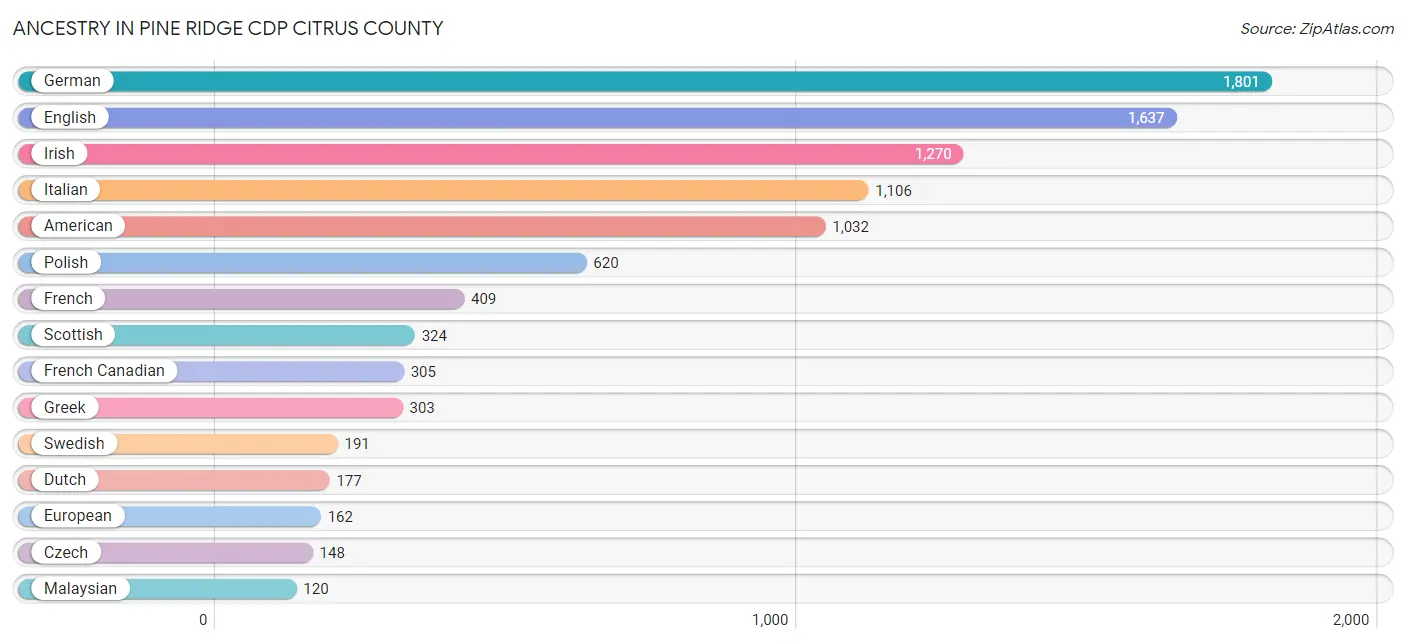
Ancestry in Pine Ridge CDP Citrus County
The most populous ancestries reported in Pine Ridge CDP Citrus County are German (1,801 | 17.5%), English (1,637 | 15.9%), Irish (1,270 | 12.4%), Italian (1,106 | 10.8%), and American (1,032 | 10.1%), together accounting for 66.7% of all Pine Ridge CDP Citrus County residents.
| Ancestry | # Population | % Population |
| African | 106 | 1.0% |
| American | 1,032 | 10.1% |
| Arab | 36 | 0.4% |
| Argentinean | 76 | 0.7% |
| Austrian | 40 | 0.4% |
| Bangladeshi | 116 | 1.1% |
| Basque | 37 | 0.4% |
| British | 116 | 1.1% |
| British West Indian | 13 | 0.1% |
| Bulgarian | 26 | 0.3% |
| Canadian | 79 | 0.8% |
| Central American | 66 | 0.6% |
| Central American Indian | 27 | 0.3% |
| Cherokee | 10 | 0.1% |
| Cuban | 55 | 0.5% |
| Czech | 148 | 1.4% |
| Czechoslovakian | 24 | 0.2% |
| Danish | 27 | 0.3% |
| Dominican | 16 | 0.2% |
| Dutch | 177 | 1.7% |
| English | 1,637 | 15.9% |
| European | 162 | 1.6% |
| Finnish | 11 | 0.1% |
| French | 409 | 4.0% |
| French Canadian | 305 | 3.0% |
| German | 1,801 | 17.5% |
| Greek | 303 | 2.9% |
| Guatemalan | 24 | 0.2% |
| Hungarian | 39 | 0.4% |
| Irish | 1,270 | 12.4% |
| Italian | 1,106 | 10.8% |
| Korean | 81 | 0.8% |
| Lebanese | 22 | 0.2% |
| Lithuanian | 24 | 0.2% |
| Malaysian | 120 | 1.2% |
| Mexican | 103 | 1.0% |
| Nicaraguan | 25 | 0.2% |
| Northern European | 37 | 0.4% |
| Norwegian | 48 | 0.5% |
| Panamanian | 17 | 0.2% |
| Pennsylvania German | 8 | 0.1% |
| Polish | 620 | 6.0% |
| Puerto Rican | 75 | 0.7% |
| Russian | 64 | 0.6% |
| Scandinavian | 16 | 0.2% |
| Scotch-Irish | 62 | 0.6% |
| Scottish | 324 | 3.2% |
| Slavic | 16 | 0.2% |
| Slovak | 79 | 0.8% |
| South American | 76 | 0.7% |
| Spaniard | 17 | 0.2% |
| Subsaharan African | 106 | 1.0% |
| Swedish | 191 | 1.9% |
| Turkish | 29 | 0.3% |
| Ukrainian | 61 | 0.6% |
| Welsh | 11 | 0.1% |
| West Indian | 40 | 0.4% | View All 57 Rows |
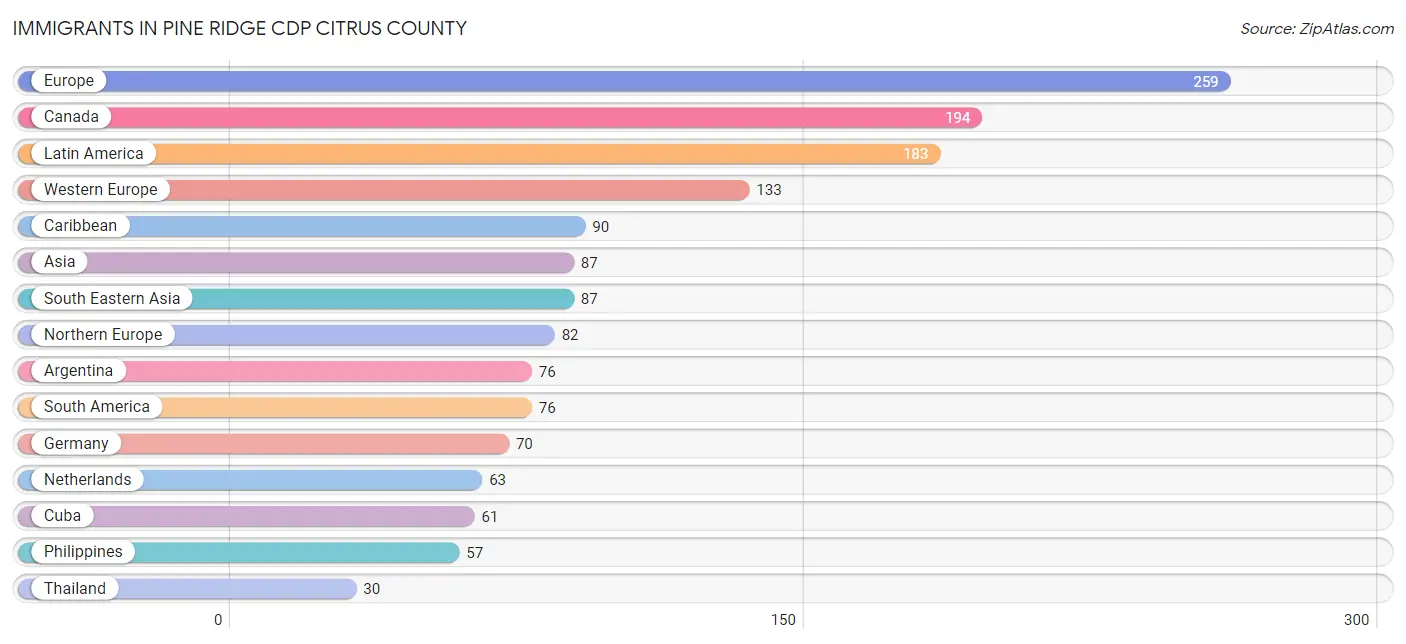
Immigrants in Pine Ridge CDP Citrus County
The most numerous immigrant groups reported in Pine Ridge CDP Citrus County came from Europe (259 | 2.5%), Canada (194 | 1.9%), Latin America (183 | 1.8%), Western Europe (133 | 1.3%), and Caribbean (90 | 0.9%), together accounting for 8.4% of all Pine Ridge CDP Citrus County residents.
| Immigration Origin | # Population | % Population |
| Argentina | 76 | 0.7% |
| Asia | 87 | 0.9% |
| Canada | 194 | 1.9% |
| Caribbean | 90 | 0.9% |
| Central America | 17 | 0.2% |
| Cuba | 61 | 0.6% |
| Dominican Republic | 16 | 0.2% |
| Eastern Europe | 16 | 0.2% |
| Europe | 259 | 2.5% |
| Germany | 70 | 0.7% |
| Italy | 28 | 0.3% |
| Latin America | 183 | 1.8% |
| Netherlands | 63 | 0.6% |
| Northern Europe | 82 | 0.8% |
| Panama | 17 | 0.2% |
| Philippines | 57 | 0.6% |
| Poland | 16 | 0.2% |
| South America | 76 | 0.7% |
| South Eastern Asia | 87 | 0.9% |
| Southern Europe | 28 | 0.3% |
| Thailand | 30 | 0.3% |
| Western Europe | 133 | 1.3% | View All 22 Rows |
Sex and Age in Pine Ridge CDP Citrus County
Sex and Age in Pine Ridge CDP Citrus County
The most populous age groups in Pine Ridge CDP Citrus County are 65 to 69 Years (588 | 11.7%) for men and 55 to 59 Years (643 | 12.2%) for women.
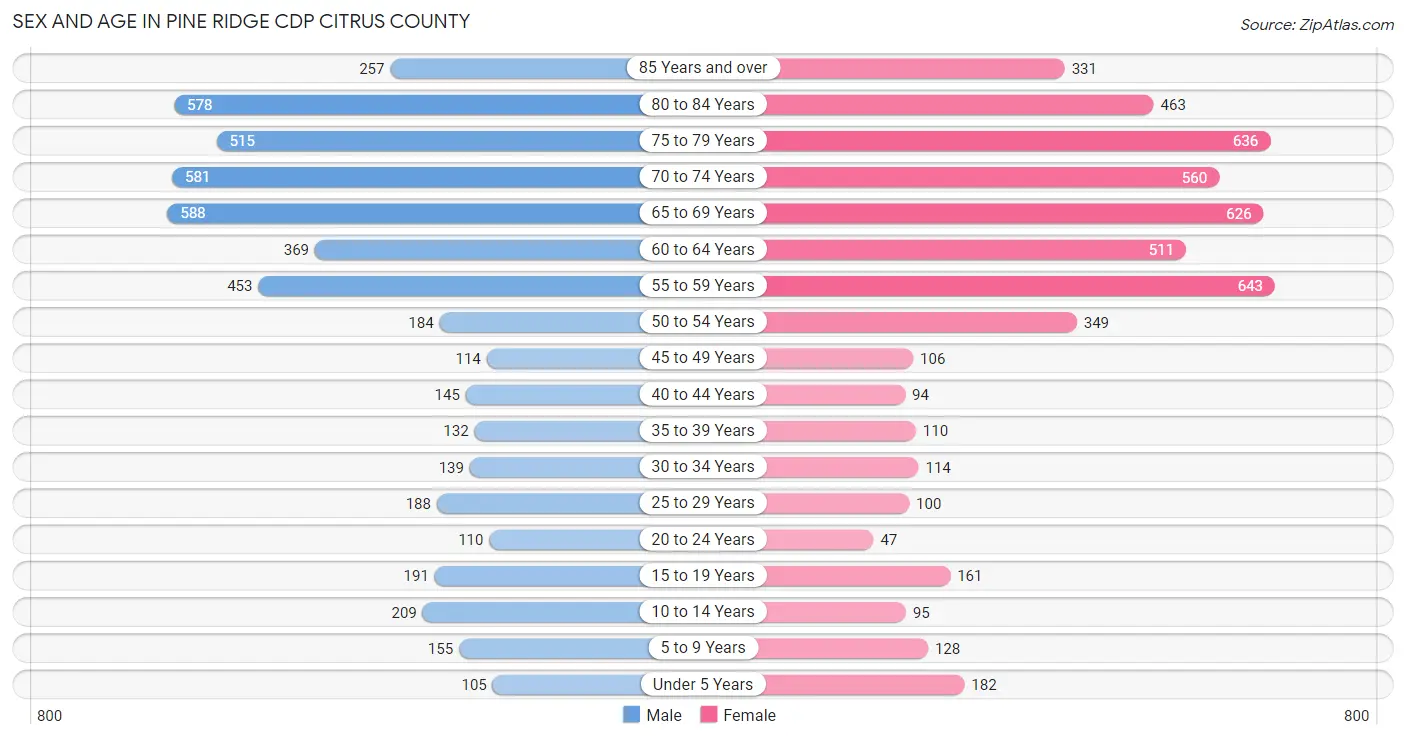
| Age Bracket | Male | Female |
| Under 5 Years | 105 (2.1%) | 182 (3.5%) |
| 5 to 9 Years | 155 (3.1%) | 128 (2.4%) |
| 10 to 14 Years | 209 (4.2%) | 95 (1.8%) |
| 15 to 19 Years | 191 (3.8%) | 161 (3.1%) |
| 20 to 24 Years | 110 (2.2%) | 47 (0.9%) |
| 25 to 29 Years | 188 (3.7%) | 100 (1.9%) |
| 30 to 34 Years | 139 (2.8%) | 114 (2.2%) |
| 35 to 39 Years | 132 (2.6%) | 110 (2.1%) |
| 40 to 44 Years | 145 (2.9%) | 94 (1.8%) |
| 45 to 49 Years | 114 (2.3%) | 106 (2.0%) |
| 50 to 54 Years | 184 (3.7%) | 349 (6.6%) |
| 55 to 59 Years | 453 (9.0%) | 643 (12.2%) |
| 60 to 64 Years | 369 (7.4%) | 511 (9.7%) |
| 65 to 69 Years | 588 (11.7%) | 626 (11.9%) |
| 70 to 74 Years | 581 (11.6%) | 560 (10.6%) |
| 75 to 79 Years | 515 (10.3%) | 636 (12.1%) |
| 80 to 84 Years | 578 (11.5%) | 463 (8.8%) |
| 85 Years and over | 257 (5.1%) | 331 (6.3%) |
| Total | 5,013 (100.0%) | 5,256 (100.0%) |
Families and Households in Pine Ridge CDP Citrus County
Median Family Size in Pine Ridge CDP Citrus County

| Family Type | # Families | Family Size |
| Married-Couple | 3,327 (96.9%) | 2.46 |
| Single Male/Father | 0 (0.0%) | - |
| Single Female/Mother | 108 (3.1%) | 2.75 |
| Total Families | 3,435 (100.0%) | 2.47 |
Median Household Size in Pine Ridge CDP Citrus County
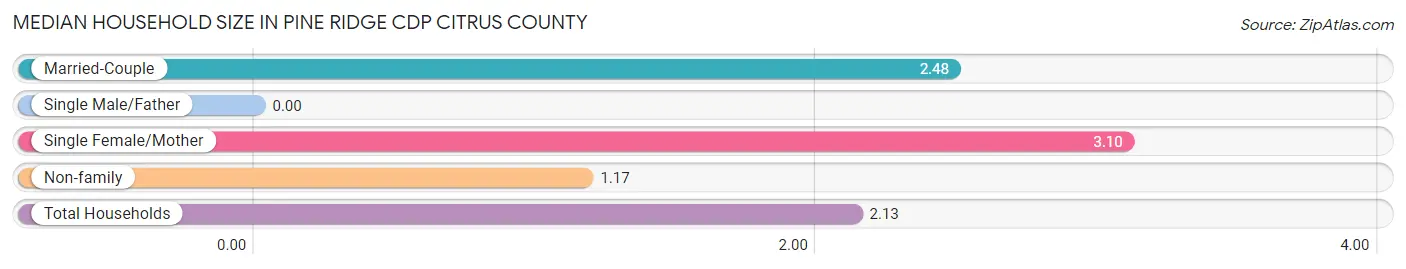
| Household Type | # Households | Household Size |
| Married-Couple | 3,327 (69.5%) | 2.48 |
| Single Male/Father | 0 (0.0%) | - |
| Single Female/Mother | 108 (2.3%) | 3.10 |
| Non-family | 1,353 (28.3%) | 1.17 |
| Total Households | 4,788 (100.0%) | 2.13 |
Household Size by Marriage Status in Pine Ridge CDP Citrus County
Out of a total of 4,788 households in Pine Ridge CDP Citrus County, 3,435 (71.7%) are family households, while 1,353 (28.3%) are nonfamily households. The most numerous type of family households are 2-person households, comprising 2,338, and the most common type of nonfamily households are 1-person households, comprising 1,165.
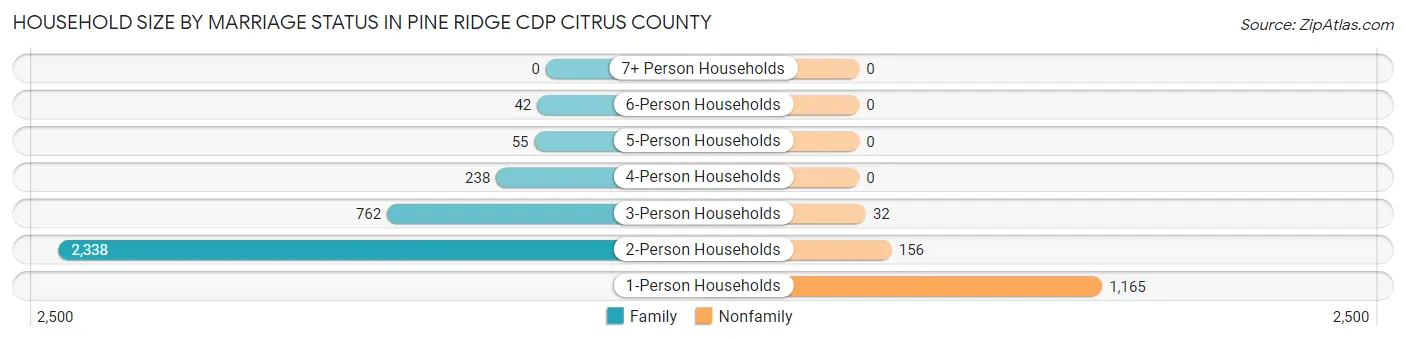
| Household Size | Family Households | Nonfamily Households |
| 1-Person Households | - | 1,165 (24.3%) |
| 2-Person Households | 2,338 (48.8%) | 156 (3.3%) |
| 3-Person Households | 762 (15.9%) | 32 (0.7%) |
| 4-Person Households | 238 (5.0%) | 0 (0.0%) |
| 5-Person Households | 55 (1.1%) | 0 (0.0%) |
| 6-Person Households | 42 (0.9%) | 0 (0.0%) |
| 7+ Person Households | 0 (0.0%) | 0 (0.0%) |
| Total | 3,435 (71.7%) | 1,353 (28.3%) |
Female Fertility in Pine Ridge CDP Citrus County
Fertility by Age in Pine Ridge CDP Citrus County
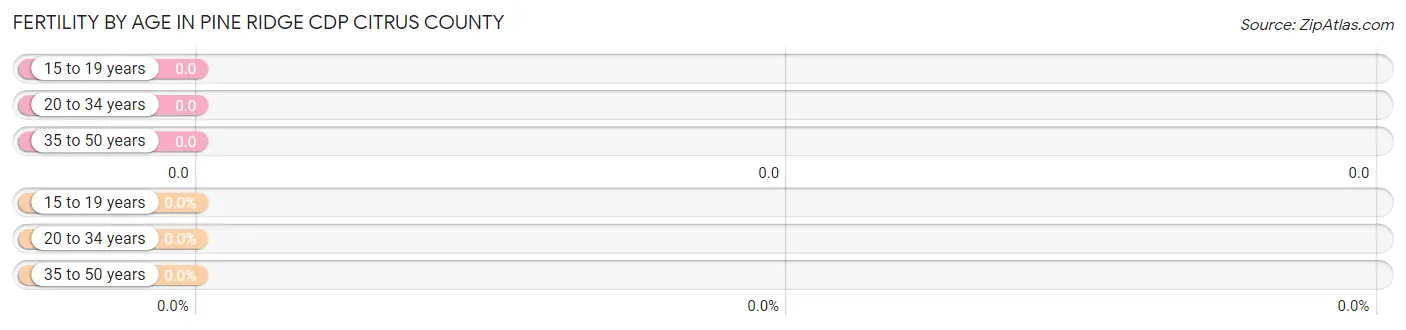
| Age Bracket | Women with Births | Births / 1,000 Women |
| 15 to 19 years | 0 (0.0%) | 0.0 |
| 20 to 34 years | 0 (0.0%) | 0.0 |
| 35 to 50 years | 0 (0.0%) | 0.0 |
| Total | 0 (0.0%) | 0.0 |
Fertility by Age by Marriage Status in Pine Ridge CDP Citrus County
| Age Bracket | Married | Unmarried |
| 15 to 19 years | 0 (0.0%) | 0 (0.0%) |
| 20 to 34 years | 0 (0.0%) | 0 (0.0%) |
| 35 to 50 years | 0 (0.0%) | 0 (0.0%) |
| Total | 0 (0.0%) | 0 (0.0%) |
Fertility by Education in Pine Ridge CDP Citrus County
| Educational Attainment | Women with Births | Births / 1,000 Women |
| Less than High School | 0 (0.0%) | 0.0 |
| High School Diploma | 0 (0.0%) | 0.0 |
| College or Associate's Degree | 0 (0.0%) | 0.0 |
| Bachelor's Degree | 0 (0.0%) | 0.0 |
| Graduate Degree | 0 (0.0%) | 0.0 |
| Total | 0 (0.0%) | 0.0 |
Fertility by Education by Marriage Status in Pine Ridge CDP Citrus County
| Educational Attainment | Married | Unmarried |
| Less than High School | 0 (0.0%) | 0 (0.0%) |
| High School Diploma | 0 (0.0%) | 0 (0.0%) |
| College or Associate's Degree | 0 (0.0%) | 0 (0.0%) |
| Bachelor's Degree | 0 (0.0%) | 0 (0.0%) |
| Graduate Degree | 0 (0.0%) | 0 (0.0%) |
| Total | 0 (0.0%) | 0 (0.0%) |
Employment Characteristics in Pine Ridge CDP Citrus County
Employment by Class of Employer in Pine Ridge CDP Citrus County
Among the 2,677 employed individuals in Pine Ridge CDP Citrus County, private company employees (1,609 | 60.1%), local government employees (440 | 16.4%), and self-employed (not incorporated) (253 | 9.5%) make up the most common classes of employment.
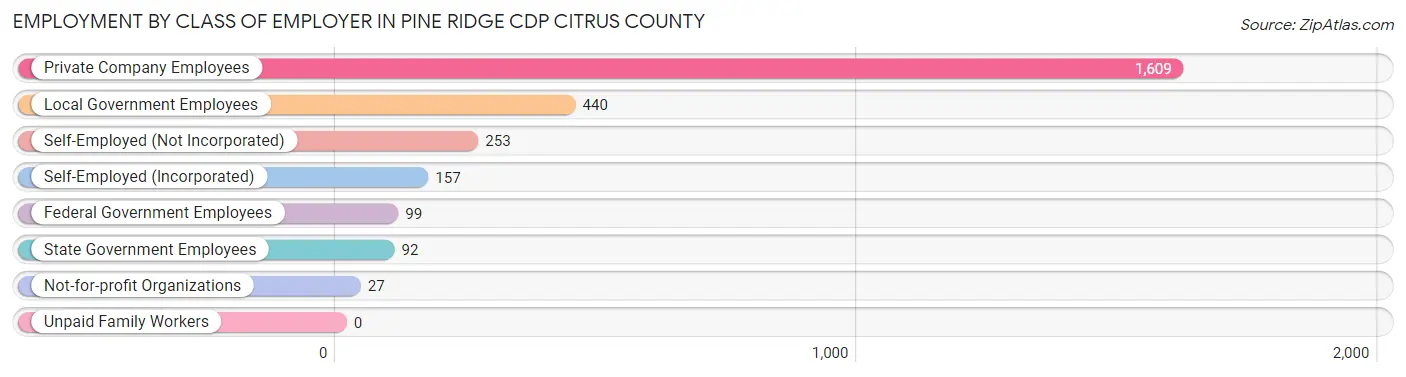
| Employer Class | # Employees | % Employees |
| Private Company Employees | 1,609 | 60.1% |
| Self-Employed (Incorporated) | 157 | 5.9% |
| Self-Employed (Not Incorporated) | 253 | 9.5% |
| Not-for-profit Organizations | 27 | 1.0% |
| Local Government Employees | 440 | 16.4% |
| State Government Employees | 92 | 3.4% |
| Federal Government Employees | 99 | 3.7% |
| Unpaid Family Workers | 0 | 0.0% |
| Total | 2,677 | 100.0% |
Employment Status by Age in Pine Ridge CDP Citrus County
According to the labor force statistics for Pine Ridge CDP Citrus County, out of the total population over 16 years of age (9,304), 30.5% or 2,838 individuals are in the labor force, with 5.1% or 145 of them unemployed. The age group with the highest labor force participation rate is 20 to 24 years, with 100.0% or 157 individuals in the labor force. Within the labor force, the 35 to 44 years age range has the highest percentage of unemployed individuals, with 29.2% or 100 of them being unemployed.
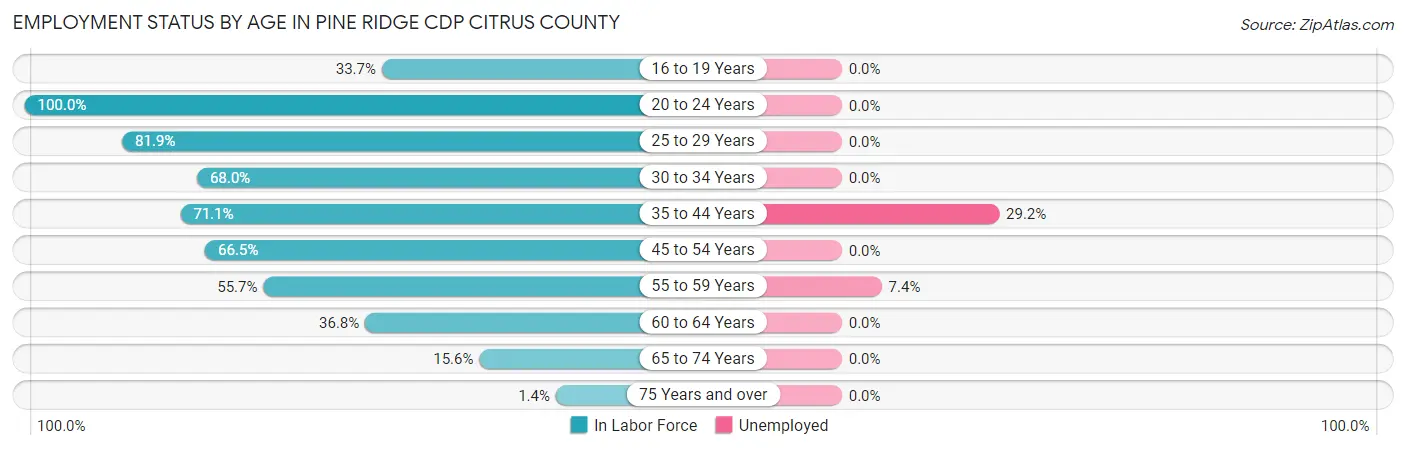
| Age Bracket | In Labor Force | Unemployed |
| 16 to 19 Years | 88 (33.7%) | 0 (0.0%) |
| 20 to 24 Years | 157 (100.0%) | 0 (0.0%) |
| 25 to 29 Years | 236 (81.9%) | 0 (0.0%) |
| 30 to 34 Years | 172 (68.0%) | 0 (0.0%) |
| 35 to 44 Years | 342 (71.1%) | 100 (29.2%) |
| 45 to 54 Years | 501 (66.5%) | 0 (0.0%) |
| 55 to 59 Years | 610 (55.7%) | 45 (7.4%) |
| 60 to 64 Years | 324 (36.8%) | 0 (0.0%) |
| 65 to 74 Years | 367 (15.6%) | 0 (0.0%) |
| 75 Years and over | 39 (1.4%) | 0 (0.0%) |
| Total | 2,838 (30.5%) | 145 (5.1%) |
Employment Status by Educational Attainment in Pine Ridge CDP Citrus County
According to labor force statistics for Pine Ridge CDP Citrus County, 58.3% of individuals (2,187) out of the total population between 25 and 64 years of age (3,751) are in the labor force, with 6.6% or 144 of them being unemployed. The group with the highest labor force participation rate are those with the educational attainment of less than high school, with 85.1% or 206 individuals in the labor force. Within the labor force, individuals with less than high school education have the highest percentage of unemployment, with 10.7% or 22 of them being unemployed.
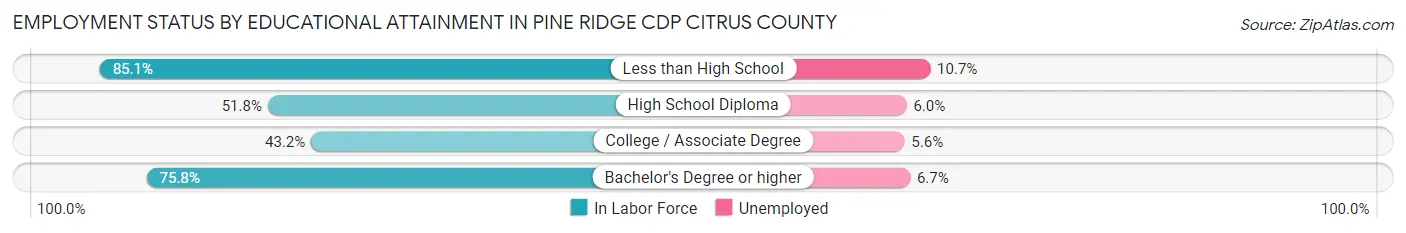
| Educational Attainment | In Labor Force | Unemployed |
| Less than High School | 206 (85.1%) | 26 (10.7%) |
| High School Diploma | 665 (51.8%) | 77 (6.0%) |
| College / Associate Degree | 496 (43.2%) | 64 (5.6%) |
| Bachelor's Degree or higher | 818 (75.8%) | 72 (6.7%) |
| Total | 2,187 (58.3%) | 248 (6.6%) |
Employment Occupations by Sex in Pine Ridge CDP Citrus County
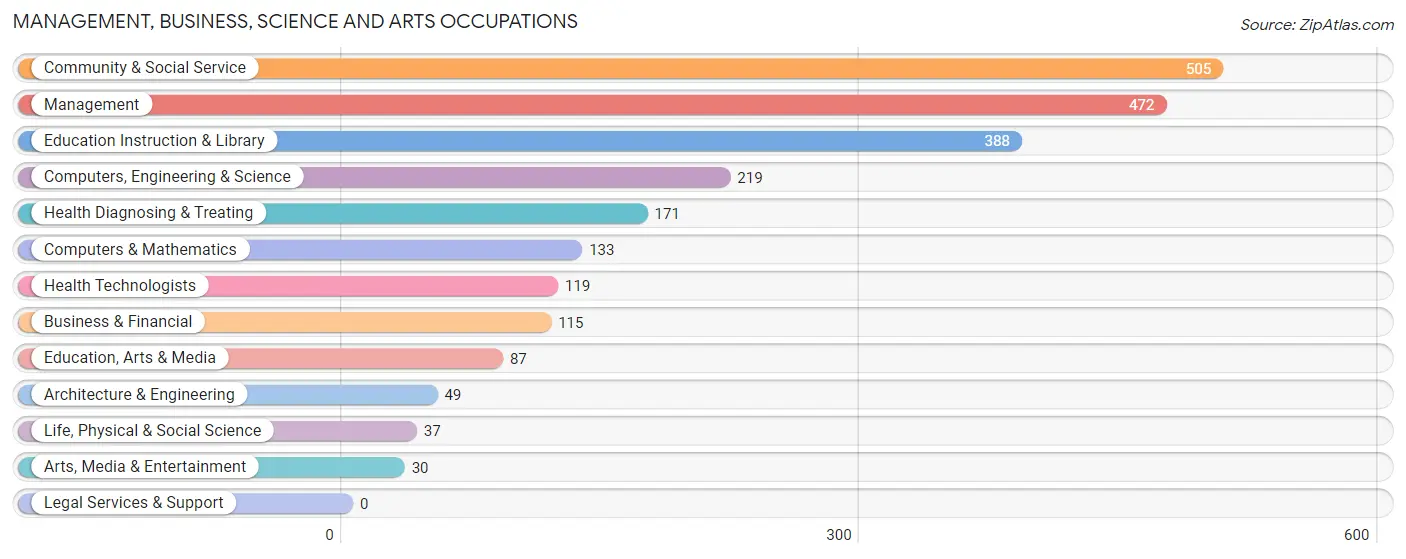
Management, Business, Science and Arts Occupations
The most common Management, Business, Science and Arts occupations in Pine Ridge CDP Citrus County are Community & Social Service (505 | 18.8%), Management (472 | 17.5%), Education Instruction & Library (388 | 14.4%), Computers, Engineering & Science (219 | 8.1%), and Health Diagnosing & Treating (171 | 6.4%).
Management, Business, Science and Arts Occupations by Sex
Within the Management, Business, Science and Arts occupations in Pine Ridge CDP Citrus County, the most male-oriented occupations are Computers & Mathematics (100.0%), Architecture & Engineering (100.0%), and Computers, Engineering & Science (93.1%), while the most female-oriented occupations are Arts, Media & Entertainment (100.0%), Education Instruction & Library (76.5%), and Community & Social Service (66.7%).
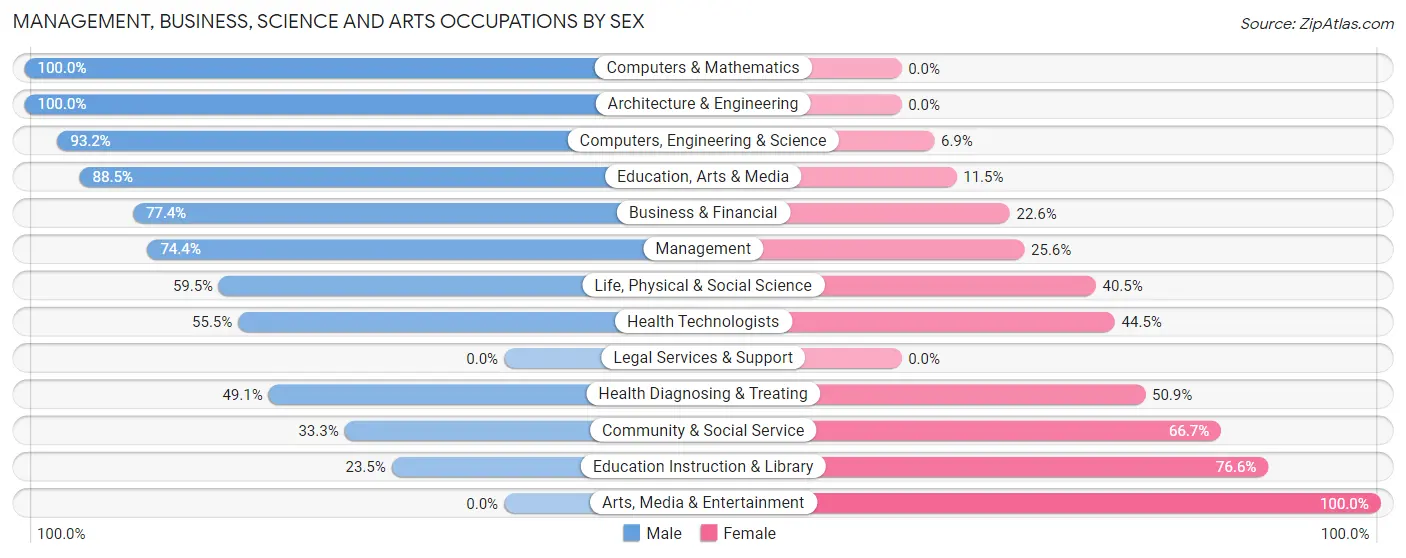
| Occupation | Male | Female |
| Management | 351 (74.4%) | 121 (25.6%) |
| Business & Financial | 89 (77.4%) | 26 (22.6%) |
| Computers, Engineering & Science | 204 (93.1%) | 15 (6.9%) |
| Computers & Mathematics | 133 (100.0%) | 0 (0.0%) |
| Architecture & Engineering | 49 (100.0%) | 0 (0.0%) |
| Life, Physical & Social Science | 22 (59.5%) | 15 (40.5%) |
| Community & Social Service | 168 (33.3%) | 337 (66.7%) |
| Education, Arts & Media | 77 (88.5%) | 10 (11.5%) |
| Legal Services & Support | 0 (0.0%) | 0 (0.0%) |
| Education Instruction & Library | 91 (23.4%) | 297 (76.5%) |
| Arts, Media & Entertainment | 0 (0.0%) | 30 (100.0%) |
| Health Diagnosing & Treating | 84 (49.1%) | 87 (50.9%) |
| Health Technologists | 66 (55.5%) | 53 (44.5%) |
| Total (Category) | 896 (60.5%) | 586 (39.5%) |
| Total (Overall) | 1,488 (55.2%) | 1,205 (44.8%) |
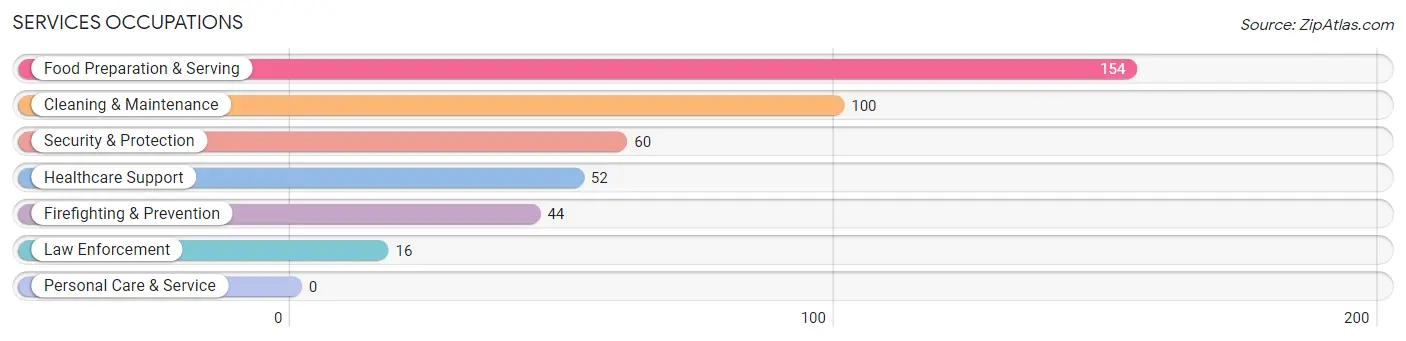
Services Occupations
The most common Services occupations in Pine Ridge CDP Citrus County are Food Preparation & Serving (154 | 5.7%), Cleaning & Maintenance (100 | 3.7%), Security & Protection (60 | 2.2%), Healthcare Support (52 | 1.9%), and Firefighting & Prevention (44 | 1.6%).
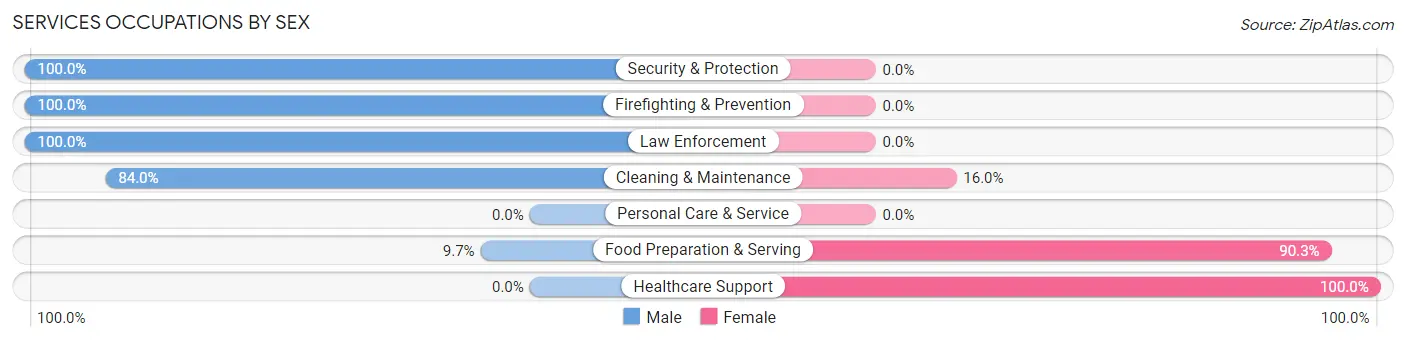
Services Occupations by Sex
Within the Services occupations in Pine Ridge CDP Citrus County, the most male-oriented occupations are Security & Protection (100.0%), Firefighting & Prevention (100.0%), and Law Enforcement (100.0%), while the most female-oriented occupations are Healthcare Support (100.0%), Food Preparation & Serving (90.3%), and Cleaning & Maintenance (16.0%).
| Occupation | Male | Female |
| Healthcare Support | 0 (0.0%) | 52 (100.0%) |
| Security & Protection | 60 (100.0%) | 0 (0.0%) |
| Firefighting & Prevention | 44 (100.0%) | 0 (0.0%) |
| Law Enforcement | 16 (100.0%) | 0 (0.0%) |
| Food Preparation & Serving | 15 (9.7%) | 139 (90.3%) |
| Cleaning & Maintenance | 84 (84.0%) | 16 (16.0%) |
| Personal Care & Service | 0 (0.0%) | 0 (0.0%) |
| Total (Category) | 159 (43.4%) | 207 (56.6%) |
| Total (Overall) | 1,488 (55.2%) | 1,205 (44.8%) |
Sales and Office Occupations
The most common Sales and Office occupations in Pine Ridge CDP Citrus County are Sales & Related (274 | 10.2%), and Office & Administration (249 | 9.2%).

Sales and Office Occupations by Sex

| Occupation | Male | Female |
| Sales & Related | 148 (54.0%) | 126 (46.0%) |
| Office & Administration | 11 (4.4%) | 238 (95.6%) |
| Total (Category) | 159 (30.4%) | 364 (69.6%) |
| Total (Overall) | 1,488 (55.2%) | 1,205 (44.8%) |
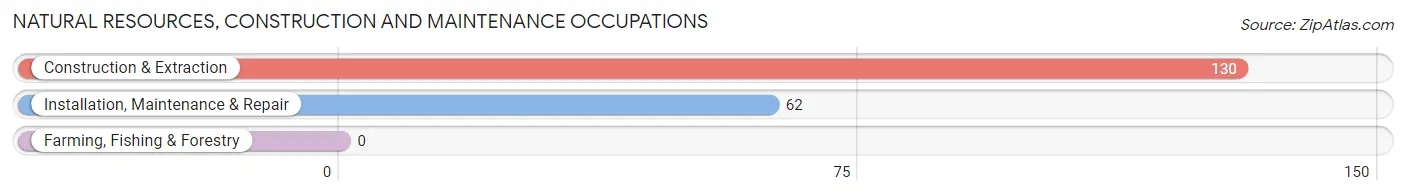
Natural Resources, Construction and Maintenance Occupations
The most common Natural Resources, Construction and Maintenance occupations in Pine Ridge CDP Citrus County are Construction & Extraction (130 | 4.8%), and Installation, Maintenance & Repair (62 | 2.3%).
Natural Resources, Construction and Maintenance Occupations by Sex

| Occupation | Male | Female |
| Farming, Fishing & Forestry | 0 (0.0%) | 0 (0.0%) |
| Construction & Extraction | 130 (100.0%) | 0 (0.0%) |
| Installation, Maintenance & Repair | 62 (100.0%) | 0 (0.0%) |
| Total (Category) | 192 (100.0%) | 0 (0.0%) |
| Total (Overall) | 1,488 (55.2%) | 1,205 (44.8%) |
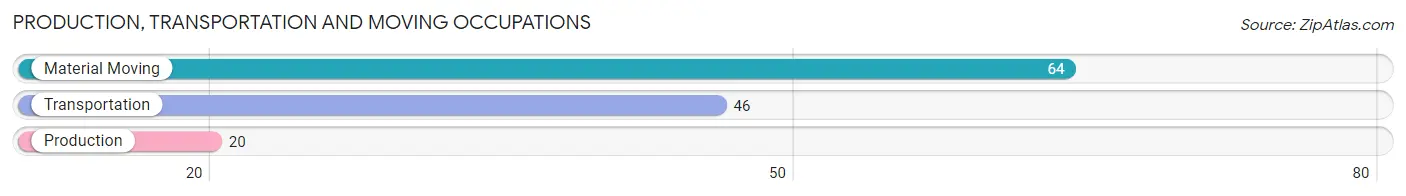
Production, Transportation and Moving Occupations
The most common Production, Transportation and Moving occupations in Pine Ridge CDP Citrus County are Material Moving (64 | 2.4%), Transportation (46 | 1.7%), and Production (20 | 0.7%).
Production, Transportation and Moving Occupations by Sex
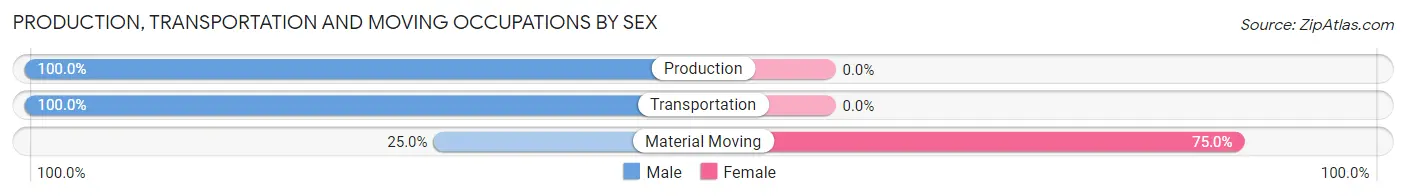
| Occupation | Male | Female |
| Production | 20 (100.0%) | 0 (0.0%) |
| Transportation | 46 (100.0%) | 0 (0.0%) |
| Material Moving | 16 (25.0%) | 48 (75.0%) |
| Total (Category) | 82 (63.1%) | 48 (36.9%) |
| Total (Overall) | 1,488 (55.2%) | 1,205 (44.8%) |
Employment Industries by Sex in Pine Ridge CDP Citrus County
Employment Industries in Pine Ridge CDP Citrus County
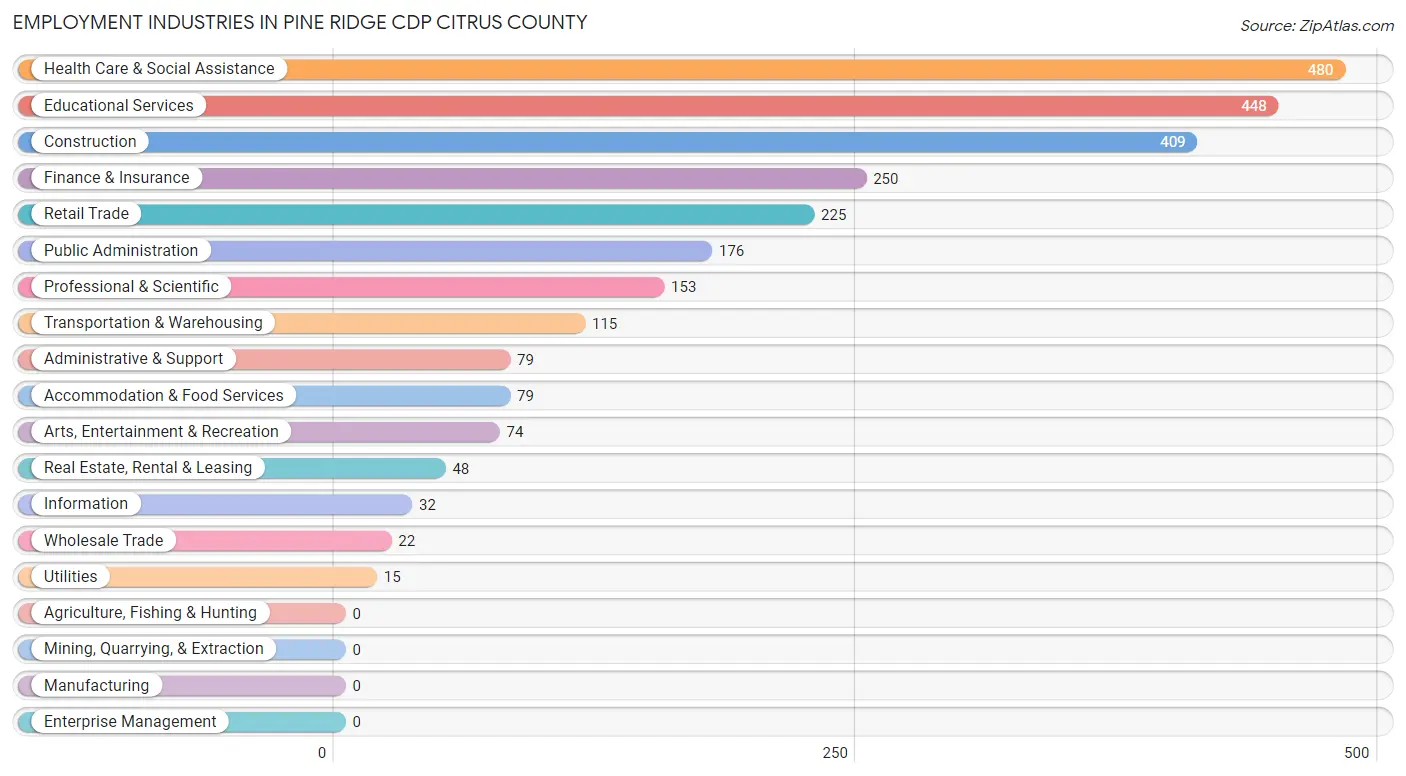
The major employment industries in Pine Ridge CDP Citrus County include Health Care & Social Assistance (480 | 17.8%), Educational Services (448 | 16.6%), Construction (409 | 15.2%), Finance & Insurance (250 | 9.3%), and Retail Trade (225 | 8.4%).
Employment Industries by Sex in Pine Ridge CDP Citrus County
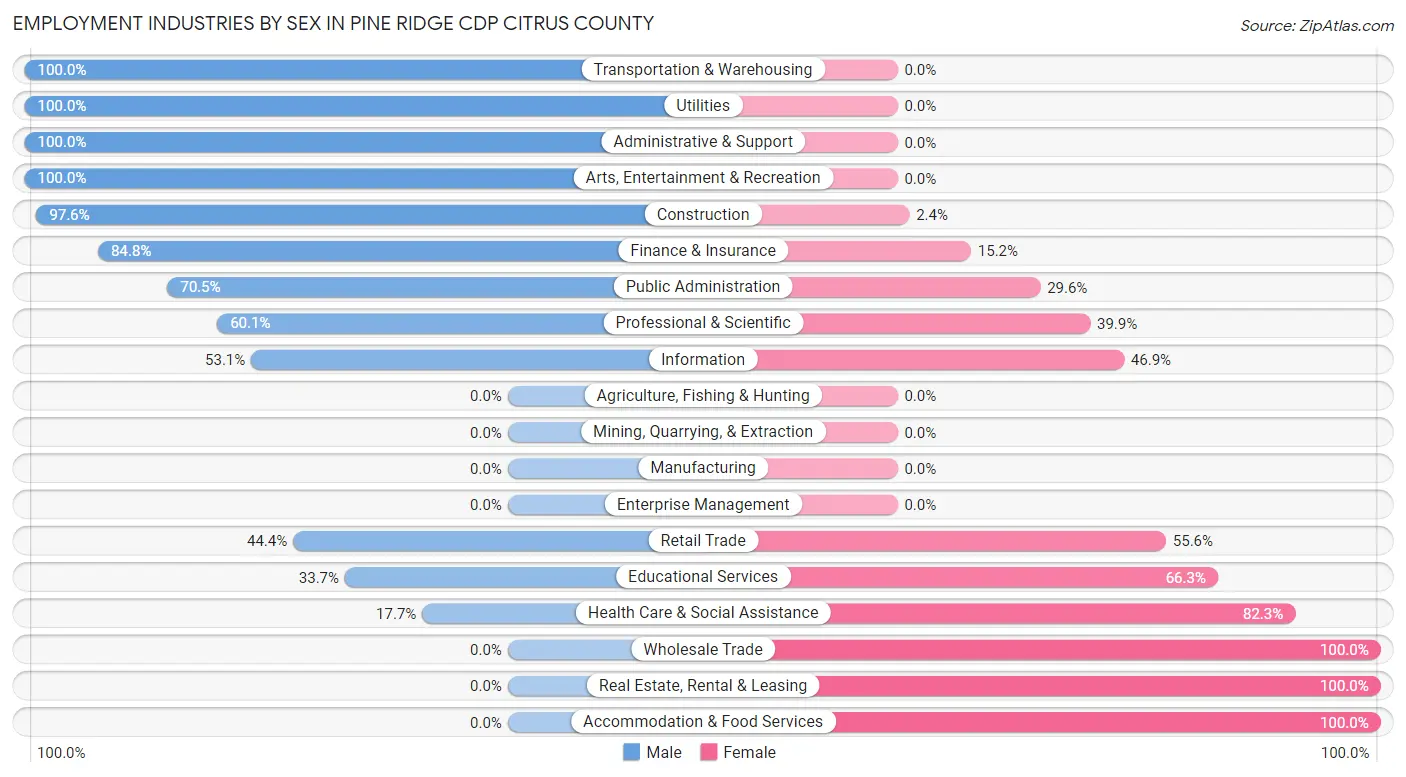
The Pine Ridge CDP Citrus County industries that see more men than women are Transportation & Warehousing (100.0%), Utilities (100.0%), and Administrative & Support (100.0%), whereas the industries that tend to have a higher number of women are Wholesale Trade (100.0%), Real Estate, Rental & Leasing (100.0%), and Accommodation & Food Services (100.0%).
| Industry | Male | Female |
| Agriculture, Fishing & Hunting | 0 (0.0%) | 0 (0.0%) |
| Mining, Quarrying, & Extraction | 0 (0.0%) | 0 (0.0%) |
| Construction | 399 (97.6%) | 10 (2.4%) |
| Manufacturing | 0 (0.0%) | 0 (0.0%) |
| Wholesale Trade | 0 (0.0%) | 22 (100.0%) |
| Retail Trade | 100 (44.4%) | 125 (55.6%) |
| Transportation & Warehousing | 115 (100.0%) | 0 (0.0%) |
| Utilities | 15 (100.0%) | 0 (0.0%) |
| Information | 17 (53.1%) | 15 (46.9%) |
| Finance & Insurance | 212 (84.8%) | 38 (15.2%) |
| Real Estate, Rental & Leasing | 0 (0.0%) | 48 (100.0%) |
| Professional & Scientific | 92 (60.1%) | 61 (39.9%) |
| Enterprise Management | 0 (0.0%) | 0 (0.0%) |
| Administrative & Support | 79 (100.0%) | 0 (0.0%) |
| Educational Services | 151 (33.7%) | 297 (66.3%) |
| Health Care & Social Assistance | 85 (17.7%) | 395 (82.3%) |
| Arts, Entertainment & Recreation | 74 (100.0%) | 0 (0.0%) |
| Accommodation & Food Services | 0 (0.0%) | 79 (100.0%) |
| Public Administration | 124 (70.5%) | 52 (29.5%) |
| Total | 1,488 (55.2%) | 1,205 (44.8%) |
Education in Pine Ridge CDP Citrus County
School Enrollment in Pine Ridge CDP Citrus County
The most common levels of schooling among the 1,217 students in Pine Ridge CDP Citrus County are high school (417 | 34.3%), elementary school (283 | 23.3%), and middle school (244 | 20.1%).
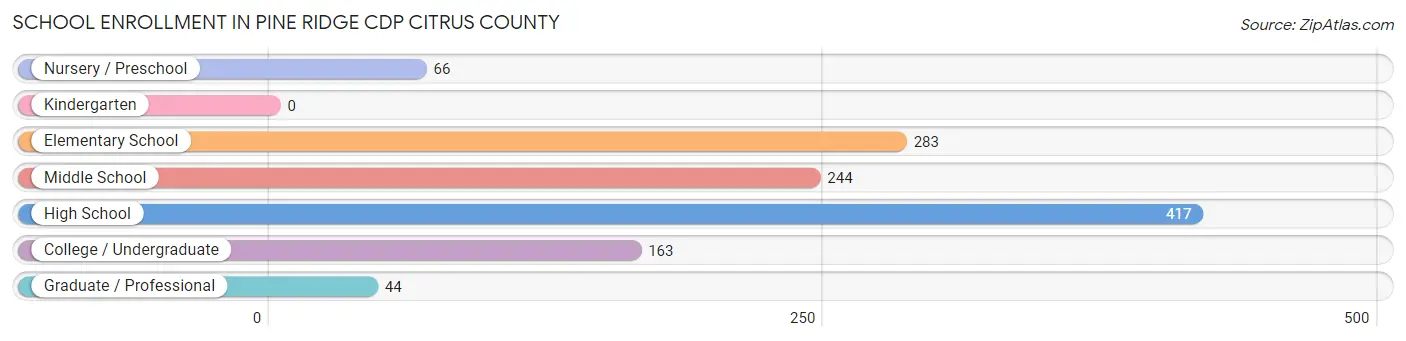
| School Level | # Students | % Students |
| Nursery / Preschool | 66 | 5.4% |
| Kindergarten | 0 | 0.0% |
| Elementary School | 283 | 23.3% |
| Middle School | 244 | 20.1% |
| High School | 417 | 34.3% |
| College / Undergraduate | 163 | 13.4% |
| Graduate / Professional | 44 | 3.6% |
| Total | 1,217 | 100.0% |
School Enrollment by Age by Funding Source in Pine Ridge CDP Citrus County
Out of a total of 1,217 students who are enrolled in schools in Pine Ridge CDP Citrus County, 287 (23.6%) attend a private institution, while the remaining 930 (76.4%) are enrolled in public schools. The age group of 20 to 24 year olds has the highest likelihood of being enrolled in private schools, with 17 (100.0% in the age bracket) enrolled. Conversely, the age group of 3 to 4 year olds has the lowest likelihood of being enrolled in a private school, with 66 (100.0% in the age bracket) attending a public institution.
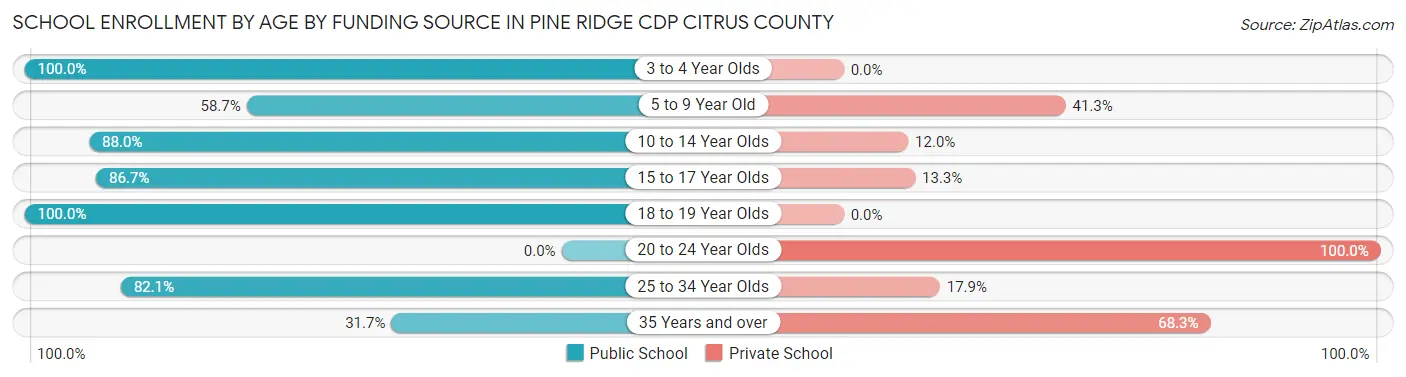
| Age Bracket | Public School | Private School |
| 3 to 4 Year Olds | 66 (100.0%) | 0 (0.0%) |
| 5 to 9 Year Old | 166 (58.7%) | 117 (41.3%) |
| 10 to 14 Year Olds | 249 (88.0%) | 34 (12.0%) |
| 15 to 17 Year Olds | 254 (86.7%) | 39 (13.3%) |
| 18 to 19 Year Olds | 59 (100.0%) | 0 (0.0%) |
| 20 to 24 Year Olds | 0 (0.0%) | 17 (100.0%) |
| 25 to 34 Year Olds | 110 (82.1%) | 24 (17.9%) |
| 35 Years and over | 26 (31.7%) | 56 (68.3%) |
| Total | 930 (76.4%) | 287 (23.6%) |
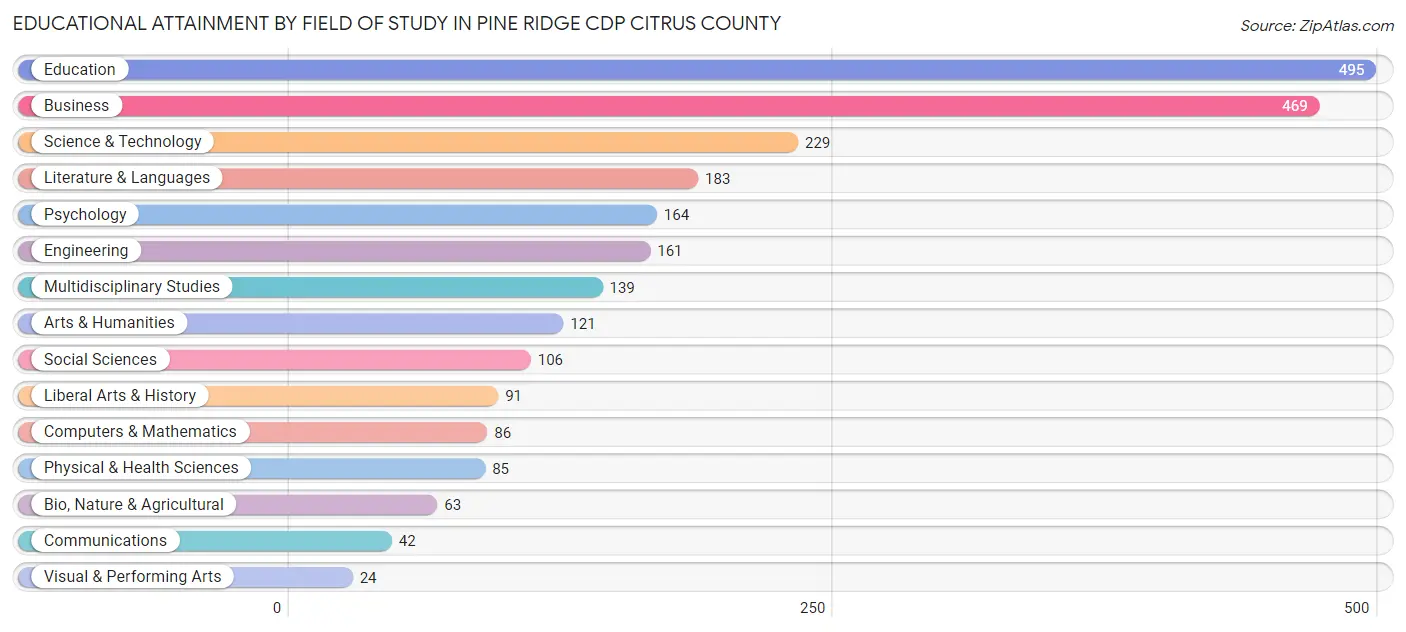
Educational Attainment by Field of Study in Pine Ridge CDP Citrus County
Education (495 | 20.1%), business (469 | 19.1%), science & technology (229 | 9.3%), literature & languages (183 | 7.4%), and psychology (164 | 6.7%) are the most common fields of study among 2,458 individuals in Pine Ridge CDP Citrus County who have obtained a bachelor's degree or higher.
| Field of Study | # Graduates | % Graduates |
| Computers & Mathematics | 86 | 3.5% |
| Bio, Nature & Agricultural | 63 | 2.6% |
| Physical & Health Sciences | 85 | 3.5% |
| Psychology | 164 | 6.7% |
| Social Sciences | 106 | 4.3% |
| Engineering | 161 | 6.6% |
| Multidisciplinary Studies | 139 | 5.7% |
| Science & Technology | 229 | 9.3% |
| Business | 469 | 19.1% |
| Education | 495 | 20.1% |
| Literature & Languages | 183 | 7.4% |
| Liberal Arts & History | 91 | 3.7% |
| Visual & Performing Arts | 24 | 1.0% |
| Communications | 42 | 1.7% |
| Arts & Humanities | 121 | 4.9% |
| Total | 2,458 | 100.0% |
Transportation & Commute in Pine Ridge CDP Citrus County
Vehicle Availability by Sex in Pine Ridge CDP Citrus County
The most prevalent vehicle ownership categories in Pine Ridge CDP Citrus County are males with 2 vehicles (698, accounting for 47.4%) and females with 2 vehicles (526, making up 57.9%).
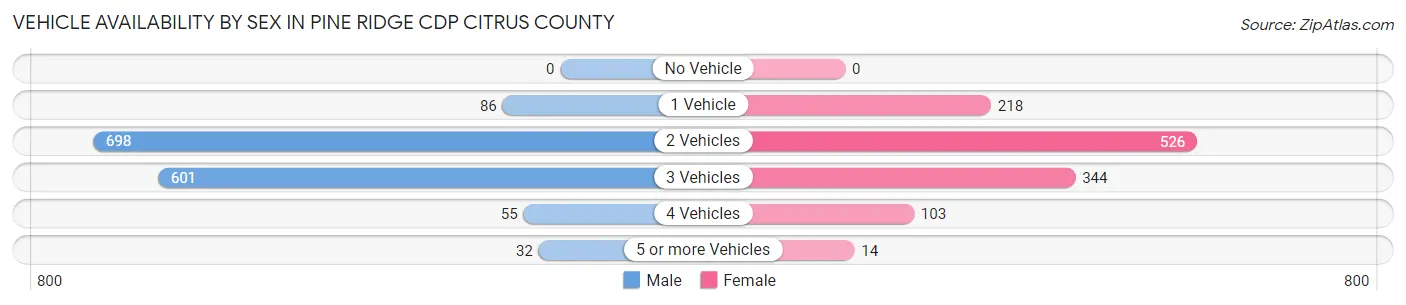
| Vehicles Available | Male | Female |
| No Vehicle | 0 (0.0%) | 0 (0.0%) |
| 1 Vehicle | 86 (5.8%) | 218 (18.1%) |
| 2 Vehicles | 698 (47.4%) | 526 (43.6%) |
| 3 Vehicles | 601 (40.8%) | 344 (28.5%) |
| 4 Vehicles | 55 (3.7%) | 103 (8.6%) |
| 5 or more Vehicles | 32 (2.2%) | 14 (1.2%) |
| Total | 1,472 (100.0%) | 1,205 (100.0%) |
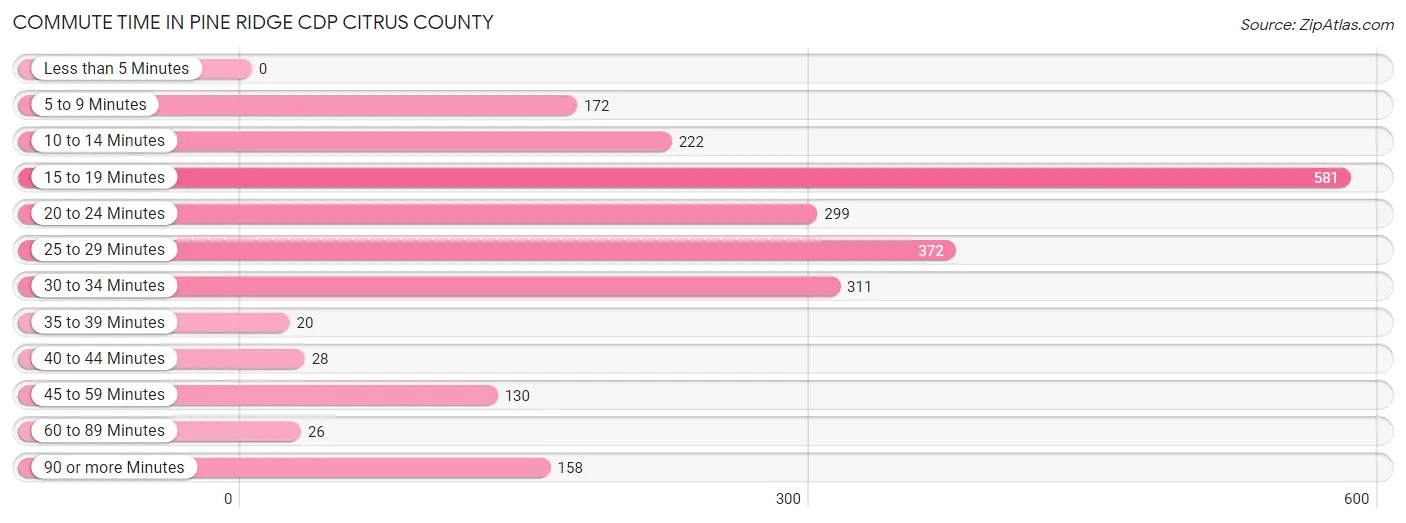
Commute Time in Pine Ridge CDP Citrus County
The most frequently occuring commute durations in Pine Ridge CDP Citrus County are 15 to 19 minutes (581 commuters, 25.1%), 25 to 29 minutes (372 commuters, 16.0%), and 30 to 34 minutes (311 commuters, 13.4%).
| Commute Time | # Commuters | % Commuters |
| Less than 5 Minutes | 0 | 0.0% |
| 5 to 9 Minutes | 172 | 7.4% |
| 10 to 14 Minutes | 222 | 9.6% |
| 15 to 19 Minutes | 581 | 25.1% |
| 20 to 24 Minutes | 299 | 12.9% |
| 25 to 29 Minutes | 372 | 16.0% |
| 30 to 34 Minutes | 311 | 13.4% |
| 35 to 39 Minutes | 20 | 0.9% |
| 40 to 44 Minutes | 28 | 1.2% |
| 45 to 59 Minutes | 130 | 5.6% |
| 60 to 89 Minutes | 26 | 1.1% |
| 90 or more Minutes | 158 | 6.8% |
Commute Time by Sex in Pine Ridge CDP Citrus County
The most common commute times in Pine Ridge CDP Citrus County are 15 to 19 minutes (288 commuters, 23.3%) for males and 25 to 29 minutes (313 commuters, 28.9%) for females.
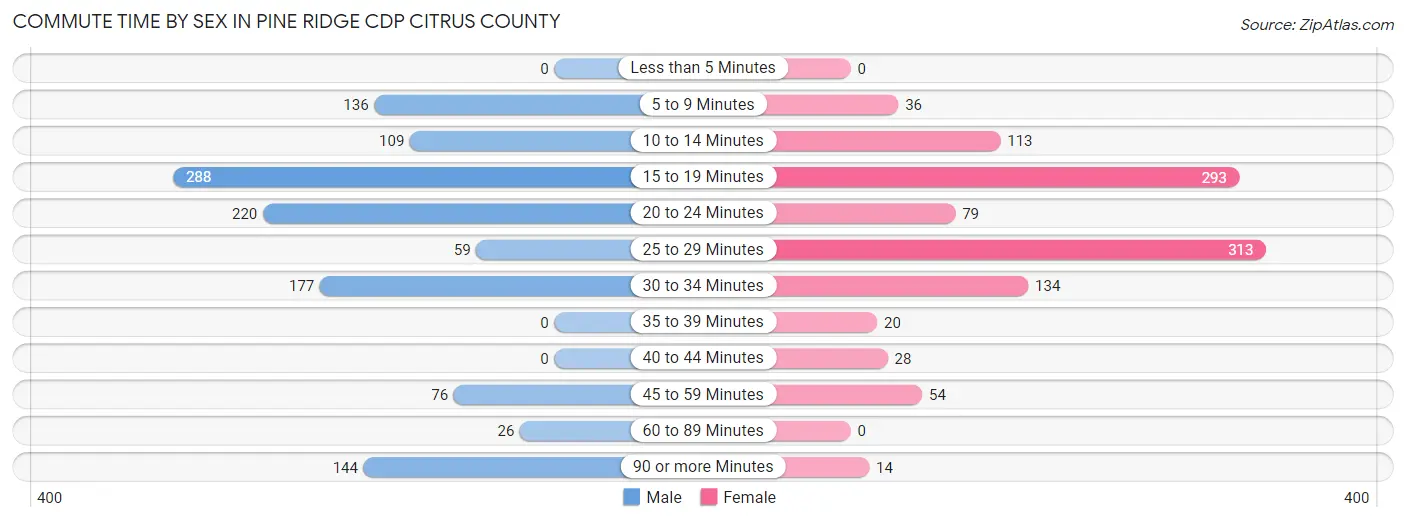
| Commute Time | Male | Female |
| Less than 5 Minutes | 0 (0.0%) | 0 (0.0%) |
| 5 to 9 Minutes | 136 (11.0%) | 36 (3.3%) |
| 10 to 14 Minutes | 109 (8.8%) | 113 (10.4%) |
| 15 to 19 Minutes | 288 (23.3%) | 293 (27.0%) |
| 20 to 24 Minutes | 220 (17.8%) | 79 (7.3%) |
| 25 to 29 Minutes | 59 (4.8%) | 313 (28.9%) |
| 30 to 34 Minutes | 177 (14.3%) | 134 (12.4%) |
| 35 to 39 Minutes | 0 (0.0%) | 20 (1.8%) |
| 40 to 44 Minutes | 0 (0.0%) | 28 (2.6%) |
| 45 to 59 Minutes | 76 (6.1%) | 54 (5.0%) |
| 60 to 89 Minutes | 26 (2.1%) | 0 (0.0%) |
| 90 or more Minutes | 144 (11.7%) | 14 (1.3%) |
Time of Departure to Work by Sex in Pine Ridge CDP Citrus County
The most frequent times of departure to work in Pine Ridge CDP Citrus County are 7:00 AM to 7:29 AM (381, 30.8%) for males and 7:00 AM to 7:29 AM (219, 20.2%) for females.
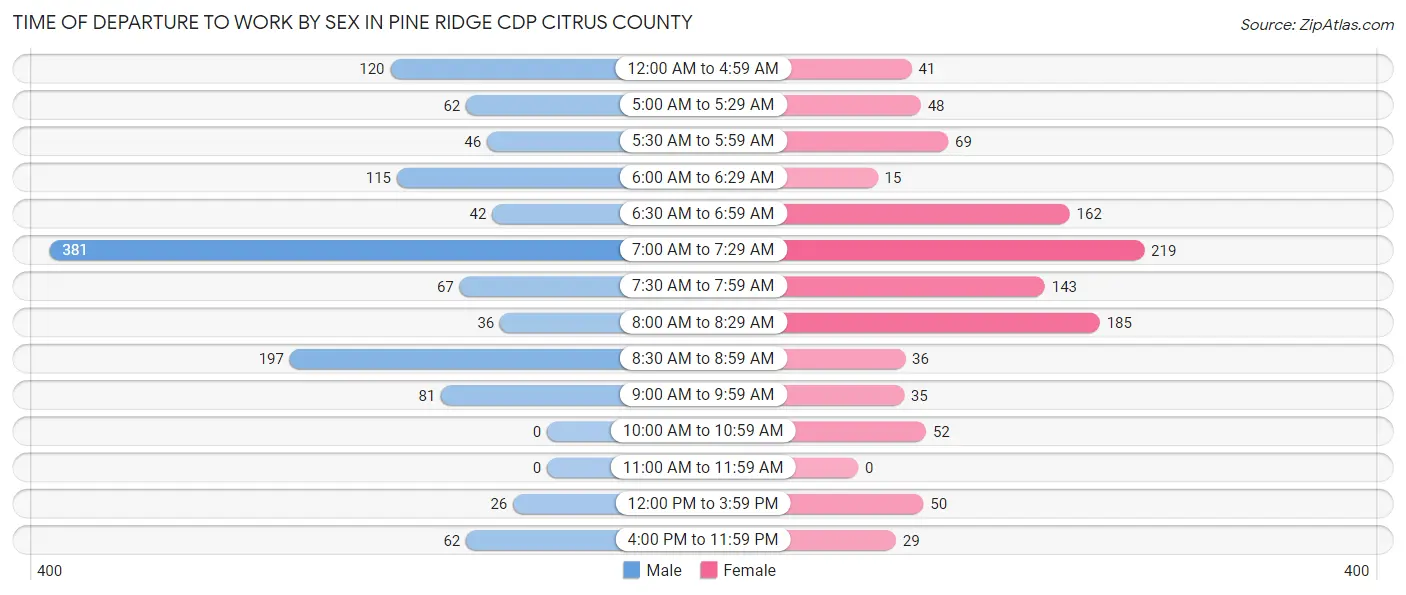
| Time of Departure | Male | Female |
| 12:00 AM to 4:59 AM | 120 (9.7%) | 41 (3.8%) |
| 5:00 AM to 5:29 AM | 62 (5.0%) | 48 (4.4%) |
| 5:30 AM to 5:59 AM | 46 (3.7%) | 69 (6.4%) |
| 6:00 AM to 6:29 AM | 115 (9.3%) | 15 (1.4%) |
| 6:30 AM to 6:59 AM | 42 (3.4%) | 162 (14.9%) |
| 7:00 AM to 7:29 AM | 381 (30.8%) | 219 (20.2%) |
| 7:30 AM to 7:59 AM | 67 (5.4%) | 143 (13.2%) |
| 8:00 AM to 8:29 AM | 36 (2.9%) | 185 (17.1%) |
| 8:30 AM to 8:59 AM | 197 (16.0%) | 36 (3.3%) |
| 9:00 AM to 9:59 AM | 81 (6.6%) | 35 (3.2%) |
| 10:00 AM to 10:59 AM | 0 (0.0%) | 52 (4.8%) |
| 11:00 AM to 11:59 AM | 0 (0.0%) | 0 (0.0%) |
| 12:00 PM to 3:59 PM | 26 (2.1%) | 50 (4.6%) |
| 4:00 PM to 11:59 PM | 62 (5.0%) | 29 (2.7%) |
| Total | 1,235 (100.0%) | 1,084 (100.0%) |
Housing Occupancy in Pine Ridge CDP Citrus County
Occupancy by Ownership in Pine Ridge CDP Citrus County
Of the total 4,788 dwellings in Pine Ridge CDP Citrus County, owner-occupied units account for 4,310 (90.0%), while renter-occupied units make up 478 (10.0%).
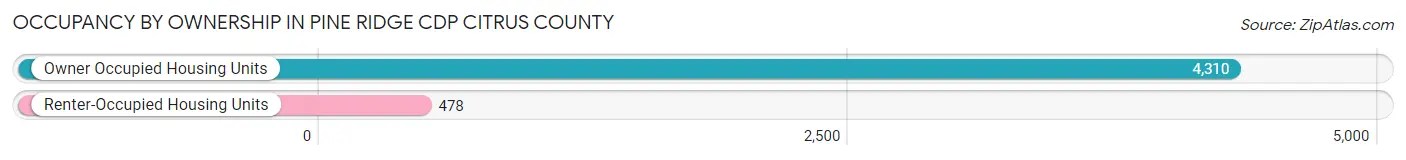
| Occupancy | # Housing Units | % Housing Units |
| Owner Occupied Housing Units | 4,310 | 90.0% |
| Renter-Occupied Housing Units | 478 | 10.0% |
| Total Occupied Housing Units | 4,788 | 100.0% |
Occupancy by Household Size in Pine Ridge CDP Citrus County
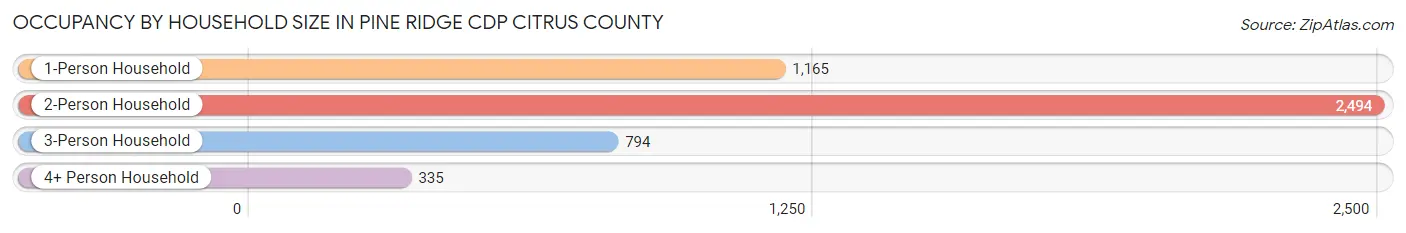
| Household Size | # Housing Units | % Housing Units |
| 1-Person Household | 1,165 | 24.3% |
| 2-Person Household | 2,494 | 52.1% |
| 3-Person Household | 794 | 16.6% |
| 4+ Person Household | 335 | 7.0% |
| Total Housing Units | 4,788 | 100.0% |
Occupancy by Ownership by Household Size in Pine Ridge CDP Citrus County
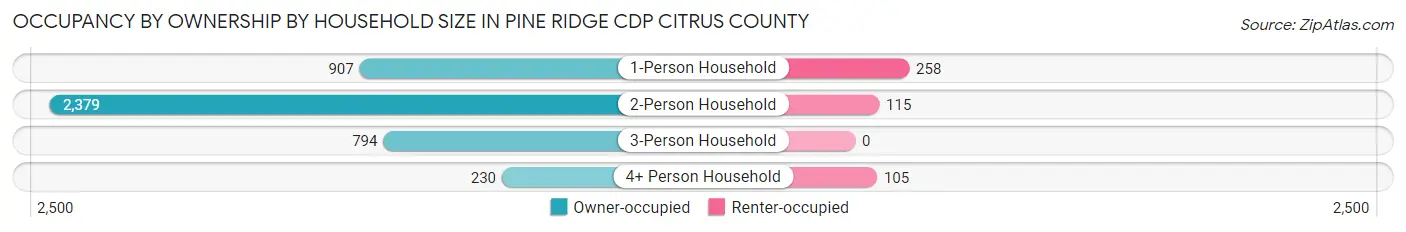
| Household Size | Owner-occupied | Renter-occupied |
| 1-Person Household | 907 (77.8%) | 258 (22.2%) |
| 2-Person Household | 2,379 (95.4%) | 115 (4.6%) |
| 3-Person Household | 794 (100.0%) | 0 (0.0%) |
| 4+ Person Household | 230 (68.7%) | 105 (31.3%) |
| Total Housing Units | 4,310 (90.0%) | 478 (10.0%) |
Occupancy by Educational Attainment in Pine Ridge CDP Citrus County
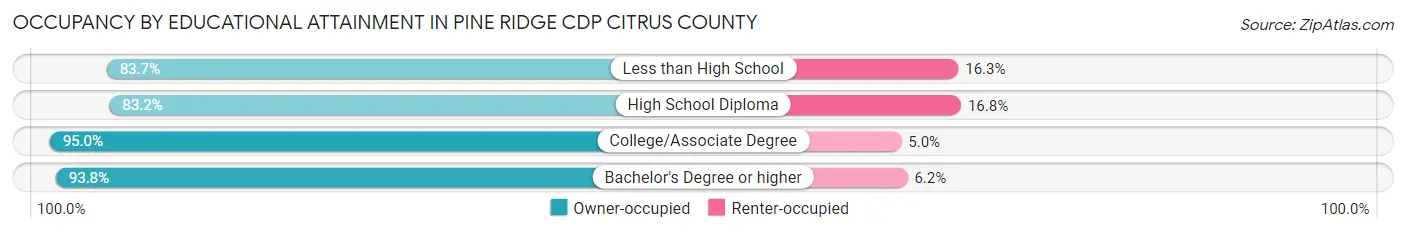
| Household Size | Owner-occupied | Renter-occupied |
| Less than High School | 257 (83.7%) | 50 (16.3%) |
| High School Diploma | 1,320 (83.2%) | 267 (16.8%) |
| College/Associate Degree | 1,446 (95.0%) | 76 (5.0%) |
| Bachelor's Degree or higher | 1,287 (93.8%) | 85 (6.2%) |
Occupancy by Age of Householder in Pine Ridge CDP Citrus County
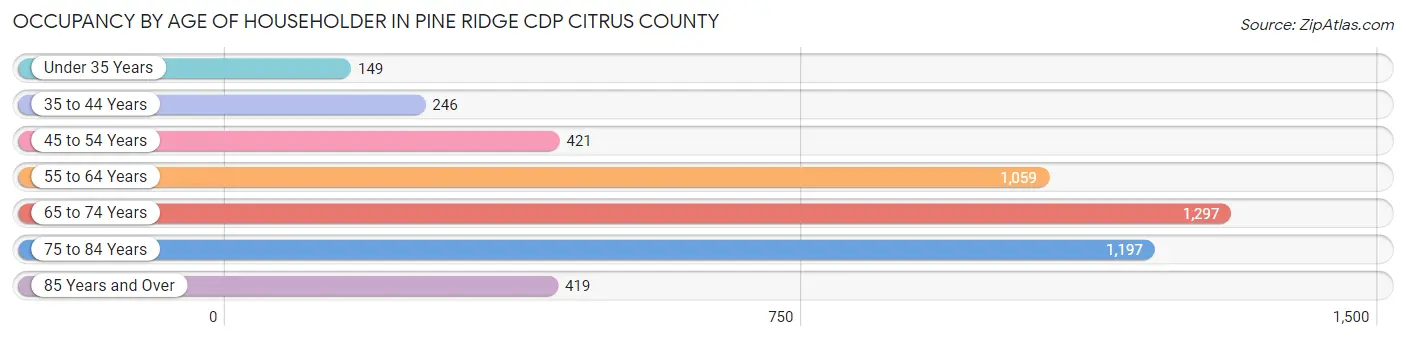
| Age Bracket | # Households | % Households |
| Under 35 Years | 149 | 3.1% |
| 35 to 44 Years | 246 | 5.1% |
| 45 to 54 Years | 421 | 8.8% |
| 55 to 64 Years | 1,059 | 22.1% |
| 65 to 74 Years | 1,297 | 27.1% |
| 75 to 84 Years | 1,197 | 25.0% |
| 85 Years and Over | 419 | 8.7% |
| Total | 4,788 | 100.0% |
Housing Finances in Pine Ridge CDP Citrus County
Median Income by Occupancy in Pine Ridge CDP Citrus County
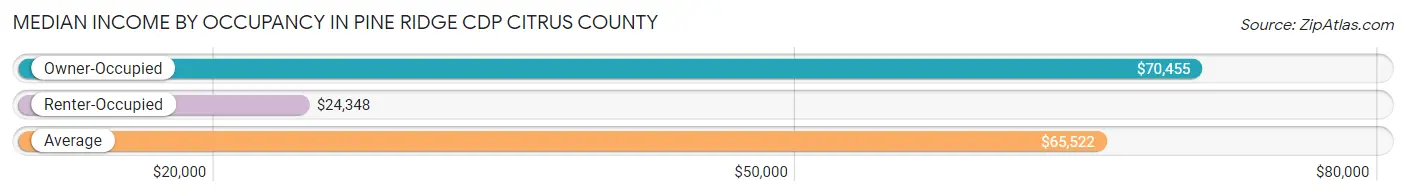
| Occupancy Type | # Households | Median Income |
| Owner-Occupied | 4,310 (90.0%) | $70,455 |
| Renter-Occupied | 478 (10.0%) | $24,348 |
| Average | 4,788 (100.0%) | $65,522 |
Occupancy by Householder Income Bracket in Pine Ridge CDP Citrus County
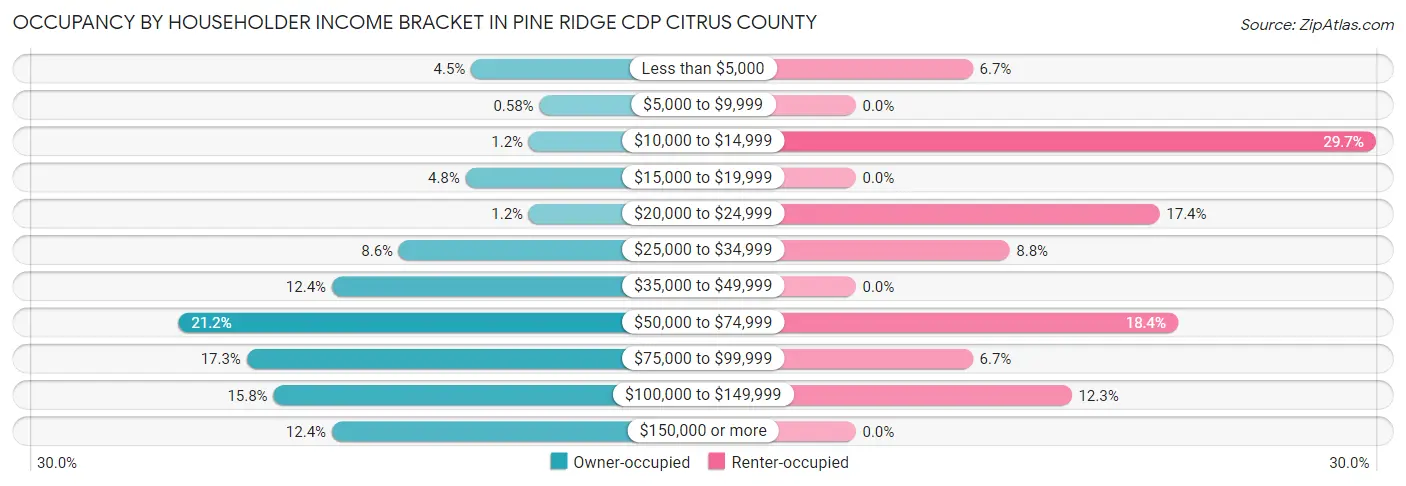
| Income Bracket | Owner-occupied | Renter-occupied |
| Less than $5,000 | 193 (4.5%) | 32 (6.7%) |
| $5,000 to $9,999 | 25 (0.6%) | 0 (0.0%) |
| $10,000 to $14,999 | 51 (1.2%) | 142 (29.7%) |
| $15,000 to $19,999 | 207 (4.8%) | 0 (0.0%) |
| $20,000 to $24,999 | 51 (1.2%) | 83 (17.4%) |
| $25,000 to $34,999 | 371 (8.6%) | 42 (8.8%) |
| $35,000 to $49,999 | 536 (12.4%) | 0 (0.0%) |
| $50,000 to $74,999 | 914 (21.2%) | 88 (18.4%) |
| $75,000 to $99,999 | 746 (17.3%) | 32 (6.7%) |
| $100,000 to $149,999 | 680 (15.8%) | 59 (12.3%) |
| $150,000 or more | 536 (12.4%) | 0 (0.0%) |
| Total | 4,310 (100.0%) | 478 (100.0%) |
Monthly Housing Cost Tiers in Pine Ridge CDP Citrus County
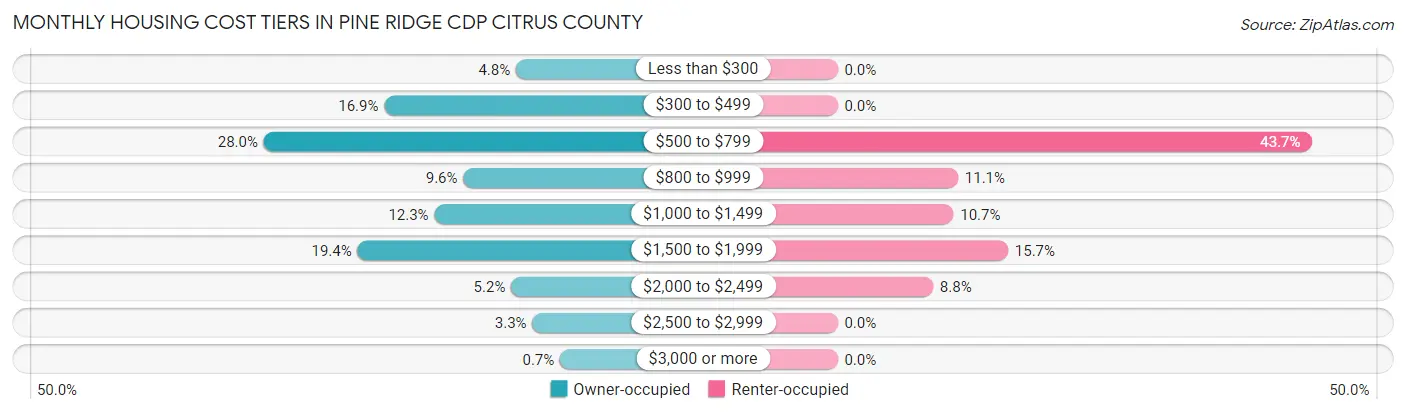
| Monthly Cost | Owner-occupied | Renter-occupied |
| Less than $300 | 205 (4.8%) | 0 (0.0%) |
| $300 to $499 | 728 (16.9%) | 0 (0.0%) |
| $500 to $799 | 1,206 (28.0%) | 209 (43.7%) |
| $800 to $999 | 414 (9.6%) | 53 (11.1%) |
| $1,000 to $1,499 | 529 (12.3%) | 51 (10.7%) |
| $1,500 to $1,999 | 834 (19.4%) | 75 (15.7%) |
| $2,000 to $2,499 | 224 (5.2%) | 42 (8.8%) |
| $2,500 to $2,999 | 140 (3.3%) | 0 (0.0%) |
| $3,000 or more | 30 (0.7%) | 0 (0.0%) |
| Total | 4,310 (100.0%) | 478 (100.0%) |
Physical Housing Characteristics in Pine Ridge CDP Citrus County
Housing Structures in Pine Ridge CDP Citrus County
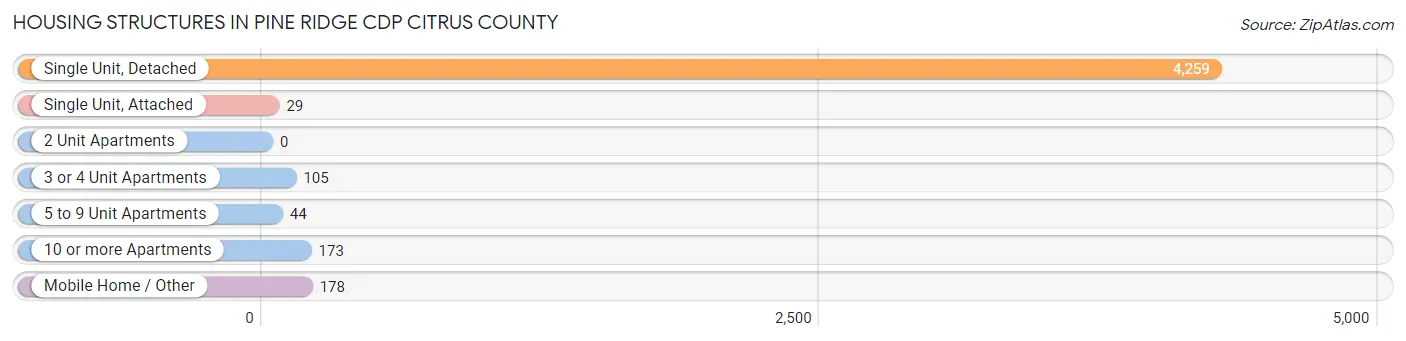
| Structure Type | # Housing Units | % Housing Units |
| Single Unit, Detached | 4,259 | 88.9% |
| Single Unit, Attached | 29 | 0.6% |
| 2 Unit Apartments | 0 | 0.0% |
| 3 or 4 Unit Apartments | 105 | 2.2% |
| 5 to 9 Unit Apartments | 44 | 0.9% |
| 10 or more Apartments | 173 | 3.6% |
| Mobile Home / Other | 178 | 3.7% |
| Total | 4,788 | 100.0% |
Housing Structures by Occupancy in Pine Ridge CDP Citrus County
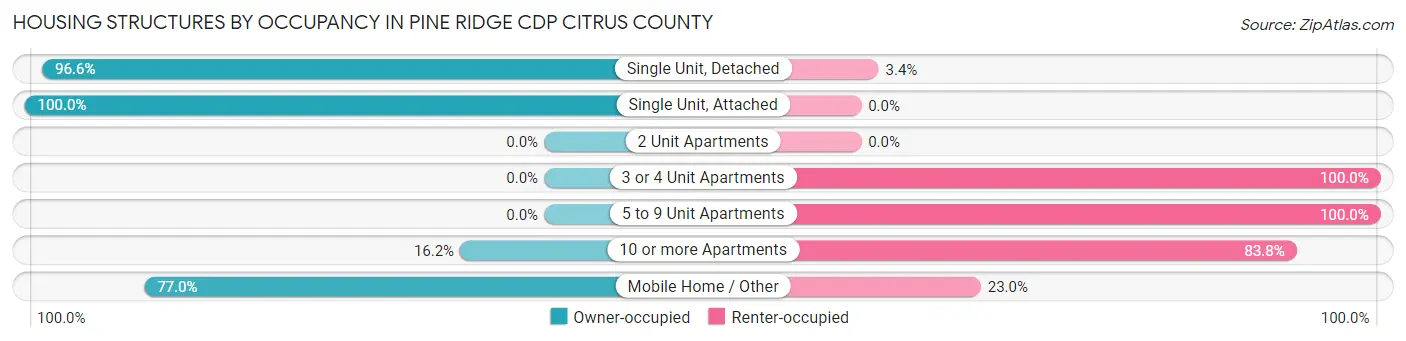
| Structure Type | Owner-occupied | Renter-occupied |
| Single Unit, Detached | 4,116 (96.6%) | 143 (3.4%) |
| Single Unit, Attached | 29 (100.0%) | 0 (0.0%) |
| 2 Unit Apartments | 0 (0.0%) | 0 (0.0%) |
| 3 or 4 Unit Apartments | 0 (0.0%) | 105 (100.0%) |
| 5 to 9 Unit Apartments | 0 (0.0%) | 44 (100.0%) |
| 10 or more Apartments | 28 (16.2%) | 145 (83.8%) |
| Mobile Home / Other | 137 (77.0%) | 41 (23.0%) |
| Total | 4,310 (90.0%) | 478 (10.0%) |
Housing Structures by Number of Rooms in Pine Ridge CDP Citrus County
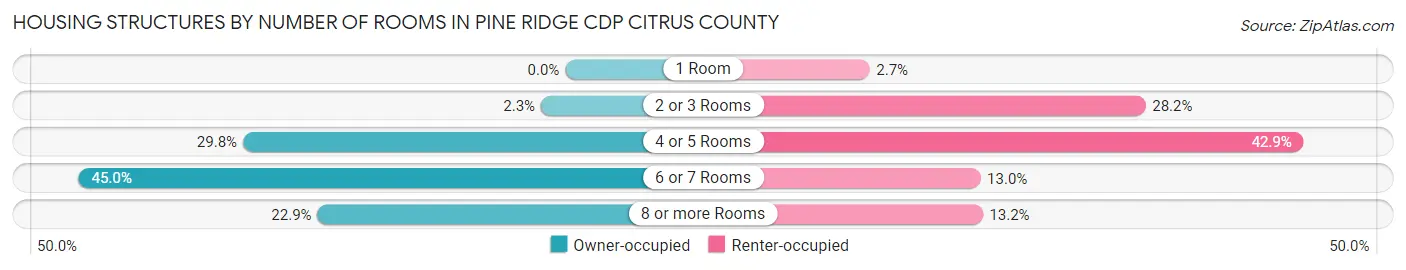
| Number of Rooms | Owner-occupied | Renter-occupied |
| 1 Room | 0 (0.0%) | 13 (2.7%) |
| 2 or 3 Rooms | 97 (2.2%) | 135 (28.2%) |
| 4 or 5 Rooms | 1,285 (29.8%) | 205 (42.9%) |
| 6 or 7 Rooms | 1,940 (45.0%) | 62 (13.0%) |
| 8 or more Rooms | 988 (22.9%) | 63 (13.2%) |
| Total | 4,310 (100.0%) | 478 (100.0%) |
Housing Structure by Heating Type in Pine Ridge CDP Citrus County
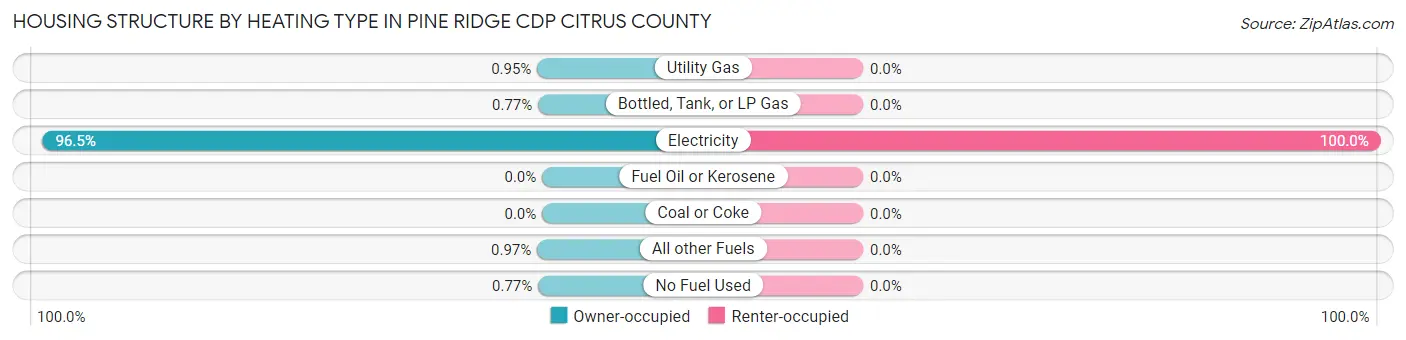
| Heating Type | Owner-occupied | Renter-occupied |
| Utility Gas | 41 (0.9%) | 0 (0.0%) |
| Bottled, Tank, or LP Gas | 33 (0.8%) | 0 (0.0%) |
| Electricity | 4,161 (96.5%) | 478 (100.0%) |
| Fuel Oil or Kerosene | 0 (0.0%) | 0 (0.0%) |
| Coal or Coke | 0 (0.0%) | 0 (0.0%) |
| All other Fuels | 42 (1.0%) | 0 (0.0%) |
| No Fuel Used | 33 (0.8%) | 0 (0.0%) |
| Total | 4,310 (100.0%) | 478 (100.0%) |
Household Vehicle Usage in Pine Ridge CDP Citrus County
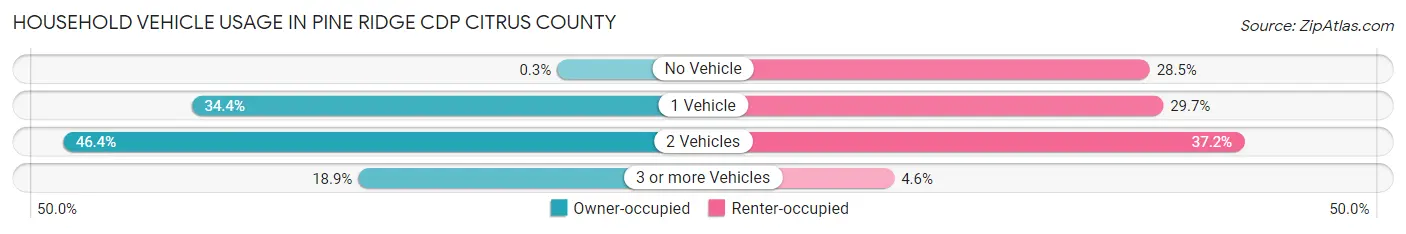
| Vehicles per Household | Owner-occupied | Renter-occupied |
| No Vehicle | 13 (0.3%) | 136 (28.4%) |
| 1 Vehicle | 1,483 (34.4%) | 142 (29.7%) |
| 2 Vehicles | 2,001 (46.4%) | 178 (37.2%) |
| 3 or more Vehicles | 813 (18.9%) | 22 (4.6%) |
| Total | 4,310 (100.0%) | 478 (100.0%) |
Real Estate & Mortgages in Pine Ridge CDP Citrus County
Real Estate and Mortgage Overview in Pine Ridge CDP Citrus County
| Characteristic | Without Mortgage | With Mortgage |
| Housing Units | 2,119 | 2,191 |
| Median Property Value | $281,500 | $326,800 |
| Median Household Income | $57,232 | $359 |
| Monthly Housing Costs | $544 | $30 |
| Real Estate Taxes | $1,944 | $59 |
Property Value by Mortgage Status in Pine Ridge CDP Citrus County
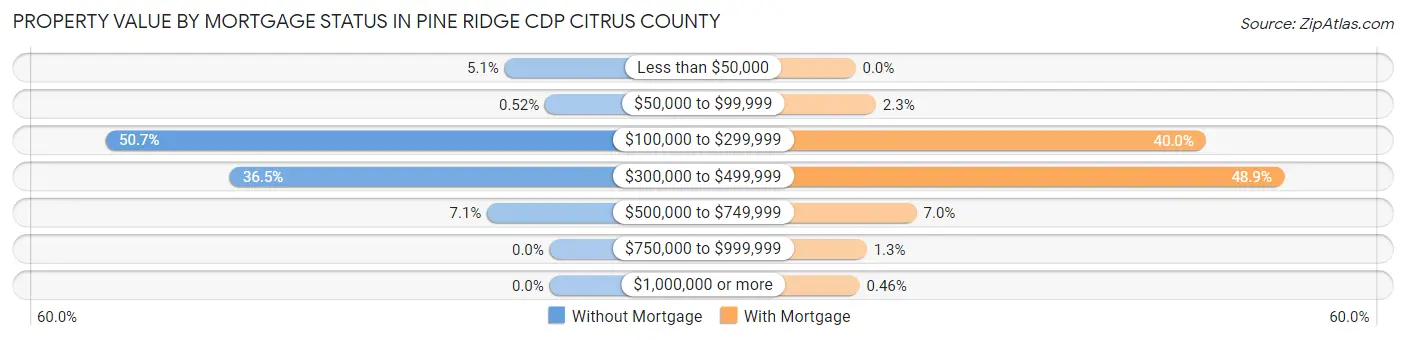
| Property Value | Without Mortgage | With Mortgage |
| Less than $50,000 | 109 (5.1%) | 0 (0.0%) |
| $50,000 to $99,999 | 11 (0.5%) | 51 (2.3%) |
| $100,000 to $299,999 | 1,074 (50.7%) | 877 (40.0%) |
| $300,000 to $499,999 | 774 (36.5%) | 1,072 (48.9%) |
| $500,000 to $749,999 | 151 (7.1%) | 153 (7.0%) |
| $750,000 to $999,999 | 0 (0.0%) | 28 (1.3%) |
| $1,000,000 or more | 0 (0.0%) | 10 (0.5%) |
| Total | 2,119 (100.0%) | 2,191 (100.0%) |
Household Income by Mortgage Status in Pine Ridge CDP Citrus County
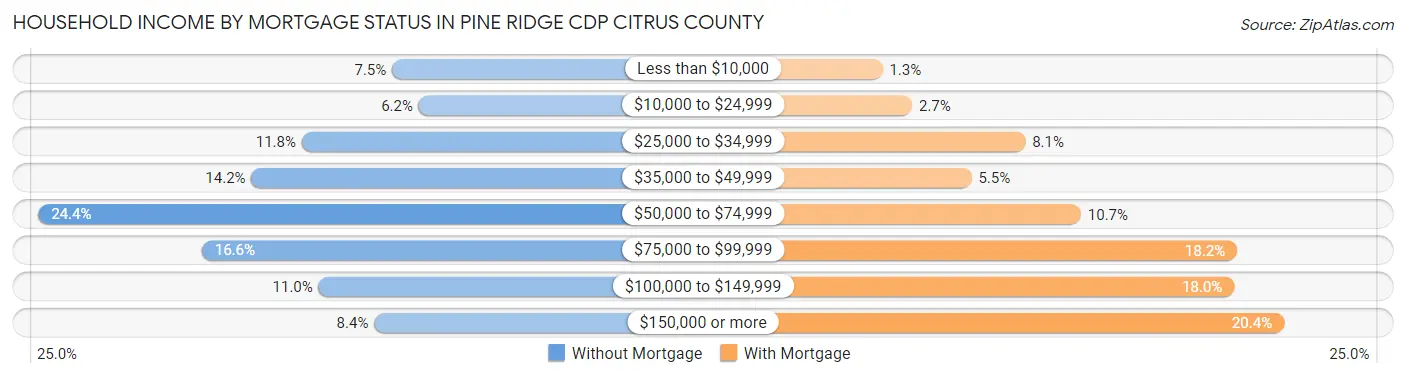
| Household Income | Without Mortgage | With Mortgage |
| Less than $10,000 | 159 (7.5%) | 28 (1.3%) |
| $10,000 to $24,999 | 132 (6.2%) | 59 (2.7%) |
| $25,000 to $34,999 | 250 (11.8%) | 177 (8.1%) |
| $35,000 to $49,999 | 301 (14.2%) | 121 (5.5%) |
| $50,000 to $74,999 | 516 (24.3%) | 235 (10.7%) |
| $75,000 to $99,999 | 351 (16.6%) | 398 (18.2%) |
| $100,000 to $149,999 | 233 (11.0%) | 395 (18.0%) |
| $150,000 or more | 177 (8.4%) | 447 (20.4%) |
| Total | 2,119 (100.0%) | 2,191 (100.0%) |
Property Value to Household Income Ratio in Pine Ridge CDP Citrus County
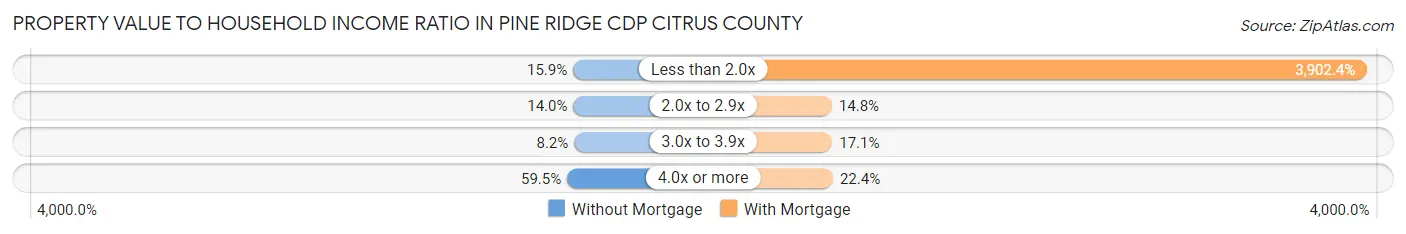
| Value-to-Income Ratio | Without Mortgage | With Mortgage |
| Less than 2.0x | 336 (15.9%) | 85,502 (3,902.4%) |
| 2.0x to 2.9x | 296 (14.0%) | 324 (14.8%) |
| 3.0x to 3.9x | 174 (8.2%) | 375 (17.1%) |
| 4.0x or more | 1,261 (59.5%) | 490 (22.4%) |
| Total | 2,119 (100.0%) | 2,191 (100.0%) |
Real Estate Taxes by Mortgage Status in Pine Ridge CDP Citrus County

| Property Taxes | Without Mortgage | With Mortgage |
| Less than $800 | 182 (8.6%) | 27 (1.2%) |
| $800 to $1,499 | 361 (17.0%) | 240 (11.0%) |
| $800 to $1,499 | 1,455 (68.7%) | 323 (14.7%) |
| Total | 2,119 (100.0%) | 2,191 (100.0%) |
Health & Disability in Pine Ridge CDP Citrus County
Health Insurance Coverage by Age in Pine Ridge CDP Citrus County
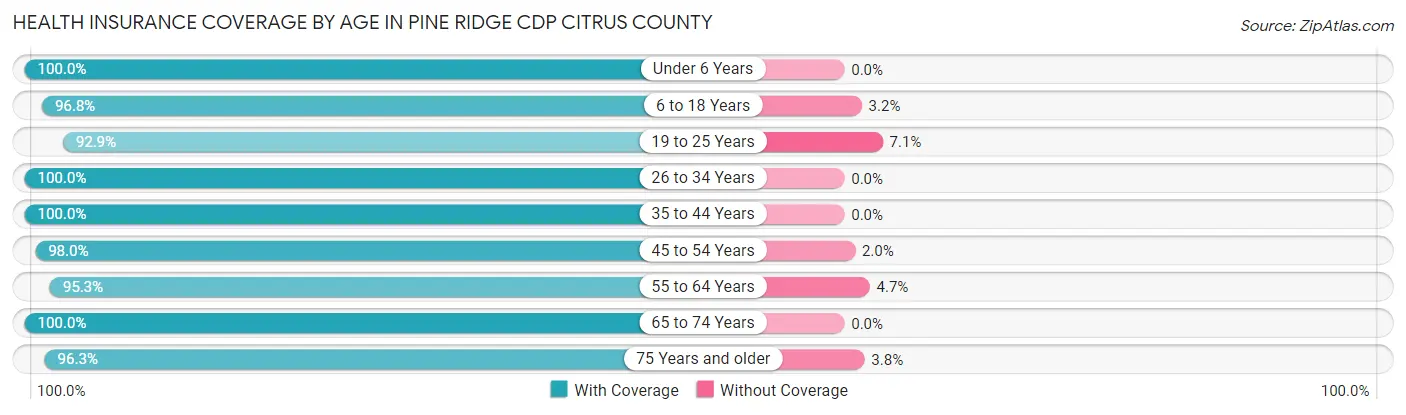
| Age Bracket | With Coverage | Without Coverage |
| Under 6 Years | 287 (100.0%) | 0 (0.0%) |
| 6 to 18 Years | 865 (96.8%) | 29 (3.2%) |
| 19 to 25 Years | 312 (92.9%) | 24 (7.1%) |
| 26 to 34 Years | 407 (100.0%) | 0 (0.0%) |
| 35 to 44 Years | 452 (100.0%) | 0 (0.0%) |
| 45 to 54 Years | 738 (98.0%) | 15 (2.0%) |
| 55 to 64 Years | 1,878 (95.3%) | 93 (4.7%) |
| 65 to 74 Years | 2,340 (100.0%) | 0 (0.0%) |
| 75 Years and older | 2,647 (96.3%) | 103 (3.7%) |
| Total | 9,926 (97.4%) | 264 (2.6%) |
Health Insurance Coverage by Citizenship Status in Pine Ridge CDP Citrus County
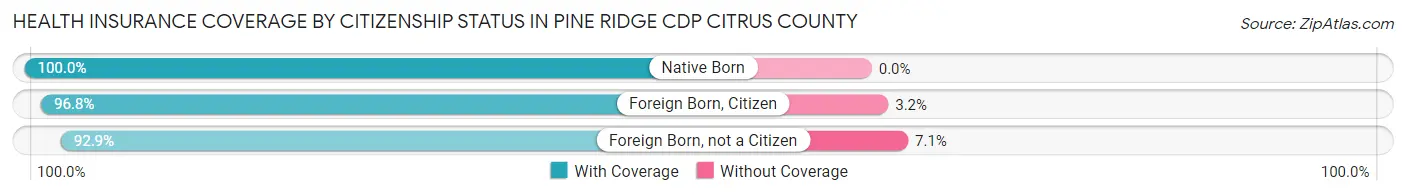
| Citizenship Status | With Coverage | Without Coverage |
| Native Born | 287 (100.0%) | 0 (0.0%) |
| Foreign Born, Citizen | 865 (96.8%) | 29 (3.2%) |
| Foreign Born, not a Citizen | 312 (92.9%) | 24 (7.1%) |
Health Insurance Coverage by Household Income in Pine Ridge CDP Citrus County
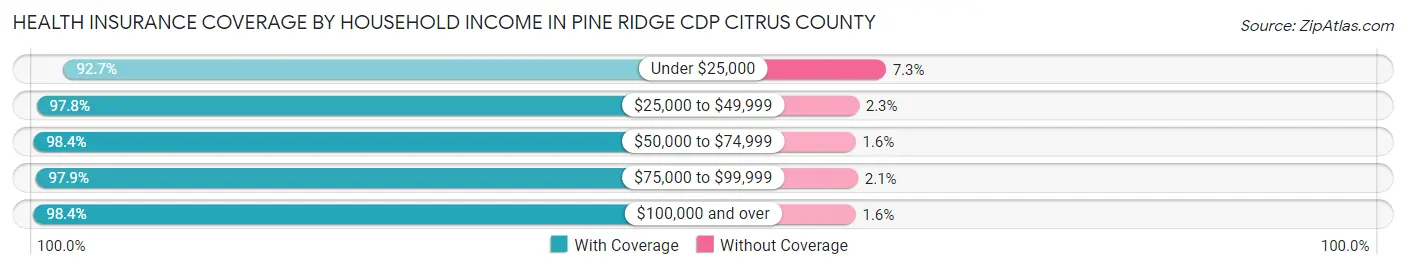
| Household Income | With Coverage | Without Coverage |
| Under $25,000 | 1,310 (92.7%) | 103 (7.3%) |
| $25,000 to $49,999 | 1,606 (97.8%) | 37 (2.2%) |
| $50,000 to $74,999 | 2,185 (98.4%) | 36 (1.6%) |
| $75,000 to $99,999 | 1,654 (97.9%) | 35 (2.1%) |
| $100,000 and over | 3,169 (98.4%) | 53 (1.6%) |
Public vs Private Health Insurance Coverage by Age in Pine Ridge CDP Citrus County
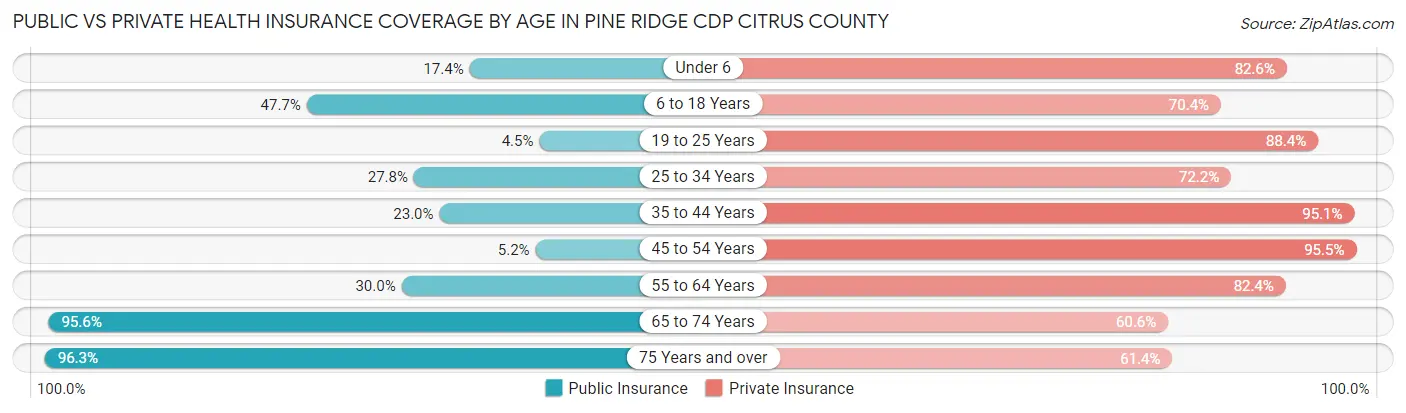
| Age Bracket | Public Insurance | Private Insurance |
| Under 6 | 50 (17.4%) | 237 (82.6%) |
| 6 to 18 Years | 426 (47.6%) | 629 (70.4%) |
| 19 to 25 Years | 15 (4.5%) | 297 (88.4%) |
| 25 to 34 Years | 113 (27.8%) | 294 (72.2%) |
| 35 to 44 Years | 104 (23.0%) | 430 (95.1%) |
| 45 to 54 Years | 39 (5.2%) | 719 (95.5%) |
| 55 to 64 Years | 592 (30.0%) | 1,624 (82.4%) |
| 65 to 74 Years | 2,236 (95.6%) | 1,417 (60.6%) |
| 75 Years and over | 2,647 (96.3%) | 1,687 (61.4%) |
| Total | 6,222 (61.1%) | 7,334 (72.0%) |
Disability Status by Sex by Age in Pine Ridge CDP Citrus County
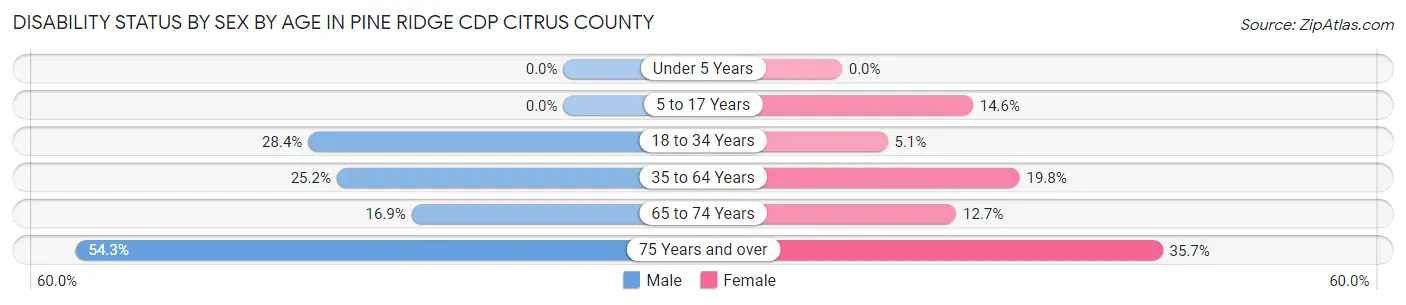
| Age Bracket | Male | Female |
| Under 5 Years | 0 (0.0%) | 0 (0.0%) |
| 5 to 17 Years | 0 (0.0%) | 54 (14.6%) |
| 18 to 34 Years | 137 (28.4%) | 14 (5.1%) |
| 35 to 64 Years | 344 (25.2%) | 359 (19.8%) |
| 65 to 74 Years | 195 (16.9%) | 151 (12.7%) |
| 75 Years and over | 729 (54.3%) | 503 (35.7%) |
Disability Class by Sex by Age in Pine Ridge CDP Citrus County
Disability Class: Hearing Difficulty
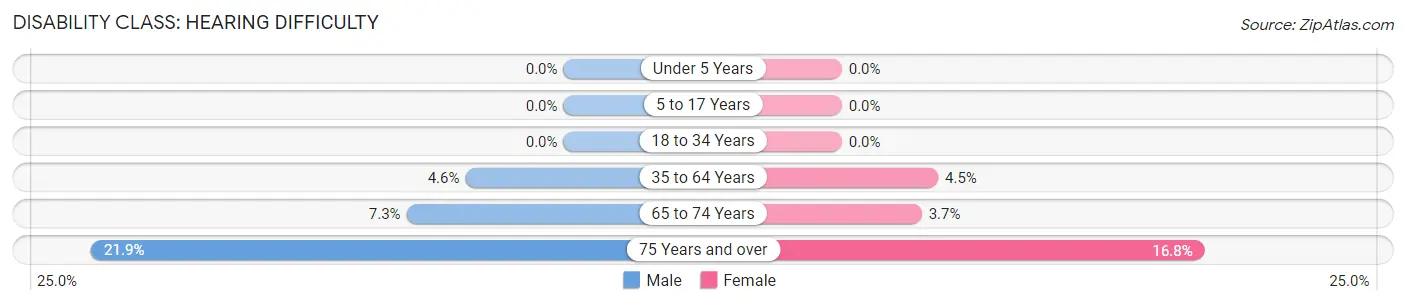
| Age Bracket | Male | Female |
| Under 5 Years | 0 (0.0%) | 0 (0.0%) |
| 5 to 17 Years | 0 (0.0%) | 0 (0.0%) |
| 18 to 34 Years | 0 (0.0%) | 0 (0.0%) |
| 35 to 64 Years | 62 (4.5%) | 81 (4.5%) |
| 65 to 74 Years | 84 (7.3%) | 44 (3.7%) |
| 75 Years and over | 294 (21.9%) | 237 (16.8%) |
Disability Class: Vision Difficulty
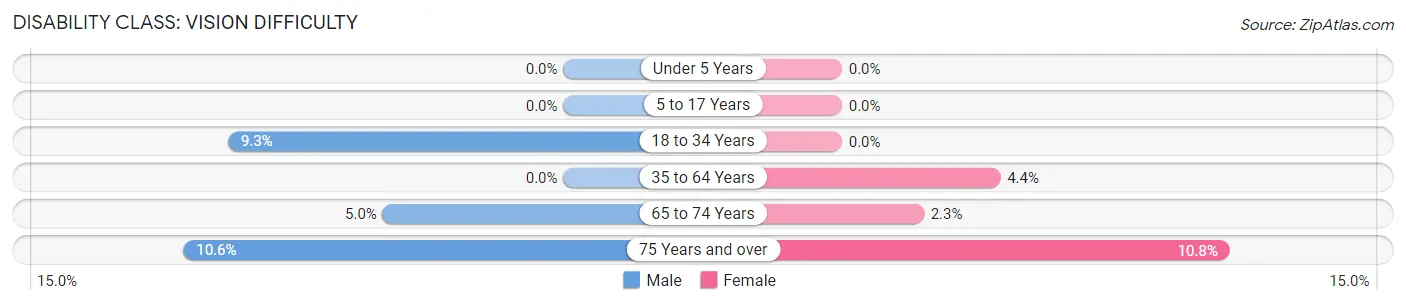
| Age Bracket | Male | Female |
| Under 5 Years | 0 (0.0%) | 0 (0.0%) |
| 5 to 17 Years | 0 (0.0%) | 0 (0.0%) |
| 18 to 34 Years | 45 (9.3%) | 0 (0.0%) |
| 35 to 64 Years | 0 (0.0%) | 80 (4.4%) |
| 65 to 74 Years | 58 (5.0%) | 27 (2.3%) |
| 75 Years and over | 142 (10.6%) | 152 (10.8%) |
Disability Class: Cognitive Difficulty
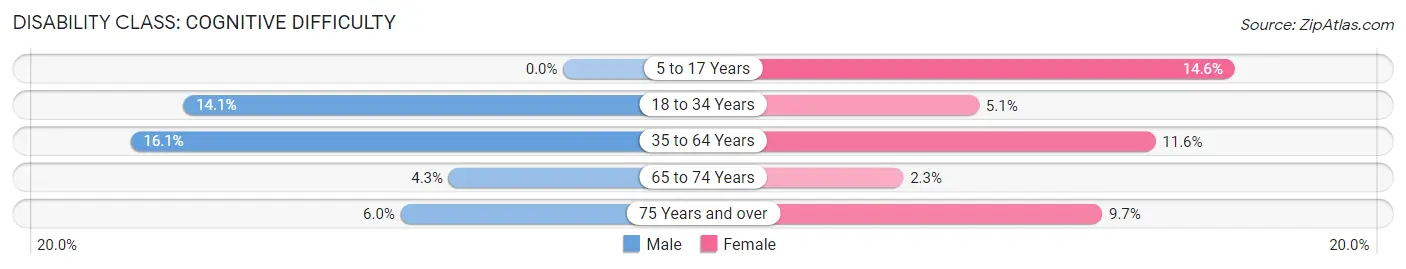
| Age Bracket | Male | Female |
| 5 to 17 Years | 0 (0.0%) | 54 (14.6%) |
| 18 to 34 Years | 68 (14.1%) | 14 (5.1%) |
| 35 to 64 Years | 219 (16.1%) | 211 (11.6%) |
| 65 to 74 Years | 49 (4.3%) | 27 (2.3%) |
| 75 Years and over | 81 (6.0%) | 136 (9.7%) |
Disability Class: Ambulatory Difficulty
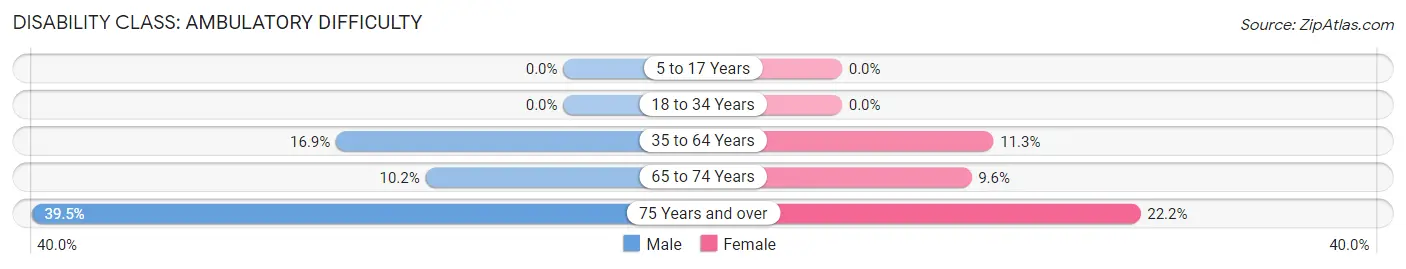
| Age Bracket | Male | Female |
| 5 to 17 Years | 0 (0.0%) | 0 (0.0%) |
| 18 to 34 Years | 0 (0.0%) | 0 (0.0%) |
| 35 to 64 Years | 230 (16.9%) | 204 (11.3%) |
| 65 to 74 Years | 118 (10.2%) | 114 (9.6%) |
| 75 Years and over | 530 (39.5%) | 312 (22.2%) |
Disability Class: Self-Care Difficulty
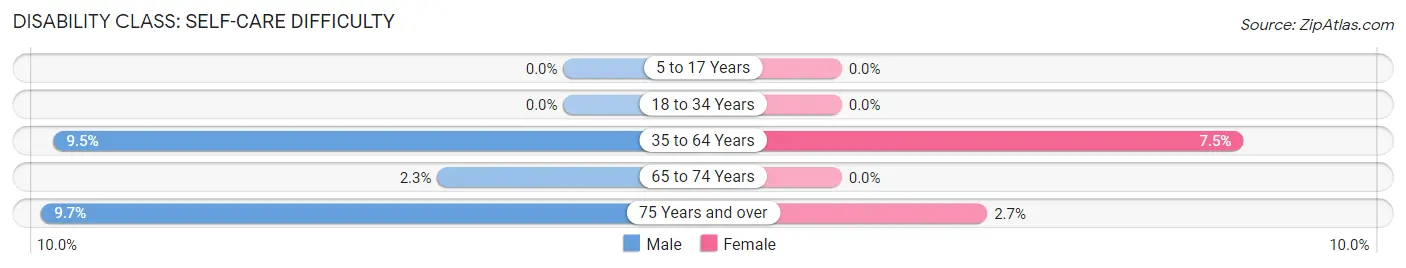
| Age Bracket | Male | Female |
| 5 to 17 Years | 0 (0.0%) | 0 (0.0%) |
| 18 to 34 Years | 0 (0.0%) | 0 (0.0%) |
| 35 to 64 Years | 129 (9.5%) | 135 (7.4%) |
| 65 to 74 Years | 27 (2.3%) | 0 (0.0%) |
| 75 Years and over | 130 (9.7%) | 38 (2.7%) |
Technology Access in Pine Ridge CDP Citrus County
Computing Device Access in Pine Ridge CDP Citrus County
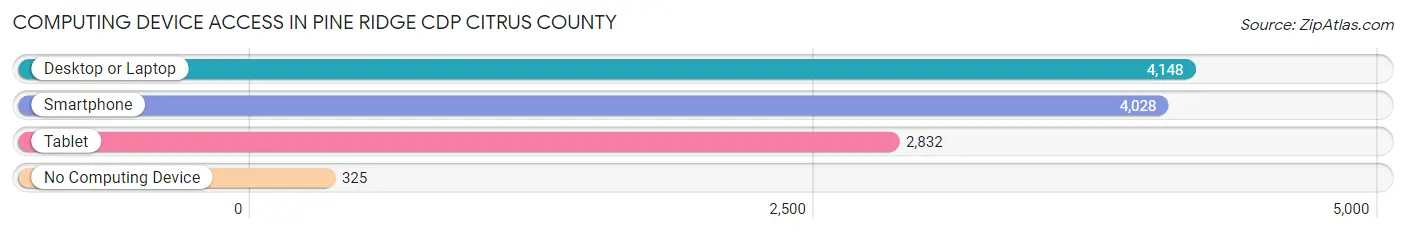
| Device Type | # Households | % Households |
| Desktop or Laptop | 4,148 | 86.6% |
| Smartphone | 4,028 | 84.1% |
| Tablet | 2,832 | 59.2% |
| No Computing Device | 325 | 6.8% |
| Total | 4,788 | 100.0% |
Internet Access in Pine Ridge CDP Citrus County
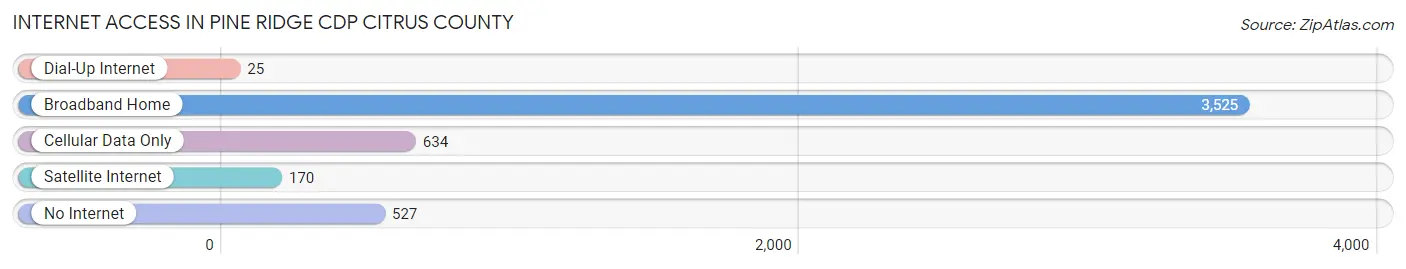
| Internet Type | # Households | % Households |
| Dial-Up Internet | 25 | 0.5% |
| Broadband Home | 3,525 | 73.6% |
| Cellular Data Only | 634 | 13.2% |
| Satellite Internet | 170 | 3.5% |
| No Internet | 527 | 11.0% |
| Total | 4,788 | 100.0% |
Pine Ridge CDP Citrus County Summary
Pine Ridge Cdp is a census-designated place (CDP) located in Citrus County, Florida. It is located in the western part of the county, about 10 miles east of the city of Inverness. The population of Pine Ridge Cdp was 4,845 at the 2010 census.
Geography
Pine Ridge Cdp is located at 28°54'25" North, 82°25'17" West (28.906944, -82.421389). It is situated in the western part of Citrus County, about 10 miles east of the city of Inverness. The terrain is mostly flat, with some rolling hills. The area is mostly wooded, with some open fields and pastures.
The CDP has a total area of 8.3 square miles, of which 8.2 square miles is land and 0.1 square miles is water.
Demographics
As of the 2010 census, there were 4,845 people, 1,945 households, and 1,521 families residing in the CDP. The population density was 590.2 people per square mile. There were 2,093 housing units at an average density of 255.3 per square mile. The racial makeup of the CDP was 97.2% White, 0.7% African American, 0.3% Native American, 0.4% Asian, 0.1% Pacific Islander, 0.4% from other races, and 0.9% from two or more races. Hispanic or Latino of any race were 3.2% of the population.
There were 1,945 households, out of which 22.3% had children under the age of 18 living with them, 63.2% were married couples living together, 8.2% had a female householder with no husband present, and 24.7% were non-families. 20.2% of all households were made up of individuals, and 10.2% had someone living alone who was 65 years of age or older. The average household size was 2.49 and the average family size was 2.84.
In the CDP, the population was spread out, with 19.7% under the age of 18, 5.3% from 18 to 24, 19.3% from 25 to 44, 32.2% from 45 to 64, and 23.5% who were 65 years of age or older. The median age was 49 years. For every 100 females, there were 97.2 males. For every 100 females age 18 and over, there were 94.3 males.
The median income for a household in the CDP was $45,938, and the median income for a family was $51,964. Males had a median income of $37,917 versus $25,938 for females. The per capita income for the CDP was $22,945. About 4.3% of families and 6.2% of the population were below the poverty line, including 8.2% of those under age 18 and 4.2% of those age 65 or over.
Economy
The economy of Pine Ridge Cdp is largely based on agriculture and tourism. The area is home to several farms, which produce a variety of crops, including citrus, vegetables, and hay. The area is also home to several tourist attractions, including the Homosassa Springs Wildlife State Park, the Crystal River National Wildlife Refuge, and the Withlacoochee State Forest.
The area is also home to several businesses, including restaurants, retail stores, and service providers. The area is served by the Citrus County School District, which operates several elementary, middle, and high schools in the area.
Conclusion
Pine Ridge Cdp is a census-designated place located in Citrus County, Florida. It is located in the western part of the county, about 10 miles east of the city of Inverness. The population of Pine Ridge Cdp was 4,845 at the 2010 census. The economy of Pine Ridge Cdp is largely based on agriculture and tourism. The area is home to several farms, which produce a variety of crops, including citrus, vegetables, and hay. The area is also home to several tourist attractions, including the Homosassa Springs Wildlife State Park, the Crystal River National Wildlife Refuge, and the Withlacoochee State Forest. The area is also home to several businesses, including restaurants, retail stores, and service providers. The area is served by the Citrus County School District, which operates several elementary, middle, and high schools in the area.
Common Questions
What is Per Capita Income in Pine Ridge CDP Citrus County?
Per Capita income in Pine Ridge CDP Citrus County is $40,932.
What is the Median Family Income in Pine Ridge CDP Citrus County?
Median Family Income in Pine Ridge CDP Citrus County is $75,233.
What is the Median Household income in Pine Ridge CDP Citrus County?
Median Household Income in Pine Ridge CDP Citrus County is $65,522.
What is Income or Wage Gap in Pine Ridge CDP Citrus County?
Income or Wage Gap in Pine Ridge CDP Citrus County is 10.0%.
Women in Pine Ridge CDP Citrus County earn 90.0 cents for every dollar earned by a man.
What is Inequality or Gini Index in Pine Ridge CDP Citrus County?
Inequality or Gini Index in Pine Ridge CDP Citrus County is 0.46.
What is the Total Population of Pine Ridge CDP Citrus County?
Total Population of Pine Ridge CDP Citrus County is 10,269.
What is the Total Male Population of Pine Ridge CDP Citrus County?
Total Male Population of Pine Ridge CDP Citrus County is 5,013.
What is the Total Female Population of Pine Ridge CDP Citrus County?
Total Female Population of Pine Ridge CDP Citrus County is 5,256.
What is the Ratio of Males per 100 Females in Pine Ridge CDP Citrus County?
There are 95.38 Males per 100 Females in Pine Ridge CDP Citrus County.
What is the Ratio of Females per 100 Males in Pine Ridge CDP Citrus County?
There are 104.85 Females per 100 Males in Pine Ridge CDP Citrus County.
What is the Median Population Age in Pine Ridge CDP Citrus County?
Median Population Age in Pine Ridge CDP Citrus County is 65.0 Years.
What is the Average Family Size in Pine Ridge CDP Citrus County
Average Family Size in Pine Ridge CDP Citrus County is 2.5 People.
What is the Average Household Size in Pine Ridge CDP Citrus County
Average Household Size in Pine Ridge CDP Citrus County is 2.1 People.
How Large is the Labor Force in Pine Ridge CDP Citrus County?
There are 2,838 People in the Labor Forcein in Pine Ridge CDP Citrus County.
What is the Percentage of People in the Labor Force in Pine Ridge CDP Citrus County?
30.5% of People are in the Labor Force in Pine Ridge CDP Citrus County.
What is the Unemployment Rate in Pine Ridge CDP Citrus County?
Unemployment Rate in Pine Ridge CDP Citrus County is 5.1%.