Hillcrest Heights, FL Map & Demographics
Hillcrest Heights Map
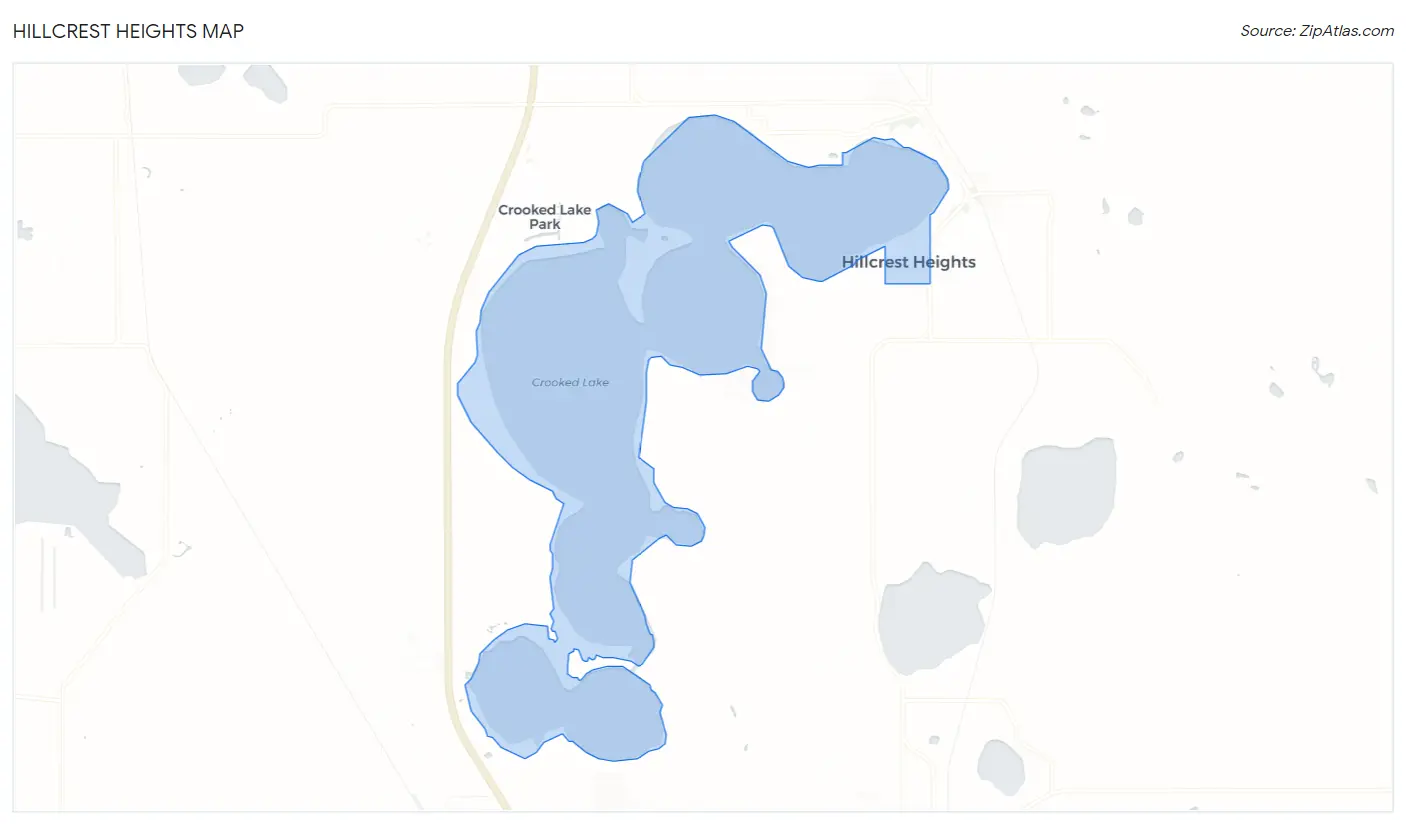
Hillcrest Heights Overview
$38,677
PER CAPITA INCOME
$110,893
AVG FAMILY INCOME
$110,536
AVG HOUSEHOLD INCOME
44.5%
WAGE / INCOME GAP [ % ]
55.5¢/ $1
WAGE / INCOME GAP [ $ ]
0.30
INEQUALITY / GINI INDEX
360
TOTAL POPULATION
171
MALE POPULATION
189
FEMALE POPULATION
90.48
MALES / 100 FEMALES
110.53
FEMALES / 100 MALES
55.2
MEDIAN AGE
3.4
AVG FAMILY SIZE
3.2
AVG HOUSEHOLD SIZE
163
LABOR FORCE [ PEOPLE ]
56.2%
PERCENT IN LABOR FORCE
1.8%
UNEMPLOYMENT RATE
Hillcrest Heights Area Codes
Income in Hillcrest Heights
Income Overview in Hillcrest Heights
Per Capita Income in Hillcrest Heights is $38,677, while median incomes of families and households are $110,893 and $110,536 respectively.
| Characteristic | Number | Measure |
| Per Capita Income | 360 | $38,677 |
| Median Family Income | 102 | $110,893 |
| Mean Family Income | 102 | $124,374 |
| Median Household Income | 114 | $110,536 |
| Mean Household Income | 114 | $118,054 |
| Income Deficit | 102 | $0 |
| Wage / Income Gap (%) | 360 | 44.46% |
| Wage / Income Gap ($) | 360 | 55.54¢ per $1 |
| Gini / Inequality Index | 360 | 0.30 |
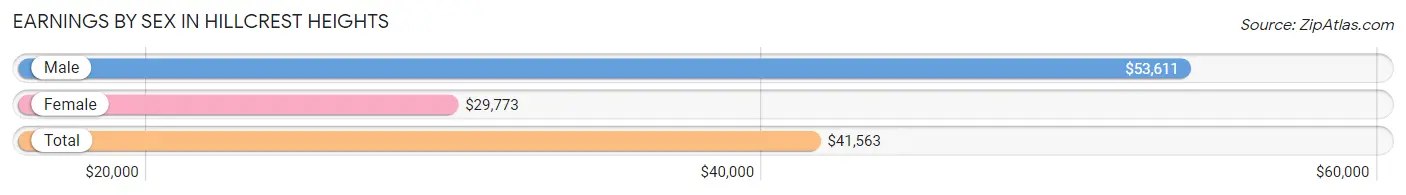
Earnings by Sex in Hillcrest Heights
Average Earnings in Hillcrest Heights are $41,563, $53,611 for men and $29,773 for women, a difference of 44.5%.
| Sex | Number | Average Earnings |
| Male | 102 (61.5%) | $53,611 |
| Female | 64 (38.6%) | $29,773 |
| Total | 166 (100.0%) | $41,563 |
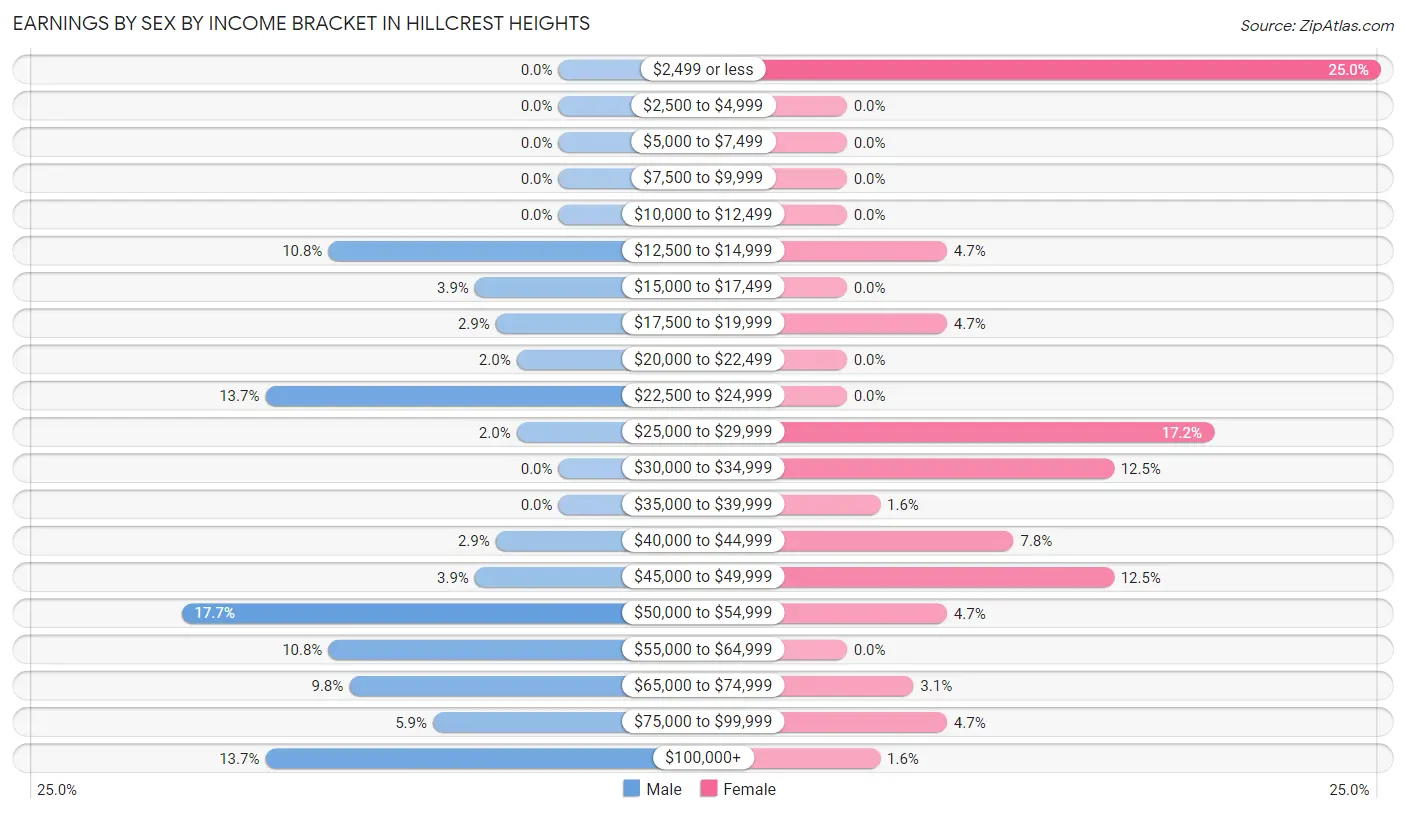
Earnings by Sex by Income Bracket in Hillcrest Heights
The most common earnings brackets in Hillcrest Heights are $50,000 to $54,999 for men (18 | 17.6%) and $2,499 or less for women (16 | 25.0%).
| Income | Male | Female |
| $2,499 or less | 0 (0.0%) | 16 (25.0%) |
| $2,500 to $4,999 | 0 (0.0%) | 0 (0.0%) |
| $5,000 to $7,499 | 0 (0.0%) | 0 (0.0%) |
| $7,500 to $9,999 | 0 (0.0%) | 0 (0.0%) |
| $10,000 to $12,499 | 0 (0.0%) | 0 (0.0%) |
| $12,500 to $14,999 | 11 (10.8%) | 3 (4.7%) |
| $15,000 to $17,499 | 4 (3.9%) | 0 (0.0%) |
| $17,500 to $19,999 | 3 (2.9%) | 3 (4.7%) |
| $20,000 to $22,499 | 2 (2.0%) | 0 (0.0%) |
| $22,500 to $24,999 | 14 (13.7%) | 0 (0.0%) |
| $25,000 to $29,999 | 2 (2.0%) | 11 (17.2%) |
| $30,000 to $34,999 | 0 (0.0%) | 8 (12.5%) |
| $35,000 to $39,999 | 0 (0.0%) | 1 (1.6%) |
| $40,000 to $44,999 | 3 (2.9%) | 5 (7.8%) |
| $45,000 to $49,999 | 4 (3.9%) | 8 (12.5%) |
| $50,000 to $54,999 | 18 (17.6%) | 3 (4.7%) |
| $55,000 to $64,999 | 11 (10.8%) | 0 (0.0%) |
| $65,000 to $74,999 | 10 (9.8%) | 2 (3.1%) |
| $75,000 to $99,999 | 6 (5.9%) | 3 (4.7%) |
| $100,000+ | 14 (13.7%) | 1 (1.6%) |
| Total | 102 (100.0%) | 64 (100.0%) |
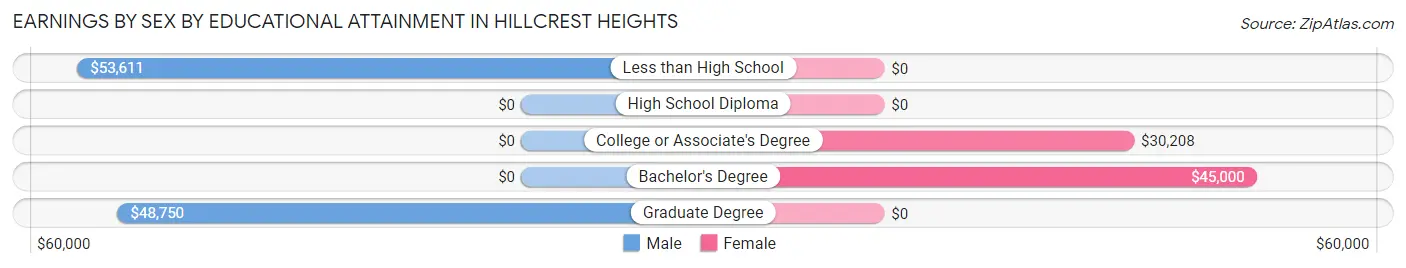
Earnings by Sex by Educational Attainment in Hillcrest Heights
Average earnings in Hillcrest Heights are $53,819 for men and $32,083 for women, a difference of 40.4%. Men with an educational attainment of less than high school enjoy the highest average annual earnings of $53,611, while those with graduate degree education earn the least with $48,750. Women with an educational attainment of bachelor's degree earn the most with the average annual earnings of $45,000, while those with college or associate's degree education have the smallest earnings of $30,208.
| Educational Attainment | Male Income | Female Income |
| Less than High School | $53,611 | $0 |
| High School Diploma | - | - |
| College or Associate's Degree | - | - |
| Bachelor's Degree | - | - |
| Graduate Degree | $48,750 | $0 |
| Total | $53,819 | $32,083 |
Family Income in Hillcrest Heights
Family Income Brackets in Hillcrest Heights
According to the Hillcrest Heights family income data, there are 37 families falling into the $100,000 to $149,999 income range, which is the most common income bracket and makes up 36.3% of all families.
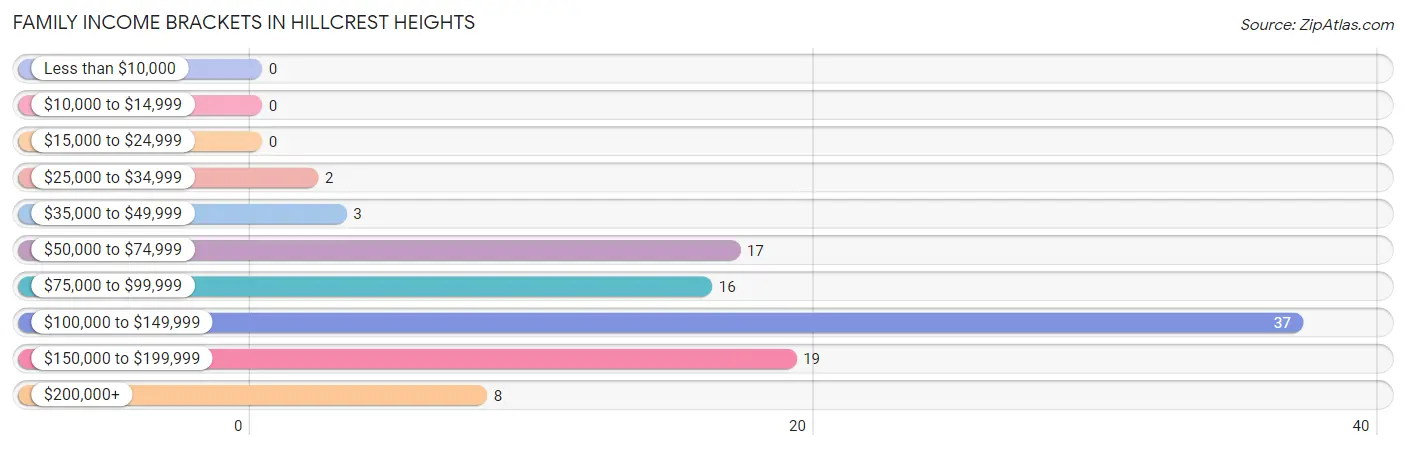
| Income Bracket | # Families | % Families |
| Less than $10,000 | 0 | 0.0% |
| $10,000 to $14,999 | 0 | 0.0% |
| $15,000 to $24,999 | 0 | 0.0% |
| $25,000 to $34,999 | 2 | 2.0% |
| $35,000 to $49,999 | 3 | 2.9% |
| $50,000 to $74,999 | 17 | 16.7% |
| $75,000 to $99,999 | 16 | 15.7% |
| $100,000 to $149,999 | 37 | 36.3% |
| $150,000 to $199,999 | 19 | 18.6% |
| $200,000+ | 8 | 7.8% |
Family Income by Famaliy Size in Hillcrest Heights
2-person families (50 | 49.0%) account for the highest median family income in Hillcrest Heights with $133,750 per family, while 2-person families (50 | 49.0%) have the highest median income of $66,875 per family member.
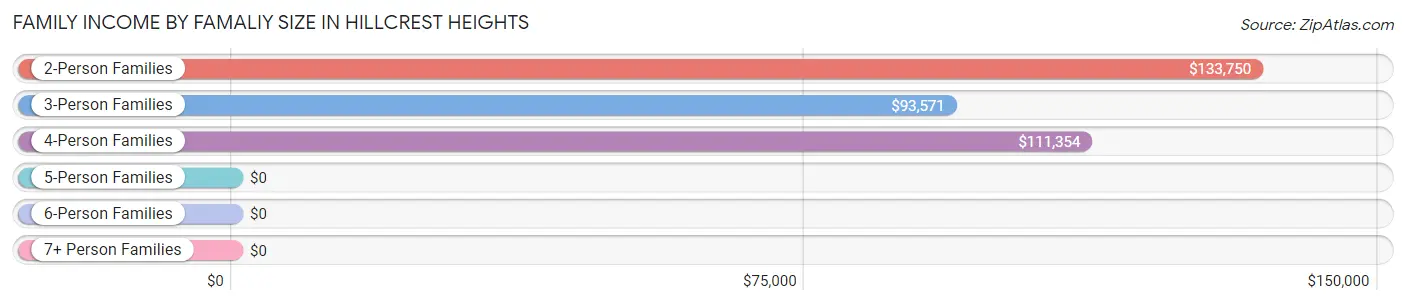
| Income Bracket | # Families | Median Income |
| 2-Person Families | 50 (49.0%) | $133,750 |
| 3-Person Families | 20 (19.6%) | $93,571 |
| 4-Person Families | 19 (18.6%) | $111,354 |
| 5-Person Families | 7 (6.9%) | $0 |
| 6-Person Families | 6 (5.9%) | $0 |
| 7+ Person Families | 0 (0.0%) | $0 |
| Total | 102 (100.0%) | $110,893 |
Family Income by Number of Earners in Hillcrest Heights
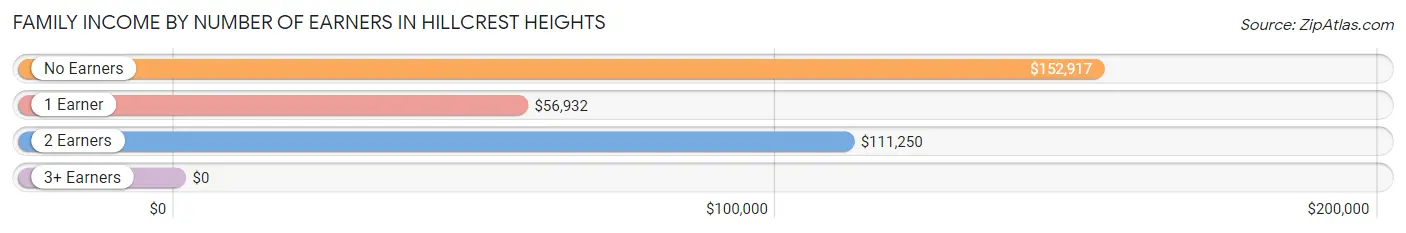
| Number of Earners | # Families | Median Income |
| No Earners | 25 (24.5%) | $152,917 |
| 1 Earner | 23 (22.6%) | $56,932 |
| 2 Earners | 42 (41.2%) | $111,250 |
| 3+ Earners | 12 (11.8%) | $0 |
| Total | 102 (100.0%) | $110,893 |
Household Income in Hillcrest Heights
Household Income Brackets in Hillcrest Heights
With 41 households falling in the category, the $100,000 to $149,999 income range is the most frequent in Hillcrest Heights, accounting for 36.0% of all households.
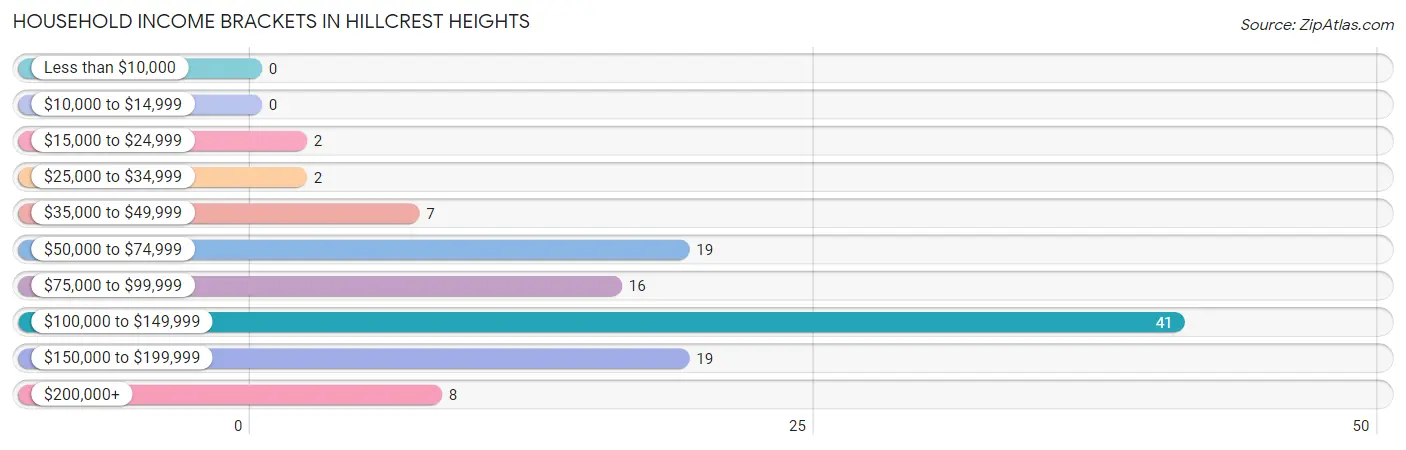
| Income Bracket | # Households | % Households |
| Less than $10,000 | 0 | 0.0% |
| $10,000 to $14,999 | 0 | 0.0% |
| $15,000 to $24,999 | 2 | 1.8% |
| $25,000 to $34,999 | 2 | 1.8% |
| $35,000 to $49,999 | 7 | 6.1% |
| $50,000 to $74,999 | 19 | 16.7% |
| $75,000 to $99,999 | 16 | 14.0% |
| $100,000 to $149,999 | 41 | 36.0% |
| $150,000 to $199,999 | 19 | 16.7% |
| $200,000+ | 8 | 7.0% |
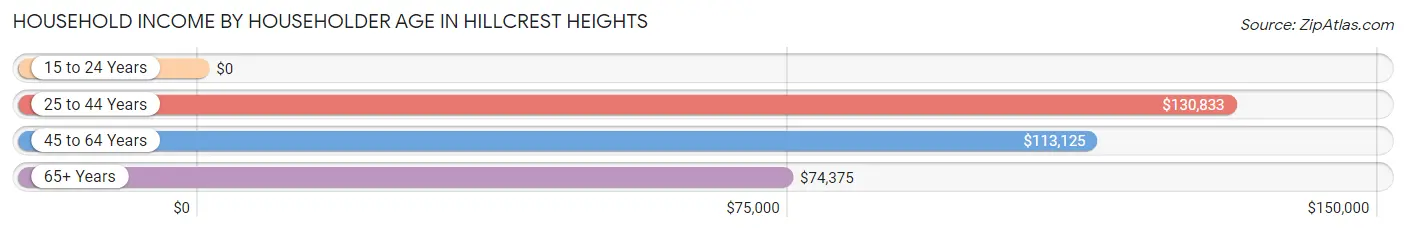
Household Income by Householder Age in Hillcrest Heights
The median household income in Hillcrest Heights is $110,536, with the highest median household income of $130,833 found in the 25 to 44 years age bracket for the primary householder. A total of 20 households (17.5%) fall into this category.
| Income Bracket | # Households | Median Income |
| 15 to 24 Years | 0 (0.0%) | $0 |
| 25 to 44 Years | 20 (17.5%) | $130,833 |
| 45 to 64 Years | 55 (48.2%) | $113,125 |
| 65+ Years | 39 (34.2%) | $74,375 |
| Total | 114 (100.0%) | $110,536 |
Poverty in Hillcrest Heights
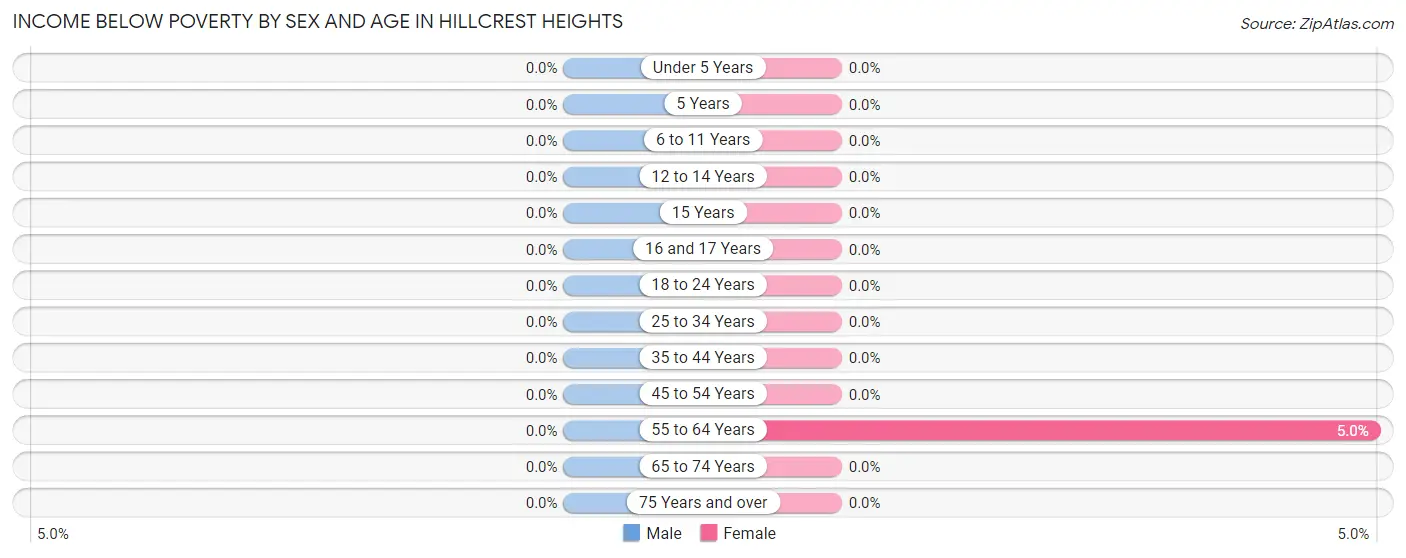
Income Below Poverty by Sex and Age in Hillcrest Heights
| Age Bracket | Male | Female |
| Under 5 Years | 0 (0.0%) | 0 (0.0%) |
| 5 Years | 0 (0.0%) | 0 (0.0%) |
| 6 to 11 Years | 0 (0.0%) | 0 (0.0%) |
| 12 to 14 Years | 0 (0.0%) | 0 (0.0%) |
| 15 Years | 0 (0.0%) | 0 (0.0%) |
| 16 and 17 Years | 0 (0.0%) | 0 (0.0%) |
| 18 to 24 Years | 0 (0.0%) | 0 (0.0%) |
| 25 to 34 Years | 0 (0.0%) | 0 (0.0%) |
| 35 to 44 Years | 0 (0.0%) | 0 (0.0%) |
| 45 to 54 Years | 0 (0.0%) | 0 (0.0%) |
| 55 to 64 Years | 0 (0.0%) | 2 (5.0%) |
| 65 to 74 Years | 0 (0.0%) | 0 (0.0%) |
| 75 Years and over | 0 (0.0%) | 0 (0.0%) |
| Total | 0 (0.0%) | 2 (1.1%) |
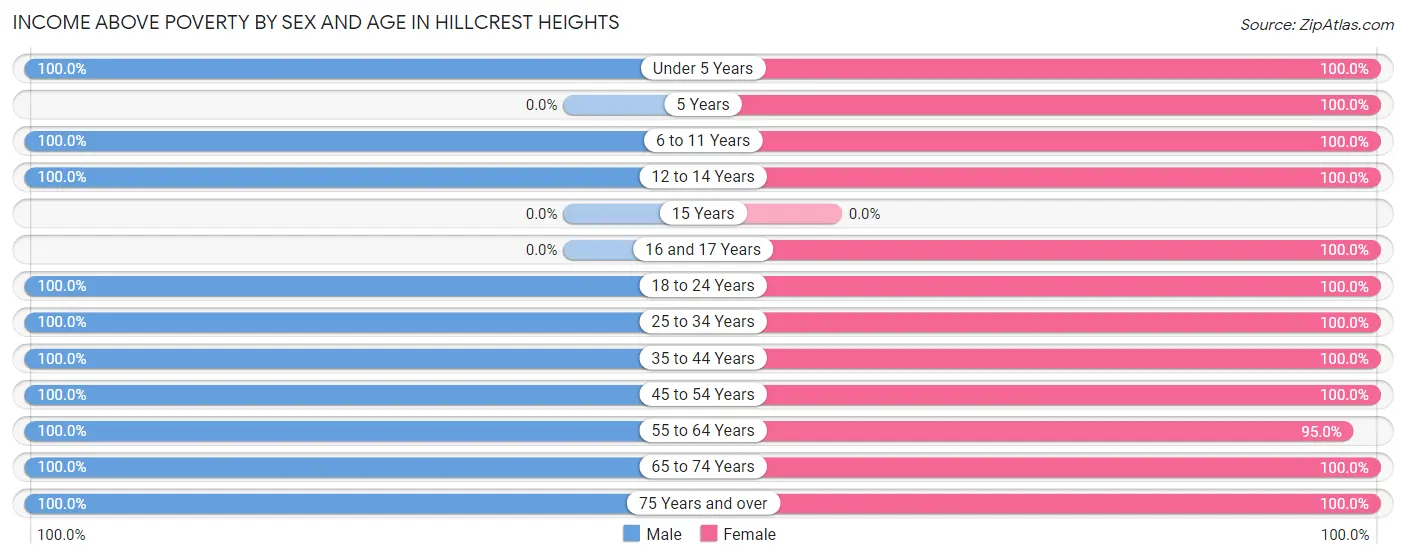
Income Above Poverty by Sex and Age in Hillcrest Heights
According to the poverty statistics in Hillcrest Heights, males aged under 5 years and females aged under 5 years are the age groups that are most secure financially, with 100.0% of males and 100.0% of females in these age groups living above the poverty line.
| Age Bracket | Male | Female |
| Under 5 Years | 17 (100.0%) | 3 (100.0%) |
| 5 Years | 0 (0.0%) | 6 (100.0%) |
| 6 to 11 Years | 18 (100.0%) | 23 (100.0%) |
| 12 to 14 Years | 1 (100.0%) | 2 (100.0%) |
| 15 Years | 0 (0.0%) | 0 (0.0%) |
| 16 and 17 Years | 0 (0.0%) | 5 (100.0%) |
| 18 to 24 Years | 3 (100.0%) | 12 (100.0%) |
| 25 to 34 Years | 10 (100.0%) | 15 (100.0%) |
| 35 to 44 Years | 13 (100.0%) | 20 (100.0%) |
| 45 to 54 Years | 21 (100.0%) | 7 (100.0%) |
| 55 to 64 Years | 49 (100.0%) | 38 (95.0%) |
| 65 to 74 Years | 21 (100.0%) | 40 (100.0%) |
| 75 Years and over | 18 (100.0%) | 16 (100.0%) |
| Total | 171 (100.0%) | 187 (98.9%) |
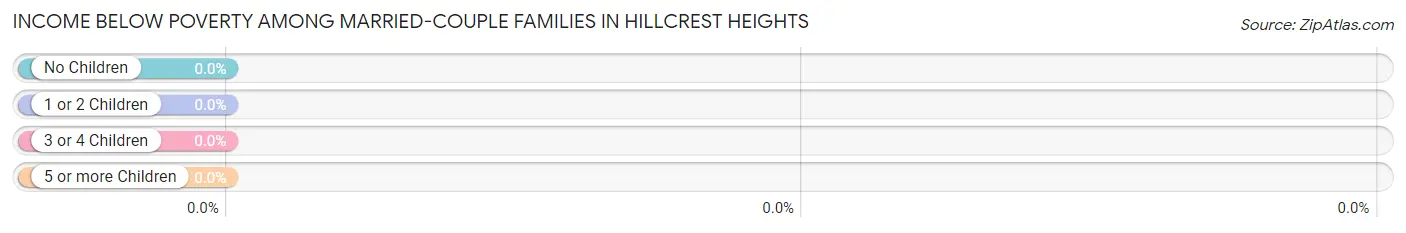
Income Below Poverty Among Married-Couple Families in Hillcrest Heights
| Children | Above Poverty | Below Poverty |
| No Children | 70 (100.0%) | 0 (0.0%) |
| 1 or 2 Children | 16 (100.0%) | 0 (0.0%) |
| 3 or 4 Children | 13 (100.0%) | 0 (0.0%) |
| 5 or more Children | 0 (0.0%) | 0 (0.0%) |
| Total | 99 (100.0%) | 0 (0.0%) |
Income Below Poverty Among Single-Parent Households in Hillcrest Heights
| Children | Single Father | Single Mother |
| No Children | 0 (0.0%) | 0 (0.0%) |
| 1 or 2 Children | 0 (0.0%) | 0 (0.0%) |
| 3 or 4 Children | 0 (0.0%) | 0 (0.0%) |
| 5 or more Children | 0 (0.0%) | 0 (0.0%) |
| Total | 0 (0.0%) | 0 (0.0%) |
Income Below Poverty Among Married-Couple vs Single-Parent Households in Hillcrest Heights
| Children | Married-Couple Families | Single-Parent Households |
| No Children | 0 (0.0%) | 0 (0.0%) |
| 1 or 2 Children | 0 (0.0%) | 0 (0.0%) |
| 3 or 4 Children | 0 (0.0%) | 0 (0.0%) |
| 5 or more Children | 0 (0.0%) | 0 (0.0%) |
| Total | 0 (0.0%) | 0 (0.0%) |
Race in Hillcrest Heights
The most populous races in Hillcrest Heights are White / Caucasian (289 | 80.3%), Some other Race (29 | 8.1%), and Black / African American (26 | 7.2%).
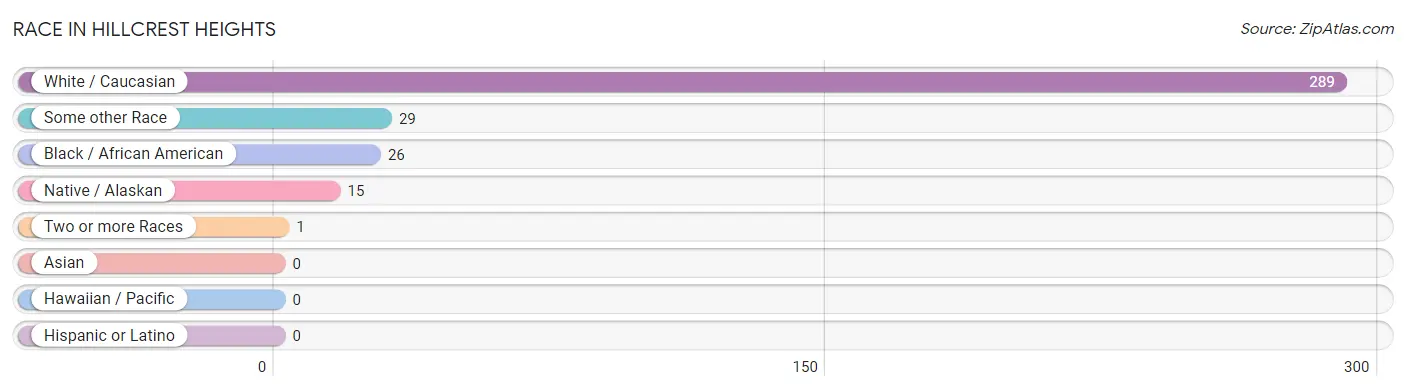
| Race | # Population | % Population |
| Asian | 0 | 0.0% |
| Black / African American | 26 | 7.2% |
| Hawaiian / Pacific | 0 | 0.0% |
| Hispanic or Latino | 0 | 0.0% |
| Native / Alaskan | 15 | 4.2% |
| White / Caucasian | 289 | 80.3% |
| Two or more Races | 1 | 0.3% |
| Some other Race | 29 | 8.1% |
| Total | 360 | 100.0% |
Ancestry in Hillcrest Heights
The most populous ancestries reported in Hillcrest Heights are English (58 | 16.1%), German (37 | 10.3%), Irish (30 | 8.3%), Italian (19 | 5.3%), and Scottish (18 | 5.0%), together accounting for 45.0% of all Hillcrest Heights residents.
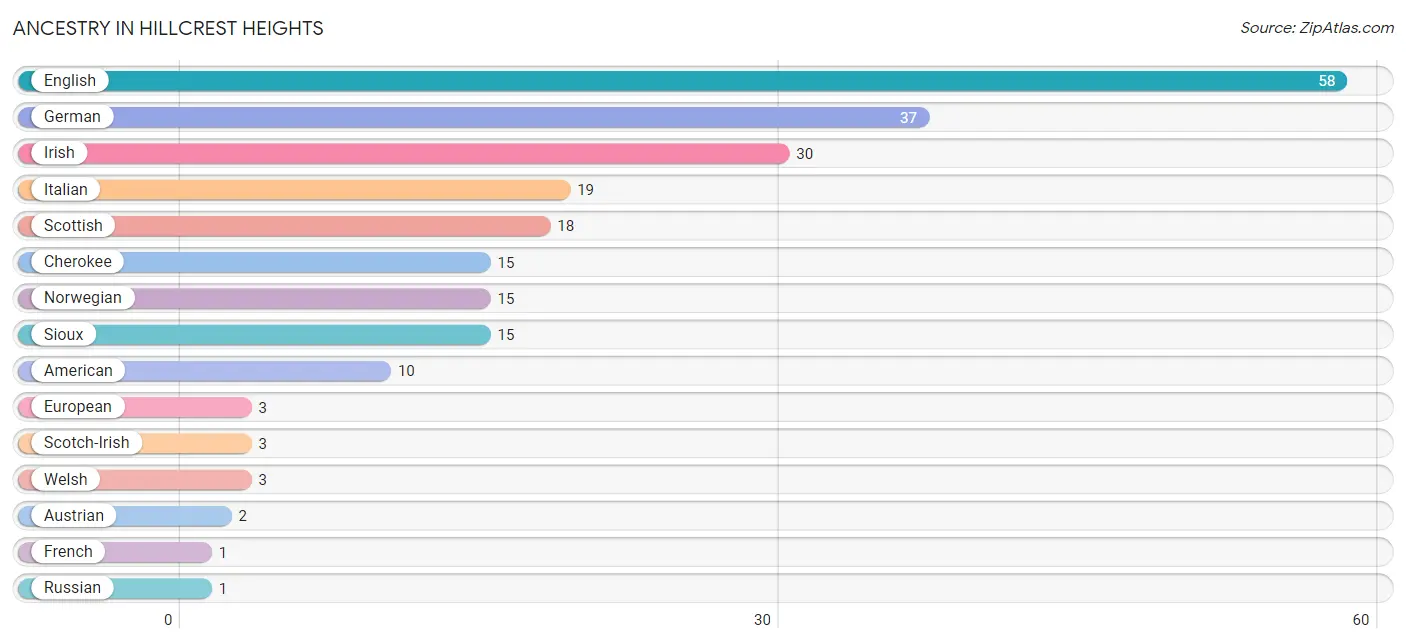
| Ancestry | # Population | % Population |
| American | 10 | 2.8% |
| Austrian | 2 | 0.6% |
| Cherokee | 15 | 4.2% |
| English | 58 | 16.1% |
| European | 3 | 0.8% |
| French | 1 | 0.3% |
| German | 37 | 10.3% |
| Irish | 30 | 8.3% |
| Italian | 19 | 5.3% |
| Norwegian | 15 | 4.2% |
| Russian | 1 | 0.3% |
| Scotch-Irish | 3 | 0.8% |
| Scottish | 18 | 5.0% |
| Sioux | 15 | 4.2% |
| Swedish | 1 | 0.3% |
| Welsh | 3 | 0.8% | View All 16 Rows |
Immigrants in Hillcrest Heights
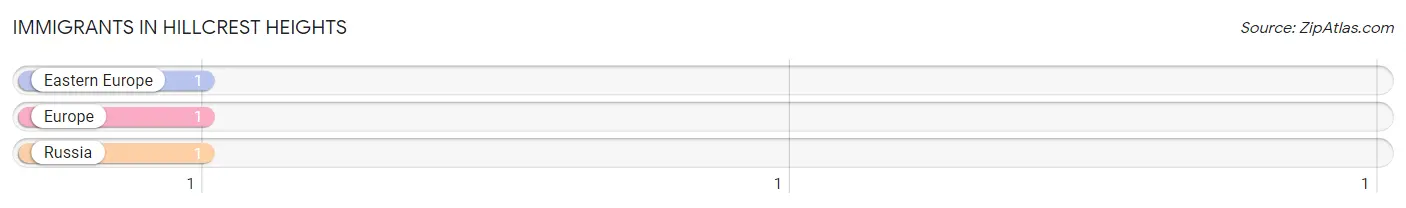
The most numerous immigrant groups reported in Hillcrest Heights came from Eastern Europe (1 | 0.3%), Europe (1 | 0.3%), and Russia (1 | 0.3%), together accounting for 0.8% of all Hillcrest Heights residents.
| Immigration Origin | # Population | % Population |
| Eastern Europe | 1 | 0.3% |
| Europe | 1 | 0.3% |
| Russia | 1 | 0.3% | View All 3 Rows |
Sex and Age in Hillcrest Heights
Sex and Age in Hillcrest Heights
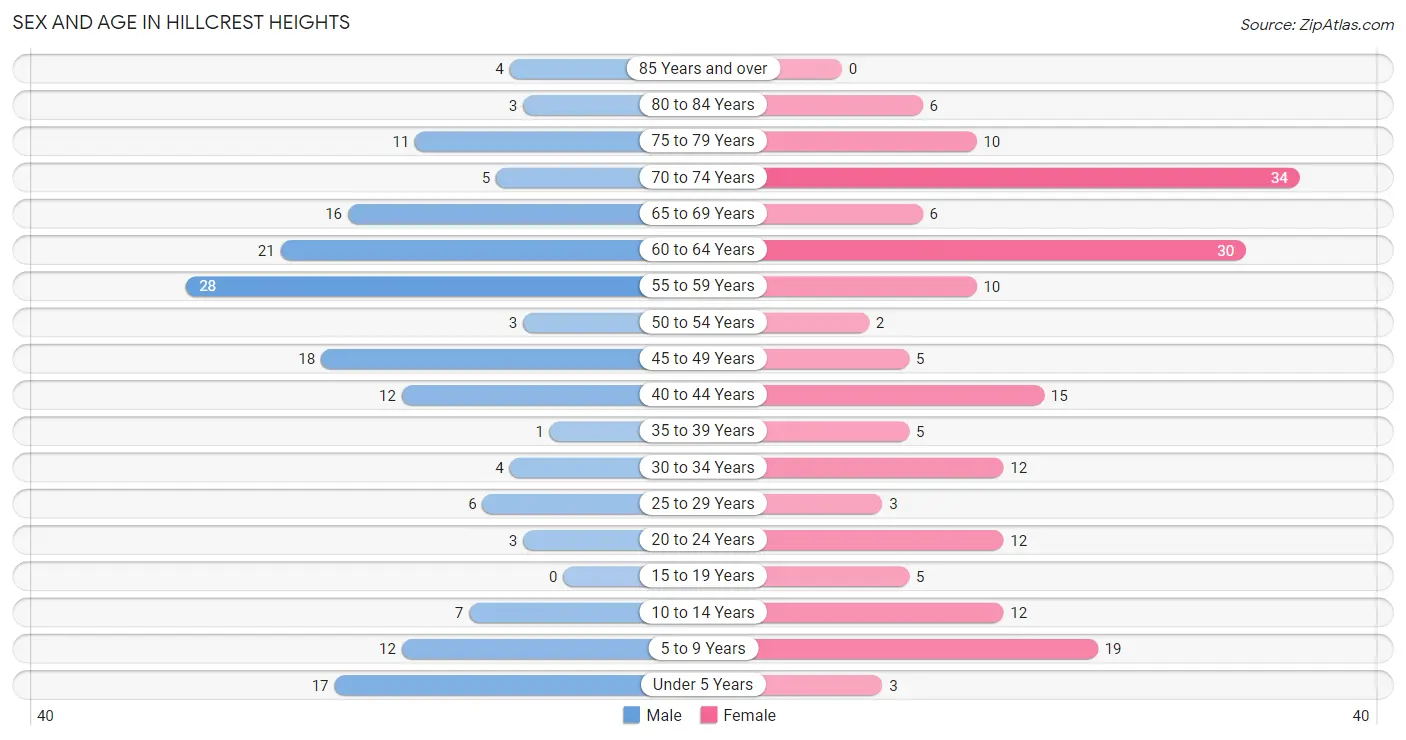
The most populous age groups in Hillcrest Heights are 55 to 59 Years (28 | 16.4%) for men and 70 to 74 Years (34 | 18.0%) for women.
| Age Bracket | Male | Female |
| Under 5 Years | 17 (9.9%) | 3 (1.6%) |
| 5 to 9 Years | 12 (7.0%) | 19 (10.1%) |
| 10 to 14 Years | 7 (4.1%) | 12 (6.4%) |
| 15 to 19 Years | 0 (0.0%) | 5 (2.6%) |
| 20 to 24 Years | 3 (1.8%) | 12 (6.4%) |
| 25 to 29 Years | 6 (3.5%) | 3 (1.6%) |
| 30 to 34 Years | 4 (2.3%) | 12 (6.4%) |
| 35 to 39 Years | 1 (0.6%) | 5 (2.6%) |
| 40 to 44 Years | 12 (7.0%) | 15 (7.9%) |
| 45 to 49 Years | 18 (10.5%) | 5 (2.6%) |
| 50 to 54 Years | 3 (1.8%) | 2 (1.1%) |
| 55 to 59 Years | 28 (16.4%) | 10 (5.3%) |
| 60 to 64 Years | 21 (12.3%) | 30 (15.9%) |
| 65 to 69 Years | 16 (9.4%) | 6 (3.2%) |
| 70 to 74 Years | 5 (2.9%) | 34 (18.0%) |
| 75 to 79 Years | 11 (6.4%) | 10 (5.3%) |
| 80 to 84 Years | 3 (1.8%) | 6 (3.2%) |
| 85 Years and over | 4 (2.3%) | 0 (0.0%) |
| Total | 171 (100.0%) | 189 (100.0%) |
Families and Households in Hillcrest Heights
Median Family Size in Hillcrest Heights
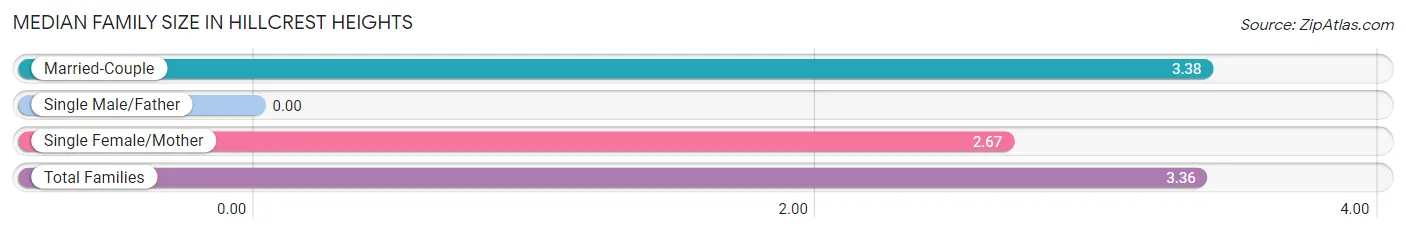
| Family Type | # Families | Family Size |
| Married-Couple | 99 (97.1%) | 3.38 |
| Single Male/Father | 0 (0.0%) | - |
| Single Female/Mother | 3 (2.9%) | 2.67 |
| Total Families | 102 (100.0%) | 3.36 |
Median Household Size in Hillcrest Heights
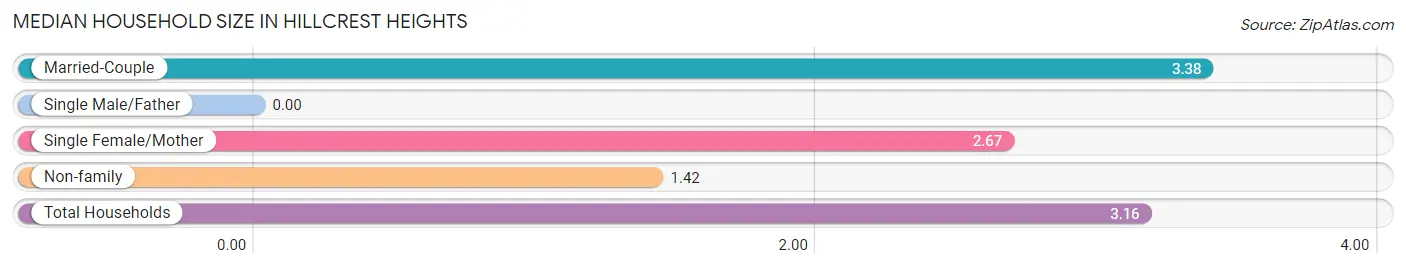
| Household Type | # Households | Household Size |
| Married-Couple | 99 (86.8%) | 3.38 |
| Single Male/Father | 0 (0.0%) | - |
| Single Female/Mother | 3 (2.6%) | 2.67 |
| Non-family | 12 (10.5%) | 1.42 |
| Total Households | 114 (100.0%) | 3.16 |
Household Size by Marriage Status in Hillcrest Heights
Out of a total of 114 households in Hillcrest Heights, 102 (89.5%) are family households, while 12 (10.5%) are nonfamily households. The most numerous type of family households are 2-person households, comprising 50, and the most common type of nonfamily households are 1-person households, comprising 8.
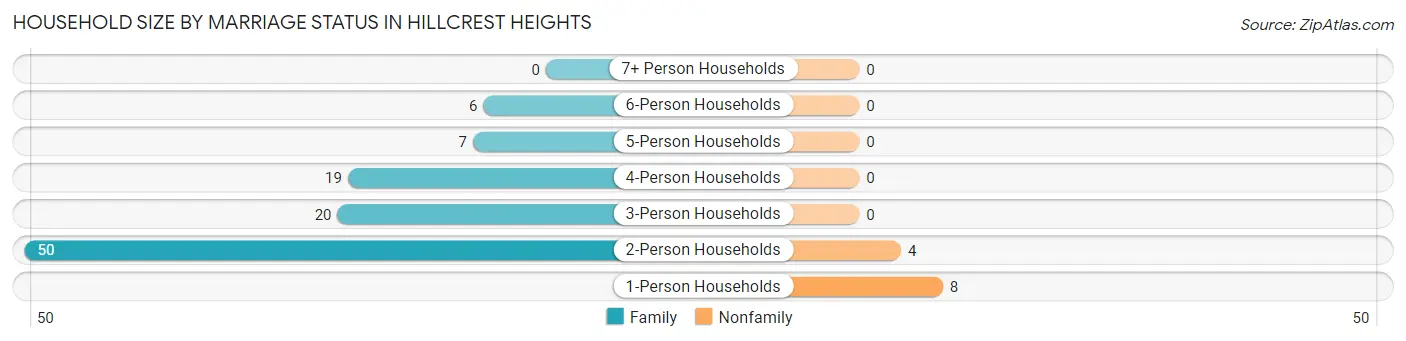
| Household Size | Family Households | Nonfamily Households |
| 1-Person Households | - | 8 (7.0%) |
| 2-Person Households | 50 (43.9%) | 4 (3.5%) |
| 3-Person Households | 20 (17.5%) | 0 (0.0%) |
| 4-Person Households | 19 (16.7%) | 0 (0.0%) |
| 5-Person Households | 7 (6.1%) | 0 (0.0%) |
| 6-Person Households | 6 (5.3%) | 0 (0.0%) |
| 7+ Person Households | 0 (0.0%) | 0 (0.0%) |
| Total | 102 (89.5%) | 12 (10.5%) |
Female Fertility in Hillcrest Heights
Fertility by Age in Hillcrest Heights
| Age Bracket | Women with Births | Births / 1,000 Women |
| 15 to 19 years | 0 (0.0%) | 0.0 |
| 20 to 34 years | 0 (0.0%) | 0.0 |
| 35 to 50 years | 0 (0.0%) | 0.0 |
| Total | 0 (0.0%) | 0.0 |
Fertility by Age by Marriage Status in Hillcrest Heights
| Age Bracket | Married | Unmarried |
| 15 to 19 years | 0 (0.0%) | 0 (0.0%) |
| 20 to 34 years | 0 (0.0%) | 0 (0.0%) |
| 35 to 50 years | 0 (0.0%) | 0 (0.0%) |
| Total | 0 (0.0%) | 0 (0.0%) |
Fertility by Education in Hillcrest Heights
| Educational Attainment | Women with Births | Births / 1,000 Women |
| Less than High School | 0 (0.0%) | 0.0 |
| High School Diploma | 0 (0.0%) | 0.0 |
| College or Associate's Degree | 0 (0.0%) | 0.0 |
| Bachelor's Degree | 0 (0.0%) | 0.0 |
| Graduate Degree | 0 (0.0%) | 0.0 |
| Total | 0 (0.0%) | 0.0 |
Fertility by Education by Marriage Status in Hillcrest Heights
| Educational Attainment | Married | Unmarried |
| Less than High School | 0 (0.0%) | 0 (0.0%) |
| High School Diploma | 0 (0.0%) | 0 (0.0%) |
| College or Associate's Degree | 0 (0.0%) | 0 (0.0%) |
| Bachelor's Degree | 0 (0.0%) | 0 (0.0%) |
| Graduate Degree | 0 (0.0%) | 0 (0.0%) |
| Total | 0 (0.0%) | 0 (0.0%) |
Employment Characteristics in Hillcrest Heights
Employment by Class of Employer in Hillcrest Heights
Among the 160 employed individuals in Hillcrest Heights, private company employees (57 | 35.6%), local government employees (27 | 16.9%), and self-employed (incorporated) (25 | 15.6%) make up the most common classes of employment.
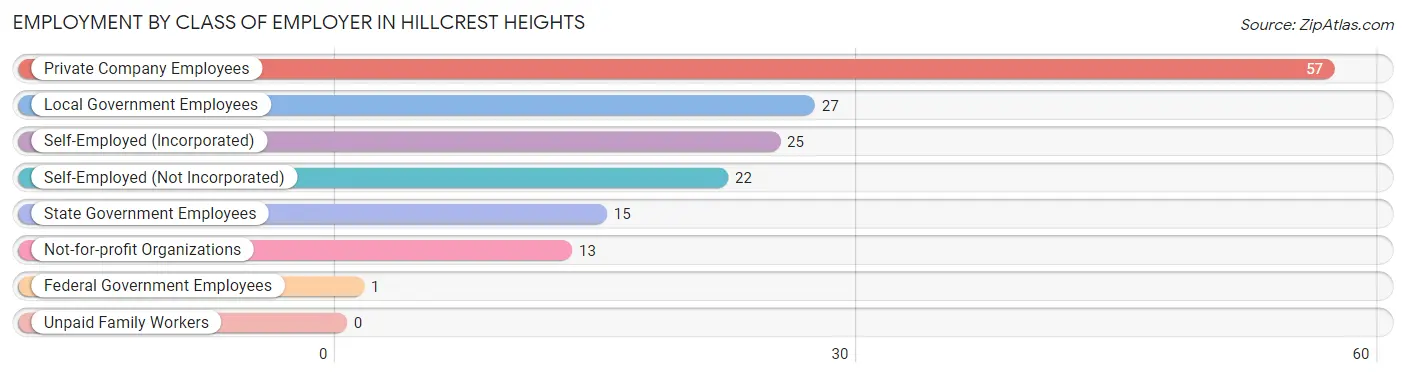
| Employer Class | # Employees | % Employees |
| Private Company Employees | 57 | 35.6% |
| Self-Employed (Incorporated) | 25 | 15.6% |
| Self-Employed (Not Incorporated) | 22 | 13.8% |
| Not-for-profit Organizations | 13 | 8.1% |
| Local Government Employees | 27 | 16.9% |
| State Government Employees | 15 | 9.4% |
| Federal Government Employees | 1 | 0.6% |
| Unpaid Family Workers | 0 | 0.0% |
| Total | 160 | 100.0% |
Employment Status by Age in Hillcrest Heights
According to the labor force statistics for Hillcrest Heights, out of the total population over 16 years of age (290), 56.2% or 163 individuals are in the labor force, with 1.8% or 3 of them unemployed. The age group with the highest labor force participation rate is 20 to 24 years, with 100.0% or 15 individuals in the labor force. Within the labor force, the 55 to 59 years age range has the highest percentage of unemployed individuals, with 5.9% or 2 of them being unemployed.
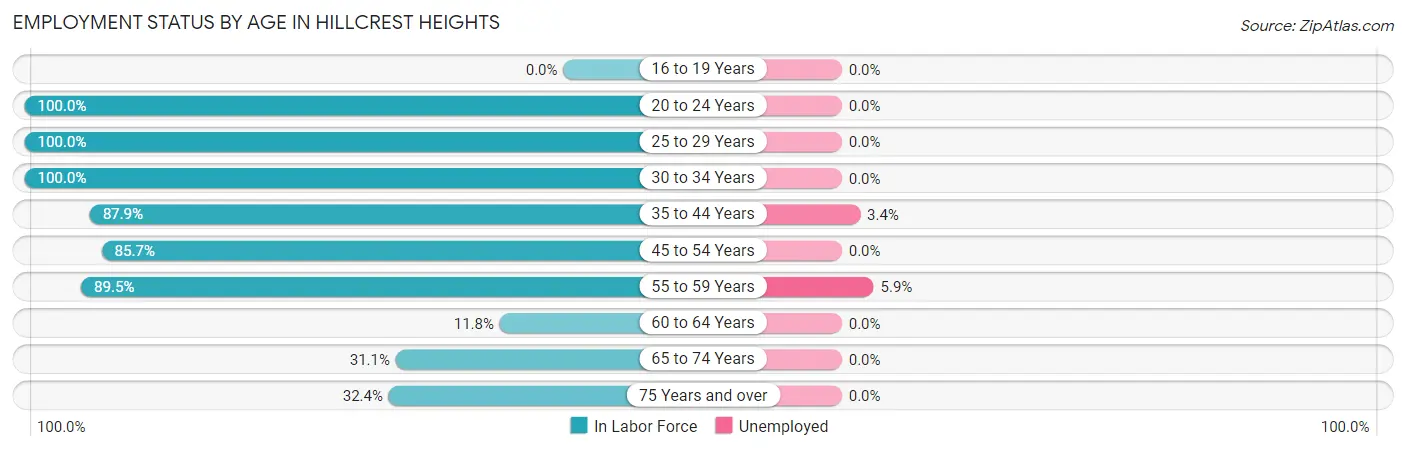
| Age Bracket | In Labor Force | Unemployed |
| 16 to 19 Years | 0 (0.0%) | 0 (0.0%) |
| 20 to 24 Years | 15 (100.0%) | 0 (0.0%) |
| 25 to 29 Years | 9 (100.0%) | 0 (0.0%) |
| 30 to 34 Years | 16 (100.0%) | 0 (0.0%) |
| 35 to 44 Years | 29 (87.9%) | 1 (3.4%) |
| 45 to 54 Years | 24 (85.7%) | 0 (0.0%) |
| 55 to 59 Years | 34 (89.5%) | 2 (5.9%) |
| 60 to 64 Years | 6 (11.8%) | 0 (0.0%) |
| 65 to 74 Years | 19 (31.1%) | 0 (0.0%) |
| 75 Years and over | 11 (32.4%) | 0 (0.0%) |
| Total | 163 (56.2%) | 3 (1.8%) |
Employment Status by Educational Attainment in Hillcrest Heights
According to labor force statistics for Hillcrest Heights, 67.4% of individuals (118) out of the total population between 25 and 64 years of age (175) are in the labor force, with 2.5% or 3 of them being unemployed. The group with the highest labor force participation rate are those with the educational attainment of college / associate degree, with 96.1% or 49 individuals in the labor force. Within the labor force, individuals with college / associate degree education have the highest percentage of unemployment, with 4.1% or 2 of them being unemployed.
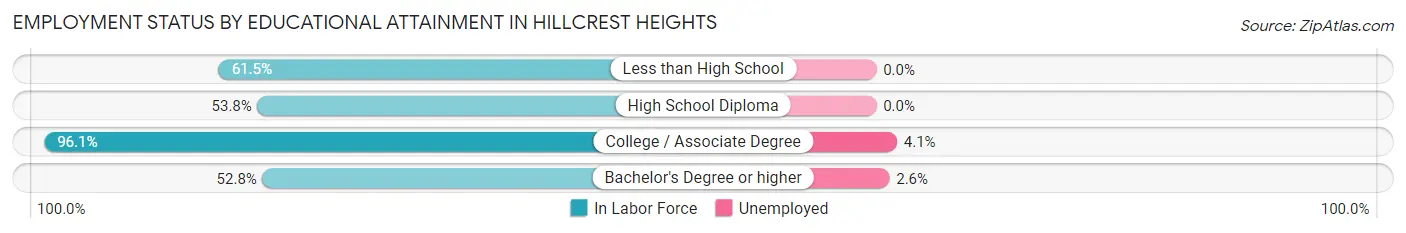
| Educational Attainment | In Labor Force | Unemployed |
| Less than High School | 24 (61.5%) | 0 (0.0%) |
| High School Diploma | 7 (53.8%) | 0 (0.0%) |
| College / Associate Degree | 49 (96.1%) | 2 (4.1%) |
| Bachelor's Degree or higher | 38 (52.8%) | 2 (2.6%) |
| Total | 118 (67.4%) | 4 (2.5%) |
Employment Occupations by Sex in Hillcrest Heights
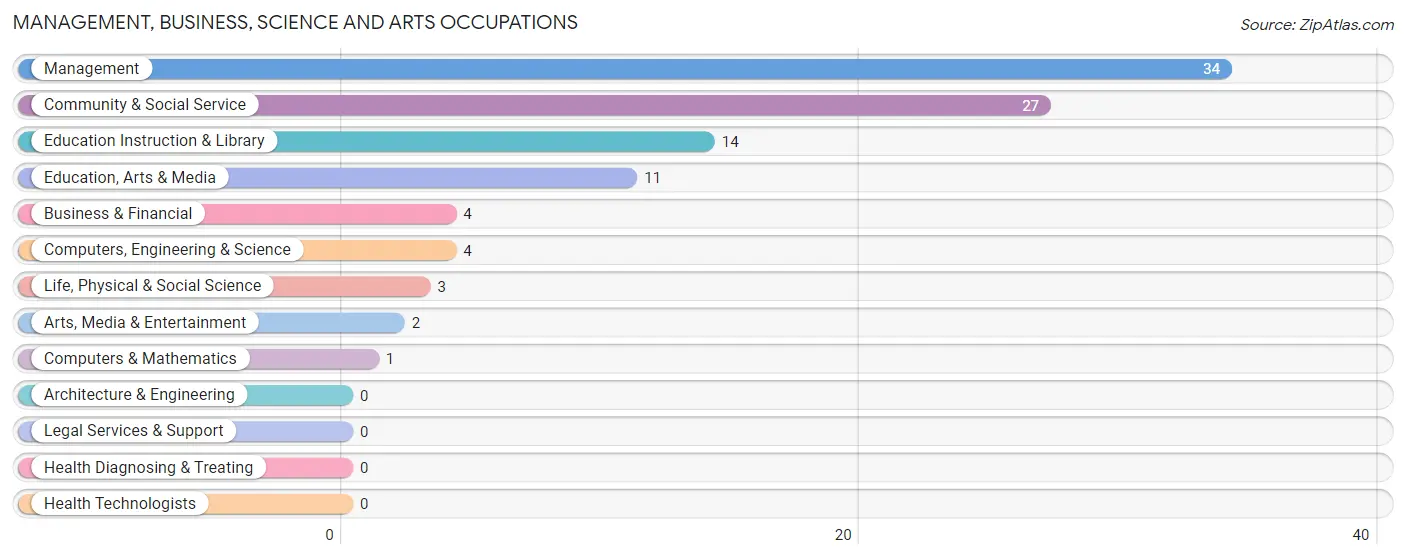
Management, Business, Science and Arts Occupations
The most common Management, Business, Science and Arts occupations in Hillcrest Heights are Management (34 | 21.2%), Community & Social Service (27 | 16.9%), Education Instruction & Library (14 | 8.7%), Education, Arts & Media (11 | 6.9%), and Business & Financial (4 | 2.5%).
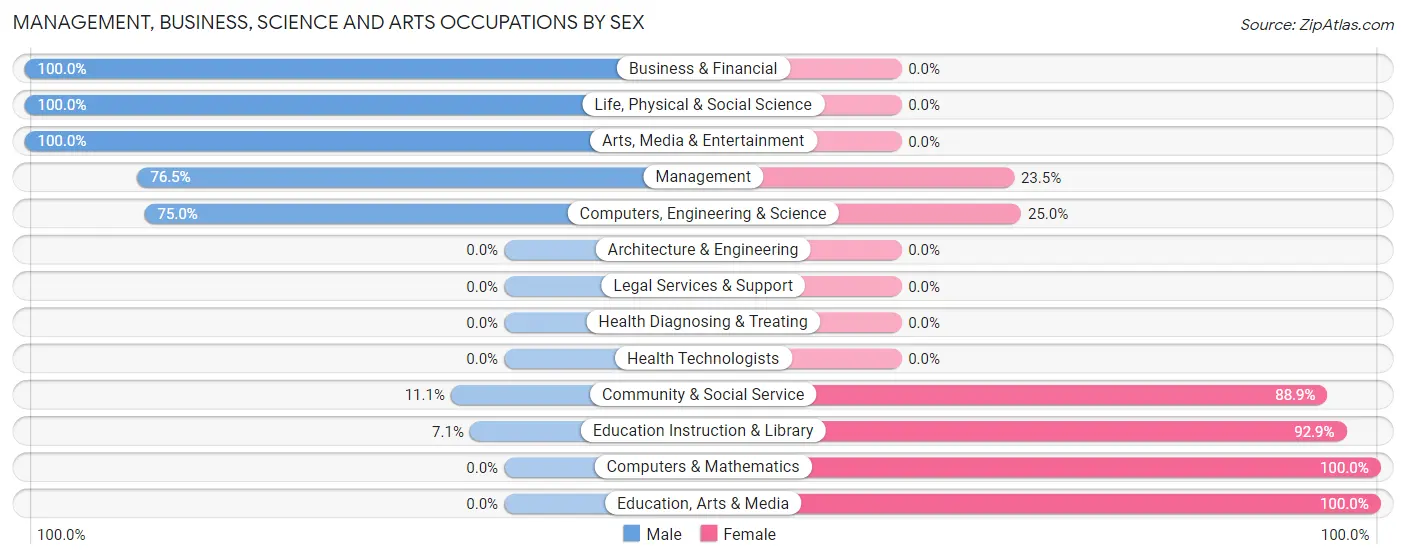
Management, Business, Science and Arts Occupations by Sex
Within the Management, Business, Science and Arts occupations in Hillcrest Heights, the most male-oriented occupations are Business & Financial (100.0%), Life, Physical & Social Science (100.0%), and Arts, Media & Entertainment (100.0%), while the most female-oriented occupations are Computers & Mathematics (100.0%), Education, Arts & Media (100.0%), and Education Instruction & Library (92.9%).
| Occupation | Male | Female |
| Management | 26 (76.5%) | 8 (23.5%) |
| Business & Financial | 4 (100.0%) | 0 (0.0%) |
| Computers, Engineering & Science | 3 (75.0%) | 1 (25.0%) |
| Computers & Mathematics | 0 (0.0%) | 1 (100.0%) |
| Architecture & Engineering | 0 (0.0%) | 0 (0.0%) |
| Life, Physical & Social Science | 3 (100.0%) | 0 (0.0%) |
| Community & Social Service | 3 (11.1%) | 24 (88.9%) |
| Education, Arts & Media | 0 (0.0%) | 11 (100.0%) |
| Legal Services & Support | 0 (0.0%) | 0 (0.0%) |
| Education Instruction & Library | 1 (7.1%) | 13 (92.9%) |
| Arts, Media & Entertainment | 2 (100.0%) | 0 (0.0%) |
| Health Diagnosing & Treating | 0 (0.0%) | 0 (0.0%) |
| Health Technologists | 0 (0.0%) | 0 (0.0%) |
| Total (Category) | 36 (52.2%) | 33 (47.8%) |
| Total (Overall) | 100 (62.5%) | 60 (37.5%) |
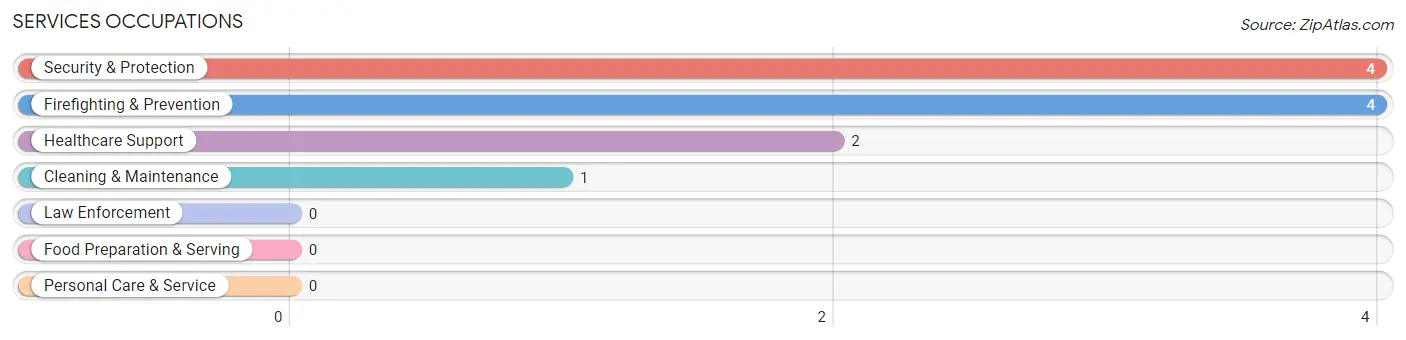
Services Occupations
The most common Services occupations in Hillcrest Heights are Security & Protection (4 | 2.5%), Firefighting & Prevention (4 | 2.5%), Healthcare Support (2 | 1.3%), and Cleaning & Maintenance (1 | 0.6%).
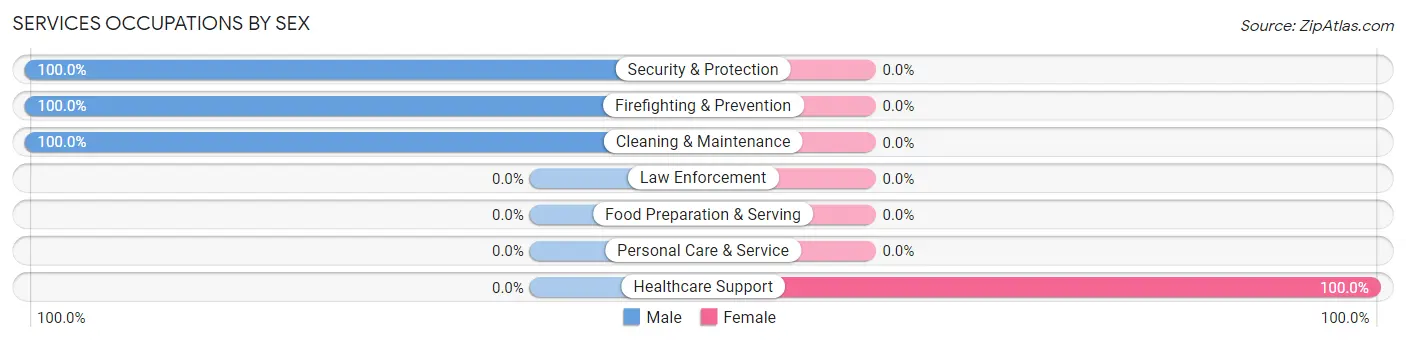
Services Occupations by Sex
| Occupation | Male | Female |
| Healthcare Support | 0 (0.0%) | 2 (100.0%) |
| Security & Protection | 4 (100.0%) | 0 (0.0%) |
| Firefighting & Prevention | 4 (100.0%) | 0 (0.0%) |
| Law Enforcement | 0 (0.0%) | 0 (0.0%) |
| Food Preparation & Serving | 0 (0.0%) | 0 (0.0%) |
| Cleaning & Maintenance | 1 (100.0%) | 0 (0.0%) |
| Personal Care & Service | 0 (0.0%) | 0 (0.0%) |
| Total (Category) | 5 (71.4%) | 2 (28.6%) |
| Total (Overall) | 100 (62.5%) | 60 (37.5%) |
Sales and Office Occupations
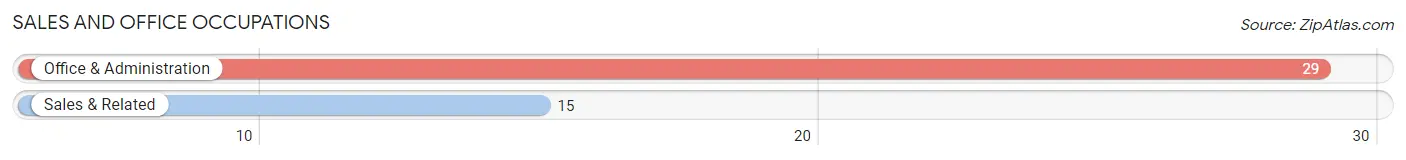
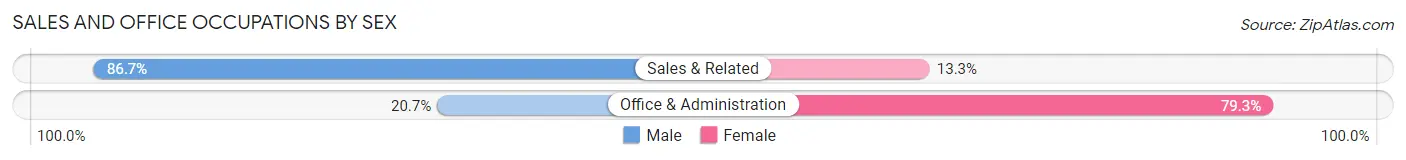
The most common Sales and Office occupations in Hillcrest Heights are Office & Administration (29 | 18.1%), and Sales & Related (15 | 9.4%).
Sales and Office Occupations by Sex
| Occupation | Male | Female |
| Sales & Related | 13 (86.7%) | 2 (13.3%) |
| Office & Administration | 6 (20.7%) | 23 (79.3%) |
| Total (Category) | 19 (43.2%) | 25 (56.8%) |
| Total (Overall) | 100 (62.5%) | 60 (37.5%) |
Natural Resources, Construction and Maintenance Occupations
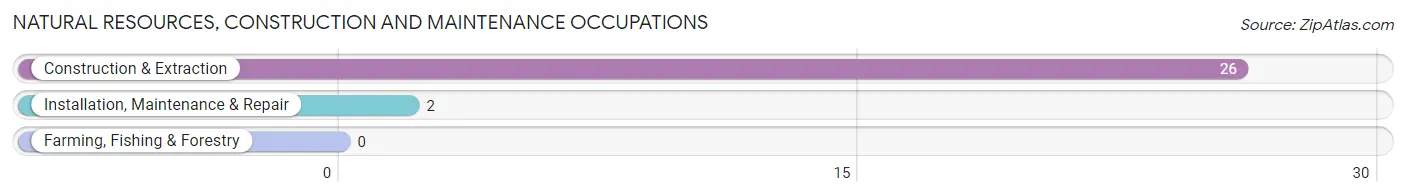
The most common Natural Resources, Construction and Maintenance occupations in Hillcrest Heights are Construction & Extraction (26 | 16.3%), and Installation, Maintenance & Repair (2 | 1.3%).
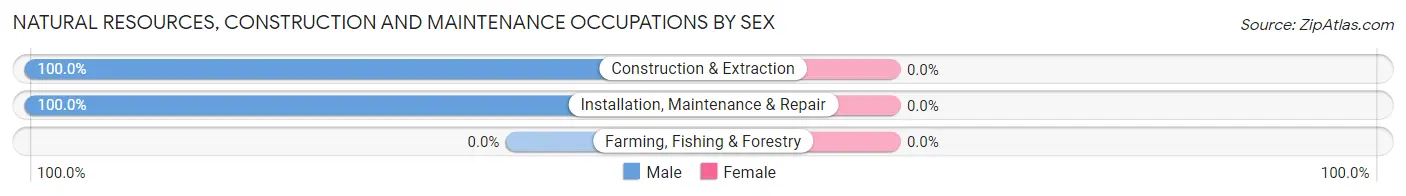
Natural Resources, Construction and Maintenance Occupations by Sex
| Occupation | Male | Female |
| Farming, Fishing & Forestry | 0 (0.0%) | 0 (0.0%) |
| Construction & Extraction | 26 (100.0%) | 0 (0.0%) |
| Installation, Maintenance & Repair | 2 (100.0%) | 0 (0.0%) |
| Total (Category) | 28 (100.0%) | 0 (0.0%) |
| Total (Overall) | 100 (62.5%) | 60 (37.5%) |
Production, Transportation and Moving Occupations
The most common Production, Transportation and Moving occupations in Hillcrest Heights are Transportation (9 | 5.6%), Material Moving (2 | 1.3%), and Production (1 | 0.6%).
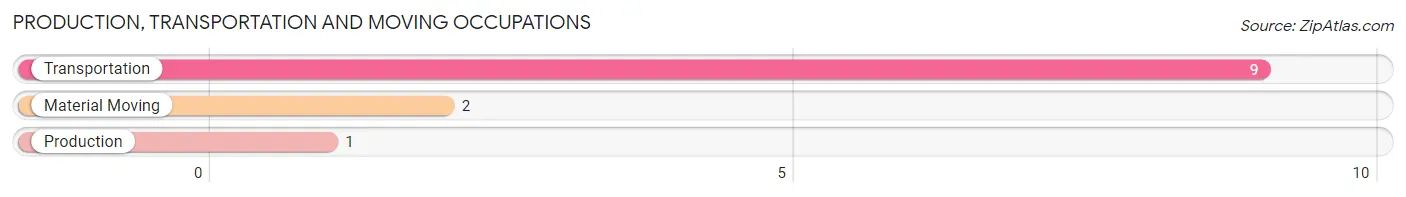
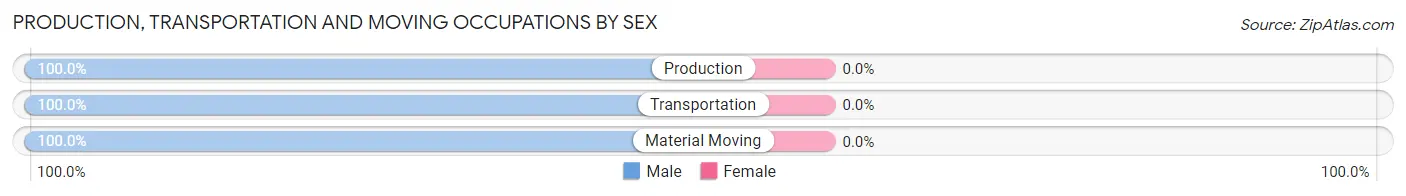
Production, Transportation and Moving Occupations by Sex
| Occupation | Male | Female |
| Production | 1 (100.0%) | 0 (0.0%) |
| Transportation | 9 (100.0%) | 0 (0.0%) |
| Material Moving | 2 (100.0%) | 0 (0.0%) |
| Total (Category) | 12 (100.0%) | 0 (0.0%) |
| Total (Overall) | 100 (62.5%) | 60 (37.5%) |
Employment Industries by Sex in Hillcrest Heights
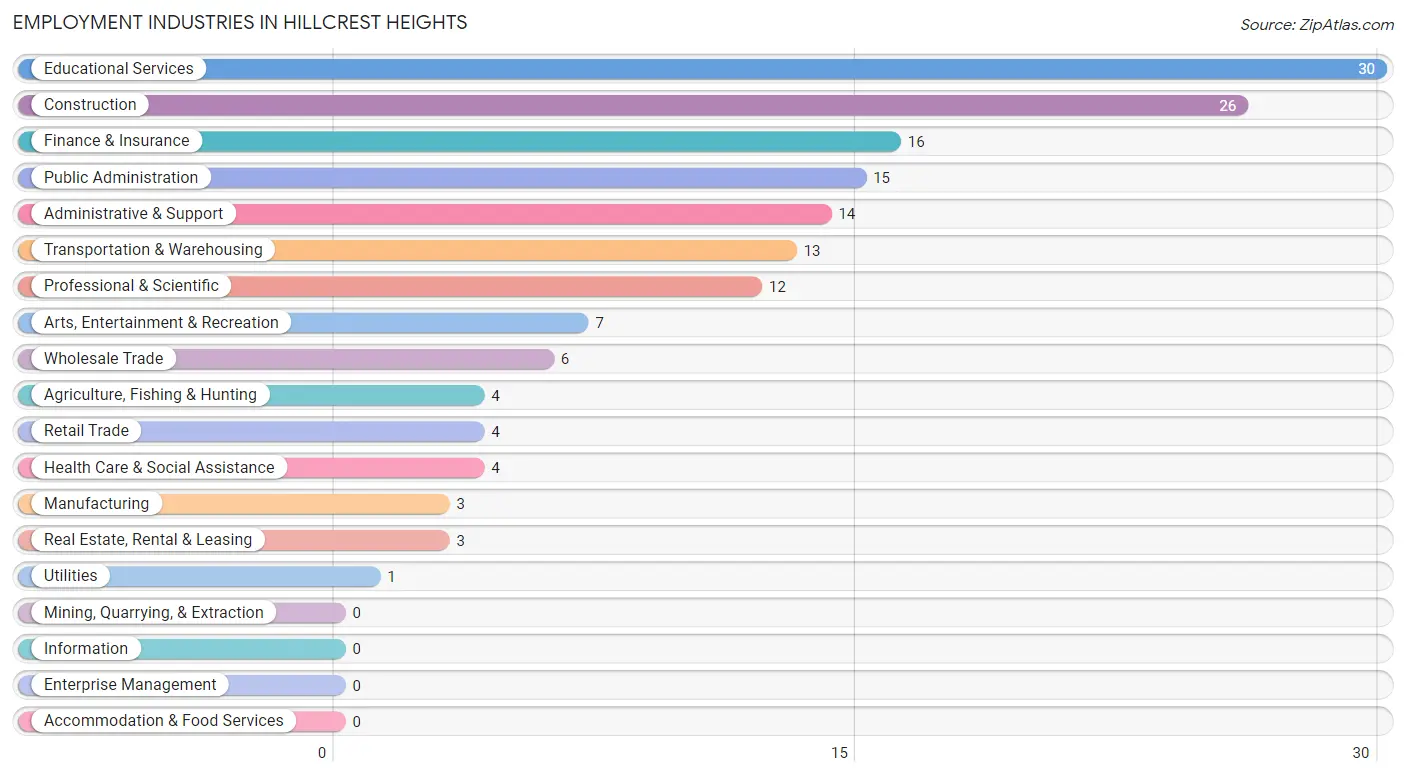
Employment Industries in Hillcrest Heights
The major employment industries in Hillcrest Heights include Educational Services (30 | 18.8%), Construction (26 | 16.3%), Finance & Insurance (16 | 10.0%), Public Administration (15 | 9.4%), and Administrative & Support (14 | 8.7%).
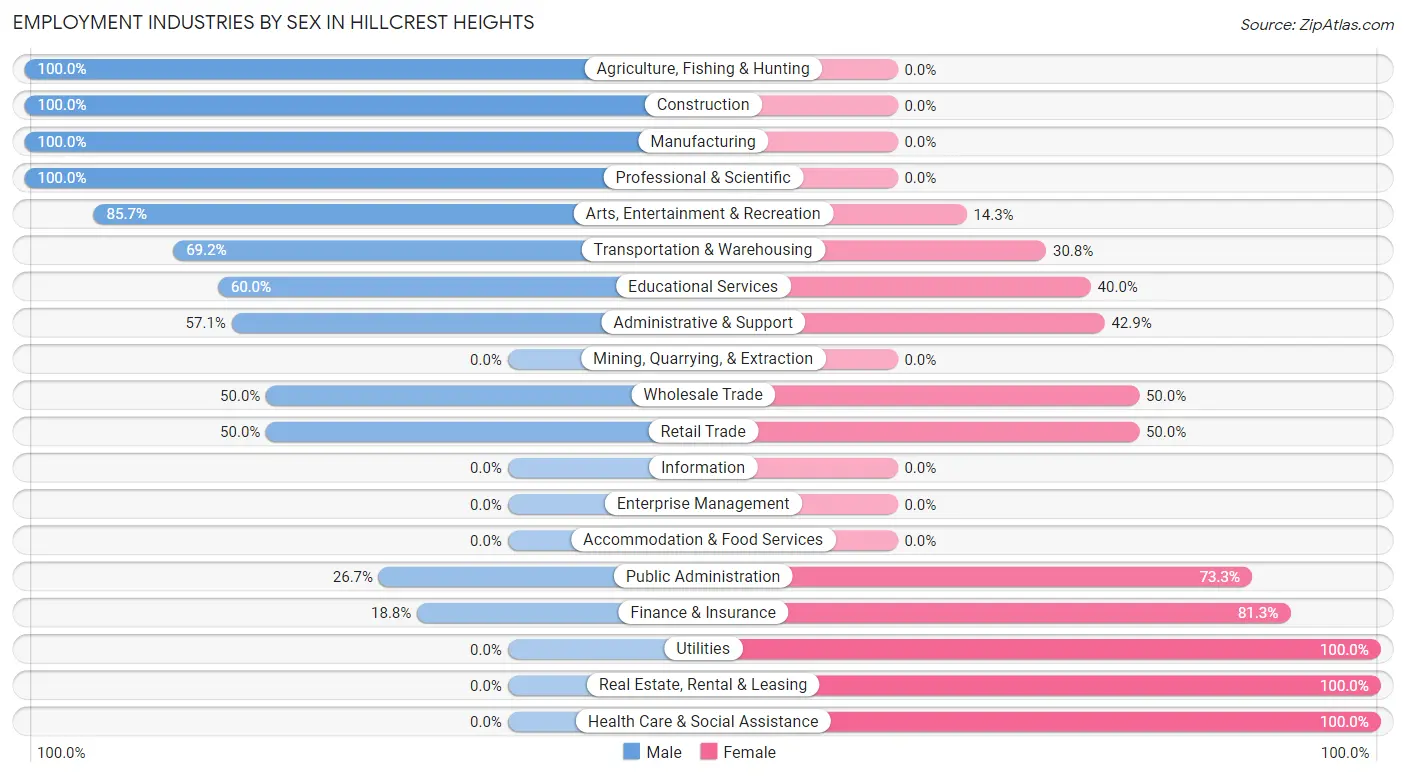
Employment Industries by Sex in Hillcrest Heights
The Hillcrest Heights industries that see more men than women are Agriculture, Fishing & Hunting (100.0%), Construction (100.0%), and Manufacturing (100.0%), whereas the industries that tend to have a higher number of women are Utilities (100.0%), Real Estate, Rental & Leasing (100.0%), and Health Care & Social Assistance (100.0%).
| Industry | Male | Female |
| Agriculture, Fishing & Hunting | 4 (100.0%) | 0 (0.0%) |
| Mining, Quarrying, & Extraction | 0 (0.0%) | 0 (0.0%) |
| Construction | 26 (100.0%) | 0 (0.0%) |
| Manufacturing | 3 (100.0%) | 0 (0.0%) |
| Wholesale Trade | 3 (50.0%) | 3 (50.0%) |
| Retail Trade | 2 (50.0%) | 2 (50.0%) |
| Transportation & Warehousing | 9 (69.2%) | 4 (30.8%) |
| Utilities | 0 (0.0%) | 1 (100.0%) |
| Information | 0 (0.0%) | 0 (0.0%) |
| Finance & Insurance | 3 (18.8%) | 13 (81.2%) |
| Real Estate, Rental & Leasing | 0 (0.0%) | 3 (100.0%) |
| Professional & Scientific | 12 (100.0%) | 0 (0.0%) |
| Enterprise Management | 0 (0.0%) | 0 (0.0%) |
| Administrative & Support | 8 (57.1%) | 6 (42.9%) |
| Educational Services | 18 (60.0%) | 12 (40.0%) |
| Health Care & Social Assistance | 0 (0.0%) | 4 (100.0%) |
| Arts, Entertainment & Recreation | 6 (85.7%) | 1 (14.3%) |
| Accommodation & Food Services | 0 (0.0%) | 0 (0.0%) |
| Public Administration | 4 (26.7%) | 11 (73.3%) |
| Total | 100 (62.5%) | 60 (37.5%) |
Education in Hillcrest Heights
School Enrollment in Hillcrest Heights
The most common levels of schooling among the 74 students in Hillcrest Heights are elementary school (20 | 27.0%), middle school (19 | 25.7%), and college / undergraduate (15 | 20.3%).
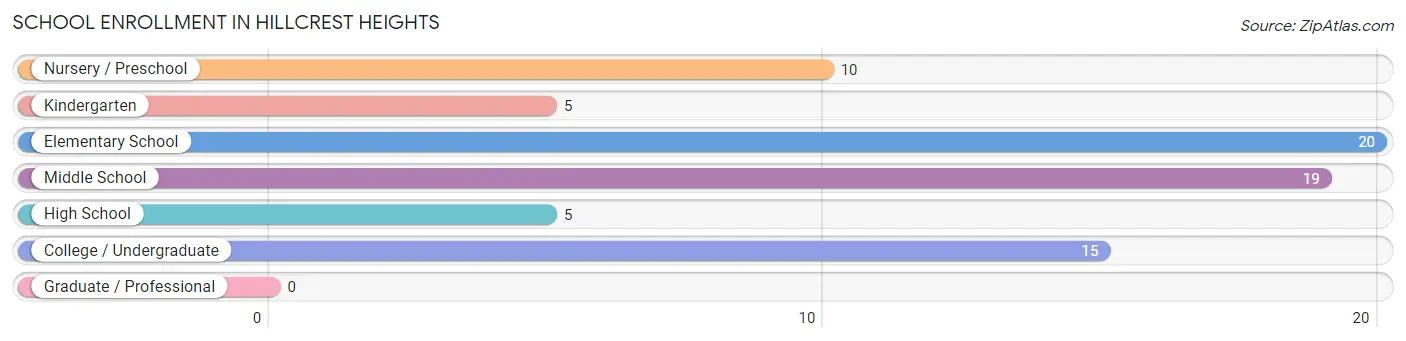
| School Level | # Students | % Students |
| Nursery / Preschool | 10 | 13.5% |
| Kindergarten | 5 | 6.8% |
| Elementary School | 20 | 27.0% |
| Middle School | 19 | 25.7% |
| High School | 5 | 6.8% |
| College / Undergraduate | 15 | 20.3% |
| Graduate / Professional | 0 | 0.0% |
| Total | 74 | 100.0% |
School Enrollment by Age by Funding Source in Hillcrest Heights
Out of a total of 74 students who are enrolled in schools in Hillcrest Heights, 2 (2.7%) attend a private institution, while the remaining 72 (97.3%) are enrolled in public schools. The age group of 10 to 14 year olds has the highest likelihood of being enrolled in private schools, with 1 (5.3% in the age bracket) enrolled. Conversely, the age group of 3 to 4 year olds has the lowest likelihood of being enrolled in a private school, with 4 (100.0% in the age bracket) attending a public institution.
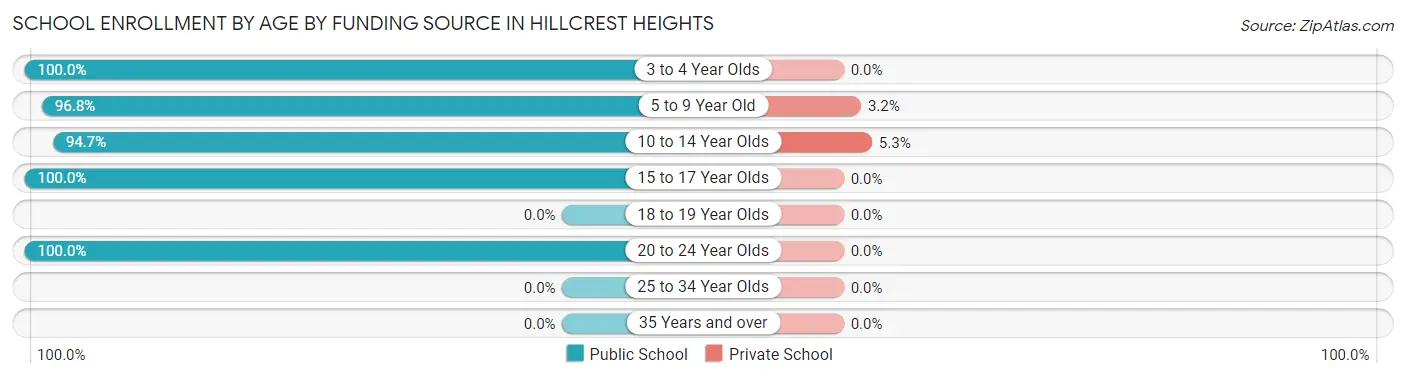
| Age Bracket | Public School | Private School |
| 3 to 4 Year Olds | 4 (100.0%) | 0 (0.0%) |
| 5 to 9 Year Old | 30 (96.8%) | 1 (3.2%) |
| 10 to 14 Year Olds | 18 (94.7%) | 1 (5.3%) |
| 15 to 17 Year Olds | 5 (100.0%) | 0 (0.0%) |
| 18 to 19 Year Olds | 0 (0.0%) | 0 (0.0%) |
| 20 to 24 Year Olds | 15 (100.0%) | 0 (0.0%) |
| 25 to 34 Year Olds | 0 (0.0%) | 0 (0.0%) |
| 35 Years and over | 0 (0.0%) | 0 (0.0%) |
| Total | 72 (97.3%) | 2 (2.7%) |
Educational Attainment by Field of Study in Hillcrest Heights
Business (43 | 41.7%), education (26 | 25.2%), bio, nature & agricultural (15 | 14.6%), literature & languages (7 | 6.8%), and physical & health sciences (3 | 2.9%) are the most common fields of study among 103 individuals in Hillcrest Heights who have obtained a bachelor's degree or higher.
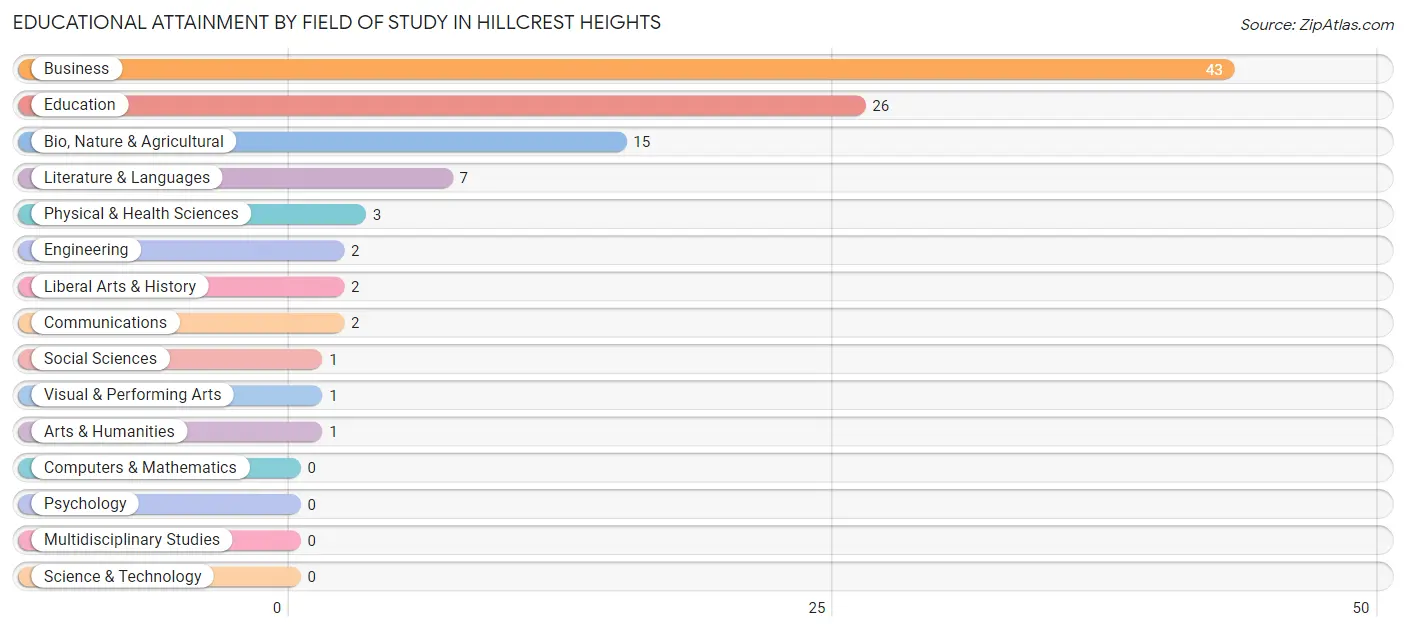
| Field of Study | # Graduates | % Graduates |
| Computers & Mathematics | 0 | 0.0% |
| Bio, Nature & Agricultural | 15 | 14.6% |
| Physical & Health Sciences | 3 | 2.9% |
| Psychology | 0 | 0.0% |
| Social Sciences | 1 | 1.0% |
| Engineering | 2 | 1.9% |
| Multidisciplinary Studies | 0 | 0.0% |
| Science & Technology | 0 | 0.0% |
| Business | 43 | 41.7% |
| Education | 26 | 25.2% |
| Literature & Languages | 7 | 6.8% |
| Liberal Arts & History | 2 | 1.9% |
| Visual & Performing Arts | 1 | 1.0% |
| Communications | 2 | 1.9% |
| Arts & Humanities | 1 | 1.0% |
| Total | 103 | 100.0% |
Transportation & Commute in Hillcrest Heights
Vehicle Availability by Sex in Hillcrest Heights
The most prevalent vehicle ownership categories in Hillcrest Heights are males with 2 vehicles (40, accounting for 40.0%) and females with 2 vehicles (27, making up 66.7%).
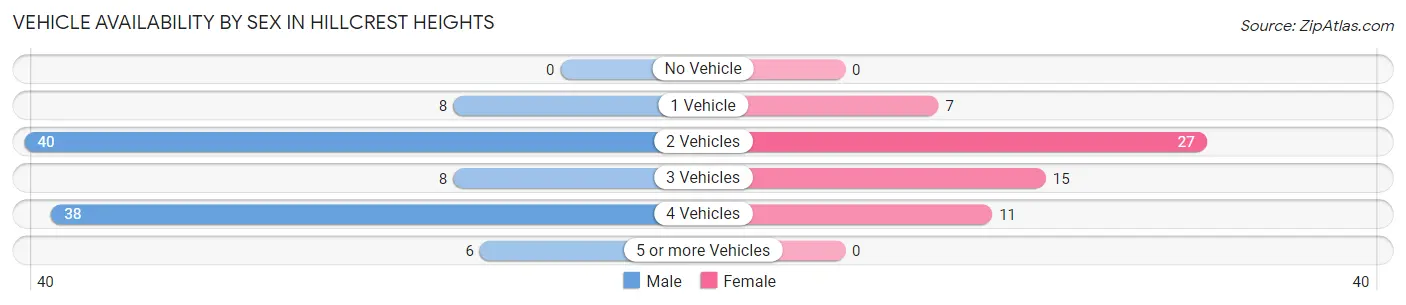
| Vehicles Available | Male | Female |
| No Vehicle | 0 (0.0%) | 0 (0.0%) |
| 1 Vehicle | 8 (8.0%) | 7 (11.7%) |
| 2 Vehicles | 40 (40.0%) | 27 (45.0%) |
| 3 Vehicles | 8 (8.0%) | 15 (25.0%) |
| 4 Vehicles | 38 (38.0%) | 11 (18.3%) |
| 5 or more Vehicles | 6 (6.0%) | 0 (0.0%) |
| Total | 100 (100.0%) | 60 (100.0%) |
Commute Time in Hillcrest Heights
The most frequently occuring commute durations in Hillcrest Heights are 30 to 34 minutes (38 commuters, 24.2%), 15 to 19 minutes (34 commuters, 21.7%), and 10 to 14 minutes (31 commuters, 19.8%).
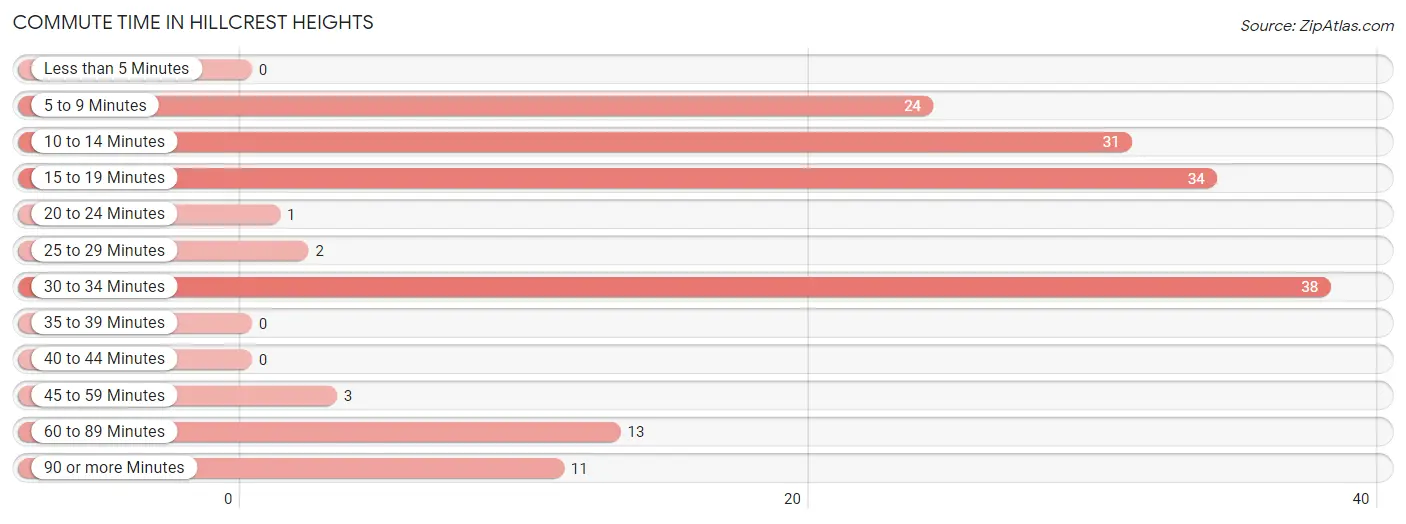
| Commute Time | # Commuters | % Commuters |
| Less than 5 Minutes | 0 | 0.0% |
| 5 to 9 Minutes | 24 | 15.3% |
| 10 to 14 Minutes | 31 | 19.8% |
| 15 to 19 Minutes | 34 | 21.7% |
| 20 to 24 Minutes | 1 | 0.6% |
| 25 to 29 Minutes | 2 | 1.3% |
| 30 to 34 Minutes | 38 | 24.2% |
| 35 to 39 Minutes | 0 | 0.0% |
| 40 to 44 Minutes | 0 | 0.0% |
| 45 to 59 Minutes | 3 | 1.9% |
| 60 to 89 Minutes | 13 | 8.3% |
| 90 or more Minutes | 11 | 7.0% |
Commute Time by Sex in Hillcrest Heights
The most common commute times in Hillcrest Heights are 30 to 34 minutes (30 commuters, 30.3%) for males and 5 to 9 minutes (19 commuters, 32.8%) for females.
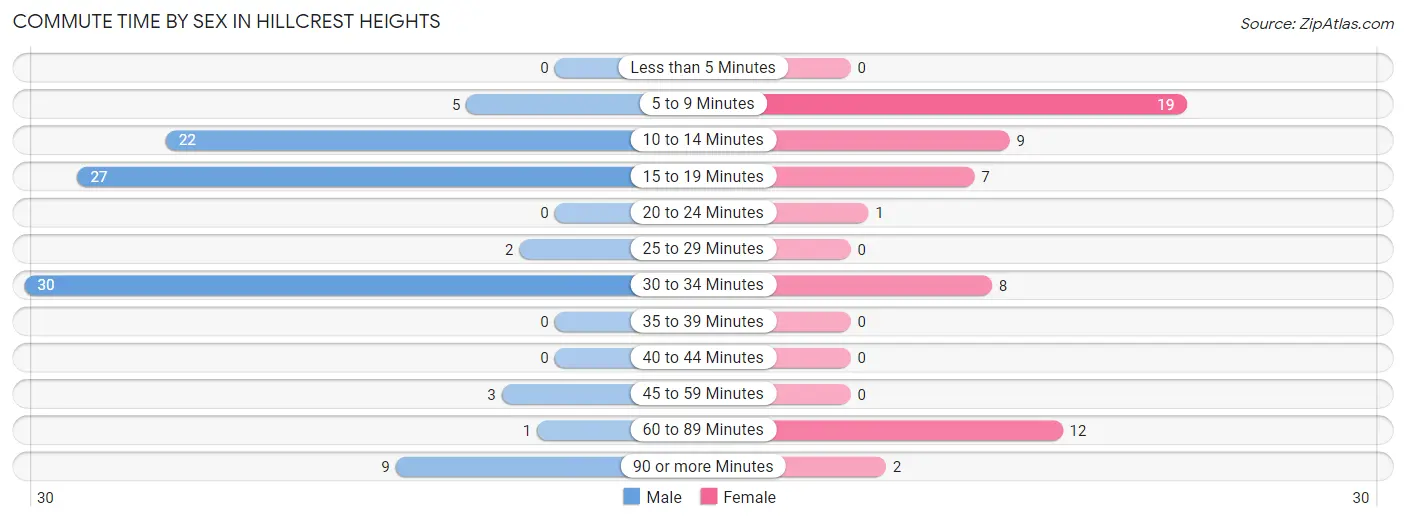
| Commute Time | Male | Female |
| Less than 5 Minutes | 0 (0.0%) | 0 (0.0%) |
| 5 to 9 Minutes | 5 (5.1%) | 19 (32.8%) |
| 10 to 14 Minutes | 22 (22.2%) | 9 (15.5%) |
| 15 to 19 Minutes | 27 (27.3%) | 7 (12.1%) |
| 20 to 24 Minutes | 0 (0.0%) | 1 (1.7%) |
| 25 to 29 Minutes | 2 (2.0%) | 0 (0.0%) |
| 30 to 34 Minutes | 30 (30.3%) | 8 (13.8%) |
| 35 to 39 Minutes | 0 (0.0%) | 0 (0.0%) |
| 40 to 44 Minutes | 0 (0.0%) | 0 (0.0%) |
| 45 to 59 Minutes | 3 (3.0%) | 0 (0.0%) |
| 60 to 89 Minutes | 1 (1.0%) | 12 (20.7%) |
| 90 or more Minutes | 9 (9.1%) | 2 (3.5%) |
Time of Departure to Work by Sex in Hillcrest Heights
The most frequent times of departure to work in Hillcrest Heights are 8:00 AM to 8:29 AM (28, 28.3%) for males and 6:30 AM to 6:59 AM (18, 31.0%) for females.
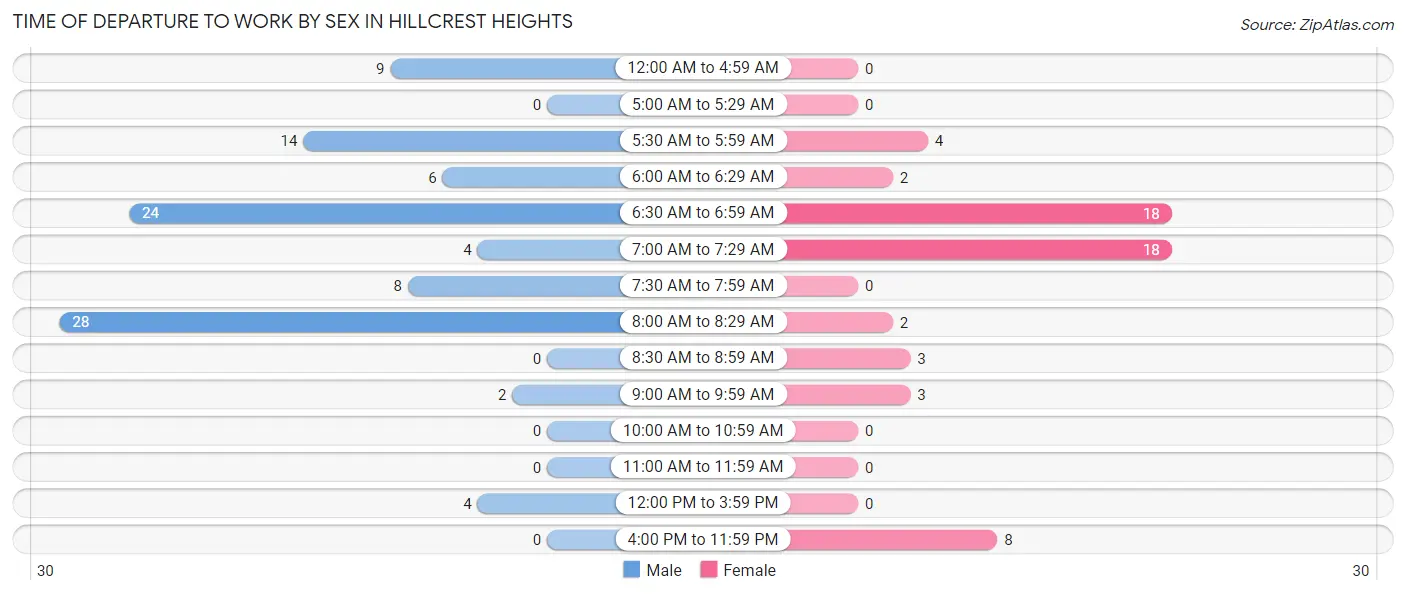
| Time of Departure | Male | Female |
| 12:00 AM to 4:59 AM | 9 (9.1%) | 0 (0.0%) |
| 5:00 AM to 5:29 AM | 0 (0.0%) | 0 (0.0%) |
| 5:30 AM to 5:59 AM | 14 (14.1%) | 4 (6.9%) |
| 6:00 AM to 6:29 AM | 6 (6.1%) | 2 (3.5%) |
| 6:30 AM to 6:59 AM | 24 (24.2%) | 18 (31.0%) |
| 7:00 AM to 7:29 AM | 4 (4.0%) | 18 (31.0%) |
| 7:30 AM to 7:59 AM | 8 (8.1%) | 0 (0.0%) |
| 8:00 AM to 8:29 AM | 28 (28.3%) | 2 (3.5%) |
| 8:30 AM to 8:59 AM | 0 (0.0%) | 3 (5.2%) |
| 9:00 AM to 9:59 AM | 2 (2.0%) | 3 (5.2%) |
| 10:00 AM to 10:59 AM | 0 (0.0%) | 0 (0.0%) |
| 11:00 AM to 11:59 AM | 0 (0.0%) | 0 (0.0%) |
| 12:00 PM to 3:59 PM | 4 (4.0%) | 0 (0.0%) |
| 4:00 PM to 11:59 PM | 0 (0.0%) | 8 (13.8%) |
| Total | 99 (100.0%) | 58 (100.0%) |
Housing Occupancy in Hillcrest Heights
Occupancy by Ownership in Hillcrest Heights
Of the total 114 dwellings in Hillcrest Heights, owner-occupied units account for 103 (90.3%), while renter-occupied units make up 11 (9.7%).
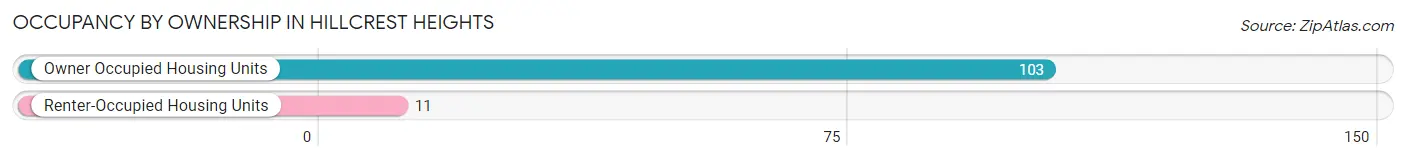
| Occupancy | # Housing Units | % Housing Units |
| Owner Occupied Housing Units | 103 | 90.3% |
| Renter-Occupied Housing Units | 11 | 9.7% |
| Total Occupied Housing Units | 114 | 100.0% |
Occupancy by Household Size in Hillcrest Heights
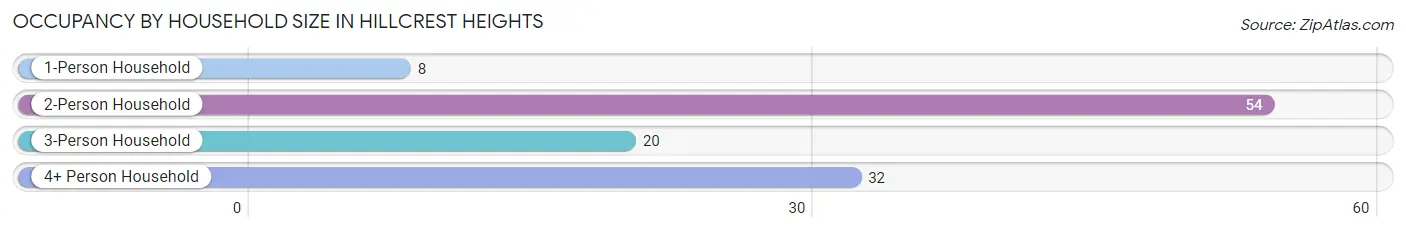
| Household Size | # Housing Units | % Housing Units |
| 1-Person Household | 8 | 7.0% |
| 2-Person Household | 54 | 47.4% |
| 3-Person Household | 20 | 17.5% |
| 4+ Person Household | 32 | 28.1% |
| Total Housing Units | 114 | 100.0% |
Occupancy by Ownership by Household Size in Hillcrest Heights
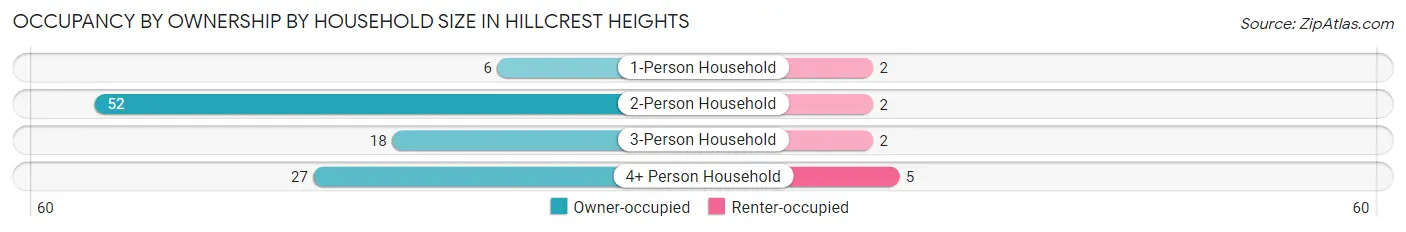
| Household Size | Owner-occupied | Renter-occupied |
| 1-Person Household | 6 (75.0%) | 2 (25.0%) |
| 2-Person Household | 52 (96.3%) | 2 (3.7%) |
| 3-Person Household | 18 (90.0%) | 2 (10.0%) |
| 4+ Person Household | 27 (84.4%) | 5 (15.6%) |
| Total Housing Units | 103 (90.3%) | 11 (9.7%) |
Occupancy by Educational Attainment in Hillcrest Heights
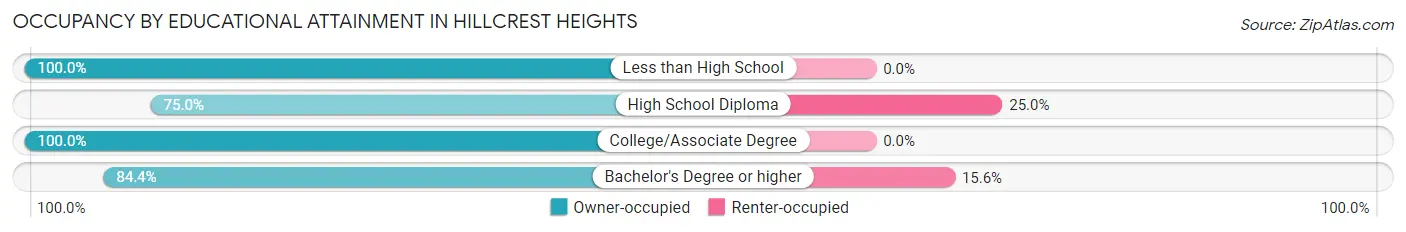
| Household Size | Owner-occupied | Renter-occupied |
| Less than High School | 17 (100.0%) | 0 (0.0%) |
| High School Diploma | 18 (75.0%) | 6 (25.0%) |
| College/Associate Degree | 41 (100.0%) | 0 (0.0%) |
| Bachelor's Degree or higher | 27 (84.4%) | 5 (15.6%) |
Occupancy by Age of Householder in Hillcrest Heights
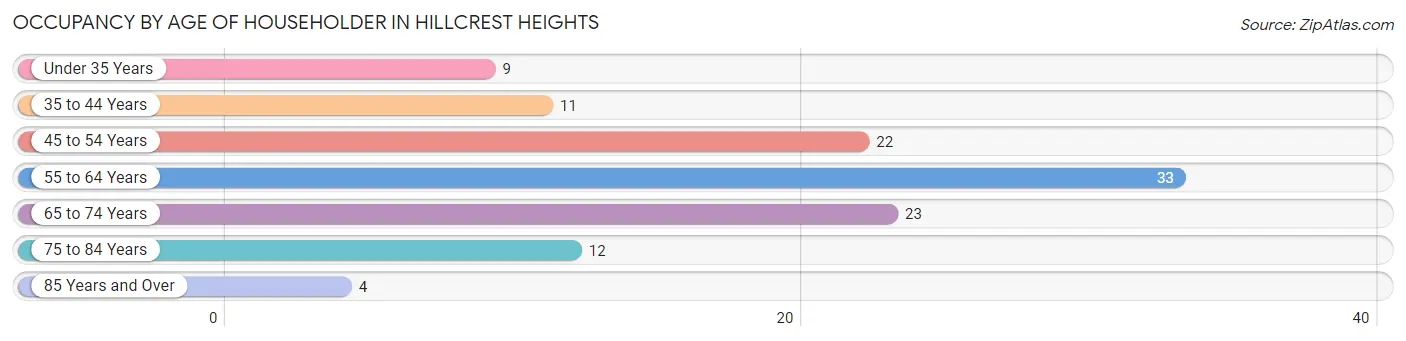
| Age Bracket | # Households | % Households |
| Under 35 Years | 9 | 7.9% |
| 35 to 44 Years | 11 | 9.7% |
| 45 to 54 Years | 22 | 19.3% |
| 55 to 64 Years | 33 | 28.9% |
| 65 to 74 Years | 23 | 20.2% |
| 75 to 84 Years | 12 | 10.5% |
| 85 Years and Over | 4 | 3.5% |
| Total | 114 | 100.0% |
Housing Finances in Hillcrest Heights
Median Income by Occupancy in Hillcrest Heights
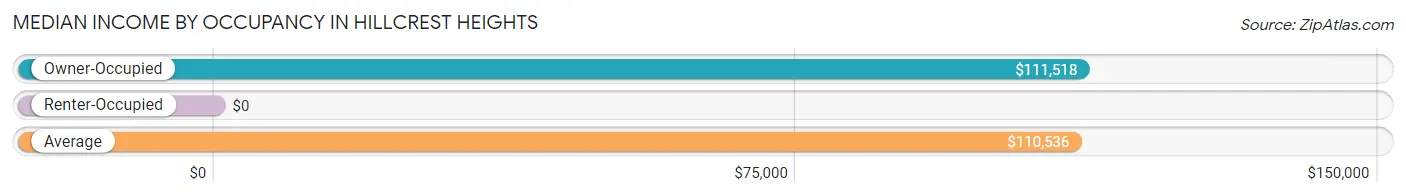
| Occupancy Type | # Households | Median Income |
| Owner-Occupied | 103 (90.3%) | $111,518 |
| Renter-Occupied | 11 (9.7%) | $0 |
| Average | 114 (100.0%) | $110,536 |
Occupancy by Householder Income Bracket in Hillcrest Heights
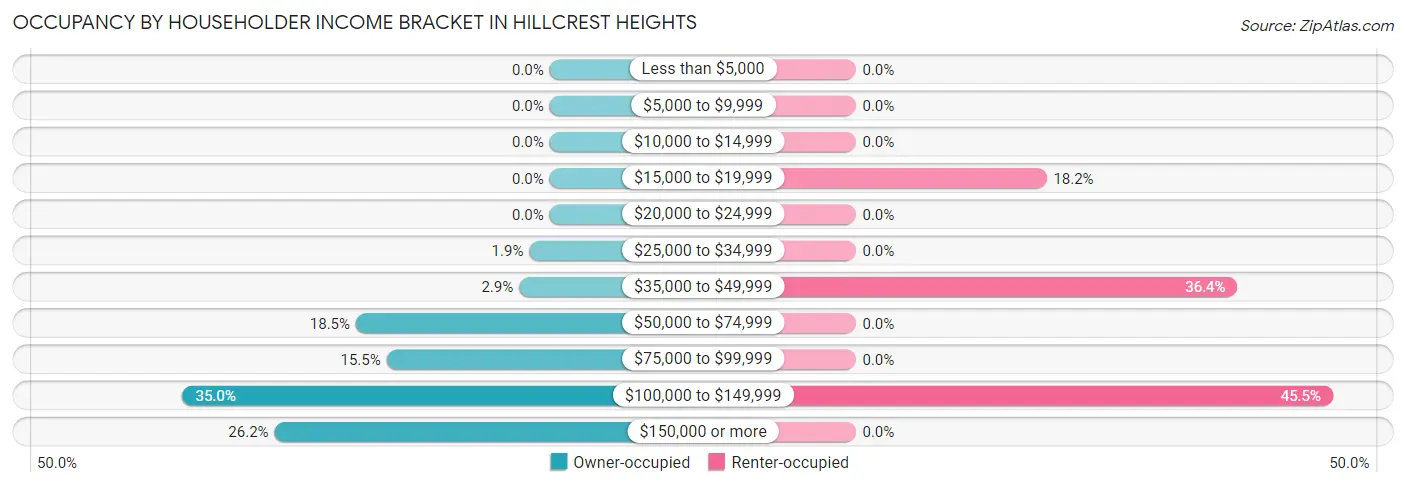
| Income Bracket | Owner-occupied | Renter-occupied |
| Less than $5,000 | 0 (0.0%) | 0 (0.0%) |
| $5,000 to $9,999 | 0 (0.0%) | 0 (0.0%) |
| $10,000 to $14,999 | 0 (0.0%) | 0 (0.0%) |
| $15,000 to $19,999 | 0 (0.0%) | 2 (18.2%) |
| $20,000 to $24,999 | 0 (0.0%) | 0 (0.0%) |
| $25,000 to $34,999 | 2 (1.9%) | 0 (0.0%) |
| $35,000 to $49,999 | 3 (2.9%) | 4 (36.4%) |
| $50,000 to $74,999 | 19 (18.4%) | 0 (0.0%) |
| $75,000 to $99,999 | 16 (15.5%) | 0 (0.0%) |
| $100,000 to $149,999 | 36 (34.9%) | 5 (45.5%) |
| $150,000 or more | 27 (26.2%) | 0 (0.0%) |
| Total | 103 (100.0%) | 11 (100.0%) |
Monthly Housing Cost Tiers in Hillcrest Heights
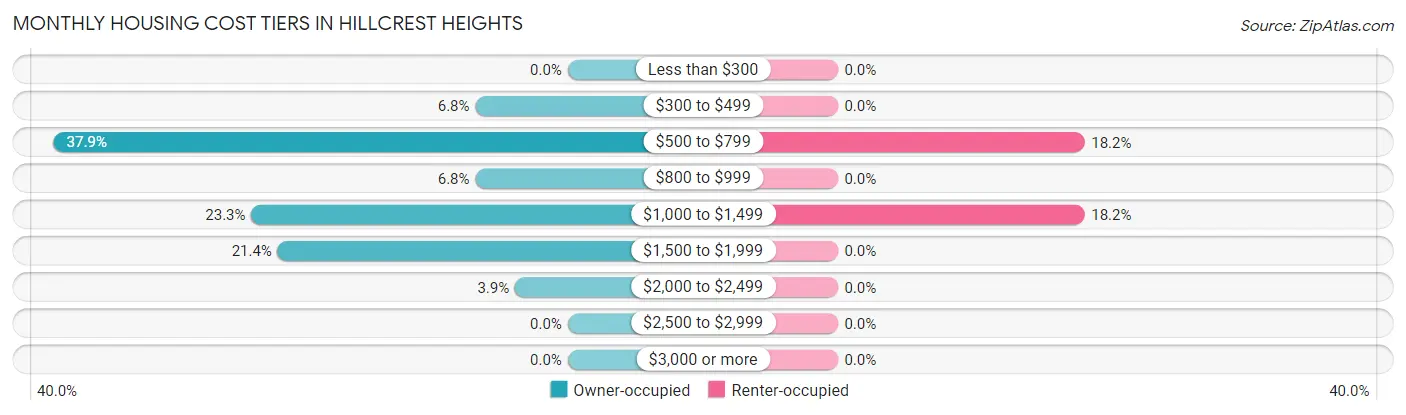
| Monthly Cost | Owner-occupied | Renter-occupied |
| Less than $300 | 0 (0.0%) | 0 (0.0%) |
| $300 to $499 | 7 (6.8%) | 0 (0.0%) |
| $500 to $799 | 39 (37.9%) | 2 (18.2%) |
| $800 to $999 | 7 (6.8%) | 0 (0.0%) |
| $1,000 to $1,499 | 24 (23.3%) | 2 (18.2%) |
| $1,500 to $1,999 | 22 (21.4%) | 0 (0.0%) |
| $2,000 to $2,499 | 4 (3.9%) | 0 (0.0%) |
| $2,500 to $2,999 | 0 (0.0%) | 0 (0.0%) |
| $3,000 or more | 0 (0.0%) | 0 (0.0%) |
| Total | 103 (100.0%) | 11 (100.0%) |
Physical Housing Characteristics in Hillcrest Heights
Housing Structures in Hillcrest Heights
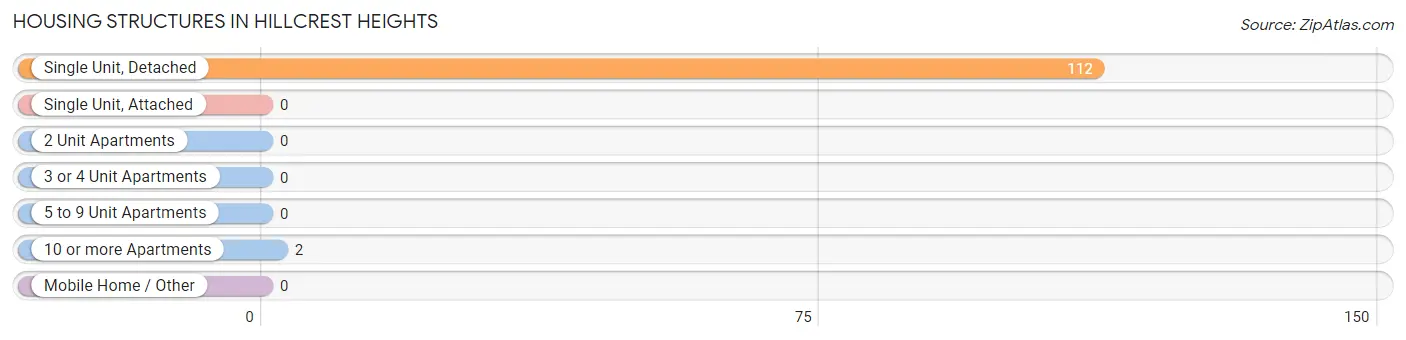
| Structure Type | # Housing Units | % Housing Units |
| Single Unit, Detached | 112 | 98.3% |
| Single Unit, Attached | 0 | 0.0% |
| 2 Unit Apartments | 0 | 0.0% |
| 3 or 4 Unit Apartments | 0 | 0.0% |
| 5 to 9 Unit Apartments | 0 | 0.0% |
| 10 or more Apartments | 2 | 1.8% |
| Mobile Home / Other | 0 | 0.0% |
| Total | 114 | 100.0% |
Housing Structures by Occupancy in Hillcrest Heights
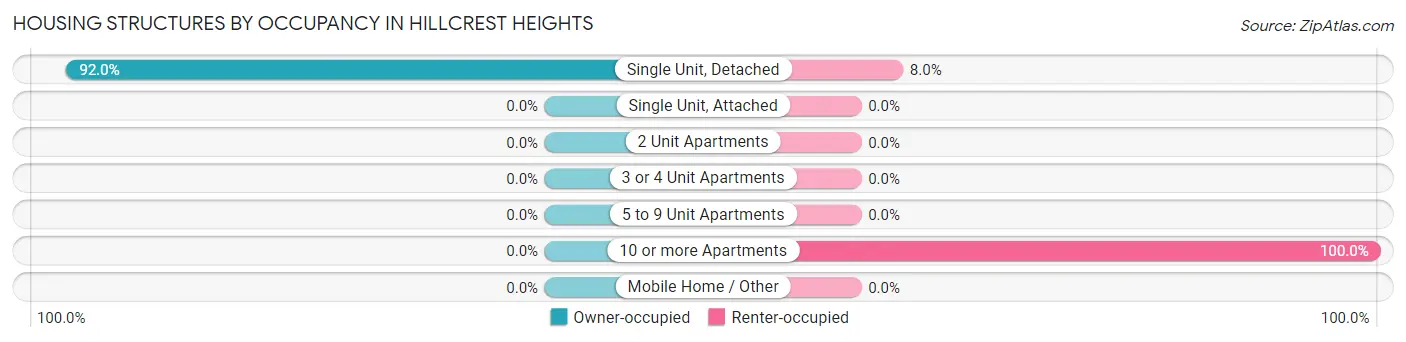
| Structure Type | Owner-occupied | Renter-occupied |
| Single Unit, Detached | 103 (92.0%) | 9 (8.0%) |
| Single Unit, Attached | 0 (0.0%) | 0 (0.0%) |
| 2 Unit Apartments | 0 (0.0%) | 0 (0.0%) |
| 3 or 4 Unit Apartments | 0 (0.0%) | 0 (0.0%) |
| 5 to 9 Unit Apartments | 0 (0.0%) | 0 (0.0%) |
| 10 or more Apartments | 0 (0.0%) | 2 (100.0%) |
| Mobile Home / Other | 0 (0.0%) | 0 (0.0%) |
| Total | 103 (90.3%) | 11 (9.7%) |
Housing Structures by Number of Rooms in Hillcrest Heights
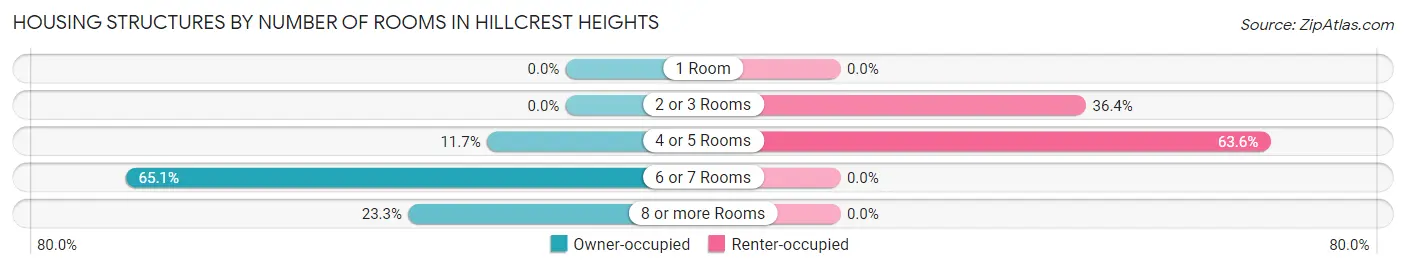
| Number of Rooms | Owner-occupied | Renter-occupied |
| 1 Room | 0 (0.0%) | 0 (0.0%) |
| 2 or 3 Rooms | 0 (0.0%) | 4 (36.4%) |
| 4 or 5 Rooms | 12 (11.7%) | 7 (63.6%) |
| 6 or 7 Rooms | 67 (65.0%) | 0 (0.0%) |
| 8 or more Rooms | 24 (23.3%) | 0 (0.0%) |
| Total | 103 (100.0%) | 11 (100.0%) |
Housing Structure by Heating Type in Hillcrest Heights
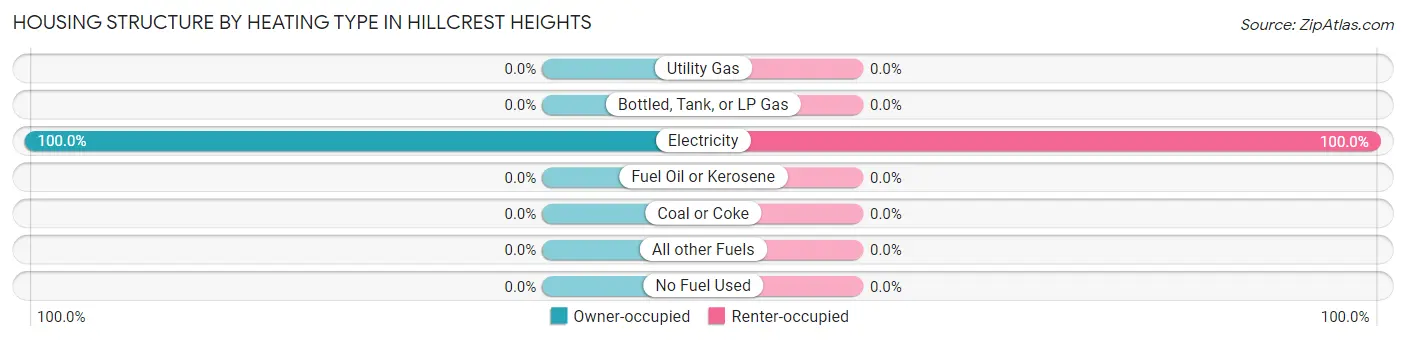
| Heating Type | Owner-occupied | Renter-occupied |
| Utility Gas | 0 (0.0%) | 0 (0.0%) |
| Bottled, Tank, or LP Gas | 0 (0.0%) | 0 (0.0%) |
| Electricity | 103 (100.0%) | 11 (100.0%) |
| Fuel Oil or Kerosene | 0 (0.0%) | 0 (0.0%) |
| Coal or Coke | 0 (0.0%) | 0 (0.0%) |
| All other Fuels | 0 (0.0%) | 0 (0.0%) |
| No Fuel Used | 0 (0.0%) | 0 (0.0%) |
| Total | 103 (100.0%) | 11 (100.0%) |
Household Vehicle Usage in Hillcrest Heights
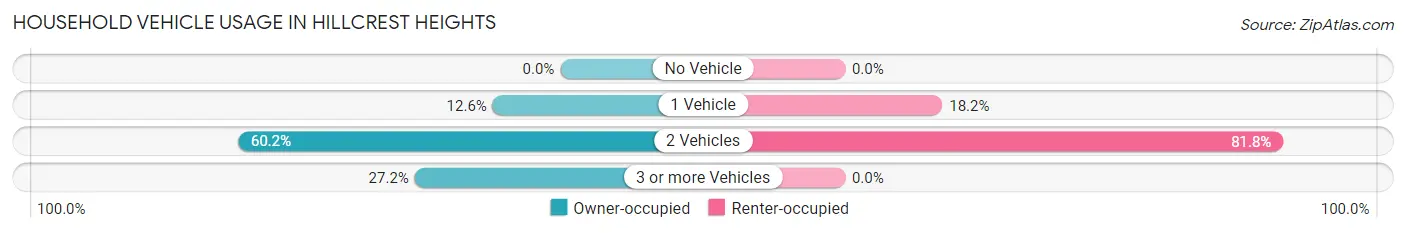
| Vehicles per Household | Owner-occupied | Renter-occupied |
| No Vehicle | 0 (0.0%) | 0 (0.0%) |
| 1 Vehicle | 13 (12.6%) | 2 (18.2%) |
| 2 Vehicles | 62 (60.2%) | 9 (81.8%) |
| 3 or more Vehicles | 28 (27.2%) | 0 (0.0%) |
| Total | 103 (100.0%) | 11 (100.0%) |
Real Estate & Mortgages in Hillcrest Heights
Real Estate and Mortgage Overview in Hillcrest Heights
| Characteristic | Without Mortgage | With Mortgage |
| Housing Units | 48 | 55 |
| Median Property Value | - | - |
| Median Household Income | $133,750 | $6 |
| Monthly Housing Costs | $594 | $0 |
| Real Estate Taxes | $2,400 | $3 |
Property Value by Mortgage Status in Hillcrest Heights
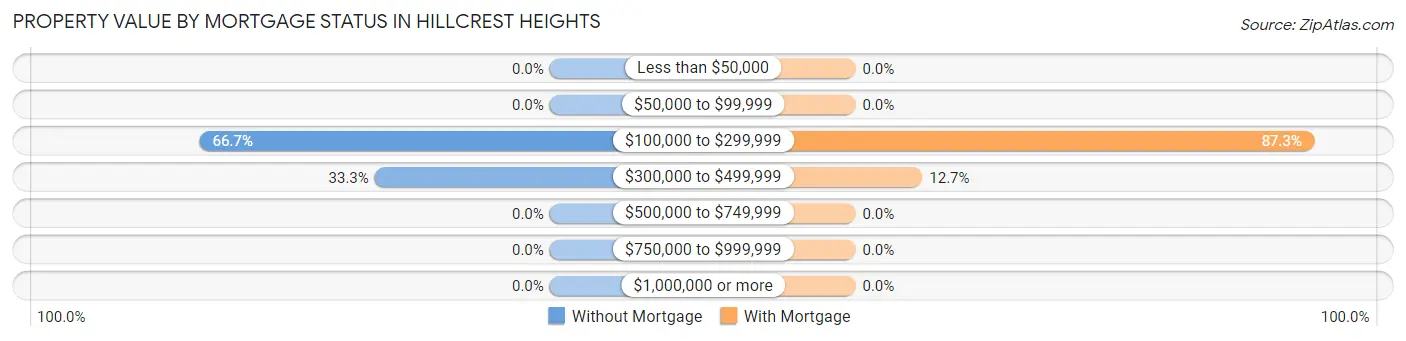
| Property Value | Without Mortgage | With Mortgage |
| Less than $50,000 | 0 (0.0%) | 0 (0.0%) |
| $50,000 to $99,999 | 0 (0.0%) | 0 (0.0%) |
| $100,000 to $299,999 | 32 (66.7%) | 48 (87.3%) |
| $300,000 to $499,999 | 16 (33.3%) | 7 (12.7%) |
| $500,000 to $749,999 | 0 (0.0%) | 0 (0.0%) |
| $750,000 to $999,999 | 0 (0.0%) | 0 (0.0%) |
| $1,000,000 or more | 0 (0.0%) | 0 (0.0%) |
| Total | 48 (100.0%) | 55 (100.0%) |
Household Income by Mortgage Status in Hillcrest Heights
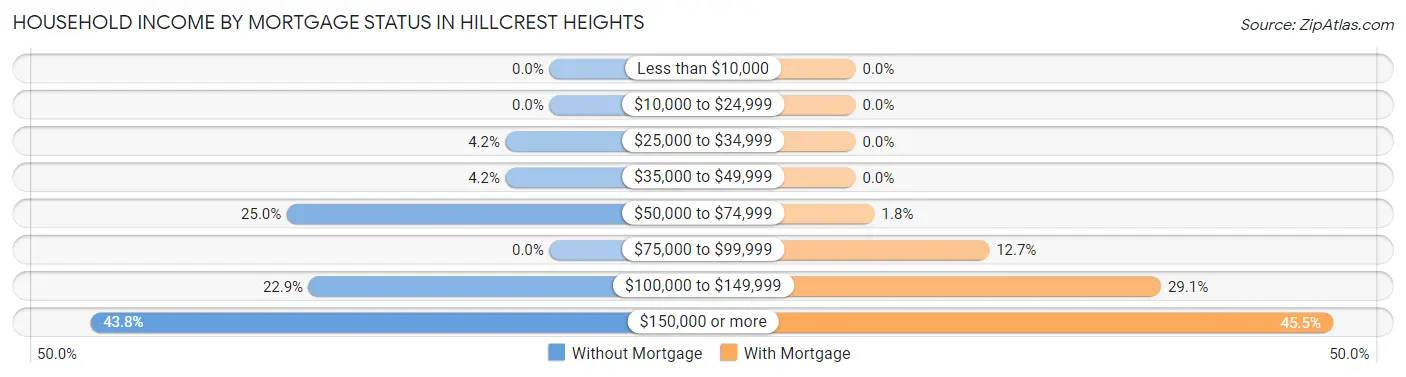
| Household Income | Without Mortgage | With Mortgage |
| Less than $10,000 | 0 (0.0%) | 0 (0.0%) |
| $10,000 to $24,999 | 0 (0.0%) | 0 (0.0%) |
| $25,000 to $34,999 | 2 (4.2%) | 0 (0.0%) |
| $35,000 to $49,999 | 2 (4.2%) | 0 (0.0%) |
| $50,000 to $74,999 | 12 (25.0%) | 1 (1.8%) |
| $75,000 to $99,999 | 0 (0.0%) | 7 (12.7%) |
| $100,000 to $149,999 | 11 (22.9%) | 16 (29.1%) |
| $150,000 or more | 21 (43.8%) | 25 (45.5%) |
| Total | 48 (100.0%) | 55 (100.0%) |
Property Value to Household Income Ratio in Hillcrest Heights
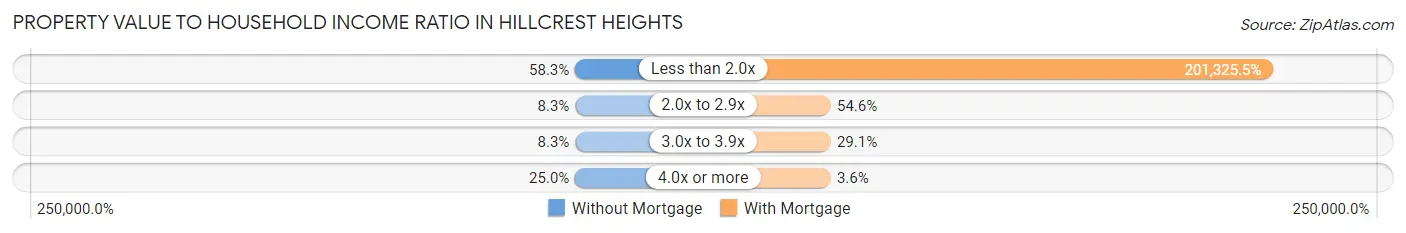
| Value-to-Income Ratio | Without Mortgage | With Mortgage |
| Less than 2.0x | 28 (58.3%) | 110,729 (201,325.5%) |
| 2.0x to 2.9x | 4 (8.3%) | 30 (54.5%) |
| 3.0x to 3.9x | 4 (8.3%) | 16 (29.1%) |
| 4.0x or more | 12 (25.0%) | 2 (3.6%) |
| Total | 48 (100.0%) | 55 (100.0%) |
Real Estate Taxes by Mortgage Status in Hillcrest Heights
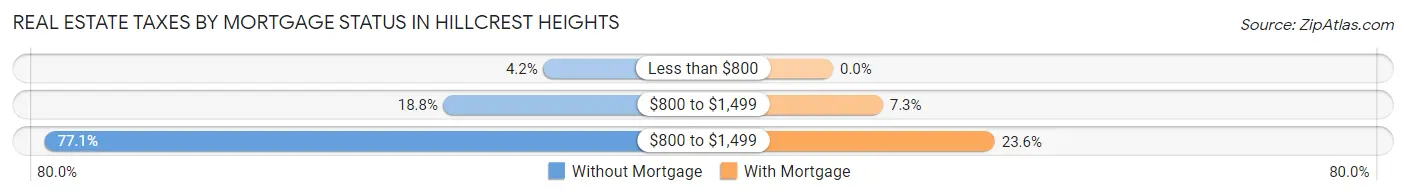
| Property Taxes | Without Mortgage | With Mortgage |
| Less than $800 | 2 (4.2%) | 0 (0.0%) |
| $800 to $1,499 | 9 (18.8%) | 4 (7.3%) |
| $800 to $1,499 | 37 (77.1%) | 13 (23.6%) |
| Total | 48 (100.0%) | 55 (100.0%) |
Health & Disability in Hillcrest Heights
Health Insurance Coverage by Age in Hillcrest Heights
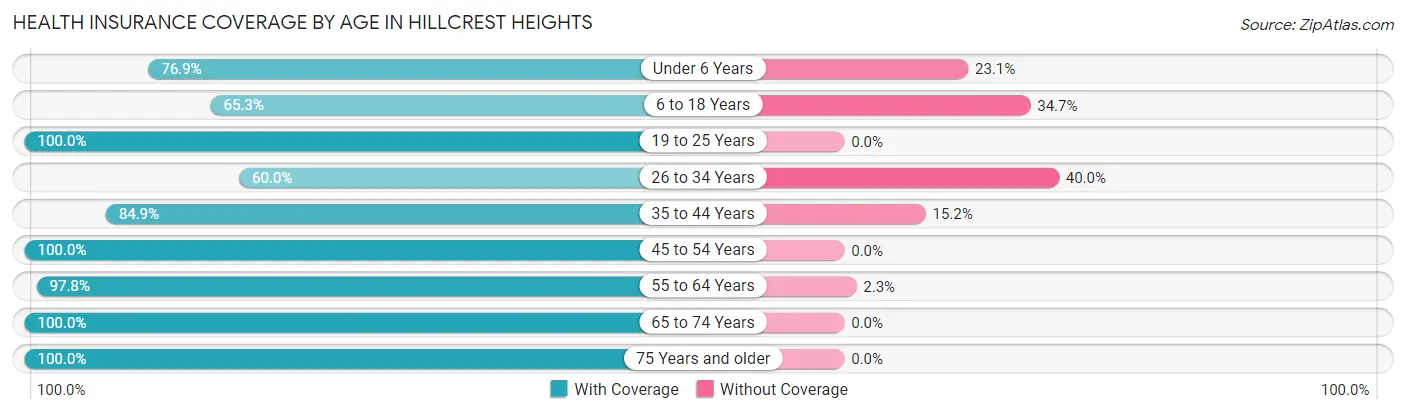
| Age Bracket | With Coverage | Without Coverage |
| Under 6 Years | 20 (76.9%) | 6 (23.1%) |
| 6 to 18 Years | 32 (65.3%) | 17 (34.7%) |
| 19 to 25 Years | 15 (100.0%) | 0 (0.0%) |
| 26 to 34 Years | 15 (60.0%) | 10 (40.0%) |
| 35 to 44 Years | 28 (84.9%) | 5 (15.1%) |
| 45 to 54 Years | 28 (100.0%) | 0 (0.0%) |
| 55 to 64 Years | 87 (97.8%) | 2 (2.2%) |
| 65 to 74 Years | 61 (100.0%) | 0 (0.0%) |
| 75 Years and older | 34 (100.0%) | 0 (0.0%) |
| Total | 320 (88.9%) | 40 (11.1%) |
Health Insurance Coverage by Citizenship Status in Hillcrest Heights
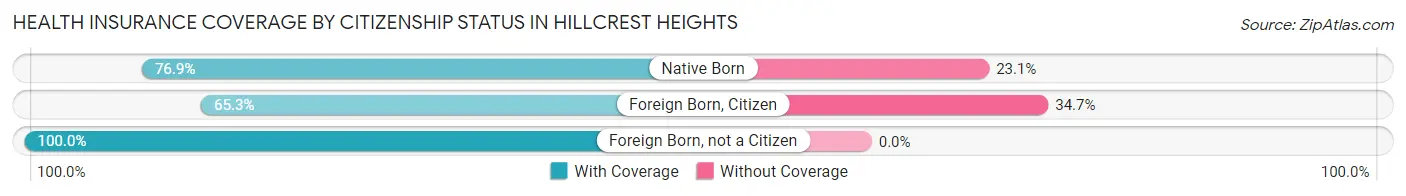
| Citizenship Status | With Coverage | Without Coverage |
| Native Born | 20 (76.9%) | 6 (23.1%) |
| Foreign Born, Citizen | 32 (65.3%) | 17 (34.7%) |
| Foreign Born, not a Citizen | 15 (100.0%) | 0 (0.0%) |
Health Insurance Coverage by Household Income in Hillcrest Heights
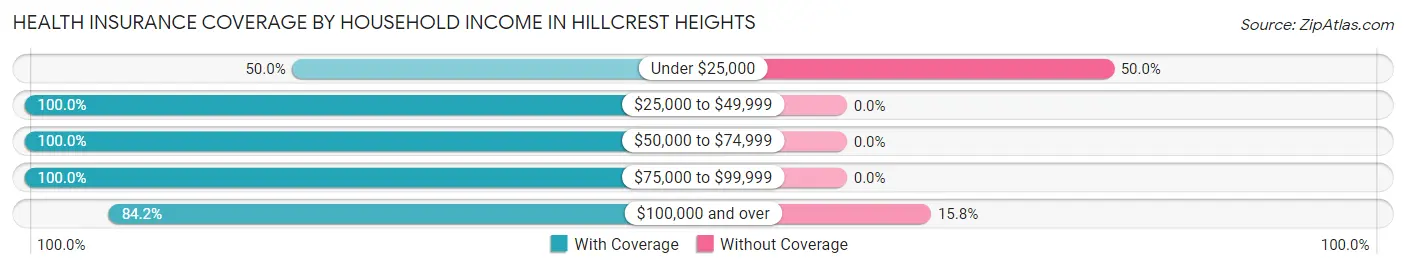
| Household Income | With Coverage | Without Coverage |
| Under $25,000 | 2 (50.0%) | 2 (50.0%) |
| $25,000 to $49,999 | 16 (100.0%) | 0 (0.0%) |
| $50,000 to $74,999 | 43 (100.0%) | 0 (0.0%) |
| $75,000 to $99,999 | 56 (100.0%) | 0 (0.0%) |
| $100,000 and over | 203 (84.2%) | 38 (15.8%) |
Public vs Private Health Insurance Coverage by Age in Hillcrest Heights
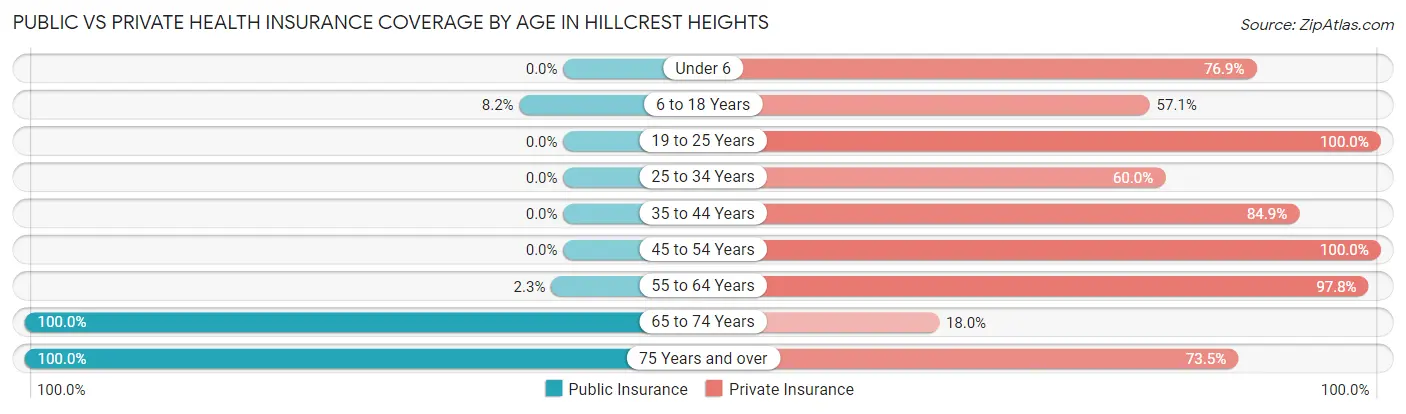
| Age Bracket | Public Insurance | Private Insurance |
| Under 6 | 0 (0.0%) | 20 (76.9%) |
| 6 to 18 Years | 4 (8.2%) | 28 (57.1%) |
| 19 to 25 Years | 0 (0.0%) | 15 (100.0%) |
| 25 to 34 Years | 0 (0.0%) | 15 (60.0%) |
| 35 to 44 Years | 0 (0.0%) | 28 (84.9%) |
| 45 to 54 Years | 0 (0.0%) | 28 (100.0%) |
| 55 to 64 Years | 2 (2.2%) | 87 (97.8%) |
| 65 to 74 Years | 61 (100.0%) | 11 (18.0%) |
| 75 Years and over | 34 (100.0%) | 25 (73.5%) |
| Total | 101 (28.1%) | 257 (71.4%) |
Disability Status by Sex by Age in Hillcrest Heights
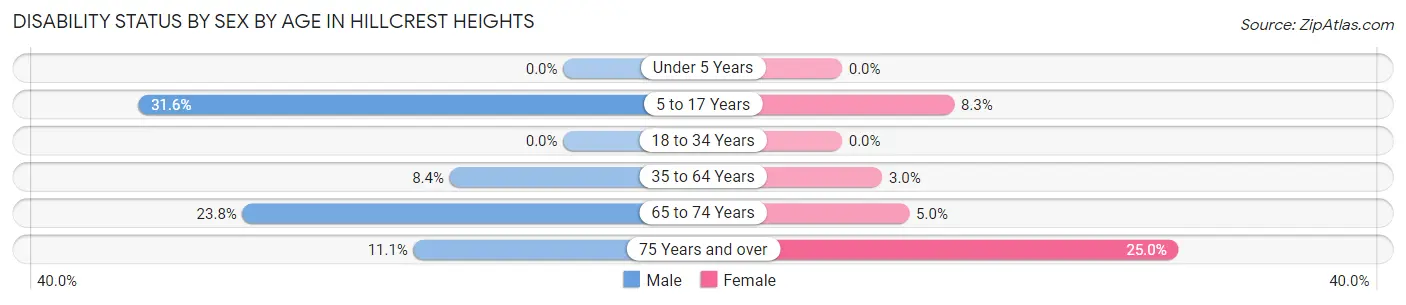
| Age Bracket | Male | Female |
| Under 5 Years | 0 (0.0%) | 0 (0.0%) |
| 5 to 17 Years | 6 (31.6%) | 3 (8.3%) |
| 18 to 34 Years | 0 (0.0%) | 0 (0.0%) |
| 35 to 64 Years | 7 (8.4%) | 2 (3.0%) |
| 65 to 74 Years | 5 (23.8%) | 2 (5.0%) |
| 75 Years and over | 2 (11.1%) | 4 (25.0%) |
Disability Class by Sex by Age in Hillcrest Heights
Disability Class: Hearing Difficulty
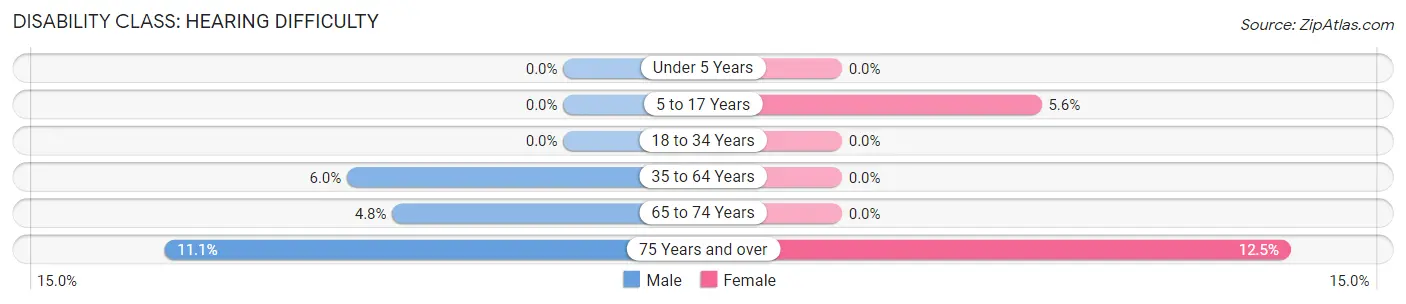
| Age Bracket | Male | Female |
| Under 5 Years | 0 (0.0%) | 0 (0.0%) |
| 5 to 17 Years | 0 (0.0%) | 2 (5.6%) |
| 18 to 34 Years | 0 (0.0%) | 0 (0.0%) |
| 35 to 64 Years | 5 (6.0%) | 0 (0.0%) |
| 65 to 74 Years | 1 (4.8%) | 0 (0.0%) |
| 75 Years and over | 2 (11.1%) | 2 (12.5%) |
Disability Class: Vision Difficulty
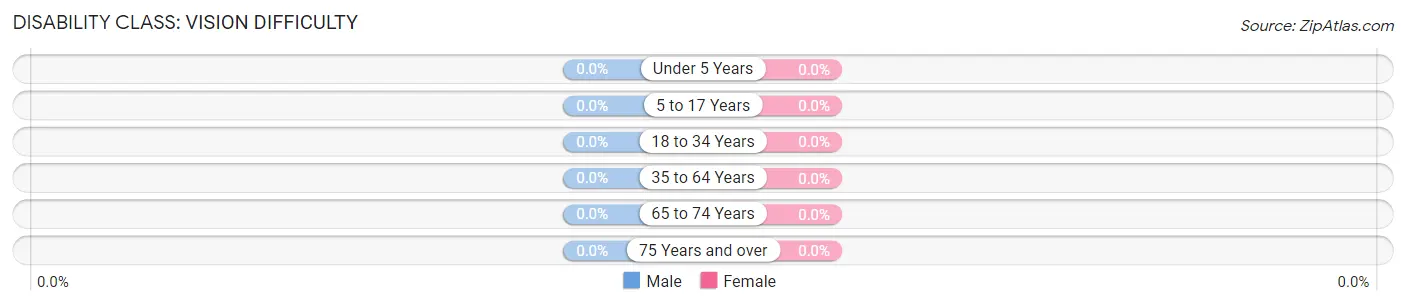
| Age Bracket | Male | Female |
| Under 5 Years | 0 (0.0%) | 0 (0.0%) |
| 5 to 17 Years | 0 (0.0%) | 0 (0.0%) |
| 18 to 34 Years | 0 (0.0%) | 0 (0.0%) |
| 35 to 64 Years | 0 (0.0%) | 0 (0.0%) |
| 65 to 74 Years | 0 (0.0%) | 0 (0.0%) |
| 75 Years and over | 0 (0.0%) | 0 (0.0%) |
Disability Class: Cognitive Difficulty
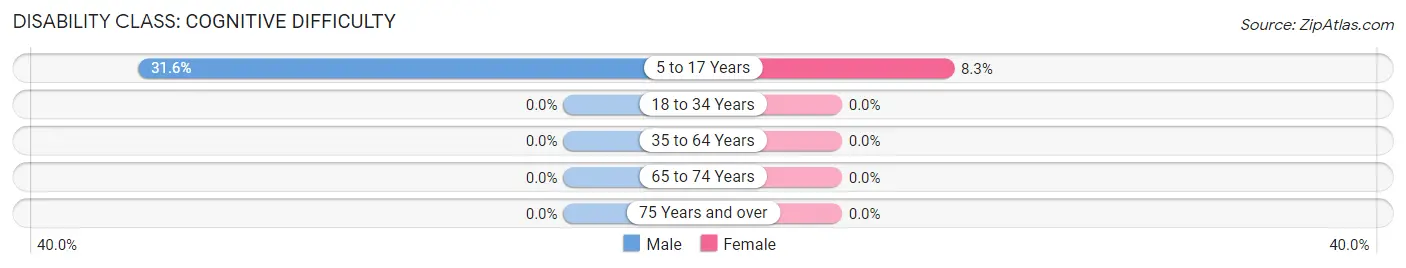
| Age Bracket | Male | Female |
| 5 to 17 Years | 6 (31.6%) | 3 (8.3%) |
| 18 to 34 Years | 0 (0.0%) | 0 (0.0%) |
| 35 to 64 Years | 0 (0.0%) | 0 (0.0%) |
| 65 to 74 Years | 0 (0.0%) | 0 (0.0%) |
| 75 Years and over | 0 (0.0%) | 0 (0.0%) |
Disability Class: Ambulatory Difficulty
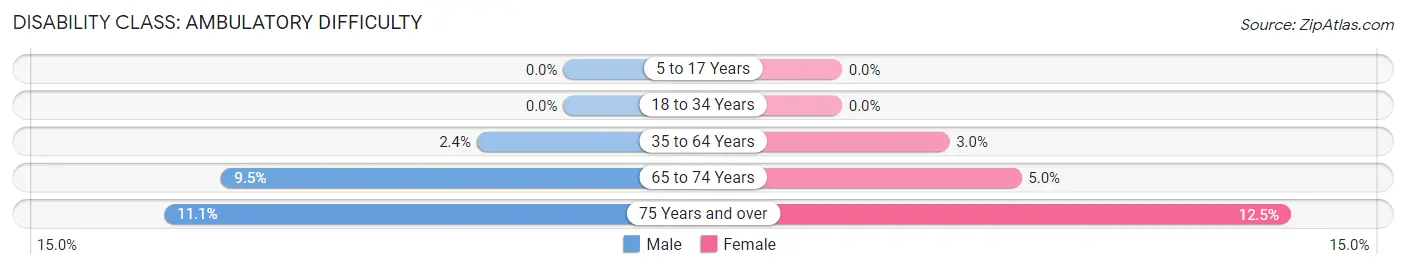
| Age Bracket | Male | Female |
| 5 to 17 Years | 0 (0.0%) | 0 (0.0%) |
| 18 to 34 Years | 0 (0.0%) | 0 (0.0%) |
| 35 to 64 Years | 2 (2.4%) | 2 (3.0%) |
| 65 to 74 Years | 2 (9.5%) | 2 (5.0%) |
| 75 Years and over | 2 (11.1%) | 2 (12.5%) |
Disability Class: Self-Care Difficulty
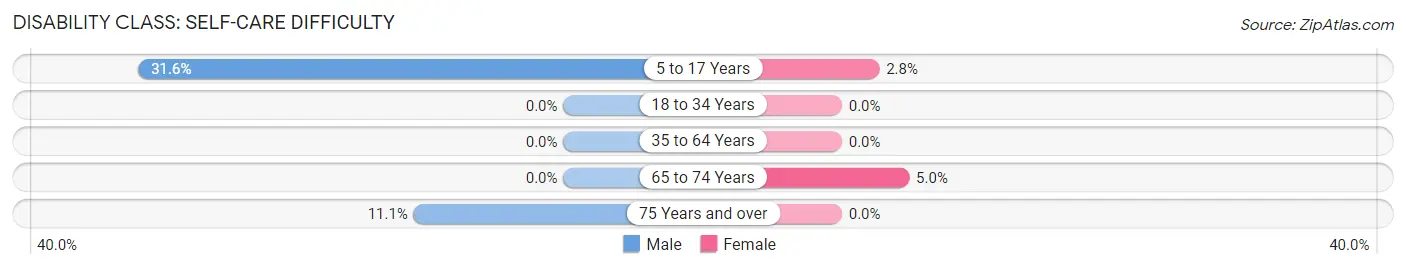
| Age Bracket | Male | Female |
| 5 to 17 Years | 6 (31.6%) | 1 (2.8%) |
| 18 to 34 Years | 0 (0.0%) | 0 (0.0%) |
| 35 to 64 Years | 0 (0.0%) | 0 (0.0%) |
| 65 to 74 Years | 0 (0.0%) | 2 (5.0%) |
| 75 Years and over | 2 (11.1%) | 0 (0.0%) |
Technology Access in Hillcrest Heights
Computing Device Access in Hillcrest Heights
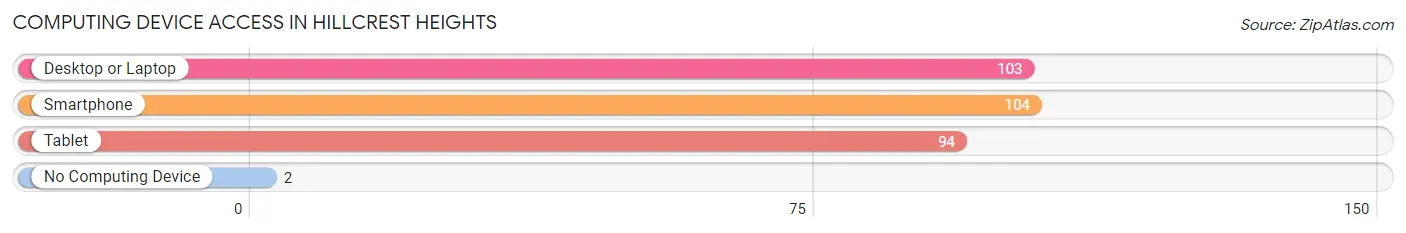
| Device Type | # Households | % Households |
| Desktop or Laptop | 103 | 90.3% |
| Smartphone | 104 | 91.2% |
| Tablet | 94 | 82.5% |
| No Computing Device | 2 | 1.8% |
| Total | 114 | 100.0% |
Internet Access in Hillcrest Heights
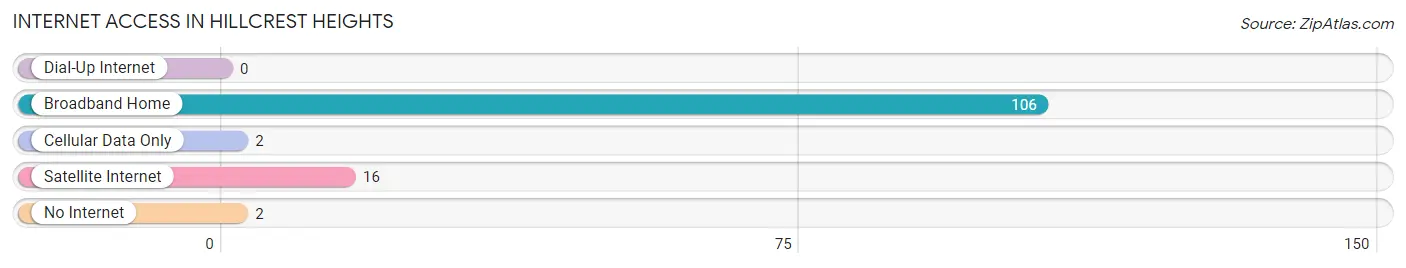
| Internet Type | # Households | % Households |
| Dial-Up Internet | 0 | 0.0% |
| Broadband Home | 106 | 93.0% |
| Cellular Data Only | 2 | 1.8% |
| Satellite Internet | 16 | 14.0% |
| No Internet | 2 | 1.8% |
| Total | 114 | 100.0% |
Hillcrest Heights Summary
Hillcrest Heights is a census-designated place (CDP) located in the southeastern corner of Pinellas County, Florida. It is part of the Tampa-St. Petersburg-Clearwater Metropolitan Statistical Area. The population was 2,845 at the 2010 census.
History
The area that is now Hillcrest Heights was originally inhabited by the Tocobaga people, who were part of the larger Timucua tribe. The Tocobaga lived in the area for centuries before the arrival of Europeans in the 16th century. The area was later settled by Spanish colonists, who established a mission in the area in the late 17th century.
In the early 19th century, the area was part of the United States, and was part of Hillsborough County. In 1887, Pinellas County was created from parts of Hillsborough and other counties, and the area that is now Hillcrest Heights became part of Pinellas County.
The area was largely rural until the 1950s, when it began to be developed as a residential area. The area was officially designated as Hillcrest Heights in the 1970s.
Geography
Hillcrest Heights is located at 28 02 45 North 82 45 45 West 28 04583 82 76250
According to the United States Census Bureau, the CDP has a total area of 0.9 square miles (2.3 km2), all land.
Economy
The economy of Hillcrest Heights is largely based on tourism and service industries. The area is home to several hotels and resorts, as well as restaurants and other businesses catering to tourists.
Demographics
As of the census of 2000, there were 2,845 people, 1,093 households, and 745 families residing in the CDP. The population density was 3,093.3 people per square mile (1,192.2/km2). There were 1,183 housing units at an average density of 1,279.3/sq mi (493.3/km2). The racial makeup of the CDP was 79.45% White, 11.90% African American, 0.35% Native American, 0.53% Asian, 0.04% Pacific Islander, 5.90% from other races, and 1.83% from two or more races. Hispanic or Latino of any race were 11.90% of the population.
There were 1,093 households, out of which 33.2% had children under the age of 18 living with them, 48.2% were married couples living together, 14.7% had a female householder with no husband present, and 30.7% were non-families. 24.2% of all households were made up of individuals, and 8.2% had someone living alone who was 65 years of age or older. The average household size was 2.60 and the average family size was 3.09.
In the CDP, the population was spread out, with 25.7% under the age of 18, 8.7% from 18 to 24, 30.2% from 25 to 44, 22.7% from 45 to 64, and 12.7% who were 65 years of age or older. The median age was 36 years. For every 100 females, there were 97.2 males. For every 100 females age 18 and over, there were 94.2 males.
The median income for a household in the CDP was $35,938, and the median income for a family was $41,250. Males had a median income of $30,938 versus $25,000 for females. The per capita income for the CDP was $17,845. About 10.2% of families and 12.3% of the population were below the poverty line, including 16.2% of those under age 18 and 8.2% of those age 65 or over.
Common Questions
What is Per Capita Income in Hillcrest Heights?
Per Capita income in Hillcrest Heights is $38,677.
What is the Median Family Income in Hillcrest Heights?
Median Family Income in Hillcrest Heights is $110,893.
What is the Median Household income in Hillcrest Heights?
Median Household Income in Hillcrest Heights is $110,536.
What is Income or Wage Gap in Hillcrest Heights?
Income or Wage Gap in Hillcrest Heights is 44.5%.
Women in Hillcrest Heights earn 55.5 cents for every dollar earned by a man.
What is Inequality or Gini Index in Hillcrest Heights?
Inequality or Gini Index in Hillcrest Heights is 0.30.
What is the Total Population of Hillcrest Heights?
Total Population of Hillcrest Heights is 360.
What is the Total Male Population of Hillcrest Heights?
Total Male Population of Hillcrest Heights is 171.
What is the Total Female Population of Hillcrest Heights?
Total Female Population of Hillcrest Heights is 189.
What is the Ratio of Males per 100 Females in Hillcrest Heights?
There are 90.48 Males per 100 Females in Hillcrest Heights.
What is the Ratio of Females per 100 Males in Hillcrest Heights?
There are 110.53 Females per 100 Males in Hillcrest Heights.
What is the Median Population Age in Hillcrest Heights?
Median Population Age in Hillcrest Heights is 55.2 Years.
What is the Average Family Size in Hillcrest Heights
Average Family Size in Hillcrest Heights is 3.4 People.
What is the Average Household Size in Hillcrest Heights
Average Household Size in Hillcrest Heights is 3.2 People.
How Large is the Labor Force in Hillcrest Heights?
There are 163 People in the Labor Forcein in Hillcrest Heights.
What is the Percentage of People in the Labor Force in Hillcrest Heights?
56.2% of People are in the Labor Force in Hillcrest Heights.
What is the Unemployment Rate in Hillcrest Heights?
Unemployment Rate in Hillcrest Heights is 1.8%.