Brownsdale, FL Map & Demographics
Brownsdale Map
Brownsdale Overview
$33,363
PER CAPITA INCOME
$127,708
AVG FAMILY INCOME
$86,250
AVG HOUSEHOLD INCOME
42.4%
WAGE / INCOME GAP [ % ]
57.6¢/ $1
WAGE / INCOME GAP [ $ ]
0.28
INEQUALITY / GINI INDEX
389
TOTAL POPULATION
147
MALE POPULATION
242
FEMALE POPULATION
60.74
MALES / 100 FEMALES
164.63
FEMALES / 100 MALES
43.7
MEDIAN AGE
3.6
AVG FAMILY SIZE
3.0
AVG HOUSEHOLD SIZE
161
LABOR FORCE [ PEOPLE ]
50.5%
PERCENT IN LABOR FORCE
Income in Brownsdale
Income Overview in Brownsdale
Per Capita Income in Brownsdale is $33,363, while median incomes of families and households are $127,708 and $86,250 respectively.
| Characteristic | Number | Measure |
| Per Capita Income | 389 | $33,363 |
| Median Family Income | 99 | $127,708 |
| Mean Family Income | 99 | $112,531 |
| Median Household Income | 132 | $86,250 |
| Mean Household Income | 132 | $94,491 |
| Income Deficit | 99 | $0 |
| Wage / Income Gap (%) | 389 | 42.36% |
| Wage / Income Gap ($) | 389 | 57.64¢ per $1 |
| Gini / Inequality Index | 389 | 0.28 |
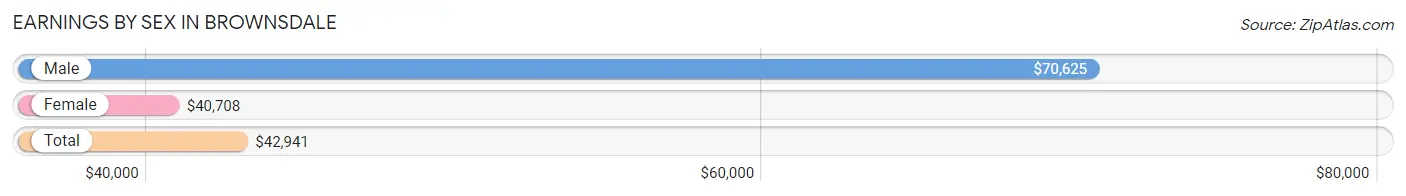
Earnings by Sex in Brownsdale
Average Earnings in Brownsdale are $42,941, $70,625 for men and $40,708 for women, a difference of 42.4%.
| Sex | Number | Average Earnings |
| Male | 59 (33.9%) | $70,625 |
| Female | 115 (66.1%) | $40,708 |
| Total | 174 (100.0%) | $42,941 |
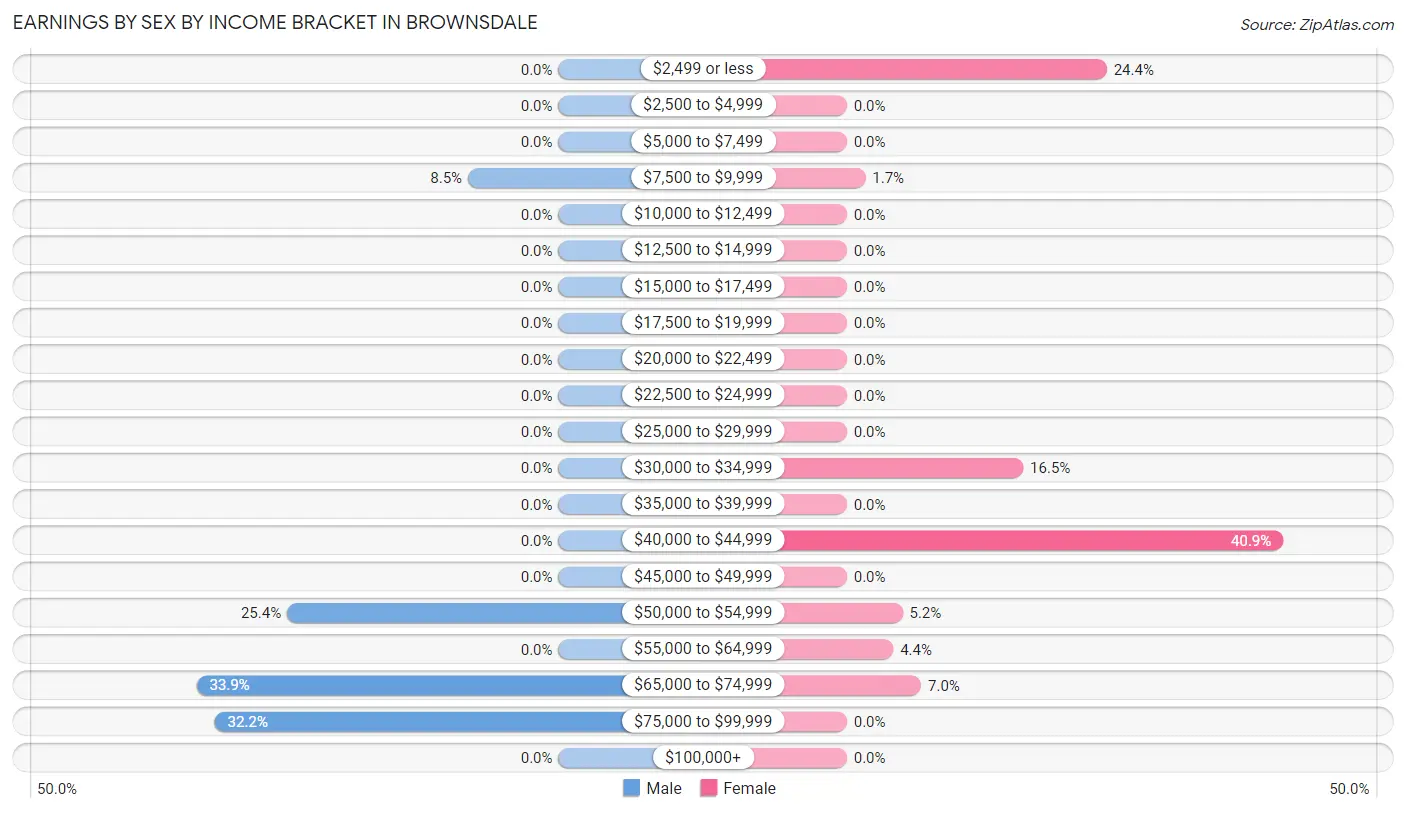
Earnings by Sex by Income Bracket in Brownsdale
The most common earnings brackets in Brownsdale are $65,000 to $74,999 for men (20 | 33.9%) and $40,000 to $44,999 for women (47 | 40.9%).
| Income | Male | Female |
| $2,499 or less | 0 (0.0%) | 28 (24.3%) |
| $2,500 to $4,999 | 0 (0.0%) | 0 (0.0%) |
| $5,000 to $7,499 | 0 (0.0%) | 0 (0.0%) |
| $7,500 to $9,999 | 5 (8.5%) | 2 (1.7%) |
| $10,000 to $12,499 | 0 (0.0%) | 0 (0.0%) |
| $12,500 to $14,999 | 0 (0.0%) | 0 (0.0%) |
| $15,000 to $17,499 | 0 (0.0%) | 0 (0.0%) |
| $17,500 to $19,999 | 0 (0.0%) | 0 (0.0%) |
| $20,000 to $22,499 | 0 (0.0%) | 0 (0.0%) |
| $22,500 to $24,999 | 0 (0.0%) | 0 (0.0%) |
| $25,000 to $29,999 | 0 (0.0%) | 0 (0.0%) |
| $30,000 to $34,999 | 0 (0.0%) | 19 (16.5%) |
| $35,000 to $39,999 | 0 (0.0%) | 0 (0.0%) |
| $40,000 to $44,999 | 0 (0.0%) | 47 (40.9%) |
| $45,000 to $49,999 | 0 (0.0%) | 0 (0.0%) |
| $50,000 to $54,999 | 15 (25.4%) | 6 (5.2%) |
| $55,000 to $64,999 | 0 (0.0%) | 5 (4.3%) |
| $65,000 to $74,999 | 20 (33.9%) | 8 (7.0%) |
| $75,000 to $99,999 | 19 (32.2%) | 0 (0.0%) |
| $100,000+ | 0 (0.0%) | 0 (0.0%) |
| Total | 59 (100.0%) | 115 (100.0%) |
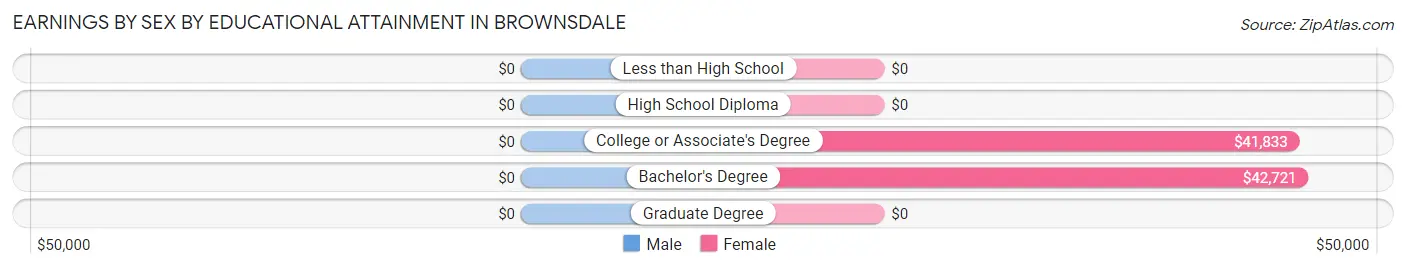
Earnings by Sex by Educational Attainment in Brownsdale
| Educational Attainment | Male Income | Female Income |
| Less than High School | - | - |
| High School Diploma | - | - |
| College or Associate's Degree | - | - |
| Bachelor's Degree | - | - |
| Graduate Degree | - | - |
| Total | $71,875 | $41,875 |
Family Income in Brownsdale
Family Income Brackets in Brownsdale
According to the Brownsdale family income data, there are 43 families falling into the $100,000 to $149,999 income range, which is the most common income bracket and makes up 43.4% of all families.
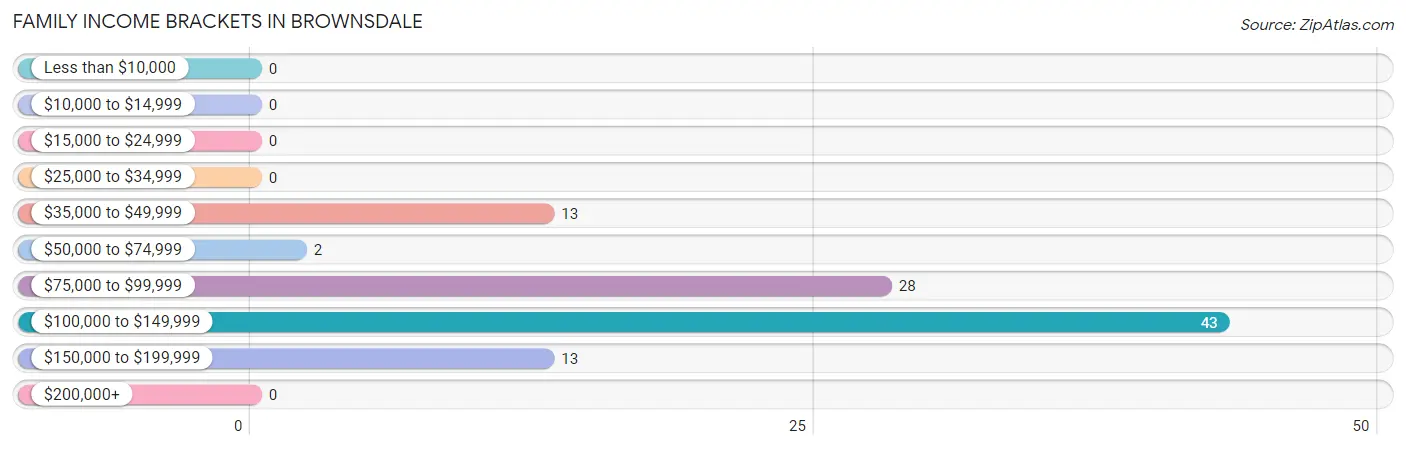
| Income Bracket | # Families | % Families |
| Less than $10,000 | 0 | 0.0% |
| $10,000 to $14,999 | 0 | 0.0% |
| $15,000 to $24,999 | 0 | 0.0% |
| $25,000 to $34,999 | 0 | 0.0% |
| $35,000 to $49,999 | 13 | 13.1% |
| $50,000 to $74,999 | 2 | 2.0% |
| $75,000 to $99,999 | 28 | 28.3% |
| $100,000 to $149,999 | 43 | 43.4% |
| $150,000 to $199,999 | 13 | 13.1% |
| $200,000+ | 0 | 0.0% |
Family Income by Famaliy Size in Brownsdale
2-person families (55 | 55.6%) account for the highest median family income in Brownsdale with $84,732 per family, while 2-person families (55 | 55.6%) have the highest median income of $42,366 per family member.
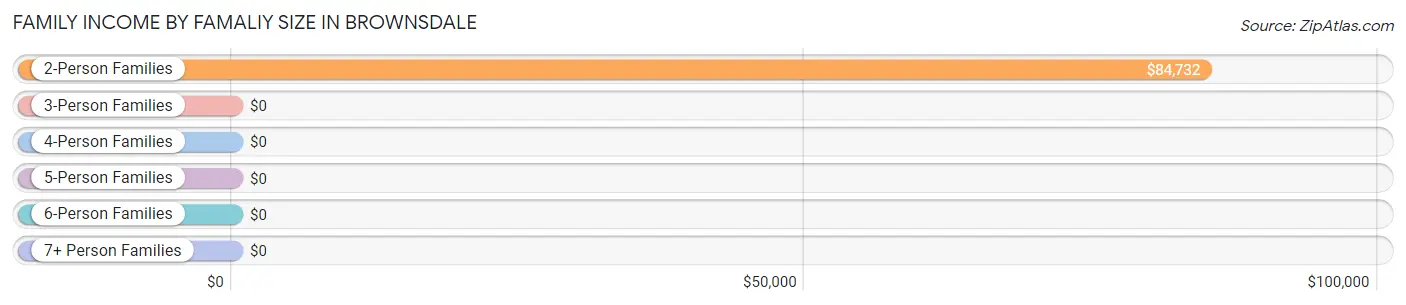
| Income Bracket | # Families | Median Income |
| 2-Person Families | 55 (55.6%) | $84,732 |
| 3-Person Families | 0 (0.0%) | $0 |
| 4-Person Families | 6 (6.1%) | $0 |
| 5-Person Families | 25 (25.3%) | $0 |
| 6-Person Families | 13 (13.1%) | $0 |
| 7+ Person Families | 0 (0.0%) | $0 |
| Total | 99 (100.0%) | $127,708 |
Family Income by Number of Earners in Brownsdale
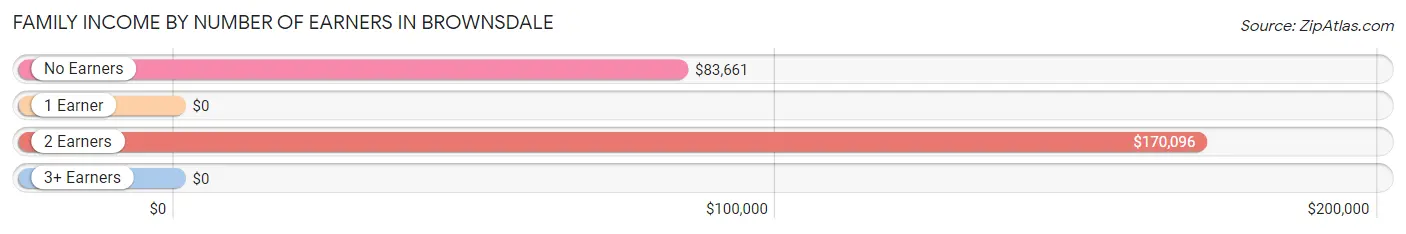
| Number of Earners | # Families | Median Income |
| No Earners | 39 (39.4%) | $83,661 |
| 1 Earner | 10 (10.1%) | $0 |
| 2 Earners | 25 (25.3%) | $170,096 |
| 3+ Earners | 25 (25.3%) | $0 |
| Total | 99 (100.0%) | $127,708 |
Household Income in Brownsdale
Household Income Brackets in Brownsdale
With 46 households falling in the category, the $35,000 to $49,999 income range is the most frequent in Brownsdale, accounting for 34.8% of all households.
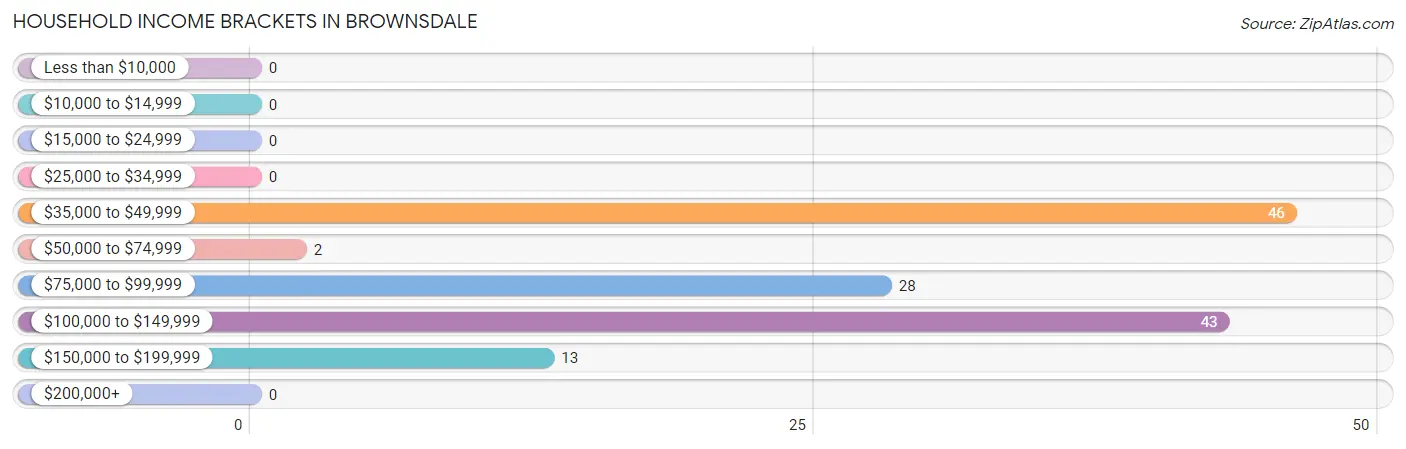
| Income Bracket | # Households | % Households |
| Less than $10,000 | 0 | 0.0% |
| $10,000 to $14,999 | 0 | 0.0% |
| $15,000 to $24,999 | 0 | 0.0% |
| $25,000 to $34,999 | 0 | 0.0% |
| $35,000 to $49,999 | 46 | 34.8% |
| $50,000 to $74,999 | 2 | 1.5% |
| $75,000 to $99,999 | 28 | 21.2% |
| $100,000 to $149,999 | 43 | 32.6% |
| $150,000 to $199,999 | 13 | 9.8% |
| $200,000+ | 0 | 0.0% |
Household Income by Householder Age in Brownsdale
The median household income in Brownsdale is $86,250, with the highest median household income of $128,542 found in the 45 to 64 years age bracket for the primary householder. A total of 33 households (25.0%) fall into this category.
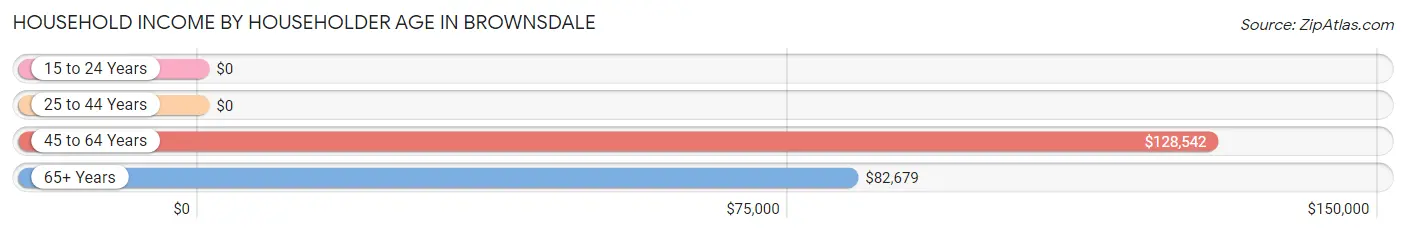
| Income Bracket | # Households | Median Income |
| 15 to 24 Years | 0 (0.0%) | $0 |
| 25 to 44 Years | 49 (37.1%) | $0 |
| 45 to 64 Years | 33 (25.0%) | $128,542 |
| 65+ Years | 50 (37.9%) | $82,679 |
| Total | 132 (100.0%) | $86,250 |
Poverty in Brownsdale
Income Below Poverty by Sex and Age in Brownsdale
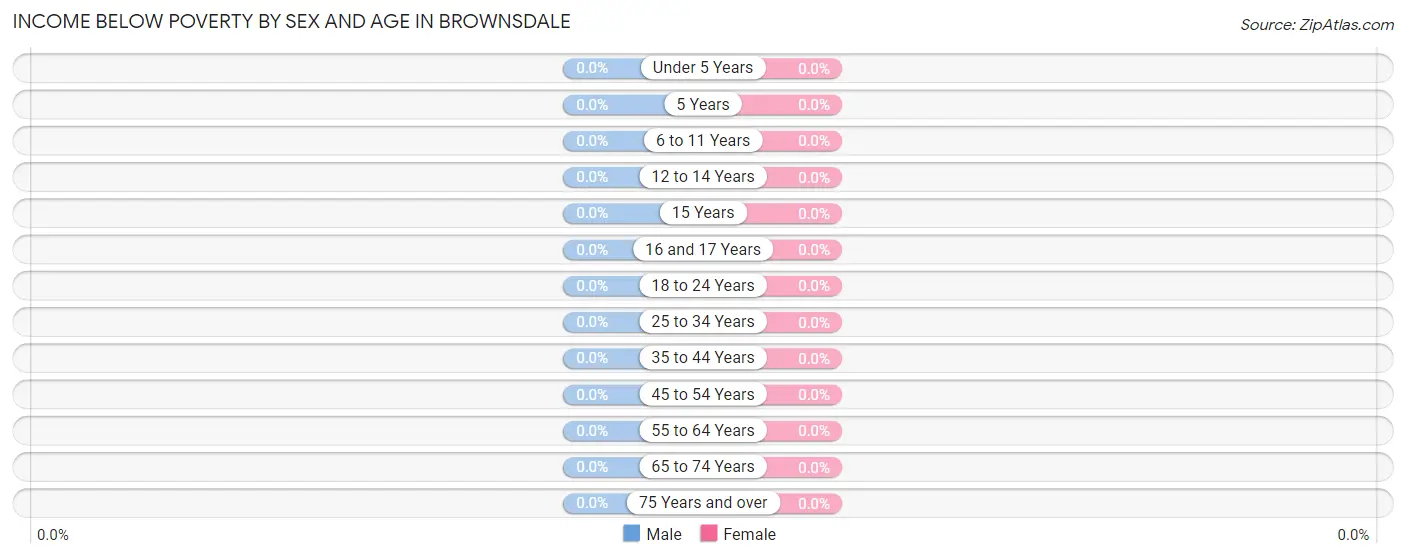
| Age Bracket | Male | Female |
| Under 5 Years | 0 (0.0%) | 0 (0.0%) |
| 5 Years | 0 (0.0%) | 0 (0.0%) |
| 6 to 11 Years | 0 (0.0%) | 0 (0.0%) |
| 12 to 14 Years | 0 (0.0%) | 0 (0.0%) |
| 15 Years | 0 (0.0%) | 0 (0.0%) |
| 16 and 17 Years | 0 (0.0%) | 0 (0.0%) |
| 18 to 24 Years | 0 (0.0%) | 0 (0.0%) |
| 25 to 34 Years | 0 (0.0%) | 0 (0.0%) |
| 35 to 44 Years | 0 (0.0%) | 0 (0.0%) |
| 45 to 54 Years | 0 (0.0%) | 0 (0.0%) |
| 55 to 64 Years | 0 (0.0%) | 0 (0.0%) |
| 65 to 74 Years | 0 (0.0%) | 0 (0.0%) |
| 75 Years and over | 0 (0.0%) | 0 (0.0%) |
| Total | 0 (0.0%) | 0 (0.0%) |
Income Above Poverty by Sex and Age in Brownsdale
According to the poverty statistics in Brownsdale, males aged 15 years and females aged under 5 years are the age groups that are most secure financially, with 100.0% of males and 100.0% of females in these age groups living above the poverty line.
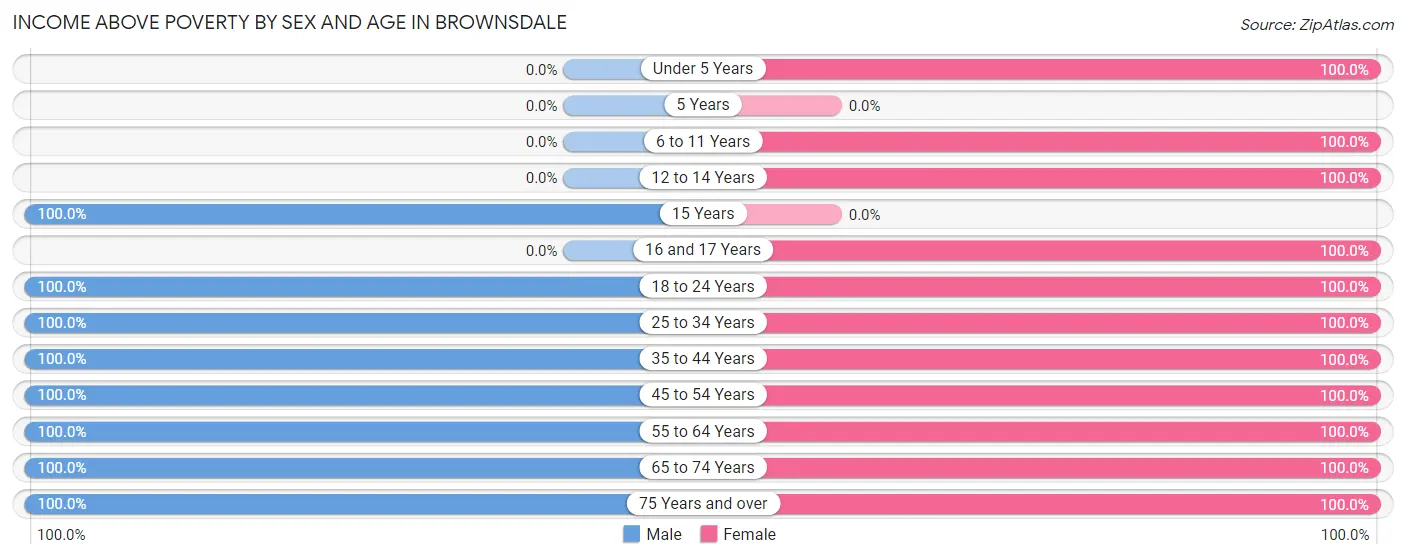
| Age Bracket | Male | Female |
| Under 5 Years | 0 (0.0%) | 30 (100.0%) |
| 5 Years | 0 (0.0%) | 0 (0.0%) |
| 6 to 11 Years | 0 (0.0%) | 18 (100.0%) |
| 12 to 14 Years | 0 (0.0%) | 5 (100.0%) |
| 15 Years | 17 (100.0%) | 0 (0.0%) |
| 16 and 17 Years | 0 (0.0%) | 27 (100.0%) |
| 18 to 24 Years | 14 (100.0%) | 13 (100.0%) |
| 25 to 34 Years | 22 (100.0%) | 19 (100.0%) |
| 35 to 44 Years | 19 (100.0%) | 47 (100.0%) |
| 45 to 54 Years | 6 (100.0%) | 11 (100.0%) |
| 55 to 64 Years | 20 (100.0%) | 21 (100.0%) |
| 65 to 74 Years | 24 (100.0%) | 29 (100.0%) |
| 75 Years and over | 25 (100.0%) | 22 (100.0%) |
| Total | 147 (100.0%) | 242 (100.0%) |
Income Below Poverty Among Married-Couple Families in Brownsdale
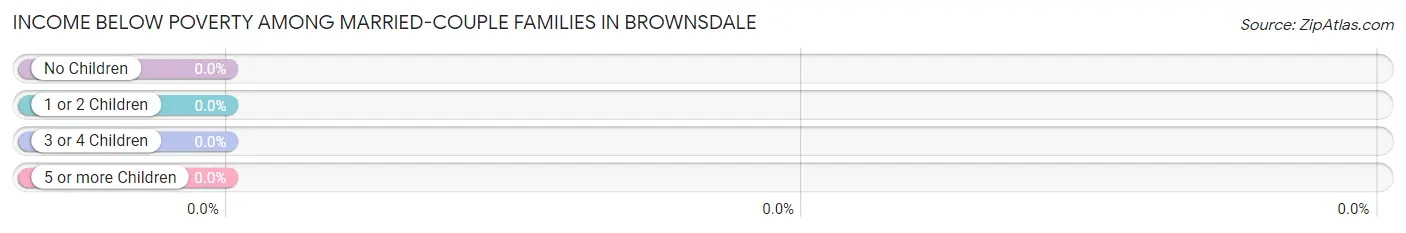
| Children | Above Poverty | Below Poverty |
| No Children | 55 (100.0%) | 0 (0.0%) |
| 1 or 2 Children | 19 (100.0%) | 0 (0.0%) |
| 3 or 4 Children | 19 (100.0%) | 0 (0.0%) |
| 5 or more Children | 0 (0.0%) | 0 (0.0%) |
| Total | 93 (100.0%) | 0 (0.0%) |
Income Below Poverty Among Single-Parent Households in Brownsdale
| Children | Single Father | Single Mother |
| No Children | 0 (0.0%) | 0 (0.0%) |
| 1 or 2 Children | 0 (0.0%) | 0 (0.0%) |
| 3 or 4 Children | 0 (0.0%) | 0 (0.0%) |
| 5 or more Children | 0 (0.0%) | 0 (0.0%) |
| Total | 0 (0.0%) | 0 (0.0%) |
Income Below Poverty Among Married-Couple vs Single-Parent Households in Brownsdale
| Children | Married-Couple Families | Single-Parent Households |
| No Children | 0 (0.0%) | 0 (0.0%) |
| 1 or 2 Children | 0 (0.0%) | 0 (0.0%) |
| 3 or 4 Children | 0 (0.0%) | 0 (0.0%) |
| 5 or more Children | 0 (0.0%) | 0 (0.0%) |
| Total | 0 (0.0%) | 0 (0.0%) |
Race in Brownsdale
The most populous races in Brownsdale are White / Caucasian (354 | 91.0%), Asian (30 | 7.7%), and Two or more Races (5 | 1.3%).
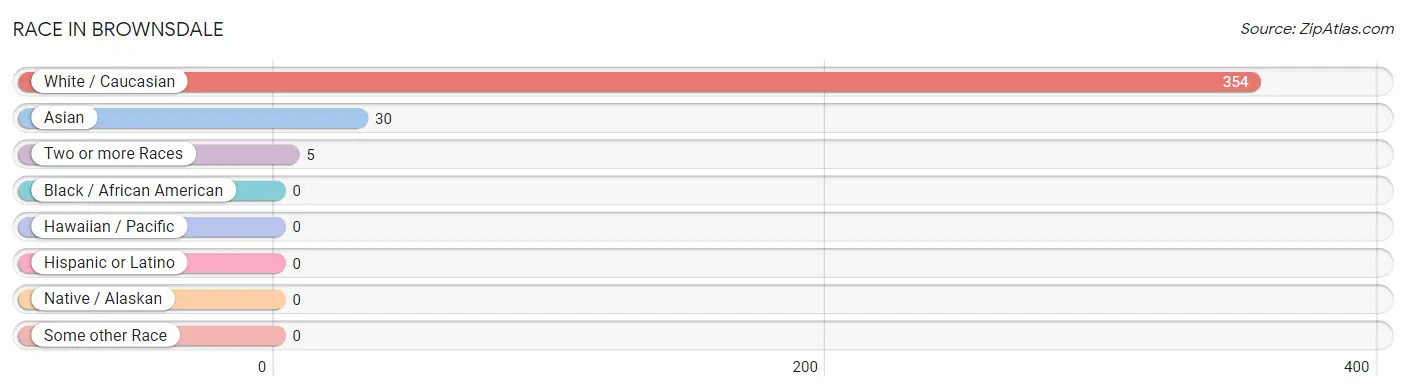
| Race | # Population | % Population |
| Asian | 30 | 7.7% |
| Black / African American | 0 | 0.0% |
| Hawaiian / Pacific | 0 | 0.0% |
| Hispanic or Latino | 0 | 0.0% |
| Native / Alaskan | 0 | 0.0% |
| White / Caucasian | 354 | 91.0% |
| Two or more Races | 5 | 1.3% |
| Some other Race | 0 | 0.0% |
| Total | 389 | 100.0% |
Ancestry in Brownsdale
The most populous ancestries reported in Brownsdale are Irish (62 | 15.9%), American (52 | 13.4%), German (49 | 12.6%), Welsh (22 | 5.7%), and English (13 | 3.3%), together accounting for 50.9% of all Brownsdale residents.
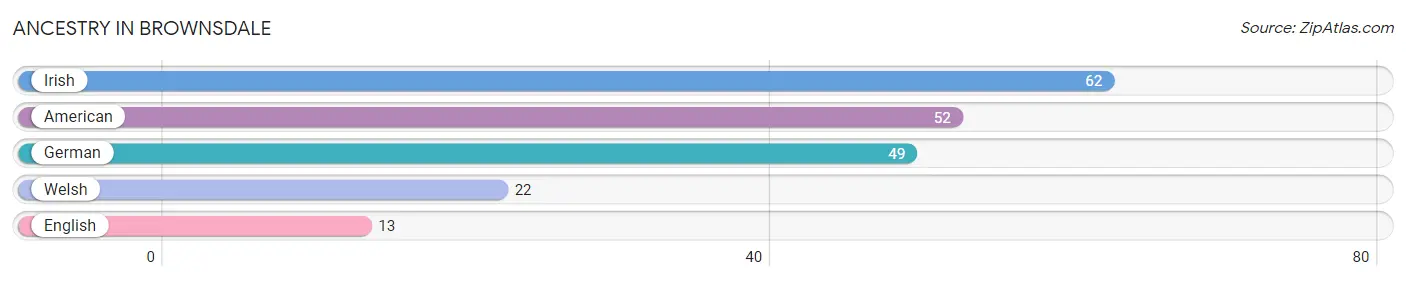
| Ancestry | # Population | % Population |
| American | 52 | 13.4% |
| English | 13 | 3.3% |
| German | 49 | 12.6% |
| Irish | 62 | 15.9% |
| Welsh | 22 | 5.7% | View All 5 Rows |
Immigrants in Brownsdale
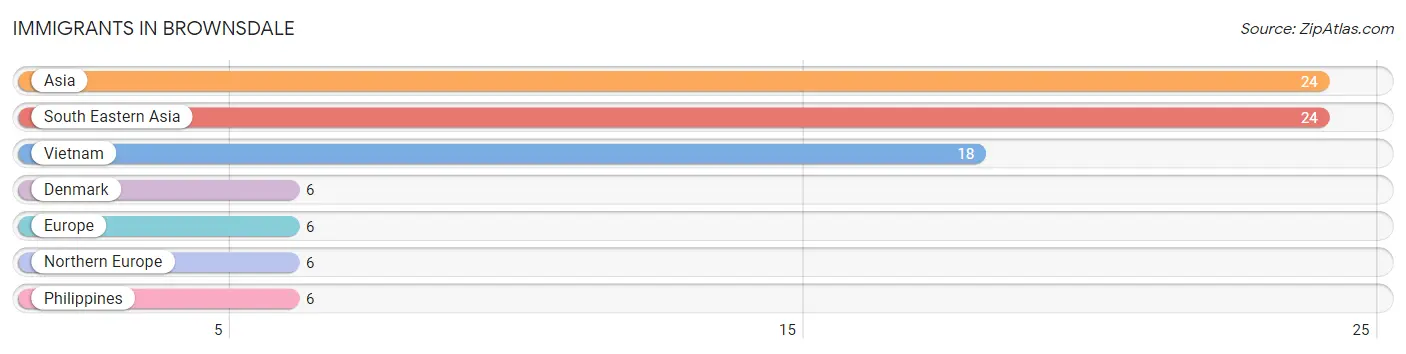
The most numerous immigrant groups reported in Brownsdale came from Asia (24 | 6.2%), South Eastern Asia (24 | 6.2%), Vietnam (18 | 4.6%), Denmark (6 | 1.5%), and Europe (6 | 1.5%), together accounting for 20.0% of all Brownsdale residents.
| Immigration Origin | # Population | % Population |
| Asia | 24 | 6.2% |
| Denmark | 6 | 1.5% |
| Europe | 6 | 1.5% |
| Northern Europe | 6 | 1.5% |
| Philippines | 6 | 1.5% |
| South Eastern Asia | 24 | 6.2% |
| Vietnam | 18 | 4.6% | View All 7 Rows |
Sex and Age in Brownsdale
Sex and Age in Brownsdale
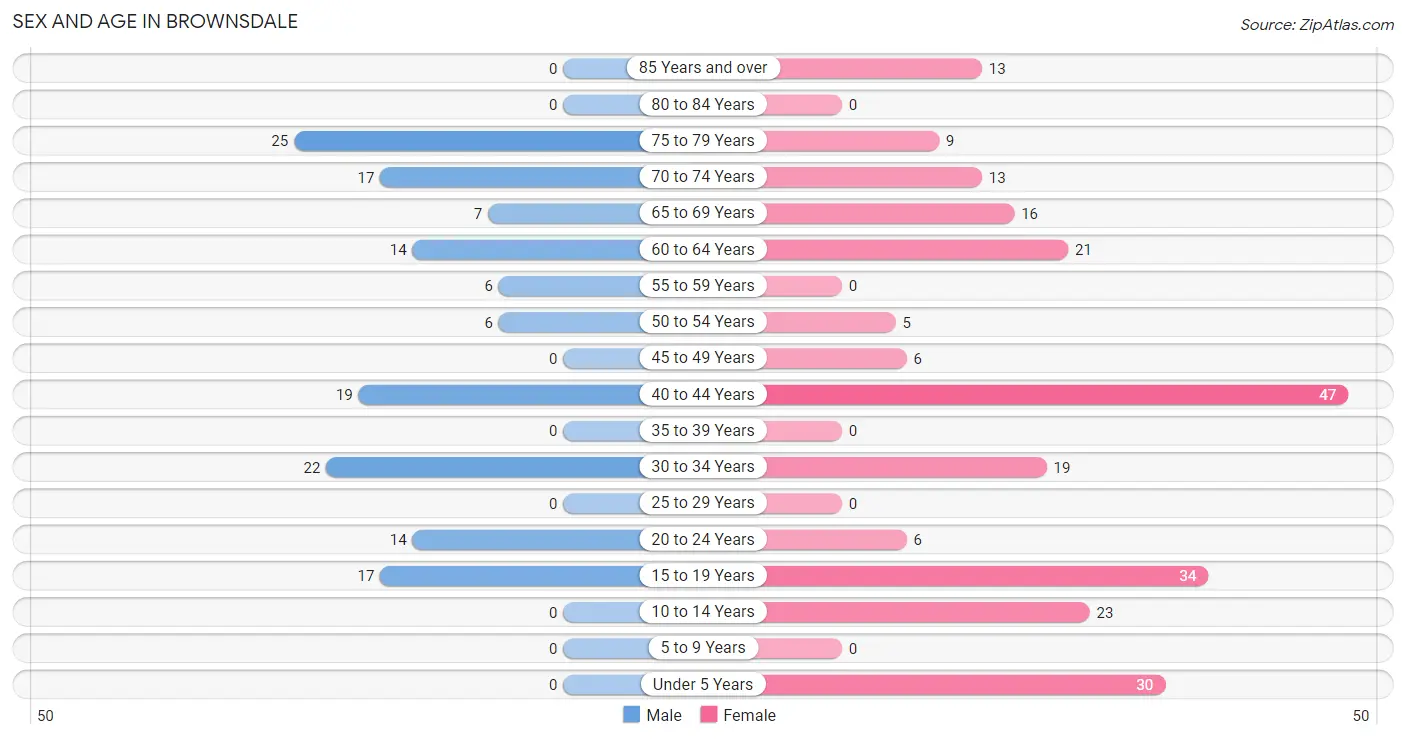
The most populous age groups in Brownsdale are 75 to 79 Years (25 | 17.0%) for men and 40 to 44 Years (47 | 19.4%) for women.
| Age Bracket | Male | Female |
| Under 5 Years | 0 (0.0%) | 30 (12.4%) |
| 5 to 9 Years | 0 (0.0%) | 0 (0.0%) |
| 10 to 14 Years | 0 (0.0%) | 23 (9.5%) |
| 15 to 19 Years | 17 (11.6%) | 34 (14.1%) |
| 20 to 24 Years | 14 (9.5%) | 6 (2.5%) |
| 25 to 29 Years | 0 (0.0%) | 0 (0.0%) |
| 30 to 34 Years | 22 (15.0%) | 19 (7.9%) |
| 35 to 39 Years | 0 (0.0%) | 0 (0.0%) |
| 40 to 44 Years | 19 (12.9%) | 47 (19.4%) |
| 45 to 49 Years | 0 (0.0%) | 6 (2.5%) |
| 50 to 54 Years | 6 (4.1%) | 5 (2.1%) |
| 55 to 59 Years | 6 (4.1%) | 0 (0.0%) |
| 60 to 64 Years | 14 (9.5%) | 21 (8.7%) |
| 65 to 69 Years | 7 (4.8%) | 16 (6.6%) |
| 70 to 74 Years | 17 (11.6%) | 13 (5.4%) |
| 75 to 79 Years | 25 (17.0%) | 9 (3.7%) |
| 80 to 84 Years | 0 (0.0%) | 0 (0.0%) |
| 85 Years and over | 0 (0.0%) | 13 (5.4%) |
| Total | 147 (100.0%) | 242 (100.0%) |
Families and Households in Brownsdale
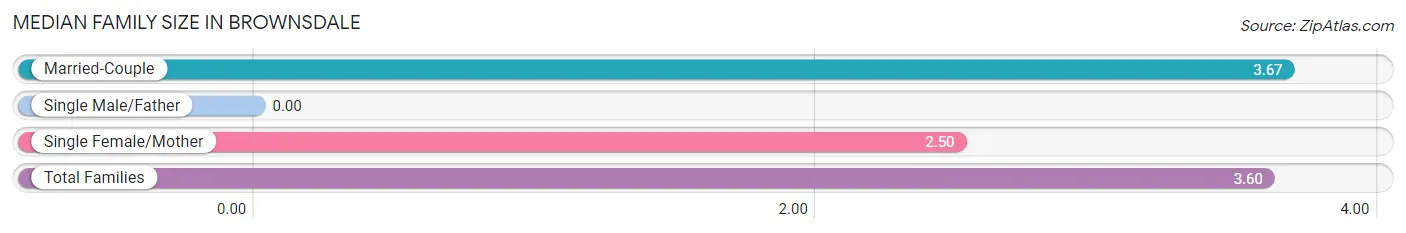
Median Family Size in Brownsdale
| Family Type | # Families | Family Size |
| Married-Couple | 93 (93.9%) | 3.67 |
| Single Male/Father | 0 (0.0%) | - |
| Single Female/Mother | 6 (6.1%) | 2.50 |
| Total Families | 99 (100.0%) | 3.60 |
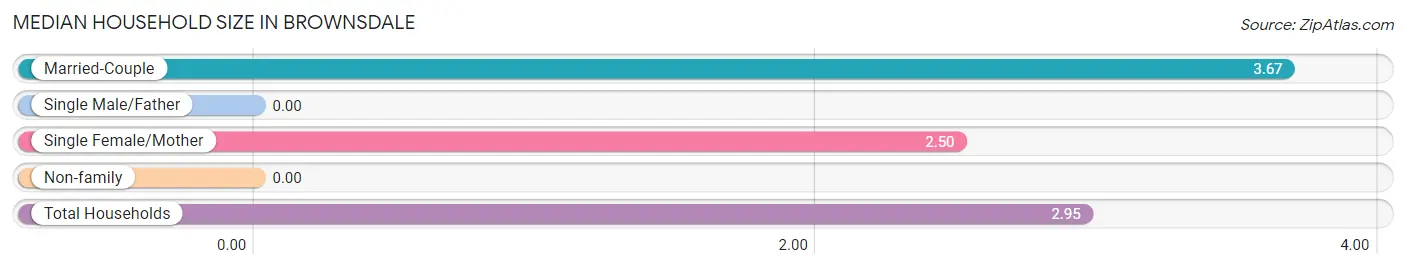
Median Household Size in Brownsdale
| Household Type | # Households | Household Size |
| Married-Couple | 93 (70.5%) | 3.67 |
| Single Male/Father | 0 (0.0%) | - |
| Single Female/Mother | 6 (4.5%) | 2.50 |
| Non-family | 33 (25.0%) | - |
| Total Households | 132 (100.0%) | 2.95 |
Household Size by Marriage Status in Brownsdale
Out of a total of 132 households in Brownsdale, 99 (75.0%) are family households, while 33 (25.0%) are nonfamily households. The most numerous type of family households are 2-person households, comprising 55, and the most common type of nonfamily households are 1-person households, comprising 33.
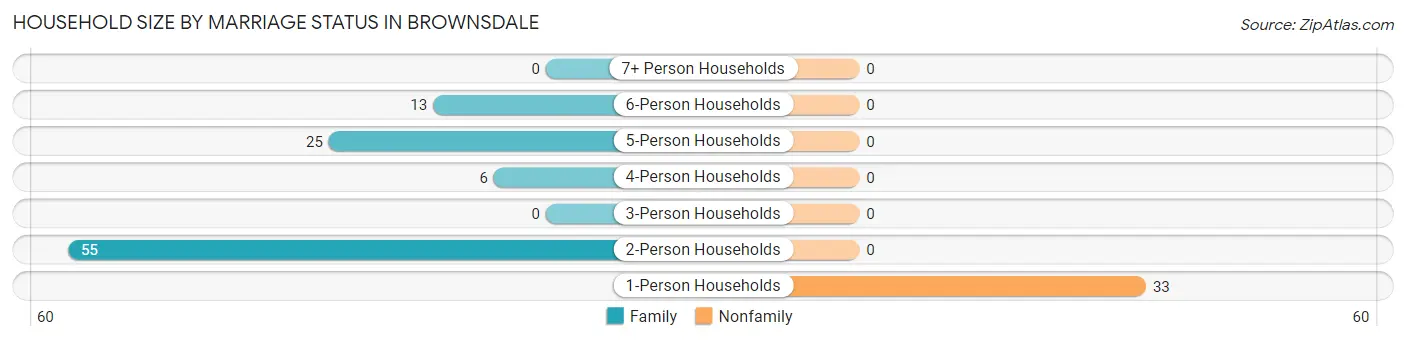
| Household Size | Family Households | Nonfamily Households |
| 1-Person Households | - | 33 (25.0%) |
| 2-Person Households | 55 (41.7%) | 0 (0.0%) |
| 3-Person Households | 0 (0.0%) | 0 (0.0%) |
| 4-Person Households | 6 (4.5%) | 0 (0.0%) |
| 5-Person Households | 25 (18.9%) | 0 (0.0%) |
| 6-Person Households | 13 (9.9%) | 0 (0.0%) |
| 7+ Person Households | 0 (0.0%) | 0 (0.0%) |
| Total | 99 (75.0%) | 33 (25.0%) |
Female Fertility in Brownsdale
Fertility by Age in Brownsdale
Average fertility rate in Brownsdale is 162.0 births per 1,000 women. Women in the age bracket of 20 to 34 years have the highest fertility rate with 760.0 births per 1,000 women. Women in the age bracket of 20 to 34 years acount for 100.0% of all women with births.
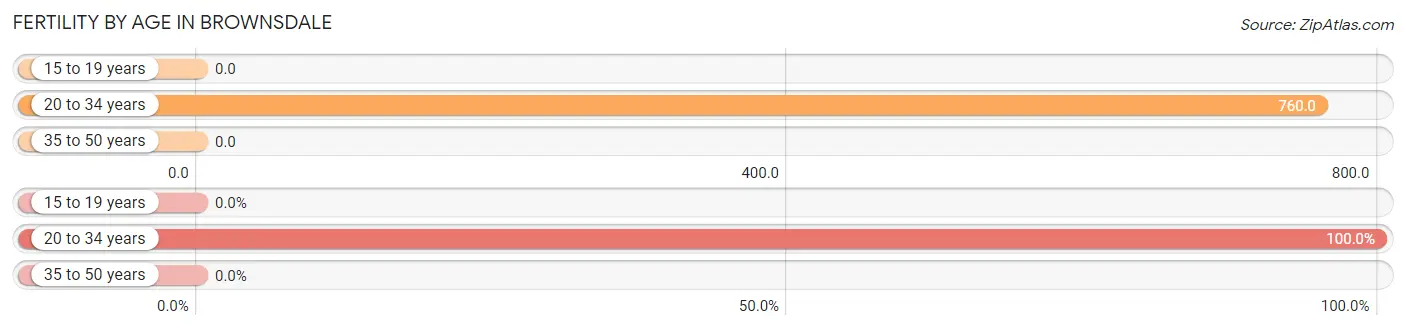
| Age Bracket | Women with Births | Births / 1,000 Women |
| 15 to 19 years | 0 (0.0%) | 0.0 |
| 20 to 34 years | 19 (100.0%) | 760.0 |
| 35 to 50 years | 0 (0.0%) | 0.0 |
| Total | 19 (100.0%) | 162.0 |
Fertility by Age by Marriage Status in Brownsdale
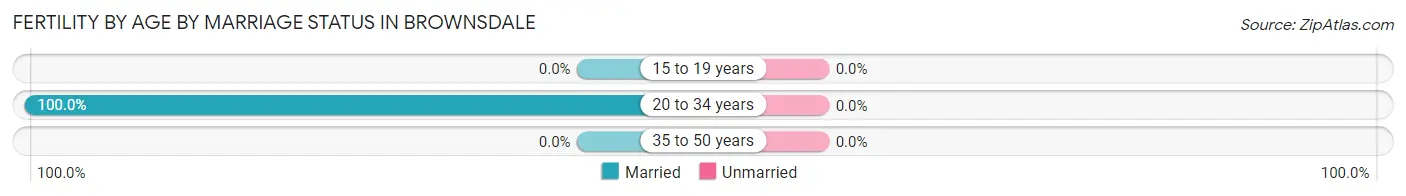
| Age Bracket | Married | Unmarried |
| 15 to 19 years | 0 (0.0%) | 0 (0.0%) |
| 20 to 34 years | 19 (100.0%) | 0 (0.0%) |
| 35 to 50 years | 0 (0.0%) | 0 (0.0%) |
| Total | 19 (100.0%) | 0 (0.0%) |
Fertility by Education in Brownsdale
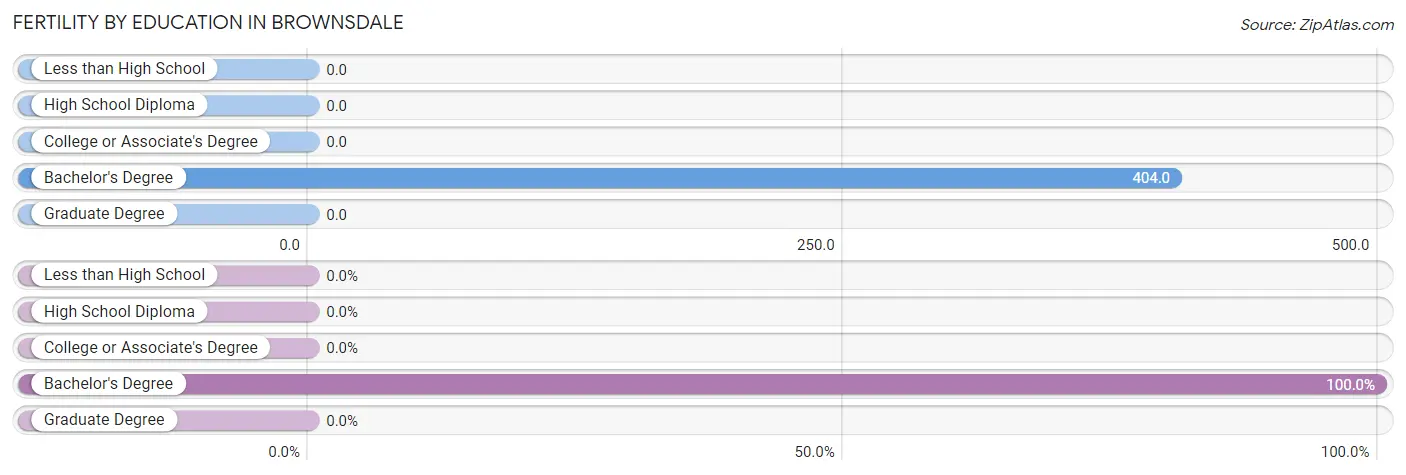
| Educational Attainment | Women with Births | Births / 1,000 Women |
| Less than High School | 0 (0.0%) | 0.0 |
| High School Diploma | 0 (0.0%) | 0.0 |
| College or Associate's Degree | 0 (0.0%) | 0.0 |
| Bachelor's Degree | 19 (100.0%) | 404.0 |
| Graduate Degree | 0 (0.0%) | 0.0 |
| Total | 19 (100.0%) | 162.0 |
Fertility by Education by Marriage Status in Brownsdale
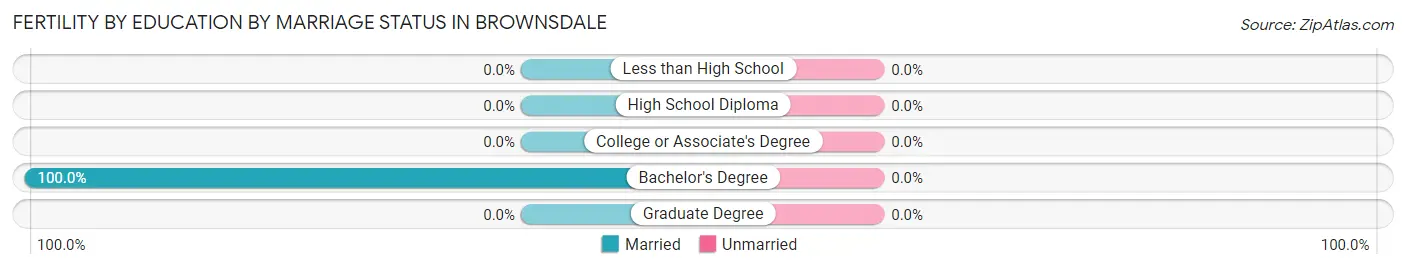
| Educational Attainment | Married | Unmarried |
| Less than High School | 0 (0.0%) | 0 (0.0%) |
| High School Diploma | 0 (0.0%) | 0 (0.0%) |
| College or Associate's Degree | 0 (0.0%) | 0 (0.0%) |
| Bachelor's Degree | 19 (100.0%) | 0 (0.0%) |
| Graduate Degree | 0 (0.0%) | 0 (0.0%) |
| Total | 19 (100.0%) | 0 (0.0%) |
Employment Characteristics in Brownsdale
Employment by Class of Employer in Brownsdale
Among the 161 employed individuals in Brownsdale, private company employees (77 | 47.8%), local government employees (38 | 23.6%), and unpaid family workers (21 | 13.0%) make up the most common classes of employment.
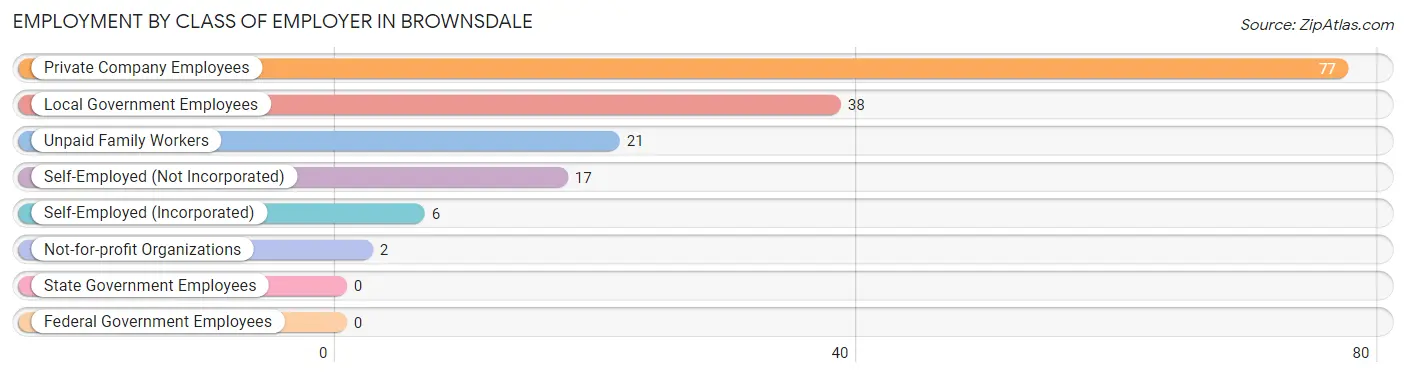
| Employer Class | # Employees | % Employees |
| Private Company Employees | 77 | 47.8% |
| Self-Employed (Incorporated) | 6 | 3.7% |
| Self-Employed (Not Incorporated) | 17 | 10.6% |
| Not-for-profit Organizations | 2 | 1.2% |
| Local Government Employees | 38 | 23.6% |
| State Government Employees | 0 | 0.0% |
| Federal Government Employees | 0 | 0.0% |
| Unpaid Family Workers | 21 | 13.0% |
| Total | 161 | 100.0% |
Employment Status by Age in Brownsdale
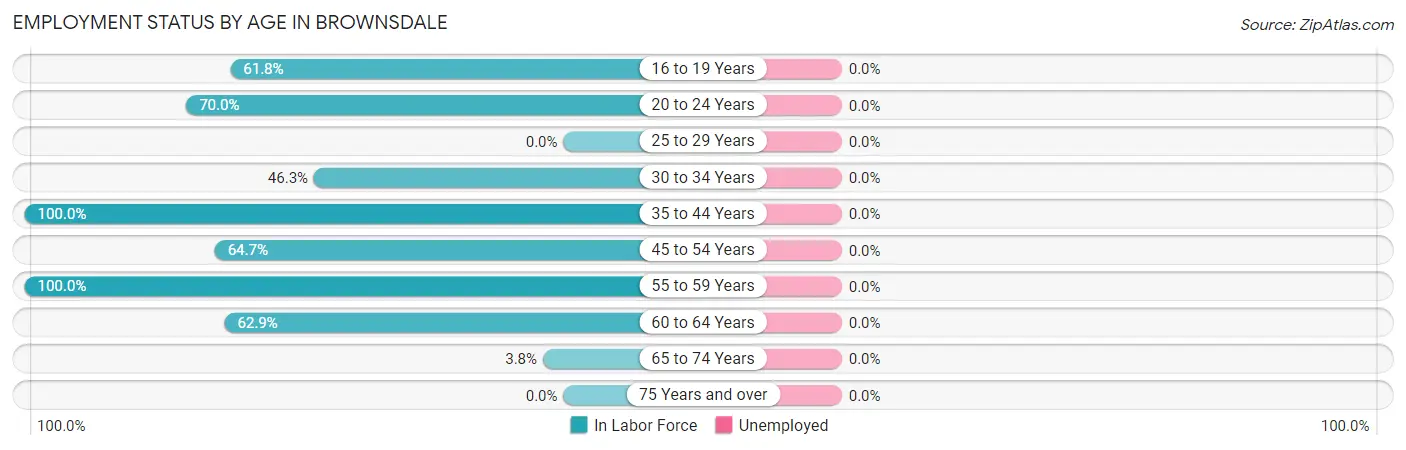
| Age Bracket | In Labor Force | Unemployed |
| 16 to 19 Years | 21 (61.8%) | 0 (0.0%) |
| 20 to 24 Years | 14 (70.0%) | 0 (0.0%) |
| 25 to 29 Years | 0 (0.0%) | 0 (0.0%) |
| 30 to 34 Years | 19 (46.3%) | 0 (0.0%) |
| 35 to 44 Years | 66 (100.0%) | 0 (0.0%) |
| 45 to 54 Years | 11 (64.7%) | 0 (0.0%) |
| 55 to 59 Years | 6 (100.0%) | 0 (0.0%) |
| 60 to 64 Years | 22 (62.9%) | 0 (0.0%) |
| 65 to 74 Years | 2 (3.8%) | 0 (0.0%) |
| 75 Years and over | 0 (0.0%) | 0 (0.0%) |
| Total | 161 (50.5%) | 0 (0.0%) |
Employment Status by Educational Attainment in Brownsdale
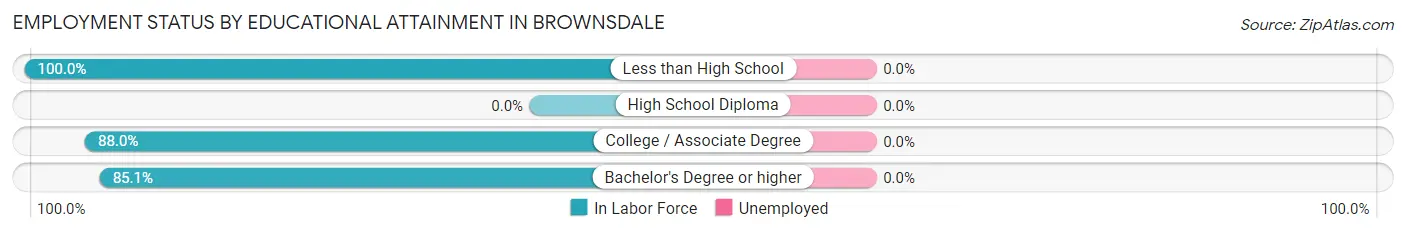
| Educational Attainment | In Labor Force | Unemployed |
| Less than High School | 6 (100.0%) | 0 (0.0%) |
| High School Diploma | 0 (0.0%) | 0 (0.0%) |
| College / Associate Degree | 44 (88.0%) | 0 (0.0%) |
| Bachelor's Degree or higher | 74 (85.1%) | 0 (0.0%) |
| Total | 124 (75.2%) | 0 (0.0%) |
Employment Occupations by Sex in Brownsdale
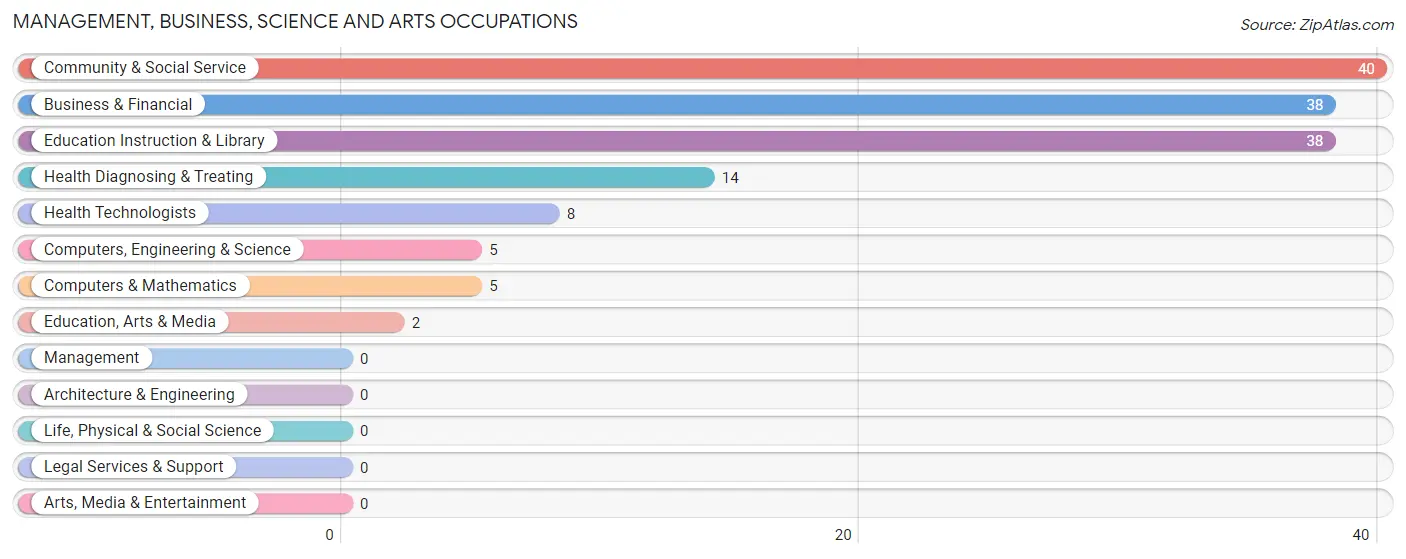
Management, Business, Science and Arts Occupations
The most common Management, Business, Science and Arts occupations in Brownsdale are Community & Social Service (40 | 24.8%), Business & Financial (38 | 23.6%), Education Instruction & Library (38 | 23.6%), Health Diagnosing & Treating (14 | 8.7%), and Health Technologists (8 | 5.0%).
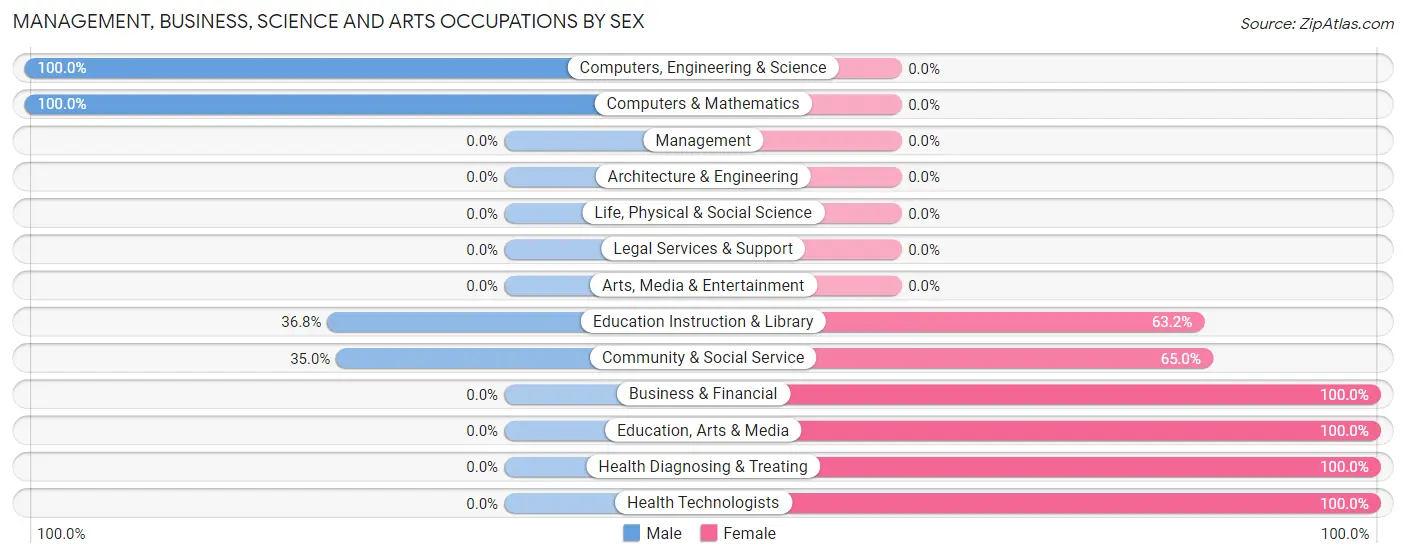
Management, Business, Science and Arts Occupations by Sex
Within the Management, Business, Science and Arts occupations in Brownsdale, the most male-oriented occupations are Computers, Engineering & Science (100.0%), Computers & Mathematics (100.0%), and Education Instruction & Library (36.8%), while the most female-oriented occupations are Business & Financial (100.0%), Education, Arts & Media (100.0%), and Health Diagnosing & Treating (100.0%).
| Occupation | Male | Female |
| Management | 0 (0.0%) | 0 (0.0%) |
| Business & Financial | 0 (0.0%) | 38 (100.0%) |
| Computers, Engineering & Science | 5 (100.0%) | 0 (0.0%) |
| Computers & Mathematics | 5 (100.0%) | 0 (0.0%) |
| Architecture & Engineering | 0 (0.0%) | 0 (0.0%) |
| Life, Physical & Social Science | 0 (0.0%) | 0 (0.0%) |
| Community & Social Service | 14 (35.0%) | 26 (65.0%) |
| Education, Arts & Media | 0 (0.0%) | 2 (100.0%) |
| Legal Services & Support | 0 (0.0%) | 0 (0.0%) |
| Education Instruction & Library | 14 (36.8%) | 24 (63.2%) |
| Arts, Media & Entertainment | 0 (0.0%) | 0 (0.0%) |
| Health Diagnosing & Treating | 0 (0.0%) | 14 (100.0%) |
| Health Technologists | 0 (0.0%) | 8 (100.0%) |
| Total (Category) | 19 (19.6%) | 78 (80.4%) |
| Total (Overall) | 59 (36.6%) | 102 (63.3%) |
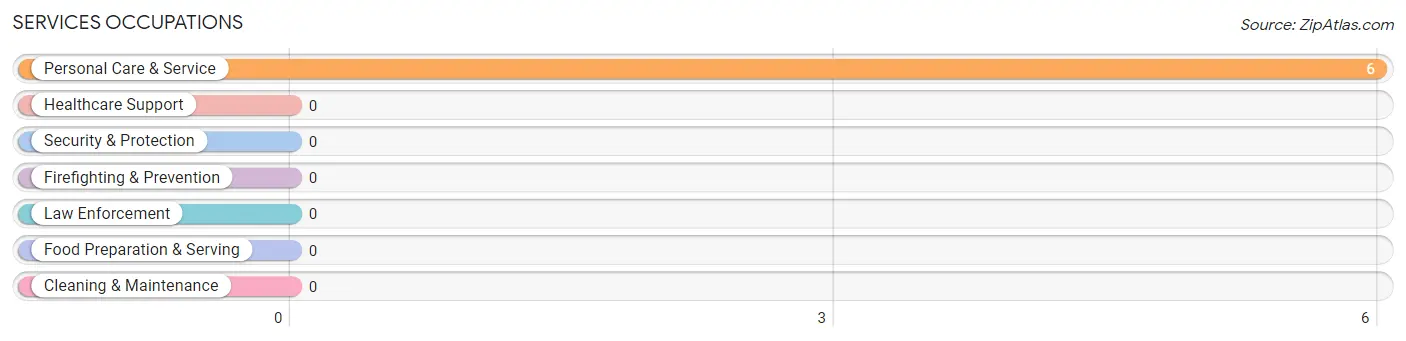
Services Occupations
The most common Services occupations in Brownsdale are , and Personal Care & Service (6 | 3.7%).
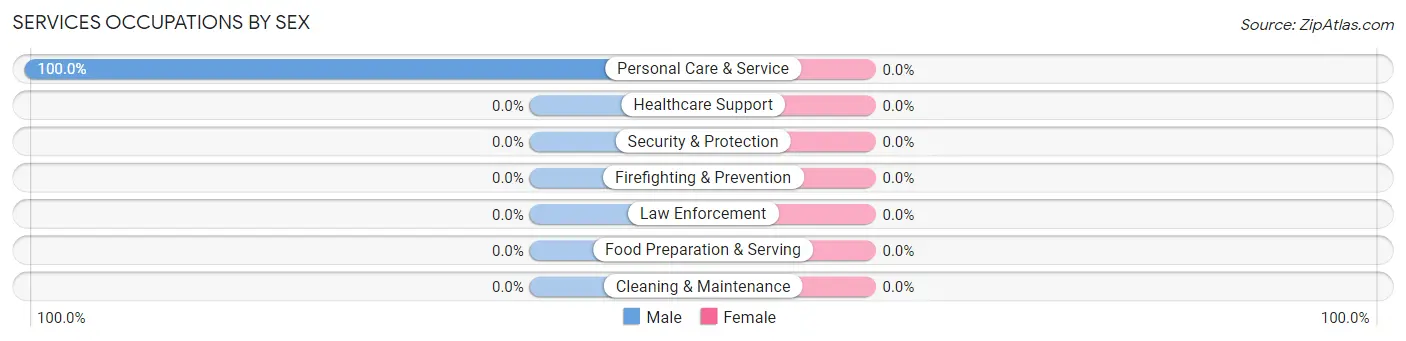
Services Occupations by Sex
| Occupation | Male | Female |
| Healthcare Support | 0 (0.0%) | 0 (0.0%) |
| Security & Protection | 0 (0.0%) | 0 (0.0%) |
| Firefighting & Prevention | 0 (0.0%) | 0 (0.0%) |
| Law Enforcement | 0 (0.0%) | 0 (0.0%) |
| Food Preparation & Serving | 0 (0.0%) | 0 (0.0%) |
| Cleaning & Maintenance | 0 (0.0%) | 0 (0.0%) |
| Personal Care & Service | 6 (100.0%) | 0 (0.0%) |
| Total (Category) | 6 (100.0%) | 0 (0.0%) |
| Total (Overall) | 59 (36.6%) | 102 (63.3%) |
Sales and Office Occupations
The most common Sales and Office occupations in Brownsdale are , and Sales & Related (19 | 11.8%).
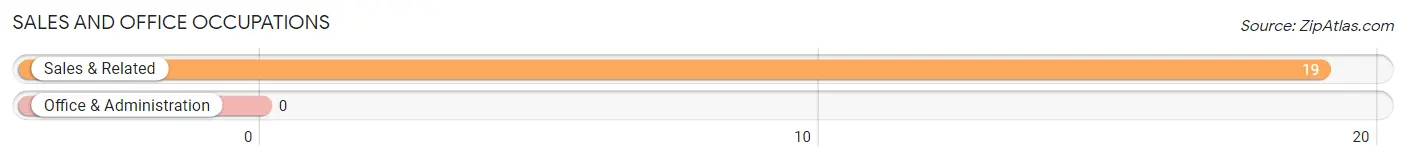
Sales and Office Occupations by Sex
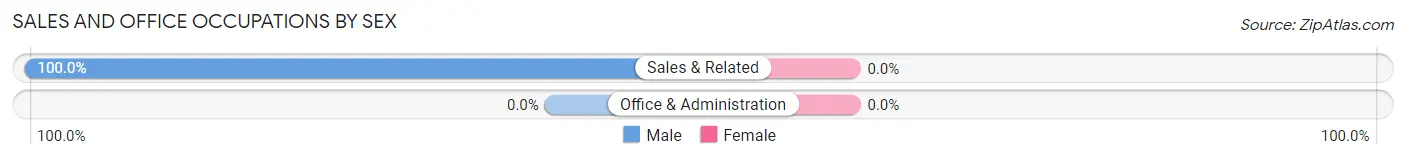
| Occupation | Male | Female |
| Sales & Related | 19 (100.0%) | 0 (0.0%) |
| Office & Administration | 0 (0.0%) | 0 (0.0%) |
| Total (Category) | 19 (100.0%) | 0 (0.0%) |
| Total (Overall) | 59 (36.6%) | 102 (63.3%) |
Natural Resources, Construction and Maintenance Occupations
The most common Natural Resources, Construction and Maintenance occupations in Brownsdale are , and Construction & Extraction (6 | 3.7%).
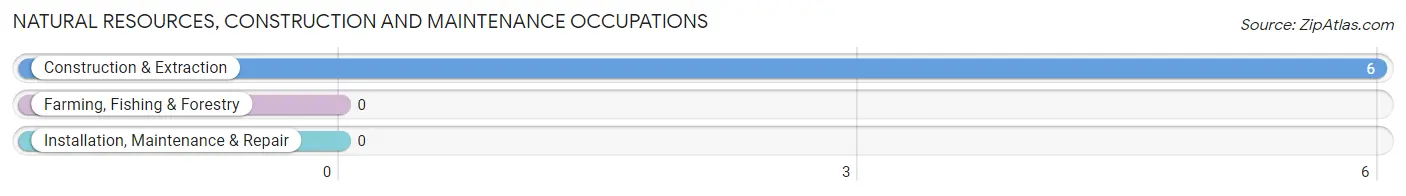
Natural Resources, Construction and Maintenance Occupations by Sex
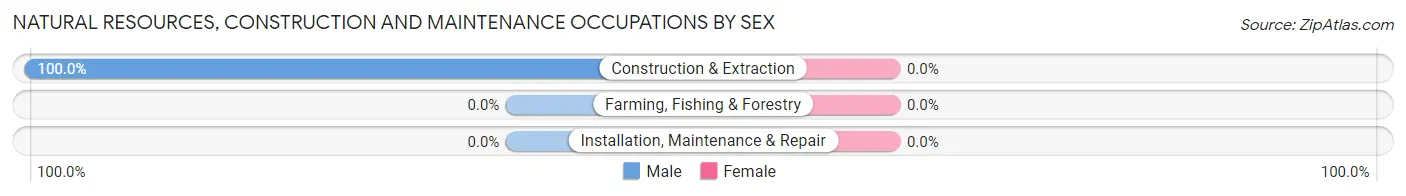
| Occupation | Male | Female |
| Farming, Fishing & Forestry | 0 (0.0%) | 0 (0.0%) |
| Construction & Extraction | 6 (100.0%) | 0 (0.0%) |
| Installation, Maintenance & Repair | 0 (0.0%) | 0 (0.0%) |
| Total (Category) | 6 (100.0%) | 0 (0.0%) |
| Total (Overall) | 59 (36.6%) | 102 (63.3%) |
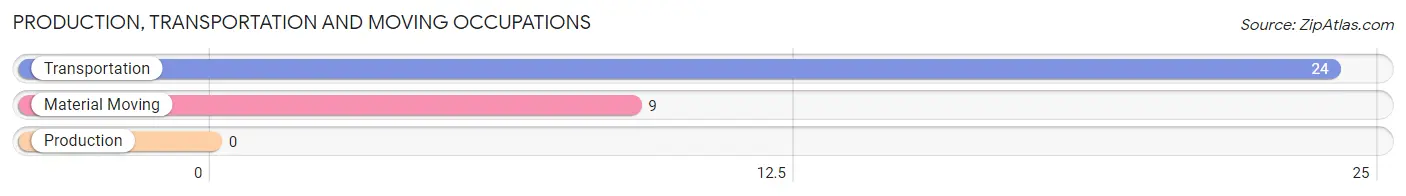
Production, Transportation and Moving Occupations
The most common Production, Transportation and Moving occupations in Brownsdale are Transportation (24 | 14.9%), and Material Moving (9 | 5.6%).
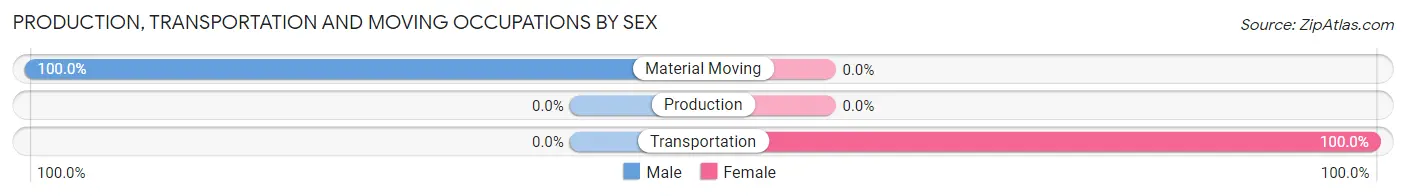
Production, Transportation and Moving Occupations by Sex
| Occupation | Male | Female |
| Production | 0 (0.0%) | 0 (0.0%) |
| Transportation | 0 (0.0%) | 24 (100.0%) |
| Material Moving | 9 (100.0%) | 0 (0.0%) |
| Total (Category) | 9 (27.3%) | 24 (72.7%) |
| Total (Overall) | 59 (36.6%) | 102 (63.3%) |
Employment Industries by Sex in Brownsdale
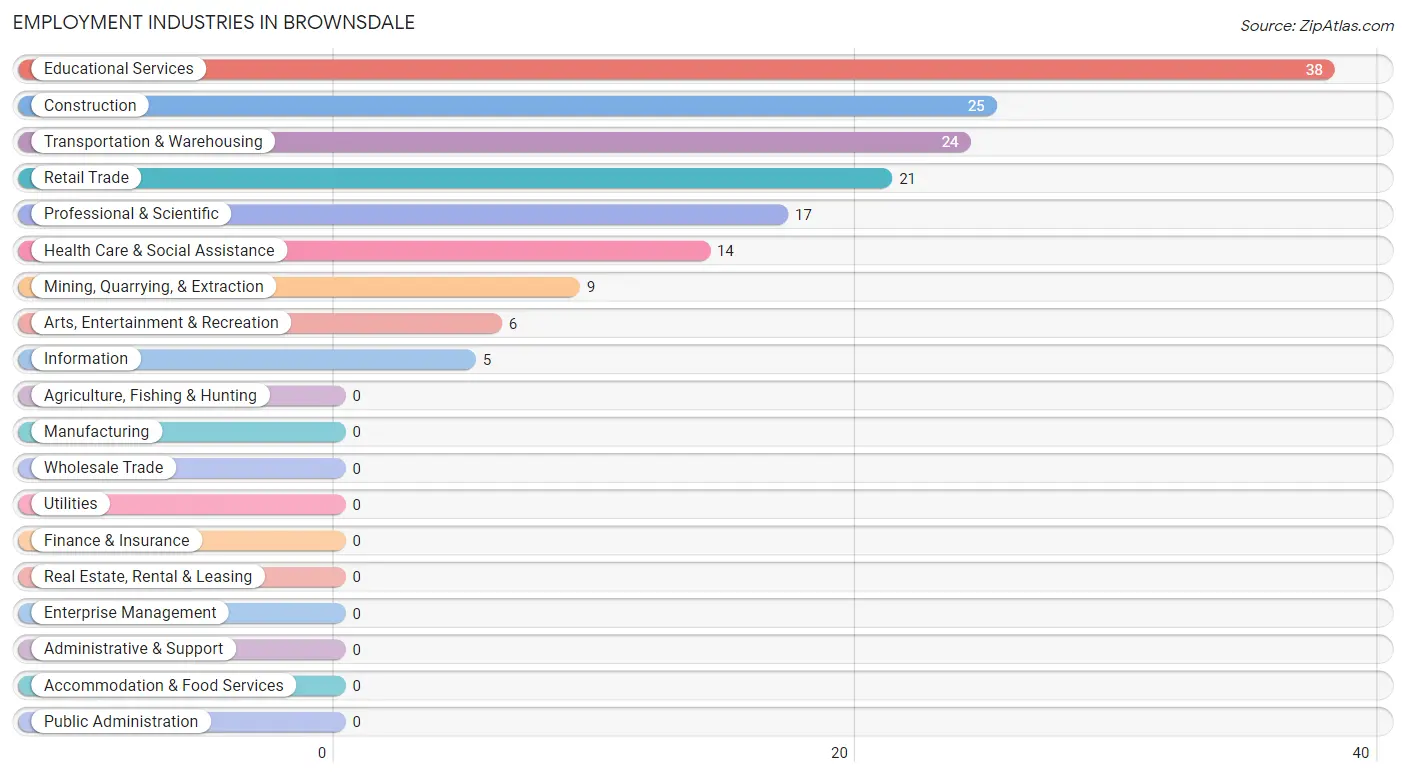
Employment Industries in Brownsdale
The major employment industries in Brownsdale include Educational Services (38 | 23.6%), Construction (25 | 15.5%), Transportation & Warehousing (24 | 14.9%), Retail Trade (21 | 13.0%), and Professional & Scientific (17 | 10.6%).
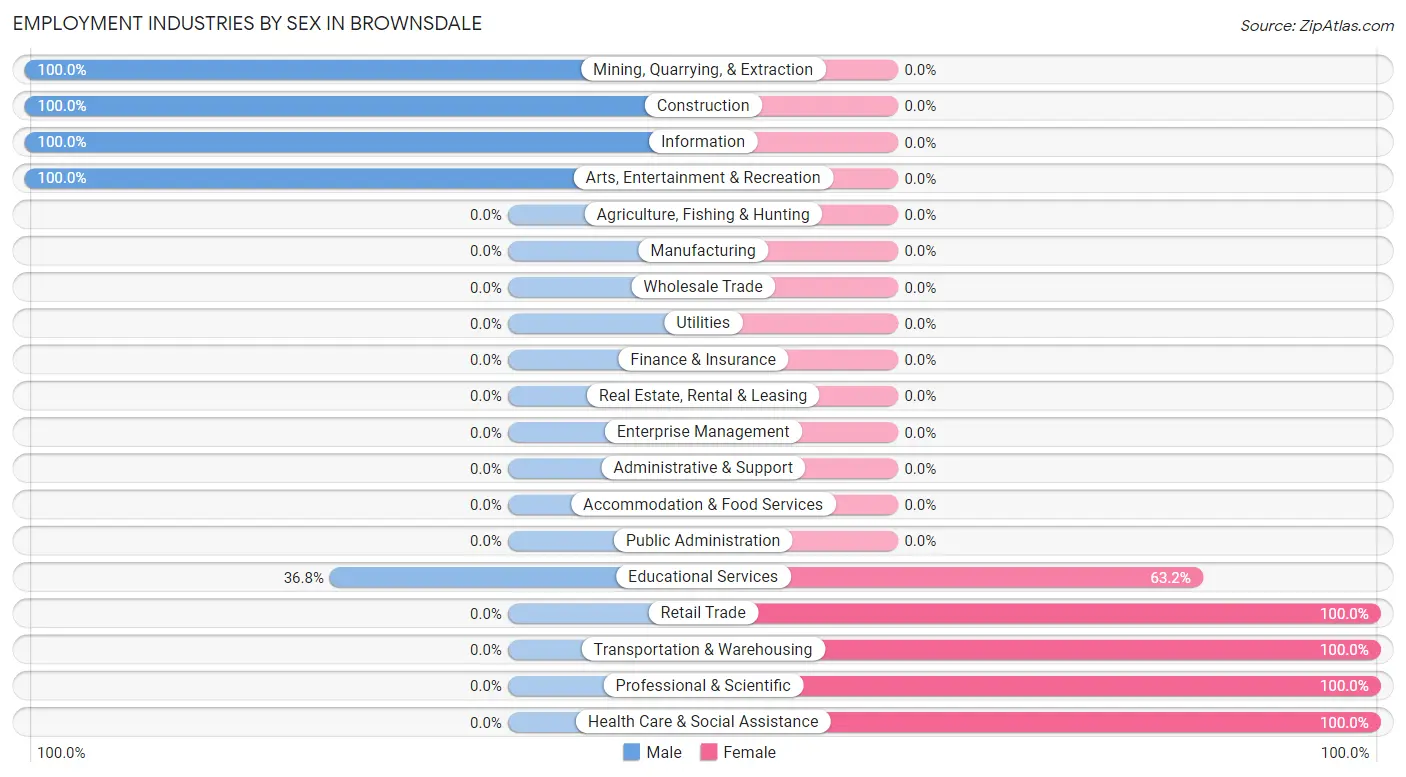
Employment Industries by Sex in Brownsdale
The Brownsdale industries that see more men than women are Mining, Quarrying, & Extraction (100.0%), Construction (100.0%), and Information (100.0%), whereas the industries that tend to have a higher number of women are Retail Trade (100.0%), Transportation & Warehousing (100.0%), and Professional & Scientific (100.0%).
| Industry | Male | Female |
| Agriculture, Fishing & Hunting | 0 (0.0%) | 0 (0.0%) |
| Mining, Quarrying, & Extraction | 9 (100.0%) | 0 (0.0%) |
| Construction | 25 (100.0%) | 0 (0.0%) |
| Manufacturing | 0 (0.0%) | 0 (0.0%) |
| Wholesale Trade | 0 (0.0%) | 0 (0.0%) |
| Retail Trade | 0 (0.0%) | 21 (100.0%) |
| Transportation & Warehousing | 0 (0.0%) | 24 (100.0%) |
| Utilities | 0 (0.0%) | 0 (0.0%) |
| Information | 5 (100.0%) | 0 (0.0%) |
| Finance & Insurance | 0 (0.0%) | 0 (0.0%) |
| Real Estate, Rental & Leasing | 0 (0.0%) | 0 (0.0%) |
| Professional & Scientific | 0 (0.0%) | 17 (100.0%) |
| Enterprise Management | 0 (0.0%) | 0 (0.0%) |
| Administrative & Support | 0 (0.0%) | 0 (0.0%) |
| Educational Services | 14 (36.8%) | 24 (63.2%) |
| Health Care & Social Assistance | 0 (0.0%) | 14 (100.0%) |
| Arts, Entertainment & Recreation | 6 (100.0%) | 0 (0.0%) |
| Accommodation & Food Services | 0 (0.0%) | 0 (0.0%) |
| Public Administration | 0 (0.0%) | 0 (0.0%) |
| Total | 59 (36.6%) | 102 (63.3%) |
Education in Brownsdale
School Enrollment in Brownsdale
The most common levels of schooling among the 107 students in Brownsdale are high school (44 | 41.1%), college / undergraduate (35 | 32.7%), and middle school (23 | 21.5%).
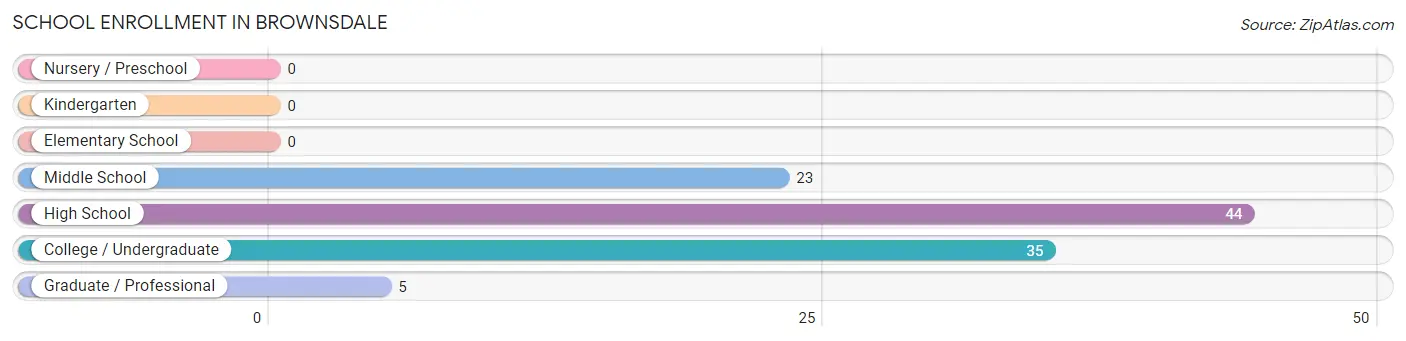
| School Level | # Students | % Students |
| Nursery / Preschool | 0 | 0.0% |
| Kindergarten | 0 | 0.0% |
| Elementary School | 0 | 0.0% |
| Middle School | 23 | 21.5% |
| High School | 44 | 41.1% |
| College / Undergraduate | 35 | 32.7% |
| Graduate / Professional | 5 | 4.7% |
| Total | 107 | 100.0% |
School Enrollment by Age by Funding Source in Brownsdale
Out of a total of 107 students who are enrolled in schools in Brownsdale, 11 (10.3%) attend a private institution, while the remaining 96 (89.7%) are enrolled in public schools. The age group of 10 to 14 year olds has the highest likelihood of being enrolled in private schools, with 5 (21.7% in the age bracket) enrolled. Conversely, the age group of 18 to 19 year olds has the lowest likelihood of being enrolled in a private school, with 7 (100.0% in the age bracket) attending a public institution.
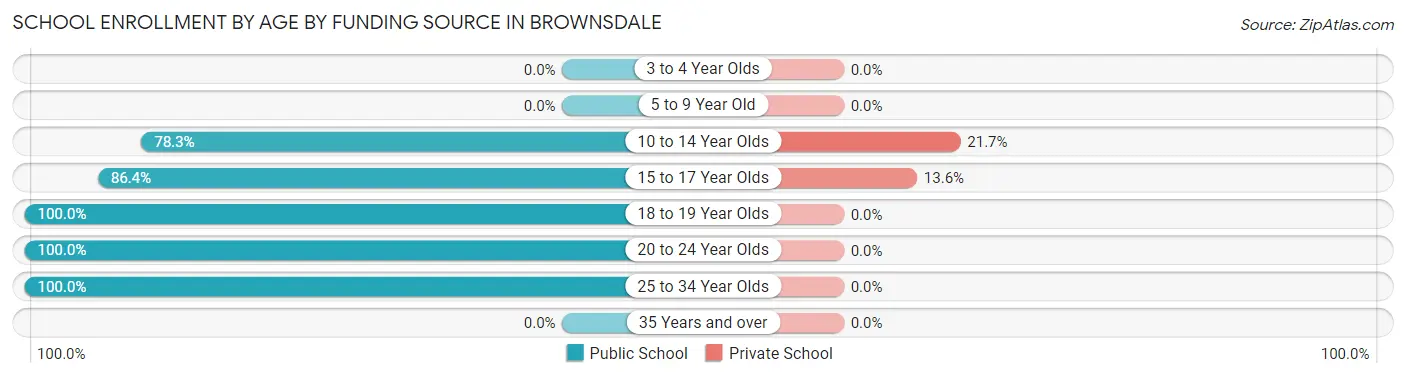
| Age Bracket | Public School | Private School |
| 3 to 4 Year Olds | 0 (0.0%) | 0 (0.0%) |
| 5 to 9 Year Old | 0 (0.0%) | 0 (0.0%) |
| 10 to 14 Year Olds | 18 (78.3%) | 5 (21.7%) |
| 15 to 17 Year Olds | 38 (86.4%) | 6 (13.6%) |
| 18 to 19 Year Olds | 7 (100.0%) | 0 (0.0%) |
| 20 to 24 Year Olds | 11 (100.0%) | 0 (0.0%) |
| 25 to 34 Year Olds | 22 (100.0%) | 0 (0.0%) |
| 35 Years and over | 0 (0.0%) | 0 (0.0%) |
| Total | 96 (89.7%) | 11 (10.3%) |
Educational Attainment by Field of Study in Brownsdale
Business (36 | 36.0%), education (32 | 32.0%), visual & performing arts (19 | 19.0%), and bio, nature & agricultural (13 | 13.0%) are the most common fields of study among 100 individuals in Brownsdale who have obtained a bachelor's degree or higher.
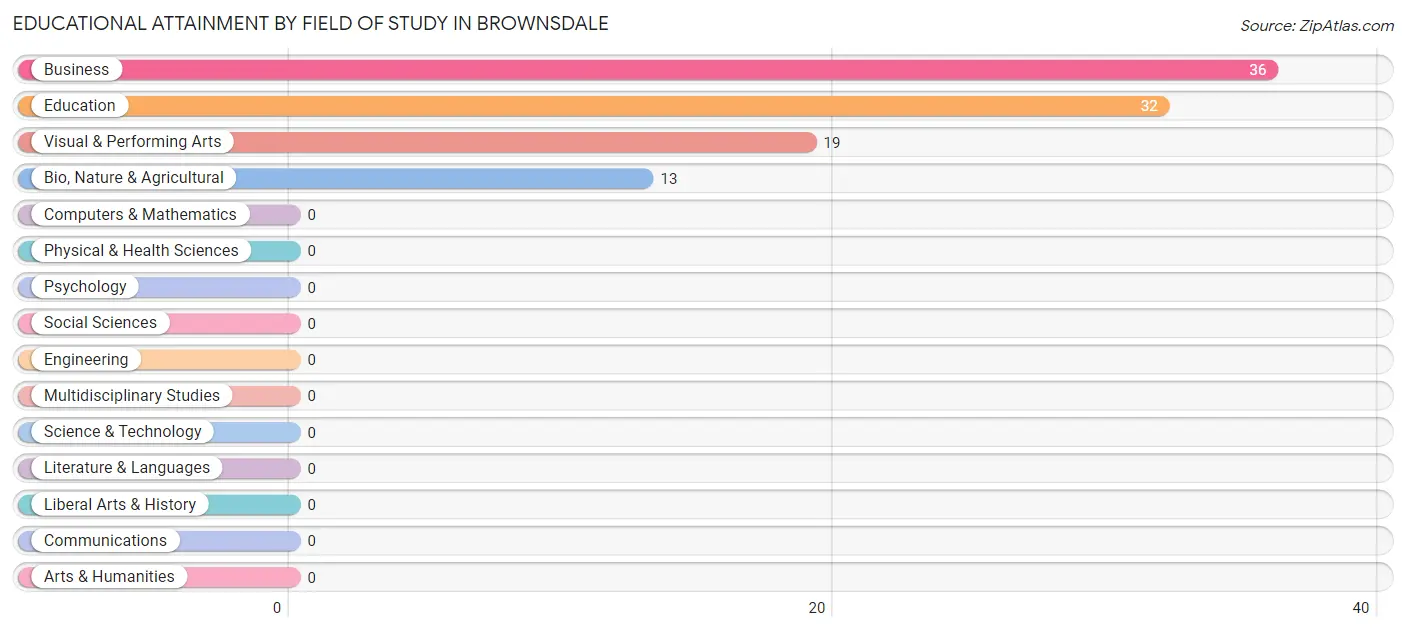
| Field of Study | # Graduates | % Graduates |
| Computers & Mathematics | 0 | 0.0% |
| Bio, Nature & Agricultural | 13 | 13.0% |
| Physical & Health Sciences | 0 | 0.0% |
| Psychology | 0 | 0.0% |
| Social Sciences | 0 | 0.0% |
| Engineering | 0 | 0.0% |
| Multidisciplinary Studies | 0 | 0.0% |
| Science & Technology | 0 | 0.0% |
| Business | 36 | 36.0% |
| Education | 32 | 32.0% |
| Literature & Languages | 0 | 0.0% |
| Liberal Arts & History | 0 | 0.0% |
| Visual & Performing Arts | 19 | 19.0% |
| Communications | 0 | 0.0% |
| Arts & Humanities | 0 | 0.0% |
| Total | 100 | 100.0% |
Transportation & Commute in Brownsdale
Vehicle Availability by Sex in Brownsdale
The most prevalent vehicle ownership categories in Brownsdale are males with 3 vehicles (28, accounting for 47.5%) and females with 3 vehicles (44, making up 27.5%).
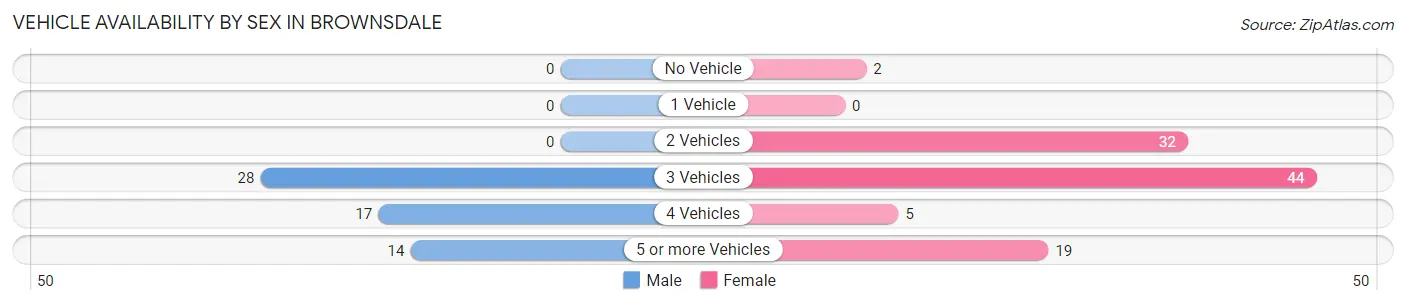
| Vehicles Available | Male | Female |
| No Vehicle | 0 (0.0%) | 2 (2.0%) |
| 1 Vehicle | 0 (0.0%) | 0 (0.0%) |
| 2 Vehicles | 0 (0.0%) | 32 (31.4%) |
| 3 Vehicles | 28 (47.5%) | 44 (43.1%) |
| 4 Vehicles | 17 (28.8%) | 5 (4.9%) |
| 5 or more Vehicles | 14 (23.7%) | 19 (18.6%) |
| Total | 59 (100.0%) | 102 (100.0%) |
Commute Time in Brownsdale
The most frequently occuring commute durations in Brownsdale are 45 to 59 minutes (62 commuters, 50.4%), 30 to 34 minutes (30 commuters, 24.4%), and 10 to 14 minutes (15 commuters, 12.2%).
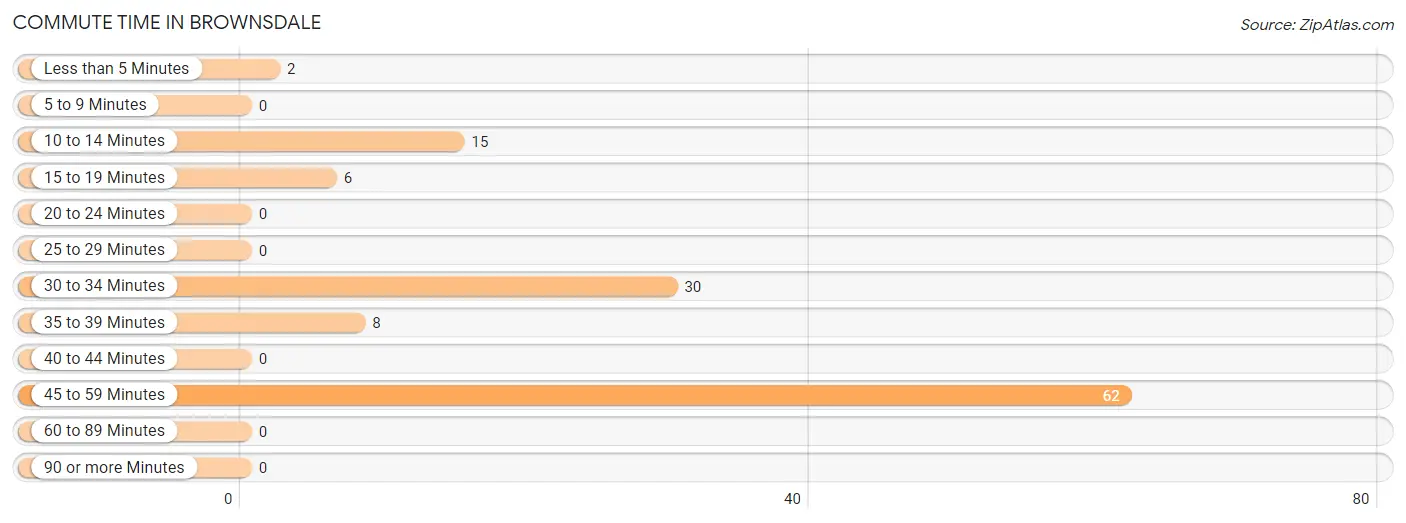
| Commute Time | # Commuters | % Commuters |
| Less than 5 Minutes | 2 | 1.6% |
| 5 to 9 Minutes | 0 | 0.0% |
| 10 to 14 Minutes | 15 | 12.2% |
| 15 to 19 Minutes | 6 | 4.9% |
| 20 to 24 Minutes | 0 | 0.0% |
| 25 to 29 Minutes | 0 | 0.0% |
| 30 to 34 Minutes | 30 | 24.4% |
| 35 to 39 Minutes | 8 | 6.5% |
| 40 to 44 Minutes | 0 | 0.0% |
| 45 to 59 Minutes | 62 | 50.4% |
| 60 to 89 Minutes | 0 | 0.0% |
| 90 or more Minutes | 0 | 0.0% |
Commute Time by Sex in Brownsdale
The most common commute times in Brownsdale are 45 to 59 minutes (38 commuters, 64.4%) for males and 30 to 34 minutes (24 commuters, 37.5%) for females.
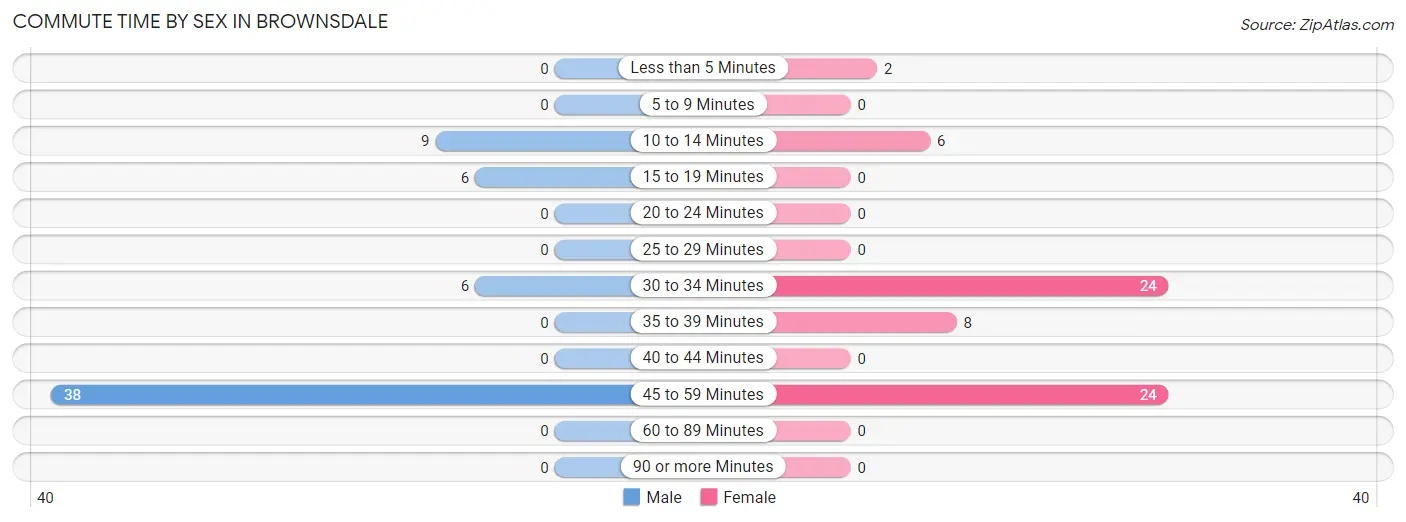
| Commute Time | Male | Female |
| Less than 5 Minutes | 0 (0.0%) | 2 (3.1%) |
| 5 to 9 Minutes | 0 (0.0%) | 0 (0.0%) |
| 10 to 14 Minutes | 9 (15.2%) | 6 (9.4%) |
| 15 to 19 Minutes | 6 (10.2%) | 0 (0.0%) |
| 20 to 24 Minutes | 0 (0.0%) | 0 (0.0%) |
| 25 to 29 Minutes | 0 (0.0%) | 0 (0.0%) |
| 30 to 34 Minutes | 6 (10.2%) | 24 (37.5%) |
| 35 to 39 Minutes | 0 (0.0%) | 8 (12.5%) |
| 40 to 44 Minutes | 0 (0.0%) | 0 (0.0%) |
| 45 to 59 Minutes | 38 (64.4%) | 24 (37.5%) |
| 60 to 89 Minutes | 0 (0.0%) | 0 (0.0%) |
| 90 or more Minutes | 0 (0.0%) | 0 (0.0%) |
Time of Departure to Work by Sex in Brownsdale
The most frequent times of departure to work in Brownsdale are 5:30 AM to 5:59 AM (19, 32.2%) for males and 6:00 AM to 6:29 AM (27, 42.2%) for females.
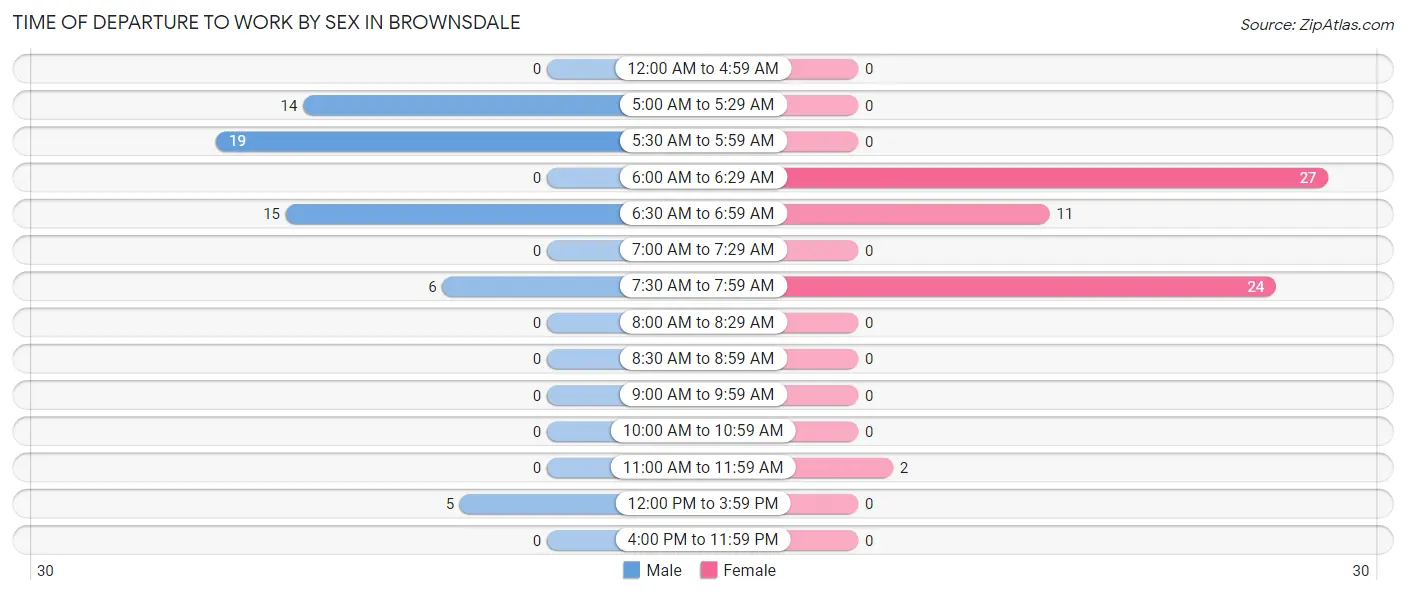
| Time of Departure | Male | Female |
| 12:00 AM to 4:59 AM | 0 (0.0%) | 0 (0.0%) |
| 5:00 AM to 5:29 AM | 14 (23.7%) | 0 (0.0%) |
| 5:30 AM to 5:59 AM | 19 (32.2%) | 0 (0.0%) |
| 6:00 AM to 6:29 AM | 0 (0.0%) | 27 (42.2%) |
| 6:30 AM to 6:59 AM | 15 (25.4%) | 11 (17.2%) |
| 7:00 AM to 7:29 AM | 0 (0.0%) | 0 (0.0%) |
| 7:30 AM to 7:59 AM | 6 (10.2%) | 24 (37.5%) |
| 8:00 AM to 8:29 AM | 0 (0.0%) | 0 (0.0%) |
| 8:30 AM to 8:59 AM | 0 (0.0%) | 0 (0.0%) |
| 9:00 AM to 9:59 AM | 0 (0.0%) | 0 (0.0%) |
| 10:00 AM to 10:59 AM | 0 (0.0%) | 0 (0.0%) |
| 11:00 AM to 11:59 AM | 0 (0.0%) | 2 (3.1%) |
| 12:00 PM to 3:59 PM | 5 (8.5%) | 0 (0.0%) |
| 4:00 PM to 11:59 PM | 0 (0.0%) | 0 (0.0%) |
| Total | 59 (100.0%) | 64 (100.0%) |
Housing Occupancy in Brownsdale
Occupancy by Ownership in Brownsdale
Of the total 132 dwellings in Brownsdale, owner-occupied units account for 130 (98.5%), while renter-occupied units make up 2 (1.5%).
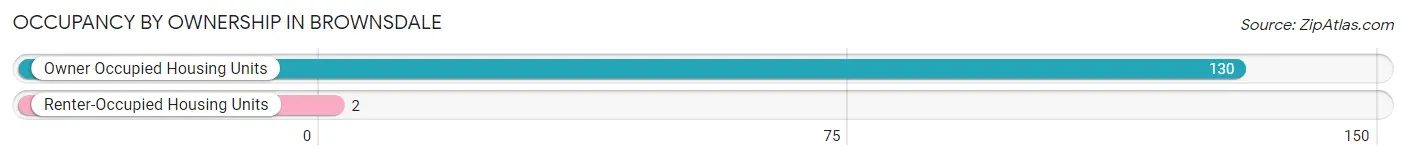
| Occupancy | # Housing Units | % Housing Units |
| Owner Occupied Housing Units | 130 | 98.5% |
| Renter-Occupied Housing Units | 2 | 1.5% |
| Total Occupied Housing Units | 132 | 100.0% |
Occupancy by Household Size in Brownsdale
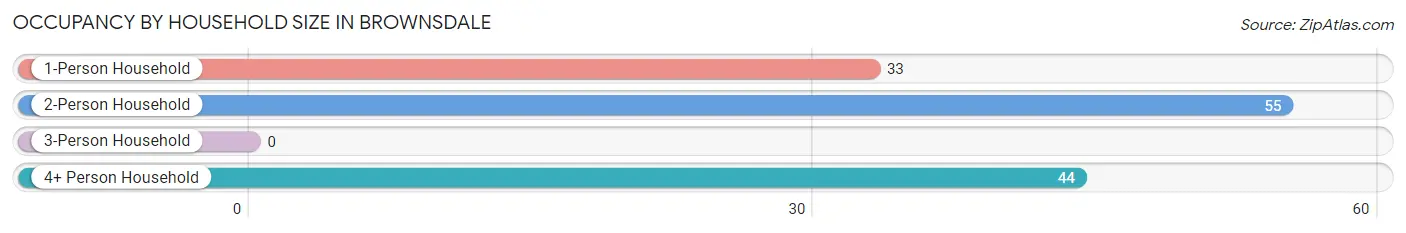
| Household Size | # Housing Units | % Housing Units |
| 1-Person Household | 33 | 25.0% |
| 2-Person Household | 55 | 41.7% |
| 3-Person Household | 0 | 0.0% |
| 4+ Person Household | 44 | 33.3% |
| Total Housing Units | 132 | 100.0% |
Occupancy by Ownership by Household Size in Brownsdale
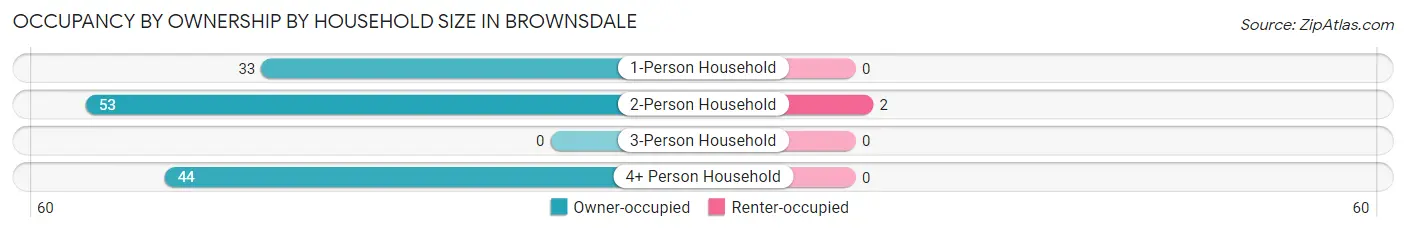
| Household Size | Owner-occupied | Renter-occupied |
| 1-Person Household | 33 (100.0%) | 0 (0.0%) |
| 2-Person Household | 53 (96.4%) | 2 (3.6%) |
| 3-Person Household | 0 (0.0%) | 0 (0.0%) |
| 4+ Person Household | 44 (100.0%) | 0 (0.0%) |
| Total Housing Units | 130 (98.5%) | 2 (1.5%) |
Occupancy by Educational Attainment in Brownsdale
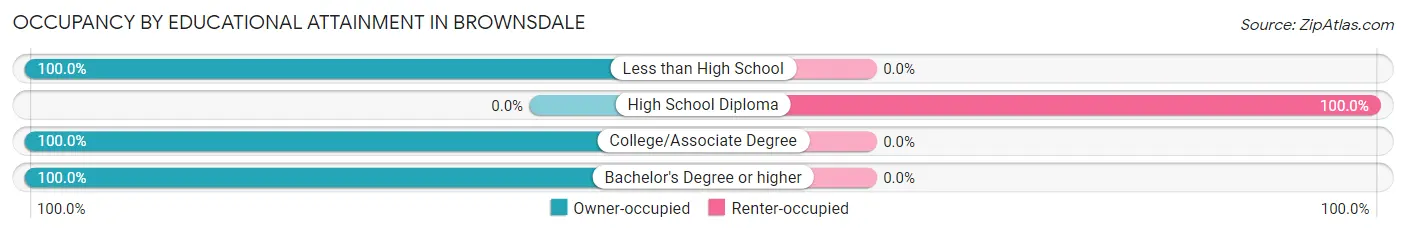
| Household Size | Owner-occupied | Renter-occupied |
| Less than High School | 6 (100.0%) | 0 (0.0%) |
| High School Diploma | 0 (0.0%) | 2 (100.0%) |
| College/Associate Degree | 92 (100.0%) | 0 (0.0%) |
| Bachelor's Degree or higher | 32 (100.0%) | 0 (0.0%) |
Occupancy by Age of Householder in Brownsdale
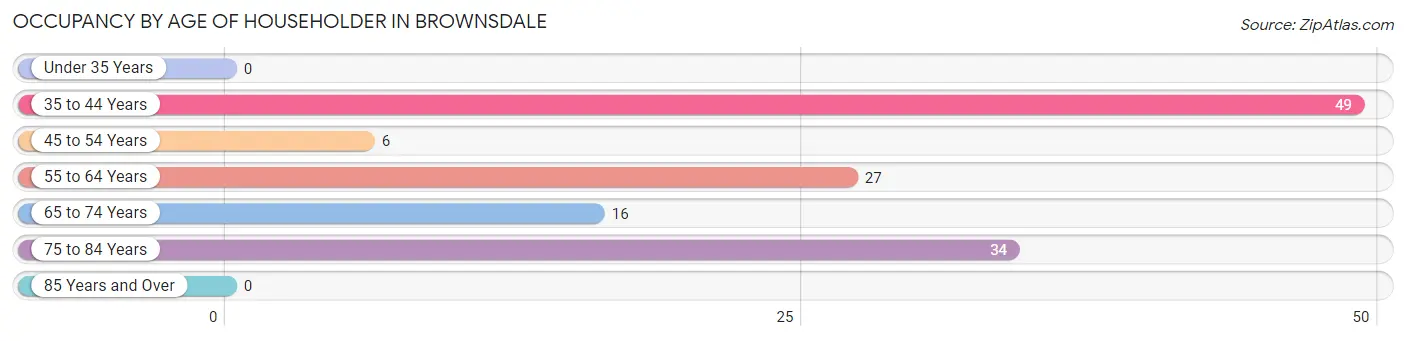
| Age Bracket | # Households | % Households |
| Under 35 Years | 0 | 0.0% |
| 35 to 44 Years | 49 | 37.1% |
| 45 to 54 Years | 6 | 4.5% |
| 55 to 64 Years | 27 | 20.4% |
| 65 to 74 Years | 16 | 12.1% |
| 75 to 84 Years | 34 | 25.8% |
| 85 Years and Over | 0 | 0.0% |
| Total | 132 | 100.0% |
Housing Finances in Brownsdale
Median Income by Occupancy in Brownsdale
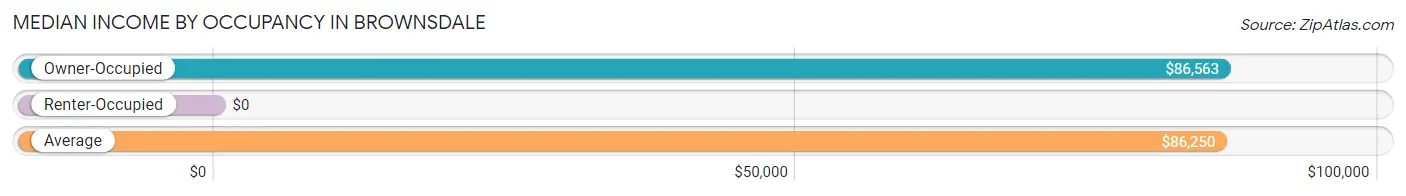
| Occupancy Type | # Households | Median Income |
| Owner-Occupied | 130 (98.5%) | $86,563 |
| Renter-Occupied | 2 (1.5%) | $0 |
| Average | 132 (100.0%) | $86,250 |
Occupancy by Householder Income Bracket in Brownsdale
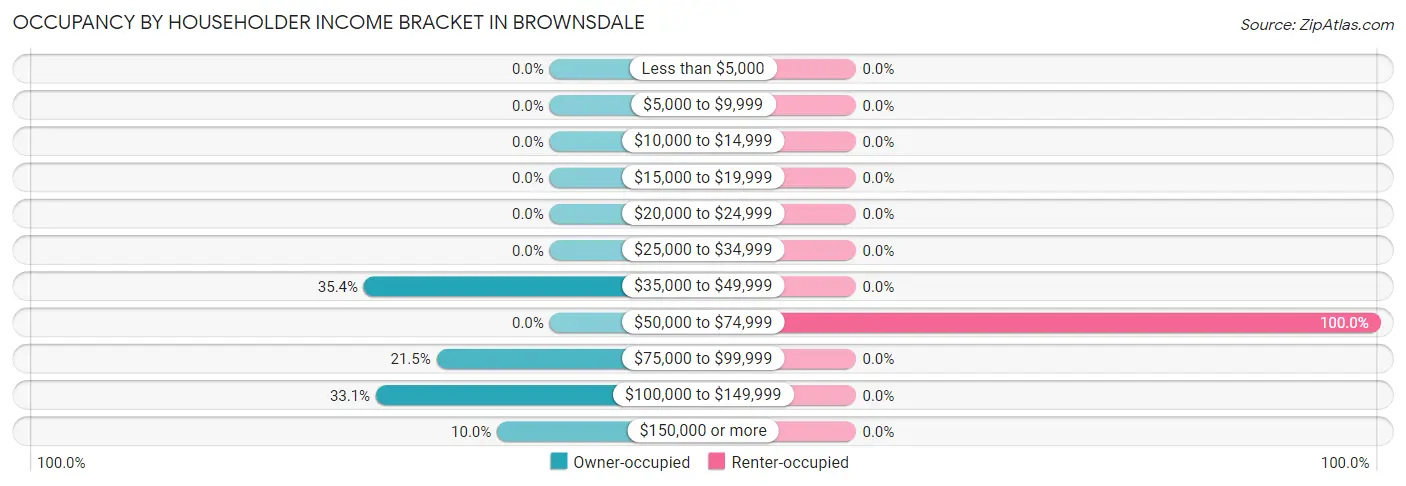
| Income Bracket | Owner-occupied | Renter-occupied |
| Less than $5,000 | 0 (0.0%) | 0 (0.0%) |
| $5,000 to $9,999 | 0 (0.0%) | 0 (0.0%) |
| $10,000 to $14,999 | 0 (0.0%) | 0 (0.0%) |
| $15,000 to $19,999 | 0 (0.0%) | 0 (0.0%) |
| $20,000 to $24,999 | 0 (0.0%) | 0 (0.0%) |
| $25,000 to $34,999 | 0 (0.0%) | 0 (0.0%) |
| $35,000 to $49,999 | 46 (35.4%) | 0 (0.0%) |
| $50,000 to $74,999 | 0 (0.0%) | 2 (100.0%) |
| $75,000 to $99,999 | 28 (21.5%) | 0 (0.0%) |
| $100,000 to $149,999 | 43 (33.1%) | 0 (0.0%) |
| $150,000 or more | 13 (10.0%) | 0 (0.0%) |
| Total | 130 (100.0%) | 2 (100.0%) |
Monthly Housing Cost Tiers in Brownsdale
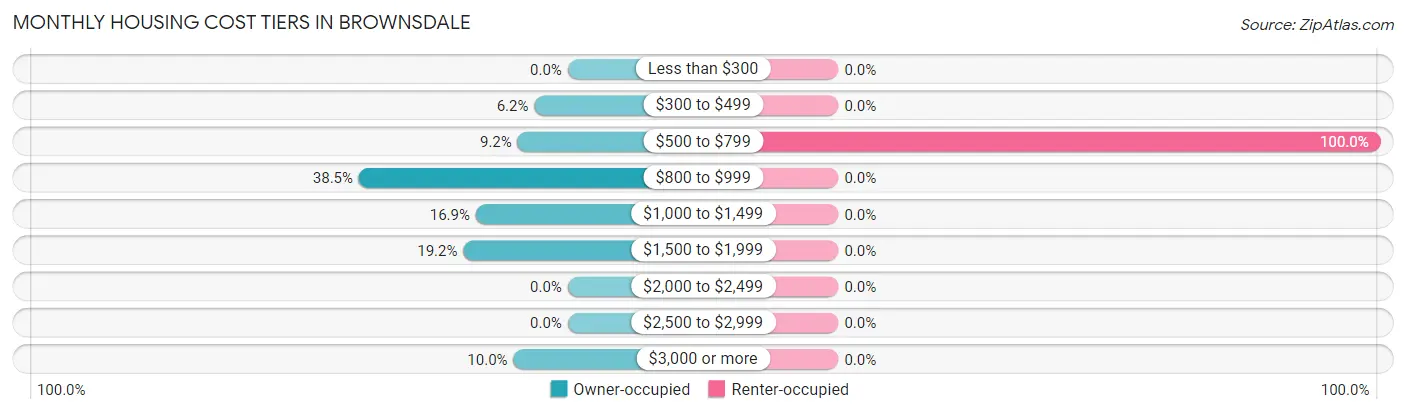
| Monthly Cost | Owner-occupied | Renter-occupied |
| Less than $300 | 0 (0.0%) | 0 (0.0%) |
| $300 to $499 | 8 (6.1%) | 0 (0.0%) |
| $500 to $799 | 12 (9.2%) | 2 (100.0%) |
| $800 to $999 | 50 (38.5%) | 0 (0.0%) |
| $1,000 to $1,499 | 22 (16.9%) | 0 (0.0%) |
| $1,500 to $1,999 | 25 (19.2%) | 0 (0.0%) |
| $2,000 to $2,499 | 0 (0.0%) | 0 (0.0%) |
| $2,500 to $2,999 | 0 (0.0%) | 0 (0.0%) |
| $3,000 or more | 13 (10.0%) | 0 (0.0%) |
| Total | 130 (100.0%) | 2 (100.0%) |
Physical Housing Characteristics in Brownsdale
Housing Structures in Brownsdale
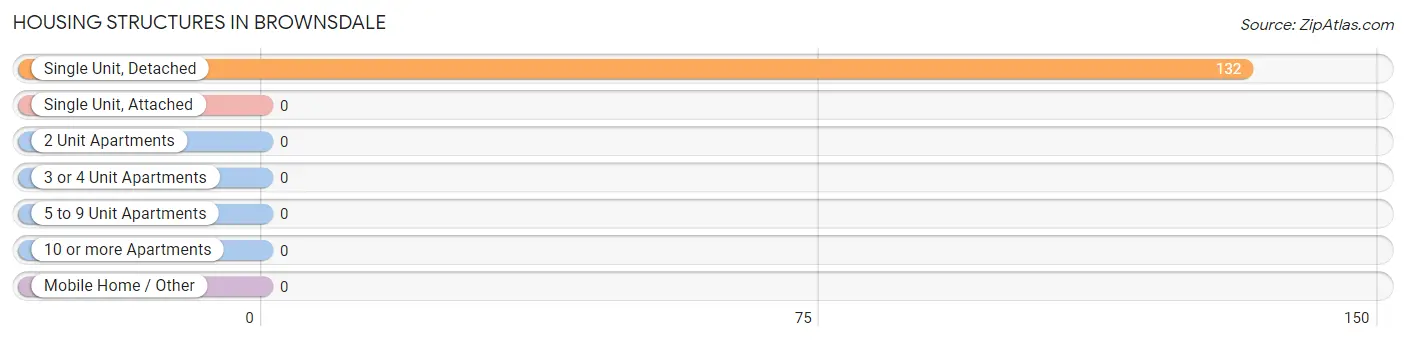
| Structure Type | # Housing Units | % Housing Units |
| Single Unit, Detached | 132 | 100.0% |
| Single Unit, Attached | 0 | 0.0% |
| 2 Unit Apartments | 0 | 0.0% |
| 3 or 4 Unit Apartments | 0 | 0.0% |
| 5 to 9 Unit Apartments | 0 | 0.0% |
| 10 or more Apartments | 0 | 0.0% |
| Mobile Home / Other | 0 | 0.0% |
| Total | 132 | 100.0% |
Housing Structures by Occupancy in Brownsdale
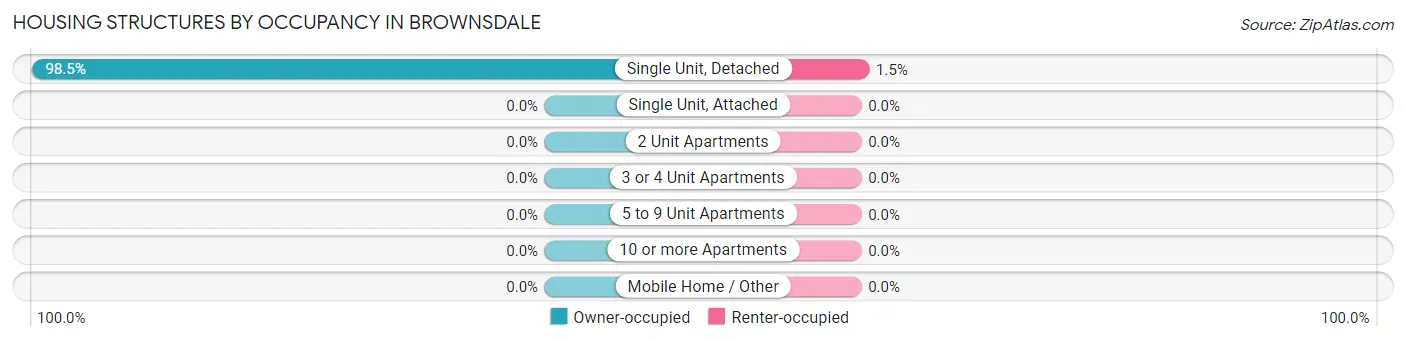
| Structure Type | Owner-occupied | Renter-occupied |
| Single Unit, Detached | 130 (98.5%) | 2 (1.5%) |
| Single Unit, Attached | 0 (0.0%) | 0 (0.0%) |
| 2 Unit Apartments | 0 (0.0%) | 0 (0.0%) |
| 3 or 4 Unit Apartments | 0 (0.0%) | 0 (0.0%) |
| 5 to 9 Unit Apartments | 0 (0.0%) | 0 (0.0%) |
| 10 or more Apartments | 0 (0.0%) | 0 (0.0%) |
| Mobile Home / Other | 0 (0.0%) | 0 (0.0%) |
| Total | 130 (98.5%) | 2 (1.5%) |
Housing Structures by Number of Rooms in Brownsdale
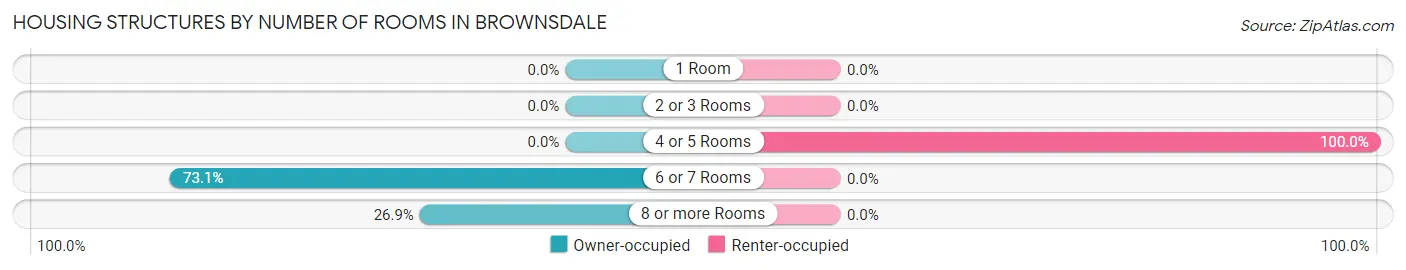
| Number of Rooms | Owner-occupied | Renter-occupied |
| 1 Room | 0 (0.0%) | 0 (0.0%) |
| 2 or 3 Rooms | 0 (0.0%) | 0 (0.0%) |
| 4 or 5 Rooms | 0 (0.0%) | 2 (100.0%) |
| 6 or 7 Rooms | 95 (73.1%) | 0 (0.0%) |
| 8 or more Rooms | 35 (26.9%) | 0 (0.0%) |
| Total | 130 (100.0%) | 2 (100.0%) |
Housing Structure by Heating Type in Brownsdale
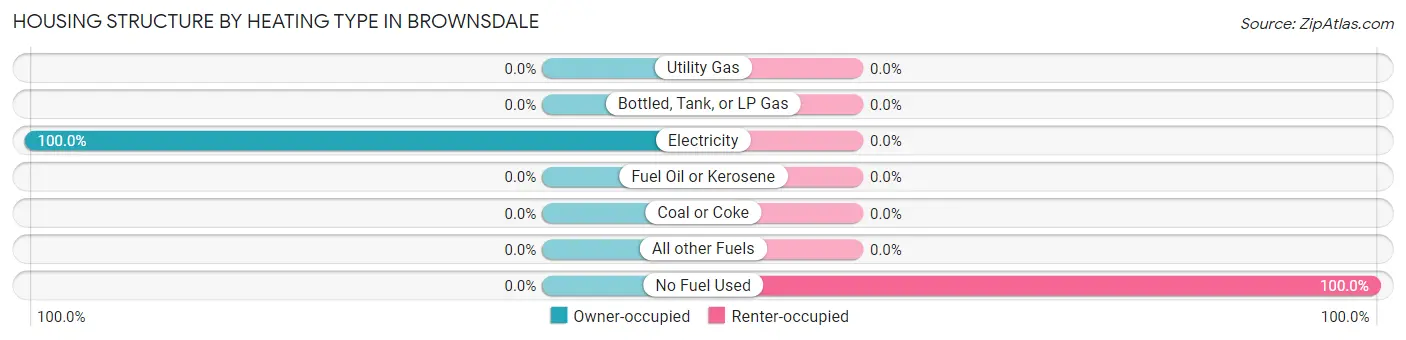
| Heating Type | Owner-occupied | Renter-occupied |
| Utility Gas | 0 (0.0%) | 0 (0.0%) |
| Bottled, Tank, or LP Gas | 0 (0.0%) | 0 (0.0%) |
| Electricity | 130 (100.0%) | 0 (0.0%) |
| Fuel Oil or Kerosene | 0 (0.0%) | 0 (0.0%) |
| Coal or Coke | 0 (0.0%) | 0 (0.0%) |
| All other Fuels | 0 (0.0%) | 0 (0.0%) |
| No Fuel Used | 0 (0.0%) | 2 (100.0%) |
| Total | 130 (100.0%) | 2 (100.0%) |
Household Vehicle Usage in Brownsdale
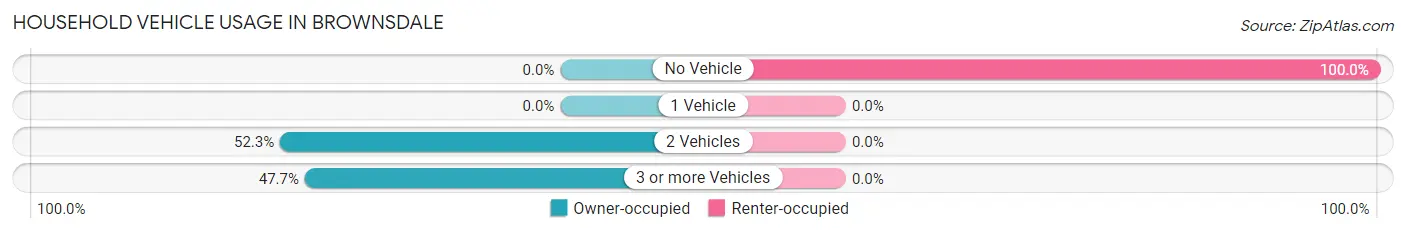
| Vehicles per Household | Owner-occupied | Renter-occupied |
| No Vehicle | 0 (0.0%) | 2 (100.0%) |
| 1 Vehicle | 0 (0.0%) | 0 (0.0%) |
| 2 Vehicles | 68 (52.3%) | 0 (0.0%) |
| 3 or more Vehicles | 62 (47.7%) | 0 (0.0%) |
| Total | 130 (100.0%) | 2 (100.0%) |
Real Estate & Mortgages in Brownsdale
Real Estate and Mortgage Overview in Brownsdale
| Characteristic | Without Mortgage | With Mortgage |
| Housing Units | 66 | 64 |
| Median Property Value | $261,400 | $0 |
| Median Household Income | - | - |
| Monthly Housing Costs | $950 | $0 |
| Real Estate Taxes | $2,571 | $0 |
Property Value by Mortgage Status in Brownsdale
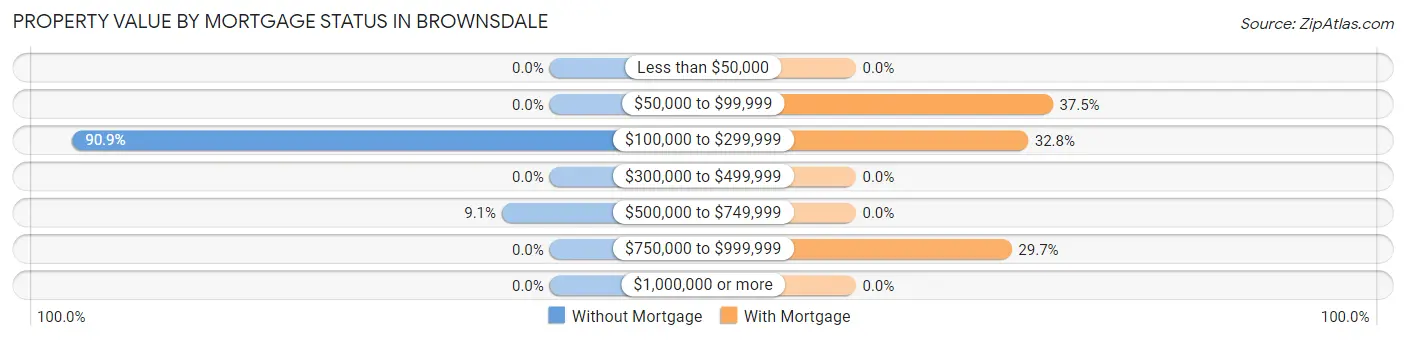
| Property Value | Without Mortgage | With Mortgage |
| Less than $50,000 | 0 (0.0%) | 0 (0.0%) |
| $50,000 to $99,999 | 0 (0.0%) | 24 (37.5%) |
| $100,000 to $299,999 | 60 (90.9%) | 21 (32.8%) |
| $300,000 to $499,999 | 0 (0.0%) | 0 (0.0%) |
| $500,000 to $749,999 | 6 (9.1%) | 0 (0.0%) |
| $750,000 to $999,999 | 0 (0.0%) | 19 (29.7%) |
| $1,000,000 or more | 0 (0.0%) | 0 (0.0%) |
| Total | 66 (100.0%) | 64 (100.0%) |
Household Income by Mortgage Status in Brownsdale
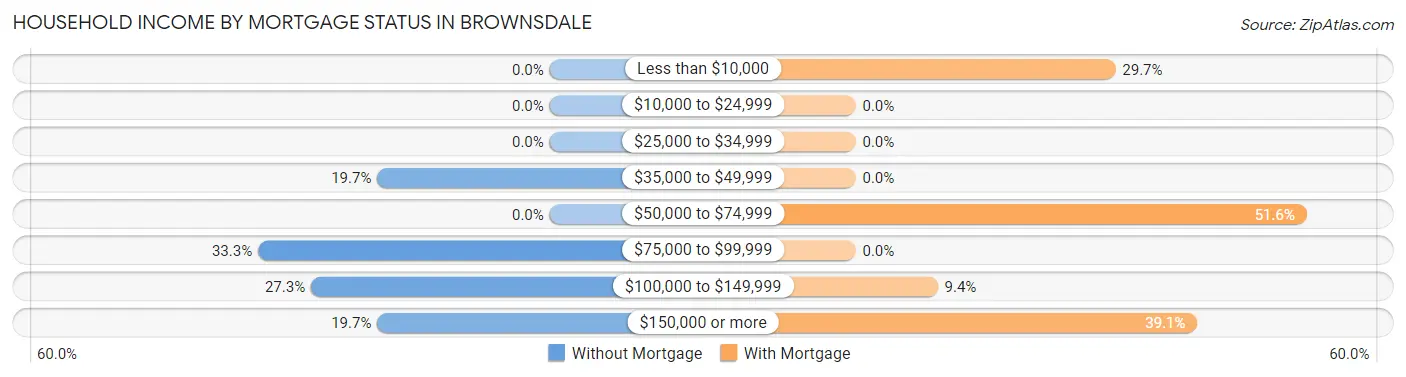
| Household Income | Without Mortgage | With Mortgage |
| Less than $10,000 | 0 (0.0%) | 19 (29.7%) |
| $10,000 to $24,999 | 0 (0.0%) | 0 (0.0%) |
| $25,000 to $34,999 | 0 (0.0%) | 0 (0.0%) |
| $35,000 to $49,999 | 13 (19.7%) | 0 (0.0%) |
| $50,000 to $74,999 | 0 (0.0%) | 33 (51.6%) |
| $75,000 to $99,999 | 22 (33.3%) | 0 (0.0%) |
| $100,000 to $149,999 | 18 (27.3%) | 6 (9.4%) |
| $150,000 or more | 13 (19.7%) | 25 (39.1%) |
| Total | 66 (100.0%) | 64 (100.0%) |
Property Value to Household Income Ratio in Brownsdale
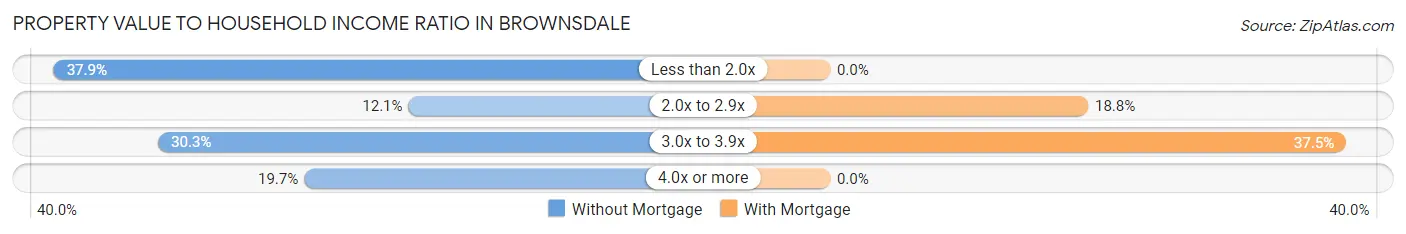
| Value-to-Income Ratio | Without Mortgage | With Mortgage |
| Less than 2.0x | 25 (37.9%) | 0 (0.0%) |
| 2.0x to 2.9x | 8 (12.1%) | 12 (18.8%) |
| 3.0x to 3.9x | 20 (30.3%) | 24 (37.5%) |
| 4.0x or more | 13 (19.7%) | 0 (0.0%) |
| Total | 66 (100.0%) | 64 (100.0%) |
Real Estate Taxes by Mortgage Status in Brownsdale
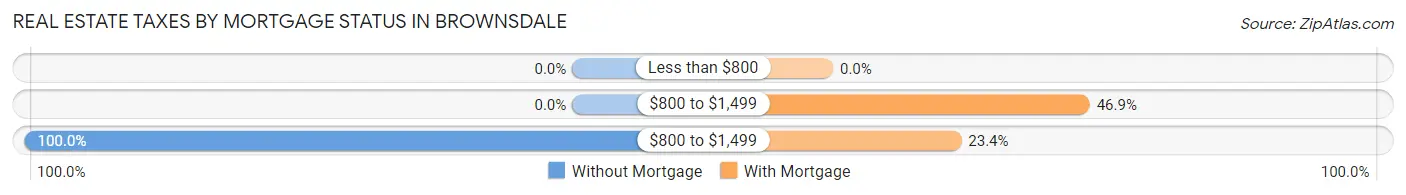
| Property Taxes | Without Mortgage | With Mortgage |
| Less than $800 | 0 (0.0%) | 0 (0.0%) |
| $800 to $1,499 | 0 (0.0%) | 30 (46.9%) |
| $800 to $1,499 | 66 (100.0%) | 15 (23.4%) |
| Total | 66 (100.0%) | 64 (100.0%) |
Health & Disability in Brownsdale
Health Insurance Coverage by Age in Brownsdale
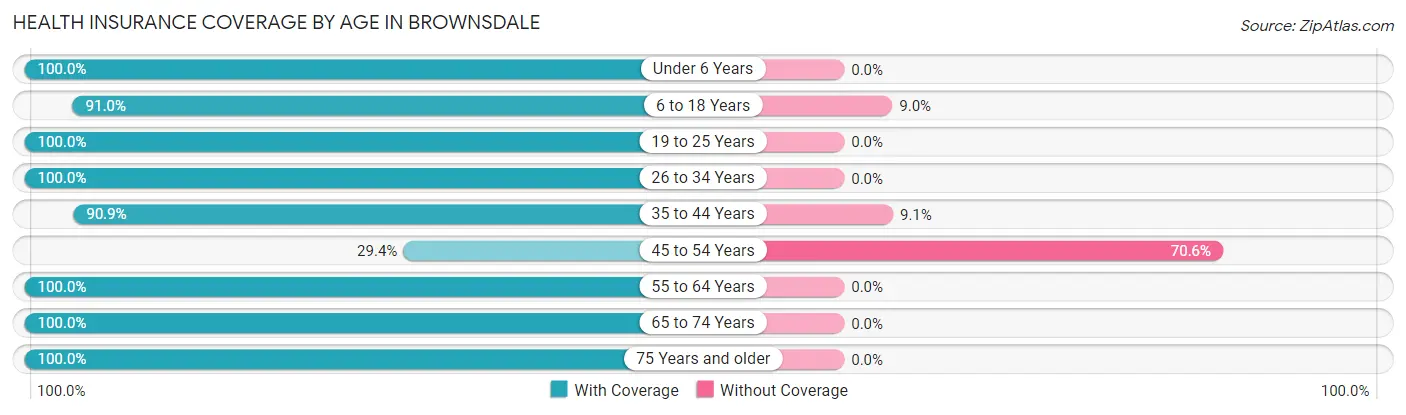
| Age Bracket | With Coverage | Without Coverage |
| Under 6 Years | 30 (100.0%) | 0 (0.0%) |
| 6 to 18 Years | 61 (91.0%) | 6 (9.0%) |
| 19 to 25 Years | 27 (100.0%) | 0 (0.0%) |
| 26 to 34 Years | 41 (100.0%) | 0 (0.0%) |
| 35 to 44 Years | 60 (90.9%) | 6 (9.1%) |
| 45 to 54 Years | 5 (29.4%) | 12 (70.6%) |
| 55 to 64 Years | 41 (100.0%) | 0 (0.0%) |
| 65 to 74 Years | 53 (100.0%) | 0 (0.0%) |
| 75 Years and older | 47 (100.0%) | 0 (0.0%) |
| Total | 365 (93.8%) | 24 (6.2%) |
Health Insurance Coverage by Citizenship Status in Brownsdale
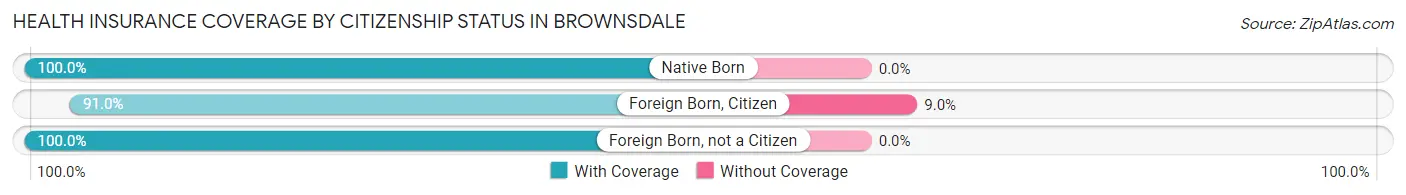
| Citizenship Status | With Coverage | Without Coverage |
| Native Born | 30 (100.0%) | 0 (0.0%) |
| Foreign Born, Citizen | 61 (91.0%) | 6 (9.0%) |
| Foreign Born, not a Citizen | 27 (100.0%) | 0 (0.0%) |
Health Insurance Coverage by Household Income in Brownsdale
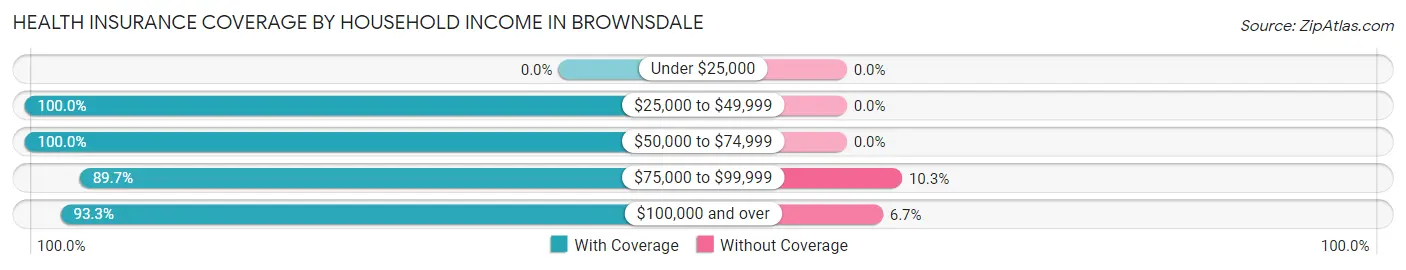
| Household Income | With Coverage | Without Coverage |
| Under $25,000 | 0 (0.0%) | 0 (0.0%) |
| $25,000 to $49,999 | 59 (100.0%) | 0 (0.0%) |
| $50,000 to $74,999 | 5 (100.0%) | 0 (0.0%) |
| $75,000 to $99,999 | 52 (89.7%) | 6 (10.3%) |
| $100,000 and over | 249 (93.3%) | 18 (6.7%) |
Public vs Private Health Insurance Coverage by Age in Brownsdale
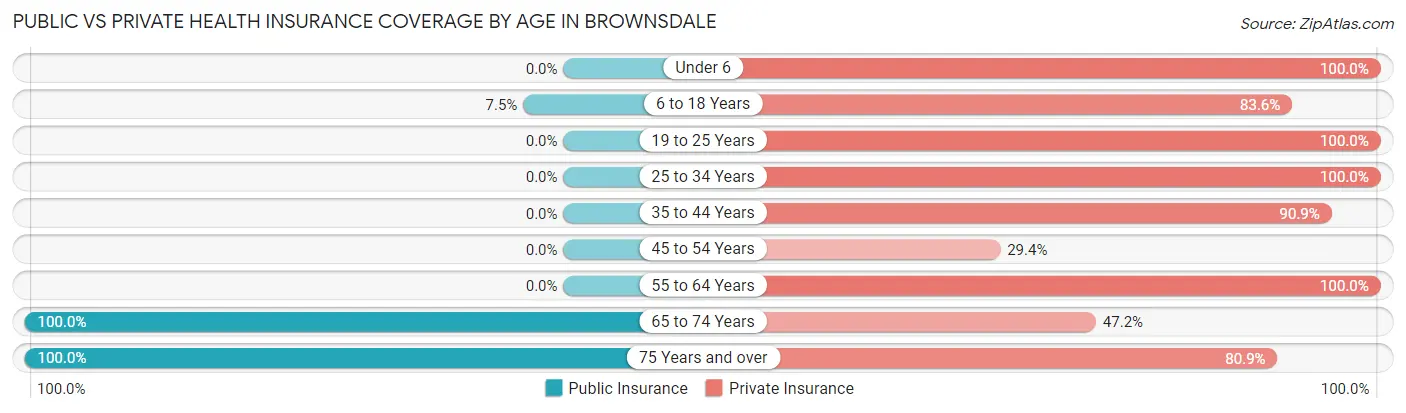
| Age Bracket | Public Insurance | Private Insurance |
| Under 6 | 0 (0.0%) | 30 (100.0%) |
| 6 to 18 Years | 5 (7.5%) | 56 (83.6%) |
| 19 to 25 Years | 0 (0.0%) | 27 (100.0%) |
| 25 to 34 Years | 0 (0.0%) | 41 (100.0%) |
| 35 to 44 Years | 0 (0.0%) | 60 (90.9%) |
| 45 to 54 Years | 0 (0.0%) | 5 (29.4%) |
| 55 to 64 Years | 0 (0.0%) | 41 (100.0%) |
| 65 to 74 Years | 53 (100.0%) | 25 (47.2%) |
| 75 Years and over | 47 (100.0%) | 38 (80.8%) |
| Total | 105 (27.0%) | 323 (83.0%) |
Disability Status by Sex by Age in Brownsdale
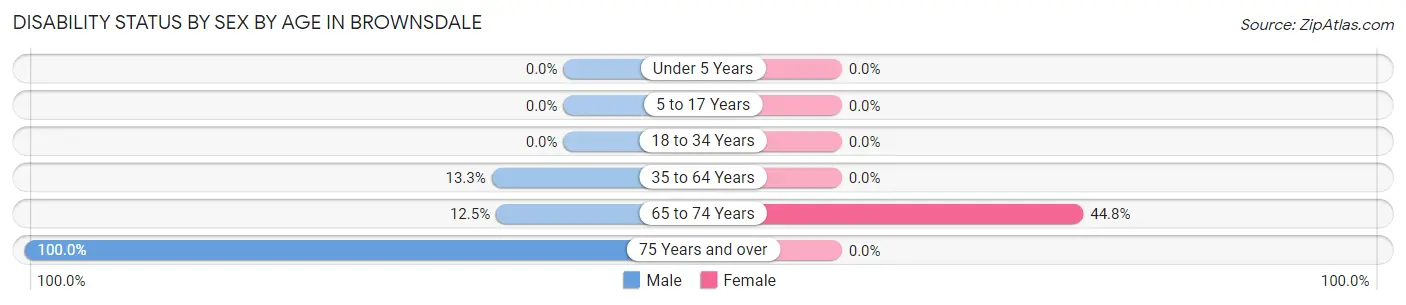
| Age Bracket | Male | Female |
| Under 5 Years | 0 (0.0%) | 0 (0.0%) |
| 5 to 17 Years | 0 (0.0%) | 0 (0.0%) |
| 18 to 34 Years | 0 (0.0%) | 0 (0.0%) |
| 35 to 64 Years | 6 (13.3%) | 0 (0.0%) |
| 65 to 74 Years | 3 (12.5%) | 13 (44.8%) |
| 75 Years and over | 25 (100.0%) | 0 (0.0%) |
Disability Class by Sex by Age in Brownsdale
Disability Class: Hearing Difficulty
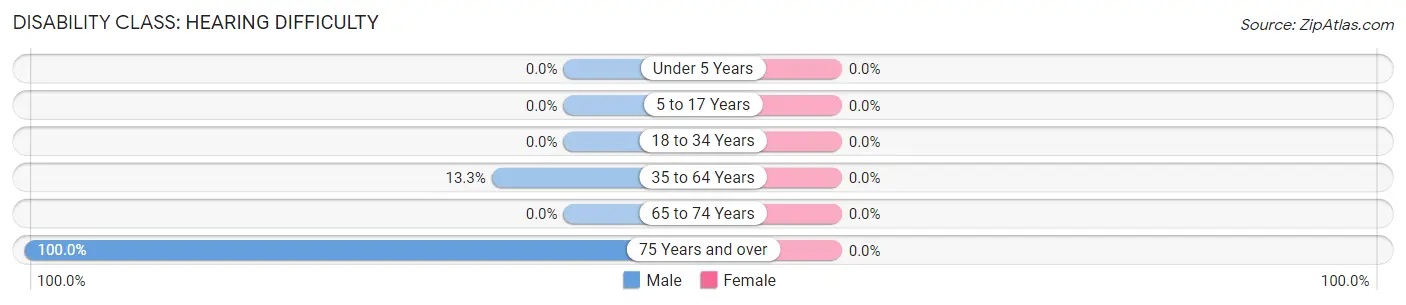
| Age Bracket | Male | Female |
| Under 5 Years | 0 (0.0%) | 0 (0.0%) |
| 5 to 17 Years | 0 (0.0%) | 0 (0.0%) |
| 18 to 34 Years | 0 (0.0%) | 0 (0.0%) |
| 35 to 64 Years | 6 (13.3%) | 0 (0.0%) |
| 65 to 74 Years | 0 (0.0%) | 0 (0.0%) |
| 75 Years and over | 25 (100.0%) | 0 (0.0%) |
Disability Class: Vision Difficulty
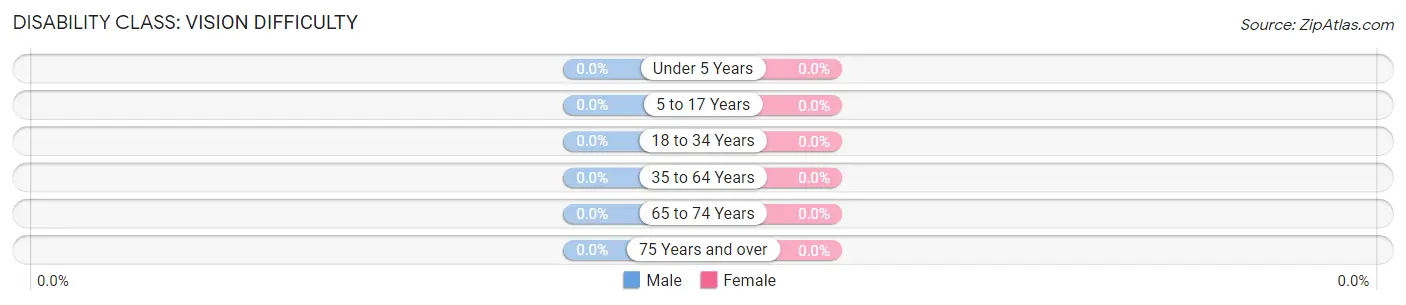
| Age Bracket | Male | Female |
| Under 5 Years | 0 (0.0%) | 0 (0.0%) |
| 5 to 17 Years | 0 (0.0%) | 0 (0.0%) |
| 18 to 34 Years | 0 (0.0%) | 0 (0.0%) |
| 35 to 64 Years | 0 (0.0%) | 0 (0.0%) |
| 65 to 74 Years | 0 (0.0%) | 0 (0.0%) |
| 75 Years and over | 0 (0.0%) | 0 (0.0%) |
Disability Class: Cognitive Difficulty
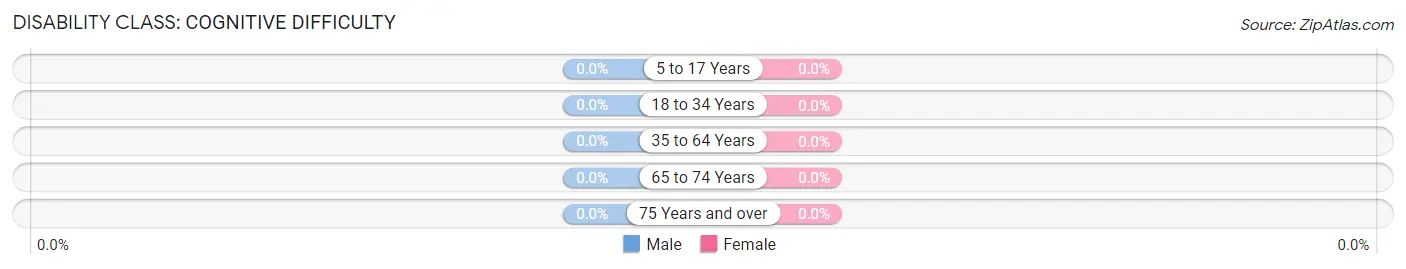
| Age Bracket | Male | Female |
| 5 to 17 Years | 0 (0.0%) | 0 (0.0%) |
| 18 to 34 Years | 0 (0.0%) | 0 (0.0%) |
| 35 to 64 Years | 0 (0.0%) | 0 (0.0%) |
| 65 to 74 Years | 0 (0.0%) | 0 (0.0%) |
| 75 Years and over | 0 (0.0%) | 0 (0.0%) |
Disability Class: Ambulatory Difficulty
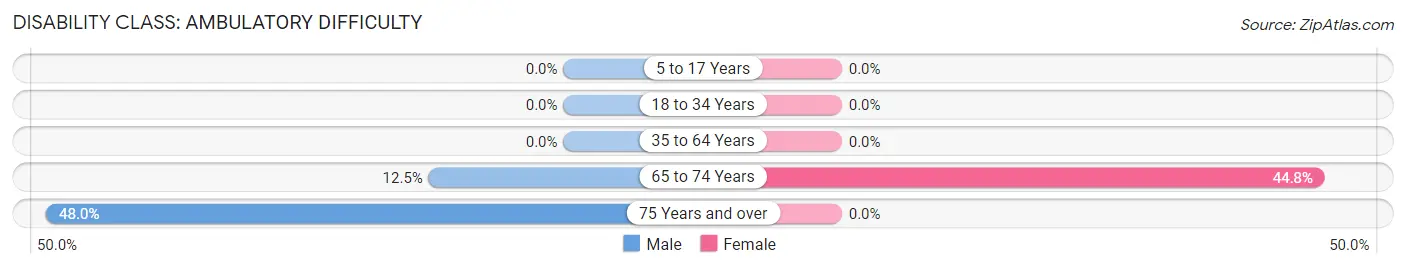
| Age Bracket | Male | Female |
| 5 to 17 Years | 0 (0.0%) | 0 (0.0%) |
| 18 to 34 Years | 0 (0.0%) | 0 (0.0%) |
| 35 to 64 Years | 0 (0.0%) | 0 (0.0%) |
| 65 to 74 Years | 3 (12.5%) | 13 (44.8%) |
| 75 Years and over | 12 (48.0%) | 0 (0.0%) |
Disability Class: Self-Care Difficulty
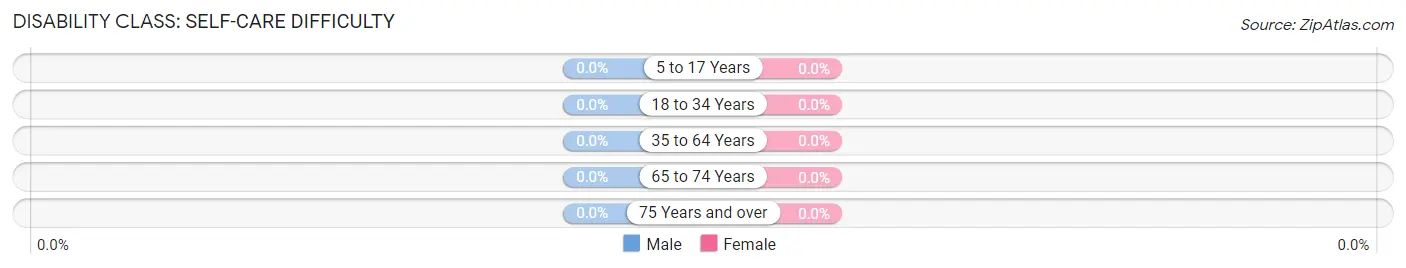
| Age Bracket | Male | Female |
| 5 to 17 Years | 0 (0.0%) | 0 (0.0%) |
| 18 to 34 Years | 0 (0.0%) | 0 (0.0%) |
| 35 to 64 Years | 0 (0.0%) | 0 (0.0%) |
| 65 to 74 Years | 0 (0.0%) | 0 (0.0%) |
| 75 Years and over | 0 (0.0%) | 0 (0.0%) |
Technology Access in Brownsdale
Computing Device Access in Brownsdale
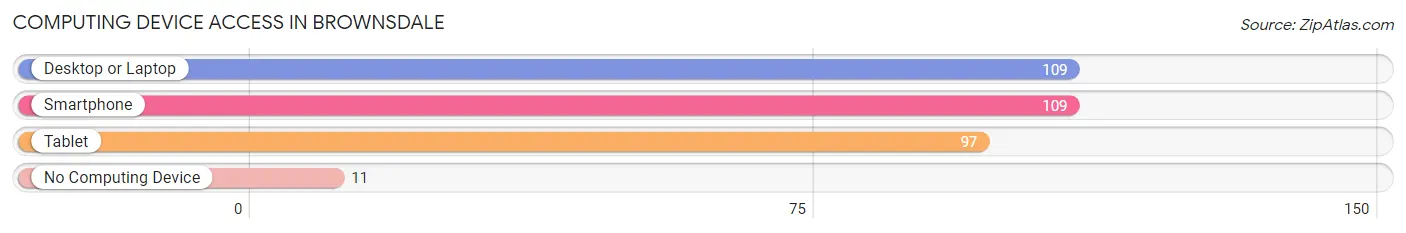
| Device Type | # Households | % Households |
| Desktop or Laptop | 109 | 82.6% |
| Smartphone | 109 | 82.6% |
| Tablet | 97 | 73.5% |
| No Computing Device | 11 | 8.3% |
| Total | 132 | 100.0% |
Internet Access in Brownsdale
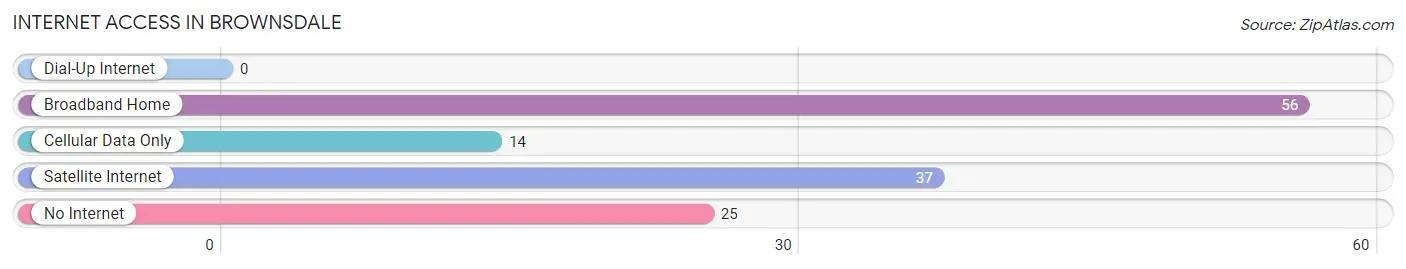
| Internet Type | # Households | % Households |
| Dial-Up Internet | 0 | 0.0% |
| Broadband Home | 56 | 42.4% |
| Cellular Data Only | 14 | 10.6% |
| Satellite Internet | 37 | 28.0% |
| No Internet | 25 | 18.9% |
| Total | 132 | 100.0% |
Brownsdale Summary
Brownsdale is a small unincorporated community located in Hernando County, Florida. It is situated on the western side of the county, approximately 20 miles north of Tampa. The population of Brownsdale is estimated to be around 500 people.
History
Brownsdale was founded in the late 1800s by a man named William Brown. He was a former Confederate soldier who had moved to the area from Georgia. He purchased a large tract of land and began to develop it into a small farming community. The town was named after him and the surrounding area became known as Brownsdale.
The town grew slowly over the years and by the early 1900s, it had become a thriving agricultural community. The main crops grown in the area were oranges, grapefruit, and vegetables. The town also had a few small businesses, including a general store, a post office, and a blacksmith shop.
In the 1950s, the town began to decline as many of the residents moved away in search of better opportunities. By the 1970s, the population had dropped to around 200 people. In the 1980s, the town began to experience a resurgence as new businesses and residents moved into the area.
Geography
Brownsdale is located in the western part of Hernando County, approximately 20 miles north of Tampa. The town is situated on the banks of the Withlacoochee River, which flows through the area. The town is surrounded by rolling hills and is home to a variety of wildlife, including deer, wild turkeys, and bald eagles.
The climate in Brownsdale is subtropical, with hot, humid summers and mild winters. The average temperature in the summer is around 90 degrees Fahrenheit, while the average temperature in the winter is around 60 degrees Fahrenheit.
Economy
The economy of Brownsdale is largely based on agriculture. The main crops grown in the area are oranges, grapefruit, and vegetables. The town also has a few small businesses, including a general store, a post office, and a blacksmith shop.
In recent years, the town has seen an increase in tourism due to its proximity to Tampa and other nearby attractions. The town is home to several bed and breakfasts, as well as a few restaurants and bars.
Demographics
As of the 2010 census, the population of Brownsdale was estimated to be around 500 people. The racial makeup of the town was 94.2% White, 2.2% African American, 0.8% Native American, 0.4% Asian, and 2.4% from other races. The median household income in the town was $37,500.
Conclusion
Brownsdale is a small unincorporated community located in Hernando County, Florida. It was founded in the late 1800s by a former Confederate soldier and has since grown into a thriving agricultural community. The town is home to a variety of wildlife and is surrounded by rolling hills. The economy of Brownsdale is largely based on agriculture, with oranges, grapefruit, and vegetables being the main crops grown in the area. The population of Brownsdale is estimated to be around 500 people, with the median household income being $37,500.
Common Questions
What is Per Capita Income in Brownsdale?
Per Capita income in Brownsdale is $33,363.
What is the Median Family Income in Brownsdale?
Median Family Income in Brownsdale is $127,708.
What is the Median Household income in Brownsdale?
Median Household Income in Brownsdale is $86,250.
What is Income or Wage Gap in Brownsdale?
Income or Wage Gap in Brownsdale is 42.4%.
Women in Brownsdale earn 57.6 cents for every dollar earned by a man.
What is Inequality or Gini Index in Brownsdale?
Inequality or Gini Index in Brownsdale is 0.28.
What is the Total Population of Brownsdale?
Total Population of Brownsdale is 389.
What is the Total Male Population of Brownsdale?
Total Male Population of Brownsdale is 147.
What is the Total Female Population of Brownsdale?
Total Female Population of Brownsdale is 242.
What is the Ratio of Males per 100 Females in Brownsdale?
There are 60.74 Males per 100 Females in Brownsdale.
What is the Ratio of Females per 100 Males in Brownsdale?
There are 164.63 Females per 100 Males in Brownsdale.
What is the Median Population Age in Brownsdale?
Median Population Age in Brownsdale is 43.7 Years.
What is the Average Family Size in Brownsdale
Average Family Size in Brownsdale is 3.6 People.
What is the Average Household Size in Brownsdale
Average Household Size in Brownsdale is 3.0 People.
How Large is the Labor Force in Brownsdale?
There are 161 People in the Labor Forcein in Brownsdale.
What is the Percentage of People in the Labor Force in Brownsdale?
50.5% of People are in the Labor Force in Brownsdale.