Greenville, FL Map & Demographics
Greenville Map
Greenville Overview
$15,267
PER CAPITA INCOME
$71,267
AVG FAMILY INCOME
$52,204
AVG HOUSEHOLD INCOME
36.3%
WAGE / INCOME GAP [ % ]
63.7¢/ $1
WAGE / INCOME GAP [ $ ]
$8,645
FAMILY INCOME DEFICIT
0.37
INEQUALITY / GINI INDEX
1,546
TOTAL POPULATION
637
MALE POPULATION
909
FEMALE POPULATION
70.08
MALES / 100 FEMALES
142.70
FEMALES / 100 MALES
32.9
MEDIAN AGE
4.7
AVG FAMILY SIZE
3.5
AVG HOUSEHOLD SIZE
319
LABOR FORCE [ PEOPLE ]
29.0%
PERCENT IN LABOR FORCE
Greenville Zip Codes
Greenville Area Codes
Income in Greenville
Income Overview in Greenville
Per Capita Income in Greenville is $15,267, while median incomes of families and households are $71,267 and $52,204 respectively.
| Characteristic | Number | Measure |
| Per Capita Income | 1,546 | $15,267 |
| Median Family Income | 271 | $71,267 |
| Mean Family Income | 271 | $67,516 |
| Median Household Income | 427 | $52,204 |
| Mean Household Income | 427 | $55,381 |
| Income Deficit | 271 | $8,645 |
| Wage / Income Gap (%) | 1,546 | 36.28% |
| Wage / Income Gap ($) | 1,546 | 63.72¢ per $1 |
| Gini / Inequality Index | 1,546 | 0.37 |
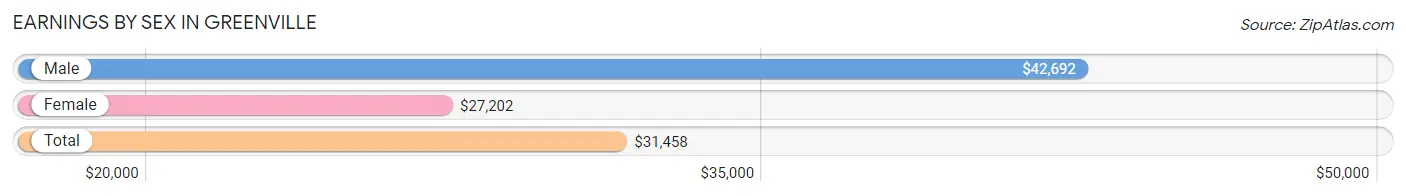
Earnings by Sex in Greenville
Average Earnings in Greenville are $31,458, $42,692 for men and $27,202 for women, a difference of 36.3%.
| Sex | Number | Average Earnings |
| Male | 134 (41.7%) | $42,692 |
| Female | 187 (58.3%) | $27,202 |
| Total | 321 (100.0%) | $31,458 |
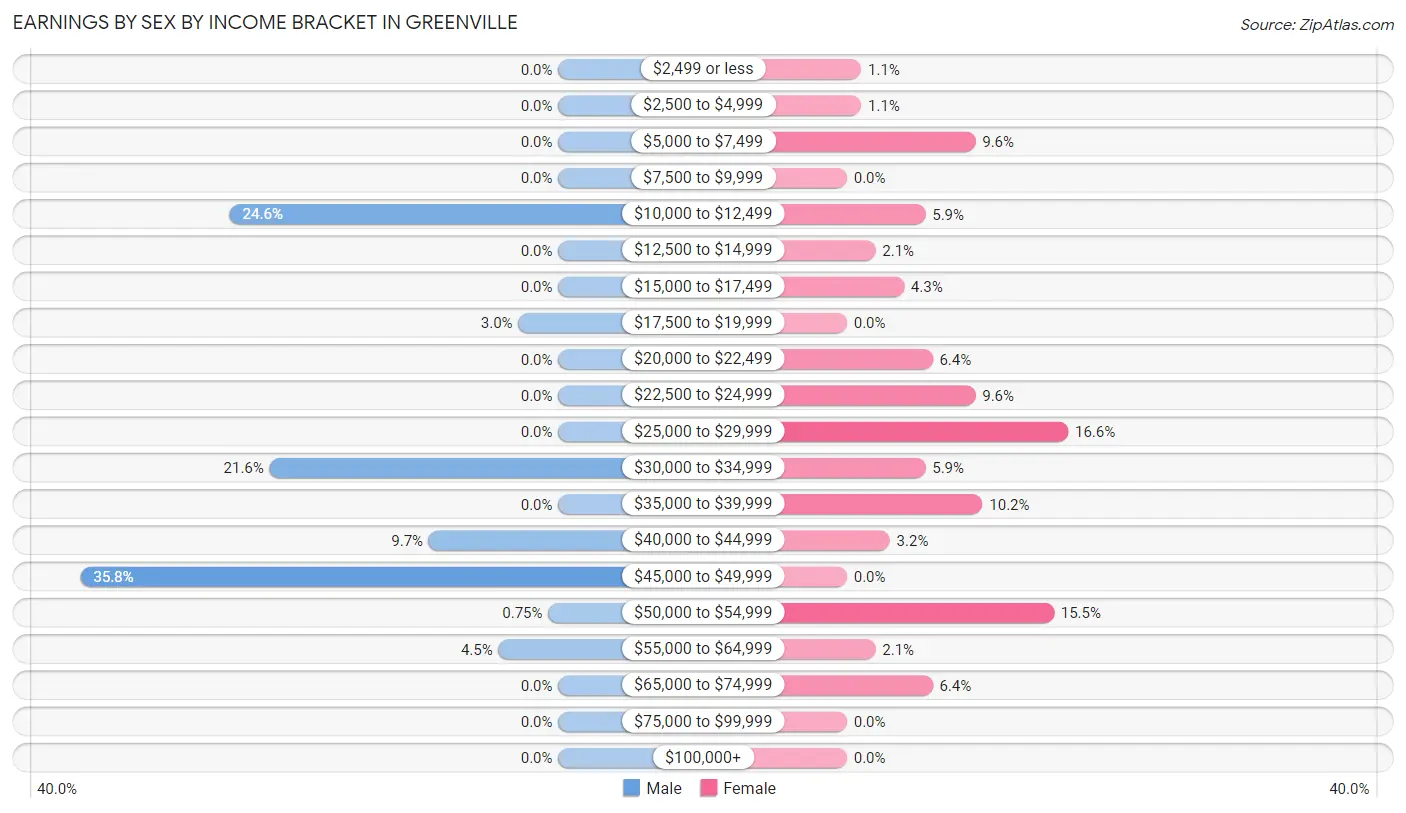
Earnings by Sex by Income Bracket in Greenville
The most common earnings brackets in Greenville are $45,000 to $49,999 for men (48 | 35.8%) and $25,000 to $29,999 for women (31 | 16.6%).
| Income | Male | Female |
| $2,499 or less | 0 (0.0%) | 2 (1.1%) |
| $2,500 to $4,999 | 0 (0.0%) | 2 (1.1%) |
| $5,000 to $7,499 | 0 (0.0%) | 18 (9.6%) |
| $7,500 to $9,999 | 0 (0.0%) | 0 (0.0%) |
| $10,000 to $12,499 | 33 (24.6%) | 11 (5.9%) |
| $12,500 to $14,999 | 0 (0.0%) | 4 (2.1%) |
| $15,000 to $17,499 | 0 (0.0%) | 8 (4.3%) |
| $17,500 to $19,999 | 4 (3.0%) | 0 (0.0%) |
| $20,000 to $22,499 | 0 (0.0%) | 12 (6.4%) |
| $22,500 to $24,999 | 0 (0.0%) | 18 (9.6%) |
| $25,000 to $29,999 | 0 (0.0%) | 31 (16.6%) |
| $30,000 to $34,999 | 29 (21.6%) | 11 (5.9%) |
| $35,000 to $39,999 | 0 (0.0%) | 19 (10.2%) |
| $40,000 to $44,999 | 13 (9.7%) | 6 (3.2%) |
| $45,000 to $49,999 | 48 (35.8%) | 0 (0.0%) |
| $50,000 to $54,999 | 1 (0.7%) | 29 (15.5%) |
| $55,000 to $64,999 | 6 (4.5%) | 4 (2.1%) |
| $65,000 to $74,999 | 0 (0.0%) | 12 (6.4%) |
| $75,000 to $99,999 | 0 (0.0%) | 0 (0.0%) |
| $100,000+ | 0 (0.0%) | 0 (0.0%) |
| Total | 134 (100.0%) | 187 (100.0%) |
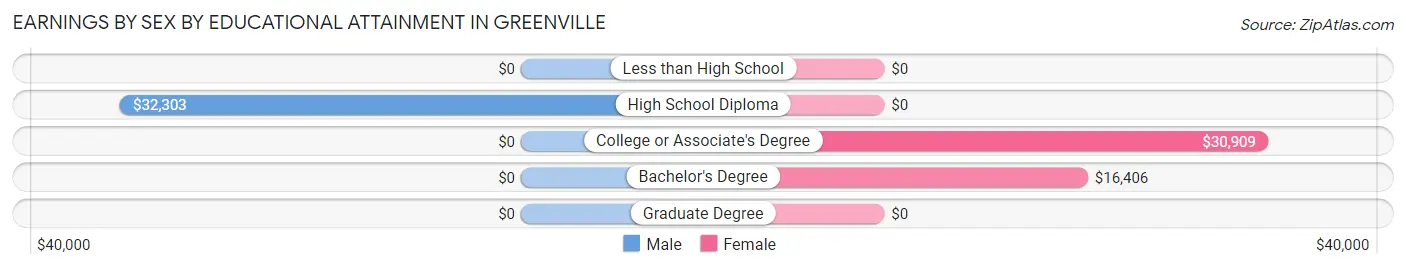
Earnings by Sex by Educational Attainment in Greenville
Average earnings in Greenville are $42,692 for men and $28,875 for women, a difference of 32.4%. Men with an educational attainment of high school diploma enjoy the highest average annual earnings of $32,303, while those with high school diploma education earn the least with $32,303. Women with an educational attainment of college or associate's degree earn the most with the average annual earnings of $30,909, while those with bachelor's degree education have the smallest earnings of $16,406.
| Educational Attainment | Male Income | Female Income |
| Less than High School | - | - |
| High School Diploma | $32,303 | $0 |
| College or Associate's Degree | - | - |
| Bachelor's Degree | - | - |
| Graduate Degree | - | - |
| Total | $42,692 | $28,875 |
Family Income in Greenville
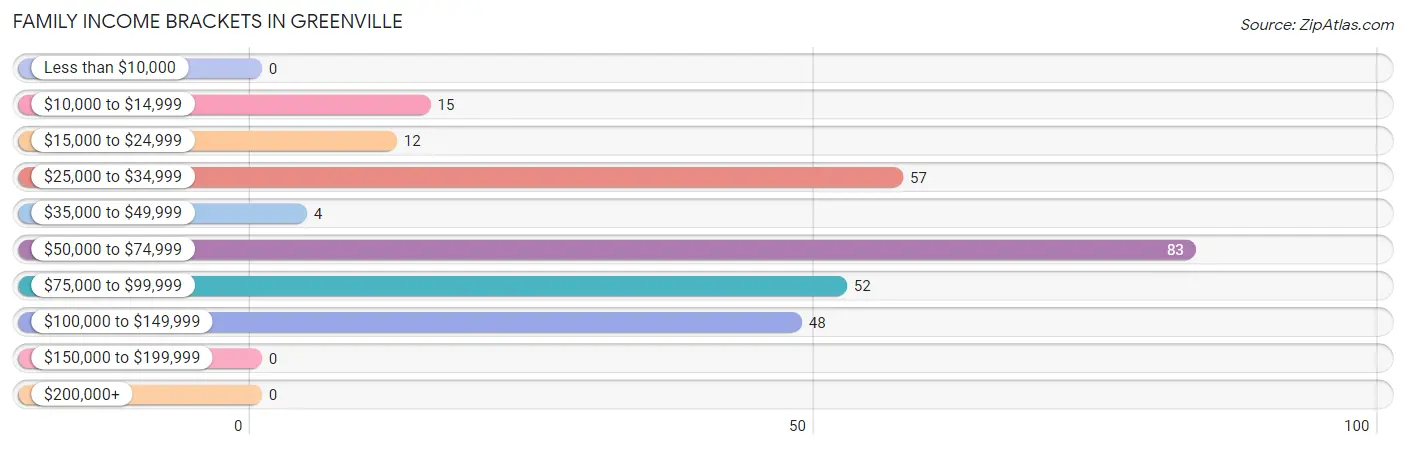
Family Income Brackets in Greenville
According to the Greenville family income data, there are 83 families falling into the $50,000 to $74,999 income range, which is the most common income bracket and makes up 30.6% of all families.
| Income Bracket | # Families | % Families |
| Less than $10,000 | 0 | 0.0% |
| $10,000 to $14,999 | 15 | 5.5% |
| $15,000 to $24,999 | 12 | 4.4% |
| $25,000 to $34,999 | 57 | 21.0% |
| $35,000 to $49,999 | 4 | 1.5% |
| $50,000 to $74,999 | 83 | 30.6% |
| $75,000 to $99,999 | 52 | 19.2% |
| $100,000 to $149,999 | 48 | 17.7% |
| $150,000 to $199,999 | 0 | 0.0% |
| $200,000+ | 0 | 0.0% |
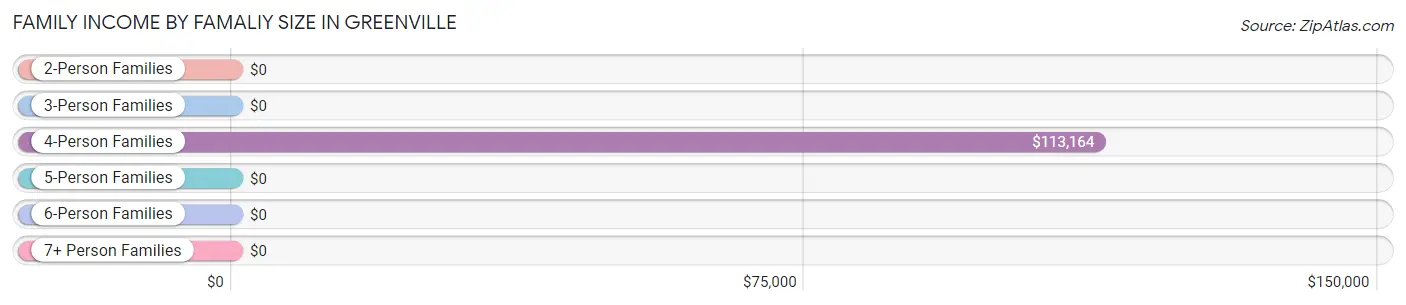
Family Income by Famaliy Size in Greenville
4-person families (73 | 26.9%) account for the highest median family income in Greenville with $113,164 per family, while 4-person families (73 | 26.9%) have the highest median income of $28,291 per family member.
| Income Bracket | # Families | Median Income |
| 2-Person Families | 82 (30.3%) | $0 |
| 3-Person Families | 29 (10.7%) | $0 |
| 4-Person Families | 73 (26.9%) | $113,164 |
| 5-Person Families | 0 (0.0%) | $0 |
| 6-Person Families | 87 (32.1%) | $0 |
| 7+ Person Families | 0 (0.0%) | $0 |
| Total | 271 (100.0%) | $71,267 |
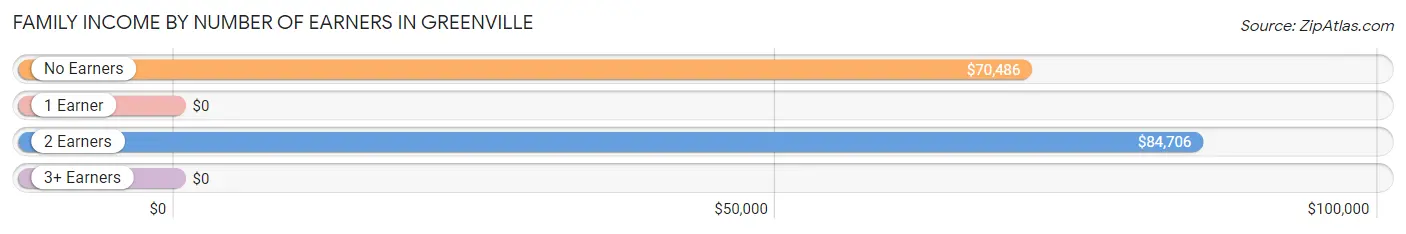
Family Income by Number of Earners in Greenville
| Number of Earners | # Families | Median Income |
| No Earners | 116 (42.8%) | $70,486 |
| 1 Earner | 90 (33.2%) | $0 |
| 2 Earners | 52 (19.2%) | $84,706 |
| 3+ Earners | 13 (4.8%) | $0 |
| Total | 271 (100.0%) | $71,267 |
Household Income in Greenville
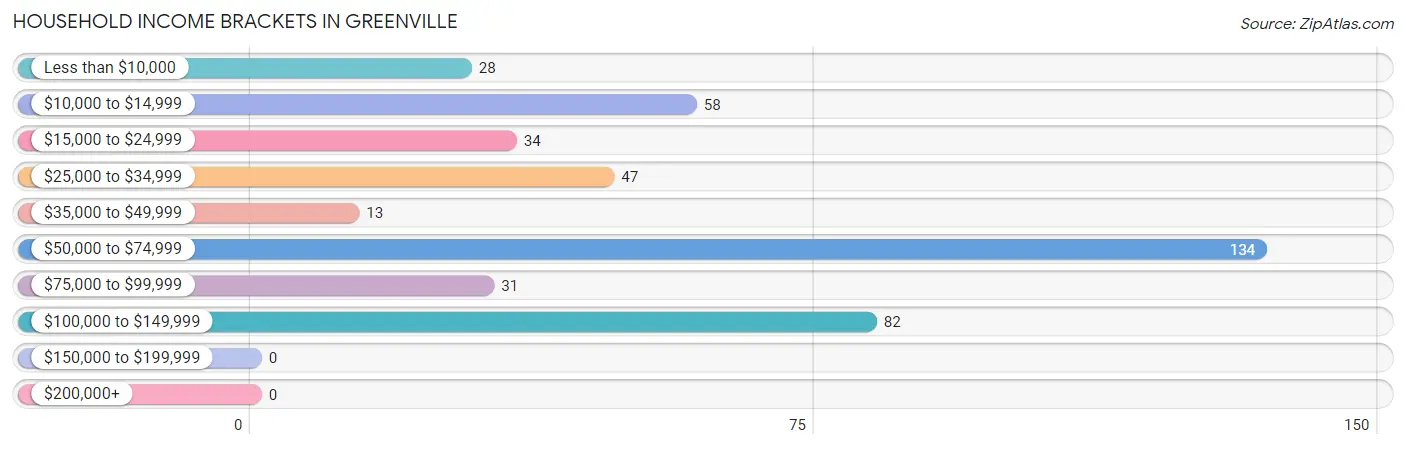
Household Income Brackets in Greenville
With 134 households falling in the category, the $50,000 to $74,999 income range is the most frequent in Greenville, accounting for 31.4% of all households.
| Income Bracket | # Households | % Households |
| Less than $10,000 | 28 | 6.6% |
| $10,000 to $14,999 | 58 | 13.6% |
| $15,000 to $24,999 | 34 | 8.0% |
| $25,000 to $34,999 | 47 | 11.0% |
| $35,000 to $49,999 | 13 | 3.0% |
| $50,000 to $74,999 | 134 | 31.4% |
| $75,000 to $99,999 | 31 | 7.3% |
| $100,000 to $149,999 | 82 | 19.2% |
| $150,000 to $199,999 | 0 | 0.0% |
| $200,000+ | 0 | 0.0% |
Household Income by Householder Age in Greenville
The median household income in Greenville is $52,204, with the highest median household income of $70,295 found in the 65+ years age bracket for the primary householder. A total of 133 households (31.1%) fall into this category.
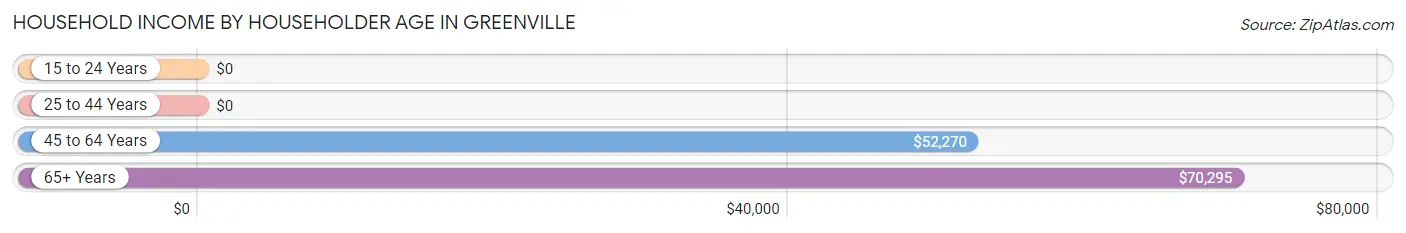
| Income Bracket | # Households | Median Income |
| 15 to 24 Years | 0 (0.0%) | $0 |
| 25 to 44 Years | 109 (25.5%) | $0 |
| 45 to 64 Years | 185 (43.3%) | $52,270 |
| 65+ Years | 133 (31.1%) | $70,295 |
| Total | 427 (100.0%) | $52,204 |
Poverty in Greenville
Income Below Poverty by Sex and Age in Greenville
With 39.1% poverty level for males and 33.4% for females among the residents of Greenville, 15 year old males and 5 year old females are the most vulnerable to poverty, with 14 males (100.0%) and 13 females (100.0%) in their respective age groups living below the poverty level.
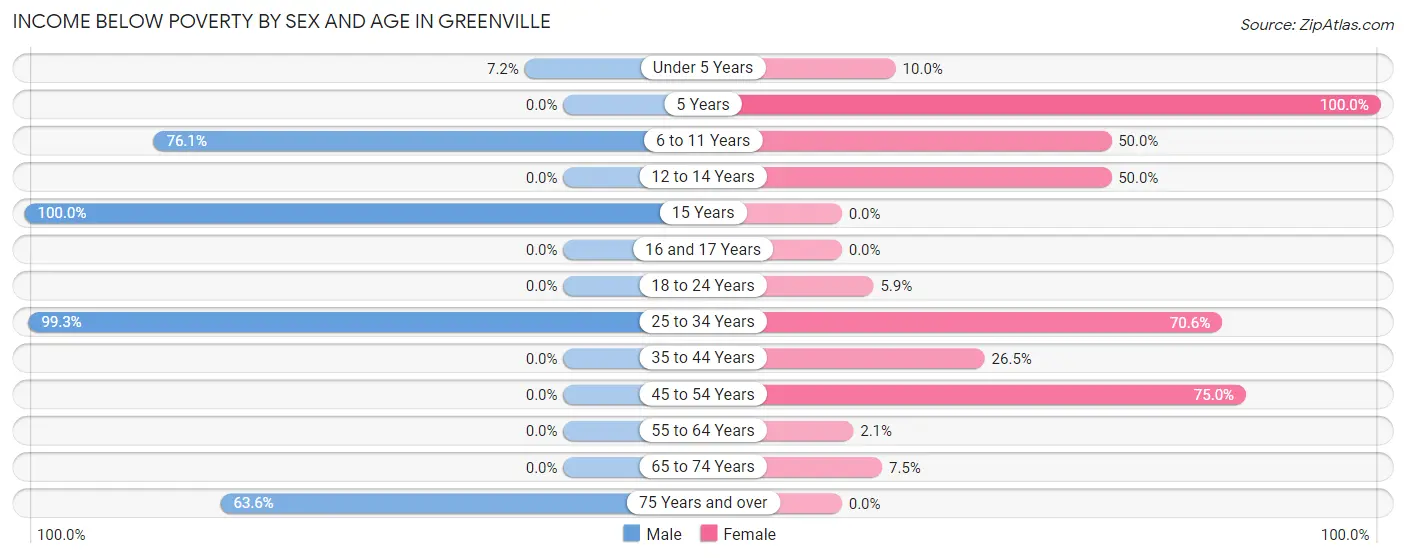
| Age Bracket | Male | Female |
| Under 5 Years | 12 (7.2%) | 8 (10.0%) |
| 5 Years | 0 (0.0%) | 13 (100.0%) |
| 6 to 11 Years | 54 (76.1%) | 18 (50.0%) |
| 12 to 14 Years | 0 (0.0%) | 18 (50.0%) |
| 15 Years | 14 (100.0%) | 0 (0.0%) |
| 16 and 17 Years | 0 (0.0%) | 0 (0.0%) |
| 18 to 24 Years | 0 (0.0%) | 1 (5.9%) |
| 25 to 34 Years | 138 (99.3%) | 151 (70.6%) |
| 35 to 44 Years | 0 (0.0%) | 35 (26.5%) |
| 45 to 54 Years | 0 (0.0%) | 36 (75.0%) |
| 55 to 64 Years | 0 (0.0%) | 2 (2.1%) |
| 65 to 74 Years | 0 (0.0%) | 8 (7.5%) |
| 75 Years and over | 21 (63.6%) | 0 (0.0%) |
| Total | 239 (39.1%) | 290 (33.4%) |
Income Above Poverty by Sex and Age in Greenville
According to the poverty statistics in Greenville, males aged 12 to 14 years and females aged 75 years and over are the age groups that are most secure financially, with 100.0% of males and 100.0% of females in these age groups living above the poverty line.
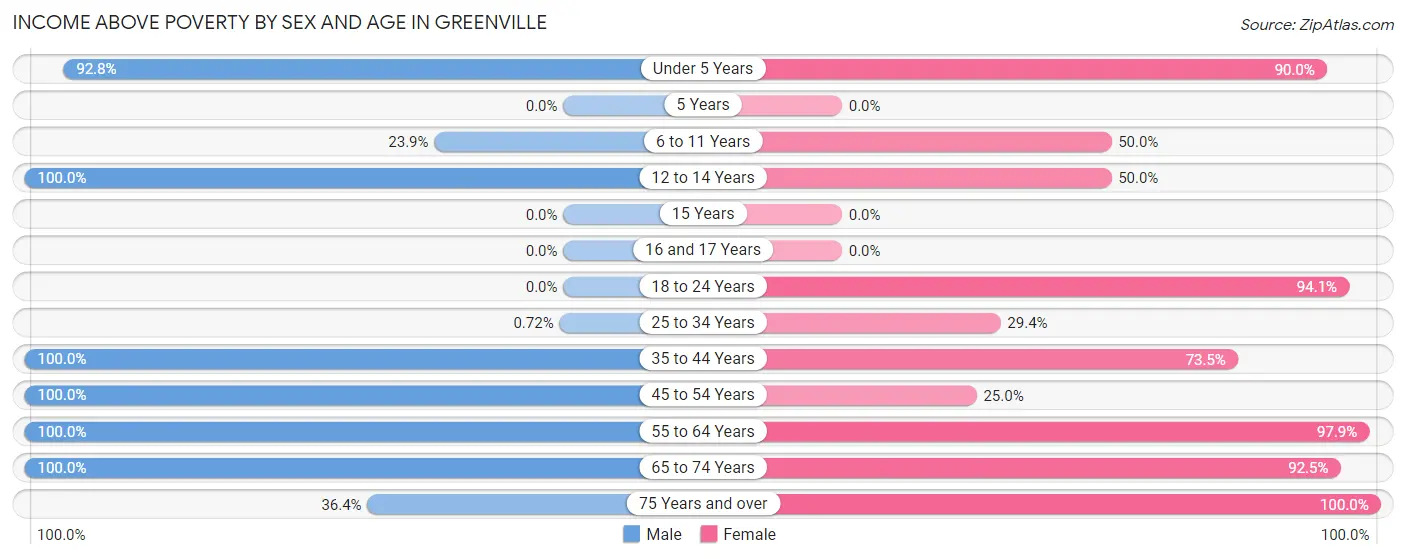
| Age Bracket | Male | Female |
| Under 5 Years | 155 (92.8%) | 72 (90.0%) |
| 5 Years | 0 (0.0%) | 0 (0.0%) |
| 6 to 11 Years | 17 (23.9%) | 18 (50.0%) |
| 12 to 14 Years | 29 (100.0%) | 18 (50.0%) |
| 15 Years | 0 (0.0%) | 0 (0.0%) |
| 16 and 17 Years | 0 (0.0%) | 0 (0.0%) |
| 18 to 24 Years | 0 (0.0%) | 16 (94.1%) |
| 25 to 34 Years | 1 (0.7%) | 63 (29.4%) |
| 35 to 44 Years | 63 (100.0%) | 97 (73.5%) |
| 45 to 54 Years | 31 (100.0%) | 12 (25.0%) |
| 55 to 64 Years | 60 (100.0%) | 92 (97.9%) |
| 65 to 74 Years | 5 (100.0%) | 99 (92.5%) |
| 75 Years and over | 12 (36.4%) | 91 (100.0%) |
| Total | 373 (61.0%) | 578 (66.6%) |
Income Below Poverty Among Married-Couple Families in Greenville
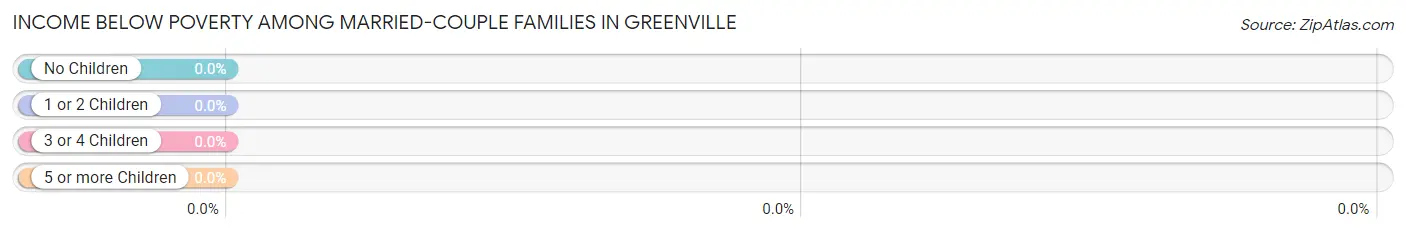
| Children | Above Poverty | Below Poverty |
| No Children | 20 (100.0%) | 0 (0.0%) |
| 1 or 2 Children | 17 (100.0%) | 0 (0.0%) |
| 3 or 4 Children | 0 (0.0%) | 0 (0.0%) |
| 5 or more Children | 0 (0.0%) | 0 (0.0%) |
| Total | 37 (100.0%) | 0 (0.0%) |
Income Below Poverty Among Single-Parent Households in Greenville
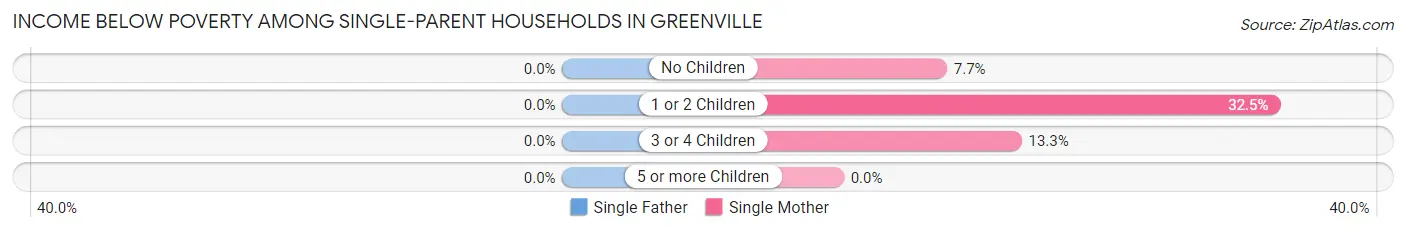
| Children | Single Father | Single Mother |
| No Children | 0 (0.0%) | 4 (7.7%) |
| 1 or 2 Children | 0 (0.0%) | 27 (32.5%) |
| 3 or 4 Children | 0 (0.0%) | 11 (13.3%) |
| 5 or more Children | 0 (0.0%) | 0 (0.0%) |
| Total | 0 (0.0%) | 42 (19.3%) |
Income Below Poverty Among Married-Couple vs Single-Parent Households in Greenville
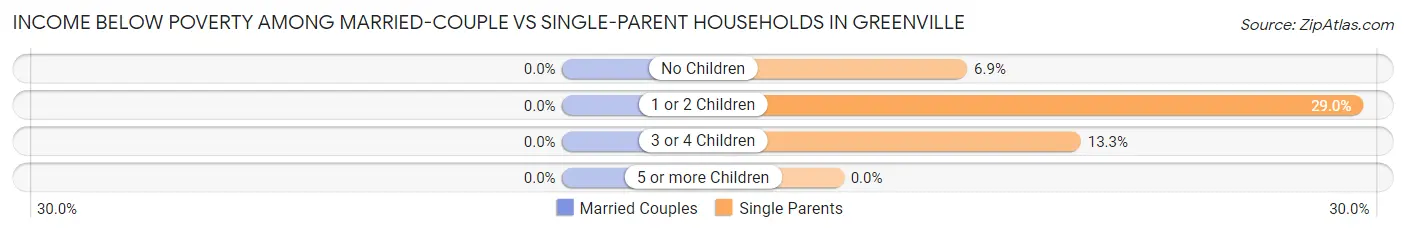
| Children | Married-Couple Families | Single-Parent Households |
| No Children | 0 (0.0%) | 4 (6.9%) |
| 1 or 2 Children | 0 (0.0%) | 27 (29.0%) |
| 3 or 4 Children | 0 (0.0%) | 11 (13.3%) |
| 5 or more Children | 0 (0.0%) | 0 (0.0%) |
| Total | 0 (0.0%) | 42 (17.9%) |
Race in Greenville
The most populous races in Greenville are Black / African American (1,393 | 90.1%), White / Caucasian (95 | 6.1%), and Some other Race (52 | 3.4%).
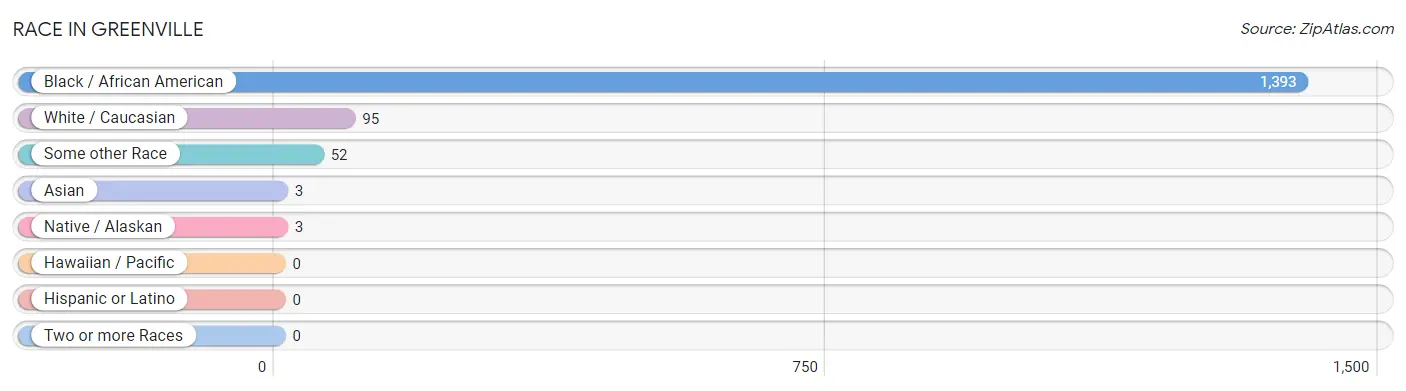
| Race | # Population | % Population |
| Asian | 3 | 0.2% |
| Black / African American | 1,393 | 90.1% |
| Hawaiian / Pacific | 0 | 0.0% |
| Hispanic or Latino | 0 | 0.0% |
| Native / Alaskan | 3 | 0.2% |
| White / Caucasian | 95 | 6.1% |
| Two or more Races | 0 | 0.0% |
| Some other Race | 52 | 3.4% |
| Total | 1,546 | 100.0% |
Ancestry in Greenville
The most populous ancestries reported in Greenville are English (7 | 0.4%), German (4 | 0.3%), Burmese (3 | 0.2%), Houma (3 | 0.2%), and Norwegian (3 | 0.2%), together accounting for 1.3% of all Greenville residents.
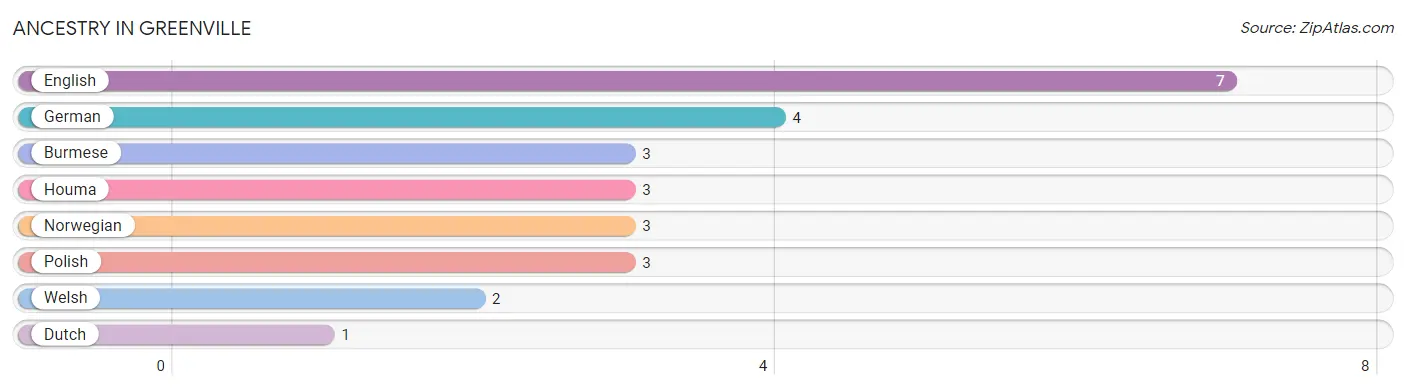
| Ancestry | # Population | % Population |
| Burmese | 3 | 0.2% |
| Dutch | 1 | 0.1% |
| English | 7 | 0.4% |
| German | 4 | 0.3% |
| Houma | 3 | 0.2% |
| Norwegian | 3 | 0.2% |
| Polish | 3 | 0.2% |
| Welsh | 2 | 0.1% | View All 8 Rows |
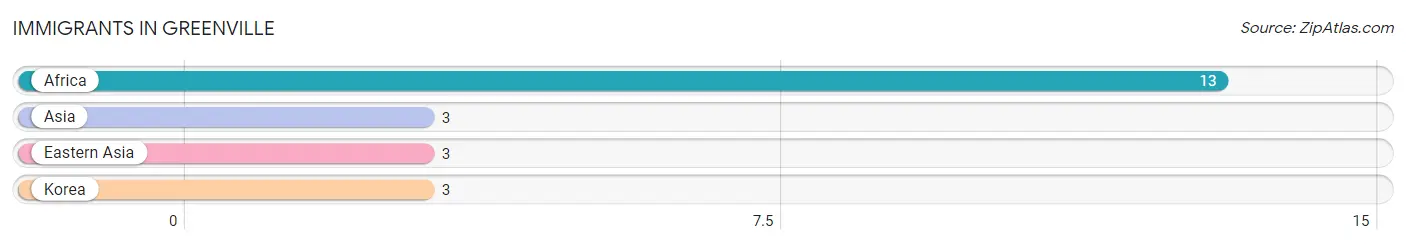
Immigrants in Greenville
The most numerous immigrant groups reported in Greenville came from Africa (13 | 0.8%), Asia (3 | 0.2%), Eastern Asia (3 | 0.2%), and Korea (3 | 0.2%), together accounting for 1.4% of all Greenville residents.
| Immigration Origin | # Population | % Population |
| Africa | 13 | 0.8% |
| Asia | 3 | 0.2% |
| Eastern Asia | 3 | 0.2% |
| Korea | 3 | 0.2% | View All 4 Rows |
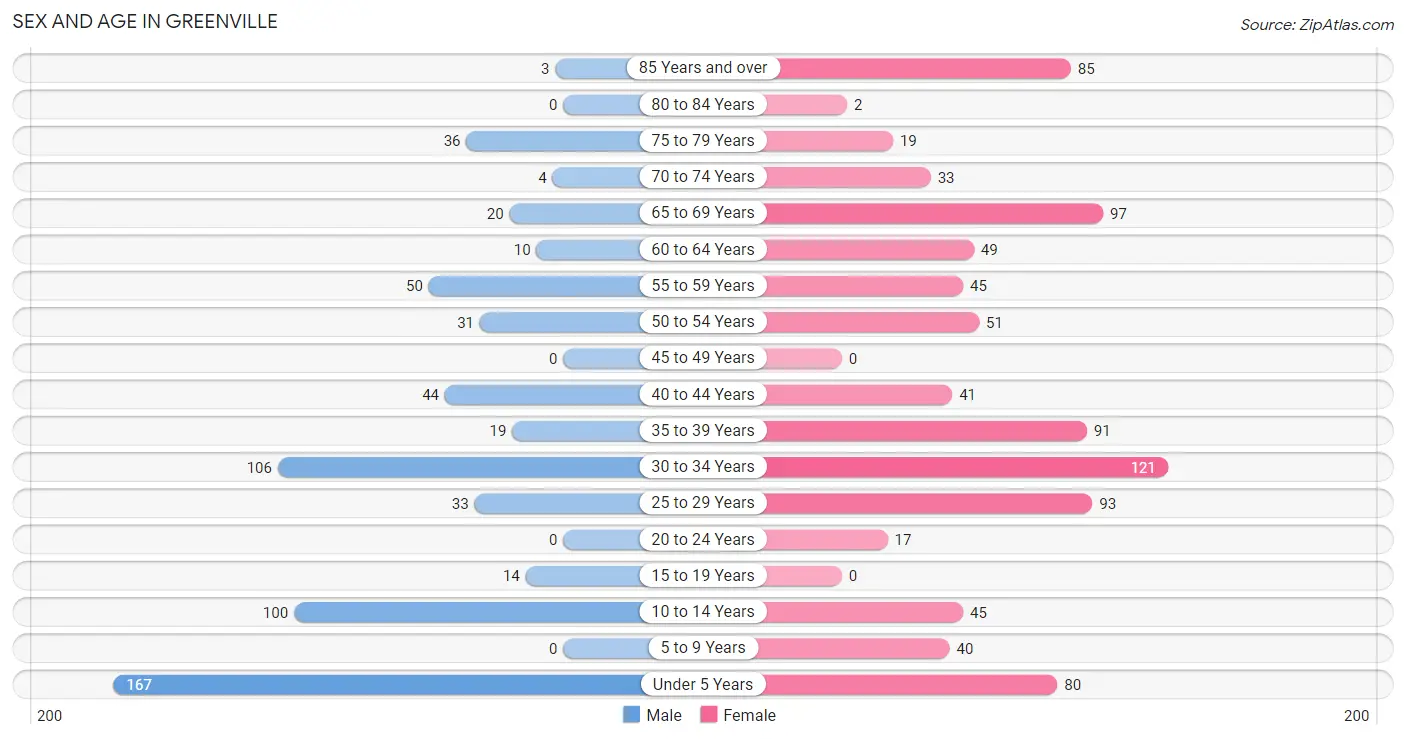
Sex and Age in Greenville
Sex and Age in Greenville
The most populous age groups in Greenville are Under 5 Years (167 | 26.2%) for men and 30 to 34 Years (121 | 13.3%) for women.
| Age Bracket | Male | Female |
| Under 5 Years | 167 (26.2%) | 80 (8.8%) |
| 5 to 9 Years | 0 (0.0%) | 40 (4.4%) |
| 10 to 14 Years | 100 (15.7%) | 45 (5.0%) |
| 15 to 19 Years | 14 (2.2%) | 0 (0.0%) |
| 20 to 24 Years | 0 (0.0%) | 17 (1.9%) |
| 25 to 29 Years | 33 (5.2%) | 93 (10.2%) |
| 30 to 34 Years | 106 (16.6%) | 121 (13.3%) |
| 35 to 39 Years | 19 (3.0%) | 91 (10.0%) |
| 40 to 44 Years | 44 (6.9%) | 41 (4.5%) |
| 45 to 49 Years | 0 (0.0%) | 0 (0.0%) |
| 50 to 54 Years | 31 (4.9%) | 51 (5.6%) |
| 55 to 59 Years | 50 (7.9%) | 45 (5.0%) |
| 60 to 64 Years | 10 (1.6%) | 49 (5.4%) |
| 65 to 69 Years | 20 (3.1%) | 97 (10.7%) |
| 70 to 74 Years | 4 (0.6%) | 33 (3.6%) |
| 75 to 79 Years | 36 (5.7%) | 19 (2.1%) |
| 80 to 84 Years | 0 (0.0%) | 2 (0.2%) |
| 85 Years and over | 3 (0.5%) | 85 (9.3%) |
| Total | 637 (100.0%) | 909 (100.0%) |
Families and Households in Greenville
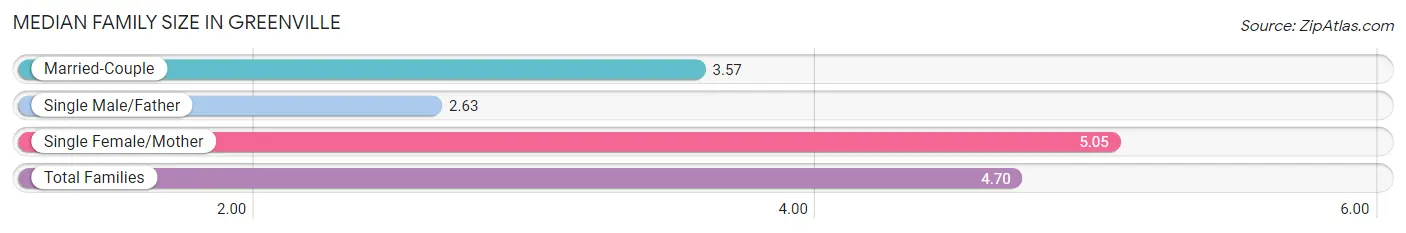
Median Family Size in Greenville
The median family size in Greenville is 4.70 persons per family, with single female/mother families (218 | 80.4%) accounting for the largest median family size of 5.05 persons per family. On the other hand, single male/father families (16 | 5.9%) represent the smallest median family size with 2.63 persons per family.
| Family Type | # Families | Family Size |
| Married-Couple | 37 (13.7%) | 3.57 |
| Single Male/Father | 16 (5.9%) | 2.63 |
| Single Female/Mother | 218 (80.4%) | 5.05 |
| Total Families | 271 (100.0%) | 4.70 |
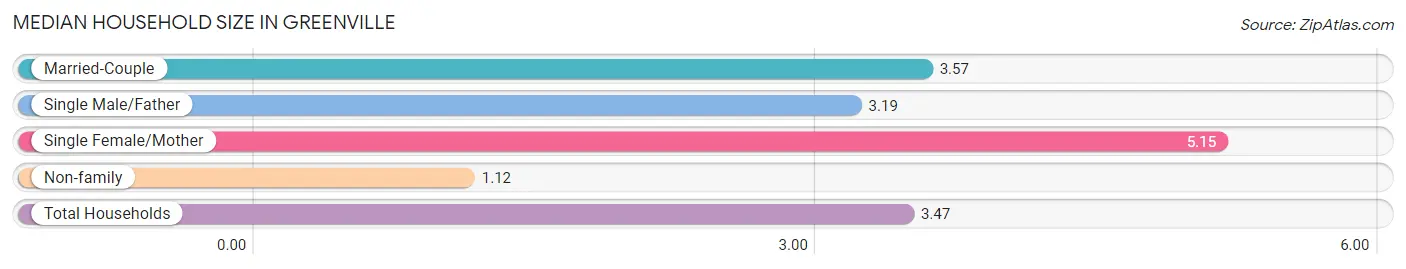
Median Household Size in Greenville
The median household size in Greenville is 3.47 persons per household, with single female/mother households (218 | 51.0%) accounting for the largest median household size of 5.15 persons per household. non-family households (156 | 36.5%) represent the smallest median household size with 1.12 persons per household.
| Household Type | # Households | Household Size |
| Married-Couple | 37 (8.7%) | 3.57 |
| Single Male/Father | 16 (3.7%) | 3.19 |
| Single Female/Mother | 218 (51.0%) | 5.15 |
| Non-family | 156 (36.5%) | 1.12 |
| Total Households | 427 (100.0%) | 3.47 |
Household Size by Marriage Status in Greenville
Out of a total of 427 households in Greenville, 271 (63.5%) are family households, while 156 (36.5%) are nonfamily households. The most numerous type of family households are 6-person households, comprising 87, and the most common type of nonfamily households are 1-person households, comprising 118.
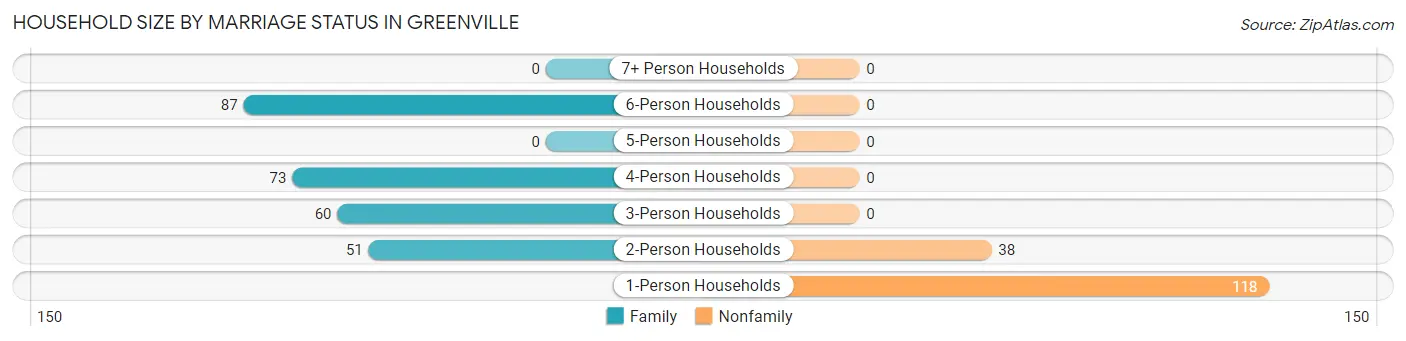
| Household Size | Family Households | Nonfamily Households |
| 1-Person Households | - | 118 (27.6%) |
| 2-Person Households | 51 (11.9%) | 38 (8.9%) |
| 3-Person Households | 60 (14.1%) | 0 (0.0%) |
| 4-Person Households | 73 (17.1%) | 0 (0.0%) |
| 5-Person Households | 0 (0.0%) | 0 (0.0%) |
| 6-Person Households | 87 (20.4%) | 0 (0.0%) |
| 7+ Person Households | 0 (0.0%) | 0 (0.0%) |
| Total | 271 (63.5%) | 156 (36.5%) |
Female Fertility in Greenville
Fertility by Age in Greenville
Average fertility rate in Greenville is 605.0 births per 1,000 women. Women in the age bracket of 35 to 50 years have the highest fertility rate with 609.0 births per 1,000 women. Women in the age bracket of 20 to 34 years acount for 59.4% of all women with births.
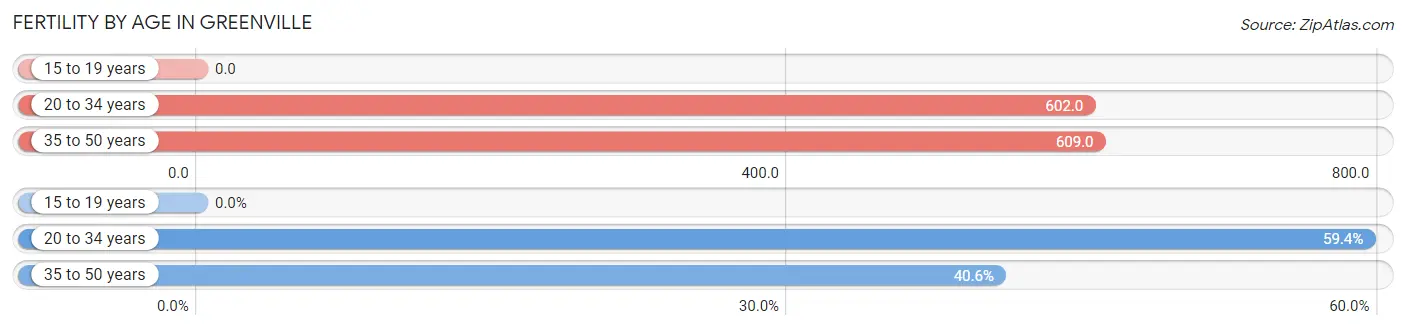
| Age Bracket | Women with Births | Births / 1,000 Women |
| 15 to 19 years | 0 (0.0%) | 0.0 |
| 20 to 34 years | 139 (59.4%) | 602.0 |
| 35 to 50 years | 95 (40.6%) | 609.0 |
| Total | 234 (100.0%) | 605.0 |
Fertility by Age by Marriage Status in Greenville
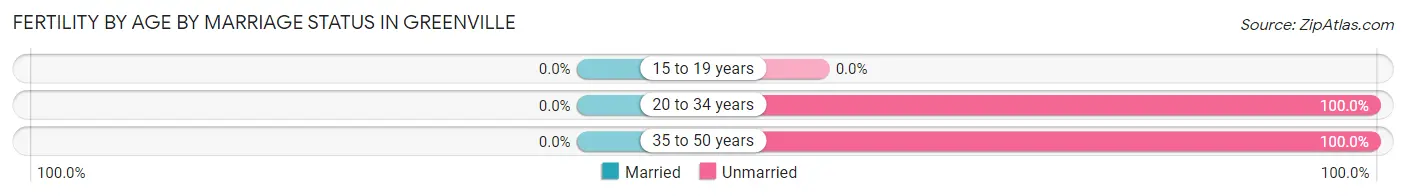
| Age Bracket | Married | Unmarried |
| 15 to 19 years | 0 (0.0%) | 0 (0.0%) |
| 20 to 34 years | 0 (0.0%) | 139 (100.0%) |
| 35 to 50 years | 0 (0.0%) | 95 (100.0%) |
| Total | 0 (0.0%) | 234 (100.0%) |
Fertility by Education in Greenville
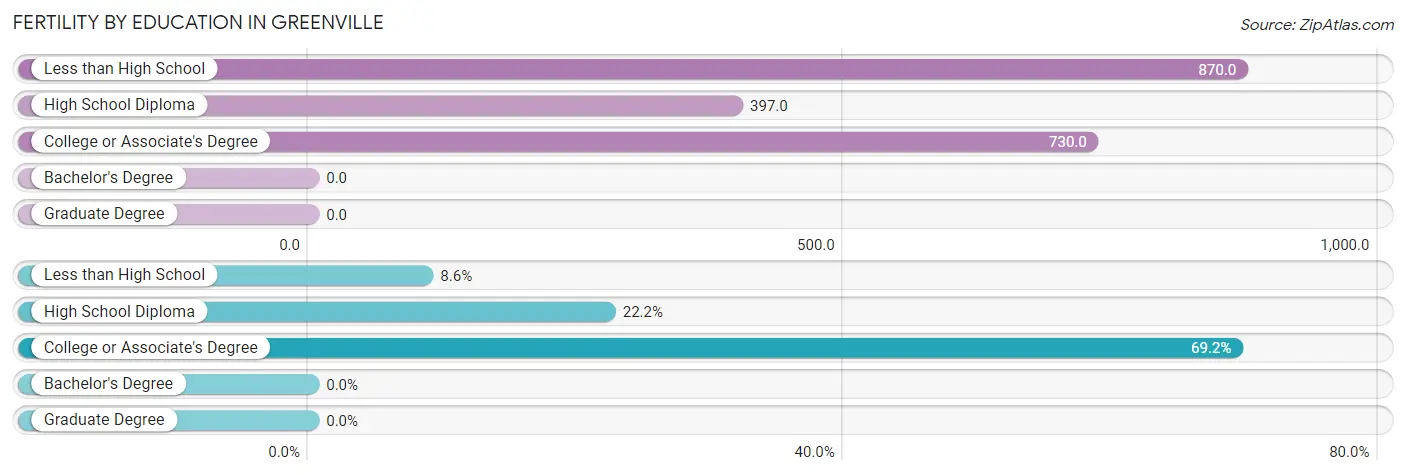
| Educational Attainment | Women with Births | Births / 1,000 Women |
| Less than High School | 20 (8.6%) | 870.0 |
| High School Diploma | 52 (22.2%) | 397.0 |
| College or Associate's Degree | 162 (69.2%) | 730.0 |
| Bachelor's Degree | 0 (0.0%) | 0.0 |
| Graduate Degree | 0 (0.0%) | 0.0 |
| Total | 234 (100.0%) | 605.0 |
Fertility by Education by Marriage Status in Greenville
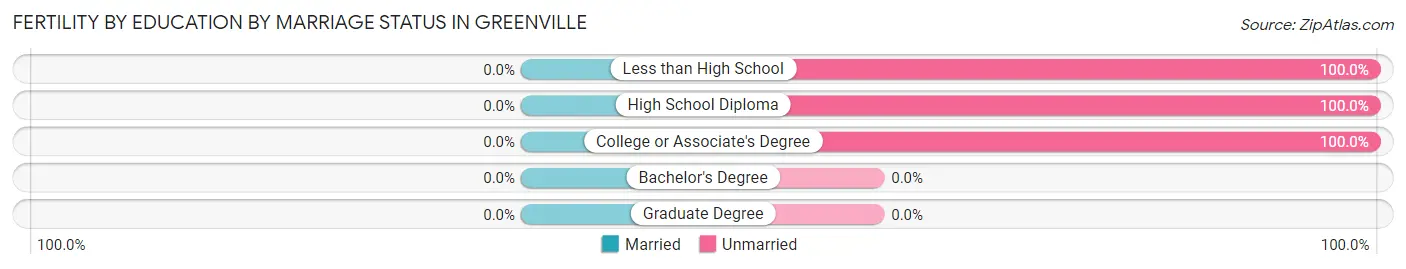
| Educational Attainment | Married | Unmarried |
| Less than High School | 0 (0.0%) | 20 (100.0%) |
| High School Diploma | 0 (0.0%) | 52 (100.0%) |
| College or Associate's Degree | 0 (0.0%) | 162 (100.0%) |
| Bachelor's Degree | 0 (0.0%) | 0 (0.0%) |
| Graduate Degree | 0 (0.0%) | 0 (0.0%) |
| Total | 0 (0.0%) | 234 (100.0%) |
Employment Characteristics in Greenville
Employment by Class of Employer in Greenville
Among the 286 employed individuals in Greenville, private company employees (170 | 59.4%), state government employees (48 | 16.8%), and self-employed (incorporated) (39 | 13.6%) make up the most common classes of employment.
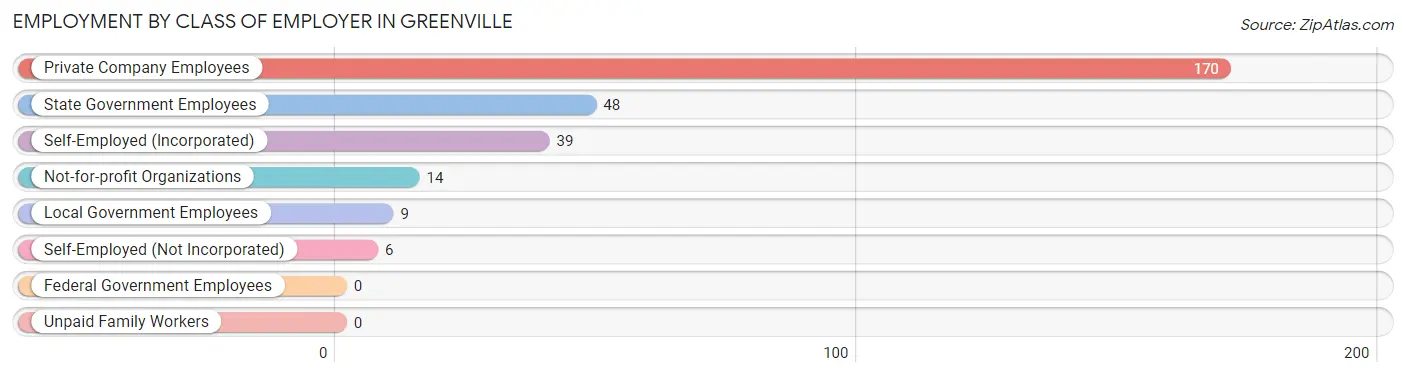
| Employer Class | # Employees | % Employees |
| Private Company Employees | 170 | 59.4% |
| Self-Employed (Incorporated) | 39 | 13.6% |
| Self-Employed (Not Incorporated) | 6 | 2.1% |
| Not-for-profit Organizations | 14 | 4.9% |
| Local Government Employees | 9 | 3.2% |
| State Government Employees | 48 | 16.8% |
| Federal Government Employees | 0 | 0.0% |
| Unpaid Family Workers | 0 | 0.0% |
| Total | 286 | 100.0% |
Employment Status by Age in Greenville
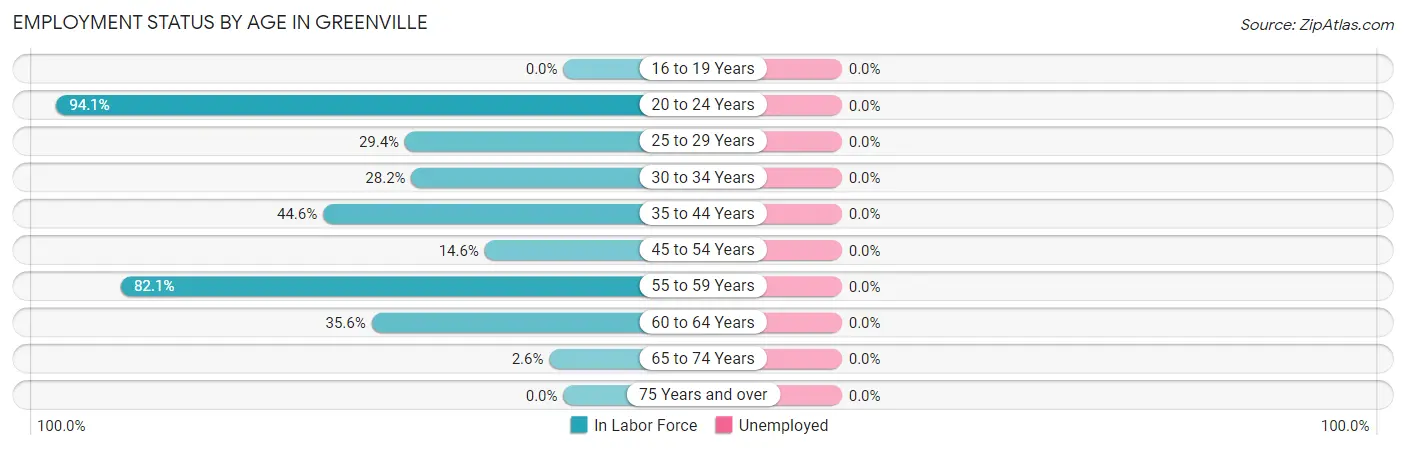
| Age Bracket | In Labor Force | Unemployed |
| 16 to 19 Years | 0 (0.0%) | 0 (0.0%) |
| 20 to 24 Years | 16 (94.1%) | 0 (0.0%) |
| 25 to 29 Years | 37 (29.4%) | 0 (0.0%) |
| 30 to 34 Years | 64 (28.2%) | 0 (0.0%) |
| 35 to 44 Years | 87 (44.6%) | 0 (0.0%) |
| 45 to 54 Years | 12 (14.6%) | 0 (0.0%) |
| 55 to 59 Years | 78 (82.1%) | 0 (0.0%) |
| 60 to 64 Years | 21 (35.6%) | 0 (0.0%) |
| 65 to 74 Years | 4 (2.6%) | 0 (0.0%) |
| 75 Years and over | 0 (0.0%) | 0 (0.0%) |
| Total | 319 (29.0%) | 0 (0.0%) |
Employment Status by Educational Attainment in Greenville
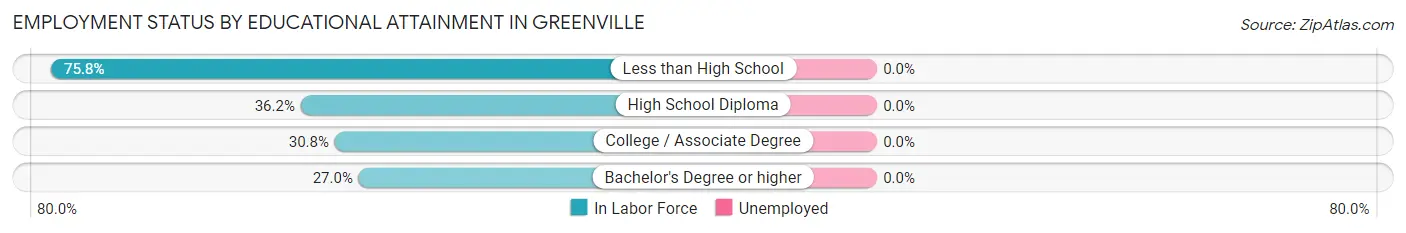
| Educational Attainment | In Labor Force | Unemployed |
| Less than High School | 72 (75.8%) | 0 (0.0%) |
| High School Diploma | 121 (36.2%) | 0 (0.0%) |
| College / Associate Degree | 82 (30.8%) | 0 (0.0%) |
| Bachelor's Degree or higher | 24 (27.0%) | 0 (0.0%) |
| Total | 299 (38.1%) | 0 (0.0%) |
Employment Occupations by Sex in Greenville
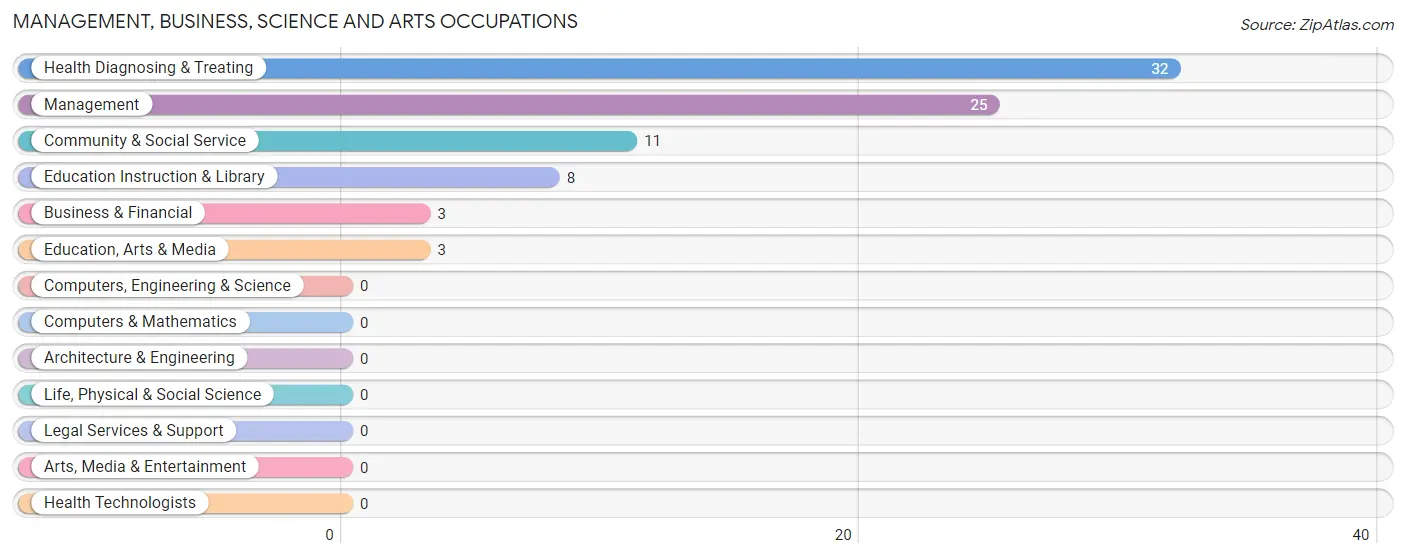
Management, Business, Science and Arts Occupations
The most common Management, Business, Science and Arts occupations in Greenville are Health Diagnosing & Treating (32 | 10.0%), Management (25 | 7.8%), Community & Social Service (11 | 3.5%), Education Instruction & Library (8 | 2.5%), and Business & Financial (3 | 0.9%).
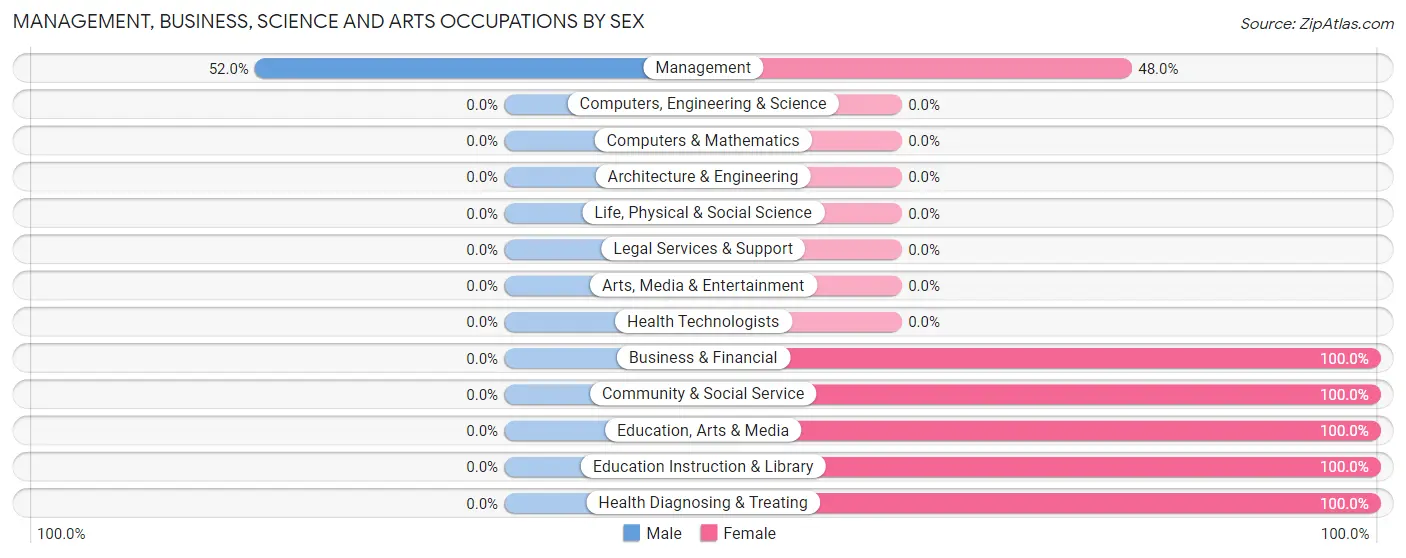
Management, Business, Science and Arts Occupations by Sex
| Occupation | Male | Female |
| Management | 13 (52.0%) | 12 (48.0%) |
| Business & Financial | 0 (0.0%) | 3 (100.0%) |
| Computers, Engineering & Science | 0 (0.0%) | 0 (0.0%) |
| Computers & Mathematics | 0 (0.0%) | 0 (0.0%) |
| Architecture & Engineering | 0 (0.0%) | 0 (0.0%) |
| Life, Physical & Social Science | 0 (0.0%) | 0 (0.0%) |
| Community & Social Service | 0 (0.0%) | 11 (100.0%) |
| Education, Arts & Media | 0 (0.0%) | 3 (100.0%) |
| Legal Services & Support | 0 (0.0%) | 0 (0.0%) |
| Education Instruction & Library | 0 (0.0%) | 8 (100.0%) |
| Arts, Media & Entertainment | 0 (0.0%) | 0 (0.0%) |
| Health Diagnosing & Treating | 0 (0.0%) | 32 (100.0%) |
| Health Technologists | 0 (0.0%) | 0 (0.0%) |
| Total (Category) | 13 (18.3%) | 58 (81.7%) |
| Total (Overall) | 134 (42.0%) | 185 (58.0%) |
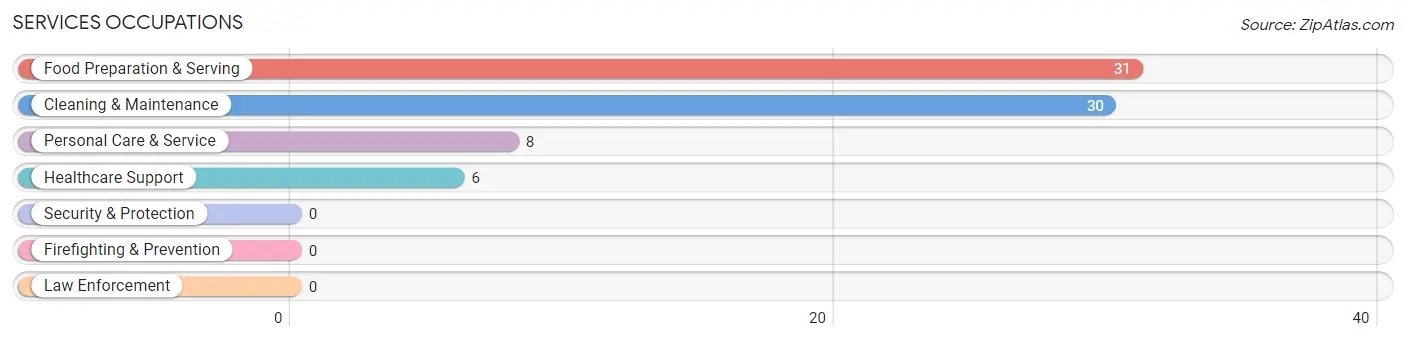
Services Occupations
The most common Services occupations in Greenville are Food Preparation & Serving (31 | 9.7%), Cleaning & Maintenance (30 | 9.4%), Personal Care & Service (8 | 2.5%), and Healthcare Support (6 | 1.9%).
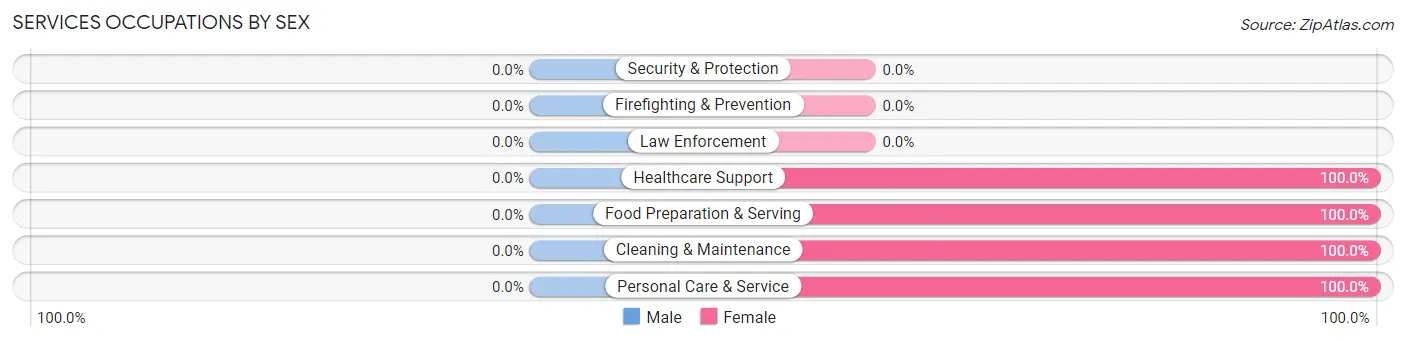
Services Occupations by Sex
| Occupation | Male | Female |
| Healthcare Support | 0 (0.0%) | 6 (100.0%) |
| Security & Protection | 0 (0.0%) | 0 (0.0%) |
| Firefighting & Prevention | 0 (0.0%) | 0 (0.0%) |
| Law Enforcement | 0 (0.0%) | 0 (0.0%) |
| Food Preparation & Serving | 0 (0.0%) | 31 (100.0%) |
| Cleaning & Maintenance | 0 (0.0%) | 30 (100.0%) |
| Personal Care & Service | 0 (0.0%) | 8 (100.0%) |
| Total (Category) | 0 (0.0%) | 75 (100.0%) |
| Total (Overall) | 134 (42.0%) | 185 (58.0%) |
Sales and Office Occupations
The most common Sales and Office occupations in Greenville are Office & Administration (32 | 10.0%), and Sales & Related (26 | 8.2%).

Sales and Office Occupations by Sex
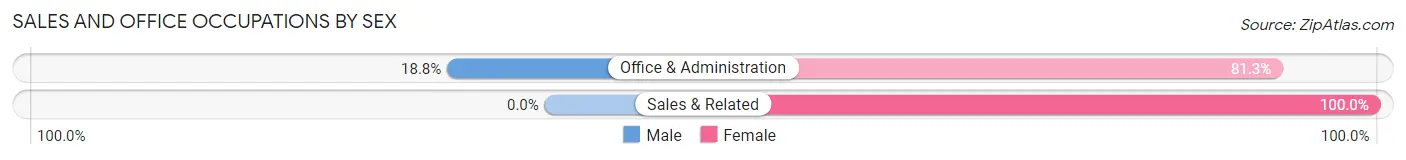
| Occupation | Male | Female |
| Sales & Related | 0 (0.0%) | 26 (100.0%) |
| Office & Administration | 6 (18.8%) | 26 (81.2%) |
| Total (Category) | 6 (10.3%) | 52 (89.7%) |
| Total (Overall) | 134 (42.0%) | 185 (58.0%) |
Natural Resources, Construction and Maintenance Occupations
The most common Natural Resources, Construction and Maintenance occupations in Greenville are Installation, Maintenance & Repair (19 | 6.0%), Farming, Fishing & Forestry (4 | 1.3%), and Construction & Extraction (1 | 0.3%).

Natural Resources, Construction and Maintenance Occupations by Sex

| Occupation | Male | Female |
| Farming, Fishing & Forestry | 4 (100.0%) | 0 (0.0%) |
| Construction & Extraction | 1 (100.0%) | 0 (0.0%) |
| Installation, Maintenance & Repair | 19 (100.0%) | 0 (0.0%) |
| Total (Category) | 24 (100.0%) | 0 (0.0%) |
| Total (Overall) | 134 (42.0%) | 185 (58.0%) |
Production, Transportation and Moving Occupations
The most common Production, Transportation and Moving occupations in Greenville are Transportation (48 | 15.0%), and Production (43 | 13.5%).
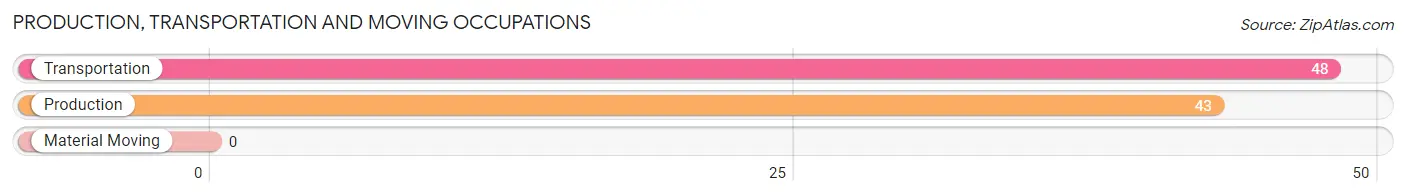
Production, Transportation and Moving Occupations by Sex
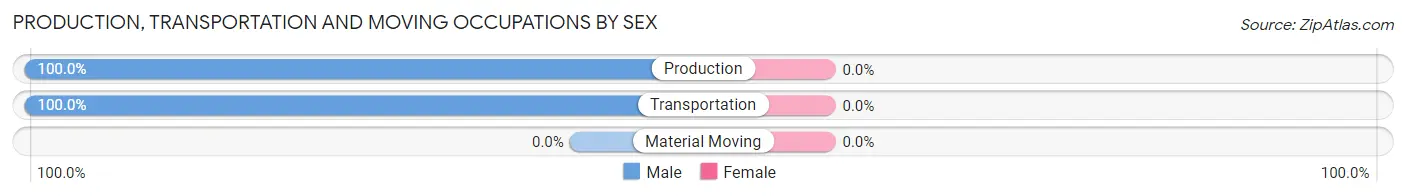
| Occupation | Male | Female |
| Production | 43 (100.0%) | 0 (0.0%) |
| Transportation | 48 (100.0%) | 0 (0.0%) |
| Material Moving | 0 (0.0%) | 0 (0.0%) |
| Total (Category) | 91 (100.0%) | 0 (0.0%) |
| Total (Overall) | 134 (42.0%) | 185 (58.0%) |
Employment Industries by Sex in Greenville
Employment Industries in Greenville
The major employment industries in Greenville include Health Care & Social Assistance (68 | 21.3%), Manufacturing (62 | 19.4%), Transportation & Warehousing (50 | 15.7%), Accommodation & Food Services (40 | 12.5%), and Educational Services (29 | 9.1%).
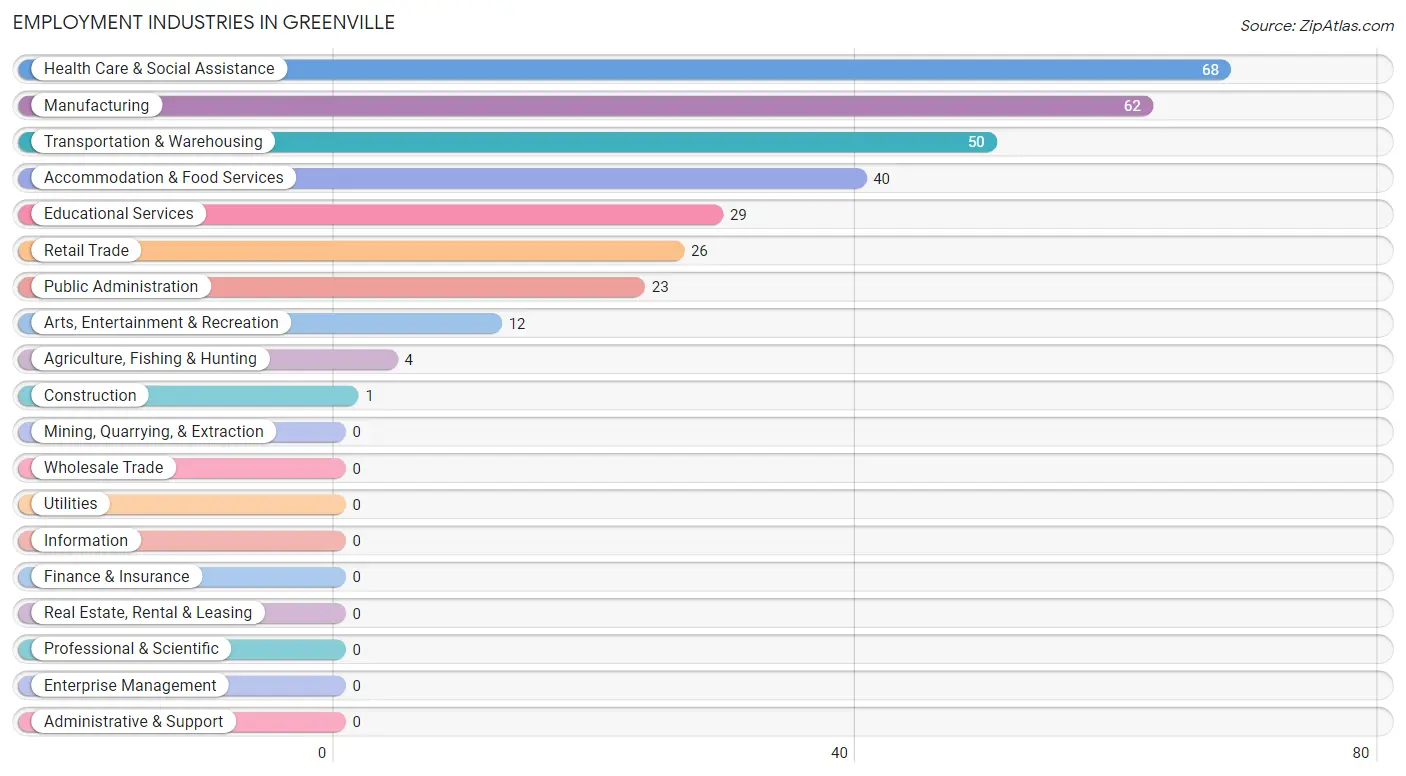
Employment Industries by Sex in Greenville
The Greenville industries that see more men than women are Agriculture, Fishing & Hunting (100.0%), Construction (100.0%), and Manufacturing (100.0%), whereas the industries that tend to have a higher number of women are Retail Trade (100.0%), Educational Services (100.0%), and Arts, Entertainment & Recreation (100.0%).
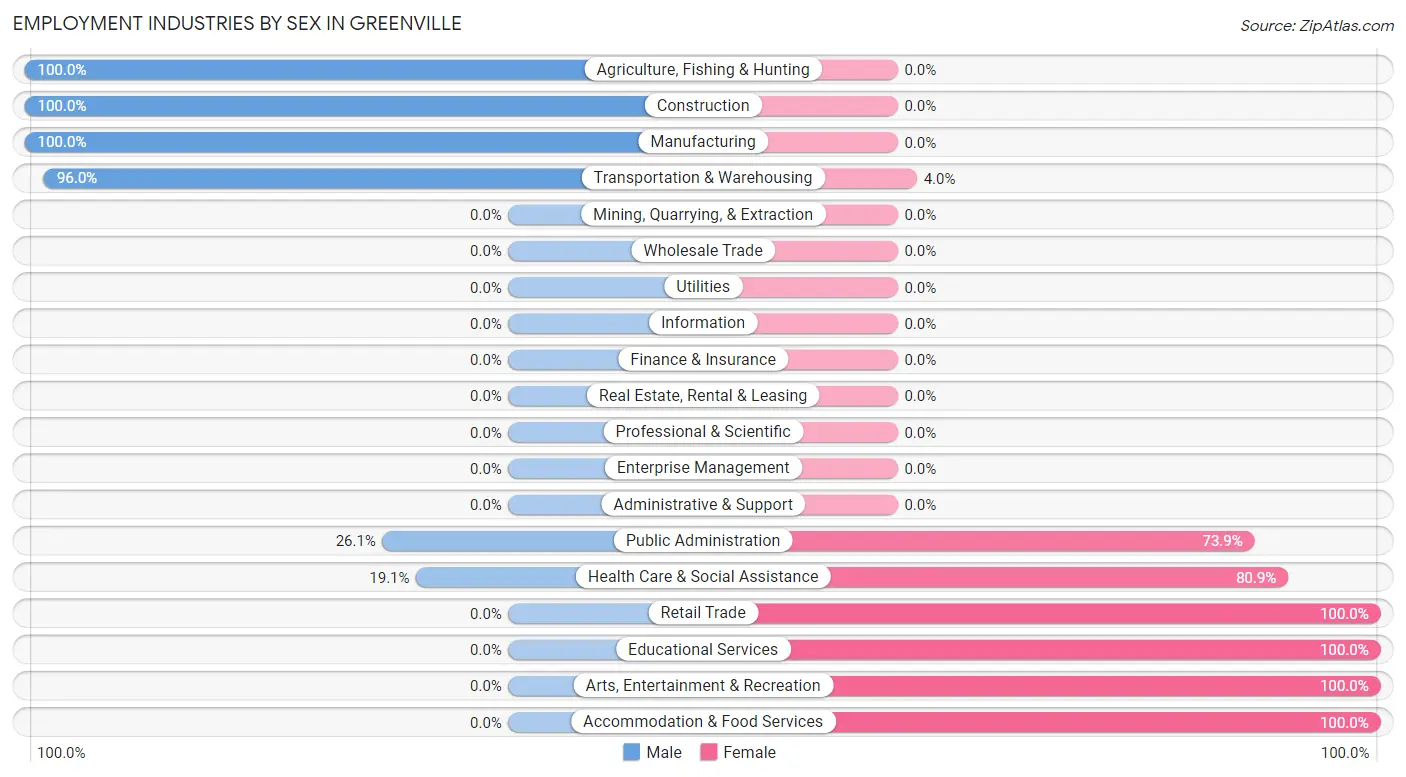
| Industry | Male | Female |
| Agriculture, Fishing & Hunting | 4 (100.0%) | 0 (0.0%) |
| Mining, Quarrying, & Extraction | 0 (0.0%) | 0 (0.0%) |
| Construction | 1 (100.0%) | 0 (0.0%) |
| Manufacturing | 62 (100.0%) | 0 (0.0%) |
| Wholesale Trade | 0 (0.0%) | 0 (0.0%) |
| Retail Trade | 0 (0.0%) | 26 (100.0%) |
| Transportation & Warehousing | 48 (96.0%) | 2 (4.0%) |
| Utilities | 0 (0.0%) | 0 (0.0%) |
| Information | 0 (0.0%) | 0 (0.0%) |
| Finance & Insurance | 0 (0.0%) | 0 (0.0%) |
| Real Estate, Rental & Leasing | 0 (0.0%) | 0 (0.0%) |
| Professional & Scientific | 0 (0.0%) | 0 (0.0%) |
| Enterprise Management | 0 (0.0%) | 0 (0.0%) |
| Administrative & Support | 0 (0.0%) | 0 (0.0%) |
| Educational Services | 0 (0.0%) | 29 (100.0%) |
| Health Care & Social Assistance | 13 (19.1%) | 55 (80.9%) |
| Arts, Entertainment & Recreation | 0 (0.0%) | 12 (100.0%) |
| Accommodation & Food Services | 0 (0.0%) | 40 (100.0%) |
| Public Administration | 6 (26.1%) | 17 (73.9%) |
| Total | 134 (42.0%) | 185 (58.0%) |
Education in Greenville
School Enrollment in Greenville
The most common levels of schooling among the 214 students in Greenville are nursery / preschool (83 | 38.8%), middle school (59 | 27.6%), and high school (28 | 13.1%).
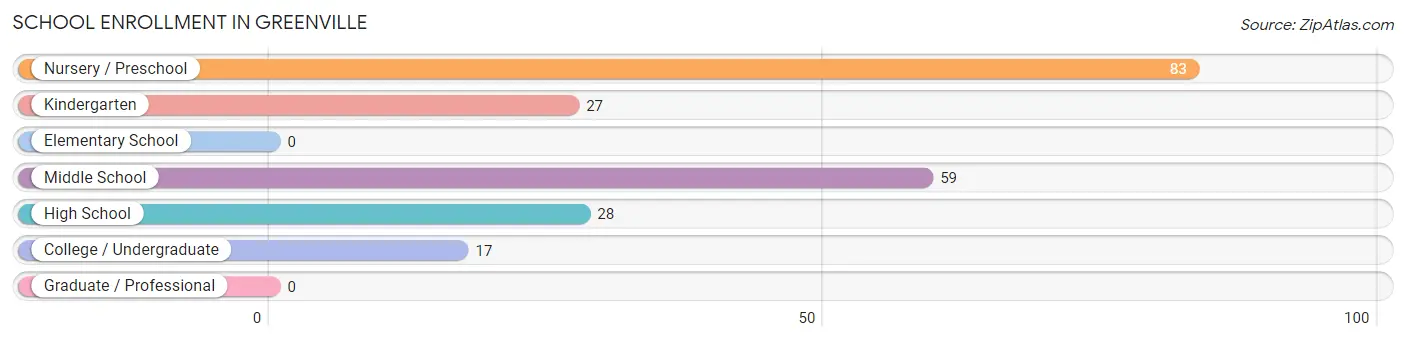
| School Level | # Students | % Students |
| Nursery / Preschool | 83 | 38.8% |
| Kindergarten | 27 | 12.6% |
| Elementary School | 0 | 0.0% |
| Middle School | 59 | 27.6% |
| High School | 28 | 13.1% |
| College / Undergraduate | 17 | 7.9% |
| Graduate / Professional | 0 | 0.0% |
| Total | 214 | 100.0% |
School Enrollment by Age by Funding Source in Greenville
Out of a total of 214 students who are enrolled in schools in Greenville, 11 (5.1%) attend a private institution, while the remaining 203 (94.9%) are enrolled in public schools. The age group of 3 to 4 year olds has the highest likelihood of being enrolled in private schools, with 11 (13.3% in the age bracket) enrolled. Conversely, the age group of 5 to 9 year old has the lowest likelihood of being enrolled in a private school, with 27 (100.0% in the age bracket) attending a public institution.
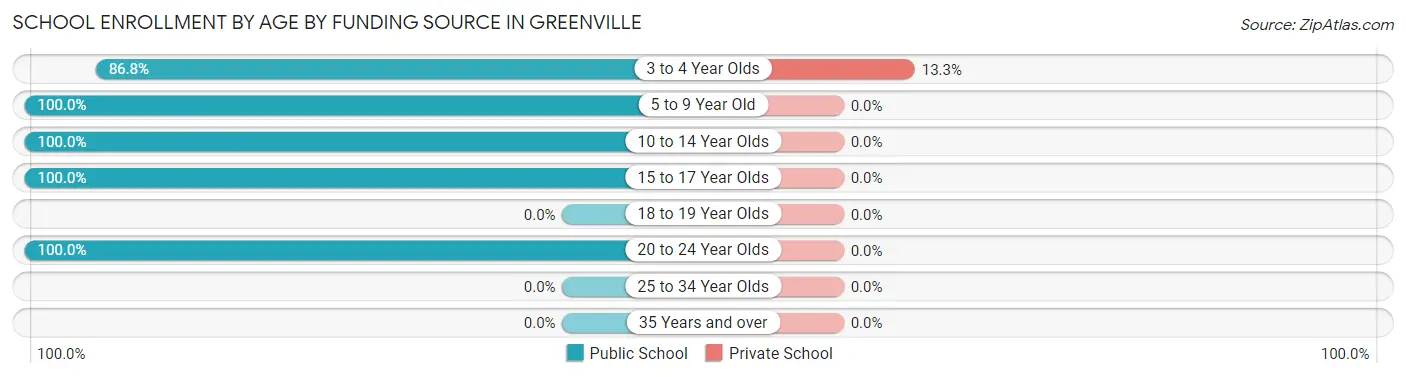
| Age Bracket | Public School | Private School |
| 3 to 4 Year Olds | 72 (86.8%) | 11 (13.3%) |
| 5 to 9 Year Old | 27 (100.0%) | 0 (0.0%) |
| 10 to 14 Year Olds | 73 (100.0%) | 0 (0.0%) |
| 15 to 17 Year Olds | 14 (100.0%) | 0 (0.0%) |
| 18 to 19 Year Olds | 0 (0.0%) | 0 (0.0%) |
| 20 to 24 Year Olds | 17 (100.0%) | 0 (0.0%) |
| 25 to 34 Year Olds | 0 (0.0%) | 0 (0.0%) |
| 35 Years and over | 0 (0.0%) | 0 (0.0%) |
| Total | 203 (94.9%) | 11 (5.1%) |
Educational Attainment by Field of Study in Greenville
Arts & humanities (40 | 40.0%), social sciences (29 | 29.0%), business (22 | 22.0%), computers & mathematics (3 | 3.0%), and science & technology (3 | 3.0%) are the most common fields of study among 100 individuals in Greenville who have obtained a bachelor's degree or higher.
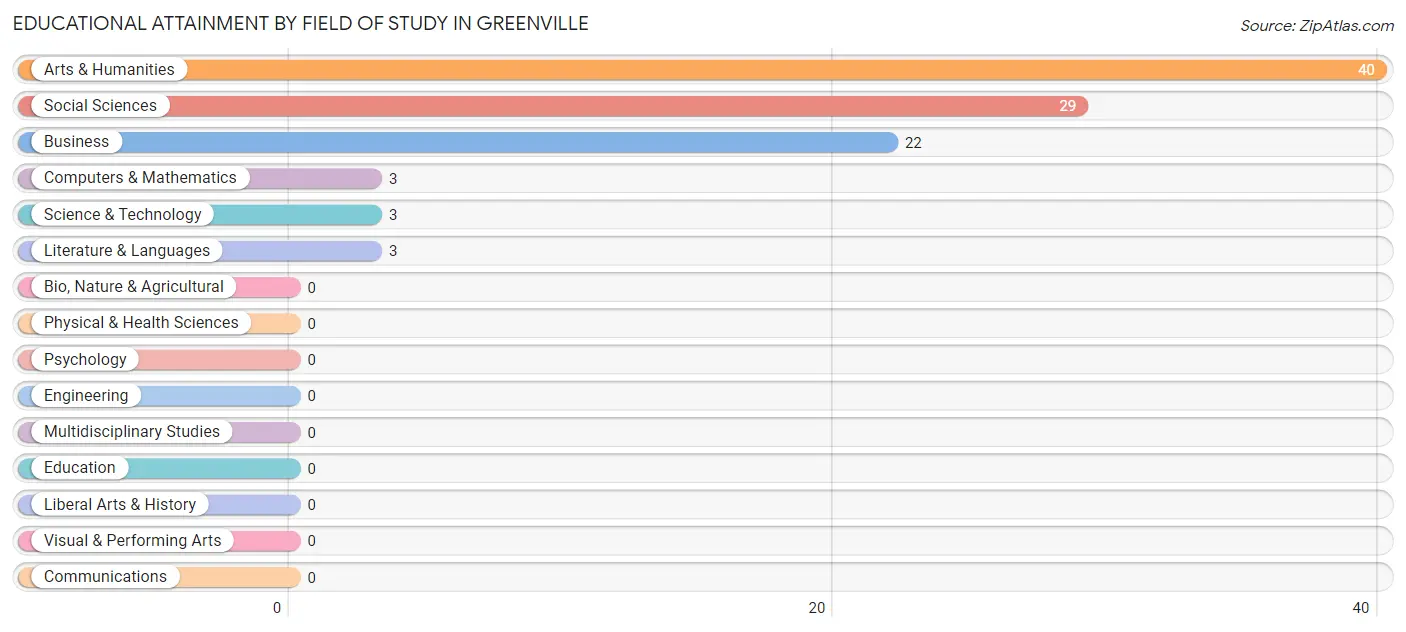
| Field of Study | # Graduates | % Graduates |
| Computers & Mathematics | 3 | 3.0% |
| Bio, Nature & Agricultural | 0 | 0.0% |
| Physical & Health Sciences | 0 | 0.0% |
| Psychology | 0 | 0.0% |
| Social Sciences | 29 | 29.0% |
| Engineering | 0 | 0.0% |
| Multidisciplinary Studies | 0 | 0.0% |
| Science & Technology | 3 | 3.0% |
| Business | 22 | 22.0% |
| Education | 0 | 0.0% |
| Literature & Languages | 3 | 3.0% |
| Liberal Arts & History | 0 | 0.0% |
| Visual & Performing Arts | 0 | 0.0% |
| Communications | 0 | 0.0% |
| Arts & Humanities | 40 | 40.0% |
| Total | 100 | 100.0% |
Transportation & Commute in Greenville
Vehicle Availability by Sex in Greenville
The most prevalent vehicle ownership categories in Greenville are males with 3 vehicles (38, accounting for 37.6%) and females with 3 vehicles (18, making up 20.5%).
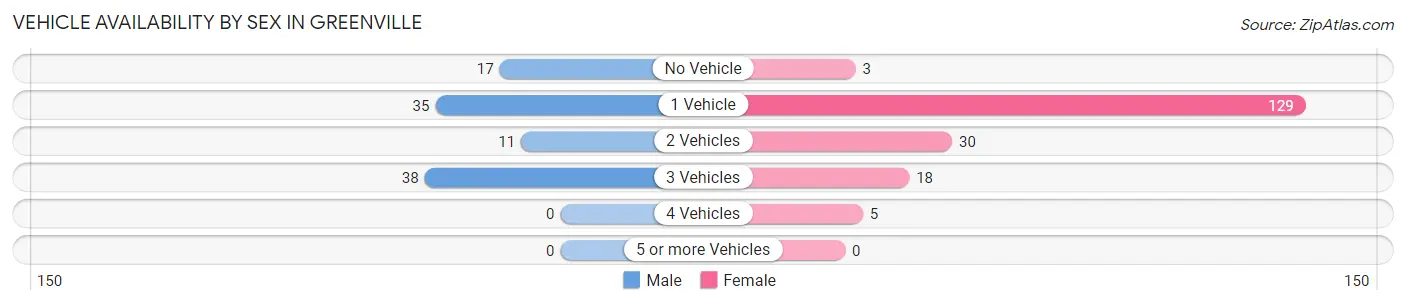
| Vehicles Available | Male | Female |
| No Vehicle | 17 (16.8%) | 3 (1.6%) |
| 1 Vehicle | 35 (34.6%) | 129 (69.7%) |
| 2 Vehicles | 11 (10.9%) | 30 (16.2%) |
| 3 Vehicles | 38 (37.6%) | 18 (9.7%) |
| 4 Vehicles | 0 (0.0%) | 5 (2.7%) |
| 5 or more Vehicles | 0 (0.0%) | 0 (0.0%) |
| Total | 101 (100.0%) | 185 (100.0%) |
Commute Time in Greenville
The most frequently occuring commute durations in Greenville are 45 to 59 minutes (69 commuters, 24.3%), 30 to 34 minutes (65 commuters, 22.9%), and 60 to 89 minutes (38 commuters, 13.4%).
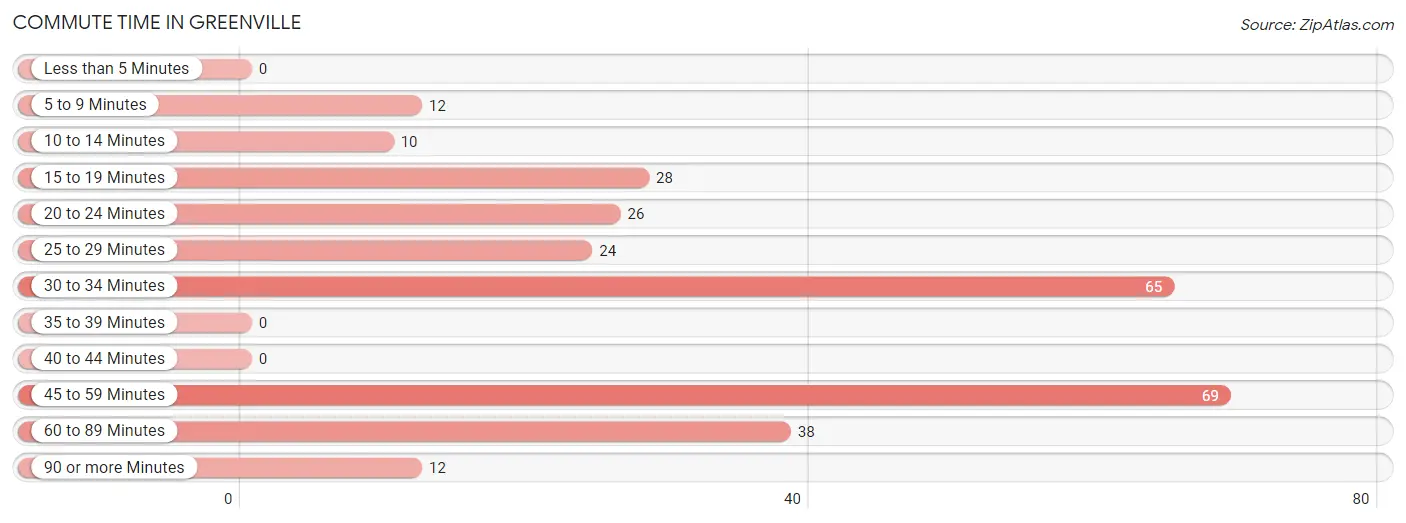
| Commute Time | # Commuters | % Commuters |
| Less than 5 Minutes | 0 | 0.0% |
| 5 to 9 Minutes | 12 | 4.2% |
| 10 to 14 Minutes | 10 | 3.5% |
| 15 to 19 Minutes | 28 | 9.9% |
| 20 to 24 Minutes | 26 | 9.1% |
| 25 to 29 Minutes | 24 | 8.5% |
| 30 to 34 Minutes | 65 | 22.9% |
| 35 to 39 Minutes | 0 | 0.0% |
| 40 to 44 Minutes | 0 | 0.0% |
| 45 to 59 Minutes | 69 | 24.3% |
| 60 to 89 Minutes | 38 | 13.4% |
| 90 or more Minutes | 12 | 4.2% |
Commute Time by Sex in Greenville
The most common commute times in Greenville are 60 to 89 minutes (38 commuters, 37.6%) for males and 45 to 59 minutes (68 commuters, 37.2%) for females.
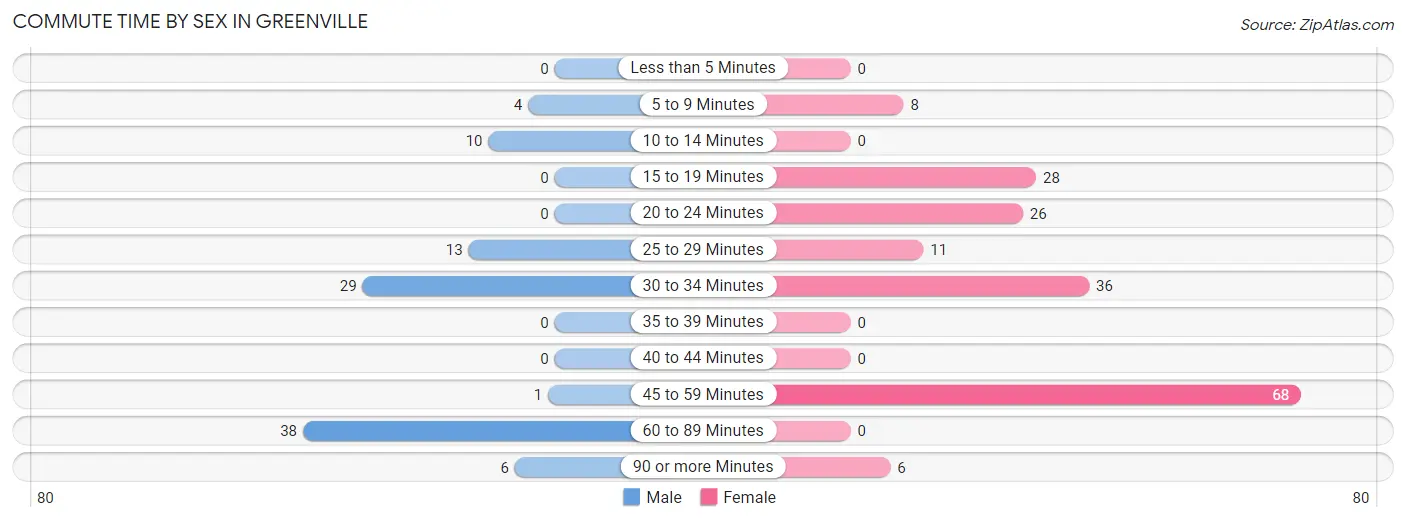
| Commute Time | Male | Female |
| Less than 5 Minutes | 0 (0.0%) | 0 (0.0%) |
| 5 to 9 Minutes | 4 (4.0%) | 8 (4.4%) |
| 10 to 14 Minutes | 10 (9.9%) | 0 (0.0%) |
| 15 to 19 Minutes | 0 (0.0%) | 28 (15.3%) |
| 20 to 24 Minutes | 0 (0.0%) | 26 (14.2%) |
| 25 to 29 Minutes | 13 (12.9%) | 11 (6.0%) |
| 30 to 34 Minutes | 29 (28.7%) | 36 (19.7%) |
| 35 to 39 Minutes | 0 (0.0%) | 0 (0.0%) |
| 40 to 44 Minutes | 0 (0.0%) | 0 (0.0%) |
| 45 to 59 Minutes | 1 (1.0%) | 68 (37.2%) |
| 60 to 89 Minutes | 38 (37.6%) | 0 (0.0%) |
| 90 or more Minutes | 6 (5.9%) | 6 (3.3%) |
Time of Departure to Work by Sex in Greenville
The most frequent times of departure to work in Greenville are 5:00 AM to 5:29 AM (43, 42.6%) for males and 7:30 AM to 7:59 AM (36, 19.7%) for females.
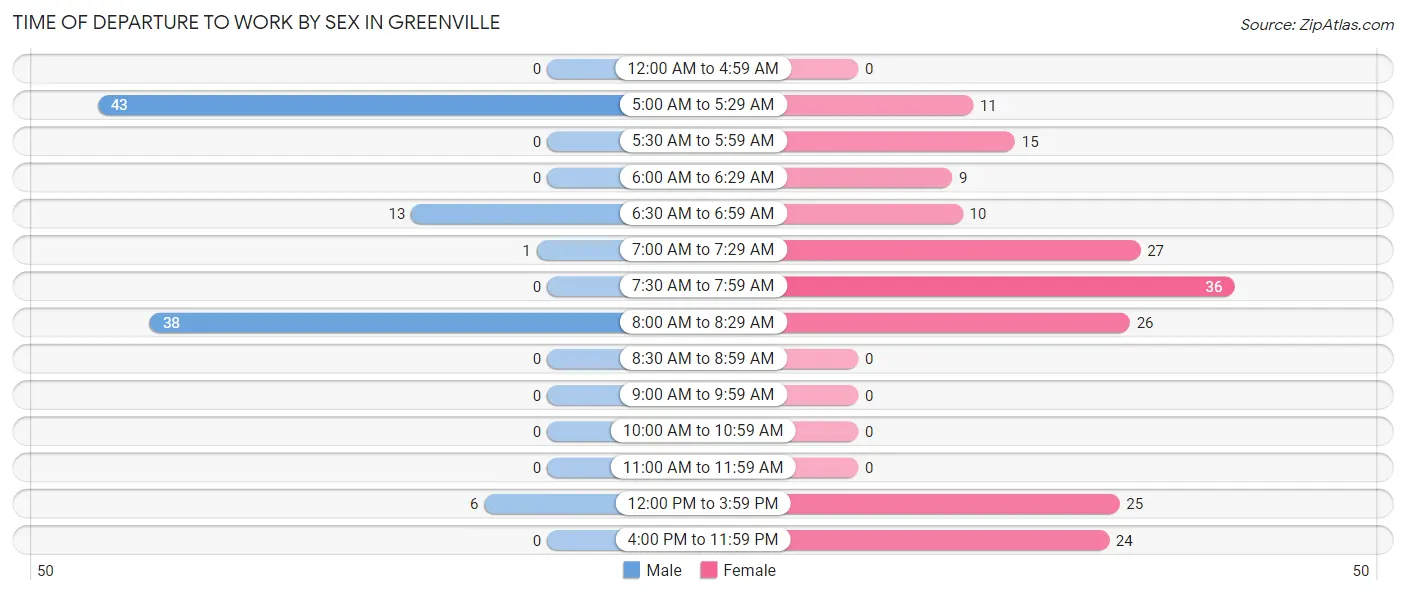
| Time of Departure | Male | Female |
| 12:00 AM to 4:59 AM | 0 (0.0%) | 0 (0.0%) |
| 5:00 AM to 5:29 AM | 43 (42.6%) | 11 (6.0%) |
| 5:30 AM to 5:59 AM | 0 (0.0%) | 15 (8.2%) |
| 6:00 AM to 6:29 AM | 0 (0.0%) | 9 (4.9%) |
| 6:30 AM to 6:59 AM | 13 (12.9%) | 10 (5.5%) |
| 7:00 AM to 7:29 AM | 1 (1.0%) | 27 (14.7%) |
| 7:30 AM to 7:59 AM | 0 (0.0%) | 36 (19.7%) |
| 8:00 AM to 8:29 AM | 38 (37.6%) | 26 (14.2%) |
| 8:30 AM to 8:59 AM | 0 (0.0%) | 0 (0.0%) |
| 9:00 AM to 9:59 AM | 0 (0.0%) | 0 (0.0%) |
| 10:00 AM to 10:59 AM | 0 (0.0%) | 0 (0.0%) |
| 11:00 AM to 11:59 AM | 0 (0.0%) | 0 (0.0%) |
| 12:00 PM to 3:59 PM | 6 (5.9%) | 25 (13.7%) |
| 4:00 PM to 11:59 PM | 0 (0.0%) | 24 (13.1%) |
| Total | 101 (100.0%) | 183 (100.0%) |
Housing Occupancy in Greenville
Occupancy by Ownership in Greenville
Of the total 427 dwellings in Greenville, owner-occupied units account for 286 (67.0%), while renter-occupied units make up 141 (33.0%).
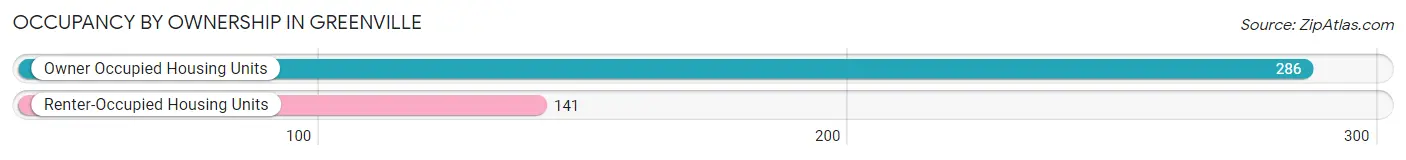
| Occupancy | # Housing Units | % Housing Units |
| Owner Occupied Housing Units | 286 | 67.0% |
| Renter-Occupied Housing Units | 141 | 33.0% |
| Total Occupied Housing Units | 427 | 100.0% |
Occupancy by Household Size in Greenville
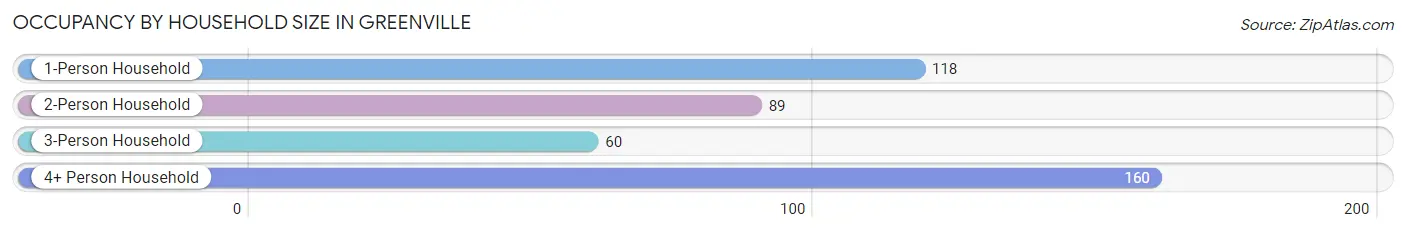
| Household Size | # Housing Units | % Housing Units |
| 1-Person Household | 118 | 27.6% |
| 2-Person Household | 89 | 20.8% |
| 3-Person Household | 60 | 14.1% |
| 4+ Person Household | 160 | 37.5% |
| Total Housing Units | 427 | 100.0% |
Occupancy by Ownership by Household Size in Greenville
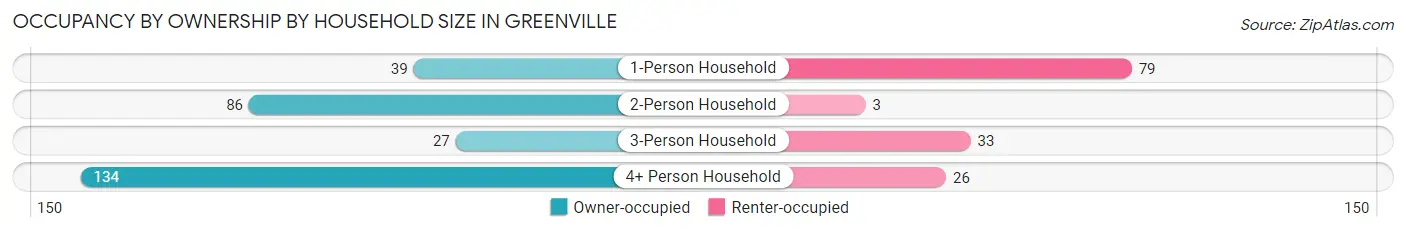
| Household Size | Owner-occupied | Renter-occupied |
| 1-Person Household | 39 (33.1%) | 79 (66.9%) |
| 2-Person Household | 86 (96.6%) | 3 (3.4%) |
| 3-Person Household | 27 (45.0%) | 33 (55.0%) |
| 4+ Person Household | 134 (83.8%) | 26 (16.3%) |
| Total Housing Units | 286 (67.0%) | 141 (33.0%) |
Occupancy by Educational Attainment in Greenville
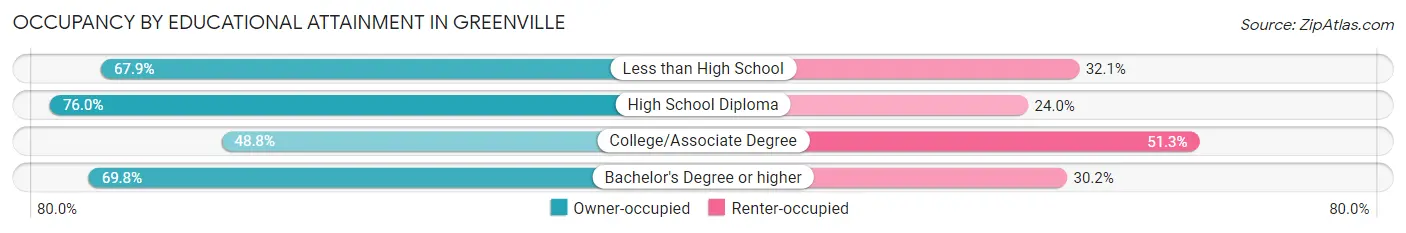
| Household Size | Owner-occupied | Renter-occupied |
| Less than High School | 112 (67.9%) | 53 (32.1%) |
| High School Diploma | 98 (76.0%) | 31 (24.0%) |
| College/Associate Degree | 39 (48.7%) | 41 (51.2%) |
| Bachelor's Degree or higher | 37 (69.8%) | 16 (30.2%) |
Occupancy by Age of Householder in Greenville
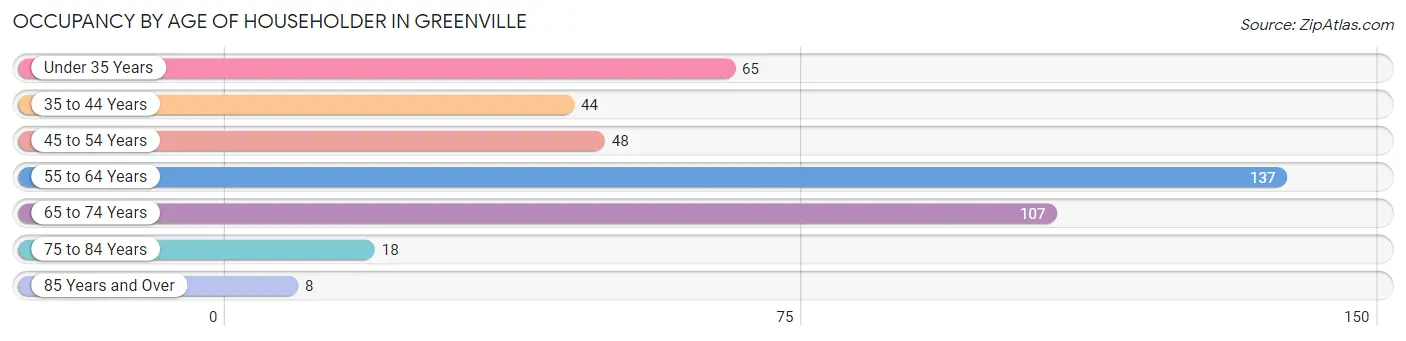
| Age Bracket | # Households | % Households |
| Under 35 Years | 65 | 15.2% |
| 35 to 44 Years | 44 | 10.3% |
| 45 to 54 Years | 48 | 11.2% |
| 55 to 64 Years | 137 | 32.1% |
| 65 to 74 Years | 107 | 25.1% |
| 75 to 84 Years | 18 | 4.2% |
| 85 Years and Over | 8 | 1.9% |
| Total | 427 | 100.0% |
Housing Finances in Greenville
Median Income by Occupancy in Greenville
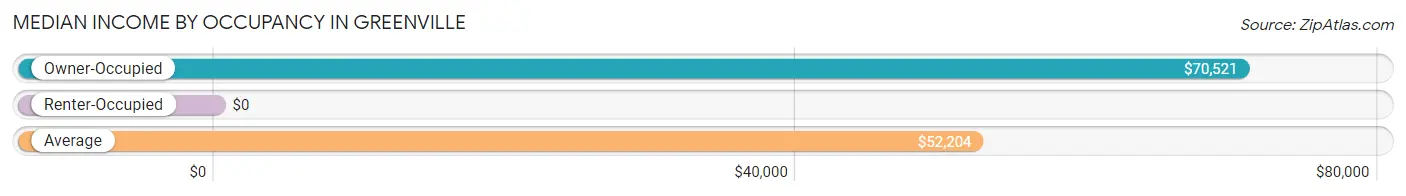
| Occupancy Type | # Households | Median Income |
| Owner-Occupied | 286 (67.0%) | $70,521 |
| Renter-Occupied | 141 (33.0%) | $0 |
| Average | 427 (100.0%) | $52,204 |
Occupancy by Householder Income Bracket in Greenville
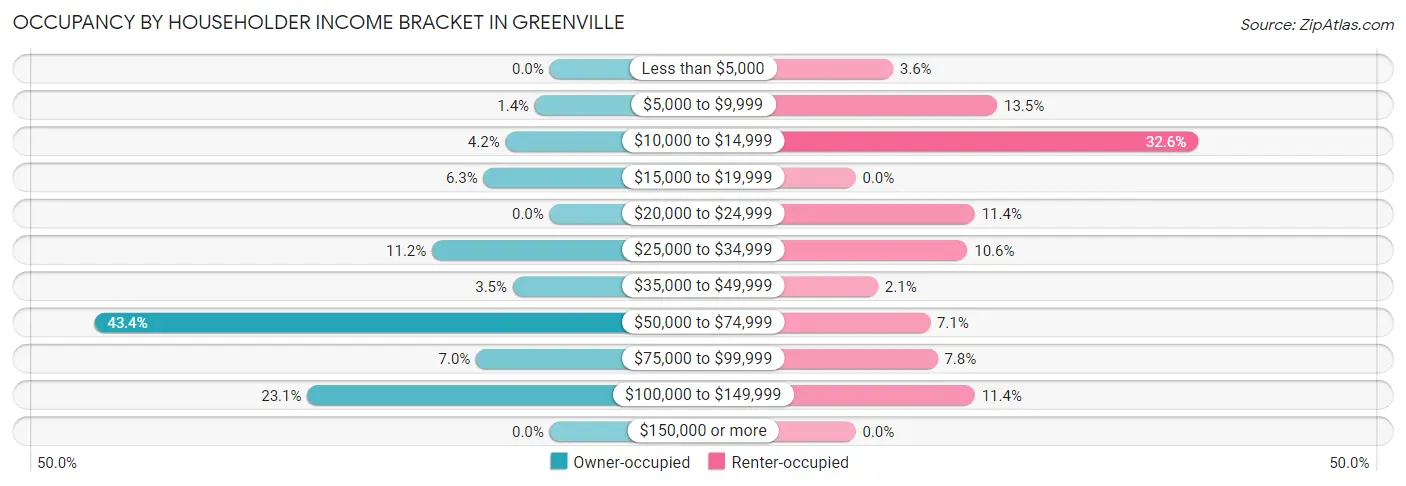
| Income Bracket | Owner-occupied | Renter-occupied |
| Less than $5,000 | 0 (0.0%) | 5 (3.5%) |
| $5,000 to $9,999 | 4 (1.4%) | 19 (13.5%) |
| $10,000 to $14,999 | 12 (4.2%) | 46 (32.6%) |
| $15,000 to $19,999 | 18 (6.3%) | 0 (0.0%) |
| $20,000 to $24,999 | 0 (0.0%) | 16 (11.4%) |
| $25,000 to $34,999 | 32 (11.2%) | 15 (10.6%) |
| $35,000 to $49,999 | 10 (3.5%) | 3 (2.1%) |
| $50,000 to $74,999 | 124 (43.4%) | 10 (7.1%) |
| $75,000 to $99,999 | 20 (7.0%) | 11 (7.8%) |
| $100,000 to $149,999 | 66 (23.1%) | 16 (11.4%) |
| $150,000 or more | 0 (0.0%) | 0 (0.0%) |
| Total | 286 (100.0%) | 141 (100.0%) |
Monthly Housing Cost Tiers in Greenville
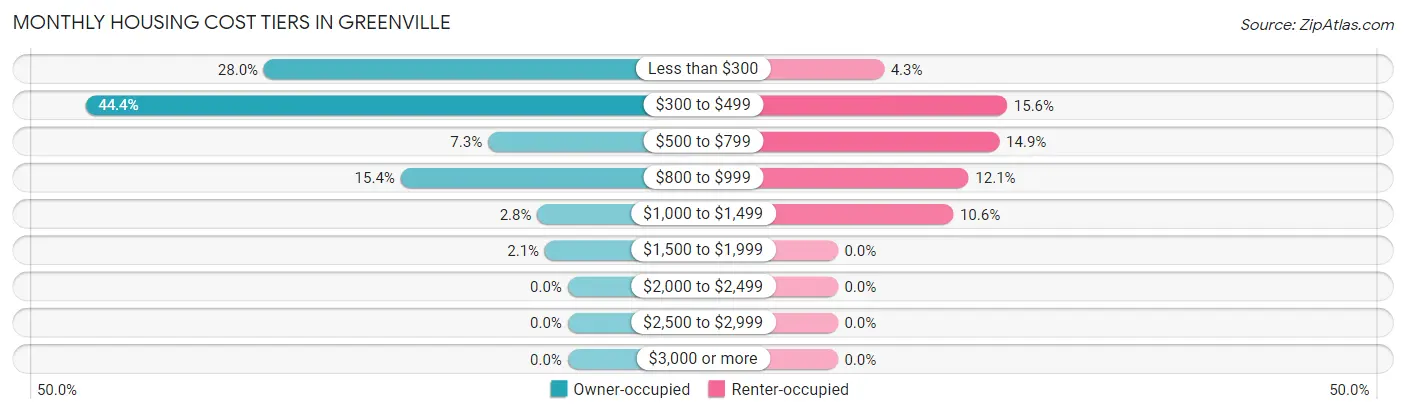
| Monthly Cost | Owner-occupied | Renter-occupied |
| Less than $300 | 80 (28.0%) | 6 (4.3%) |
| $300 to $499 | 127 (44.4%) | 22 (15.6%) |
| $500 to $799 | 21 (7.3%) | 21 (14.9%) |
| $800 to $999 | 44 (15.4%) | 17 (12.1%) |
| $1,000 to $1,499 | 8 (2.8%) | 15 (10.6%) |
| $1,500 to $1,999 | 6 (2.1%) | 0 (0.0%) |
| $2,000 to $2,499 | 0 (0.0%) | 0 (0.0%) |
| $2,500 to $2,999 | 0 (0.0%) | 0 (0.0%) |
| $3,000 or more | 0 (0.0%) | 0 (0.0%) |
| Total | 286 (100.0%) | 141 (100.0%) |
Physical Housing Characteristics in Greenville
Housing Structures in Greenville
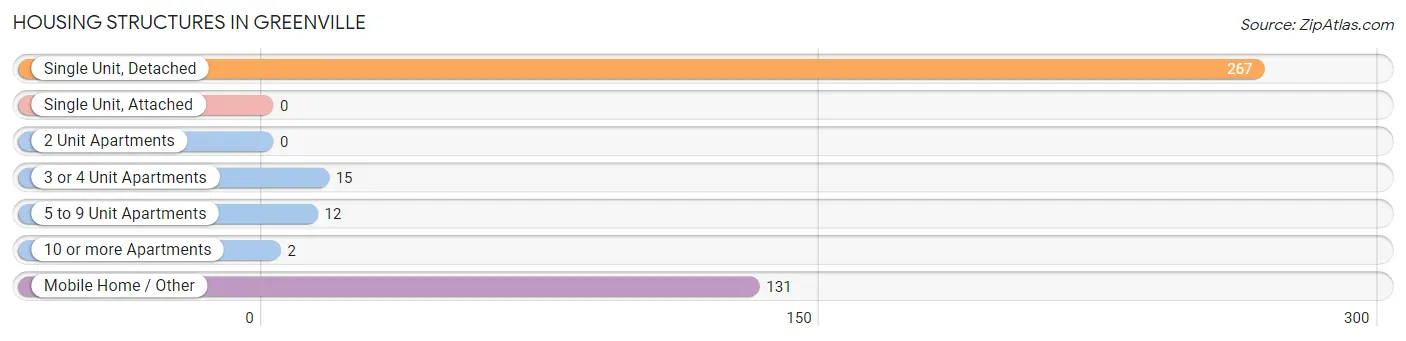
| Structure Type | # Housing Units | % Housing Units |
| Single Unit, Detached | 267 | 62.5% |
| Single Unit, Attached | 0 | 0.0% |
| 2 Unit Apartments | 0 | 0.0% |
| 3 or 4 Unit Apartments | 15 | 3.5% |
| 5 to 9 Unit Apartments | 12 | 2.8% |
| 10 or more Apartments | 2 | 0.5% |
| Mobile Home / Other | 131 | 30.7% |
| Total | 427 | 100.0% |
Housing Structures by Occupancy in Greenville
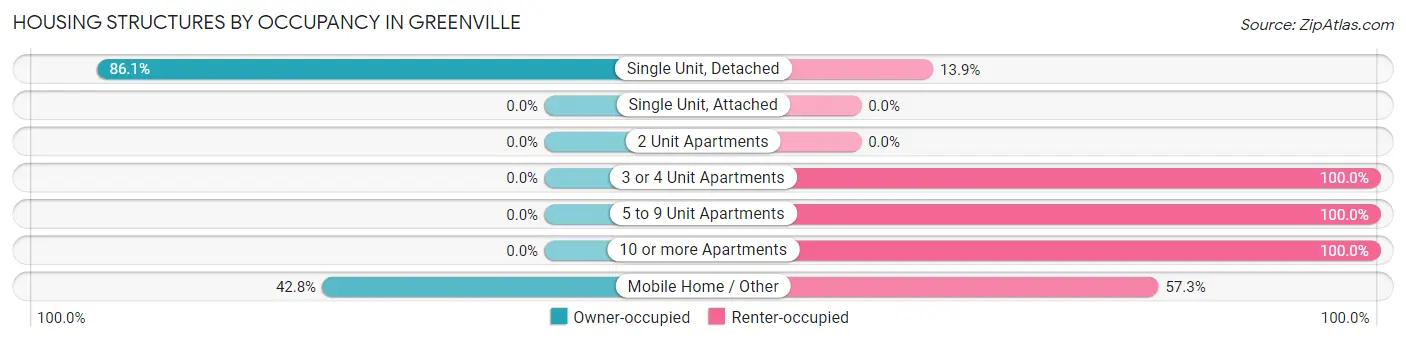
| Structure Type | Owner-occupied | Renter-occupied |
| Single Unit, Detached | 230 (86.1%) | 37 (13.9%) |
| Single Unit, Attached | 0 (0.0%) | 0 (0.0%) |
| 2 Unit Apartments | 0 (0.0%) | 0 (0.0%) |
| 3 or 4 Unit Apartments | 0 (0.0%) | 15 (100.0%) |
| 5 to 9 Unit Apartments | 0 (0.0%) | 12 (100.0%) |
| 10 or more Apartments | 0 (0.0%) | 2 (100.0%) |
| Mobile Home / Other | 56 (42.7%) | 75 (57.3%) |
| Total | 286 (67.0%) | 141 (33.0%) |
Housing Structures by Number of Rooms in Greenville
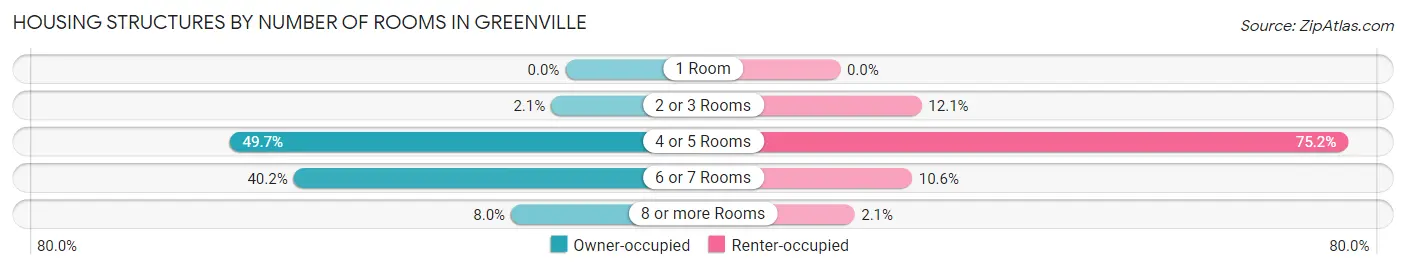
| Number of Rooms | Owner-occupied | Renter-occupied |
| 1 Room | 0 (0.0%) | 0 (0.0%) |
| 2 or 3 Rooms | 6 (2.1%) | 17 (12.1%) |
| 4 or 5 Rooms | 142 (49.6%) | 106 (75.2%) |
| 6 or 7 Rooms | 115 (40.2%) | 15 (10.6%) |
| 8 or more Rooms | 23 (8.0%) | 3 (2.1%) |
| Total | 286 (100.0%) | 141 (100.0%) |
Housing Structure by Heating Type in Greenville
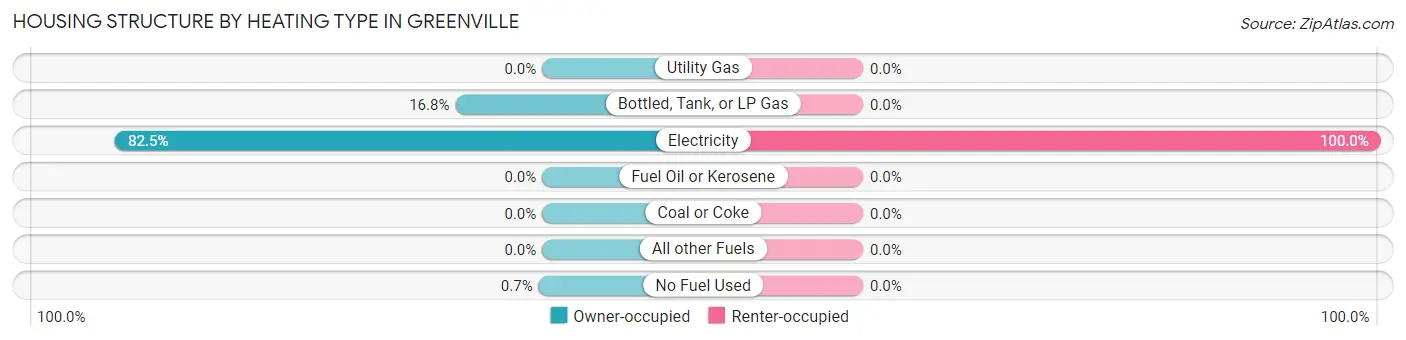
| Heating Type | Owner-occupied | Renter-occupied |
| Utility Gas | 0 (0.0%) | 0 (0.0%) |
| Bottled, Tank, or LP Gas | 48 (16.8%) | 0 (0.0%) |
| Electricity | 236 (82.5%) | 141 (100.0%) |
| Fuel Oil or Kerosene | 0 (0.0%) | 0 (0.0%) |
| Coal or Coke | 0 (0.0%) | 0 (0.0%) |
| All other Fuels | 0 (0.0%) | 0 (0.0%) |
| No Fuel Used | 2 (0.7%) | 0 (0.0%) |
| Total | 286 (100.0%) | 141 (100.0%) |
Household Vehicle Usage in Greenville
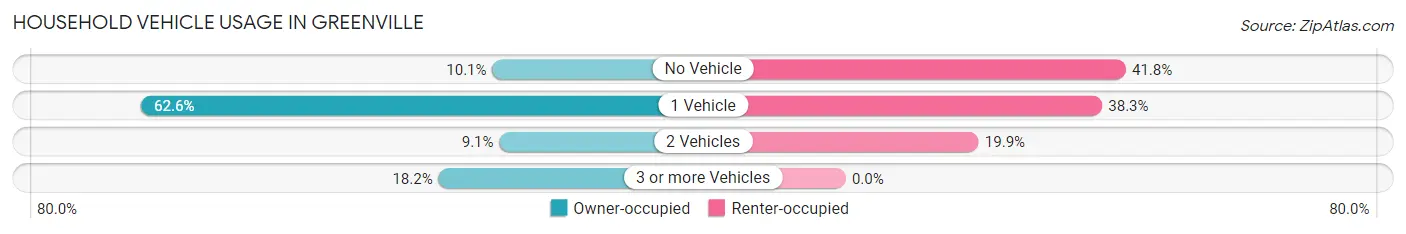
| Vehicles per Household | Owner-occupied | Renter-occupied |
| No Vehicle | 29 (10.1%) | 59 (41.8%) |
| 1 Vehicle | 179 (62.6%) | 54 (38.3%) |
| 2 Vehicles | 26 (9.1%) | 28 (19.9%) |
| 3 or more Vehicles | 52 (18.2%) | 0 (0.0%) |
| Total | 286 (100.0%) | 141 (100.0%) |
Real Estate & Mortgages in Greenville
Real Estate and Mortgage Overview in Greenville
| Characteristic | Without Mortgage | With Mortgage |
| Housing Units | 215 | 71 |
| Median Property Value | $61,100 | $73,000 |
| Median Household Income | $70,538 | $0 |
| Monthly Housing Costs | $315 | $0 |
| Real Estate Taxes | $199 | $52 |
Property Value by Mortgage Status in Greenville
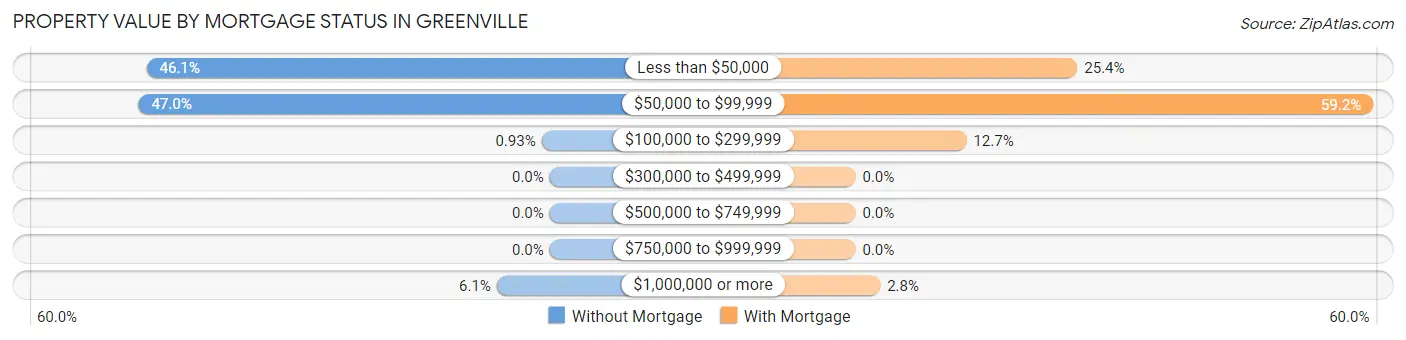
| Property Value | Without Mortgage | With Mortgage |
| Less than $50,000 | 99 (46.1%) | 18 (25.4%) |
| $50,000 to $99,999 | 101 (47.0%) | 42 (59.2%) |
| $100,000 to $299,999 | 2 (0.9%) | 9 (12.7%) |
| $300,000 to $499,999 | 0 (0.0%) | 0 (0.0%) |
| $500,000 to $749,999 | 0 (0.0%) | 0 (0.0%) |
| $750,000 to $999,999 | 0 (0.0%) | 0 (0.0%) |
| $1,000,000 or more | 13 (6.0%) | 2 (2.8%) |
| Total | 215 (100.0%) | 71 (100.0%) |
Household Income by Mortgage Status in Greenville
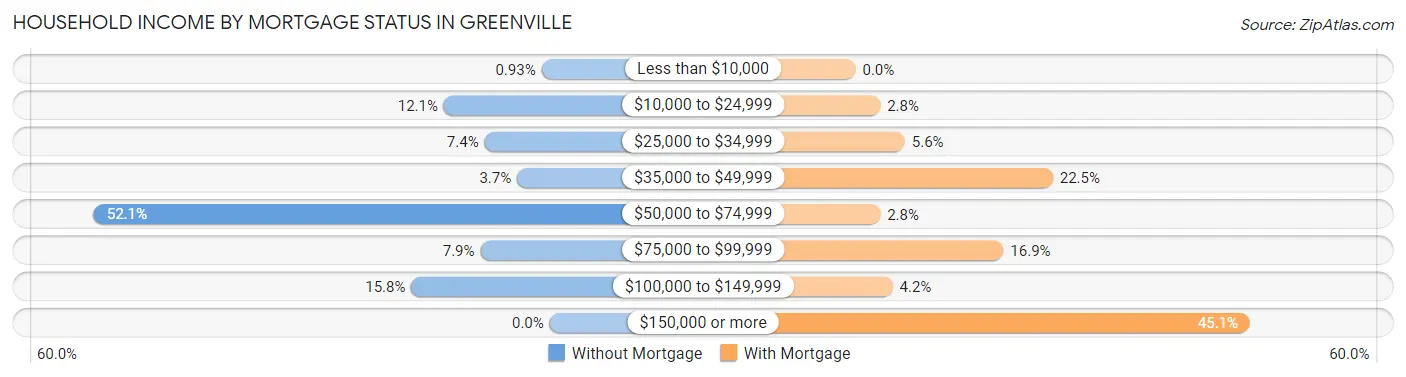
| Household Income | Without Mortgage | With Mortgage |
| Less than $10,000 | 2 (0.9%) | 0 (0.0%) |
| $10,000 to $24,999 | 26 (12.1%) | 2 (2.8%) |
| $25,000 to $34,999 | 16 (7.4%) | 4 (5.6%) |
| $35,000 to $49,999 | 8 (3.7%) | 16 (22.5%) |
| $50,000 to $74,999 | 112 (52.1%) | 2 (2.8%) |
| $75,000 to $99,999 | 17 (7.9%) | 12 (16.9%) |
| $100,000 to $149,999 | 34 (15.8%) | 3 (4.2%) |
| $150,000 or more | 0 (0.0%) | 32 (45.1%) |
| Total | 215 (100.0%) | 71 (100.0%) |
Property Value to Household Income Ratio in Greenville
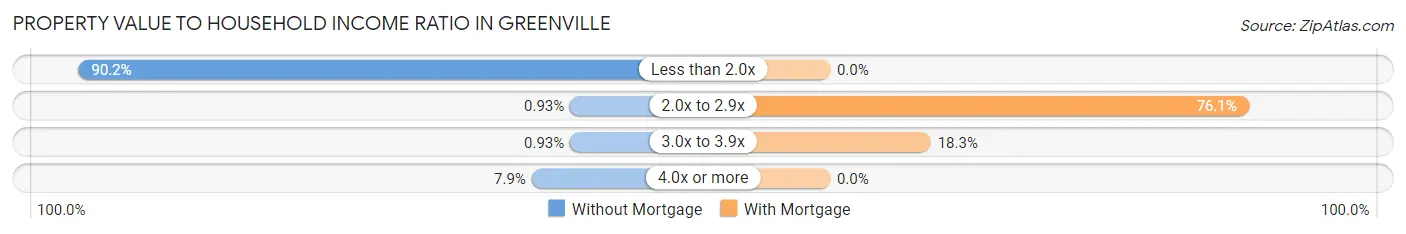
| Value-to-Income Ratio | Without Mortgage | With Mortgage |
| Less than 2.0x | 194 (90.2%) | 0 (0.0%) |
| 2.0x to 2.9x | 2 (0.9%) | 54 (76.1%) |
| 3.0x to 3.9x | 2 (0.9%) | 13 (18.3%) |
| 4.0x or more | 17 (7.9%) | 0 (0.0%) |
| Total | 215 (100.0%) | 71 (100.0%) |
Real Estate Taxes by Mortgage Status in Greenville
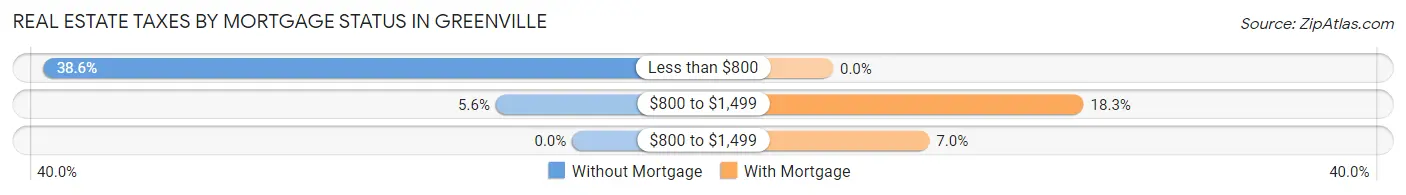
| Property Taxes | Without Mortgage | With Mortgage |
| Less than $800 | 83 (38.6%) | 0 (0.0%) |
| $800 to $1,499 | 12 (5.6%) | 13 (18.3%) |
| $800 to $1,499 | 0 (0.0%) | 5 (7.0%) |
| Total | 215 (100.0%) | 71 (100.0%) |
Health & Disability in Greenville
Health Insurance Coverage by Age in Greenville
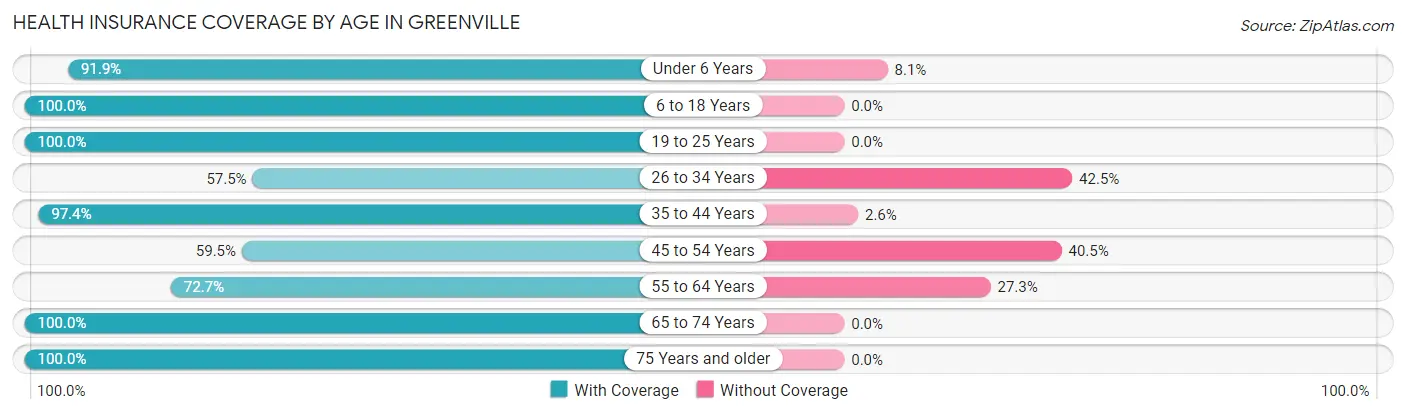
| Age Bracket | With Coverage | Without Coverage |
| Under 6 Years | 239 (91.9%) | 21 (8.1%) |
| 6 to 18 Years | 186 (100.0%) | 0 (0.0%) |
| 19 to 25 Years | 17 (100.0%) | 0 (0.0%) |
| 26 to 34 Years | 203 (57.5%) | 150 (42.5%) |
| 35 to 44 Years | 190 (97.4%) | 5 (2.6%) |
| 45 to 54 Years | 47 (59.5%) | 32 (40.5%) |
| 55 to 64 Years | 112 (72.7%) | 42 (27.3%) |
| 65 to 74 Years | 112 (100.0%) | 0 (0.0%) |
| 75 Years and older | 124 (100.0%) | 0 (0.0%) |
| Total | 1,230 (83.1%) | 250 (16.9%) |
Health Insurance Coverage by Citizenship Status in Greenville
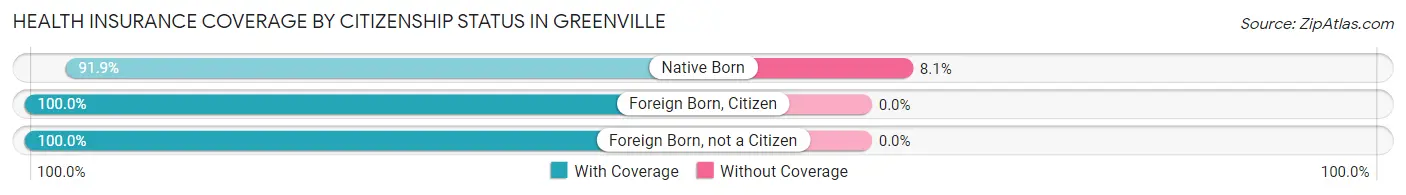
| Citizenship Status | With Coverage | Without Coverage |
| Native Born | 239 (91.9%) | 21 (8.1%) |
| Foreign Born, Citizen | 186 (100.0%) | 0 (0.0%) |
| Foreign Born, not a Citizen | 17 (100.0%) | 0 (0.0%) |
Health Insurance Coverage by Household Income in Greenville
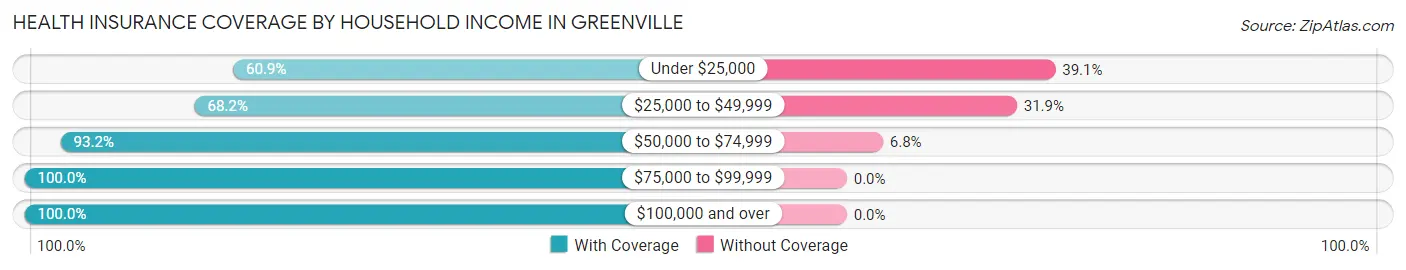
| Household Income | With Coverage | Without Coverage |
| Under $25,000 | 117 (60.9%) | 75 (39.1%) |
| $25,000 to $49,999 | 291 (68.1%) | 136 (31.9%) |
| $50,000 to $74,999 | 538 (93.2%) | 39 (6.8%) |
| $75,000 to $99,999 | 99 (100.0%) | 0 (0.0%) |
| $100,000 and over | 185 (100.0%) | 0 (0.0%) |
Public vs Private Health Insurance Coverage by Age in Greenville
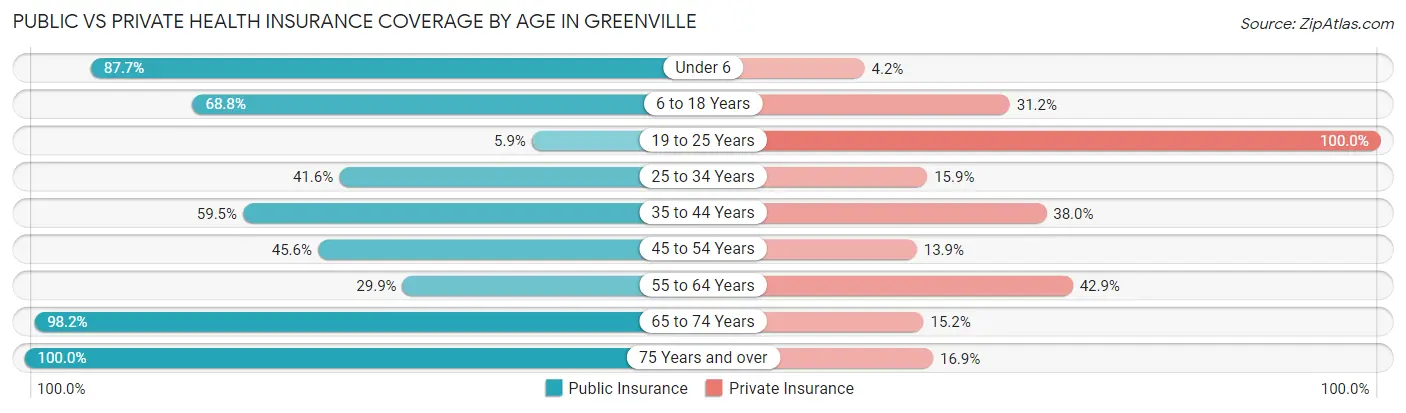
| Age Bracket | Public Insurance | Private Insurance |
| Under 6 | 228 (87.7%) | 11 (4.2%) |
| 6 to 18 Years | 128 (68.8%) | 58 (31.2%) |
| 19 to 25 Years | 1 (5.9%) | 17 (100.0%) |
| 25 to 34 Years | 147 (41.6%) | 56 (15.9%) |
| 35 to 44 Years | 116 (59.5%) | 74 (38.0%) |
| 45 to 54 Years | 36 (45.6%) | 11 (13.9%) |
| 55 to 64 Years | 46 (29.9%) | 66 (42.9%) |
| 65 to 74 Years | 110 (98.2%) | 17 (15.2%) |
| 75 Years and over | 124 (100.0%) | 21 (16.9%) |
| Total | 936 (63.2%) | 331 (22.4%) |
Disability Status by Sex by Age in Greenville
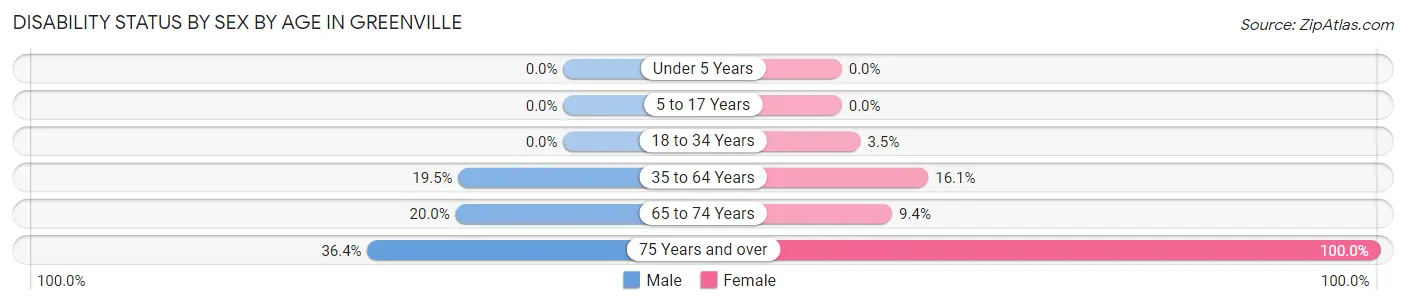
| Age Bracket | Male | Female |
| Under 5 Years | 0 (0.0%) | 0 (0.0%) |
| 5 to 17 Years | 0 (0.0%) | 0 (0.0%) |
| 18 to 34 Years | 0 (0.0%) | 8 (3.5%) |
| 35 to 64 Years | 30 (19.5%) | 44 (16.1%) |
| 65 to 74 Years | 1 (20.0%) | 10 (9.3%) |
| 75 Years and over | 12 (36.4%) | 91 (100.0%) |
Disability Class by Sex by Age in Greenville
Disability Class: Hearing Difficulty
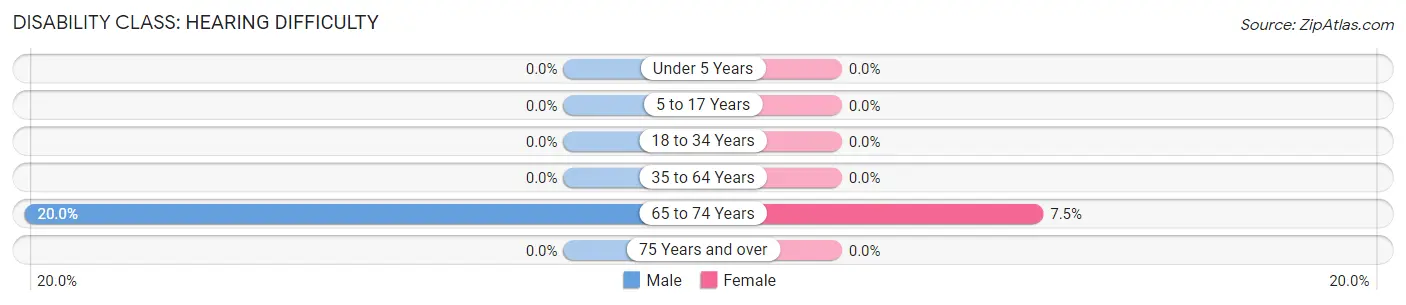
| Age Bracket | Male | Female |
| Under 5 Years | 0 (0.0%) | 0 (0.0%) |
| 5 to 17 Years | 0 (0.0%) | 0 (0.0%) |
| 18 to 34 Years | 0 (0.0%) | 0 (0.0%) |
| 35 to 64 Years | 0 (0.0%) | 0 (0.0%) |
| 65 to 74 Years | 1 (20.0%) | 8 (7.5%) |
| 75 Years and over | 0 (0.0%) | 0 (0.0%) |
Disability Class: Vision Difficulty
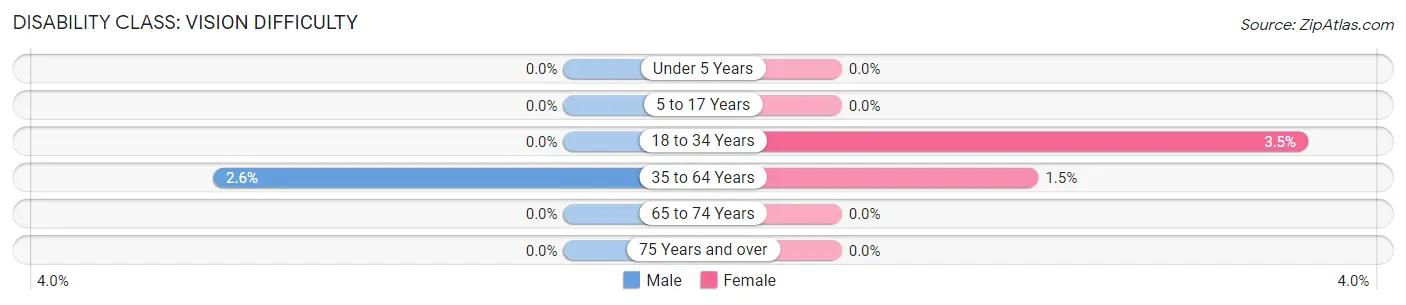
| Age Bracket | Male | Female |
| Under 5 Years | 0 (0.0%) | 0 (0.0%) |
| 5 to 17 Years | 0 (0.0%) | 0 (0.0%) |
| 18 to 34 Years | 0 (0.0%) | 8 (3.5%) |
| 35 to 64 Years | 4 (2.6%) | 4 (1.5%) |
| 65 to 74 Years | 0 (0.0%) | 0 (0.0%) |
| 75 Years and over | 0 (0.0%) | 0 (0.0%) |
Disability Class: Cognitive Difficulty
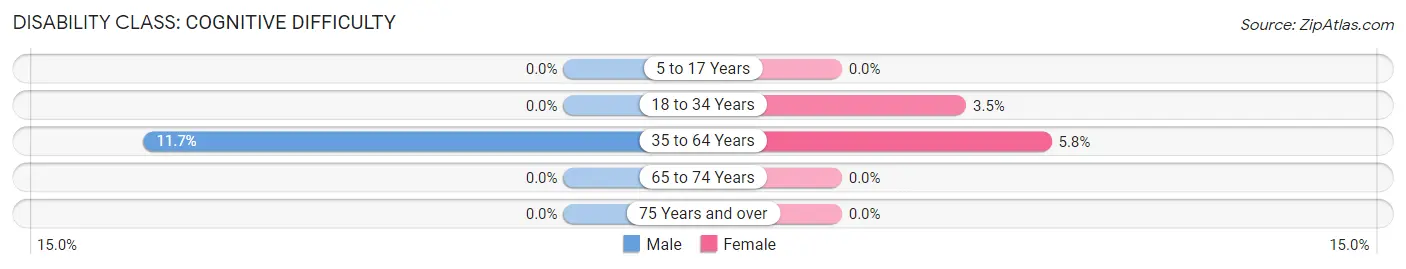
| Age Bracket | Male | Female |
| 5 to 17 Years | 0 (0.0%) | 0 (0.0%) |
| 18 to 34 Years | 0 (0.0%) | 8 (3.5%) |
| 35 to 64 Years | 18 (11.7%) | 16 (5.8%) |
| 65 to 74 Years | 0 (0.0%) | 0 (0.0%) |
| 75 Years and over | 0 (0.0%) | 0 (0.0%) |
Disability Class: Ambulatory Difficulty
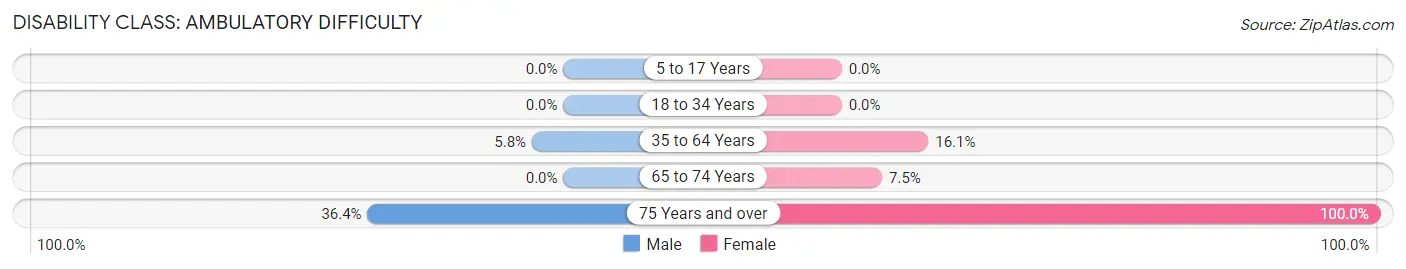
| Age Bracket | Male | Female |
| 5 to 17 Years | 0 (0.0%) | 0 (0.0%) |
| 18 to 34 Years | 0 (0.0%) | 0 (0.0%) |
| 35 to 64 Years | 9 (5.8%) | 44 (16.1%) |
| 65 to 74 Years | 0 (0.0%) | 8 (7.5%) |
| 75 Years and over | 12 (36.4%) | 91 (100.0%) |
Disability Class: Self-Care Difficulty
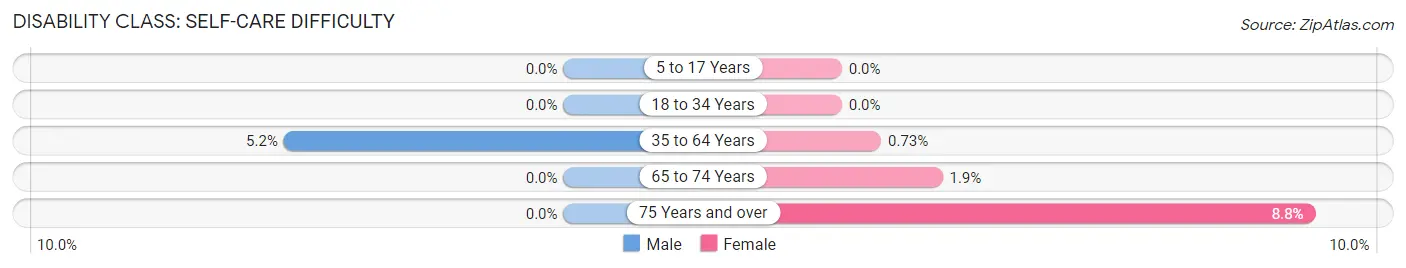
| Age Bracket | Male | Female |
| 5 to 17 Years | 0 (0.0%) | 0 (0.0%) |
| 18 to 34 Years | 0 (0.0%) | 0 (0.0%) |
| 35 to 64 Years | 8 (5.2%) | 2 (0.7%) |
| 65 to 74 Years | 0 (0.0%) | 2 (1.9%) |
| 75 Years and over | 0 (0.0%) | 8 (8.8%) |
Technology Access in Greenville
Computing Device Access in Greenville
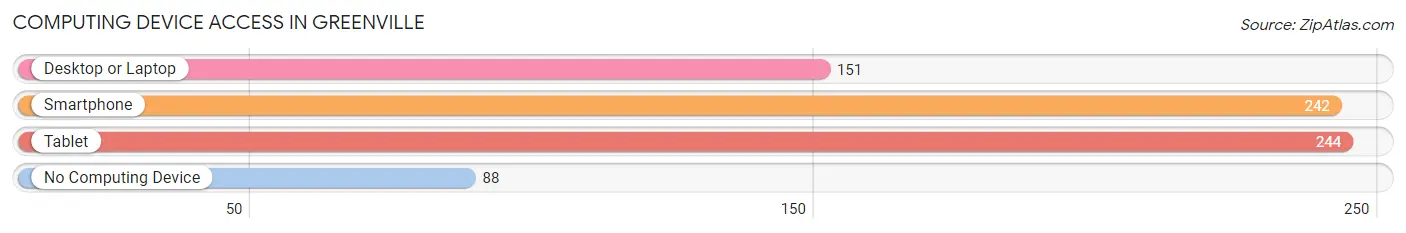
| Device Type | # Households | % Households |
| Desktop or Laptop | 151 | 35.4% |
| Smartphone | 242 | 56.7% |
| Tablet | 244 | 57.1% |
| No Computing Device | 88 | 20.6% |
| Total | 427 | 100.0% |
Internet Access in Greenville
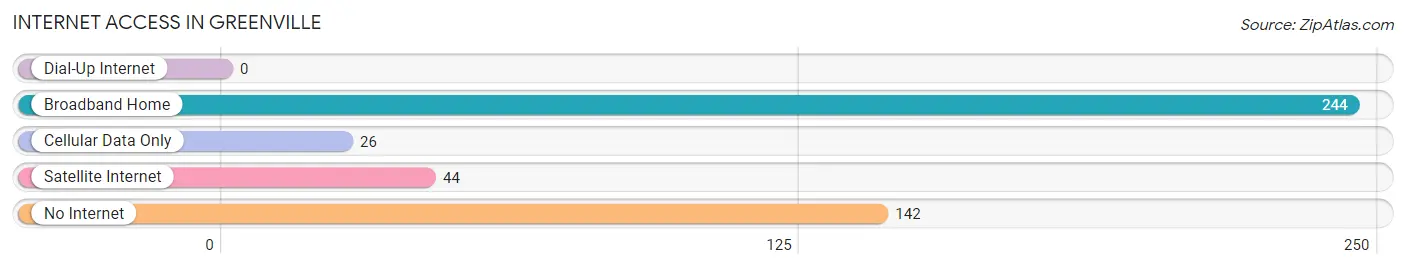
| Internet Type | # Households | % Households |
| Dial-Up Internet | 0 | 0.0% |
| Broadband Home | 244 | 57.1% |
| Cellular Data Only | 26 | 6.1% |
| Satellite Internet | 44 | 10.3% |
| No Internet | 142 | 33.3% |
| Total | 427 | 100.0% |
Greenville Summary
Geography
Greenville is a small town located in Madison County, Florida. It is situated in the northern part of the state, approximately 30 miles east of Tallahassee. The town is located on the banks of the Withlacoochee River, which is a major tributary of the Suwannee River. The town is surrounded by rolling hills and is home to several small lakes, including Lake Talquin and Lake Miccosukee. The area is known for its lush vegetation and abundant wildlife.
The town of Greenville is located in the Florida Panhandle, which is a region of the state that is characterized by its sandy beaches, pine forests, and wetlands. The area is known for its mild climate, with temperatures rarely dropping below freezing. The town is also located near several state parks, including the Apalachicola National Forest and the Ochlockonee River State Park.
History
Greenville was first settled in the early 1800s by settlers from Georgia and South Carolina. The town was originally known as “Greenville Station” and was a stop on the stagecoach line that ran between Tallahassee and St. Augustine. The town was officially incorporated in 1856 and was named after the nearby Greenville Plantation.
In the late 1800s, the town became a major center for the timber industry. The town was home to several sawmills and lumber companies, which provided employment for many of the town’s residents. The town also became a major shipping point for cotton, which was grown in the surrounding area.
In the early 1900s, the town began to experience a decline in its timber industry. This led to a period of economic stagnation, which lasted until the 1950s. During this time, the town began to experience a resurgence in its economy, thanks to the development of the nearby Lake Talquin. The lake provided a new source of recreation and tourism, which helped to revitalize the town’s economy.
Economy
Today, Greenville is a small town with a population of just over 1,000 people. The town’s economy is largely based on agriculture and tourism. The town is home to several farms, which produce a variety of crops, including cotton, corn, and soybeans. The town is also home to several tourist attractions, including the Greenville Museum and the Greenville Country Club.
The town is also home to several small businesses, including restaurants, retail stores, and service providers. The town is also home to several manufacturing companies, which produce a variety of products, including furniture, clothing, and electronics.
Demographics
As of the 2010 census, the population of Greenville was 1,072. The town is predominantly white, with approximately 87% of the population identifying as such. The town is also home to a small African American population, which makes up approximately 8% of the population. The town is also home to a small Hispanic population, which makes up approximately 4% of the population.
The median household income in Greenville is $37,000, which is slightly lower than the state average. The town also has a higher poverty rate than the state average, with approximately 17% of the population living below the poverty line. The town also has a higher unemployment rate than the state average, with approximately 8% of the population unemployed.
Common Questions
What is Per Capita Income in Greenville?
Per Capita income in Greenville is $15,267.
What is the Median Family Income in Greenville?
Median Family Income in Greenville is $71,267.
What is the Median Household income in Greenville?
Median Household Income in Greenville is $52,204.
What is Income or Wage Gap in Greenville?
Income or Wage Gap in Greenville is 36.3%.
Women in Greenville earn 63.7 cents for every dollar earned by a man.
What is Family Income Deficit in Greenville?
Family Income Deficit in Greenville is $8,645.
Families that are below poverty line in Greenville earn $8,645 less on average than the poverty threshold level.
What is Inequality or Gini Index in Greenville?
Inequality or Gini Index in Greenville is 0.37.
What is the Total Population of Greenville?
Total Population of Greenville is 1,546.
What is the Total Male Population of Greenville?
Total Male Population of Greenville is 637.
What is the Total Female Population of Greenville?
Total Female Population of Greenville is 909.
What is the Ratio of Males per 100 Females in Greenville?
There are 70.08 Males per 100 Females in Greenville.
What is the Ratio of Females per 100 Males in Greenville?
There are 142.70 Females per 100 Males in Greenville.
What is the Median Population Age in Greenville?
Median Population Age in Greenville is 32.9 Years.
What is the Average Family Size in Greenville
Average Family Size in Greenville is 4.7 People.
What is the Average Household Size in Greenville
Average Household Size in Greenville is 3.5 People.
How Large is the Labor Force in Greenville?
There are 319 People in the Labor Forcein in Greenville.
What is the Percentage of People in the Labor Force in Greenville?
29.0% of People are in the Labor Force in Greenville.