Floral City, FL Map & Demographics
Floral City Map
Floral City Overview
$35,060
PER CAPITA INCOME
$79,250
AVG FAMILY INCOME
$55,616
AVG HOUSEHOLD INCOME
12.9%
WAGE / INCOME GAP [ % ]
87.1¢/ $1
WAGE / INCOME GAP [ $ ]
$11,571
FAMILY INCOME DEFICIT
0.45
INEQUALITY / GINI INDEX
4,830
TOTAL POPULATION
2,389
MALE POPULATION
2,441
FEMALE POPULATION
97.87
MALES / 100 FEMALES
102.18
FEMALES / 100 MALES
61.9
MEDIAN AGE
2.4
AVG FAMILY SIZE
2.0
AVG HOUSEHOLD SIZE
1,681
LABOR FORCE [ PEOPLE ]
36.7%
PERCENT IN LABOR FORCE
4.5%
UNEMPLOYMENT RATE
Floral City Zip Codes
Floral City Area Codes
Income in Floral City
Income Overview in Floral City
Per Capita Income in Floral City is $35,060, while median incomes of families and households are $79,250 and $55,616 respectively.
| Characteristic | Number | Measure |
| Per Capita Income | 4,830 | $35,060 |
| Median Family Income | 1,542 | $79,250 |
| Mean Family Income | 1,542 | $85,238 |
| Median Household Income | 2,388 | $55,616 |
| Mean Household Income | 2,388 | $70,732 |
| Income Deficit | 1,542 | $11,571 |
| Wage / Income Gap (%) | 4,830 | 12.86% |
| Wage / Income Gap ($) | 4,830 | 87.14¢ per $1 |
| Gini / Inequality Index | 4,830 | 0.45 |
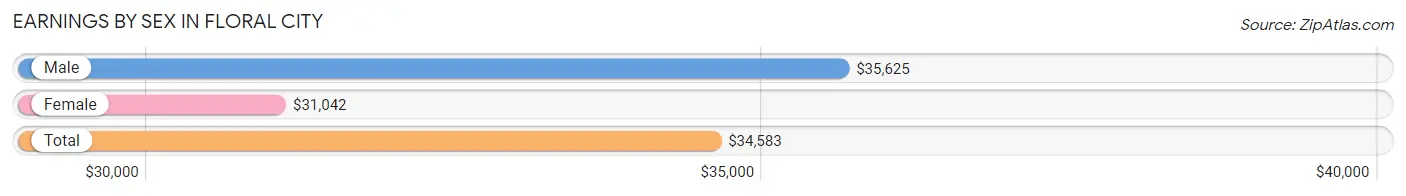
Earnings by Sex in Floral City
Average Earnings in Floral City are $34,583, $35,625 for men and $31,042 for women, a difference of 12.9%.
| Sex | Number | Average Earnings |
| Male | 984 (55.2%) | $35,625 |
| Female | 800 (44.8%) | $31,042 |
| Total | 1,784 (100.0%) | $34,583 |
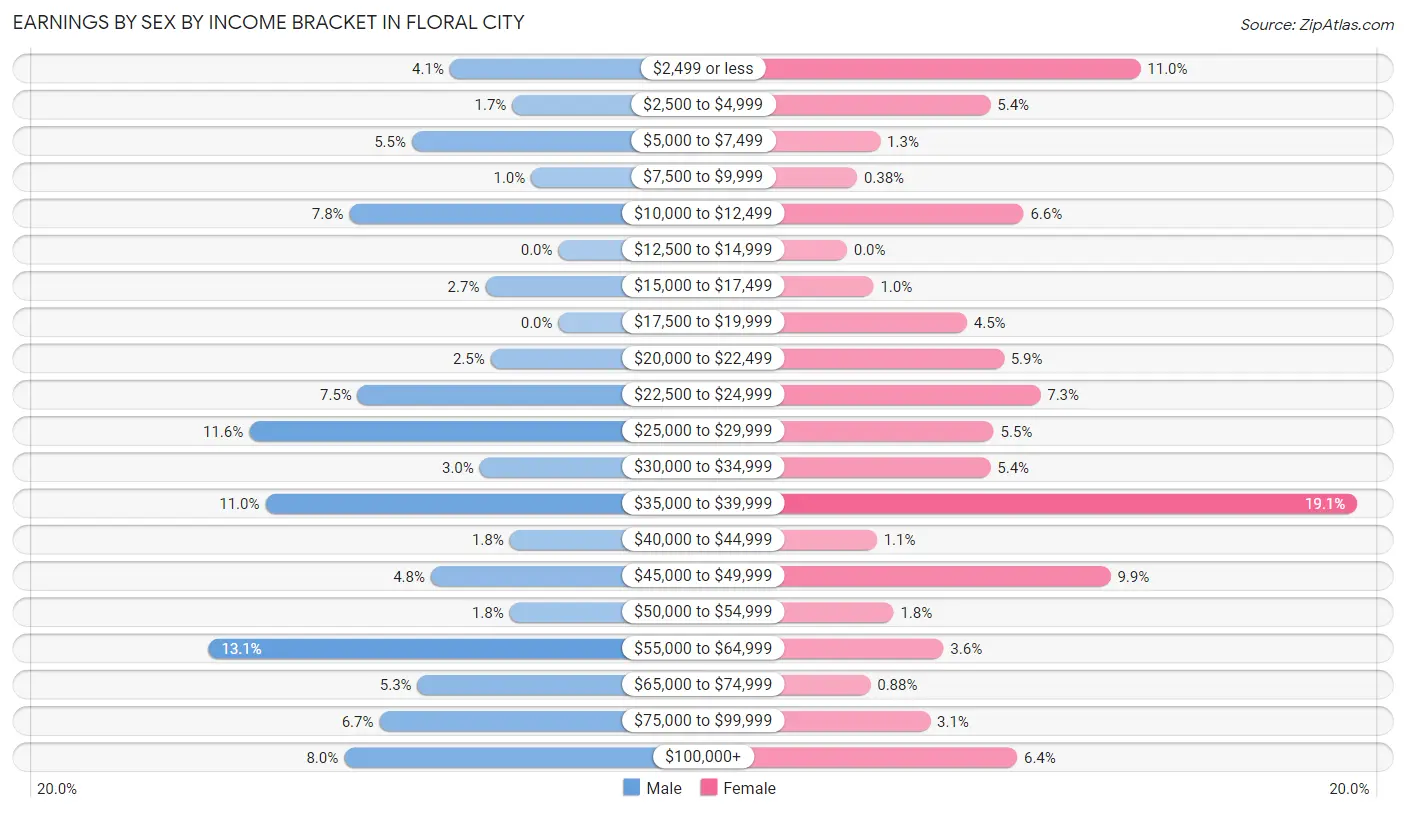
Earnings by Sex by Income Bracket in Floral City
The most common earnings brackets in Floral City are $55,000 to $64,999 for men (129 | 13.1%) and $35,000 to $39,999 for women (153 | 19.1%).
| Income | Male | Female |
| $2,499 or less | 40 (4.1%) | 88 (11.0%) |
| $2,500 to $4,999 | 17 (1.7%) | 43 (5.4%) |
| $5,000 to $7,499 | 54 (5.5%) | 10 (1.3%) |
| $7,500 to $9,999 | 10 (1.0%) | 3 (0.4%) |
| $10,000 to $12,499 | 77 (7.8%) | 53 (6.6%) |
| $12,500 to $14,999 | 0 (0.0%) | 0 (0.0%) |
| $15,000 to $17,499 | 27 (2.7%) | 8 (1.0%) |
| $17,500 to $19,999 | 0 (0.0%) | 36 (4.5%) |
| $20,000 to $22,499 | 25 (2.5%) | 47 (5.9%) |
| $22,500 to $24,999 | 74 (7.5%) | 58 (7.2%) |
| $25,000 to $29,999 | 114 (11.6%) | 44 (5.5%) |
| $30,000 to $34,999 | 29 (2.9%) | 43 (5.4%) |
| $35,000 to $39,999 | 108 (11.0%) | 153 (19.1%) |
| $40,000 to $44,999 | 18 (1.8%) | 9 (1.1%) |
| $45,000 to $49,999 | 47 (4.8%) | 79 (9.9%) |
| $50,000 to $54,999 | 18 (1.8%) | 14 (1.8%) |
| $55,000 to $64,999 | 129 (13.1%) | 29 (3.6%) |
| $65,000 to $74,999 | 52 (5.3%) | 7 (0.9%) |
| $75,000 to $99,999 | 66 (6.7%) | 25 (3.1%) |
| $100,000+ | 79 (8.0%) | 51 (6.4%) |
| Total | 984 (100.0%) | 800 (100.0%) |
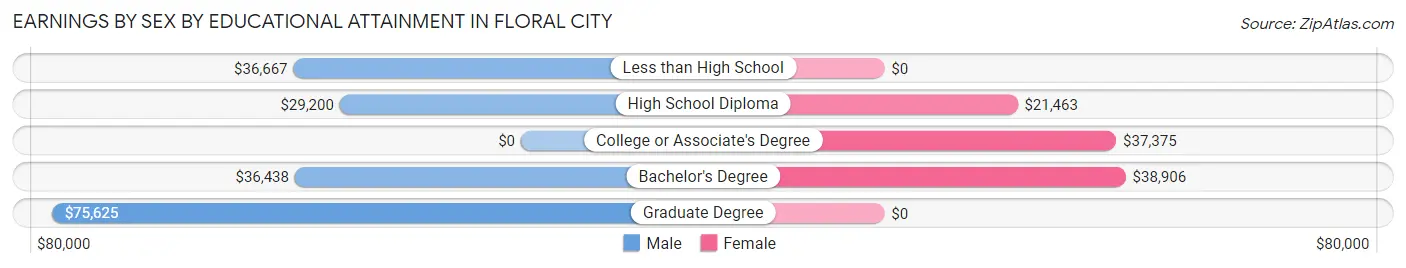
Earnings by Sex by Educational Attainment in Floral City
Average earnings in Floral City are $35,531 for men and $31,250 for women, a difference of 12.0%. Men with an educational attainment of graduate degree enjoy the highest average annual earnings of $75,625, while those with high school diploma education earn the least with $29,200. Women with an educational attainment of bachelor's degree earn the most with the average annual earnings of $38,906, while those with high school diploma education have the smallest earnings of $21,463.
| Educational Attainment | Male Income | Female Income |
| Less than High School | $36,667 | $0 |
| High School Diploma | $29,200 | $21,463 |
| College or Associate's Degree | - | - |
| Bachelor's Degree | $36,438 | $38,906 |
| Graduate Degree | $75,625 | $0 |
| Total | $35,531 | $31,250 |
Family Income in Floral City
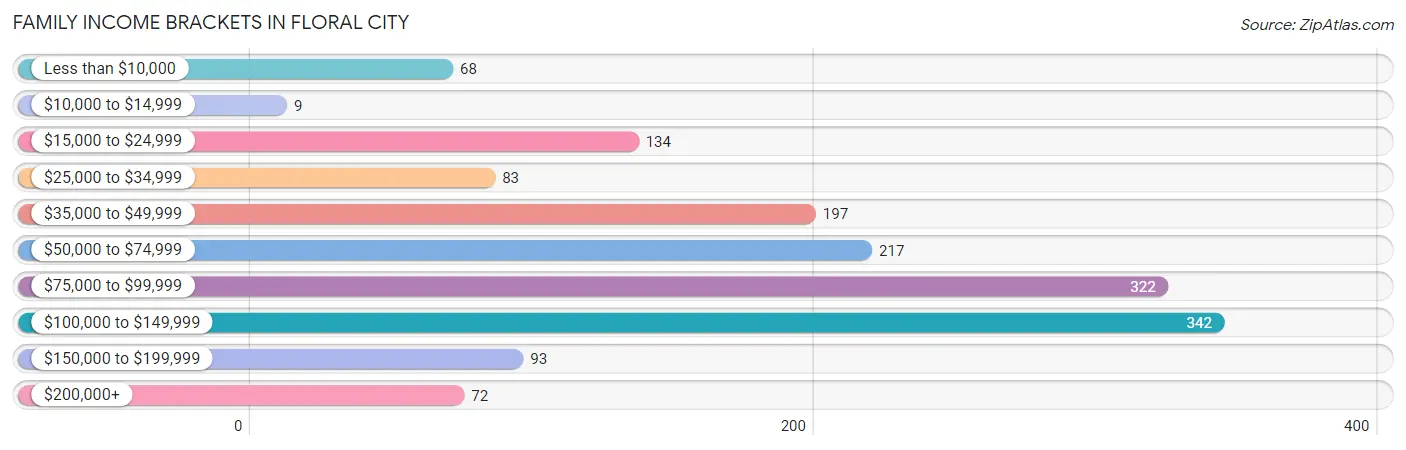
Family Income Brackets in Floral City
According to the Floral City family income data, there are 342 families falling into the $100,000 to $149,999 income range, which is the most common income bracket and makes up 22.2% of all families. Conversely, the $10,000 to $14,999 income bracket is the least frequent group with only 9 families (0.6%) belonging to this category.
| Income Bracket | # Families | % Families |
| Less than $10,000 | 68 | 4.4% |
| $10,000 to $14,999 | 9 | 0.6% |
| $15,000 to $24,999 | 134 | 8.7% |
| $25,000 to $34,999 | 83 | 5.4% |
| $35,000 to $49,999 | 197 | 12.8% |
| $50,000 to $74,999 | 217 | 14.1% |
| $75,000 to $99,999 | 322 | 20.9% |
| $100,000 to $149,999 | 342 | 22.2% |
| $150,000 to $199,999 | 93 | 6.0% |
| $200,000+ | 72 | 4.7% |
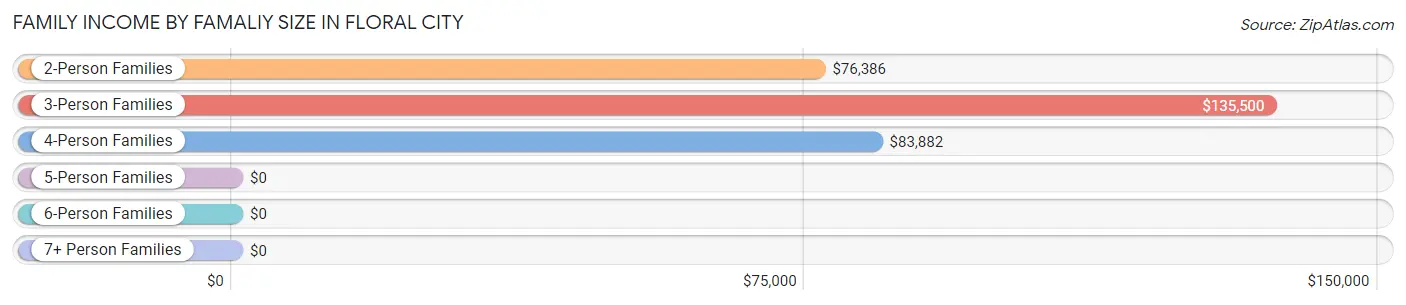
Family Income by Famaliy Size in Floral City
3-person families (106 | 6.9%) account for the highest median family income in Floral City with $135,500 per family, while 3-person families (106 | 6.9%) have the highest median income of $45,167 per family member.
| Income Bracket | # Families | Median Income |
| 2-Person Families | 1,287 (83.5%) | $76,386 |
| 3-Person Families | 106 (6.9%) | $135,500 |
| 4-Person Families | 115 (7.5%) | $83,882 |
| 5-Person Families | 8 (0.5%) | $0 |
| 6-Person Families | 0 (0.0%) | $0 |
| 7+ Person Families | 26 (1.7%) | $0 |
| Total | 1,542 (100.0%) | $79,250 |
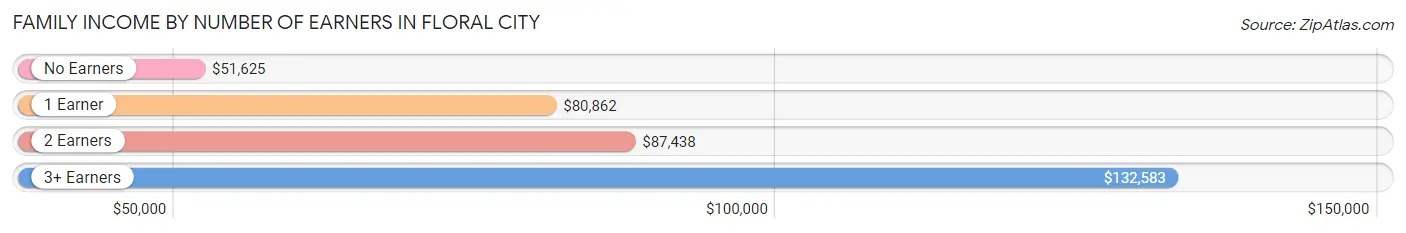
Family Income by Number of Earners in Floral City
The median family income in Floral City is $79,250, with families comprising 3+ earners (53) having the highest median family income of $132,583, while families with no earners (713) have the lowest median family income of $51,625, accounting for 3.4% and 46.2% of families, respectively.
| Number of Earners | # Families | Median Income |
| No Earners | 713 (46.2%) | $51,625 |
| 1 Earner | 356 (23.1%) | $80,862 |
| 2 Earners | 420 (27.2%) | $87,438 |
| 3+ Earners | 53 (3.4%) | $132,583 |
| Total | 1,542 (100.0%) | $79,250 |
Household Income in Floral City
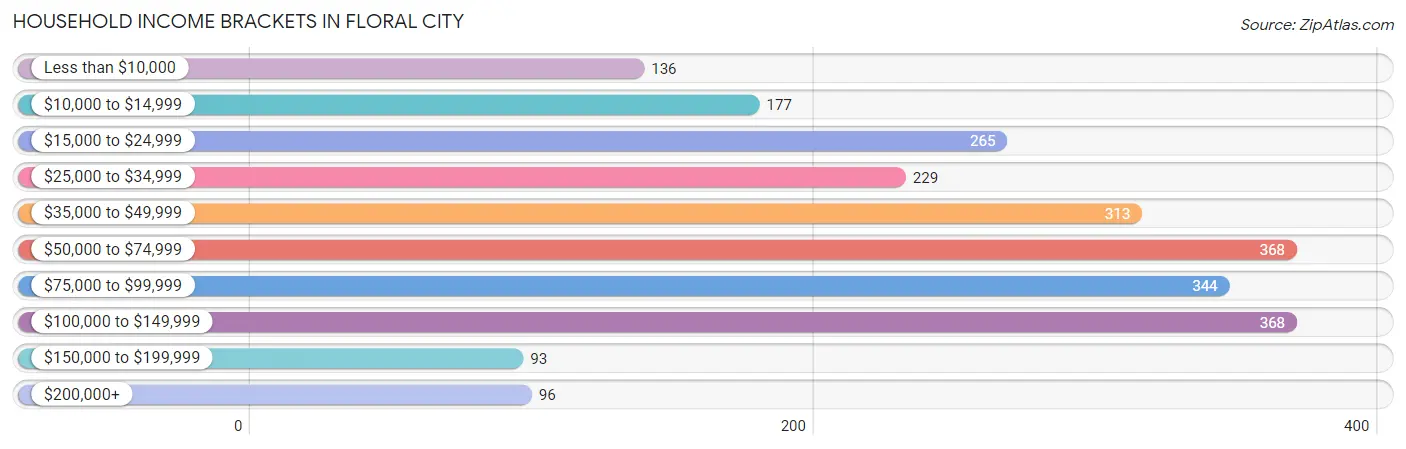
Household Income Brackets in Floral City
With 368 households falling in the category, the $50,000 to $74,999 income range is the most frequent in Floral City, accounting for 15.4% of all households. In contrast, only 93 households (3.9%) fall into the $150,000 to $199,999 income bracket, making it the least populous group.
| Income Bracket | # Households | % Households |
| Less than $10,000 | 136 | 5.7% |
| $10,000 to $14,999 | 177 | 7.4% |
| $15,000 to $24,999 | 265 | 11.1% |
| $25,000 to $34,999 | 229 | 9.6% |
| $35,000 to $49,999 | 313 | 13.1% |
| $50,000 to $74,999 | 368 | 15.4% |
| $75,000 to $99,999 | 344 | 14.4% |
| $100,000 to $149,999 | 368 | 15.4% |
| $150,000 to $199,999 | 93 | 3.9% |
| $200,000+ | 96 | 4.0% |
Household Income by Householder Age in Floral City
The median household income in Floral City is $55,616, with the highest median household income of $95,300 found in the 25 to 44 years age bracket for the primary householder. A total of 233 households (9.8%) fall into this category. Meanwhile, the 15 to 24 years age bracket for the primary householder has the lowest median household income of $0, with 11 households (0.5%) in this group.
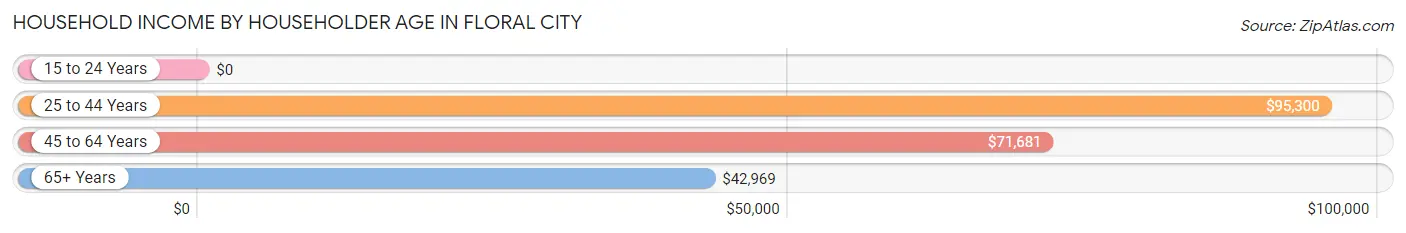
| Income Bracket | # Households | Median Income |
| 15 to 24 Years | 11 (0.5%) | $0 |
| 25 to 44 Years | 233 (9.8%) | $95,300 |
| 45 to 64 Years | 859 (36.0%) | $71,681 |
| 65+ Years | 1,285 (53.8%) | $42,969 |
| Total | 2,388 (100.0%) | $55,616 |
Poverty in Floral City
Income Below Poverty by Sex and Age in Floral City
With 12.1% poverty level for males and 16.9% for females among the residents of Floral City, 5 year old males and under 5 year old females are the most vulnerable to poverty, with 8 males (100.0%) and 46 females (62.2%) in their respective age groups living below the poverty level.
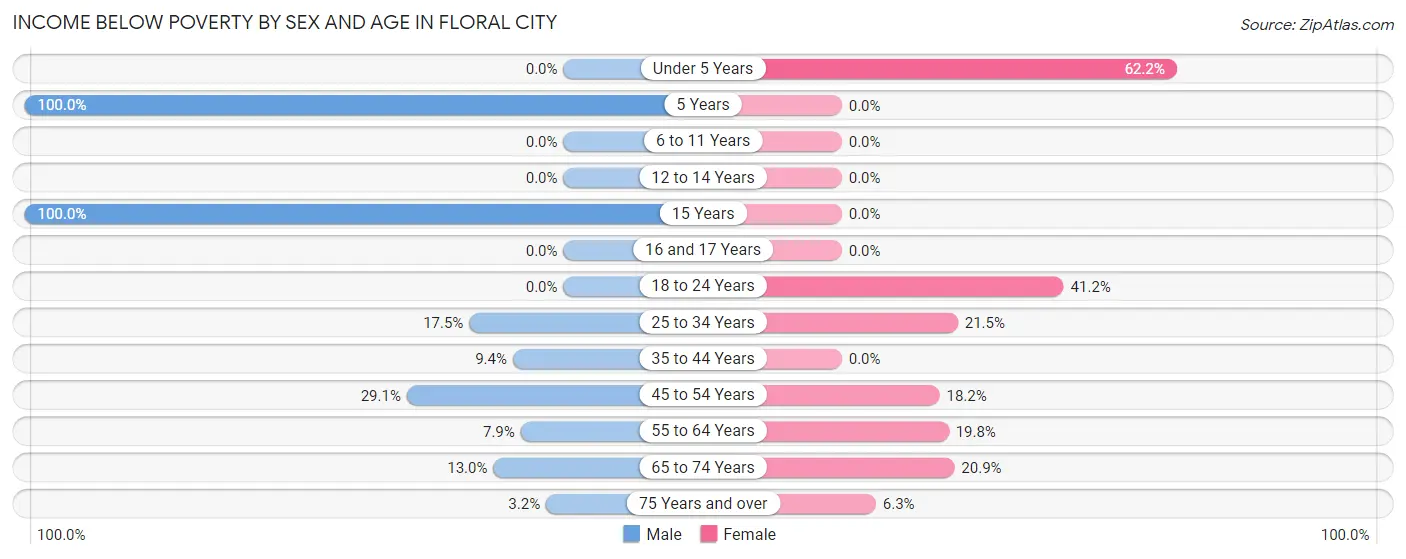
| Age Bracket | Male | Female |
| Under 5 Years | 0 (0.0%) | 46 (62.2%) |
| 5 Years | 8 (100.0%) | 0 (0.0%) |
| 6 to 11 Years | 0 (0.0%) | 0 (0.0%) |
| 12 to 14 Years | 0 (0.0%) | 0 (0.0%) |
| 15 Years | 10 (100.0%) | 0 (0.0%) |
| 16 and 17 Years | 0 (0.0%) | 0 (0.0%) |
| 18 to 24 Years | 0 (0.0%) | 21 (41.2%) |
| 25 to 34 Years | 50 (17.5%) | 31 (21.5%) |
| 35 to 44 Years | 18 (9.4%) | 0 (0.0%) |
| 45 to 54 Years | 66 (29.1%) | 45 (18.1%) |
| 55 to 64 Years | 44 (7.9%) | 125 (19.8%) |
| 65 to 74 Years | 76 (13.0%) | 107 (20.9%) |
| 75 Years and over | 12 (3.2%) | 38 (6.3%) |
| Total | 284 (12.1%) | 413 (16.9%) |
Income Above Poverty by Sex and Age in Floral City
According to the poverty statistics in Floral City, males aged 6 to 11 years and females aged 6 to 11 years are the age groups that are most secure financially, with 100.0% of males and 100.0% of females in these age groups living above the poverty line.
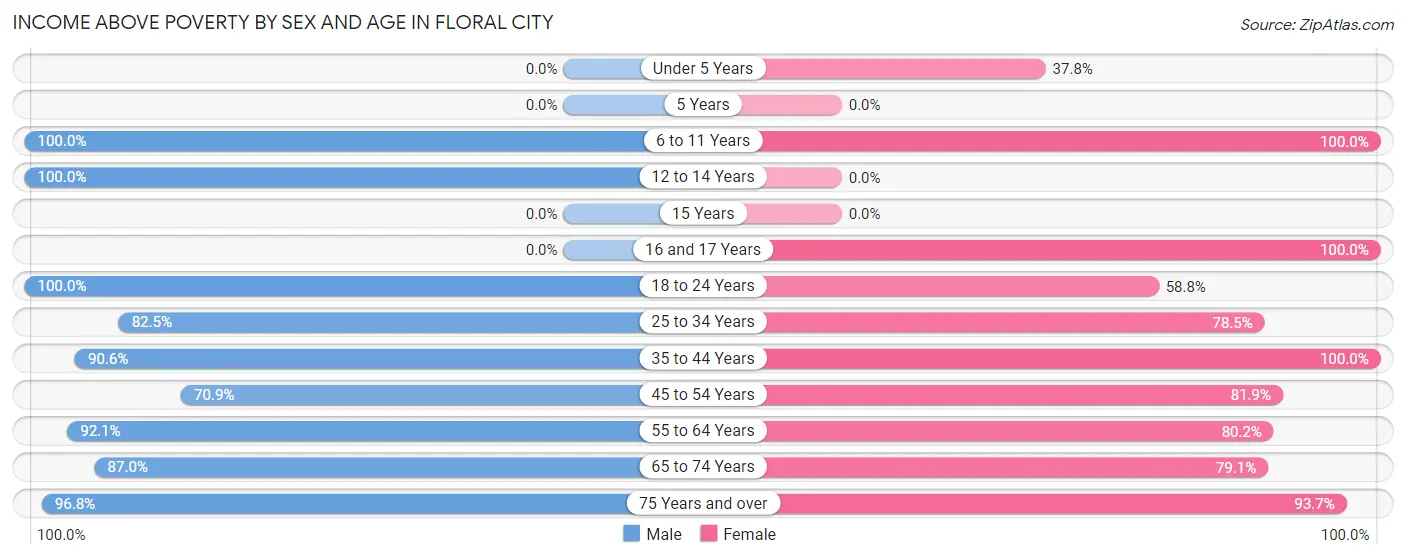
| Age Bracket | Male | Female |
| Under 5 Years | 0 (0.0%) | 28 (37.8%) |
| 5 Years | 0 (0.0%) | 0 (0.0%) |
| 6 to 11 Years | 9 (100.0%) | 61 (100.0%) |
| 12 to 14 Years | 44 (100.0%) | 0 (0.0%) |
| 15 Years | 0 (0.0%) | 0 (0.0%) |
| 16 and 17 Years | 0 (0.0%) | 23 (100.0%) |
| 18 to 24 Years | 57 (100.0%) | 30 (58.8%) |
| 25 to 34 Years | 236 (82.5%) | 113 (78.5%) |
| 35 to 44 Years | 174 (90.6%) | 97 (100.0%) |
| 45 to 54 Years | 161 (70.9%) | 203 (81.9%) |
| 55 to 64 Years | 511 (92.1%) | 505 (80.2%) |
| 65 to 74 Years | 508 (87.0%) | 405 (79.1%) |
| 75 Years and over | 361 (96.8%) | 563 (93.7%) |
| Total | 2,061 (87.9%) | 2,028 (83.1%) |
Income Below Poverty Among Married-Couple Families in Floral City
The poverty statistics for married-couple families in Floral City show that 5.9% or 74 of the total 1,258 families live below the poverty line. Families with 1 or 2 children have the highest poverty rate of 9.8%, comprising of 8 families. On the other hand, families with 3 or 4 children have the lowest poverty rate of 0.0%, which includes 0 families.
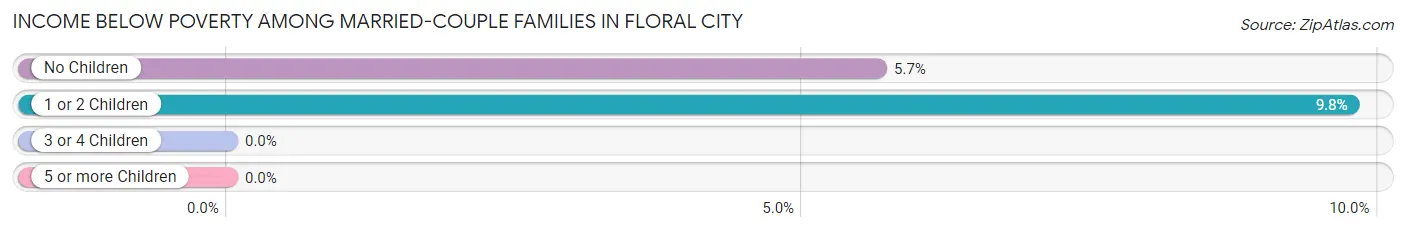
| Children | Above Poverty | Below Poverty |
| No Children | 1,102 (94.4%) | 66 (5.7%) |
| 1 or 2 Children | 74 (90.2%) | 8 (9.8%) |
| 3 or 4 Children | 8 (100.0%) | 0 (0.0%) |
| 5 or more Children | 0 (0.0%) | 0 (0.0%) |
| Total | 1,184 (94.1%) | 74 (5.9%) |
Income Below Poverty Among Single-Parent Households in Floral City
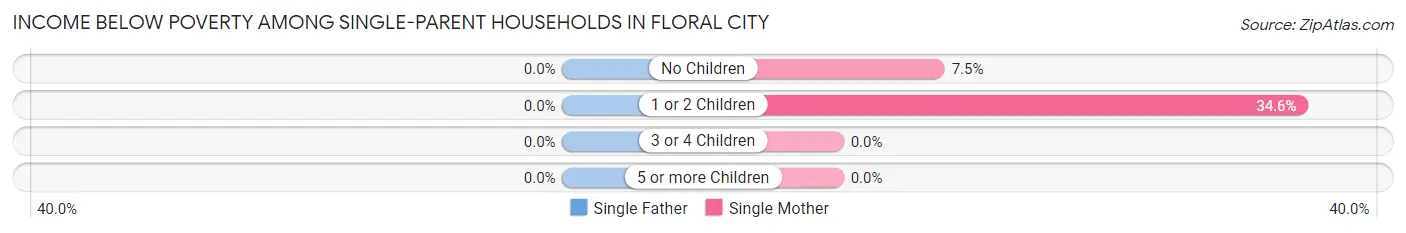
| Children | Single Father | Single Mother |
| No Children | 0 (0.0%) | 11 (7.5%) |
| 1 or 2 Children | 0 (0.0%) | 27 (34.6%) |
| 3 or 4 Children | 0 (0.0%) | 0 (0.0%) |
| 5 or more Children | 0 (0.0%) | 0 (0.0%) |
| Total | 0 (0.0%) | 38 (17.0%) |
Income Below Poverty Among Married-Couple vs Single-Parent Households in Floral City
The poverty data for Floral City shows that 74 of the married-couple family households (5.9%) and 38 of the single-parent households (13.4%) are living below the poverty level. Within the married-couple family households, those with 1 or 2 children have the highest poverty rate, with 8 households (9.8%) falling below the poverty line. Among the single-parent households, those with 1 or 2 children have the highest poverty rate, with 27 household (34.6%) living below poverty.
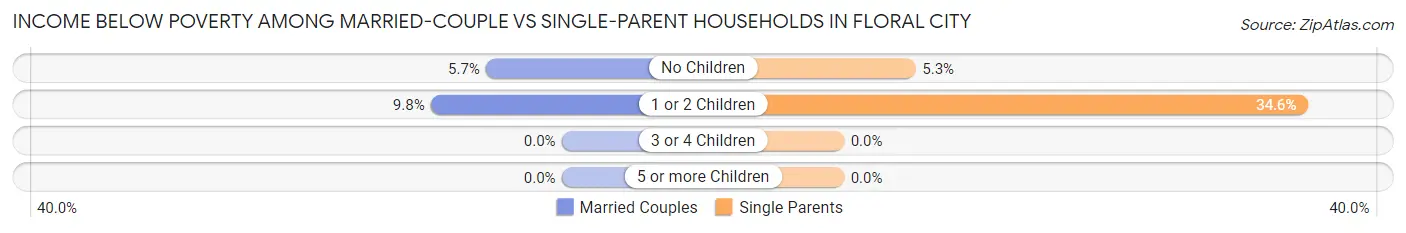
| Children | Married-Couple Families | Single-Parent Households |
| No Children | 66 (5.7%) | 11 (5.3%) |
| 1 or 2 Children | 8 (9.8%) | 27 (34.6%) |
| 3 or 4 Children | 0 (0.0%) | 0 (0.0%) |
| 5 or more Children | 0 (0.0%) | 0 (0.0%) |
| Total | 74 (5.9%) | 38 (13.4%) |
Race in Floral City
The most populous races in Floral City are White / Caucasian (4,468 | 92.5%), Hispanic or Latino (279 | 5.8%), and Black / African American (140 | 2.9%).
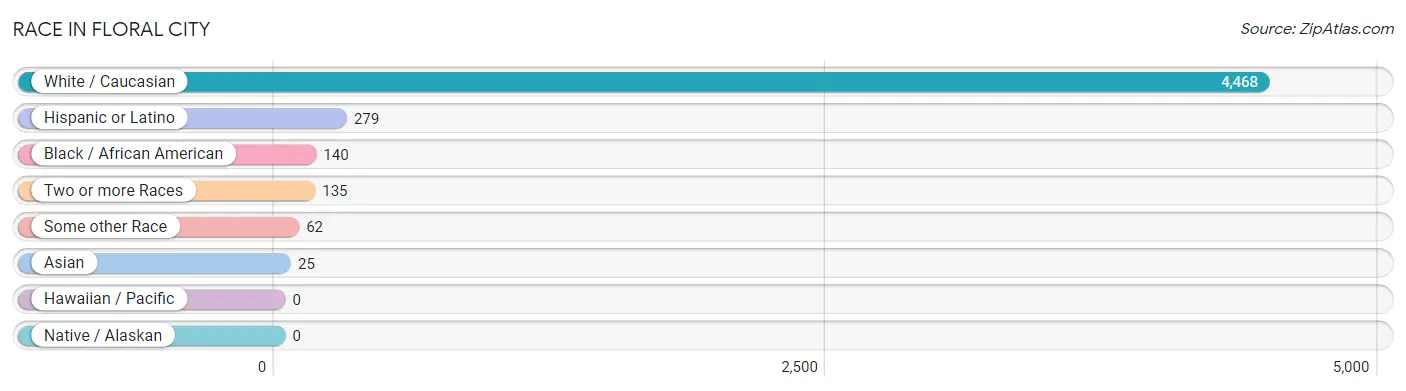
| Race | # Population | % Population |
| Asian | 25 | 0.5% |
| Black / African American | 140 | 2.9% |
| Hawaiian / Pacific | 0 | 0.0% |
| Hispanic or Latino | 279 | 5.8% |
| Native / Alaskan | 0 | 0.0% |
| White / Caucasian | 4,468 | 92.5% |
| Two or more Races | 135 | 2.8% |
| Some other Race | 62 | 1.3% |
| Total | 4,830 | 100.0% |
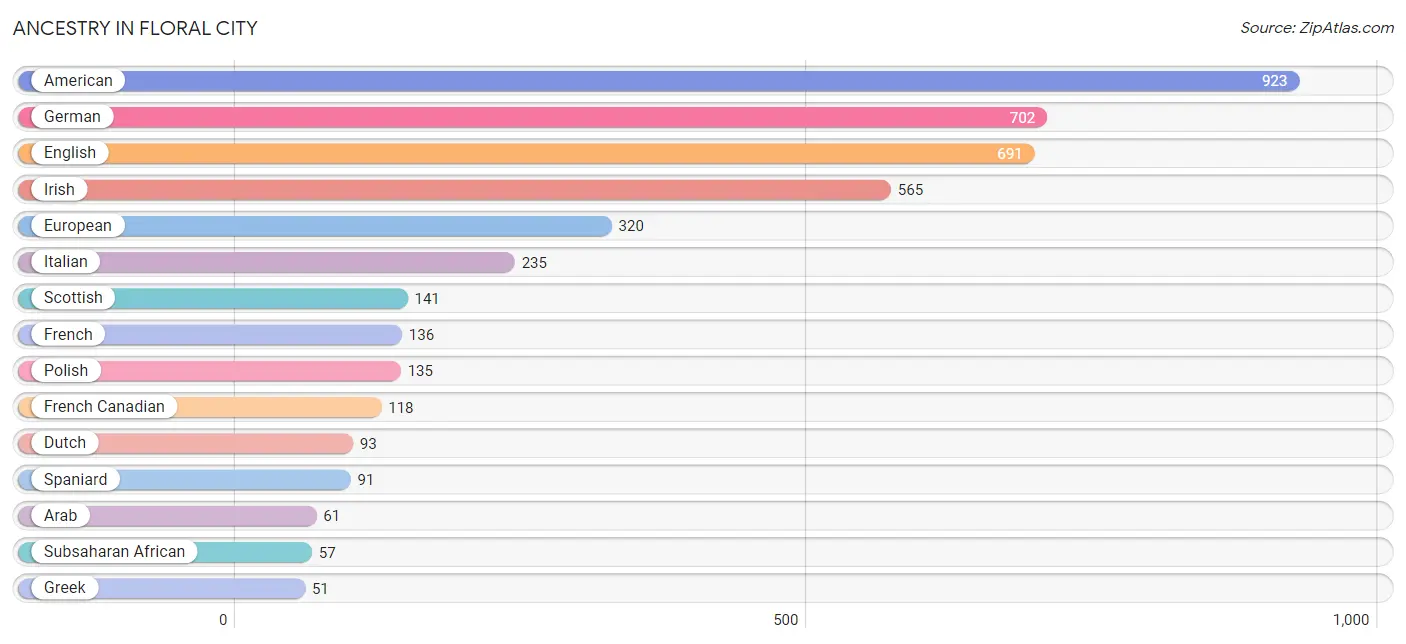
Ancestry in Floral City
The most populous ancestries reported in Floral City are American (923 | 19.1%), German (702 | 14.5%), English (691 | 14.3%), Irish (565 | 11.7%), and European (320 | 6.6%), together accounting for 66.3% of all Floral City residents.
| Ancestry | # Population | % Population |
| American | 923 | 19.1% |
| Arab | 61 | 1.3% |
| Argentinean | 2 | 0.0% |
| Belgian | 11 | 0.2% |
| Bhutanese | 31 | 0.6% |
| British | 9 | 0.2% |
| Burmese | 31 | 0.6% |
| Canadian | 27 | 0.6% |
| Cuban | 15 | 0.3% |
| Czechoslovakian | 17 | 0.4% |
| Danish | 10 | 0.2% |
| Dominican | 48 | 1.0% |
| Dutch | 93 | 1.9% |
| Eastern European | 13 | 0.3% |
| English | 691 | 14.3% |
| European | 320 | 6.6% |
| French | 136 | 2.8% |
| French Canadian | 118 | 2.4% |
| German | 702 | 14.5% |
| Greek | 51 | 1.1% |
| Indian (Asian) | 10 | 0.2% |
| Iraqi | 36 | 0.7% |
| Irish | 565 | 11.7% |
| Italian | 235 | 4.9% |
| Jamaican | 10 | 0.2% |
| Korean | 15 | 0.3% |
| Lebanese | 9 | 0.2% |
| Lithuanian | 11 | 0.2% |
| Mexican | 12 | 0.3% |
| Northern European | 10 | 0.2% |
| Norwegian | 24 | 0.5% |
| Pennsylvania German | 10 | 0.2% |
| Polish | 135 | 2.8% |
| Portuguese | 16 | 0.3% |
| Puerto Rican | 12 | 0.3% |
| Russian | 31 | 0.6% |
| Scotch-Irish | 44 | 0.9% |
| Scottish | 141 | 2.9% |
| Slavic | 7 | 0.1% |
| South American | 18 | 0.4% |
| Spaniard | 91 | 1.9% |
| Spanish | 36 | 0.7% |
| Subsaharan African | 57 | 1.2% |
| Swedish | 47 | 1.0% |
| Swiss | 29 | 0.6% |
| Ukrainian | 11 | 0.2% |
| Venezuelan | 16 | 0.3% |
| Welsh | 19 | 0.4% |
| West Indian | 34 | 0.7% | View All 49 Rows |
Immigrants in Floral City
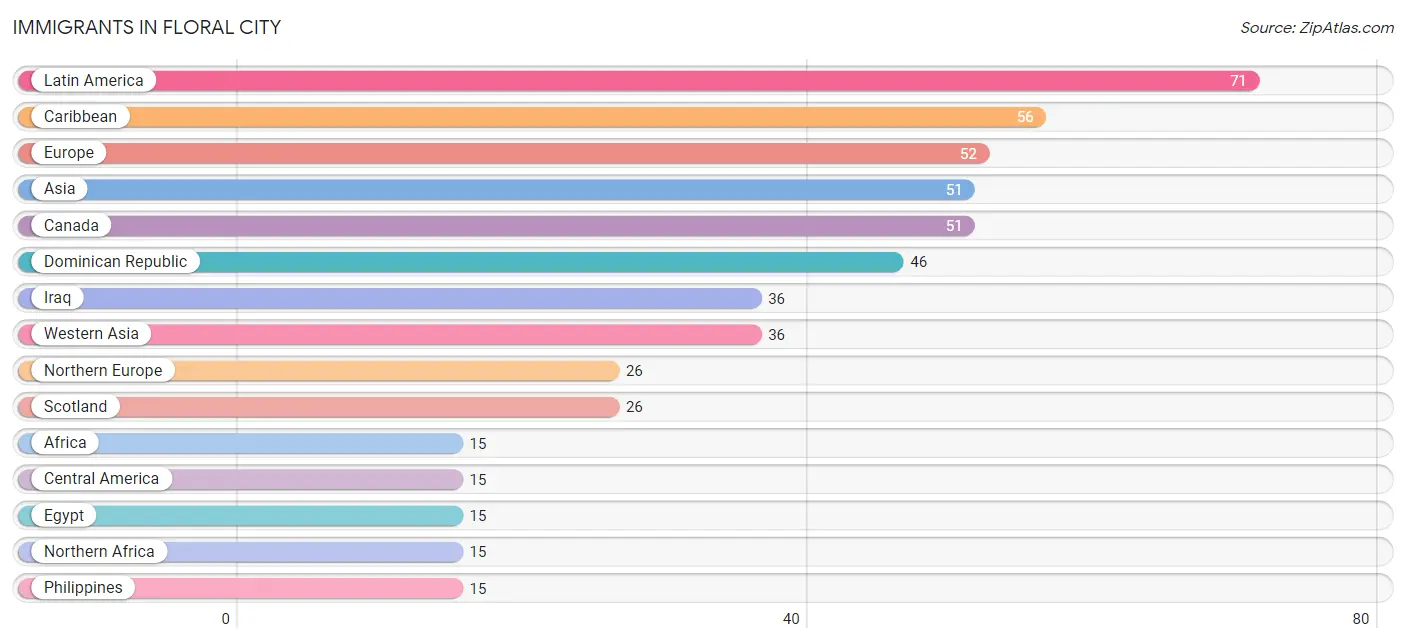
The most numerous immigrant groups reported in Floral City came from Latin America (71 | 1.5%), Caribbean (56 | 1.2%), Europe (52 | 1.1%), Asia (51 | 1.1%), and Canada (51 | 1.1%), together accounting for 5.8% of all Floral City residents.
| Immigration Origin | # Population | % Population |
| Africa | 15 | 0.3% |
| Asia | 51 | 1.1% |
| Belgium | 11 | 0.2% |
| Canada | 51 | 1.1% |
| Caribbean | 56 | 1.2% |
| Central America | 15 | 0.3% |
| Dominican Republic | 46 | 0.9% |
| Egypt | 15 | 0.3% |
| Europe | 52 | 1.1% |
| Iraq | 36 | 0.7% |
| Jamaica | 10 | 0.2% |
| Latin America | 71 | 1.5% |
| Mexico | 3 | 0.1% |
| Northern Africa | 15 | 0.3% |
| Northern Europe | 26 | 0.5% |
| Panama | 12 | 0.3% |
| Philippines | 15 | 0.3% |
| Scotland | 26 | 0.5% |
| South Eastern Asia | 15 | 0.3% |
| Southern Europe | 15 | 0.3% |
| Spain | 15 | 0.3% |
| Western Asia | 36 | 0.7% |
| Western Europe | 11 | 0.2% | View All 23 Rows |
Sex and Age in Floral City
Sex and Age in Floral City
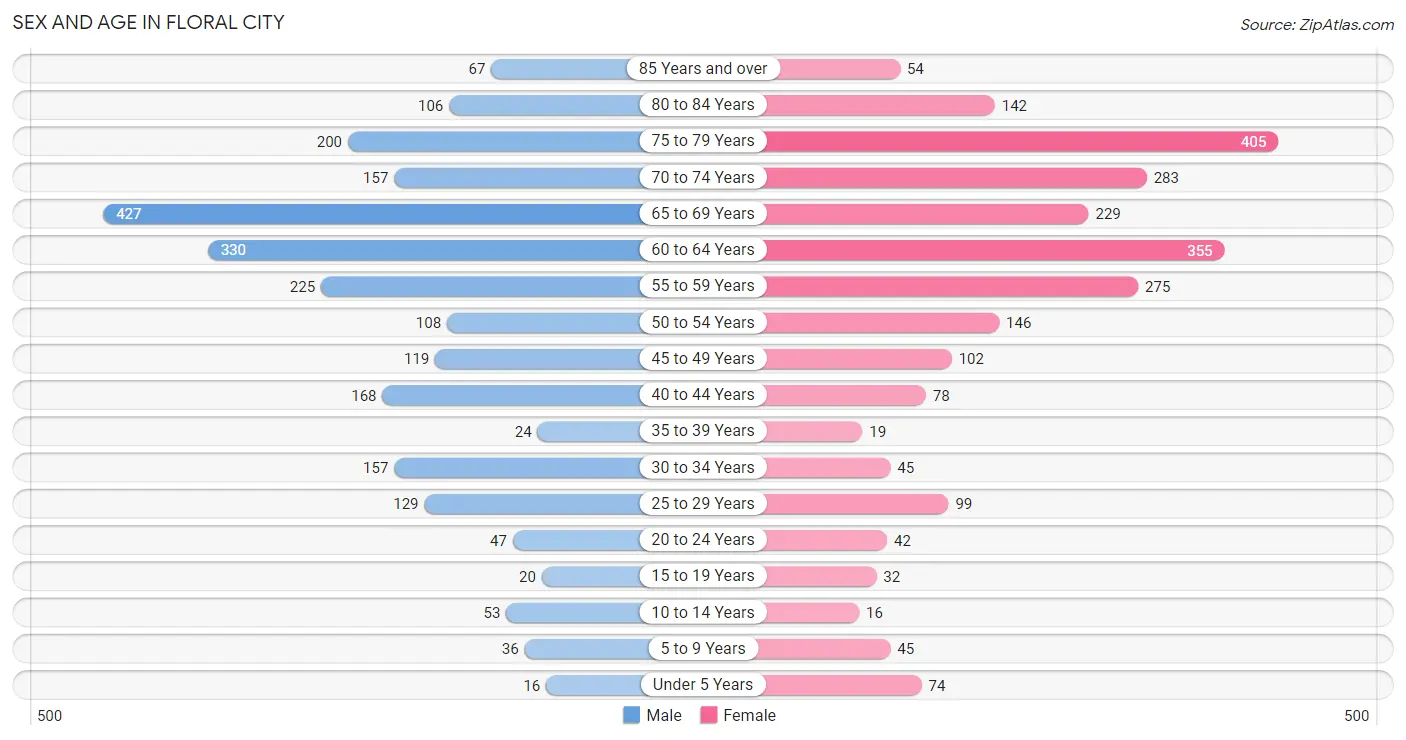
The most populous age groups in Floral City are 65 to 69 Years (427 | 17.9%) for men and 75 to 79 Years (405 | 16.6%) for women.
| Age Bracket | Male | Female |
| Under 5 Years | 16 (0.7%) | 74 (3.0%) |
| 5 to 9 Years | 36 (1.5%) | 45 (1.8%) |
| 10 to 14 Years | 53 (2.2%) | 16 (0.7%) |
| 15 to 19 Years | 20 (0.8%) | 32 (1.3%) |
| 20 to 24 Years | 47 (2.0%) | 42 (1.7%) |
| 25 to 29 Years | 129 (5.4%) | 99 (4.1%) |
| 30 to 34 Years | 157 (6.6%) | 45 (1.8%) |
| 35 to 39 Years | 24 (1.0%) | 19 (0.8%) |
| 40 to 44 Years | 168 (7.0%) | 78 (3.2%) |
| 45 to 49 Years | 119 (5.0%) | 102 (4.2%) |
| 50 to 54 Years | 108 (4.5%) | 146 (6.0%) |
| 55 to 59 Years | 225 (9.4%) | 275 (11.3%) |
| 60 to 64 Years | 330 (13.8%) | 355 (14.5%) |
| 65 to 69 Years | 427 (17.9%) | 229 (9.4%) |
| 70 to 74 Years | 157 (6.6%) | 283 (11.6%) |
| 75 to 79 Years | 200 (8.4%) | 405 (16.6%) |
| 80 to 84 Years | 106 (4.4%) | 142 (5.8%) |
| 85 Years and over | 67 (2.8%) | 54 (2.2%) |
| Total | 2,389 (100.0%) | 2,441 (100.0%) |
Families and Households in Floral City
Median Family Size in Floral City
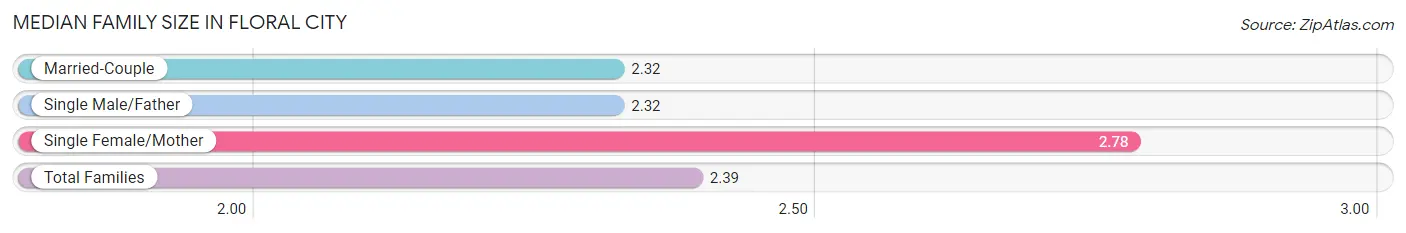
The median family size in Floral City is 2.39 persons per family, with single female/mother families (224 | 14.5%) accounting for the largest median family size of 2.78 persons per family. On the other hand, married-couple families (1,258 | 81.6%) represent the smallest median family size with 2.32 persons per family.
| Family Type | # Families | Family Size |
| Married-Couple | 1,258 (81.6%) | 2.32 |
| Single Male/Father | 60 (3.9%) | 2.32 |
| Single Female/Mother | 224 (14.5%) | 2.78 |
| Total Families | 1,542 (100.0%) | 2.39 |
Median Household Size in Floral City
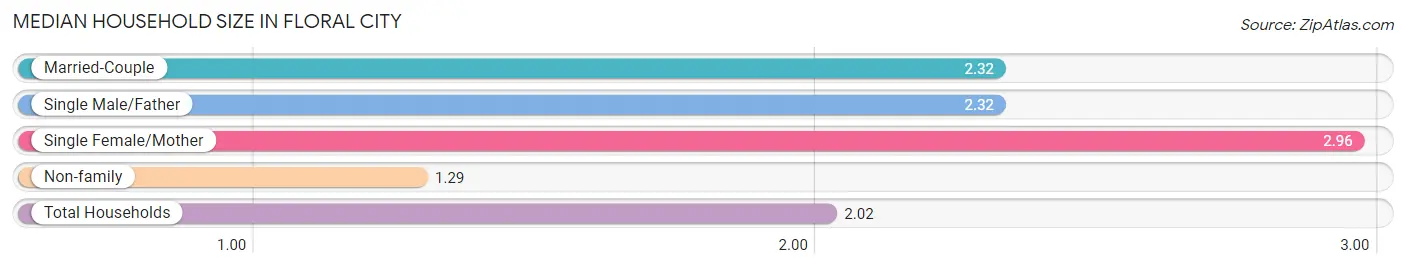
The median household size in Floral City is 2.02 persons per household, with single female/mother households (224 | 9.4%) accounting for the largest median household size of 2.96 persons per household. non-family households (846 | 35.4%) represent the smallest median household size with 1.29 persons per household.
| Household Type | # Households | Household Size |
| Married-Couple | 1,258 (52.7%) | 2.32 |
| Single Male/Father | 60 (2.5%) | 2.32 |
| Single Female/Mother | 224 (9.4%) | 2.96 |
| Non-family | 846 (35.4%) | 1.29 |
| Total Households | 2,388 (100.0%) | 2.02 |
Household Size by Marriage Status in Floral City
Out of a total of 2,388 households in Floral City, 1,542 (64.6%) are family households, while 846 (35.4%) are nonfamily households. The most numerous type of family households are 2-person households, comprising 1,277, and the most common type of nonfamily households are 1-person households, comprising 679.
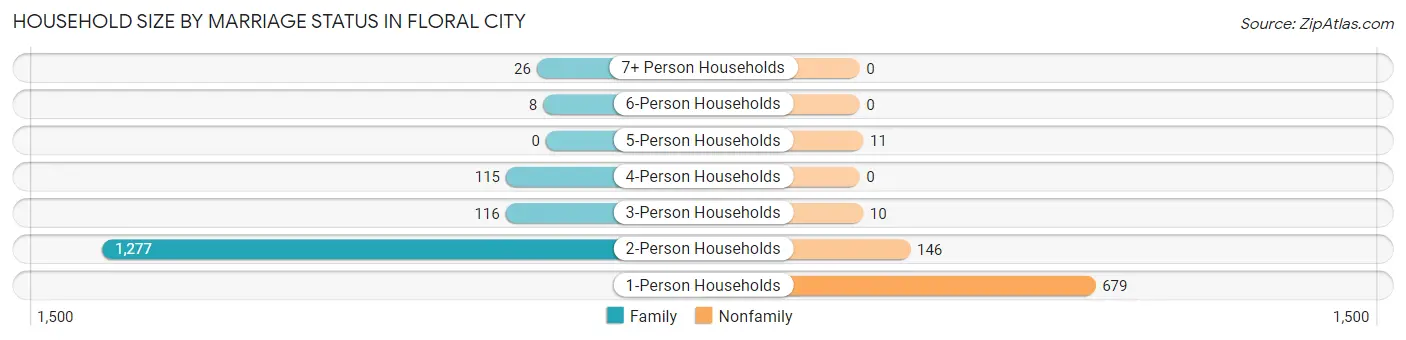
| Household Size | Family Households | Nonfamily Households |
| 1-Person Households | - | 679 (28.4%) |
| 2-Person Households | 1,277 (53.5%) | 146 (6.1%) |
| 3-Person Households | 116 (4.9%) | 10 (0.4%) |
| 4-Person Households | 115 (4.8%) | 0 (0.0%) |
| 5-Person Households | 0 (0.0%) | 11 (0.5%) |
| 6-Person Households | 8 (0.3%) | 0 (0.0%) |
| 7+ Person Households | 26 (1.1%) | 0 (0.0%) |
| Total | 1,542 (64.6%) | 846 (35.4%) |
Female Fertility in Floral City
Fertility by Age in Floral City
Average fertility rate in Floral City is 26.0 births per 1,000 women. Women in the age bracket of 20 to 34 years have the highest fertility rate with 59.0 births per 1,000 women. Women in the age bracket of 20 to 34 years acount for 100.0% of all women with births.
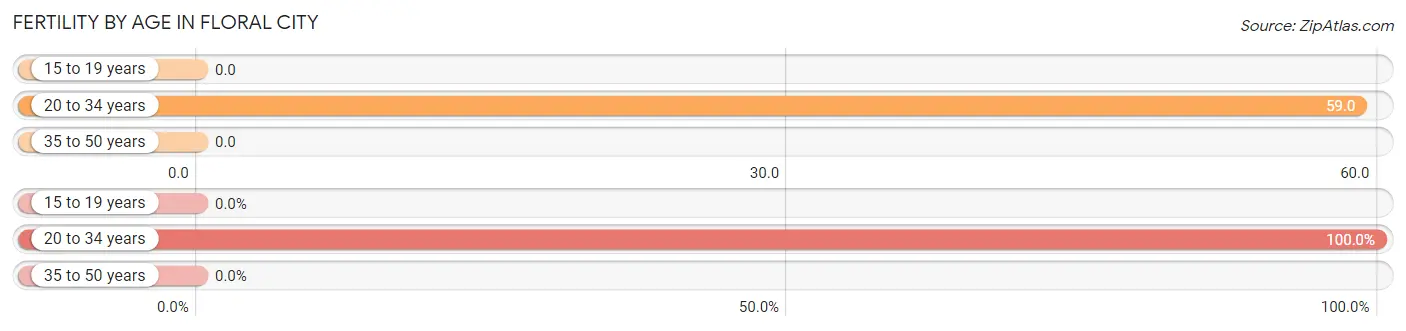
| Age Bracket | Women with Births | Births / 1,000 Women |
| 15 to 19 years | 0 (0.0%) | 0.0 |
| 20 to 34 years | 11 (100.0%) | 59.0 |
| 35 to 50 years | 0 (0.0%) | 0.0 |
| Total | 11 (100.0%) | 26.0 |
Fertility by Age by Marriage Status in Floral City
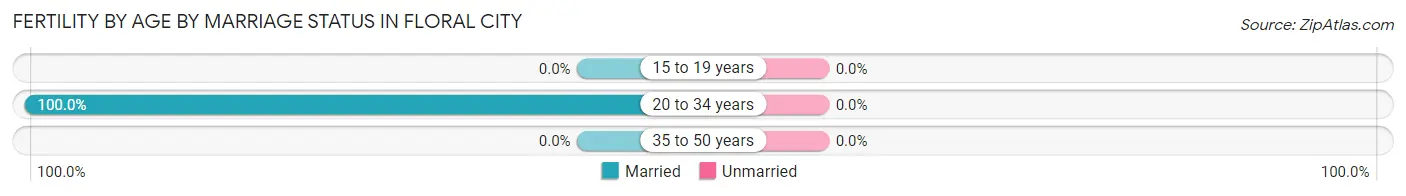
| Age Bracket | Married | Unmarried |
| 15 to 19 years | 0 (0.0%) | 0 (0.0%) |
| 20 to 34 years | 11 (100.0%) | 0 (0.0%) |
| 35 to 50 years | 0 (0.0%) | 0 (0.0%) |
| Total | 11 (100.0%) | 0 (0.0%) |
Fertility by Education in Floral City
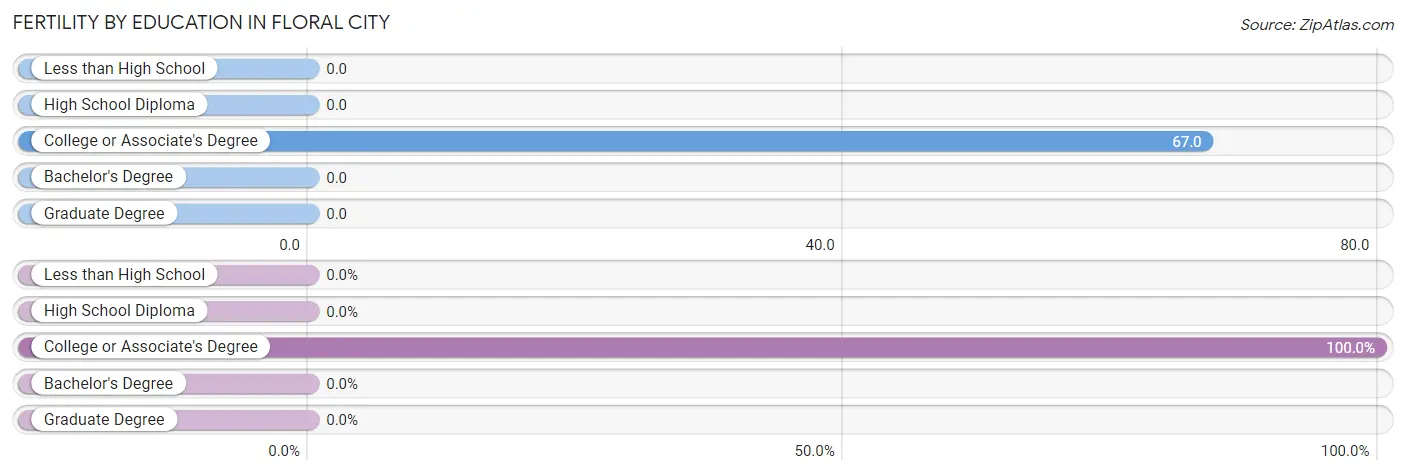
| Educational Attainment | Women with Births | Births / 1,000 Women |
| Less than High School | 0 (0.0%) | 0.0 |
| High School Diploma | 0 (0.0%) | 0.0 |
| College or Associate's Degree | 11 (100.0%) | 67.0 |
| Bachelor's Degree | 0 (0.0%) | 0.0 |
| Graduate Degree | 0 (0.0%) | 0.0 |
| Total | 11 (100.0%) | 26.0 |
Fertility by Education by Marriage Status in Floral City
| Educational Attainment | Married | Unmarried |
| Less than High School | 0 (0.0%) | 0 (0.0%) |
| High School Diploma | 0 (0.0%) | 0 (0.0%) |
| College or Associate's Degree | 11 (100.0%) | 0 (0.0%) |
| Bachelor's Degree | 0 (0.0%) | 0 (0.0%) |
| Graduate Degree | 0 (0.0%) | 0 (0.0%) |
| Total | 11 (100.0%) | 0 (0.0%) |
Employment Characteristics in Floral City
Employment by Class of Employer in Floral City
Among the 1,583 employed individuals in Floral City, private company employees (983 | 62.1%), self-employed (not incorporated) (143 | 9.0%), and not-for-profit organizations (127 | 8.0%) make up the most common classes of employment.
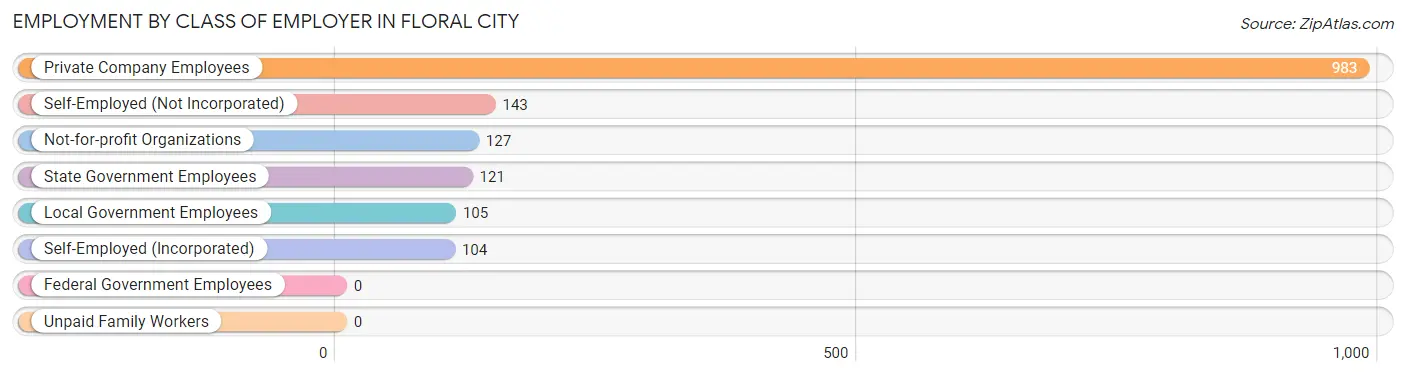
| Employer Class | # Employees | % Employees |
| Private Company Employees | 983 | 62.1% |
| Self-Employed (Incorporated) | 104 | 6.6% |
| Self-Employed (Not Incorporated) | 143 | 9.0% |
| Not-for-profit Organizations | 127 | 8.0% |
| Local Government Employees | 105 | 6.6% |
| State Government Employees | 121 | 7.6% |
| Federal Government Employees | 0 | 0.0% |
| Unpaid Family Workers | 0 | 0.0% |
| Total | 1,583 | 100.0% |
Employment Status by Age in Floral City
According to the labor force statistics for Floral City, out of the total population over 16 years of age (4,580), 36.7% or 1,681 individuals are in the labor force, with 4.5% or 76 of them unemployed. The age group with the highest labor force participation rate is 20 to 24 years, with 100.0% or 89 individuals in the labor force. Within the labor force, the 30 to 34 years age range has the highest percentage of unemployed individuals, with 11.5% or 17 of them being unemployed.
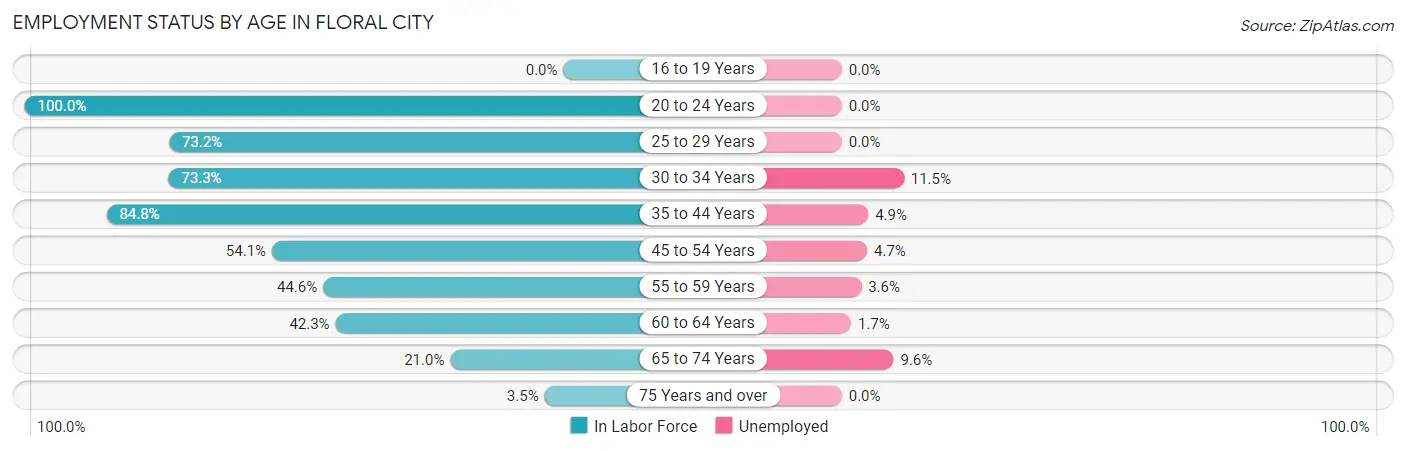
| Age Bracket | In Labor Force | Unemployed |
| 16 to 19 Years | 0 (0.0%) | 0 (0.0%) |
| 20 to 24 Years | 89 (100.0%) | 0 (0.0%) |
| 25 to 29 Years | 167 (73.2%) | 0 (0.0%) |
| 30 to 34 Years | 148 (73.3%) | 17 (11.5%) |
| 35 to 44 Years | 245 (84.8%) | 12 (4.9%) |
| 45 to 54 Years | 257 (54.1%) | 12 (4.7%) |
| 55 to 59 Years | 223 (44.6%) | 8 (3.6%) |
| 60 to 64 Years | 290 (42.3%) | 5 (1.7%) |
| 65 to 74 Years | 230 (21.0%) | 22 (9.6%) |
| 75 Years and over | 34 (3.5%) | 0 (0.0%) |
| Total | 1,681 (36.7%) | 76 (4.5%) |
Employment Status by Educational Attainment in Floral City
According to labor force statistics for Floral City, 55.9% of individuals (1,330) out of the total population between 25 and 64 years of age (2,379) are in the labor force, with 4.1% or 55 of them being unemployed. The group with the highest labor force participation rate are those with the educational attainment of bachelor's degree or higher, with 72.1% or 321 individuals in the labor force. Within the labor force, individuals with high school diploma education have the highest percentage of unemployment, with 5.1% or 25 of them being unemployed.
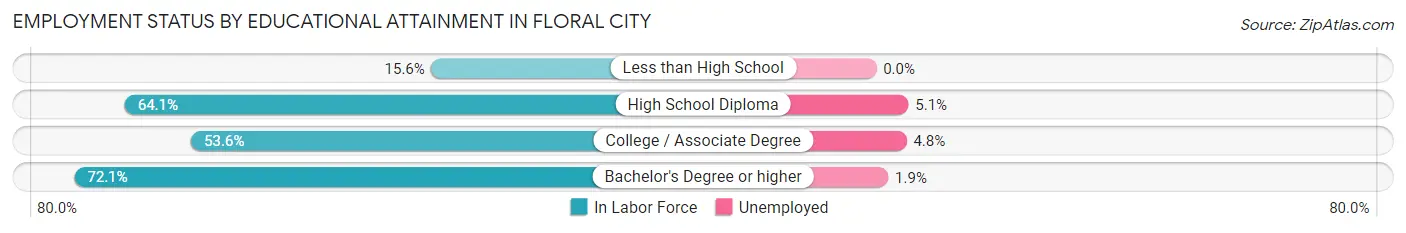
| Educational Attainment | In Labor Force | Unemployed |
| Less than High School | 44 (15.6%) | 0 (0.0%) |
| High School Diploma | 490 (64.1%) | 39 (5.1%) |
| College / Associate Degree | 475 (53.6%) | 43 (4.8%) |
| Bachelor's Degree or higher | 321 (72.1%) | 8 (1.9%) |
| Total | 1,330 (55.9%) | 98 (4.1%) |
Employment Occupations by Sex in Floral City
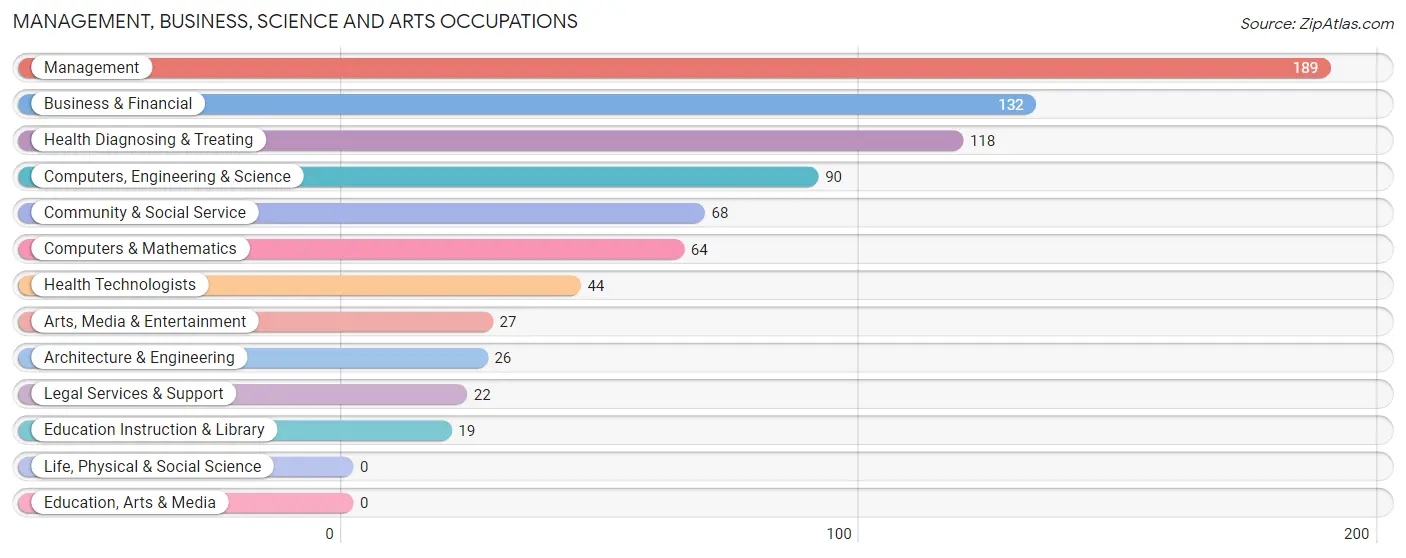
Management, Business, Science and Arts Occupations
The most common Management, Business, Science and Arts occupations in Floral City are Management (189 | 11.8%), Business & Financial (132 | 8.2%), Health Diagnosing & Treating (118 | 7.3%), Computers, Engineering & Science (90 | 5.6%), and Community & Social Service (68 | 4.2%).
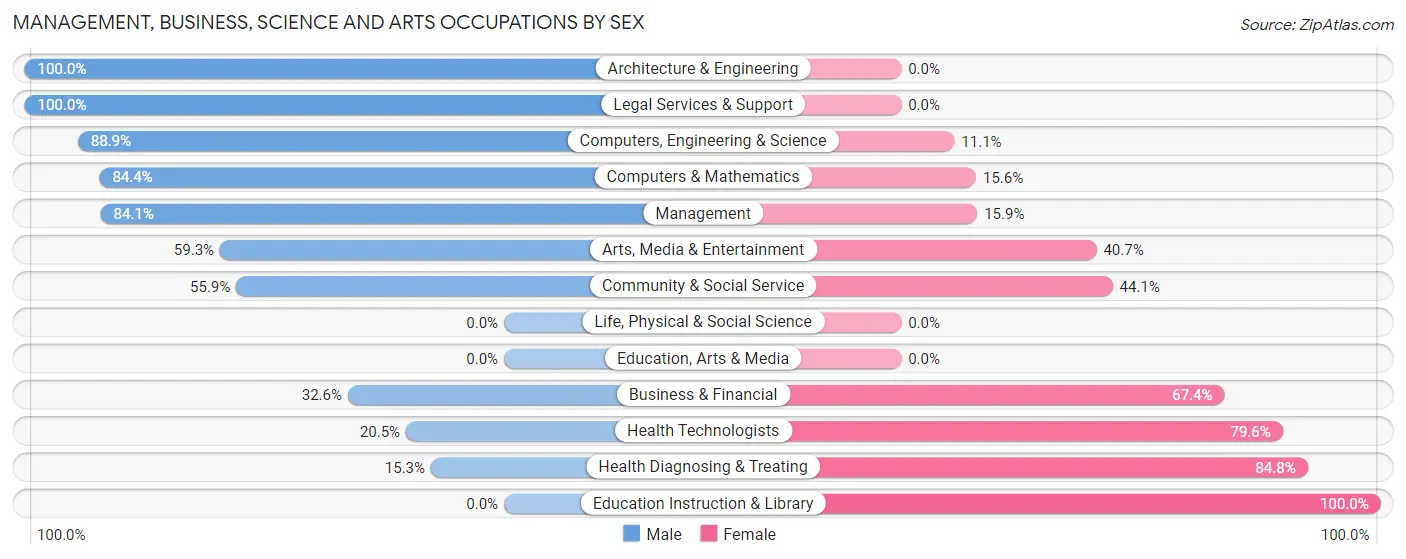
Management, Business, Science and Arts Occupations by Sex
Within the Management, Business, Science and Arts occupations in Floral City, the most male-oriented occupations are Architecture & Engineering (100.0%), Legal Services & Support (100.0%), and Computers, Engineering & Science (88.9%), while the most female-oriented occupations are Education Instruction & Library (100.0%), Health Diagnosing & Treating (84.8%), and Health Technologists (79.5%).
| Occupation | Male | Female |
| Management | 159 (84.1%) | 30 (15.9%) |
| Business & Financial | 43 (32.6%) | 89 (67.4%) |
| Computers, Engineering & Science | 80 (88.9%) | 10 (11.1%) |
| Computers & Mathematics | 54 (84.4%) | 10 (15.6%) |
| Architecture & Engineering | 26 (100.0%) | 0 (0.0%) |
| Life, Physical & Social Science | 0 (0.0%) | 0 (0.0%) |
| Community & Social Service | 38 (55.9%) | 30 (44.1%) |
| Education, Arts & Media | 0 (0.0%) | 0 (0.0%) |
| Legal Services & Support | 22 (100.0%) | 0 (0.0%) |
| Education Instruction & Library | 0 (0.0%) | 19 (100.0%) |
| Arts, Media & Entertainment | 16 (59.3%) | 11 (40.7%) |
| Health Diagnosing & Treating | 18 (15.2%) | 100 (84.8%) |
| Health Technologists | 9 (20.4%) | 35 (79.5%) |
| Total (Category) | 338 (56.6%) | 259 (43.4%) |
| Total (Overall) | 907 (56.4%) | 700 (43.6%) |
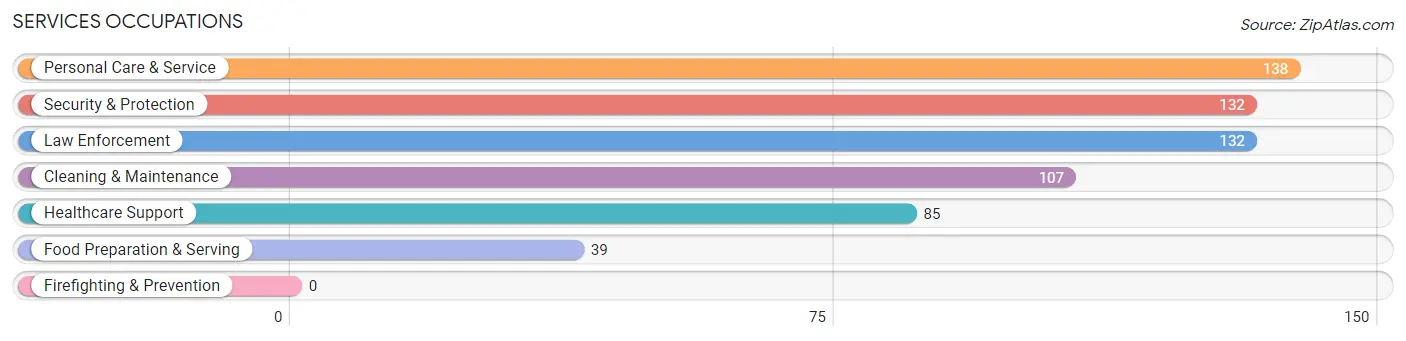
Services Occupations
The most common Services occupations in Floral City are Personal Care & Service (138 | 8.6%), Security & Protection (132 | 8.2%), Law Enforcement (132 | 8.2%), Cleaning & Maintenance (107 | 6.7%), and Healthcare Support (85 | 5.3%).
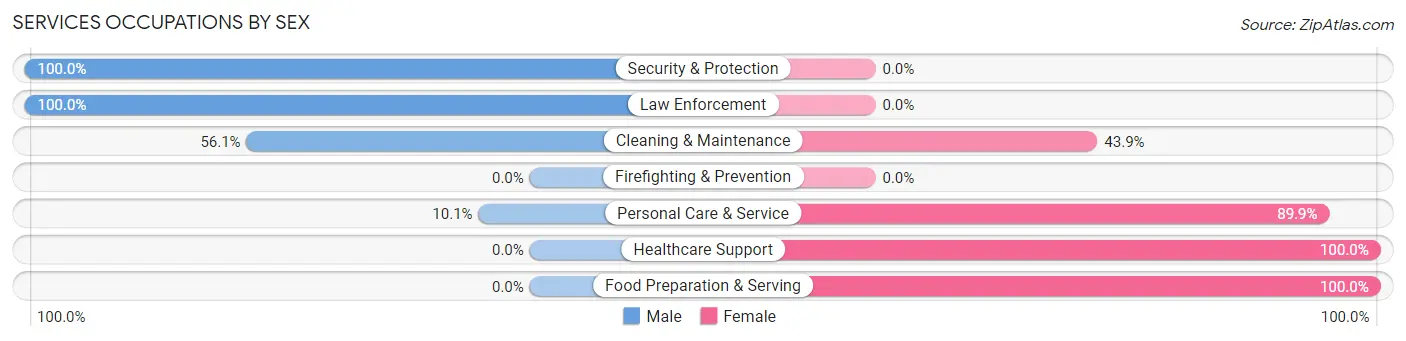
Services Occupations by Sex
Within the Services occupations in Floral City, the most male-oriented occupations are Security & Protection (100.0%), Law Enforcement (100.0%), and Cleaning & Maintenance (56.1%), while the most female-oriented occupations are Healthcare Support (100.0%), Food Preparation & Serving (100.0%), and Personal Care & Service (89.9%).
| Occupation | Male | Female |
| Healthcare Support | 0 (0.0%) | 85 (100.0%) |
| Security & Protection | 132 (100.0%) | 0 (0.0%) |
| Firefighting & Prevention | 0 (0.0%) | 0 (0.0%) |
| Law Enforcement | 132 (100.0%) | 0 (0.0%) |
| Food Preparation & Serving | 0 (0.0%) | 39 (100.0%) |
| Cleaning & Maintenance | 60 (56.1%) | 47 (43.9%) |
| Personal Care & Service | 14 (10.1%) | 124 (89.9%) |
| Total (Category) | 206 (41.1%) | 295 (58.9%) |
| Total (Overall) | 907 (56.4%) | 700 (43.6%) |
Sales and Office Occupations
The most common Sales and Office occupations in Floral City are Office & Administration (84 | 5.2%), and Sales & Related (58 | 3.6%).
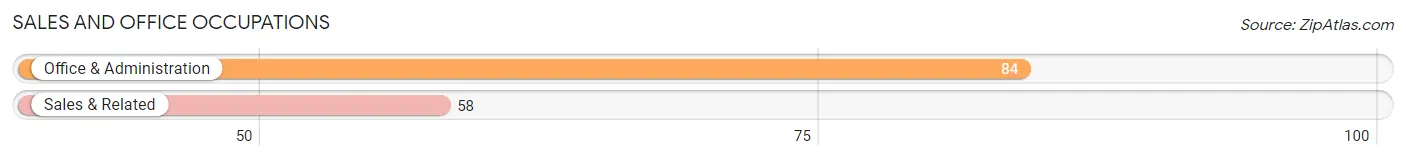
Sales and Office Occupations by Sex

| Occupation | Male | Female |
| Sales & Related | 16 (27.6%) | 42 (72.4%) |
| Office & Administration | 15 (17.9%) | 69 (82.1%) |
| Total (Category) | 31 (21.8%) | 111 (78.2%) |
| Total (Overall) | 907 (56.4%) | 700 (43.6%) |
Natural Resources, Construction and Maintenance Occupations
The most common Natural Resources, Construction and Maintenance occupations in Floral City are Construction & Extraction (94 | 5.9%), Installation, Maintenance & Repair (25 | 1.6%), and Farming, Fishing & Forestry (3 | 0.2%).
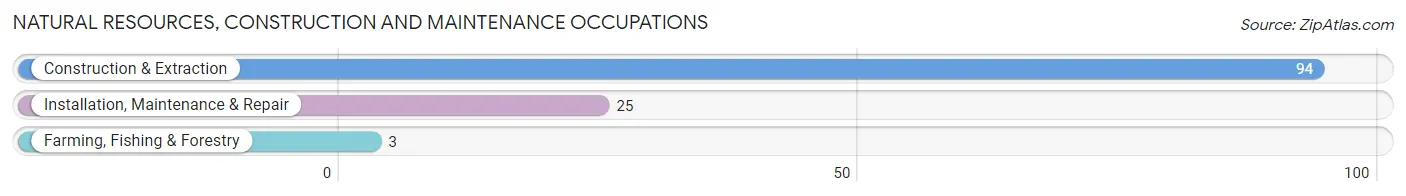
Natural Resources, Construction and Maintenance Occupations by Sex
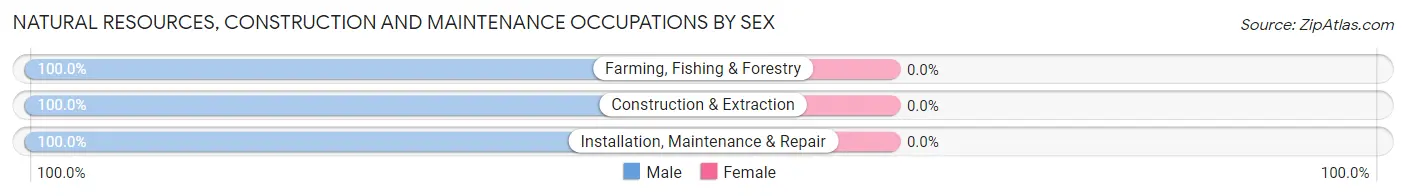
| Occupation | Male | Female |
| Farming, Fishing & Forestry | 3 (100.0%) | 0 (0.0%) |
| Construction & Extraction | 94 (100.0%) | 0 (0.0%) |
| Installation, Maintenance & Repair | 25 (100.0%) | 0 (0.0%) |
| Total (Category) | 122 (100.0%) | 0 (0.0%) |
| Total (Overall) | 907 (56.4%) | 700 (43.6%) |
Production, Transportation and Moving Occupations
The most common Production, Transportation and Moving occupations in Floral City are Production (109 | 6.8%), Material Moving (88 | 5.5%), and Transportation (48 | 3.0%).
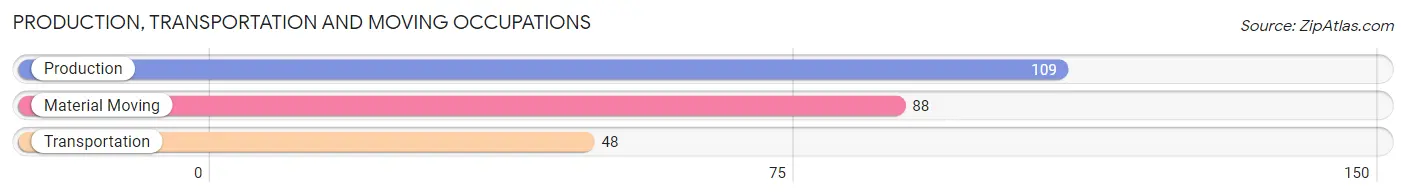
Production, Transportation and Moving Occupations by Sex
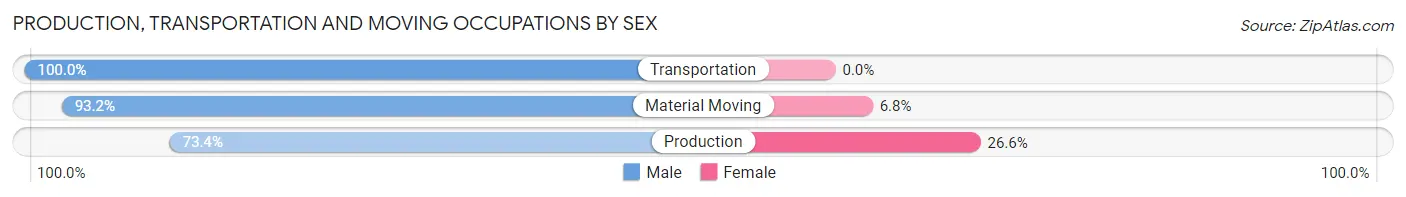
| Occupation | Male | Female |
| Production | 80 (73.4%) | 29 (26.6%) |
| Transportation | 48 (100.0%) | 0 (0.0%) |
| Material Moving | 82 (93.2%) | 6 (6.8%) |
| Total (Category) | 210 (85.7%) | 35 (14.3%) |
| Total (Overall) | 907 (56.4%) | 700 (43.6%) |
Employment Industries by Sex in Floral City
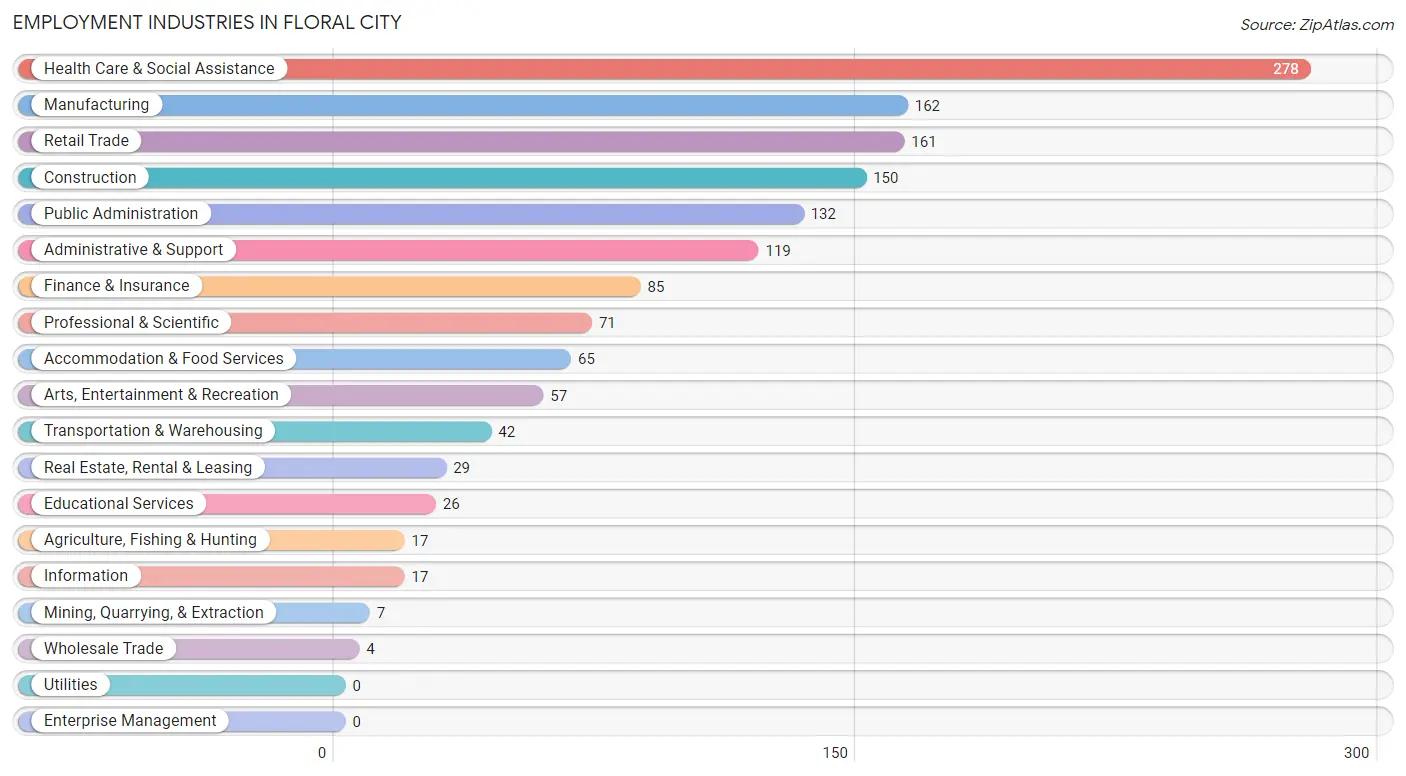
Employment Industries in Floral City
The major employment industries in Floral City include Health Care & Social Assistance (278 | 17.3%), Manufacturing (162 | 10.1%), Retail Trade (161 | 10.0%), Construction (150 | 9.3%), and Public Administration (132 | 8.2%).
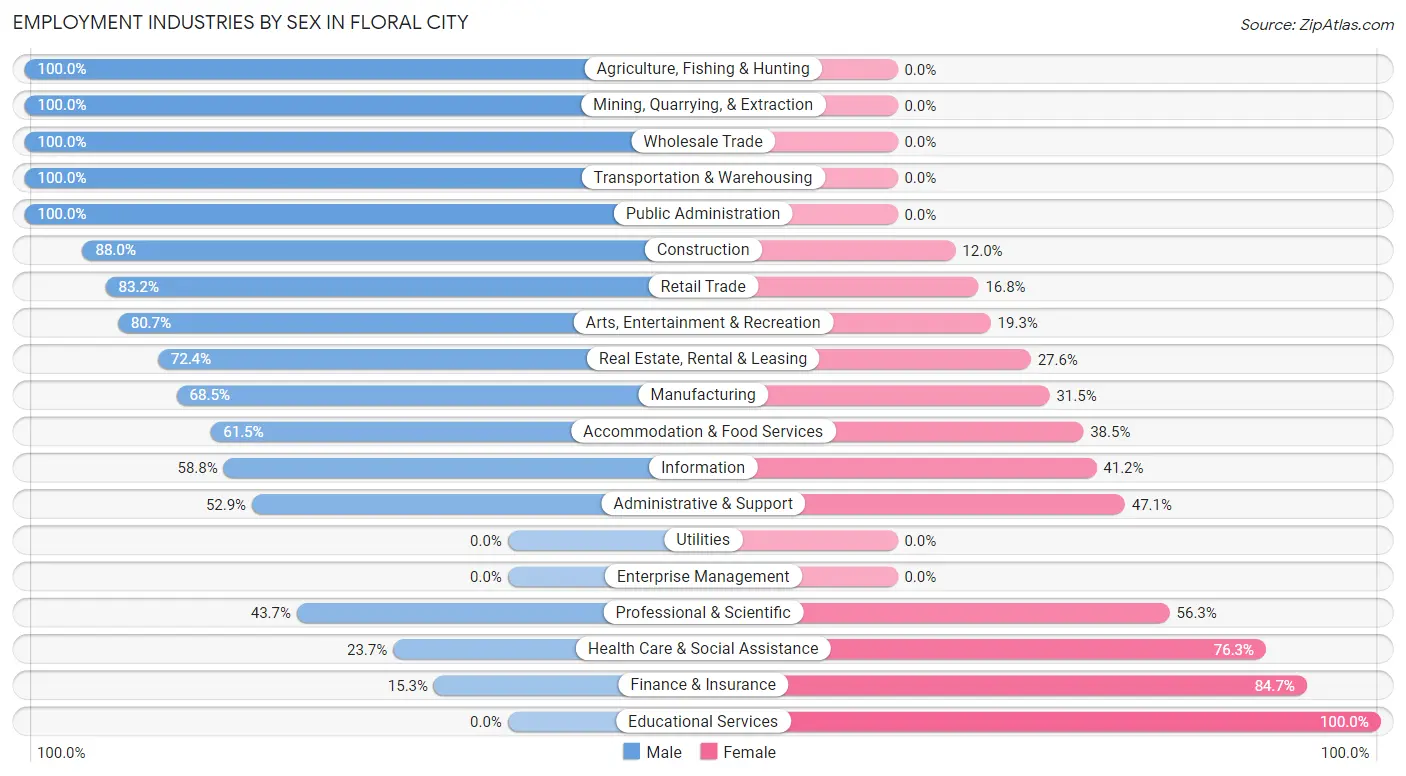
Employment Industries by Sex in Floral City
The Floral City industries that see more men than women are Agriculture, Fishing & Hunting (100.0%), Mining, Quarrying, & Extraction (100.0%), and Wholesale Trade (100.0%), whereas the industries that tend to have a higher number of women are Educational Services (100.0%), Finance & Insurance (84.7%), and Health Care & Social Assistance (76.3%).
| Industry | Male | Female |
| Agriculture, Fishing & Hunting | 17 (100.0%) | 0 (0.0%) |
| Mining, Quarrying, & Extraction | 7 (100.0%) | 0 (0.0%) |
| Construction | 132 (88.0%) | 18 (12.0%) |
| Manufacturing | 111 (68.5%) | 51 (31.5%) |
| Wholesale Trade | 4 (100.0%) | 0 (0.0%) |
| Retail Trade | 134 (83.2%) | 27 (16.8%) |
| Transportation & Warehousing | 42 (100.0%) | 0 (0.0%) |
| Utilities | 0 (0.0%) | 0 (0.0%) |
| Information | 10 (58.8%) | 7 (41.2%) |
| Finance & Insurance | 13 (15.3%) | 72 (84.7%) |
| Real Estate, Rental & Leasing | 21 (72.4%) | 8 (27.6%) |
| Professional & Scientific | 31 (43.7%) | 40 (56.3%) |
| Enterprise Management | 0 (0.0%) | 0 (0.0%) |
| Administrative & Support | 63 (52.9%) | 56 (47.1%) |
| Educational Services | 0 (0.0%) | 26 (100.0%) |
| Health Care & Social Assistance | 66 (23.7%) | 212 (76.3%) |
| Arts, Entertainment & Recreation | 46 (80.7%) | 11 (19.3%) |
| Accommodation & Food Services | 40 (61.5%) | 25 (38.5%) |
| Public Administration | 132 (100.0%) | 0 (0.0%) |
| Total | 907 (56.4%) | 700 (43.6%) |
Education in Floral City
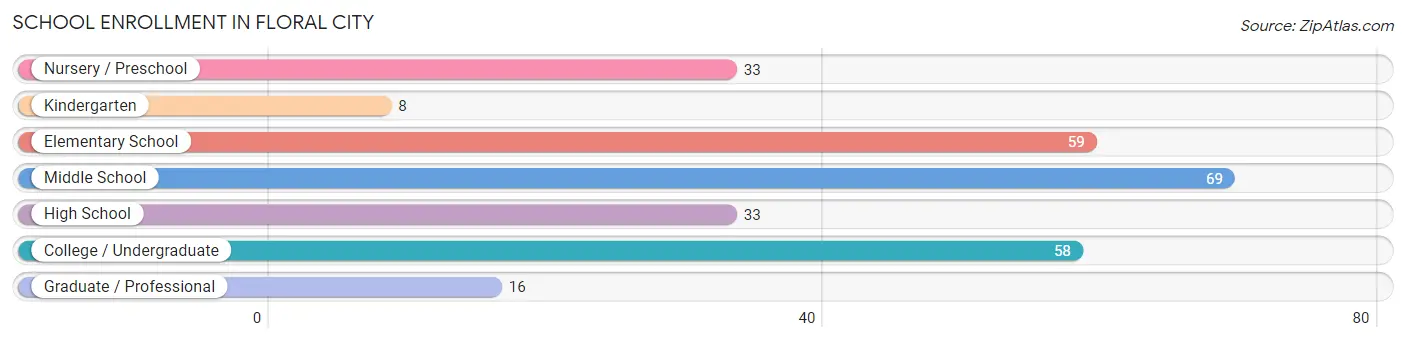
School Enrollment in Floral City
The most common levels of schooling among the 276 students in Floral City are middle school (69 | 25.0%), elementary school (59 | 21.4%), and college / undergraduate (58 | 21.0%).
| School Level | # Students | % Students |
| Nursery / Preschool | 33 | 12.0% |
| Kindergarten | 8 | 2.9% |
| Elementary School | 59 | 21.4% |
| Middle School | 69 | 25.0% |
| High School | 33 | 12.0% |
| College / Undergraduate | 58 | 21.0% |
| Graduate / Professional | 16 | 5.8% |
| Total | 276 | 100.0% |
School Enrollment by Age by Funding Source in Floral City
Out of a total of 276 students who are enrolled in schools in Floral City, 47 (17.0%) attend a private institution, while the remaining 229 (83.0%) are enrolled in public schools. The age group of 3 to 4 year olds has the highest likelihood of being enrolled in private schools, with 19 (100.0% in the age bracket) enrolled. Conversely, the age group of 5 to 9 year old has the lowest likelihood of being enrolled in a private school, with 81 (100.0% in the age bracket) attending a public institution.
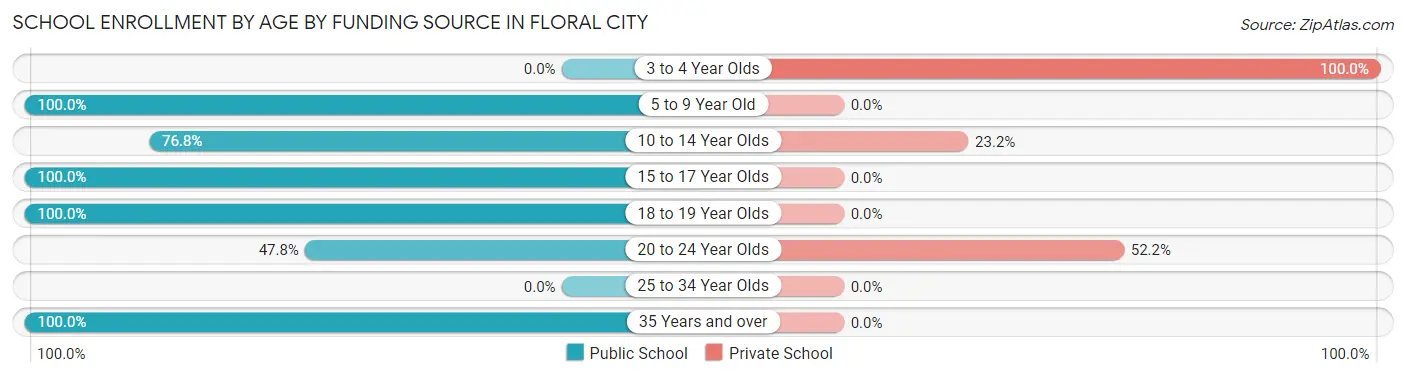
| Age Bracket | Public School | Private School |
| 3 to 4 Year Olds | 0 (0.0%) | 19 (100.0%) |
| 5 to 9 Year Old | 81 (100.0%) | 0 (0.0%) |
| 10 to 14 Year Olds | 53 (76.8%) | 16 (23.2%) |
| 15 to 17 Year Olds | 33 (100.0%) | 0 (0.0%) |
| 18 to 19 Year Olds | 9 (100.0%) | 0 (0.0%) |
| 20 to 24 Year Olds | 11 (47.8%) | 12 (52.2%) |
| 25 to 34 Year Olds | 0 (0.0%) | 0 (0.0%) |
| 35 Years and over | 42 (100.0%) | 0 (0.0%) |
| Total | 229 (83.0%) | 47 (17.0%) |
Educational Attainment by Field of Study in Floral City
Business (160 | 19.2%), social sciences (151 | 18.1%), science & technology (122 | 14.6%), education (91 | 10.9%), and computers & mathematics (45 | 5.4%) are the most common fields of study among 833 individuals in Floral City who have obtained a bachelor's degree or higher.
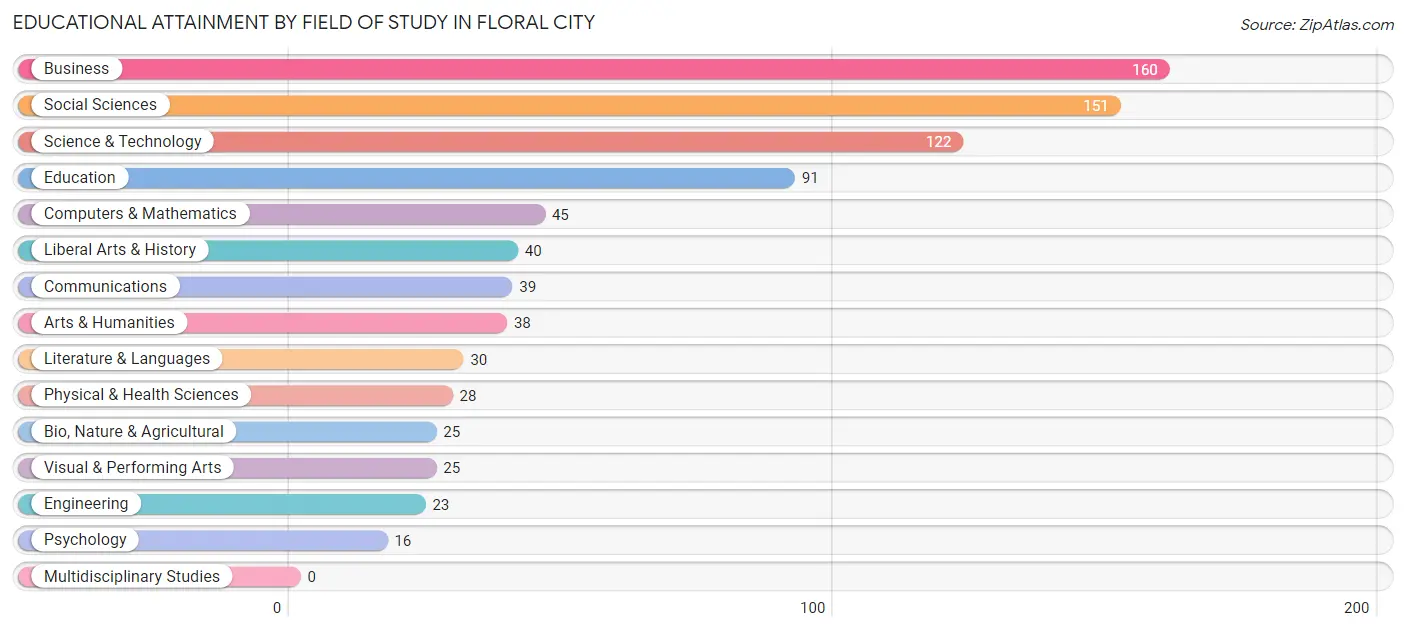
| Field of Study | # Graduates | % Graduates |
| Computers & Mathematics | 45 | 5.4% |
| Bio, Nature & Agricultural | 25 | 3.0% |
| Physical & Health Sciences | 28 | 3.4% |
| Psychology | 16 | 1.9% |
| Social Sciences | 151 | 18.1% |
| Engineering | 23 | 2.8% |
| Multidisciplinary Studies | 0 | 0.0% |
| Science & Technology | 122 | 14.6% |
| Business | 160 | 19.2% |
| Education | 91 | 10.9% |
| Literature & Languages | 30 | 3.6% |
| Liberal Arts & History | 40 | 4.8% |
| Visual & Performing Arts | 25 | 3.0% |
| Communications | 39 | 4.7% |
| Arts & Humanities | 38 | 4.6% |
| Total | 833 | 100.0% |
Transportation & Commute in Floral City
Vehicle Availability by Sex in Floral City
The most prevalent vehicle ownership categories in Floral City are males with 2 vehicles (353, accounting for 39.6%) and females with 2 vehicles (249, making up 51.5%).
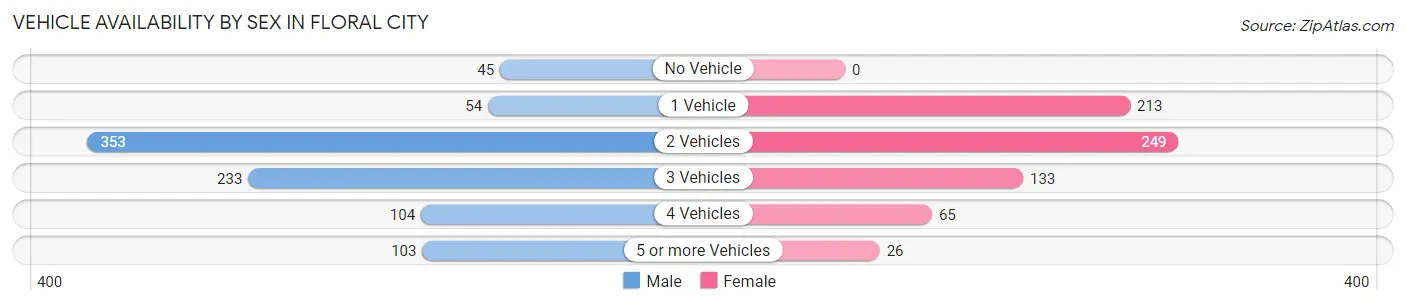
| Vehicles Available | Male | Female |
| No Vehicle | 45 (5.0%) | 0 (0.0%) |
| 1 Vehicle | 54 (6.0%) | 213 (31.0%) |
| 2 Vehicles | 353 (39.6%) | 249 (36.3%) |
| 3 Vehicles | 233 (26.1%) | 133 (19.4%) |
| 4 Vehicles | 104 (11.7%) | 65 (9.5%) |
| 5 or more Vehicles | 103 (11.6%) | 26 (3.8%) |
| Total | 892 (100.0%) | 686 (100.0%) |
Commute Time in Floral City
The most frequently occuring commute durations in Floral City are 30 to 34 minutes (246 commuters, 18.0%), 15 to 19 minutes (196 commuters, 14.3%), and 60 to 89 minutes (184 commuters, 13.5%).
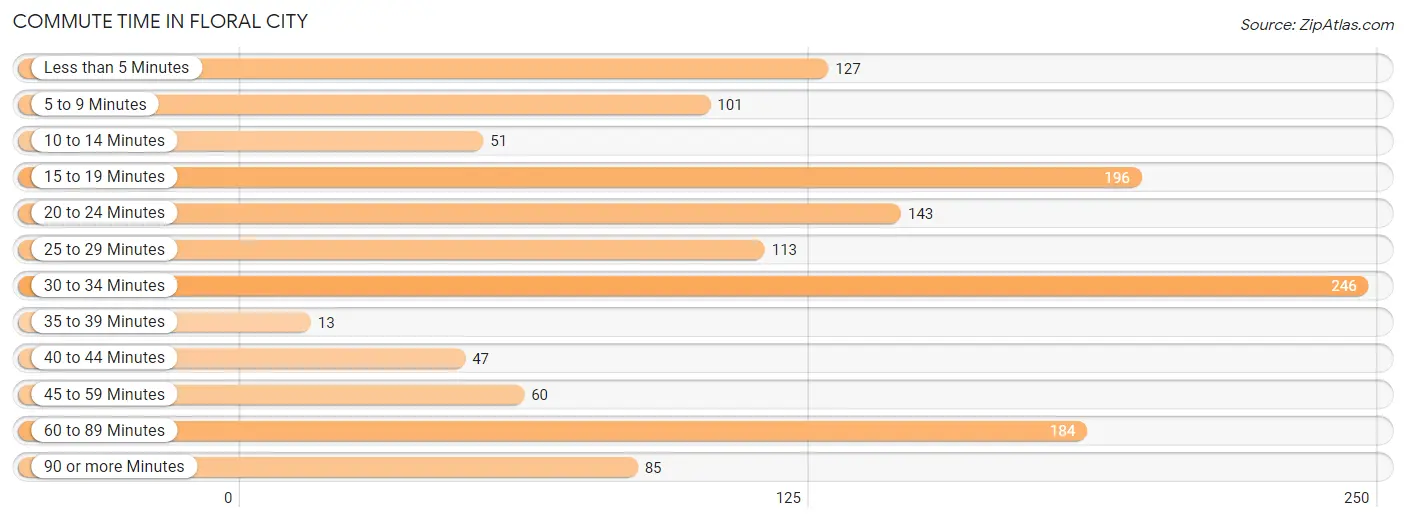
| Commute Time | # Commuters | % Commuters |
| Less than 5 Minutes | 127 | 9.3% |
| 5 to 9 Minutes | 101 | 7.4% |
| 10 to 14 Minutes | 51 | 3.7% |
| 15 to 19 Minutes | 196 | 14.3% |
| 20 to 24 Minutes | 143 | 10.5% |
| 25 to 29 Minutes | 113 | 8.3% |
| 30 to 34 Minutes | 246 | 18.0% |
| 35 to 39 Minutes | 13 | 0.9% |
| 40 to 44 Minutes | 47 | 3.4% |
| 45 to 59 Minutes | 60 | 4.4% |
| 60 to 89 Minutes | 184 | 13.5% |
| 90 or more Minutes | 85 | 6.2% |
Commute Time by Sex in Floral City
The most common commute times in Floral City are 60 to 89 minutes (168 commuters, 20.9%) for males and 15 to 19 minutes (133 commuters, 23.6%) for females.
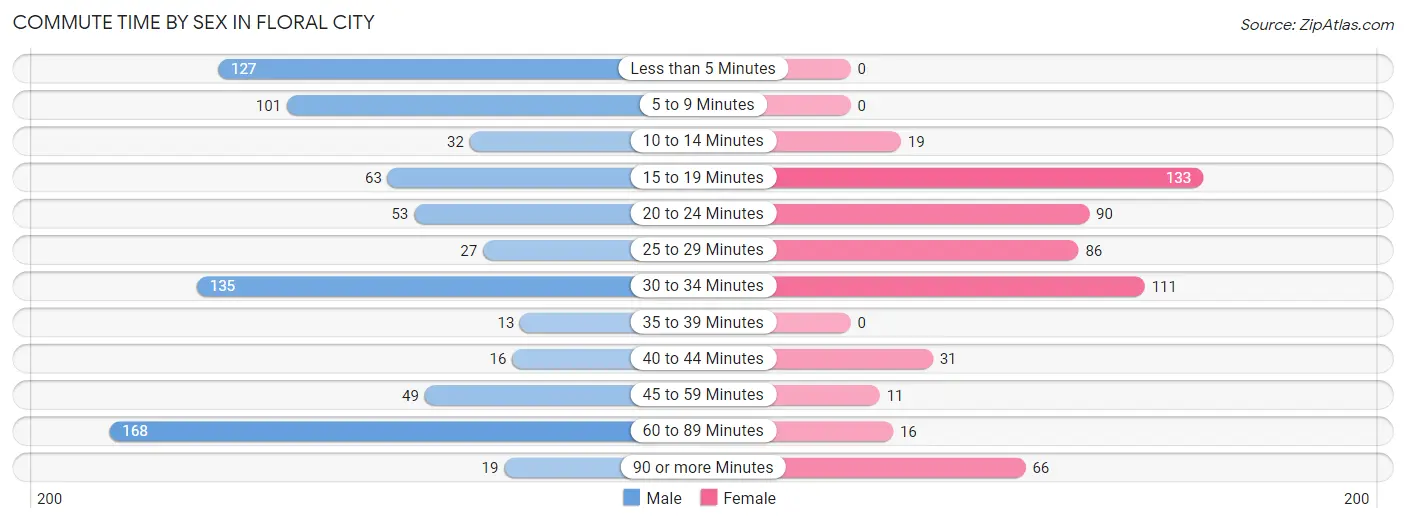
| Commute Time | Male | Female |
| Less than 5 Minutes | 127 (15.8%) | 0 (0.0%) |
| 5 to 9 Minutes | 101 (12.6%) | 0 (0.0%) |
| 10 to 14 Minutes | 32 (4.0%) | 19 (3.4%) |
| 15 to 19 Minutes | 63 (7.9%) | 133 (23.6%) |
| 20 to 24 Minutes | 53 (6.6%) | 90 (16.0%) |
| 25 to 29 Minutes | 27 (3.4%) | 86 (15.3%) |
| 30 to 34 Minutes | 135 (16.8%) | 111 (19.7%) |
| 35 to 39 Minutes | 13 (1.6%) | 0 (0.0%) |
| 40 to 44 Minutes | 16 (2.0%) | 31 (5.5%) |
| 45 to 59 Minutes | 49 (6.1%) | 11 (1.9%) |
| 60 to 89 Minutes | 168 (20.9%) | 16 (2.8%) |
| 90 or more Minutes | 19 (2.4%) | 66 (11.7%) |
Time of Departure to Work by Sex in Floral City
The most frequent times of departure to work in Floral City are 6:00 AM to 6:29 AM (173, 21.5%) for males and 11:00 AM to 11:59 AM (126, 22.4%) for females.
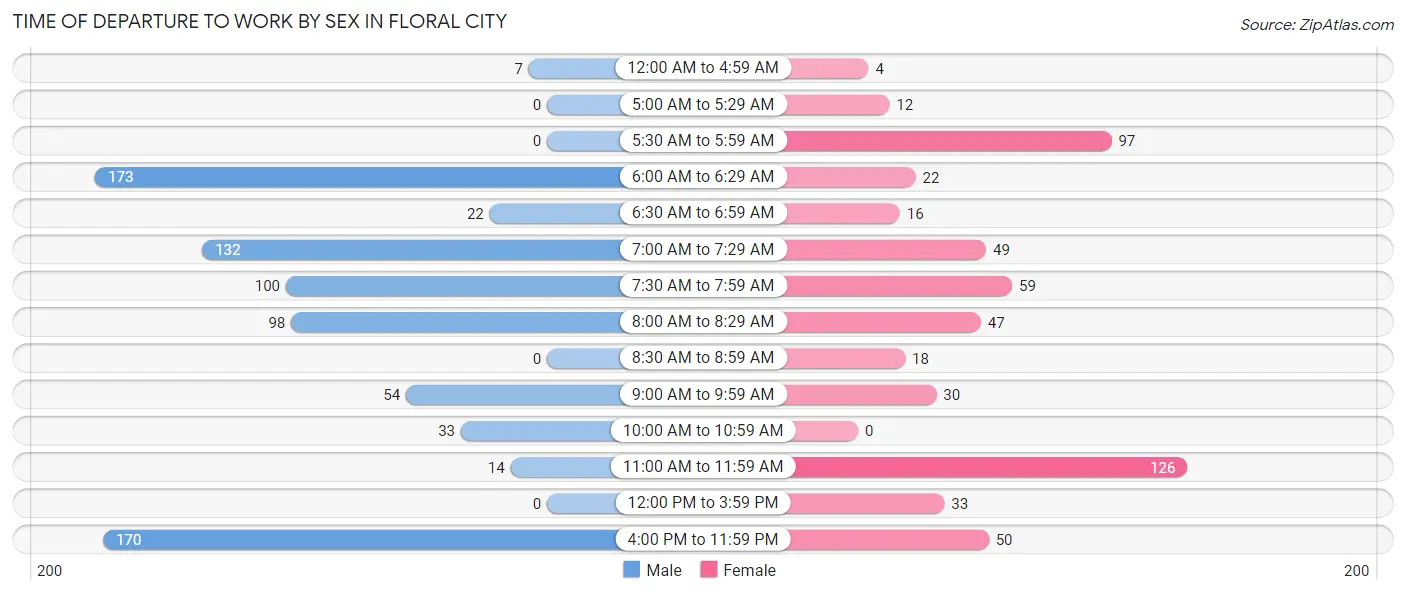
| Time of Departure | Male | Female |
| 12:00 AM to 4:59 AM | 7 (0.9%) | 4 (0.7%) |
| 5:00 AM to 5:29 AM | 0 (0.0%) | 12 (2.1%) |
| 5:30 AM to 5:59 AM | 0 (0.0%) | 97 (17.2%) |
| 6:00 AM to 6:29 AM | 173 (21.5%) | 22 (3.9%) |
| 6:30 AM to 6:59 AM | 22 (2.7%) | 16 (2.8%) |
| 7:00 AM to 7:29 AM | 132 (16.4%) | 49 (8.7%) |
| 7:30 AM to 7:59 AM | 100 (12.4%) | 59 (10.5%) |
| 8:00 AM to 8:29 AM | 98 (12.2%) | 47 (8.4%) |
| 8:30 AM to 8:59 AM | 0 (0.0%) | 18 (3.2%) |
| 9:00 AM to 9:59 AM | 54 (6.7%) | 30 (5.3%) |
| 10:00 AM to 10:59 AM | 33 (4.1%) | 0 (0.0%) |
| 11:00 AM to 11:59 AM | 14 (1.7%) | 126 (22.4%) |
| 12:00 PM to 3:59 PM | 0 (0.0%) | 33 (5.9%) |
| 4:00 PM to 11:59 PM | 170 (21.2%) | 50 (8.9%) |
| Total | 803 (100.0%) | 563 (100.0%) |
Housing Occupancy in Floral City
Occupancy by Ownership in Floral City
Of the total 2,388 dwellings in Floral City, owner-occupied units account for 2,080 (87.1%), while renter-occupied units make up 308 (12.9%).
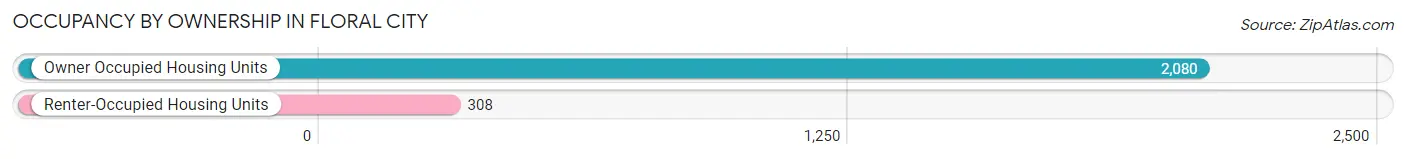
| Occupancy | # Housing Units | % Housing Units |
| Owner Occupied Housing Units | 2,080 | 87.1% |
| Renter-Occupied Housing Units | 308 | 12.9% |
| Total Occupied Housing Units | 2,388 | 100.0% |
Occupancy by Household Size in Floral City
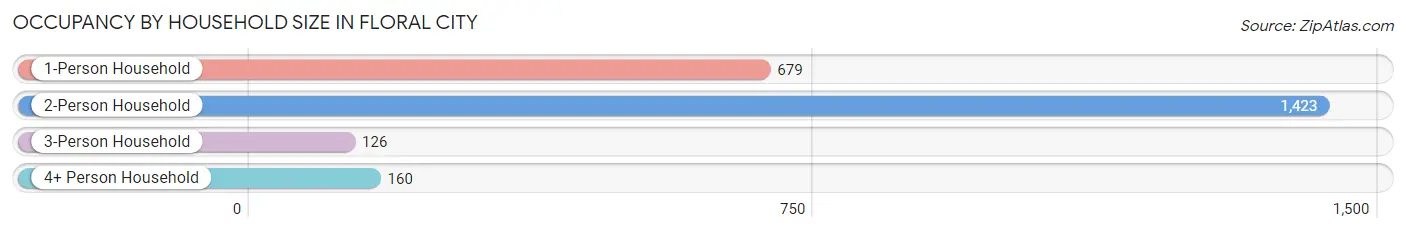
| Household Size | # Housing Units | % Housing Units |
| 1-Person Household | 679 | 28.4% |
| 2-Person Household | 1,423 | 59.6% |
| 3-Person Household | 126 | 5.3% |
| 4+ Person Household | 160 | 6.7% |
| Total Housing Units | 2,388 | 100.0% |
Occupancy by Ownership by Household Size in Floral City
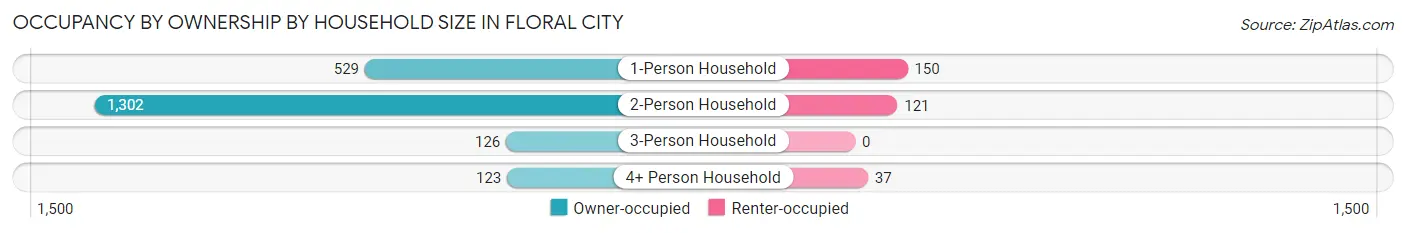
| Household Size | Owner-occupied | Renter-occupied |
| 1-Person Household | 529 (77.9%) | 150 (22.1%) |
| 2-Person Household | 1,302 (91.5%) | 121 (8.5%) |
| 3-Person Household | 126 (100.0%) | 0 (0.0%) |
| 4+ Person Household | 123 (76.9%) | 37 (23.1%) |
| Total Housing Units | 2,080 (87.1%) | 308 (12.9%) |
Occupancy by Educational Attainment in Floral City
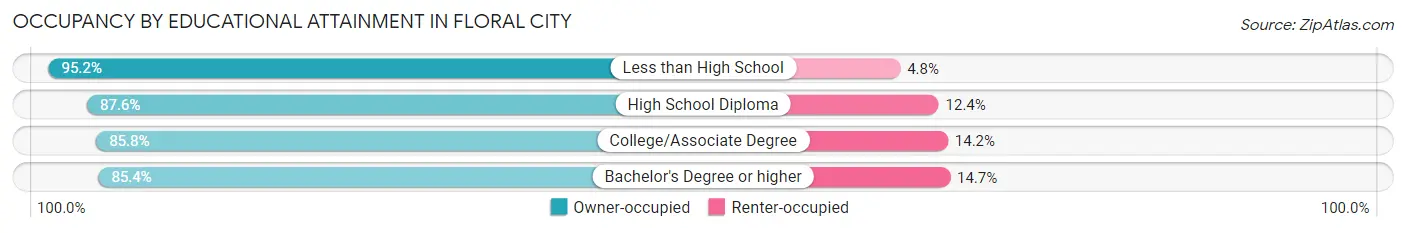
| Household Size | Owner-occupied | Renter-occupied |
| Less than High School | 220 (95.2%) | 11 (4.8%) |
| High School Diploma | 545 (87.6%) | 77 (12.4%) |
| College/Associate Degree | 948 (85.8%) | 157 (14.2%) |
| Bachelor's Degree or higher | 367 (85.4%) | 63 (14.6%) |
Occupancy by Age of Householder in Floral City
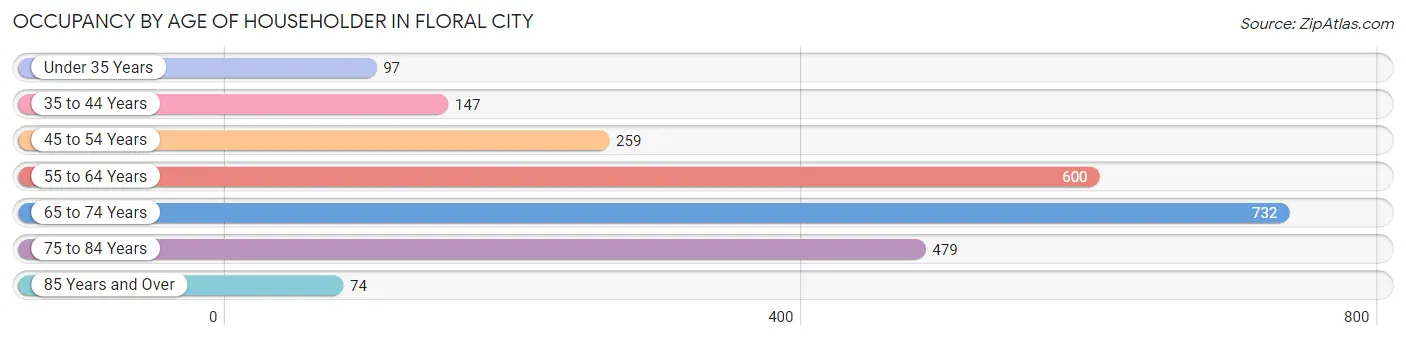
| Age Bracket | # Households | % Households |
| Under 35 Years | 97 | 4.1% |
| 35 to 44 Years | 147 | 6.2% |
| 45 to 54 Years | 259 | 10.8% |
| 55 to 64 Years | 600 | 25.1% |
| 65 to 74 Years | 732 | 30.6% |
| 75 to 84 Years | 479 | 20.1% |
| 85 Years and Over | 74 | 3.1% |
| Total | 2,388 | 100.0% |
Housing Finances in Floral City
Median Income by Occupancy in Floral City
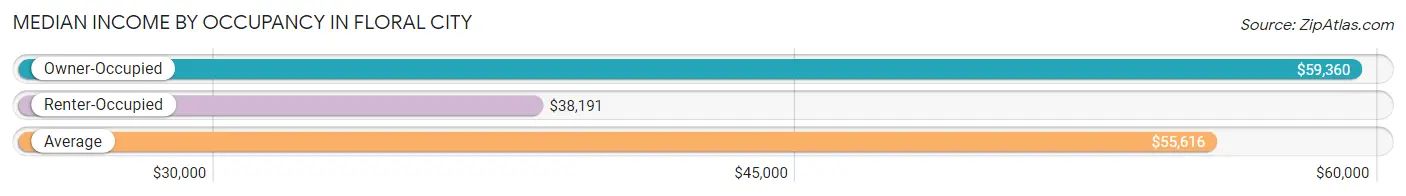
| Occupancy Type | # Households | Median Income |
| Owner-Occupied | 2,080 (87.1%) | $59,360 |
| Renter-Occupied | 308 (12.9%) | $38,191 |
| Average | 2,388 (100.0%) | $55,616 |
Occupancy by Householder Income Bracket in Floral City
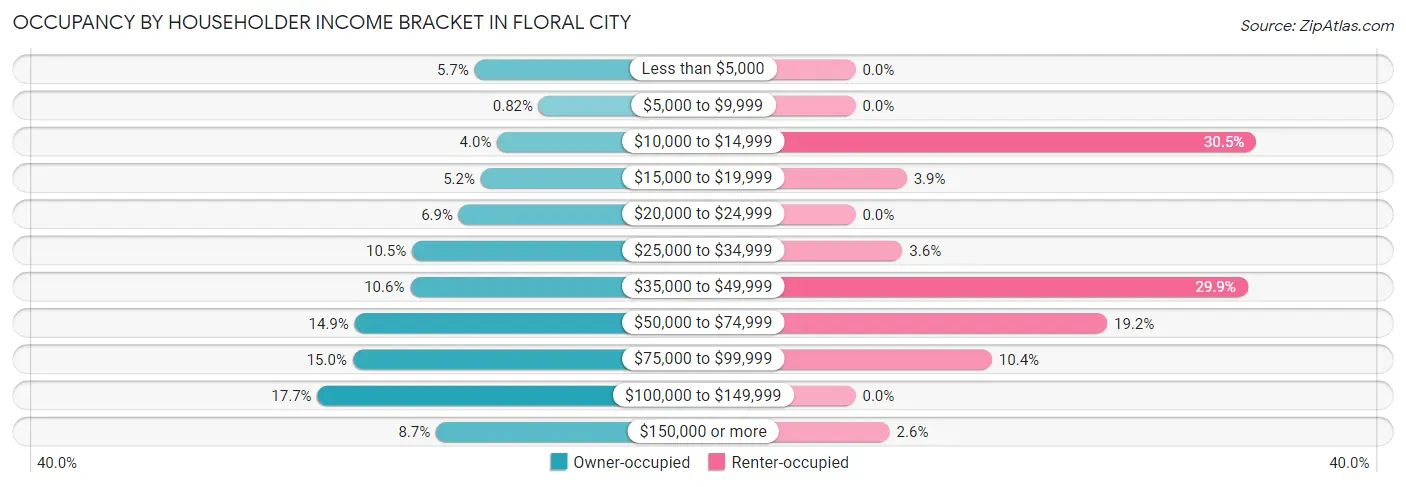
| Income Bracket | Owner-occupied | Renter-occupied |
| Less than $5,000 | 119 (5.7%) | 0 (0.0%) |
| $5,000 to $9,999 | 17 (0.8%) | 0 (0.0%) |
| $10,000 to $14,999 | 83 (4.0%) | 94 (30.5%) |
| $15,000 to $19,999 | 109 (5.2%) | 12 (3.9%) |
| $20,000 to $24,999 | 144 (6.9%) | 0 (0.0%) |
| $25,000 to $34,999 | 218 (10.5%) | 11 (3.6%) |
| $35,000 to $49,999 | 221 (10.6%) | 92 (29.9%) |
| $50,000 to $74,999 | 309 (14.9%) | 59 (19.2%) |
| $75,000 to $99,999 | 312 (15.0%) | 32 (10.4%) |
| $100,000 to $149,999 | 368 (17.7%) | 0 (0.0%) |
| $150,000 or more | 180 (8.6%) | 8 (2.6%) |
| Total | 2,080 (100.0%) | 308 (100.0%) |
Monthly Housing Cost Tiers in Floral City
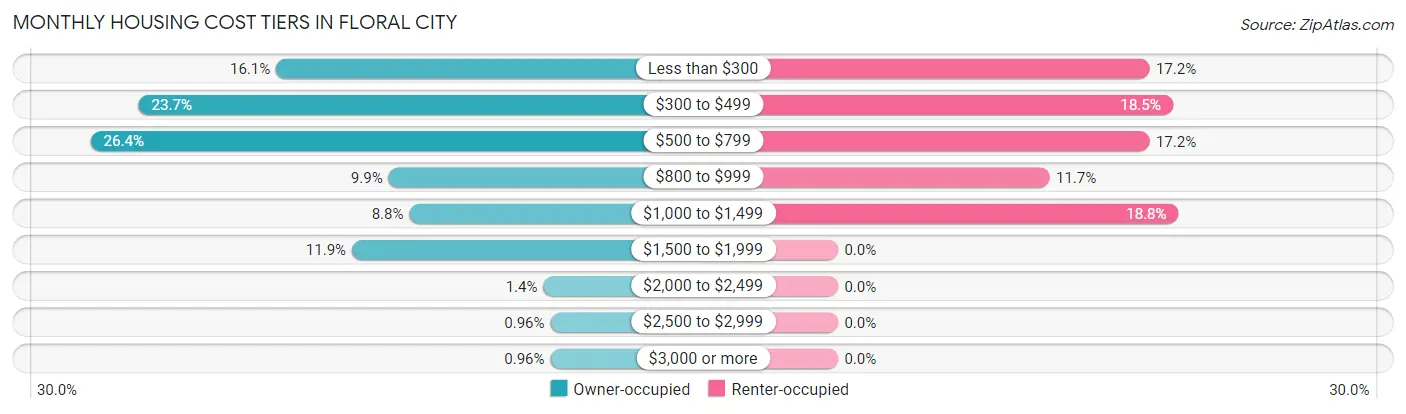
| Monthly Cost | Owner-occupied | Renter-occupied |
| Less than $300 | 335 (16.1%) | 53 (17.2%) |
| $300 to $499 | 493 (23.7%) | 57 (18.5%) |
| $500 to $799 | 548 (26.4%) | 53 (17.2%) |
| $800 to $999 | 206 (9.9%) | 36 (11.7%) |
| $1,000 to $1,499 | 182 (8.7%) | 58 (18.8%) |
| $1,500 to $1,999 | 248 (11.9%) | 0 (0.0%) |
| $2,000 to $2,499 | 28 (1.3%) | 0 (0.0%) |
| $2,500 to $2,999 | 20 (1.0%) | 0 (0.0%) |
| $3,000 or more | 20 (1.0%) | 0 (0.0%) |
| Total | 2,080 (100.0%) | 308 (100.0%) |
Physical Housing Characteristics in Floral City
Housing Structures in Floral City
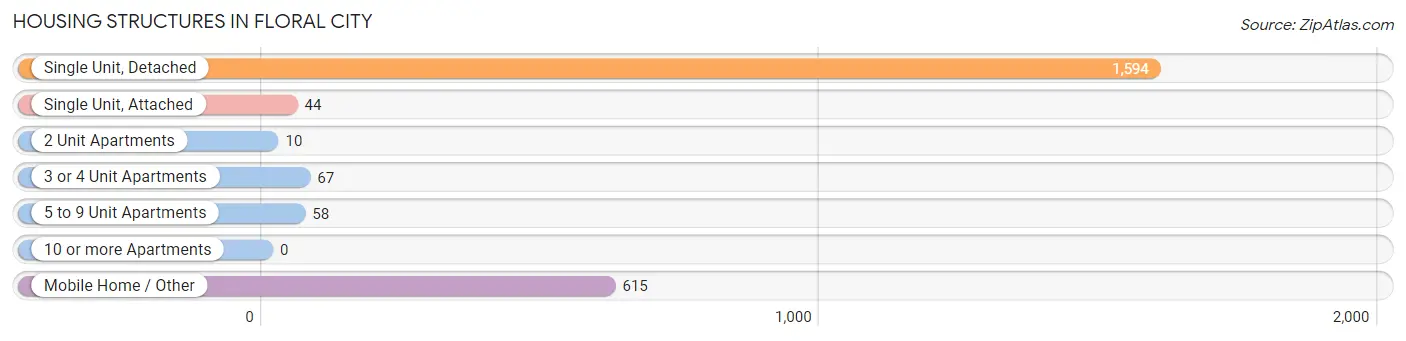
| Structure Type | # Housing Units | % Housing Units |
| Single Unit, Detached | 1,594 | 66.7% |
| Single Unit, Attached | 44 | 1.8% |
| 2 Unit Apartments | 10 | 0.4% |
| 3 or 4 Unit Apartments | 67 | 2.8% |
| 5 to 9 Unit Apartments | 58 | 2.4% |
| 10 or more Apartments | 0 | 0.0% |
| Mobile Home / Other | 615 | 25.8% |
| Total | 2,388 | 100.0% |
Housing Structures by Occupancy in Floral City
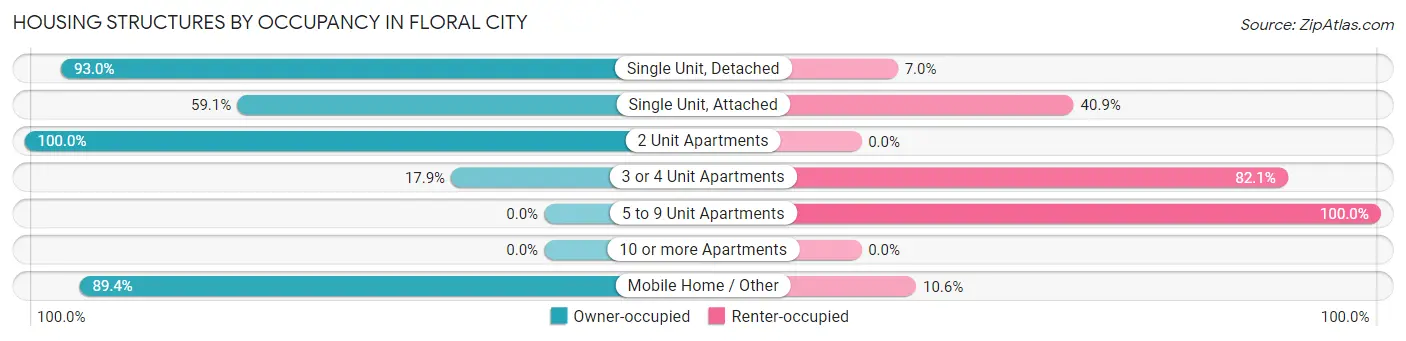
| Structure Type | Owner-occupied | Renter-occupied |
| Single Unit, Detached | 1,482 (93.0%) | 112 (7.0%) |
| Single Unit, Attached | 26 (59.1%) | 18 (40.9%) |
| 2 Unit Apartments | 10 (100.0%) | 0 (0.0%) |
| 3 or 4 Unit Apartments | 12 (17.9%) | 55 (82.1%) |
| 5 to 9 Unit Apartments | 0 (0.0%) | 58 (100.0%) |
| 10 or more Apartments | 0 (0.0%) | 0 (0.0%) |
| Mobile Home / Other | 550 (89.4%) | 65 (10.6%) |
| Total | 2,080 (87.1%) | 308 (12.9%) |
Housing Structures by Number of Rooms in Floral City
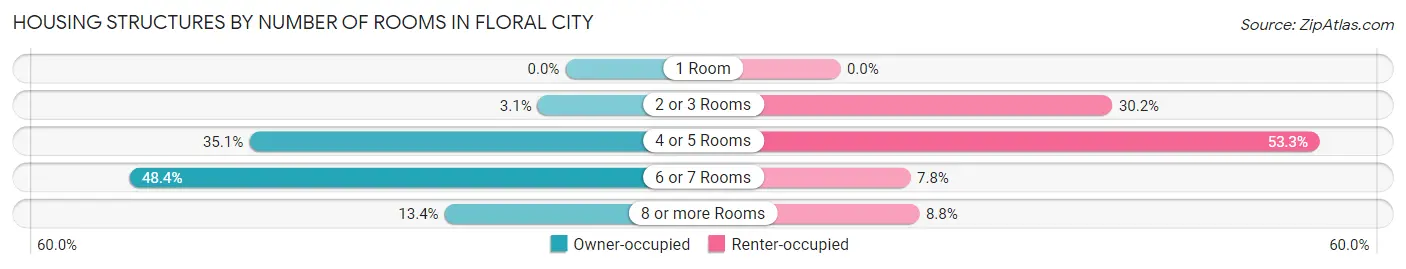
| Number of Rooms | Owner-occupied | Renter-occupied |
| 1 Room | 0 (0.0%) | 0 (0.0%) |
| 2 or 3 Rooms | 64 (3.1%) | 93 (30.2%) |
| 4 or 5 Rooms | 730 (35.1%) | 164 (53.2%) |
| 6 or 7 Rooms | 1,007 (48.4%) | 24 (7.8%) |
| 8 or more Rooms | 279 (13.4%) | 27 (8.8%) |
| Total | 2,080 (100.0%) | 308 (100.0%) |
Housing Structure by Heating Type in Floral City
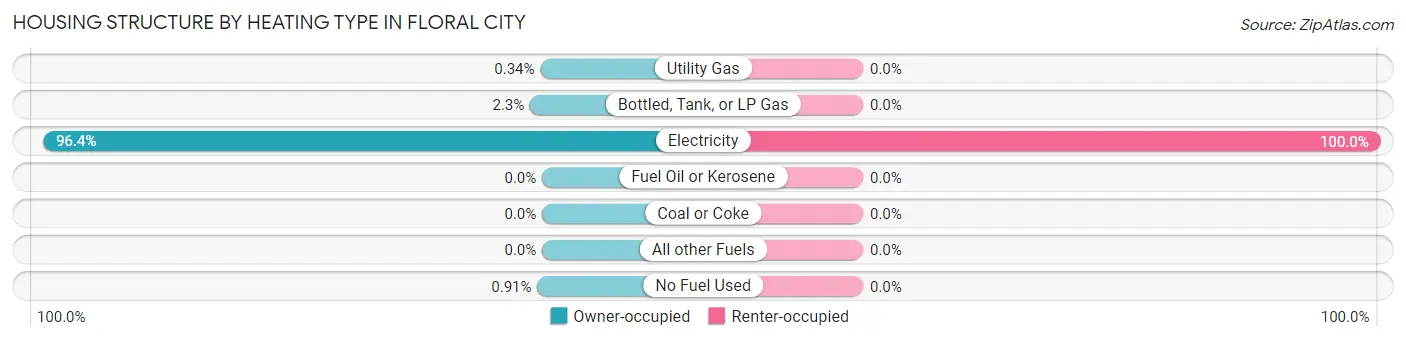
| Heating Type | Owner-occupied | Renter-occupied |
| Utility Gas | 7 (0.3%) | 0 (0.0%) |
| Bottled, Tank, or LP Gas | 48 (2.3%) | 0 (0.0%) |
| Electricity | 2,006 (96.4%) | 308 (100.0%) |
| Fuel Oil or Kerosene | 0 (0.0%) | 0 (0.0%) |
| Coal or Coke | 0 (0.0%) | 0 (0.0%) |
| All other Fuels | 0 (0.0%) | 0 (0.0%) |
| No Fuel Used | 19 (0.9%) | 0 (0.0%) |
| Total | 2,080 (100.0%) | 308 (100.0%) |
Household Vehicle Usage in Floral City
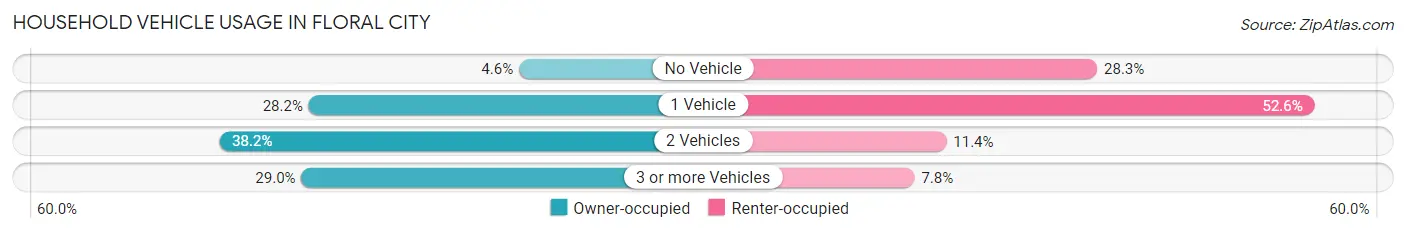
| Vehicles per Household | Owner-occupied | Renter-occupied |
| No Vehicle | 96 (4.6%) | 87 (28.2%) |
| 1 Vehicle | 586 (28.2%) | 162 (52.6%) |
| 2 Vehicles | 795 (38.2%) | 35 (11.4%) |
| 3 or more Vehicles | 603 (29.0%) | 24 (7.8%) |
| Total | 2,080 (100.0%) | 308 (100.0%) |
Real Estate & Mortgages in Floral City
Real Estate and Mortgage Overview in Floral City
| Characteristic | Without Mortgage | With Mortgage |
| Housing Units | 1,245 | 835 |
| Median Property Value | $160,400 | $203,200 |
| Median Household Income | $44,511 | $119 |
| Monthly Housing Costs | $409 | $20 |
| Real Estate Taxes | $1,252 | $11 |
Property Value by Mortgage Status in Floral City
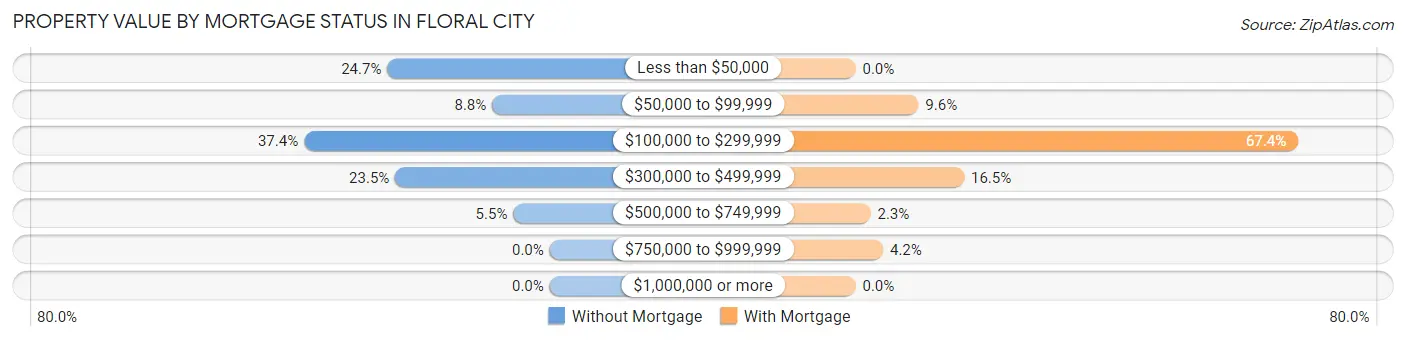
| Property Value | Without Mortgage | With Mortgage |
| Less than $50,000 | 308 (24.7%) | 0 (0.0%) |
| $50,000 to $99,999 | 109 (8.8%) | 80 (9.6%) |
| $100,000 to $299,999 | 466 (37.4%) | 563 (67.4%) |
| $300,000 to $499,999 | 293 (23.5%) | 138 (16.5%) |
| $500,000 to $749,999 | 69 (5.5%) | 19 (2.3%) |
| $750,000 to $999,999 | 0 (0.0%) | 35 (4.2%) |
| $1,000,000 or more | 0 (0.0%) | 0 (0.0%) |
| Total | 1,245 (100.0%) | 835 (100.0%) |
Household Income by Mortgage Status in Floral City
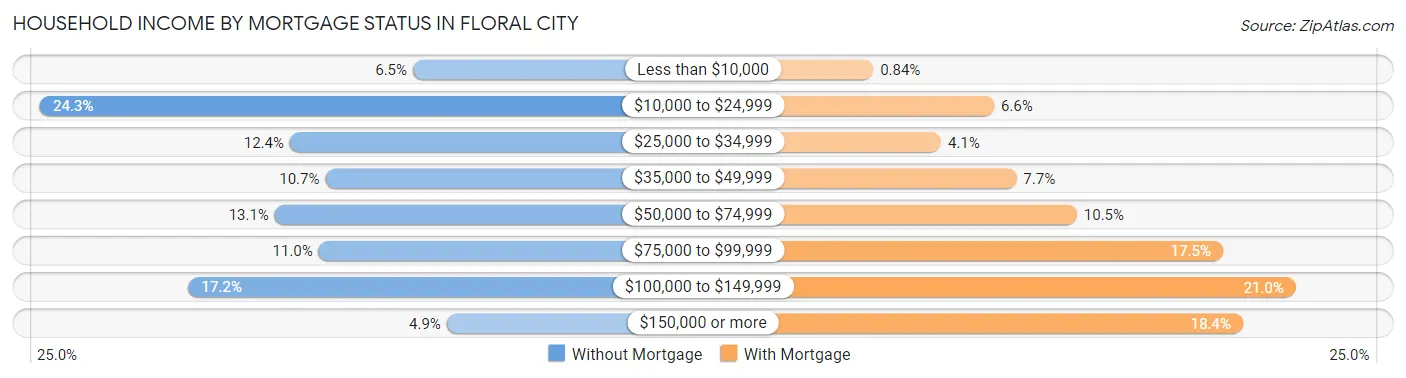
| Household Income | Without Mortgage | With Mortgage |
| Less than $10,000 | 81 (6.5%) | 7 (0.8%) |
| $10,000 to $24,999 | 302 (24.3%) | 55 (6.6%) |
| $25,000 to $34,999 | 154 (12.4%) | 34 (4.1%) |
| $35,000 to $49,999 | 133 (10.7%) | 64 (7.7%) |
| $50,000 to $74,999 | 163 (13.1%) | 88 (10.5%) |
| $75,000 to $99,999 | 137 (11.0%) | 146 (17.5%) |
| $100,000 to $149,999 | 214 (17.2%) | 175 (21.0%) |
| $150,000 or more | 61 (4.9%) | 154 (18.4%) |
| Total | 1,245 (100.0%) | 835 (100.0%) |
Property Value to Household Income Ratio in Floral City
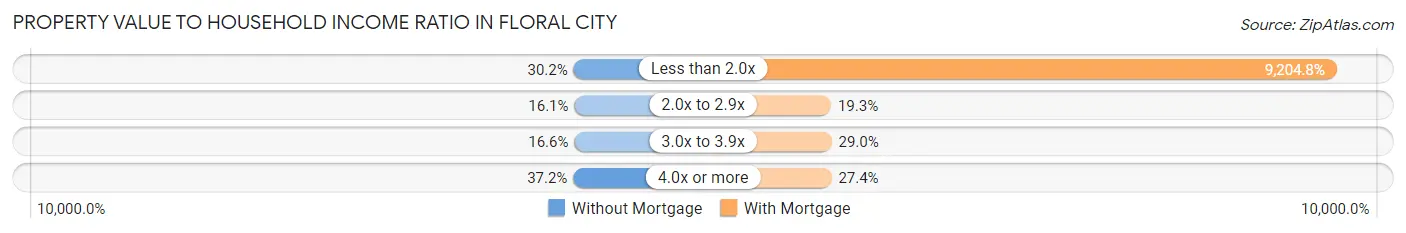
| Value-to-Income Ratio | Without Mortgage | With Mortgage |
| Less than 2.0x | 376 (30.2%) | 76,860 (9,204.8%) |
| 2.0x to 2.9x | 200 (16.1%) | 161 (19.3%) |
| 3.0x to 3.9x | 206 (16.6%) | 242 (29.0%) |
| 4.0x or more | 463 (37.2%) | 229 (27.4%) |
| Total | 1,245 (100.0%) | 835 (100.0%) |
Real Estate Taxes by Mortgage Status in Floral City
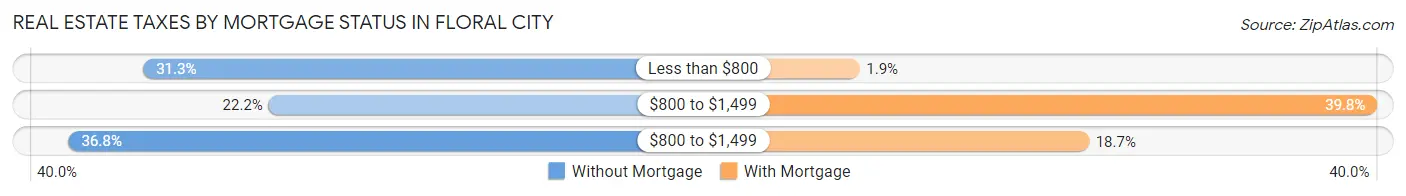
| Property Taxes | Without Mortgage | With Mortgage |
| Less than $800 | 390 (31.3%) | 16 (1.9%) |
| $800 to $1,499 | 276 (22.2%) | 332 (39.8%) |
| $800 to $1,499 | 458 (36.8%) | 156 (18.7%) |
| Total | 1,245 (100.0%) | 835 (100.0%) |
Health & Disability in Floral City
Health Insurance Coverage by Age in Floral City
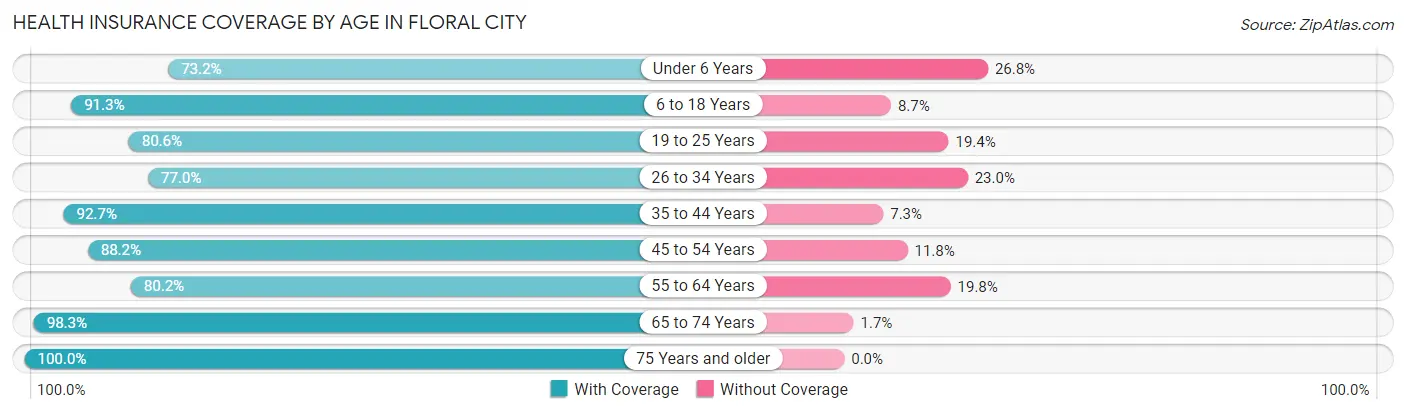
| Age Bracket | With Coverage | Without Coverage |
| Under 6 Years | 82 (73.2%) | 30 (26.8%) |
| 6 to 18 Years | 147 (91.3%) | 14 (8.7%) |
| 19 to 25 Years | 87 (80.6%) | 21 (19.4%) |
| 26 to 34 Years | 331 (77.0%) | 99 (23.0%) |
| 35 to 44 Years | 268 (92.7%) | 21 (7.3%) |
| 45 to 54 Years | 419 (88.2%) | 56 (11.8%) |
| 55 to 64 Years | 950 (80.2%) | 235 (19.8%) |
| 65 to 74 Years | 1,077 (98.3%) | 19 (1.7%) |
| 75 Years and older | 974 (100.0%) | 0 (0.0%) |
| Total | 4,335 (89.7%) | 495 (10.2%) |
Health Insurance Coverage by Citizenship Status in Floral City
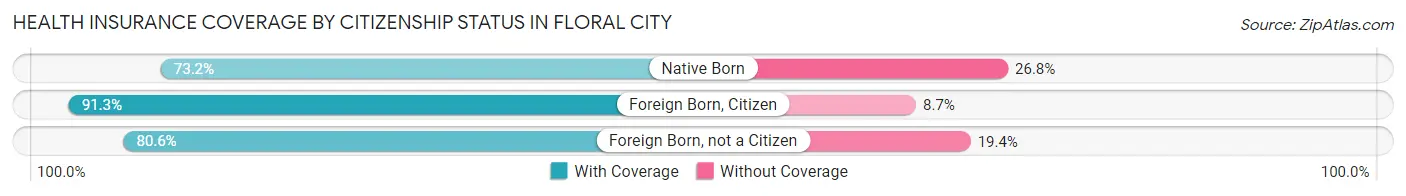
| Citizenship Status | With Coverage | Without Coverage |
| Native Born | 82 (73.2%) | 30 (26.8%) |
| Foreign Born, Citizen | 147 (91.3%) | 14 (8.7%) |
| Foreign Born, not a Citizen | 87 (80.6%) | 21 (19.4%) |
Health Insurance Coverage by Household Income in Floral City

| Household Income | With Coverage | Without Coverage |
| Under $25,000 | 782 (91.0%) | 77 (9.0%) |
| $25,000 to $49,999 | 821 (90.1%) | 90 (9.9%) |
| $50,000 to $74,999 | 775 (86.3%) | 123 (13.7%) |
| $75,000 to $99,999 | 644 (88.0%) | 88 (12.0%) |
| $100,000 and over | 1,303 (92.2%) | 110 (7.8%) |
Public vs Private Health Insurance Coverage by Age in Floral City
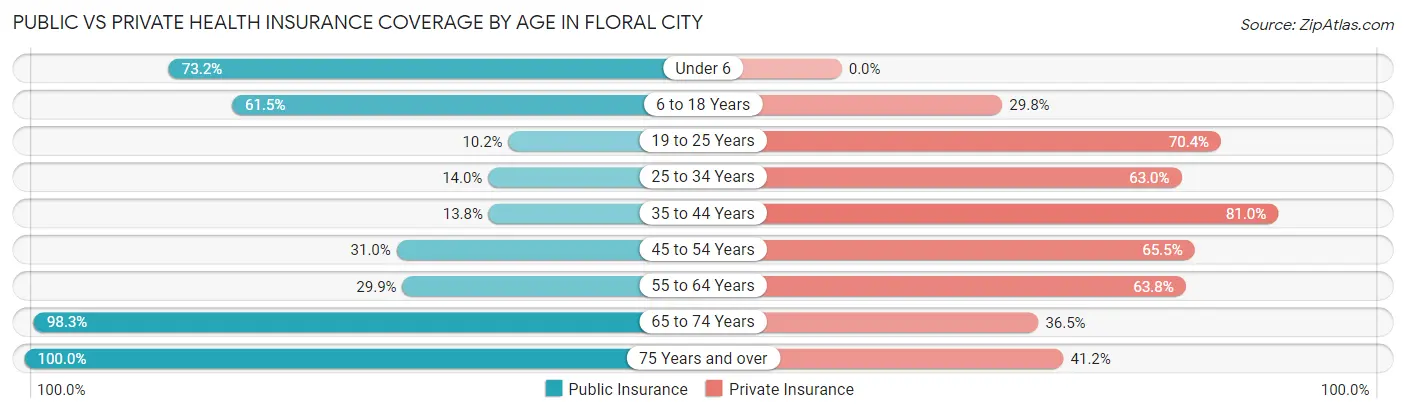
| Age Bracket | Public Insurance | Private Insurance |
| Under 6 | 82 (73.2%) | 0 (0.0%) |
| 6 to 18 Years | 99 (61.5%) | 48 (29.8%) |
| 19 to 25 Years | 11 (10.2%) | 76 (70.4%) |
| 25 to 34 Years | 60 (14.0%) | 271 (63.0%) |
| 35 to 44 Years | 40 (13.8%) | 234 (81.0%) |
| 45 to 54 Years | 147 (30.9%) | 311 (65.5%) |
| 55 to 64 Years | 354 (29.9%) | 756 (63.8%) |
| 65 to 74 Years | 1,077 (98.3%) | 400 (36.5%) |
| 75 Years and over | 974 (100.0%) | 401 (41.2%) |
| Total | 2,844 (58.9%) | 2,497 (51.7%) |
Disability Status by Sex by Age in Floral City
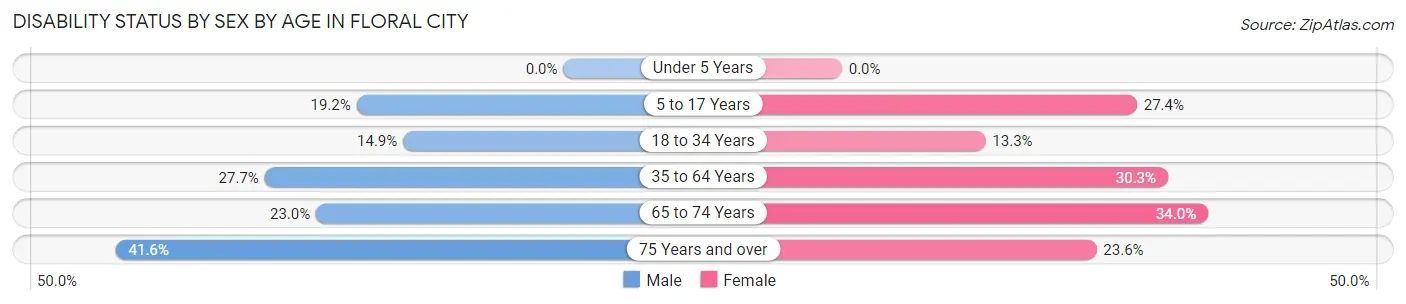
| Age Bracket | Male | Female |
| Under 5 Years | 0 (0.0%) | 0 (0.0%) |
| 5 to 17 Years | 19 (19.2%) | 23 (27.4%) |
| 18 to 34 Years | 51 (14.9%) | 26 (13.3%) |
| 35 to 64 Years | 270 (27.7%) | 295 (30.3%) |
| 65 to 74 Years | 134 (23.0%) | 174 (34.0%) |
| 75 Years and over | 155 (41.5%) | 142 (23.6%) |
Disability Class by Sex by Age in Floral City
Disability Class: Hearing Difficulty
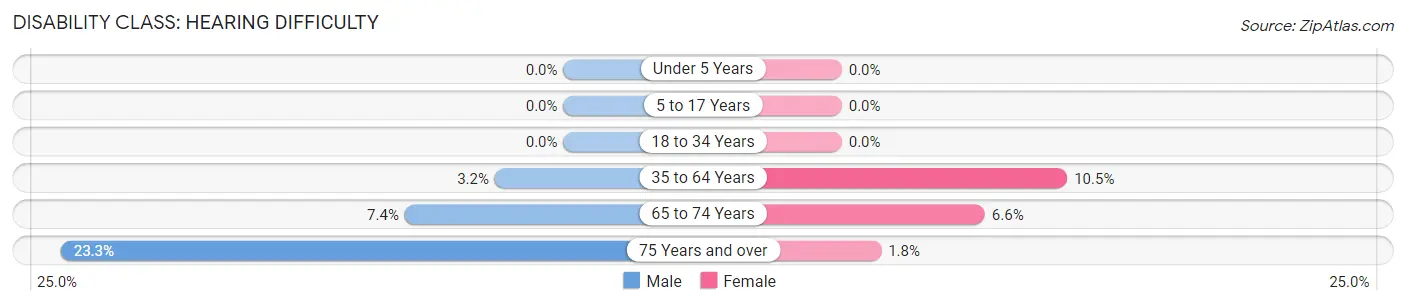
| Age Bracket | Male | Female |
| Under 5 Years | 0 (0.0%) | 0 (0.0%) |
| 5 to 17 Years | 0 (0.0%) | 0 (0.0%) |
| 18 to 34 Years | 0 (0.0%) | 0 (0.0%) |
| 35 to 64 Years | 31 (3.2%) | 102 (10.5%) |
| 65 to 74 Years | 43 (7.4%) | 34 (6.6%) |
| 75 Years and over | 87 (23.3%) | 11 (1.8%) |
Disability Class: Vision Difficulty
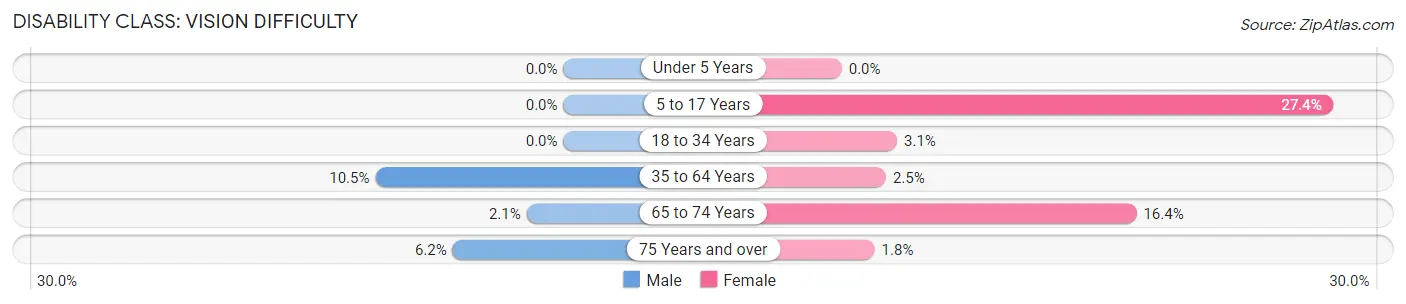
| Age Bracket | Male | Female |
| Under 5 Years | 0 (0.0%) | 0 (0.0%) |
| 5 to 17 Years | 0 (0.0%) | 23 (27.4%) |
| 18 to 34 Years | 0 (0.0%) | 6 (3.1%) |
| 35 to 64 Years | 102 (10.5%) | 24 (2.5%) |
| 65 to 74 Years | 12 (2.1%) | 84 (16.4%) |
| 75 Years and over | 23 (6.2%) | 11 (1.8%) |
Disability Class: Cognitive Difficulty
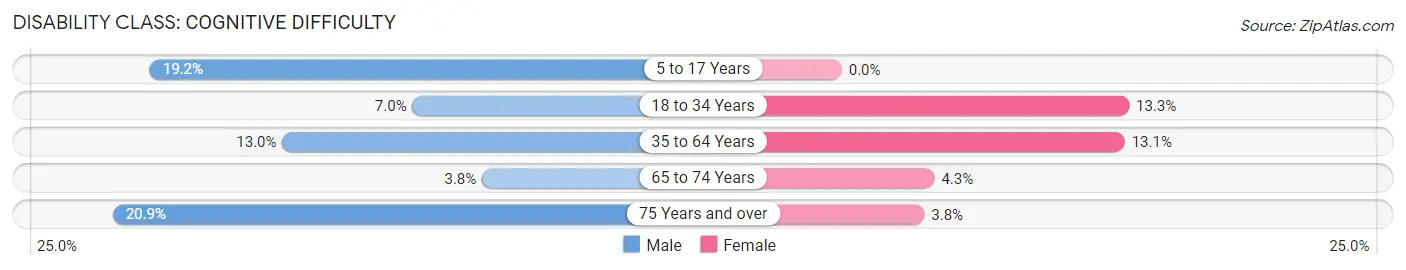
| Age Bracket | Male | Female |
| 5 to 17 Years | 19 (19.2%) | 0 (0.0%) |
| 18 to 34 Years | 24 (7.0%) | 26 (13.3%) |
| 35 to 64 Years | 127 (13.0%) | 128 (13.1%) |
| 65 to 74 Years | 22 (3.8%) | 22 (4.3%) |
| 75 Years and over | 78 (20.9%) | 23 (3.8%) |
Disability Class: Ambulatory Difficulty
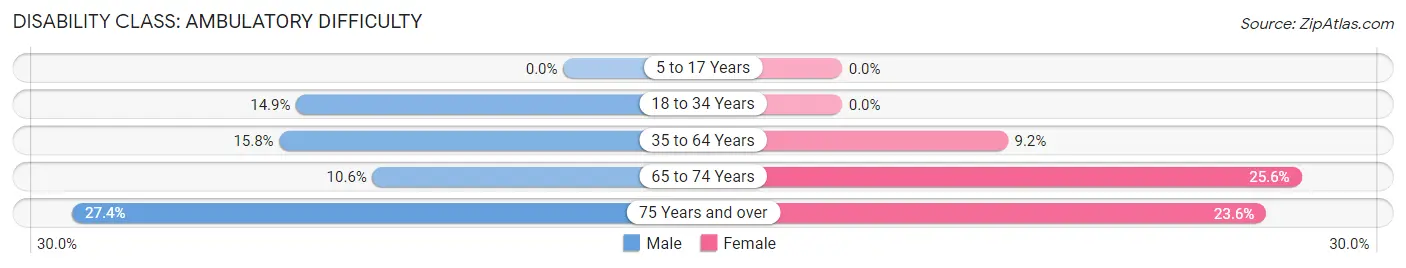
| Age Bracket | Male | Female |
| 5 to 17 Years | 0 (0.0%) | 0 (0.0%) |
| 18 to 34 Years | 51 (14.9%) | 0 (0.0%) |
| 35 to 64 Years | 154 (15.8%) | 90 (9.2%) |
| 65 to 74 Years | 62 (10.6%) | 131 (25.6%) |
| 75 Years and over | 102 (27.4%) | 142 (23.6%) |
Disability Class: Self-Care Difficulty
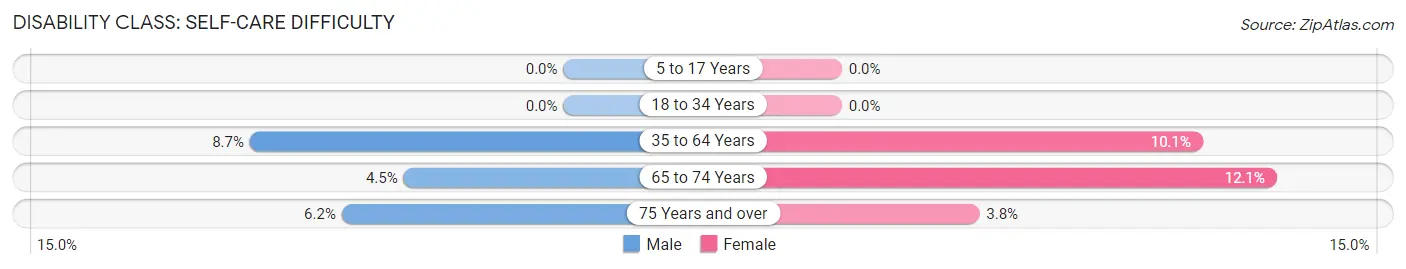
| Age Bracket | Male | Female |
| 5 to 17 Years | 0 (0.0%) | 0 (0.0%) |
| 18 to 34 Years | 0 (0.0%) | 0 (0.0%) |
| 35 to 64 Years | 85 (8.7%) | 98 (10.1%) |
| 65 to 74 Years | 26 (4.4%) | 62 (12.1%) |
| 75 Years and over | 23 (6.2%) | 23 (3.8%) |
Technology Access in Floral City
Computing Device Access in Floral City
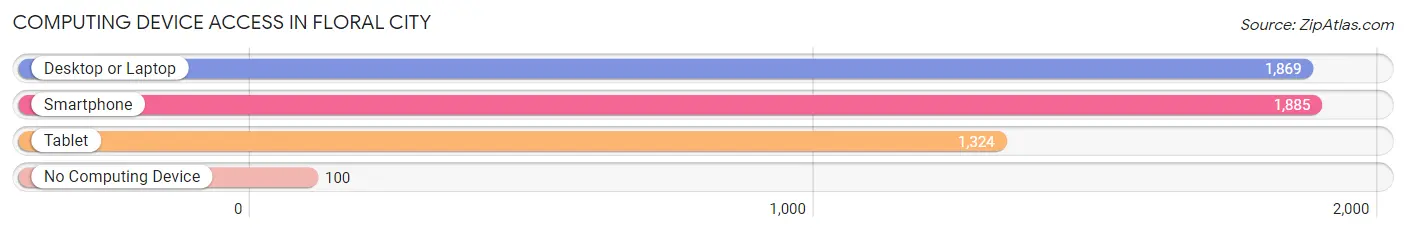
| Device Type | # Households | % Households |
| Desktop or Laptop | 1,869 | 78.3% |
| Smartphone | 1,885 | 78.9% |
| Tablet | 1,324 | 55.4% |
| No Computing Device | 100 | 4.2% |
| Total | 2,388 | 100.0% |
Internet Access in Floral City
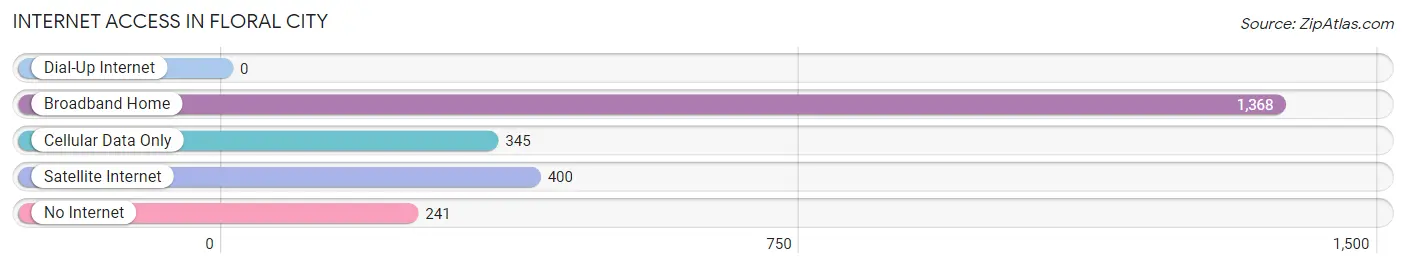
| Internet Type | # Households | % Households |
| Dial-Up Internet | 0 | 0.0% |
| Broadband Home | 1,368 | 57.3% |
| Cellular Data Only | 345 | 14.4% |
| Satellite Internet | 400 | 16.8% |
| No Internet | 241 | 10.1% |
| Total | 2,388 | 100.0% |
Floral City Summary
Floral City is a small unincorporated community located in Citrus County, Florida, United States. It is situated in the Withlacoochee State Forest, approximately 20 miles (32 km) east of Inverness and about 40 miles (64 km) northwest of Tampa. The population was 1,814 at the 2010 census.
History
Floral City was founded in 1883 by Captain John Martin, a former Confederate soldier. He named the town after the abundance of wildflowers that grew in the area. The town was incorporated in 1887 and was the first incorporated town in Citrus County.
In the early 1900s, Floral City was a thriving agricultural community. The town was known for its citrus groves, vegetable farms, and cattle ranches. The town also had a sawmill, a grist mill, and a turpentine still.
In the 1920s, the town began to decline as the citrus industry moved to other parts of the state. The Great Depression further weakened the town’s economy.
In the 1950s, the town began to experience a resurgence as the citrus industry returned to the area. The town also became a popular tourist destination due to its proximity to the Withlacoochee State Forest.
Geography
Floral City is located at 28°45'N 82°25'W (28.75, -82.41). According to the United States Census Bureau, the town has a total area of 1.2 square miles (3.2 km2), all land.
The town is located in the Withlacoochee State Forest, which is a popular destination for camping, fishing, and hiking. The Withlacoochee River runs through the town and is a popular spot for canoeing and kayaking.
Economy
The economy of Floral City is largely based on agriculture and tourism. The town is home to several citrus groves, vegetable farms, and cattle ranches. The town also has several restaurants, shops, and other businesses that cater to tourists.
Demographics
As of the 2010 census, there were 1,814 people, 745 households, and 517 families residing in the town. The population density was 1,521.7 people per square mile (586.7/km2). There were 845 housing units at an average density of 708.3 per square mile (273.7/km2). The racial makeup of the town was 97.2% White, 0.7% African American, 0.3% Native American, 0.2% Asian, 0.2% from other races, and 1.5% from two or more races. Hispanic or Latino of any race were 3.2% of the population.
There were 745 households, out of which 24.2% had children under the age of 18 living with them, 51.2% were married couples living together, 11.7% had a female householder with no husband present, and 32.2% were non-families. 27.2% of all households were made up of individuals, and 14.2% had someone living alone who was 65 years of age or older. The average household size was 2.44 and the average family size was 2.94.
In the town, the population was spread out, with 22.2% under the age of 18, 6.2% from 18 to 24, 24.2% from 25 to 44, 25.2% from 45 to 64, and 22.2% who were 65 years of age or older. The median age was 43 years. For every 100 females, there were 95.2 males. For every 100 females age 18 and over, there were 91.2 males.
The median income for a household in the town was $30,938, and the median income for a family was $36,250. Males had a median income of $30,000 versus $20,000 for females. The per capita income for the town was $17,845. About 11.2% of families and 14.2% of the population were below the poverty line, including 19.2% of those under age 18 and 8.2% of those age 65 or over.
Common Questions
What is Per Capita Income in Floral City?
Per Capita income in Floral City is $35,060.
What is the Median Family Income in Floral City?
Median Family Income in Floral City is $79,250.
What is the Median Household income in Floral City?
Median Household Income in Floral City is $55,616.
What is Income or Wage Gap in Floral City?
Income or Wage Gap in Floral City is 12.9%.
Women in Floral City earn 87.1 cents for every dollar earned by a man.
What is Family Income Deficit in Floral City?
Family Income Deficit in Floral City is $11,571.
Families that are below poverty line in Floral City earn $11,571 less on average than the poverty threshold level.
What is Inequality or Gini Index in Floral City?
Inequality or Gini Index in Floral City is 0.45.
What is the Total Population of Floral City?
Total Population of Floral City is 4,830.
What is the Total Male Population of Floral City?
Total Male Population of Floral City is 2,389.
What is the Total Female Population of Floral City?
Total Female Population of Floral City is 2,441.
What is the Ratio of Males per 100 Females in Floral City?
There are 97.87 Males per 100 Females in Floral City.
What is the Ratio of Females per 100 Males in Floral City?
There are 102.18 Females per 100 Males in Floral City.
What is the Median Population Age in Floral City?
Median Population Age in Floral City is 61.9 Years.
What is the Average Family Size in Floral City
Average Family Size in Floral City is 2.4 People.
What is the Average Household Size in Floral City
Average Household Size in Floral City is 2.0 People.
How Large is the Labor Force in Floral City?
There are 1,681 People in the Labor Forcein in Floral City.
What is the Percentage of People in the Labor Force in Floral City?
36.7% of People are in the Labor Force in Floral City.
What is the Unemployment Rate in Floral City?
Unemployment Rate in Floral City is 4.5%.