Homeland, FL Map & Demographics
Homeland Map
Homeland Overview
$31,005
PER CAPITA INCOME
$66,797
AVG FAMILY INCOME
$65,469
AVG HOUSEHOLD INCOME
0.31
INEQUALITY / GINI INDEX
274
TOTAL POPULATION
157
MALE POPULATION
117
FEMALE POPULATION
134.19
MALES / 100 FEMALES
74.52
FEMALES / 100 MALES
37.8
MEDIAN AGE
2.8
AVG FAMILY SIZE
2.7
AVG HOUSEHOLD SIZE
111
LABOR FORCE [ PEOPLE ]
47.8%
PERCENT IN LABOR FORCE
Homeland Zip Codes
Homeland Area Codes
Income in Homeland
Income Overview in Homeland
Per Capita Income in Homeland is $31,005, while median incomes of families and households are $66,797 and $65,469 respectively.
| Characteristic | Number | Measure |
| Per Capita Income | 274 | $31,005 |
| Median Family Income | 73 | $66,797 |
| Mean Family Income | 73 | $90,511 |
| Median Household Income | 102 | $65,469 |
| Mean Household Income | 102 | $81,683 |
| Income Deficit | 73 | $0 |
| Wage / Income Gap (%) | 274 | 0.00% |
| Wage / Income Gap ($) | 274 | 100.00¢ per $1 |
| Gini / Inequality Index | 274 | 0.31 |
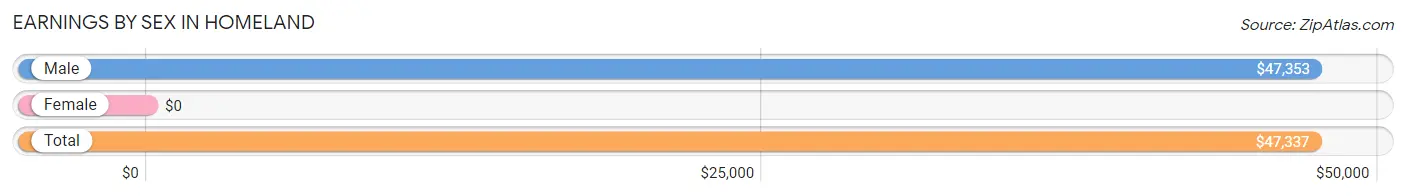
Earnings by Sex in Homeland
| Sex | Number | Average Earnings |
| Male | 70 (63.1%) | $47,353 |
| Female | 41 (36.9%) | $0 |
| Total | 111 (100.0%) | $47,337 |
Earnings by Sex by Income Bracket in Homeland
The most common earnings brackets in Homeland are $45,000 to $49,999 for men (23 | 32.9%) and $75,000 to $99,999 for women (14 | 34.2%).

| Income | Male | Female |
| $2,499 or less | 0 (0.0%) | 0 (0.0%) |
| $2,500 to $4,999 | 11 (15.7%) | 10 (24.4%) |
| $5,000 to $7,499 | 0 (0.0%) | 0 (0.0%) |
| $7,500 to $9,999 | 0 (0.0%) | 0 (0.0%) |
| $10,000 to $12,499 | 0 (0.0%) | 0 (0.0%) |
| $12,500 to $14,999 | 0 (0.0%) | 0 (0.0%) |
| $15,000 to $17,499 | 0 (0.0%) | 0 (0.0%) |
| $17,500 to $19,999 | 0 (0.0%) | 0 (0.0%) |
| $20,000 to $22,499 | 0 (0.0%) | 0 (0.0%) |
| $22,500 to $24,999 | 0 (0.0%) | 0 (0.0%) |
| $25,000 to $29,999 | 8 (11.4%) | 0 (0.0%) |
| $30,000 to $34,999 | 0 (0.0%) | 5 (12.2%) |
| $35,000 to $39,999 | 0 (0.0%) | 0 (0.0%) |
| $40,000 to $44,999 | 0 (0.0%) | 0 (0.0%) |
| $45,000 to $49,999 | 23 (32.9%) | 6 (14.6%) |
| $50,000 to $54,999 | 0 (0.0%) | 0 (0.0%) |
| $55,000 to $64,999 | 5 (7.1%) | 6 (14.6%) |
| $65,000 to $74,999 | 16 (22.9%) | 0 (0.0%) |
| $75,000 to $99,999 | 7 (10.0%) | 14 (34.2%) |
| $100,000+ | 0 (0.0%) | 0 (0.0%) |
| Total | 70 (100.0%) | 41 (100.0%) |
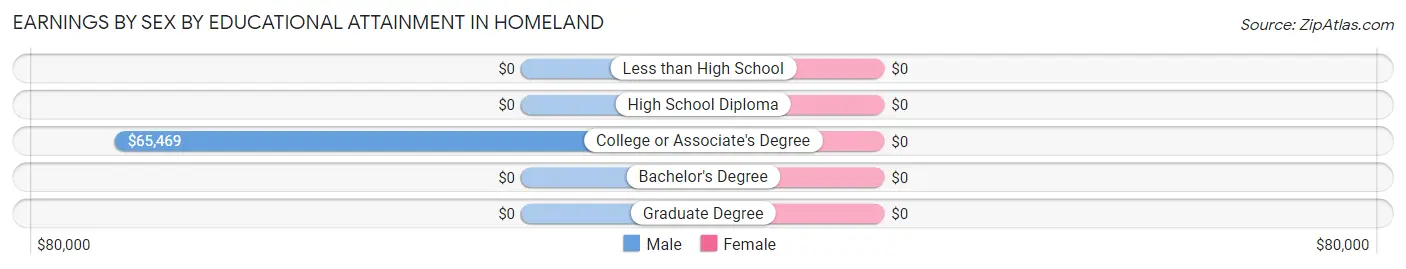
Earnings by Sex by Educational Attainment in Homeland
| Educational Attainment | Male Income | Female Income |
| Less than High School | - | - |
| High School Diploma | - | - |
| College or Associate's Degree | $65,469 | $0 |
| Bachelor's Degree | - | - |
| Graduate Degree | - | - |
| Total | $56,250 | $0 |
Family Income in Homeland
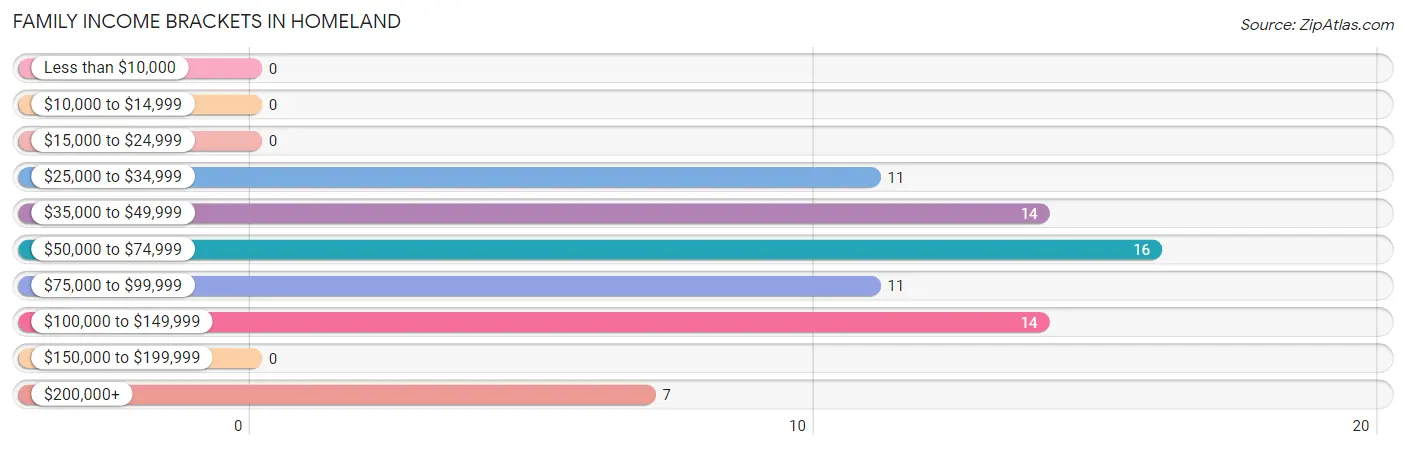
Family Income Brackets in Homeland
According to the Homeland family income data, there are 16 families falling into the $50,000 to $74,999 income range, which is the most common income bracket and makes up 21.9% of all families.
| Income Bracket | # Families | % Families |
| Less than $10,000 | 0 | 0.0% |
| $10,000 to $14,999 | 0 | 0.0% |
| $15,000 to $24,999 | 0 | 0.0% |
| $25,000 to $34,999 | 11 | 15.1% |
| $35,000 to $49,999 | 14 | 19.2% |
| $50,000 to $74,999 | 16 | 21.9% |
| $75,000 to $99,999 | 11 | 15.1% |
| $100,000 to $149,999 | 14 | 19.2% |
| $150,000 to $199,999 | 0 | 0.0% |
| $200,000+ | 7 | 9.6% |
Family Income by Famaliy Size in Homeland
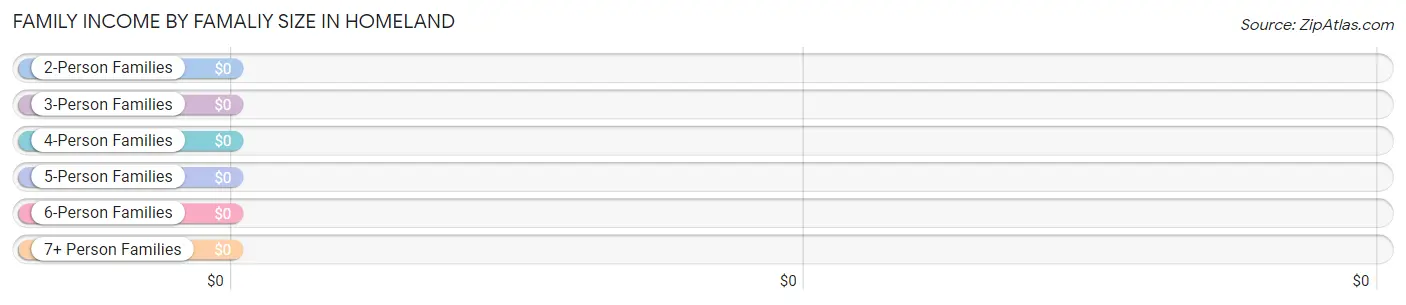
| Income Bracket | # Families | Median Income |
| 2-Person Families | 51 (69.9%) | $0 |
| 3-Person Families | 6 (8.2%) | $0 |
| 4-Person Families | 0 (0.0%) | $0 |
| 5-Person Families | 16 (21.9%) | $0 |
| 6-Person Families | 0 (0.0%) | $0 |
| 7+ Person Families | 0 (0.0%) | $0 |
| Total | 73 (100.0%) | $66,797 |
Family Income by Number of Earners in Homeland
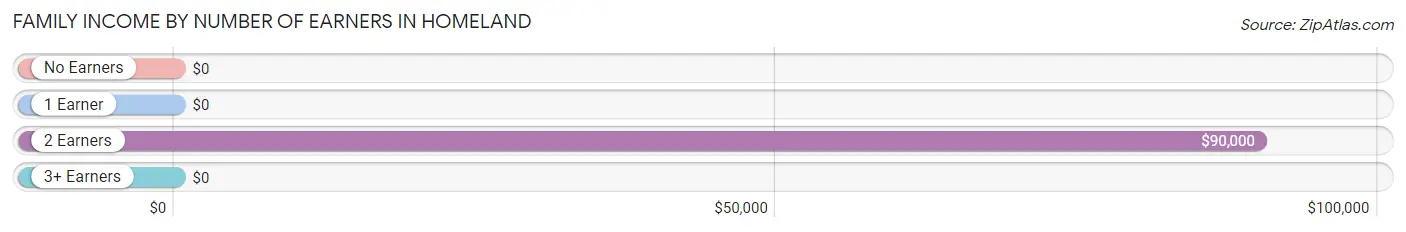
| Number of Earners | # Families | Median Income |
| No Earners | 0 (0.0%) | $0 |
| 1 Earner | 47 (64.4%) | $0 |
| 2 Earners | 26 (35.6%) | $90,000 |
| 3+ Earners | 0 (0.0%) | $0 |
| Total | 73 (100.0%) | $66,797 |
Household Income in Homeland
Household Income Brackets in Homeland
With 46 households falling in the category, the $50,000 to $74,999 income range is the most frequent in Homeland, accounting for 45.1% of all households.
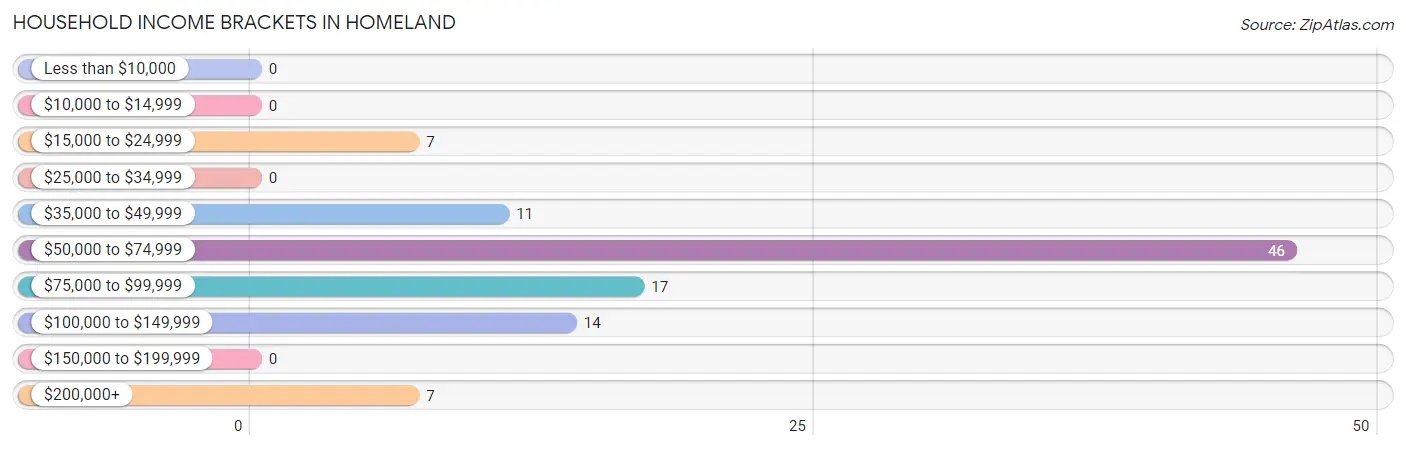
| Income Bracket | # Households | % Households |
| Less than $10,000 | 0 | 0.0% |
| $10,000 to $14,999 | 0 | 0.0% |
| $15,000 to $24,999 | 7 | 6.9% |
| $25,000 to $34,999 | 0 | 0.0% |
| $35,000 to $49,999 | 11 | 10.8% |
| $50,000 to $74,999 | 46 | 45.1% |
| $75,000 to $99,999 | 17 | 16.7% |
| $100,000 to $149,999 | 14 | 13.7% |
| $150,000 to $199,999 | 0 | 0.0% |
| $200,000+ | 7 | 6.9% |
Household Income by Householder Age in Homeland
The median household income in Homeland is $65,469, with the highest median household income of $145,893 found in the 45 to 64 years age bracket for the primary householder. A total of 32 households (31.4%) fall into this category. Meanwhile, the 15 to 24 years age bracket for the primary householder has the lowest median household income of $0, with 8 households (7.8%) in this group.
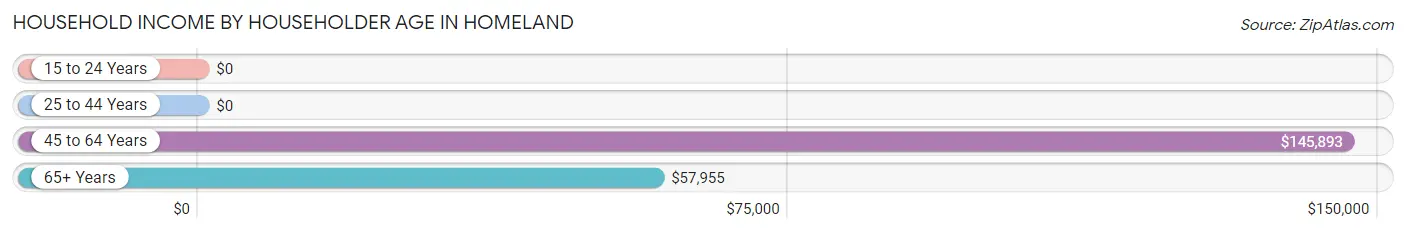
| Income Bracket | # Households | Median Income |
| 15 to 24 Years | 8 (7.8%) | $0 |
| 25 to 44 Years | 22 (21.6%) | $0 |
| 45 to 64 Years | 32 (31.4%) | $145,893 |
| 65+ Years | 40 (39.2%) | $57,955 |
| Total | 102 (100.0%) | $65,469 |
Poverty in Homeland
Income Below Poverty by Sex and Age in Homeland
With 3.8% poverty level for males and 15.4% for females among the residents of Homeland, 65 to 74 year old males and 18 to 24 year old females are the most vulnerable to poverty, with 6 males (35.3%) and 11 females (100.0%) in their respective age groups living below the poverty level.
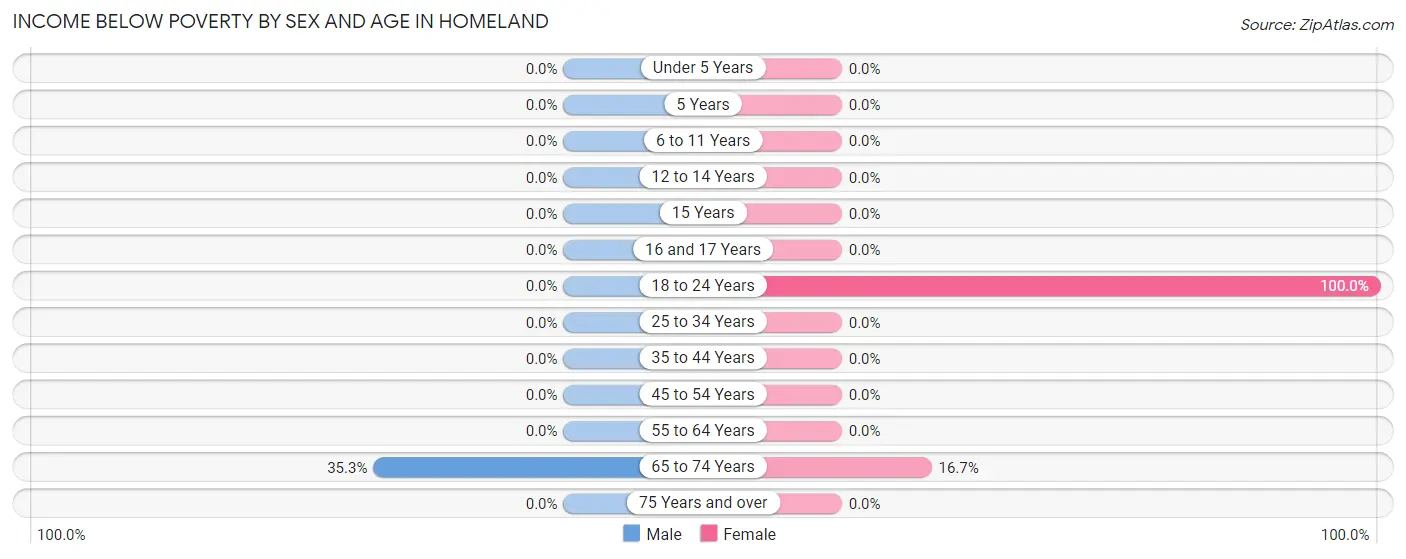
| Age Bracket | Male | Female |
| Under 5 Years | 0 (0.0%) | 0 (0.0%) |
| 5 Years | 0 (0.0%) | 0 (0.0%) |
| 6 to 11 Years | 0 (0.0%) | 0 (0.0%) |
| 12 to 14 Years | 0 (0.0%) | 0 (0.0%) |
| 15 Years | 0 (0.0%) | 0 (0.0%) |
| 16 and 17 Years | 0 (0.0%) | 0 (0.0%) |
| 18 to 24 Years | 0 (0.0%) | 11 (100.0%) |
| 25 to 34 Years | 0 (0.0%) | 0 (0.0%) |
| 35 to 44 Years | 0 (0.0%) | 0 (0.0%) |
| 45 to 54 Years | 0 (0.0%) | 0 (0.0%) |
| 55 to 64 Years | 0 (0.0%) | 0 (0.0%) |
| 65 to 74 Years | 6 (35.3%) | 7 (16.7%) |
| 75 Years and over | 0 (0.0%) | 0 (0.0%) |
| Total | 6 (3.8%) | 18 (15.4%) |
Income Above Poverty by Sex and Age in Homeland
According to the poverty statistics in Homeland, males aged under 5 years and females aged 25 to 34 years are the age groups that are most secure financially, with 100.0% of males and 100.0% of females in these age groups living above the poverty line.
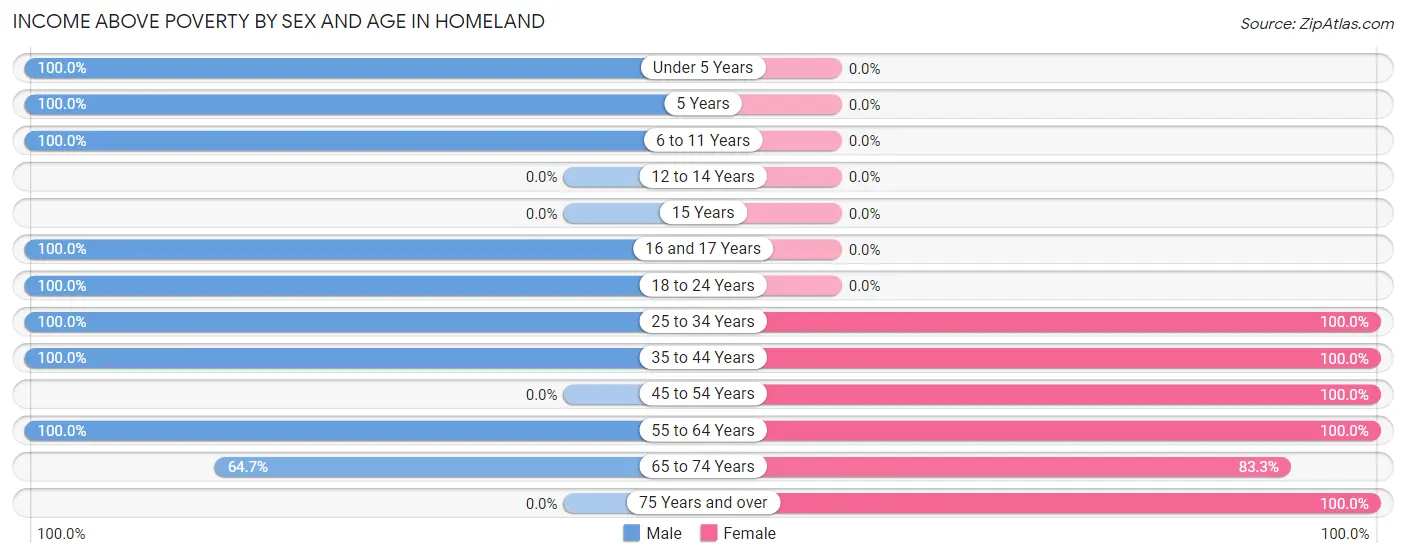
| Age Bracket | Male | Female |
| Under 5 Years | 19 (100.0%) | 0 (0.0%) |
| 5 Years | 6 (100.0%) | 0 (0.0%) |
| 6 to 11 Years | 17 (100.0%) | 0 (0.0%) |
| 12 to 14 Years | 0 (0.0%) | 0 (0.0%) |
| 15 Years | 0 (0.0%) | 0 (0.0%) |
| 16 and 17 Years | 14 (100.0%) | 0 (0.0%) |
| 18 to 24 Years | 19 (100.0%) | 0 (0.0%) |
| 25 to 34 Years | 17 (100.0%) | 6 (100.0%) |
| 35 to 44 Years | 16 (100.0%) | 16 (100.0%) |
| 45 to 54 Years | 0 (0.0%) | 5 (100.0%) |
| 55 to 64 Years | 32 (100.0%) | 26 (100.0%) |
| 65 to 74 Years | 11 (64.7%) | 35 (83.3%) |
| 75 Years and over | 0 (0.0%) | 11 (100.0%) |
| Total | 151 (96.2%) | 99 (84.6%) |
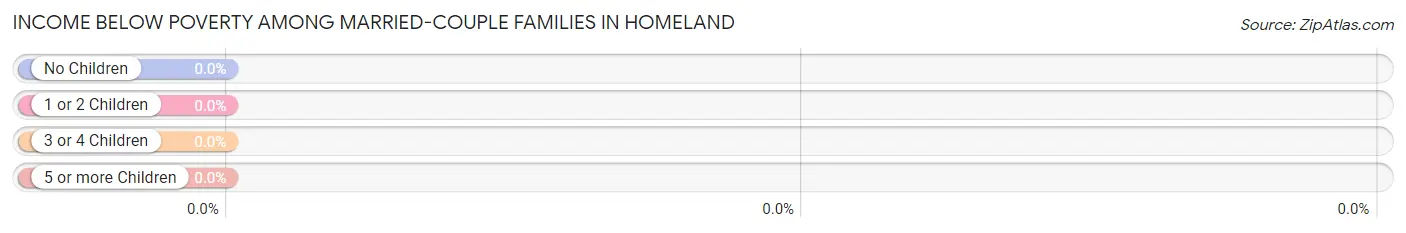
Income Below Poverty Among Married-Couple Families in Homeland
| Children | Above Poverty | Below Poverty |
| No Children | 43 (100.0%) | 0 (0.0%) |
| 1 or 2 Children | 0 (0.0%) | 0 (0.0%) |
| 3 or 4 Children | 16 (100.0%) | 0 (0.0%) |
| 5 or more Children | 0 (0.0%) | 0 (0.0%) |
| Total | 59 (100.0%) | 0 (0.0%) |
Income Below Poverty Among Single-Parent Households in Homeland
| Children | Single Father | Single Mother |
| No Children | 0 (0.0%) | 0 (0.0%) |
| 1 or 2 Children | 0 (0.0%) | 0 (0.0%) |
| 3 or 4 Children | 0 (0.0%) | 0 (0.0%) |
| 5 or more Children | 0 (0.0%) | 0 (0.0%) |
| Total | 0 (0.0%) | 0 (0.0%) |
Income Below Poverty Among Married-Couple vs Single-Parent Households in Homeland
| Children | Married-Couple Families | Single-Parent Households |
| No Children | 0 (0.0%) | 0 (0.0%) |
| 1 or 2 Children | 0 (0.0%) | 0 (0.0%) |
| 3 or 4 Children | 0 (0.0%) | 0 (0.0%) |
| 5 or more Children | 0 (0.0%) | 0 (0.0%) |
| Total | 0 (0.0%) | 0 (0.0%) |
Race in Homeland
The most populous races in Homeland are White / Caucasian (260 | 94.9%), Black / African American (8 | 2.9%), and Hispanic or Latino (6 | 2.2%).
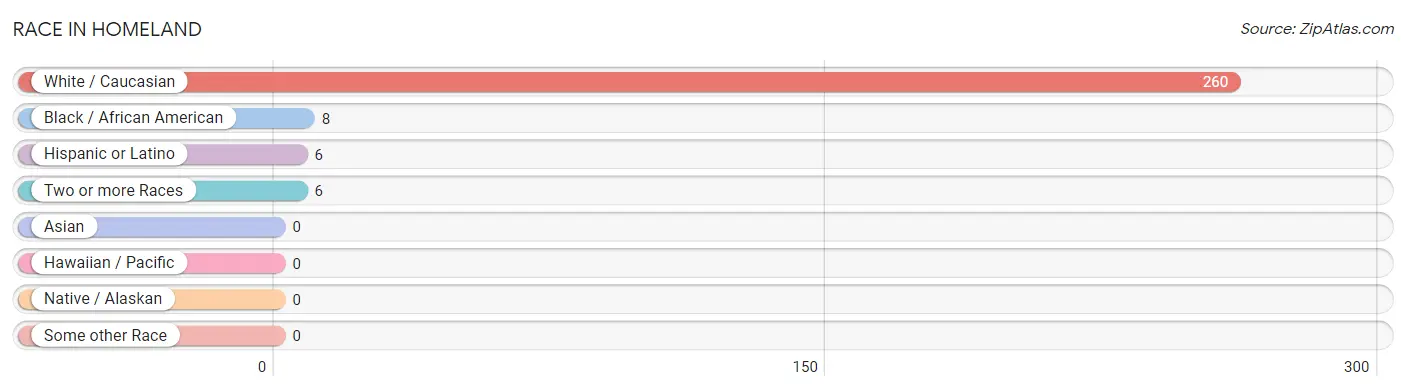
| Race | # Population | % Population |
| Asian | 0 | 0.0% |
| Black / African American | 8 | 2.9% |
| Hawaiian / Pacific | 0 | 0.0% |
| Hispanic or Latino | 6 | 2.2% |
| Native / Alaskan | 0 | 0.0% |
| White / Caucasian | 260 | 94.9% |
| Two or more Races | 6 | 2.2% |
| Some other Race | 0 | 0.0% |
| Total | 274 | 100.0% |
Ancestry in Homeland
The most populous ancestries reported in Homeland are American (95 | 34.7%), German (72 | 26.3%), English (21 | 7.7%), French (11 | 4.0%), and European (7 | 2.5%), together accounting for 75.2% of all Homeland residents.
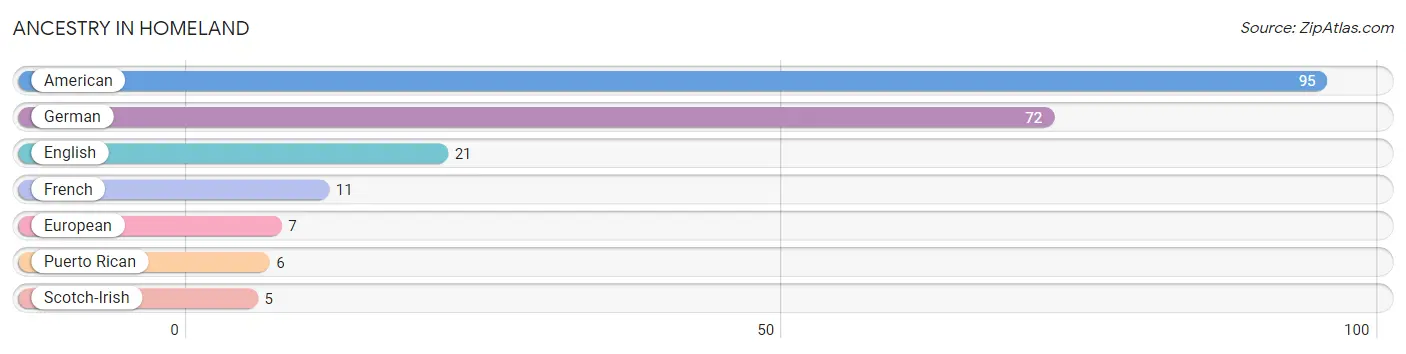
| Ancestry | # Population | % Population |
| American | 95 | 34.7% |
| English | 21 | 7.7% |
| European | 7 | 2.5% |
| French | 11 | 4.0% |
| German | 72 | 26.3% |
| Puerto Rican | 6 | 2.2% |
| Scotch-Irish | 5 | 1.8% | View All 7 Rows |
Immigrants in Homeland

| Immigration Origin | # Population | % Population | View All 0 Rows |
Sex and Age in Homeland
Sex and Age in Homeland
The most populous age groups in Homeland are 60 to 64 Years (32 | 20.4%) for men and 65 to 69 Years (42 | 35.9%) for women.
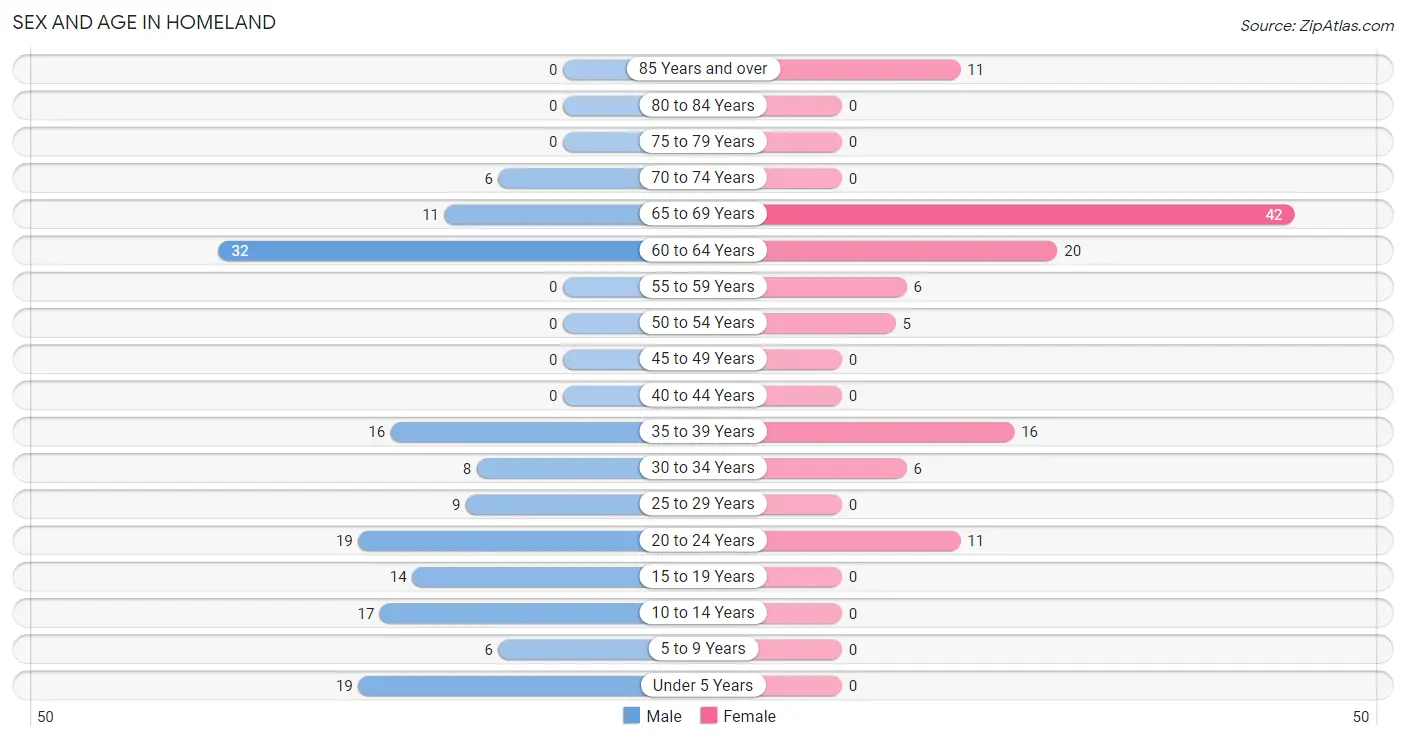
| Age Bracket | Male | Female |
| Under 5 Years | 19 (12.1%) | 0 (0.0%) |
| 5 to 9 Years | 6 (3.8%) | 0 (0.0%) |
| 10 to 14 Years | 17 (10.8%) | 0 (0.0%) |
| 15 to 19 Years | 14 (8.9%) | 0 (0.0%) |
| 20 to 24 Years | 19 (12.1%) | 11 (9.4%) |
| 25 to 29 Years | 9 (5.7%) | 0 (0.0%) |
| 30 to 34 Years | 8 (5.1%) | 6 (5.1%) |
| 35 to 39 Years | 16 (10.2%) | 16 (13.7%) |
| 40 to 44 Years | 0 (0.0%) | 0 (0.0%) |
| 45 to 49 Years | 0 (0.0%) | 0 (0.0%) |
| 50 to 54 Years | 0 (0.0%) | 5 (4.3%) |
| 55 to 59 Years | 0 (0.0%) | 6 (5.1%) |
| 60 to 64 Years | 32 (20.4%) | 20 (17.1%) |
| 65 to 69 Years | 11 (7.0%) | 42 (35.9%) |
| 70 to 74 Years | 6 (3.8%) | 0 (0.0%) |
| 75 to 79 Years | 0 (0.0%) | 0 (0.0%) |
| 80 to 84 Years | 0 (0.0%) | 0 (0.0%) |
| 85 Years and over | 0 (0.0%) | 11 (9.4%) |
| Total | 157 (100.0%) | 117 (100.0%) |
Families and Households in Homeland
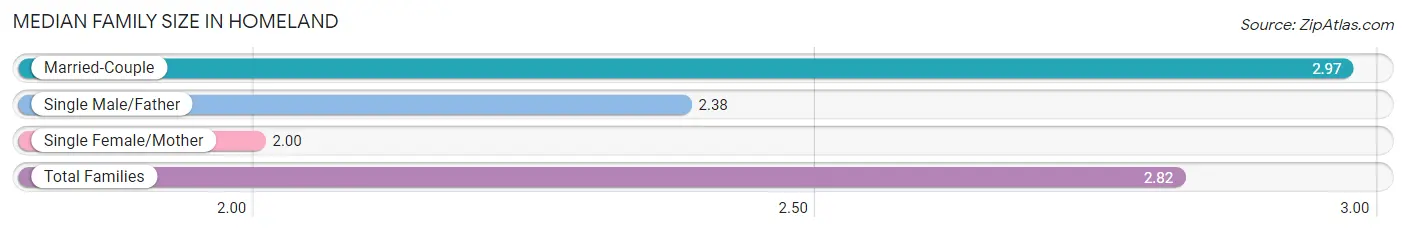
Median Family Size in Homeland
The median family size in Homeland is 2.82 persons per family, with married-couple families (59 | 80.8%) accounting for the largest median family size of 2.97 persons per family. On the other hand, single female/mother families (6 | 8.2%) represent the smallest median family size with 2.00 persons per family.
| Family Type | # Families | Family Size |
| Married-Couple | 59 (80.8%) | 2.97 |
| Single Male/Father | 8 (11.0%) | 2.38 |
| Single Female/Mother | 6 (8.2%) | 2.00 |
| Total Families | 73 (100.0%) | 2.82 |
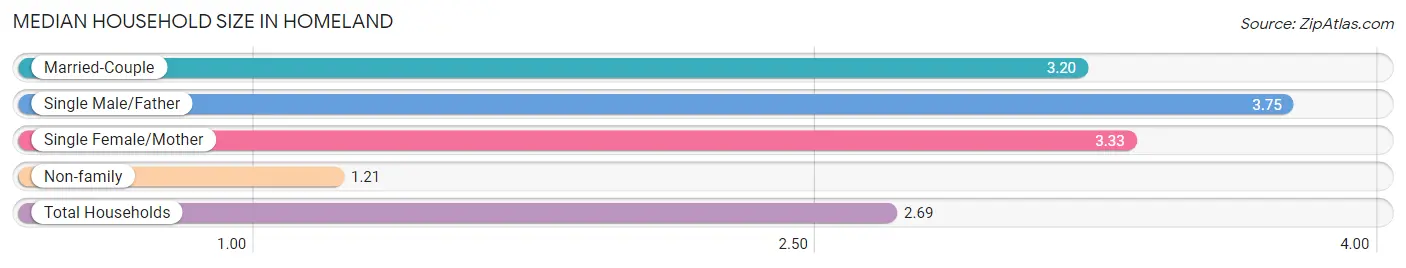
Median Household Size in Homeland
The median household size in Homeland is 2.69 persons per household, with single male/father households (8 | 7.8%) accounting for the largest median household size of 3.75 persons per household. non-family households (29 | 28.4%) represent the smallest median household size with 1.21 persons per household.
| Household Type | # Households | Household Size |
| Married-Couple | 59 (57.8%) | 3.20 |
| Single Male/Father | 8 (7.8%) | 3.75 |
| Single Female/Mother | 6 (5.9%) | 3.33 |
| Non-family | 29 (28.4%) | 1.21 |
| Total Households | 102 (100.0%) | 2.69 |
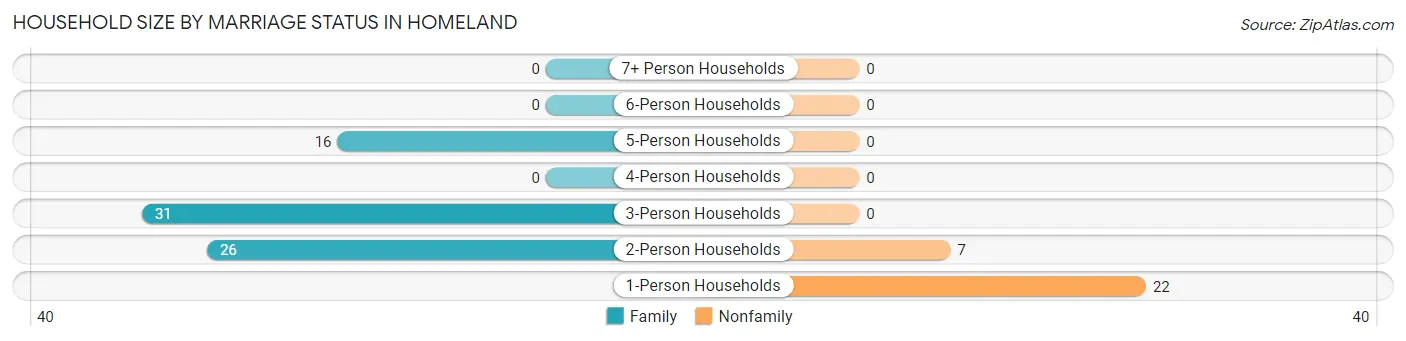
Household Size by Marriage Status in Homeland
Out of a total of 102 households in Homeland, 73 (71.6%) are family households, while 29 (28.4%) are nonfamily households. The most numerous type of family households are 3-person households, comprising 31, and the most common type of nonfamily households are 1-person households, comprising 22.
| Household Size | Family Households | Nonfamily Households |
| 1-Person Households | - | 22 (21.6%) |
| 2-Person Households | 26 (25.5%) | 7 (6.9%) |
| 3-Person Households | 31 (30.4%) | 0 (0.0%) |
| 4-Person Households | 0 (0.0%) | 0 (0.0%) |
| 5-Person Households | 16 (15.7%) | 0 (0.0%) |
| 6-Person Households | 0 (0.0%) | 0 (0.0%) |
| 7+ Person Households | 0 (0.0%) | 0 (0.0%) |
| Total | 73 (71.6%) | 29 (28.4%) |
Female Fertility in Homeland
Fertility by Age in Homeland
| Age Bracket | Women with Births | Births / 1,000 Women |
| 15 to 19 years | 0 (0.0%) | 0.0 |
| 20 to 34 years | 0 (0.0%) | 0.0 |
| 35 to 50 years | 0 (0.0%) | 0.0 |
| Total | 0 (0.0%) | 0.0 |
Fertility by Age by Marriage Status in Homeland
| Age Bracket | Married | Unmarried |
| 15 to 19 years | 0 (0.0%) | 0 (0.0%) |
| 20 to 34 years | 0 (0.0%) | 0 (0.0%) |
| 35 to 50 years | 0 (0.0%) | 0 (0.0%) |
| Total | 0 (0.0%) | 0 (0.0%) |
Fertility by Education in Homeland
| Educational Attainment | Women with Births | Births / 1,000 Women |
| Less than High School | 0 (0.0%) | 0.0 |
| High School Diploma | 0 (0.0%) | 0.0 |
| College or Associate's Degree | 0 (0.0%) | 0.0 |
| Bachelor's Degree | 0 (0.0%) | 0.0 |
| Graduate Degree | 0 (0.0%) | 0.0 |
| Total | 0 (0.0%) | 0.0 |
Fertility by Education by Marriage Status in Homeland
| Educational Attainment | Married | Unmarried |
| Less than High School | 0 (0.0%) | 0 (0.0%) |
| High School Diploma | 0 (0.0%) | 0 (0.0%) |
| College or Associate's Degree | 0 (0.0%) | 0 (0.0%) |
| Bachelor's Degree | 0 (0.0%) | 0 (0.0%) |
| Graduate Degree | 0 (0.0%) | 0 (0.0%) |
| Total | 0 (0.0%) | 0 (0.0%) |
Employment Characteristics in Homeland
Employment by Class of Employer in Homeland
Among the 111 employed individuals in Homeland, private company employees (84 | 75.7%), local government employees (18 | 16.2%), and not-for-profit organizations (9 | 8.1%) make up the most common classes of employment.
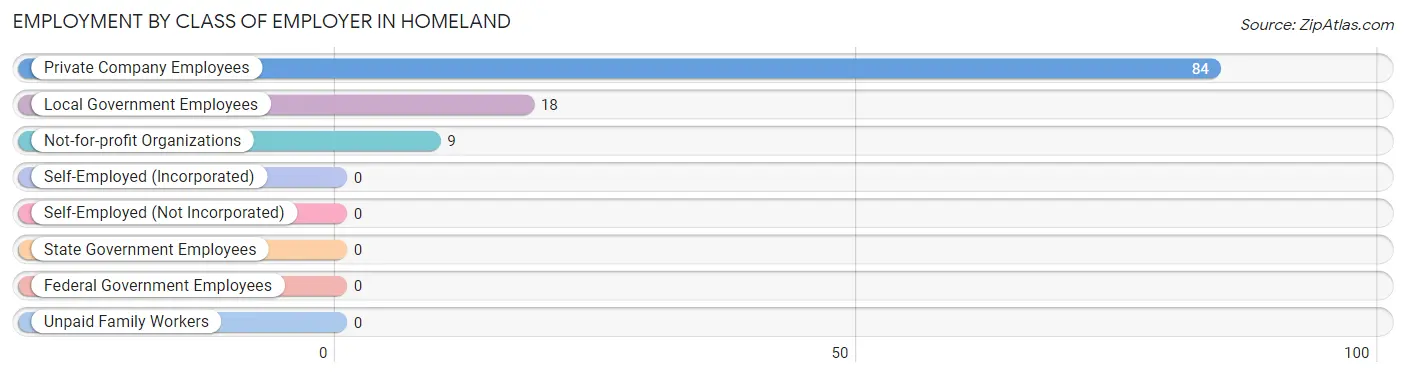
| Employer Class | # Employees | % Employees |
| Private Company Employees | 84 | 75.7% |
| Self-Employed (Incorporated) | 0 | 0.0% |
| Self-Employed (Not Incorporated) | 0 | 0.0% |
| Not-for-profit Organizations | 9 | 8.1% |
| Local Government Employees | 18 | 16.2% |
| State Government Employees | 0 | 0.0% |
| Federal Government Employees | 0 | 0.0% |
| Unpaid Family Workers | 0 | 0.0% |
| Total | 111 | 100.0% |
Employment Status by Age in Homeland
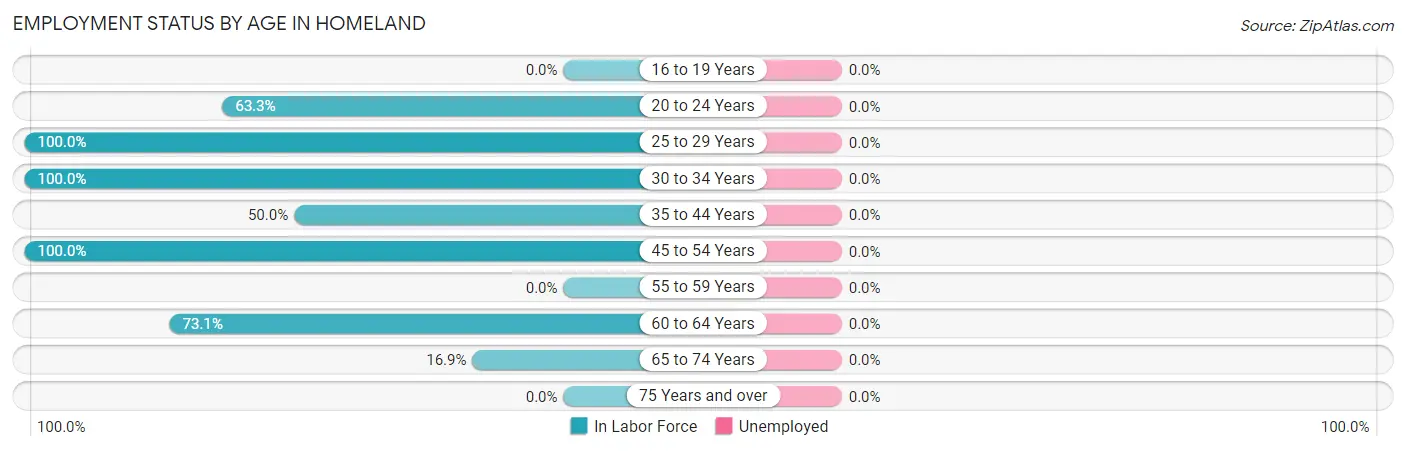
| Age Bracket | In Labor Force | Unemployed |
| 16 to 19 Years | 0 (0.0%) | 0 (0.0%) |
| 20 to 24 Years | 19 (63.3%) | 0 (0.0%) |
| 25 to 29 Years | 9 (100.0%) | 0 (0.0%) |
| 30 to 34 Years | 14 (100.0%) | 0 (0.0%) |
| 35 to 44 Years | 16 (50.0%) | 0 (0.0%) |
| 45 to 54 Years | 5 (100.0%) | 0 (0.0%) |
| 55 to 59 Years | 0 (0.0%) | 0 (0.0%) |
| 60 to 64 Years | 38 (73.1%) | 0 (0.0%) |
| 65 to 74 Years | 10 (16.9%) | 0 (0.0%) |
| 75 Years and over | 0 (0.0%) | 0 (0.0%) |
| Total | 111 (47.8%) | 0 (0.0%) |
Employment Status by Educational Attainment in Homeland
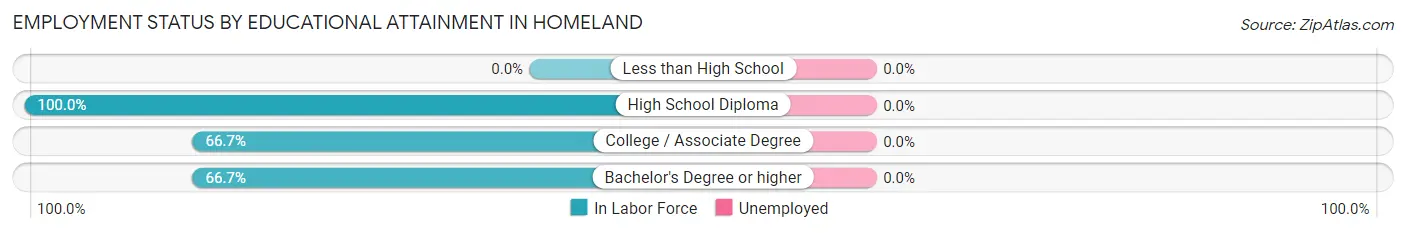
| Educational Attainment | In Labor Force | Unemployed |
| Less than High School | 0 (0.0%) | 0 (0.0%) |
| High School Diploma | 10 (100.0%) | 0 (0.0%) |
| College / Associate Degree | 60 (66.7%) | 0 (0.0%) |
| Bachelor's Degree or higher | 12 (66.7%) | 0 (0.0%) |
| Total | 82 (69.5%) | 0 (0.0%) |
Employment Occupations by Sex in Homeland
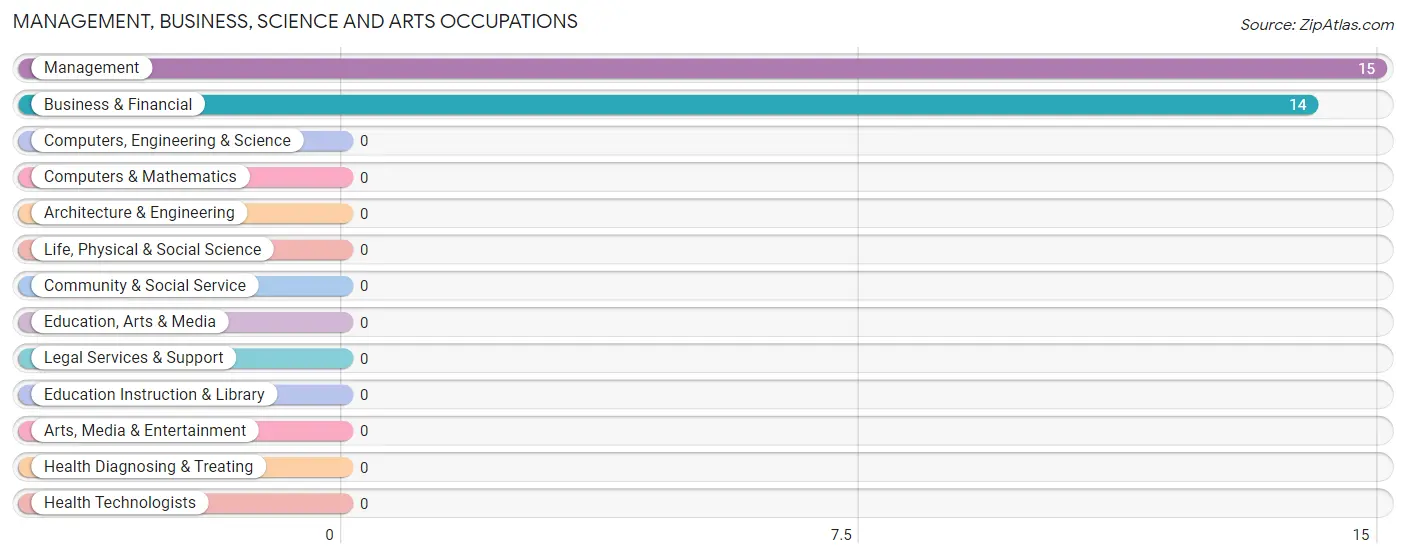
Management, Business, Science and Arts Occupations
The most common Management, Business, Science and Arts occupations in Homeland are Management (15 | 13.5%), and Business & Financial (14 | 12.6%).
Management, Business, Science and Arts Occupations by Sex
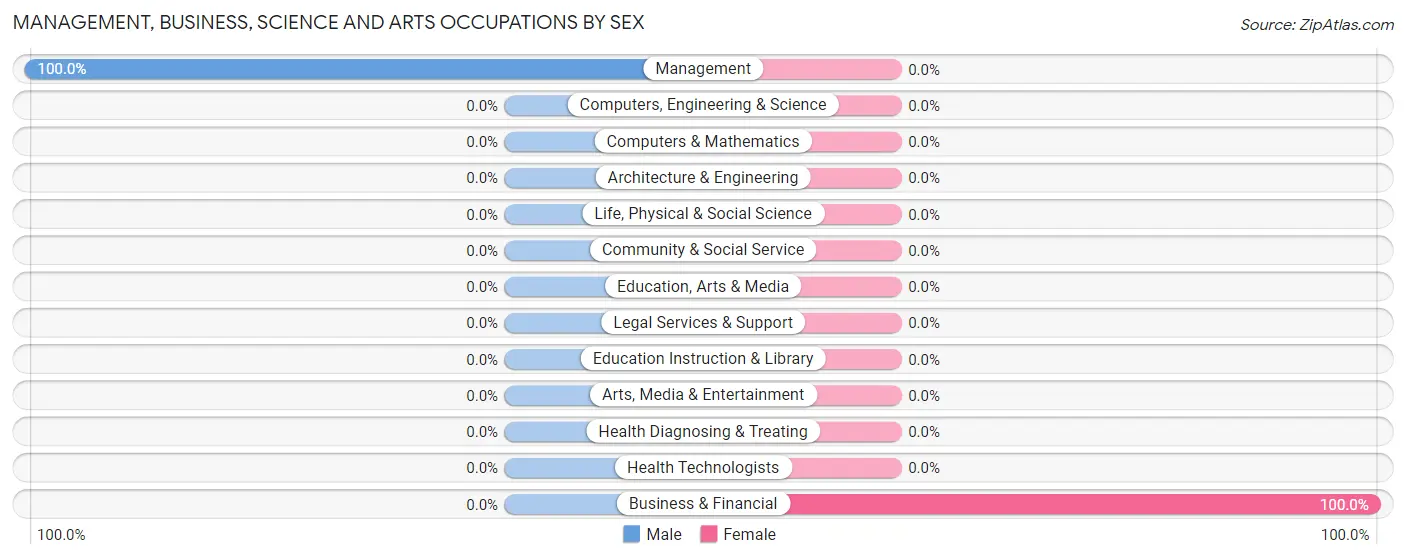
| Occupation | Male | Female |
| Management | 15 (100.0%) | 0 (0.0%) |
| Business & Financial | 0 (0.0%) | 14 (100.0%) |
| Computers, Engineering & Science | 0 (0.0%) | 0 (0.0%) |
| Computers & Mathematics | 0 (0.0%) | 0 (0.0%) |
| Architecture & Engineering | 0 (0.0%) | 0 (0.0%) |
| Life, Physical & Social Science | 0 (0.0%) | 0 (0.0%) |
| Community & Social Service | 0 (0.0%) | 0 (0.0%) |
| Education, Arts & Media | 0 (0.0%) | 0 (0.0%) |
| Legal Services & Support | 0 (0.0%) | 0 (0.0%) |
| Education Instruction & Library | 0 (0.0%) | 0 (0.0%) |
| Arts, Media & Entertainment | 0 (0.0%) | 0 (0.0%) |
| Health Diagnosing & Treating | 0 (0.0%) | 0 (0.0%) |
| Health Technologists | 0 (0.0%) | 0 (0.0%) |
| Total (Category) | 15 (51.7%) | 14 (48.3%) |
| Total (Overall) | 70 (63.1%) | 41 (36.9%) |
Services Occupations
The most common Services occupations in Homeland are , and Cleaning & Maintenance (5 | 4.5%).
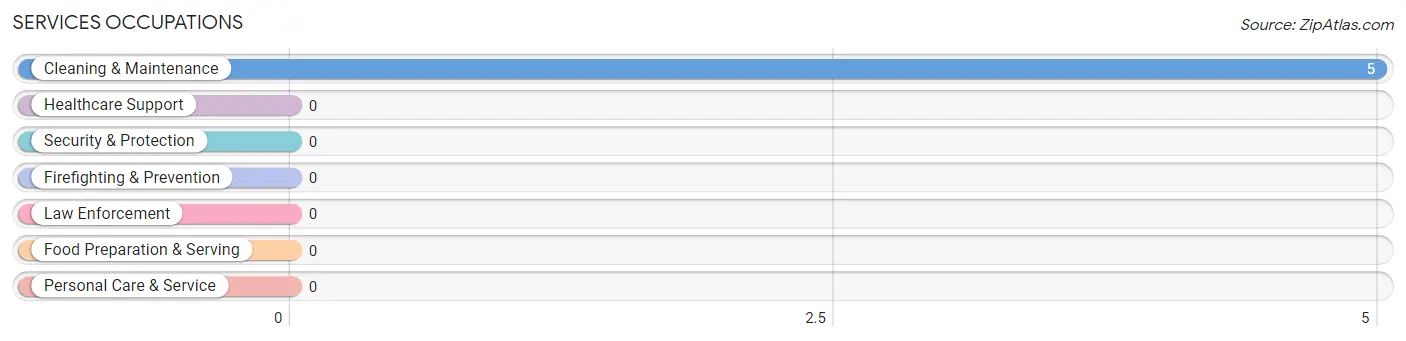
Services Occupations by Sex
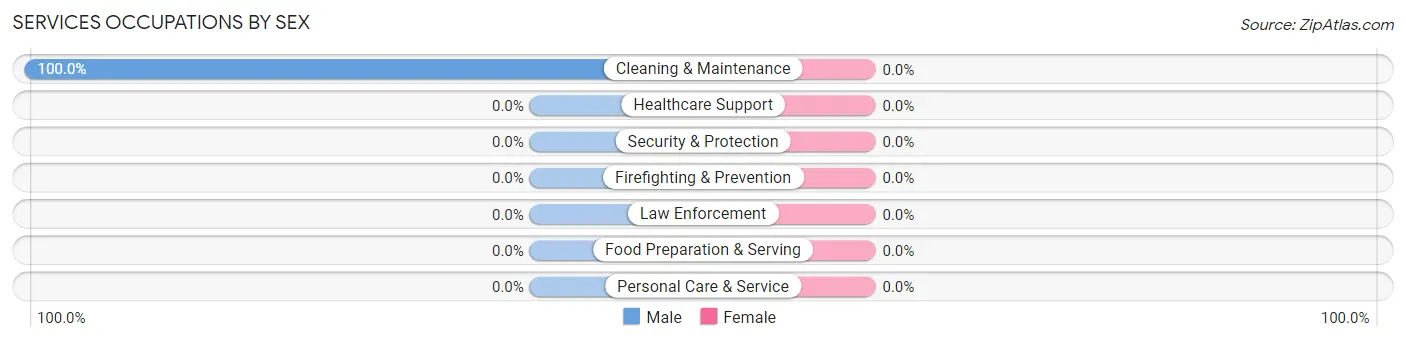
| Occupation | Male | Female |
| Healthcare Support | 0 (0.0%) | 0 (0.0%) |
| Security & Protection | 0 (0.0%) | 0 (0.0%) |
| Firefighting & Prevention | 0 (0.0%) | 0 (0.0%) |
| Law Enforcement | 0 (0.0%) | 0 (0.0%) |
| Food Preparation & Serving | 0 (0.0%) | 0 (0.0%) |
| Cleaning & Maintenance | 5 (100.0%) | 0 (0.0%) |
| Personal Care & Service | 0 (0.0%) | 0 (0.0%) |
| Total (Category) | 5 (100.0%) | 0 (0.0%) |
| Total (Overall) | 70 (63.1%) | 41 (36.9%) |
Sales and Office Occupations
The most common Sales and Office occupations in Homeland are , and Office & Administration (30 | 27.0%).
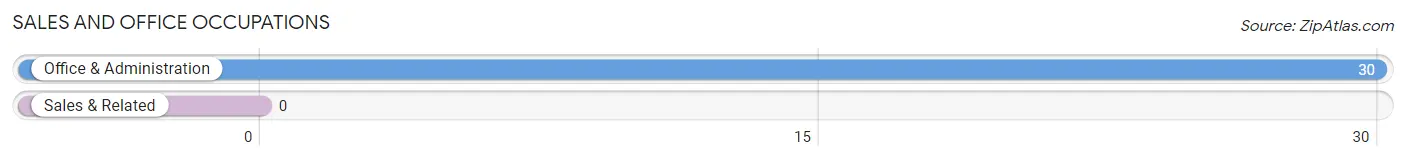
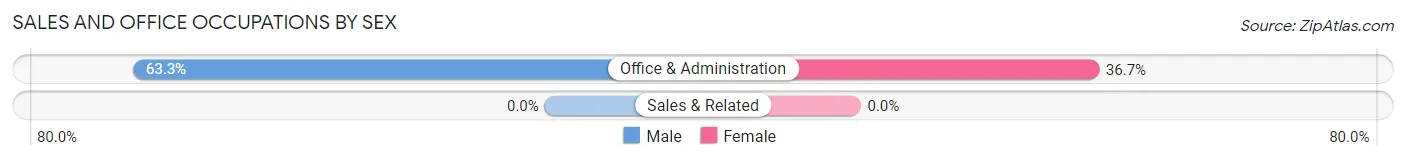
Sales and Office Occupations by Sex
| Occupation | Male | Female |
| Sales & Related | 0 (0.0%) | 0 (0.0%) |
| Office & Administration | 19 (63.3%) | 11 (36.7%) |
| Total (Category) | 19 (63.3%) | 11 (36.7%) |
| Total (Overall) | 70 (63.1%) | 41 (36.9%) |
Natural Resources, Construction and Maintenance Occupations
The most common Natural Resources, Construction and Maintenance occupations in Homeland are Farming, Fishing & Forestry (16 | 14.4%), and Installation, Maintenance & Repair (7 | 6.3%).
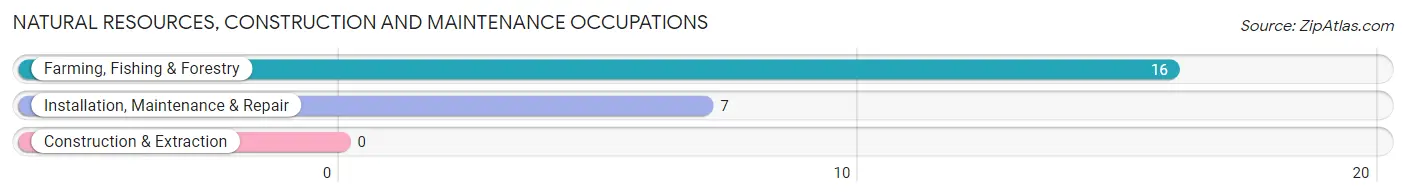
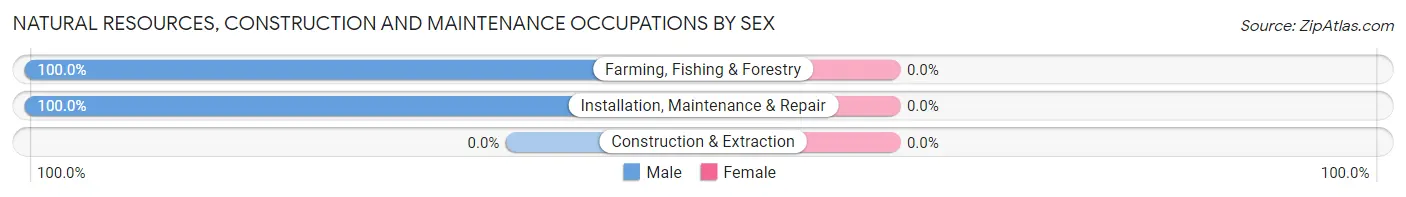
Natural Resources, Construction and Maintenance Occupations by Sex
| Occupation | Male | Female |
| Farming, Fishing & Forestry | 16 (100.0%) | 0 (0.0%) |
| Construction & Extraction | 0 (0.0%) | 0 (0.0%) |
| Installation, Maintenance & Repair | 7 (100.0%) | 0 (0.0%) |
| Total (Category) | 23 (100.0%) | 0 (0.0%) |
| Total (Overall) | 70 (63.1%) | 41 (36.9%) |
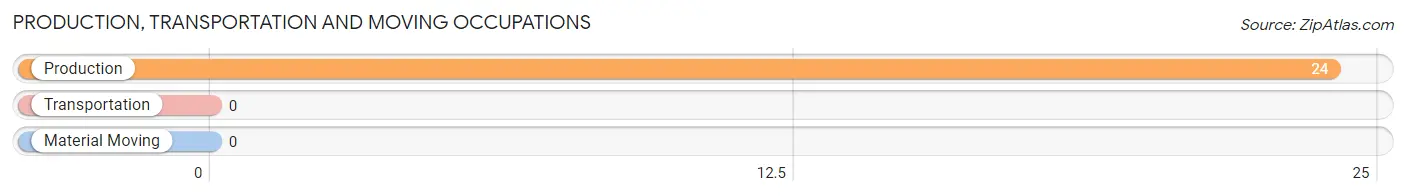
Production, Transportation and Moving Occupations
The most common Production, Transportation and Moving occupations in Homeland are , and Production (24 | 21.6%).
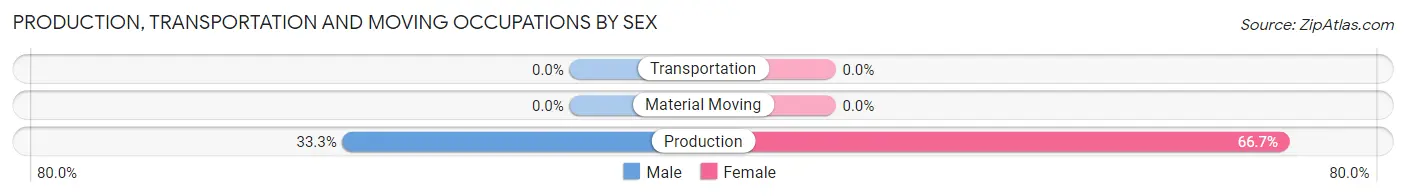
Production, Transportation and Moving Occupations by Sex
| Occupation | Male | Female |
| Production | 8 (33.3%) | 16 (66.7%) |
| Transportation | 0 (0.0%) | 0 (0.0%) |
| Material Moving | 0 (0.0%) | 0 (0.0%) |
| Total (Category) | 8 (33.3%) | 16 (66.7%) |
| Total (Overall) | 70 (63.1%) | 41 (36.9%) |
Employment Industries by Sex in Homeland
Employment Industries in Homeland
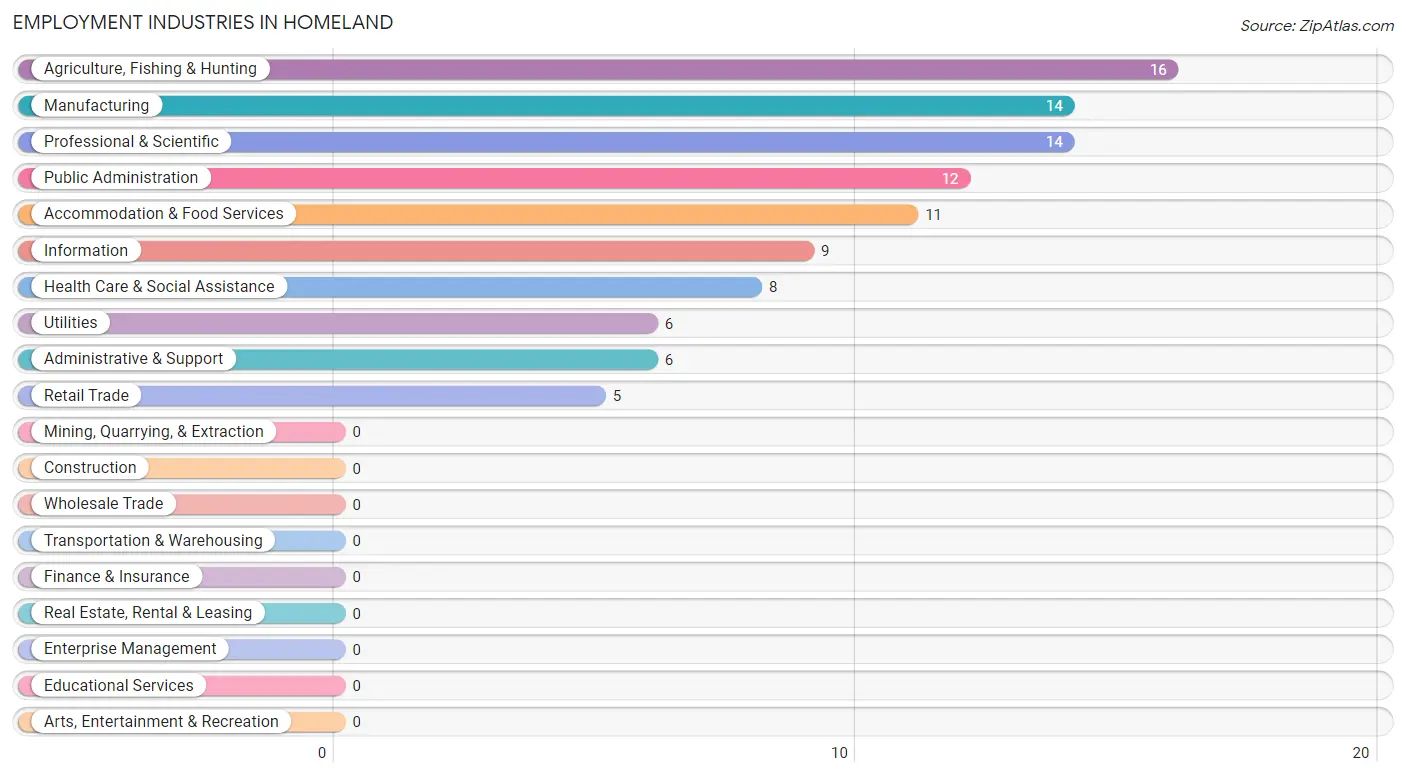
The major employment industries in Homeland include Agriculture, Fishing & Hunting (16 | 14.4%), Manufacturing (14 | 12.6%), Professional & Scientific (14 | 12.6%), Public Administration (12 | 10.8%), and Accommodation & Food Services (11 | 9.9%).
Employment Industries by Sex in Homeland
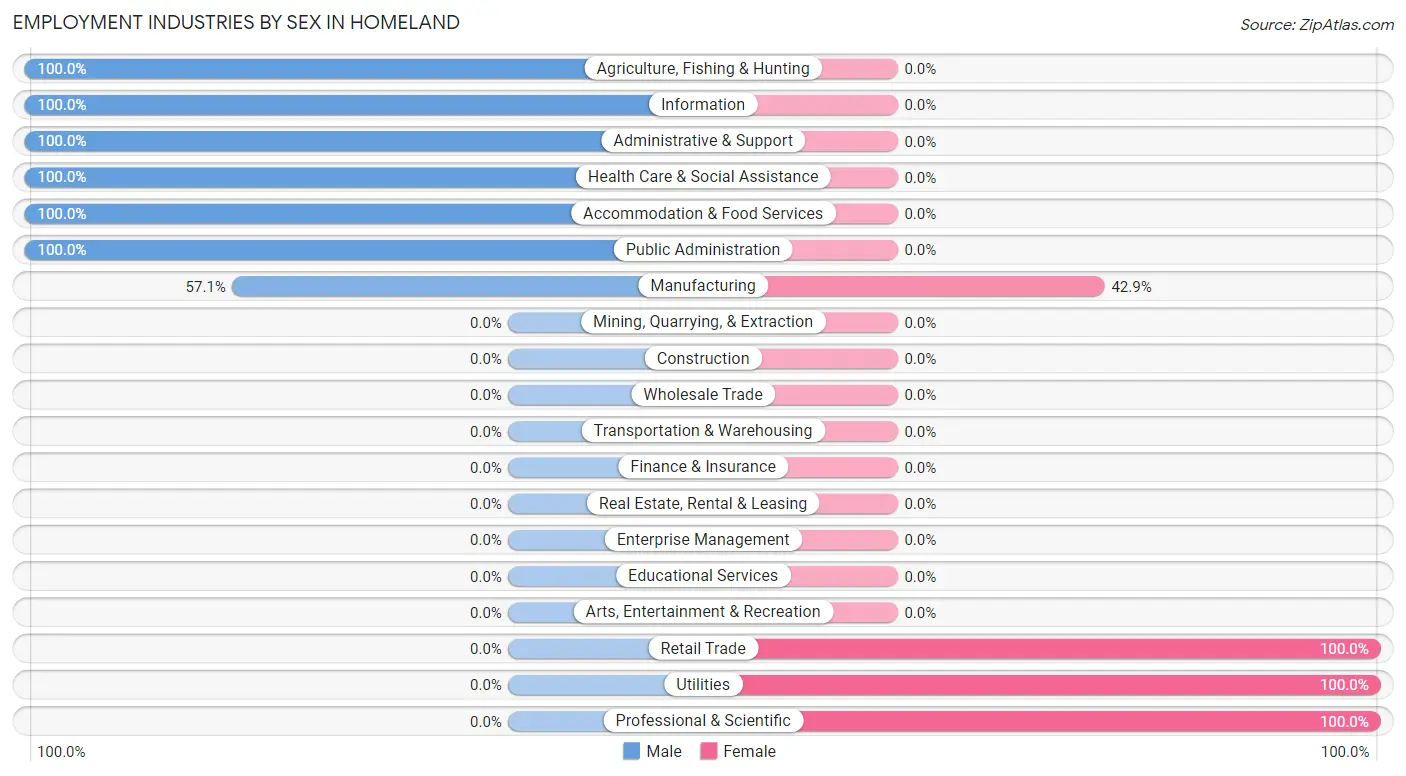
The Homeland industries that see more men than women are Agriculture, Fishing & Hunting (100.0%), Information (100.0%), and Administrative & Support (100.0%), whereas the industries that tend to have a higher number of women are Retail Trade (100.0%), Utilities (100.0%), and Professional & Scientific (100.0%).
| Industry | Male | Female |
| Agriculture, Fishing & Hunting | 16 (100.0%) | 0 (0.0%) |
| Mining, Quarrying, & Extraction | 0 (0.0%) | 0 (0.0%) |
| Construction | 0 (0.0%) | 0 (0.0%) |
| Manufacturing | 8 (57.1%) | 6 (42.9%) |
| Wholesale Trade | 0 (0.0%) | 0 (0.0%) |
| Retail Trade | 0 (0.0%) | 5 (100.0%) |
| Transportation & Warehousing | 0 (0.0%) | 0 (0.0%) |
| Utilities | 0 (0.0%) | 6 (100.0%) |
| Information | 9 (100.0%) | 0 (0.0%) |
| Finance & Insurance | 0 (0.0%) | 0 (0.0%) |
| Real Estate, Rental & Leasing | 0 (0.0%) | 0 (0.0%) |
| Professional & Scientific | 0 (0.0%) | 14 (100.0%) |
| Enterprise Management | 0 (0.0%) | 0 (0.0%) |
| Administrative & Support | 6 (100.0%) | 0 (0.0%) |
| Educational Services | 0 (0.0%) | 0 (0.0%) |
| Health Care & Social Assistance | 8 (100.0%) | 0 (0.0%) |
| Arts, Entertainment & Recreation | 0 (0.0%) | 0 (0.0%) |
| Accommodation & Food Services | 11 (100.0%) | 0 (0.0%) |
| Public Administration | 12 (100.0%) | 0 (0.0%) |
| Total | 70 (63.1%) | 41 (36.9%) |
Education in Homeland
School Enrollment in Homeland
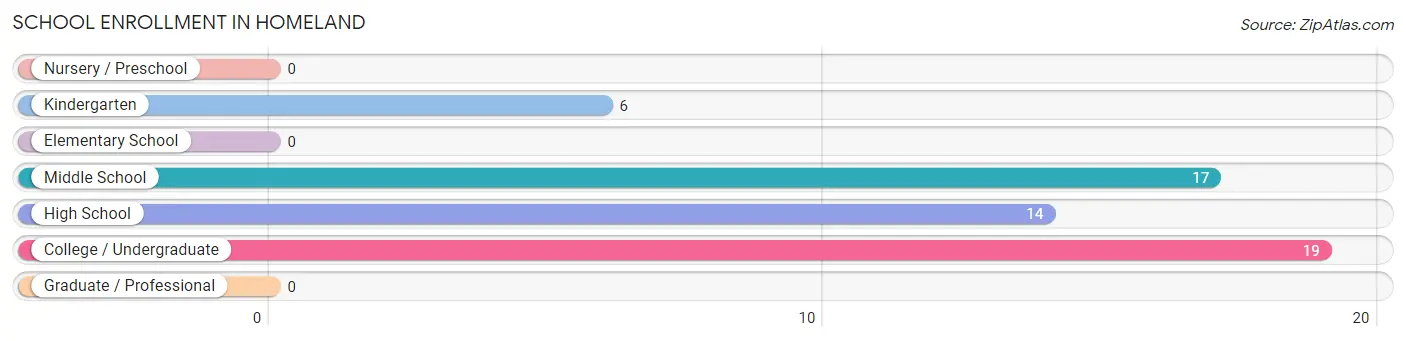
The most common levels of schooling among the 56 students in Homeland are college / undergraduate (19 | 33.9%), middle school (17 | 30.4%), and high school (14 | 25.0%).
| School Level | # Students | % Students |
| Nursery / Preschool | 0 | 0.0% |
| Kindergarten | 6 | 10.7% |
| Elementary School | 0 | 0.0% |
| Middle School | 17 | 30.4% |
| High School | 14 | 25.0% |
| College / Undergraduate | 19 | 33.9% |
| Graduate / Professional | 0 | 0.0% |
| Total | 56 | 100.0% |
School Enrollment by Age by Funding Source in Homeland
| Age Bracket | Public School | Private School |
| 3 to 4 Year Olds | 0 (0.0%) | 0 (0.0%) |
| 5 to 9 Year Old | 6 (100.0%) | 0 (0.0%) |
| 10 to 14 Year Olds | 17 (100.0%) | 0 (0.0%) |
| 15 to 17 Year Olds | 14 (100.0%) | 0 (0.0%) |
| 18 to 19 Year Olds | 0 (0.0%) | 0 (0.0%) |
| 20 to 24 Year Olds | 11 (100.0%) | 0 (0.0%) |
| 25 to 34 Year Olds | 8 (100.0%) | 0 (0.0%) |
| 35 Years and over | 0 (0.0%) | 0 (0.0%) |
| Total | 56 (100.0%) | 0 (0.0%) |
Educational Attainment by Field of Study in Homeland
Business (6 | 25.0%), education (6 | 25.0%), visual & performing arts (6 | 25.0%), and arts & humanities (6 | 25.0%) are the most common fields of study among 24 individuals in Homeland who have obtained a bachelor's degree or higher.
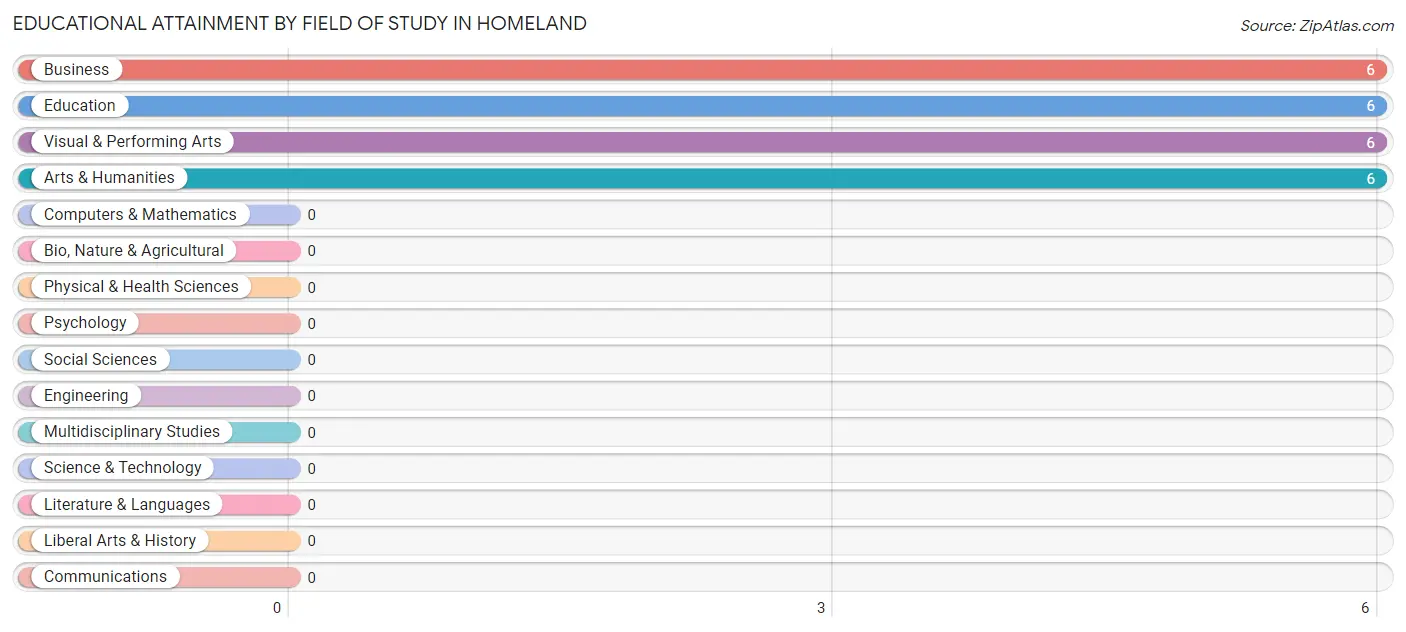
| Field of Study | # Graduates | % Graduates |
| Computers & Mathematics | 0 | 0.0% |
| Bio, Nature & Agricultural | 0 | 0.0% |
| Physical & Health Sciences | 0 | 0.0% |
| Psychology | 0 | 0.0% |
| Social Sciences | 0 | 0.0% |
| Engineering | 0 | 0.0% |
| Multidisciplinary Studies | 0 | 0.0% |
| Science & Technology | 0 | 0.0% |
| Business | 6 | 25.0% |
| Education | 6 | 25.0% |
| Literature & Languages | 0 | 0.0% |
| Liberal Arts & History | 0 | 0.0% |
| Visual & Performing Arts | 6 | 25.0% |
| Communications | 0 | 0.0% |
| Arts & Humanities | 6 | 25.0% |
| Total | 24 | 100.0% |
Transportation & Commute in Homeland
Vehicle Availability by Sex in Homeland
The most prevalent vehicle ownership categories in Homeland are males with 3 vehicles (34, accounting for 48.6%) and females with 3 vehicles (0, making up 82.9%).
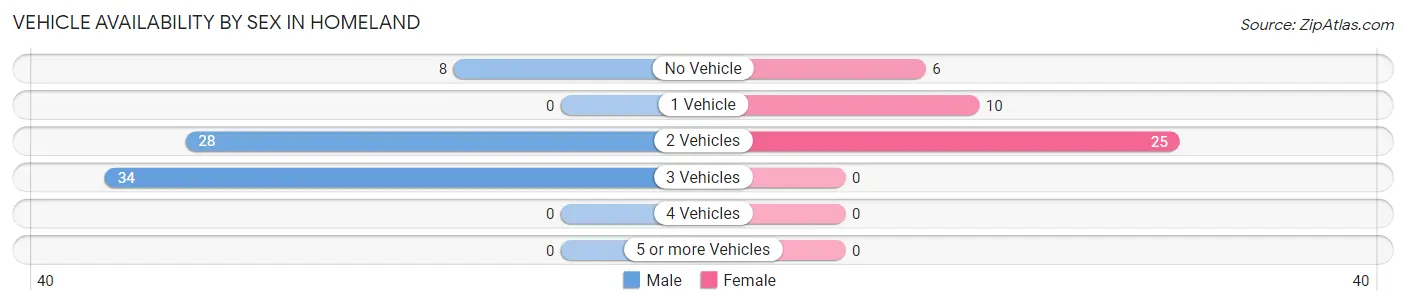
| Vehicles Available | Male | Female |
| No Vehicle | 8 (11.4%) | 6 (14.6%) |
| 1 Vehicle | 0 (0.0%) | 10 (24.4%) |
| 2 Vehicles | 28 (40.0%) | 25 (61.0%) |
| 3 Vehicles | 34 (48.6%) | 0 (0.0%) |
| 4 Vehicles | 0 (0.0%) | 0 (0.0%) |
| 5 or more Vehicles | 0 (0.0%) | 0 (0.0%) |
| Total | 70 (100.0%) | 41 (100.0%) |
Commute Time in Homeland
The most frequently occuring commute durations in Homeland are 35 to 39 minutes (29 commuters, 27.4%), 40 to 44 minutes (24 commuters, 22.6%), and 30 to 34 minutes (23 commuters, 21.7%).
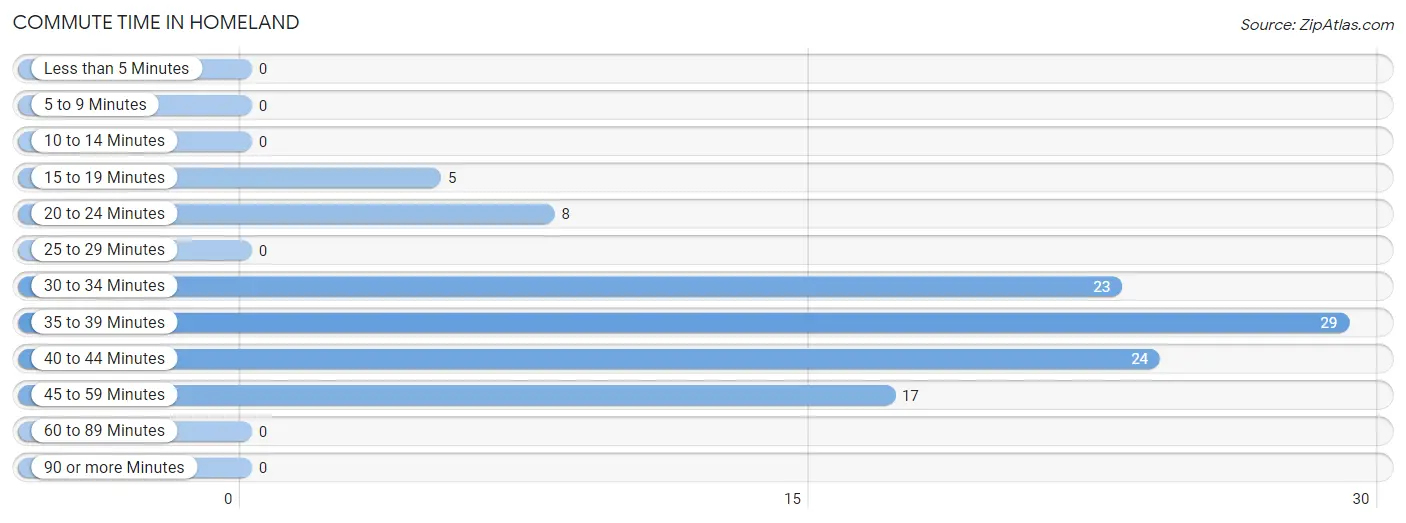
| Commute Time | # Commuters | % Commuters |
| Less than 5 Minutes | 0 | 0.0% |
| 5 to 9 Minutes | 0 | 0.0% |
| 10 to 14 Minutes | 0 | 0.0% |
| 15 to 19 Minutes | 5 | 4.7% |
| 20 to 24 Minutes | 8 | 7.5% |
| 25 to 29 Minutes | 0 | 0.0% |
| 30 to 34 Minutes | 23 | 21.7% |
| 35 to 39 Minutes | 29 | 27.4% |
| 40 to 44 Minutes | 24 | 22.6% |
| 45 to 59 Minutes | 17 | 16.0% |
| 60 to 89 Minutes | 0 | 0.0% |
| 90 or more Minutes | 0 | 0.0% |
Commute Time by Sex in Homeland
The most common commute times in Homeland are 30 to 34 minutes (23 commuters, 32.9%) for males and 40 to 44 minutes (24 commuters, 66.7%) for females.
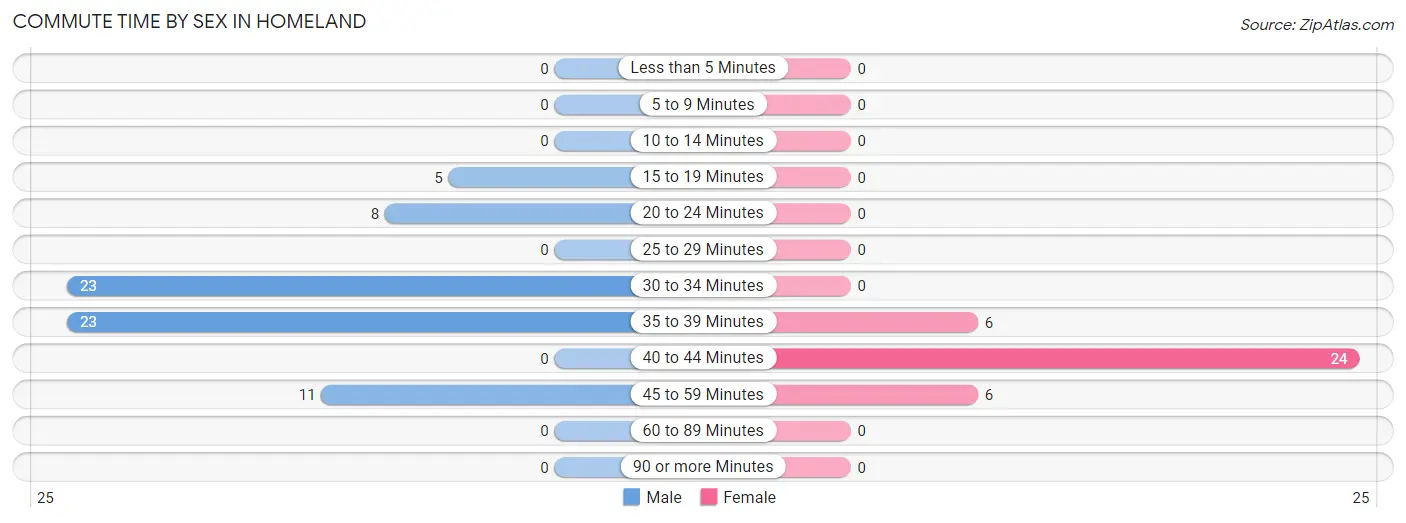
| Commute Time | Male | Female |
| Less than 5 Minutes | 0 (0.0%) | 0 (0.0%) |
| 5 to 9 Minutes | 0 (0.0%) | 0 (0.0%) |
| 10 to 14 Minutes | 0 (0.0%) | 0 (0.0%) |
| 15 to 19 Minutes | 5 (7.1%) | 0 (0.0%) |
| 20 to 24 Minutes | 8 (11.4%) | 0 (0.0%) |
| 25 to 29 Minutes | 0 (0.0%) | 0 (0.0%) |
| 30 to 34 Minutes | 23 (32.9%) | 0 (0.0%) |
| 35 to 39 Minutes | 23 (32.9%) | 6 (16.7%) |
| 40 to 44 Minutes | 0 (0.0%) | 24 (66.7%) |
| 45 to 59 Minutes | 11 (15.7%) | 6 (16.7%) |
| 60 to 89 Minutes | 0 (0.0%) | 0 (0.0%) |
| 90 or more Minutes | 0 (0.0%) | 0 (0.0%) |
Time of Departure to Work by Sex in Homeland
The most frequent times of departure to work in Homeland are 8:00 AM to 8:29 AM (16, 22.9%) for males and 4:00 PM to 11:59 PM (20, 55.6%) for females.
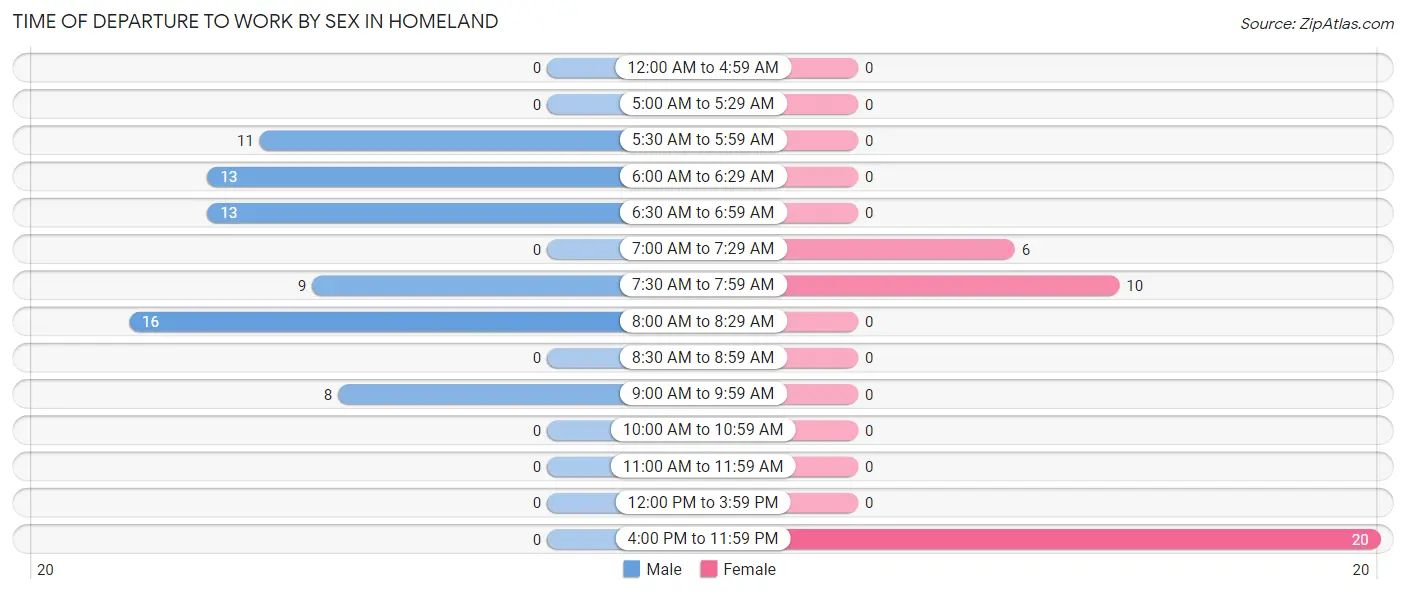
| Time of Departure | Male | Female |
| 12:00 AM to 4:59 AM | 0 (0.0%) | 0 (0.0%) |
| 5:00 AM to 5:29 AM | 0 (0.0%) | 0 (0.0%) |
| 5:30 AM to 5:59 AM | 11 (15.7%) | 0 (0.0%) |
| 6:00 AM to 6:29 AM | 13 (18.6%) | 0 (0.0%) |
| 6:30 AM to 6:59 AM | 13 (18.6%) | 0 (0.0%) |
| 7:00 AM to 7:29 AM | 0 (0.0%) | 6 (16.7%) |
| 7:30 AM to 7:59 AM | 9 (12.9%) | 10 (27.8%) |
| 8:00 AM to 8:29 AM | 16 (22.9%) | 0 (0.0%) |
| 8:30 AM to 8:59 AM | 0 (0.0%) | 0 (0.0%) |
| 9:00 AM to 9:59 AM | 8 (11.4%) | 0 (0.0%) |
| 10:00 AM to 10:59 AM | 0 (0.0%) | 0 (0.0%) |
| 11:00 AM to 11:59 AM | 0 (0.0%) | 0 (0.0%) |
| 12:00 PM to 3:59 PM | 0 (0.0%) | 0 (0.0%) |
| 4:00 PM to 11:59 PM | 0 (0.0%) | 20 (55.6%) |
| Total | 70 (100.0%) | 36 (100.0%) |
Housing Occupancy in Homeland
Occupancy by Ownership in Homeland
Of the total 102 dwellings in Homeland, owner-occupied units account for 66 (64.7%), while renter-occupied units make up 36 (35.3%).
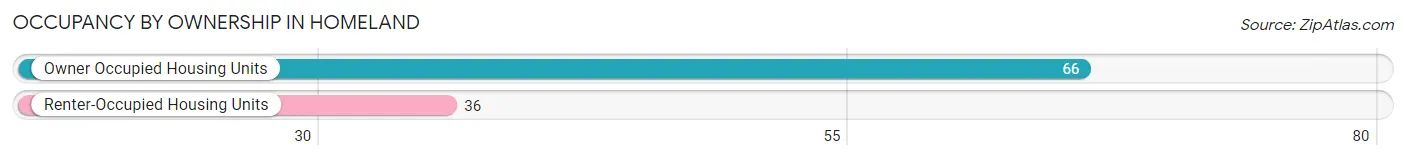
| Occupancy | # Housing Units | % Housing Units |
| Owner Occupied Housing Units | 66 | 64.7% |
| Renter-Occupied Housing Units | 36 | 35.3% |
| Total Occupied Housing Units | 102 | 100.0% |
Occupancy by Household Size in Homeland
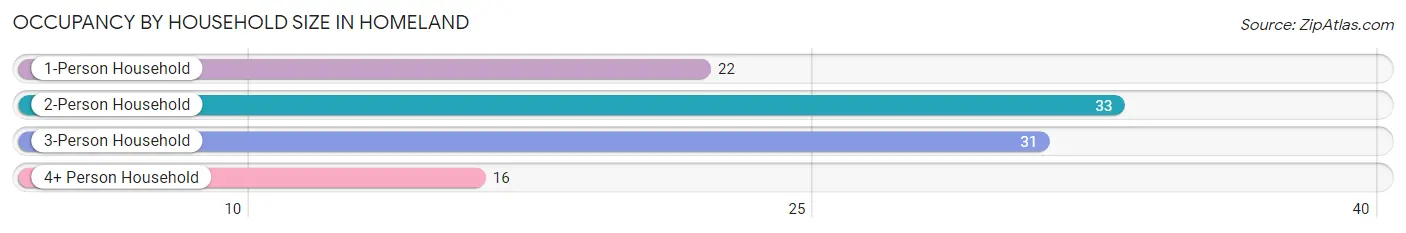
| Household Size | # Housing Units | % Housing Units |
| 1-Person Household | 22 | 21.6% |
| 2-Person Household | 33 | 32.4% |
| 3-Person Household | 31 | 30.4% |
| 4+ Person Household | 16 | 15.7% |
| Total Housing Units | 102 | 100.0% |
Occupancy by Ownership by Household Size in Homeland
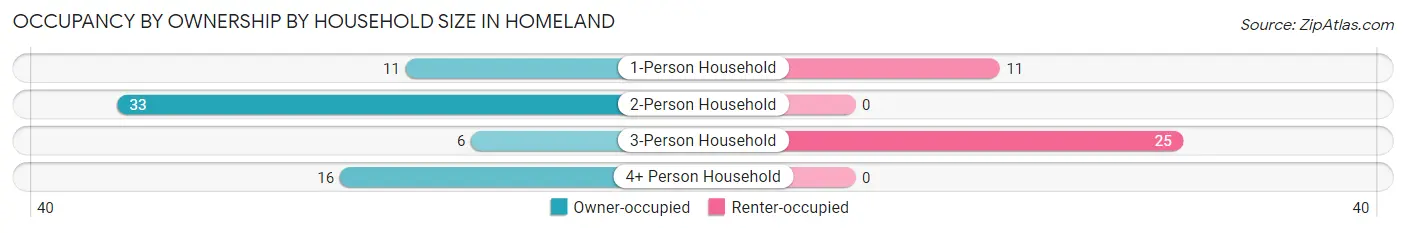
| Household Size | Owner-occupied | Renter-occupied |
| 1-Person Household | 11 (50.0%) | 11 (50.0%) |
| 2-Person Household | 33 (100.0%) | 0 (0.0%) |
| 3-Person Household | 6 (19.4%) | 25 (80.6%) |
| 4+ Person Household | 16 (100.0%) | 0 (0.0%) |
| Total Housing Units | 66 (64.7%) | 36 (35.3%) |
Occupancy by Educational Attainment in Homeland
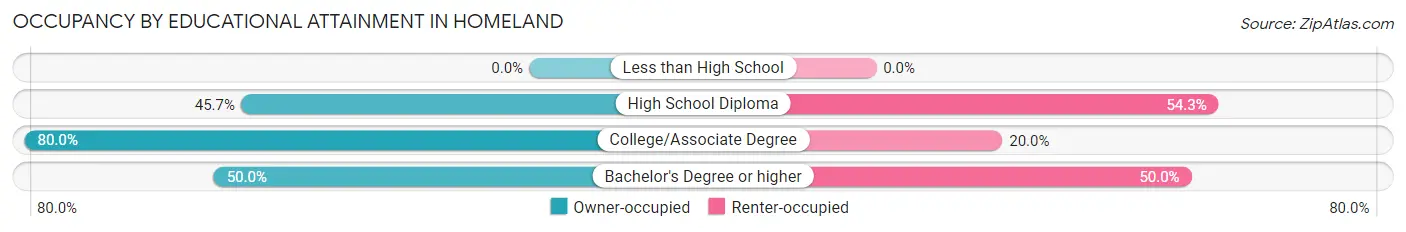
| Household Size | Owner-occupied | Renter-occupied |
| Less than High School | 0 (0.0%) | 0 (0.0%) |
| High School Diploma | 16 (45.7%) | 19 (54.3%) |
| College/Associate Degree | 44 (80.0%) | 11 (20.0%) |
| Bachelor's Degree or higher | 6 (50.0%) | 6 (50.0%) |
Occupancy by Age of Householder in Homeland
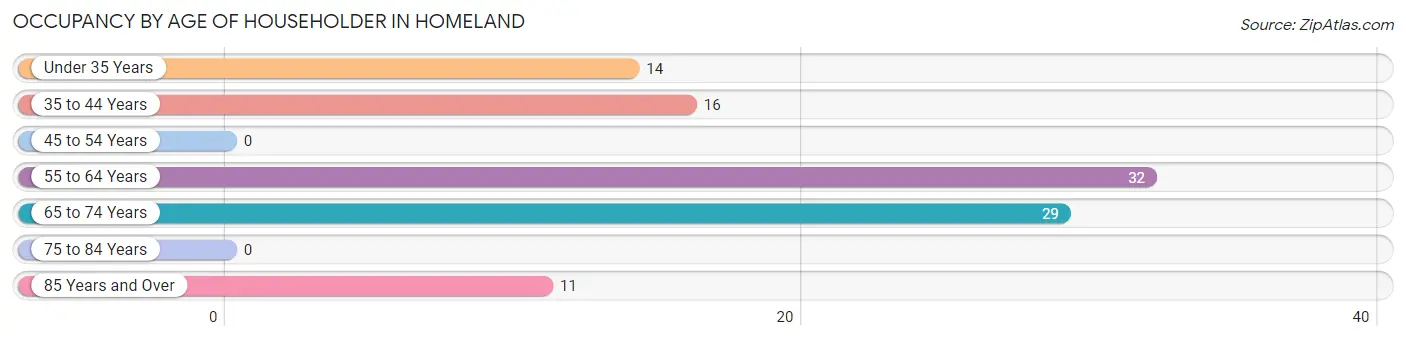
| Age Bracket | # Households | % Households |
| Under 35 Years | 14 | 13.7% |
| 35 to 44 Years | 16 | 15.7% |
| 45 to 54 Years | 0 | 0.0% |
| 55 to 64 Years | 32 | 31.4% |
| 65 to 74 Years | 29 | 28.4% |
| 75 to 84 Years | 0 | 0.0% |
| 85 Years and Over | 11 | 10.8% |
| Total | 102 | 100.0% |
Housing Finances in Homeland
Median Income by Occupancy in Homeland
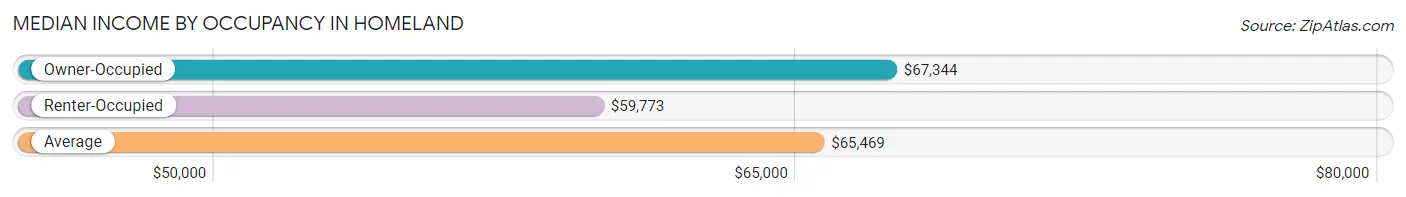
| Occupancy Type | # Households | Median Income |
| Owner-Occupied | 66 (64.7%) | $67,344 |
| Renter-Occupied | 36 (35.3%) | $59,773 |
| Average | 102 (100.0%) | $65,469 |
Occupancy by Householder Income Bracket in Homeland
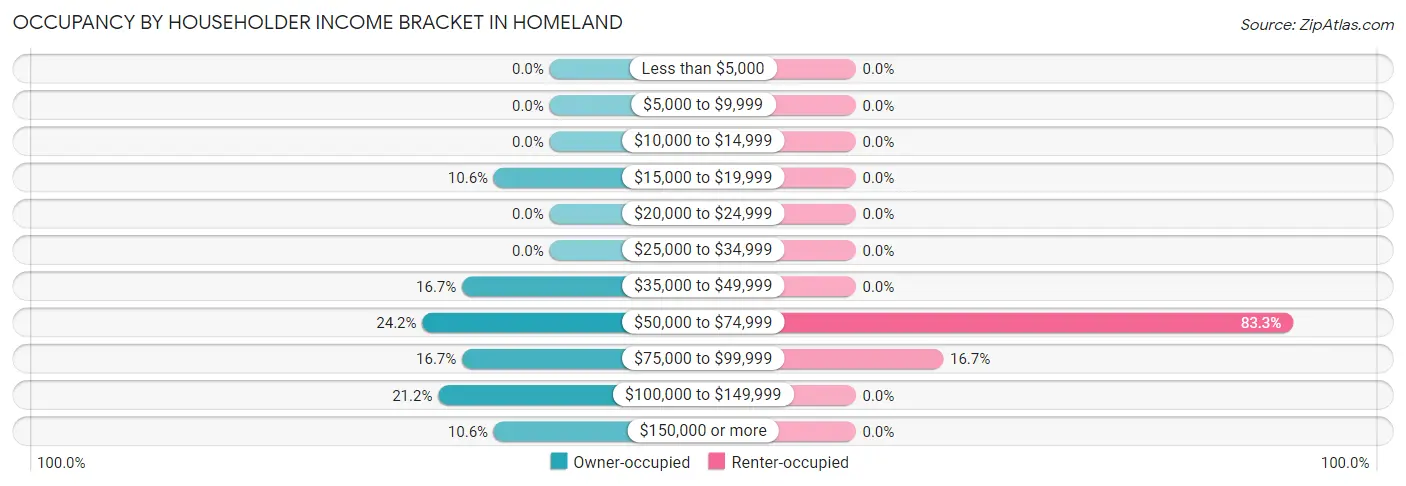
| Income Bracket | Owner-occupied | Renter-occupied |
| Less than $5,000 | 0 (0.0%) | 0 (0.0%) |
| $5,000 to $9,999 | 0 (0.0%) | 0 (0.0%) |
| $10,000 to $14,999 | 0 (0.0%) | 0 (0.0%) |
| $15,000 to $19,999 | 7 (10.6%) | 0 (0.0%) |
| $20,000 to $24,999 | 0 (0.0%) | 0 (0.0%) |
| $25,000 to $34,999 | 0 (0.0%) | 0 (0.0%) |
| $35,000 to $49,999 | 11 (16.7%) | 0 (0.0%) |
| $50,000 to $74,999 | 16 (24.2%) | 30 (83.3%) |
| $75,000 to $99,999 | 11 (16.7%) | 6 (16.7%) |
| $100,000 to $149,999 | 14 (21.2%) | 0 (0.0%) |
| $150,000 or more | 7 (10.6%) | 0 (0.0%) |
| Total | 66 (100.0%) | 36 (100.0%) |
Monthly Housing Cost Tiers in Homeland
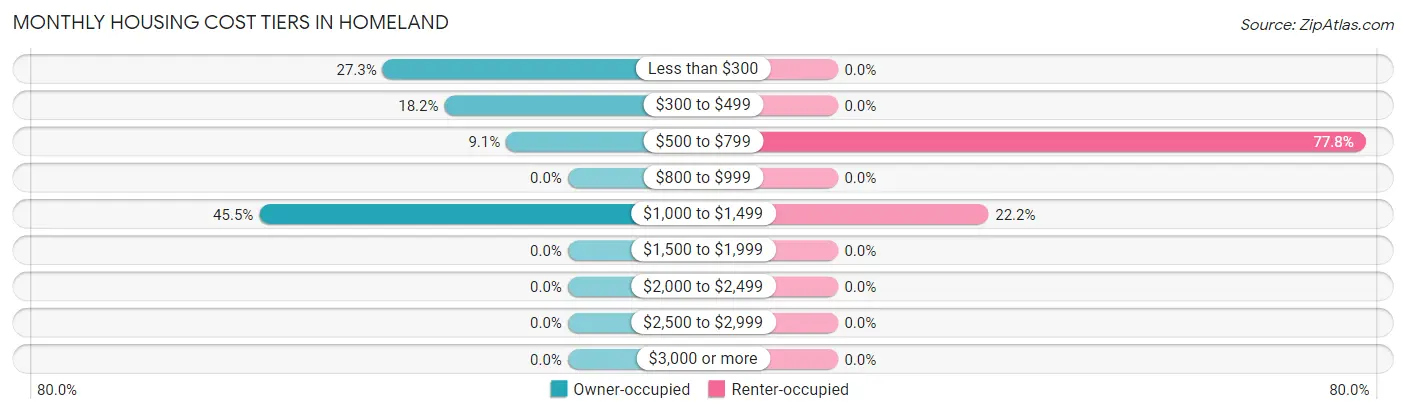
| Monthly Cost | Owner-occupied | Renter-occupied |
| Less than $300 | 18 (27.3%) | 0 (0.0%) |
| $300 to $499 | 12 (18.2%) | 0 (0.0%) |
| $500 to $799 | 6 (9.1%) | 28 (77.8%) |
| $800 to $999 | 0 (0.0%) | 0 (0.0%) |
| $1,000 to $1,499 | 30 (45.5%) | 8 (22.2%) |
| $1,500 to $1,999 | 0 (0.0%) | 0 (0.0%) |
| $2,000 to $2,499 | 0 (0.0%) | 0 (0.0%) |
| $2,500 to $2,999 | 0 (0.0%) | 0 (0.0%) |
| $3,000 or more | 0 (0.0%) | 0 (0.0%) |
| Total | 66 (100.0%) | 36 (100.0%) |
Physical Housing Characteristics in Homeland
Housing Structures in Homeland
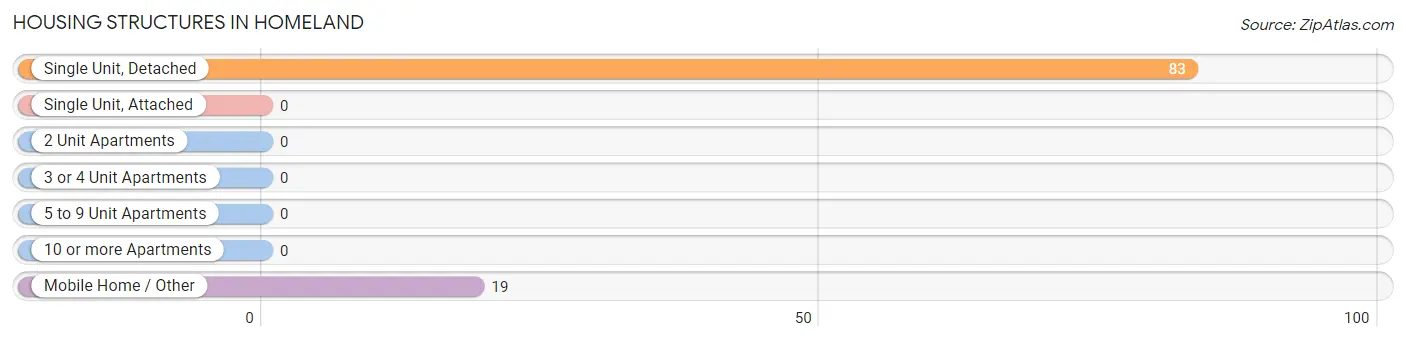
| Structure Type | # Housing Units | % Housing Units |
| Single Unit, Detached | 83 | 81.4% |
| Single Unit, Attached | 0 | 0.0% |
| 2 Unit Apartments | 0 | 0.0% |
| 3 or 4 Unit Apartments | 0 | 0.0% |
| 5 to 9 Unit Apartments | 0 | 0.0% |
| 10 or more Apartments | 0 | 0.0% |
| Mobile Home / Other | 19 | 18.6% |
| Total | 102 | 100.0% |
Housing Structures by Occupancy in Homeland
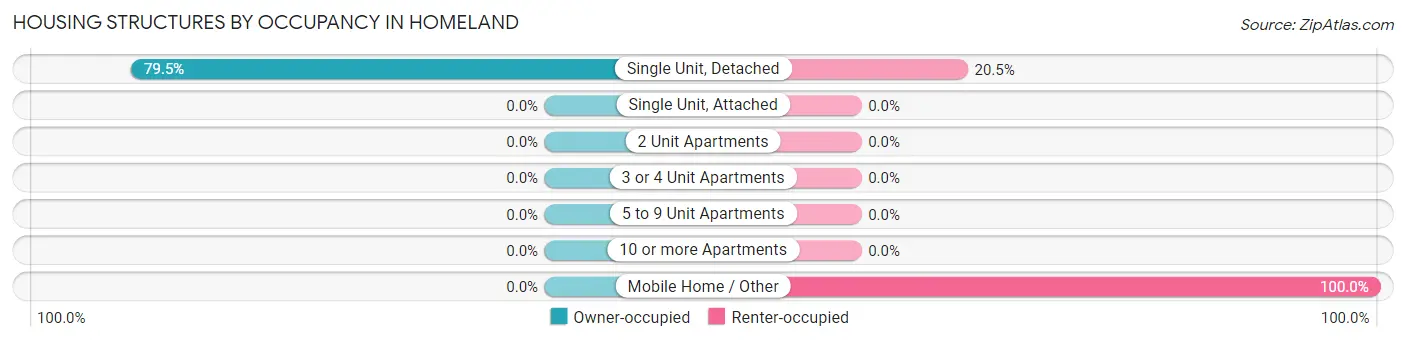
| Structure Type | Owner-occupied | Renter-occupied |
| Single Unit, Detached | 66 (79.5%) | 17 (20.5%) |
| Single Unit, Attached | 0 (0.0%) | 0 (0.0%) |
| 2 Unit Apartments | 0 (0.0%) | 0 (0.0%) |
| 3 or 4 Unit Apartments | 0 (0.0%) | 0 (0.0%) |
| 5 to 9 Unit Apartments | 0 (0.0%) | 0 (0.0%) |
| 10 or more Apartments | 0 (0.0%) | 0 (0.0%) |
| Mobile Home / Other | 0 (0.0%) | 19 (100.0%) |
| Total | 66 (64.7%) | 36 (35.3%) |
Housing Structures by Number of Rooms in Homeland
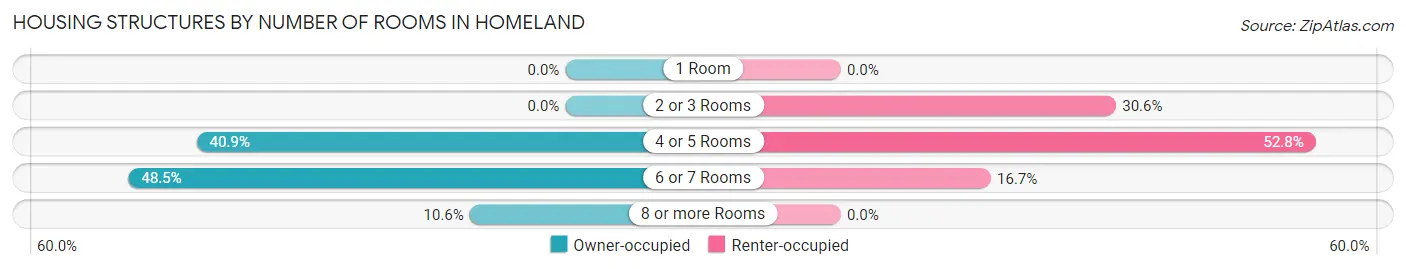
| Number of Rooms | Owner-occupied | Renter-occupied |
| 1 Room | 0 (0.0%) | 0 (0.0%) |
| 2 or 3 Rooms | 0 (0.0%) | 11 (30.6%) |
| 4 or 5 Rooms | 27 (40.9%) | 19 (52.8%) |
| 6 or 7 Rooms | 32 (48.5%) | 6 (16.7%) |
| 8 or more Rooms | 7 (10.6%) | 0 (0.0%) |
| Total | 66 (100.0%) | 36 (100.0%) |
Housing Structure by Heating Type in Homeland
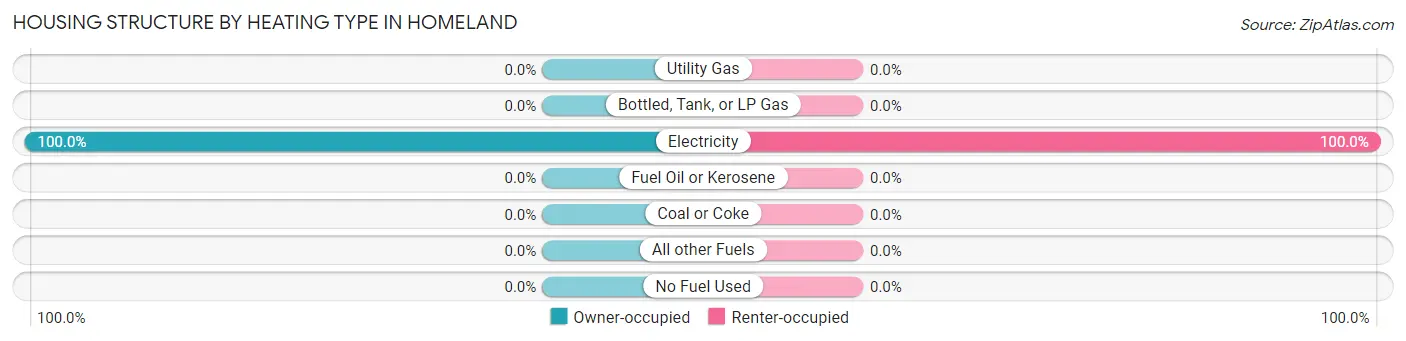
| Heating Type | Owner-occupied | Renter-occupied |
| Utility Gas | 0 (0.0%) | 0 (0.0%) |
| Bottled, Tank, or LP Gas | 0 (0.0%) | 0 (0.0%) |
| Electricity | 66 (100.0%) | 36 (100.0%) |
| Fuel Oil or Kerosene | 0 (0.0%) | 0 (0.0%) |
| Coal or Coke | 0 (0.0%) | 0 (0.0%) |
| All other Fuels | 0 (0.0%) | 0 (0.0%) |
| No Fuel Used | 0 (0.0%) | 0 (0.0%) |
| Total | 66 (100.0%) | 36 (100.0%) |
Household Vehicle Usage in Homeland
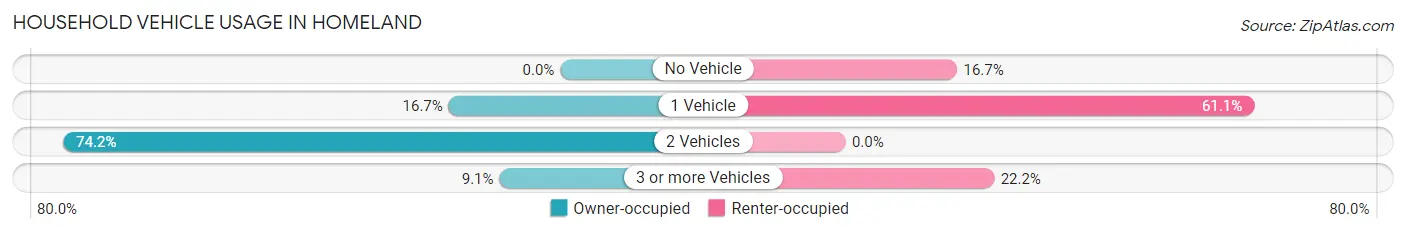
| Vehicles per Household | Owner-occupied | Renter-occupied |
| No Vehicle | 0 (0.0%) | 6 (16.7%) |
| 1 Vehicle | 11 (16.7%) | 22 (61.1%) |
| 2 Vehicles | 49 (74.2%) | 0 (0.0%) |
| 3 or more Vehicles | 6 (9.1%) | 8 (22.2%) |
| Total | 66 (100.0%) | 36 (100.0%) |
Real Estate & Mortgages in Homeland
Real Estate and Mortgage Overview in Homeland
| Characteristic | Without Mortgage | With Mortgage |
| Housing Units | 30 | 36 |
| Median Property Value | $97,300 | $0 |
| Median Household Income | - | - |
| Monthly Housing Costs | $279 | $0 |
| Real Estate Taxes | $1,286 | $0 |
Property Value by Mortgage Status in Homeland
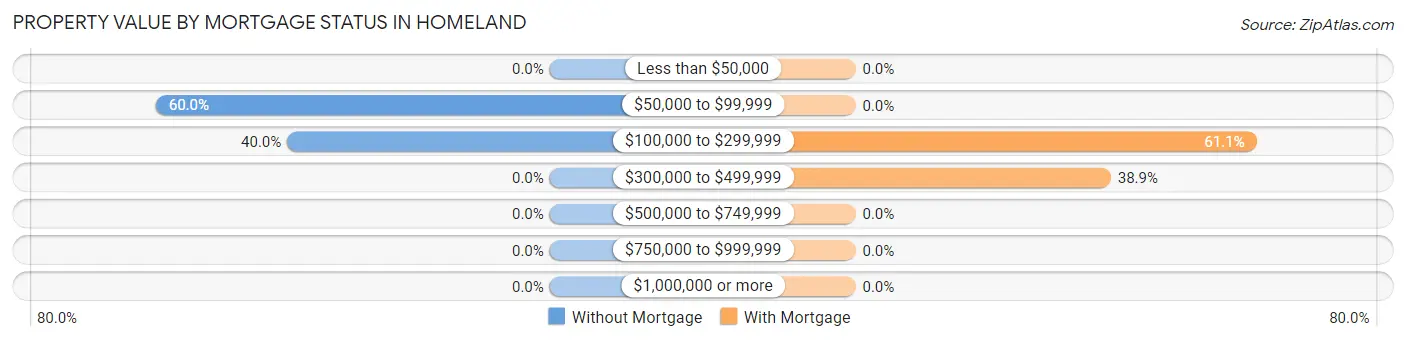
| Property Value | Without Mortgage | With Mortgage |
| Less than $50,000 | 0 (0.0%) | 0 (0.0%) |
| $50,000 to $99,999 | 18 (60.0%) | 0 (0.0%) |
| $100,000 to $299,999 | 12 (40.0%) | 22 (61.1%) |
| $300,000 to $499,999 | 0 (0.0%) | 14 (38.9%) |
| $500,000 to $749,999 | 0 (0.0%) | 0 (0.0%) |
| $750,000 to $999,999 | 0 (0.0%) | 0 (0.0%) |
| $1,000,000 or more | 0 (0.0%) | 0 (0.0%) |
| Total | 30 (100.0%) | 36 (100.0%) |
Household Income by Mortgage Status in Homeland
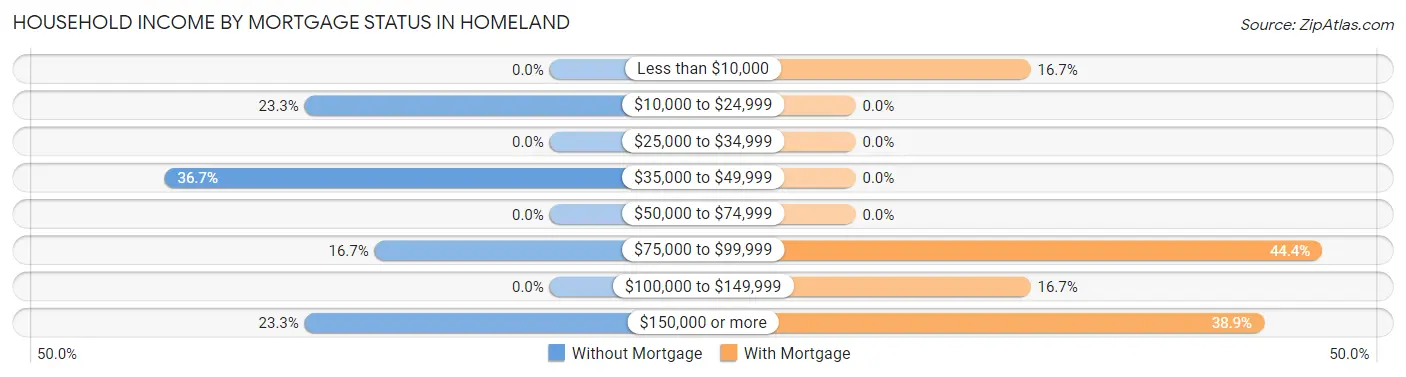
| Household Income | Without Mortgage | With Mortgage |
| Less than $10,000 | 0 (0.0%) | 6 (16.7%) |
| $10,000 to $24,999 | 7 (23.3%) | 0 (0.0%) |
| $25,000 to $34,999 | 0 (0.0%) | 0 (0.0%) |
| $35,000 to $49,999 | 11 (36.7%) | 0 (0.0%) |
| $50,000 to $74,999 | 0 (0.0%) | 0 (0.0%) |
| $75,000 to $99,999 | 5 (16.7%) | 16 (44.4%) |
| $100,000 to $149,999 | 0 (0.0%) | 6 (16.7%) |
| $150,000 or more | 7 (23.3%) | 14 (38.9%) |
| Total | 30 (100.0%) | 36 (100.0%) |
Property Value to Household Income Ratio in Homeland
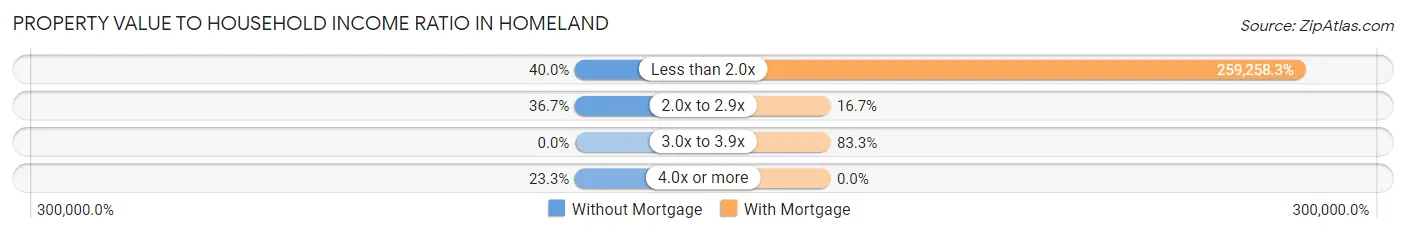
| Value-to-Income Ratio | Without Mortgage | With Mortgage |
| Less than 2.0x | 12 (40.0%) | 93,333 (259,258.3%) |
| 2.0x to 2.9x | 11 (36.7%) | 6 (16.7%) |
| 3.0x to 3.9x | 0 (0.0%) | 30 (83.3%) |
| 4.0x or more | 7 (23.3%) | 0 (0.0%) |
| Total | 30 (100.0%) | 36 (100.0%) |
Real Estate Taxes by Mortgage Status in Homeland
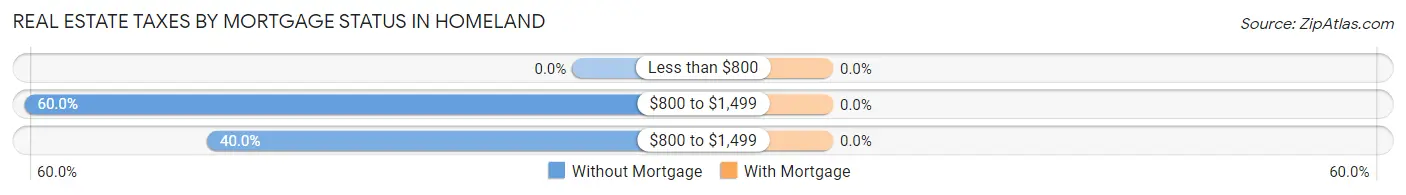
| Property Taxes | Without Mortgage | With Mortgage |
| Less than $800 | 0 (0.0%) | 0 (0.0%) |
| $800 to $1,499 | 18 (60.0%) | 0 (0.0%) |
| $800 to $1,499 | 12 (40.0%) | 0 (0.0%) |
| Total | 30 (100.0%) | 36 (100.0%) |
Health & Disability in Homeland
Health Insurance Coverage by Age in Homeland
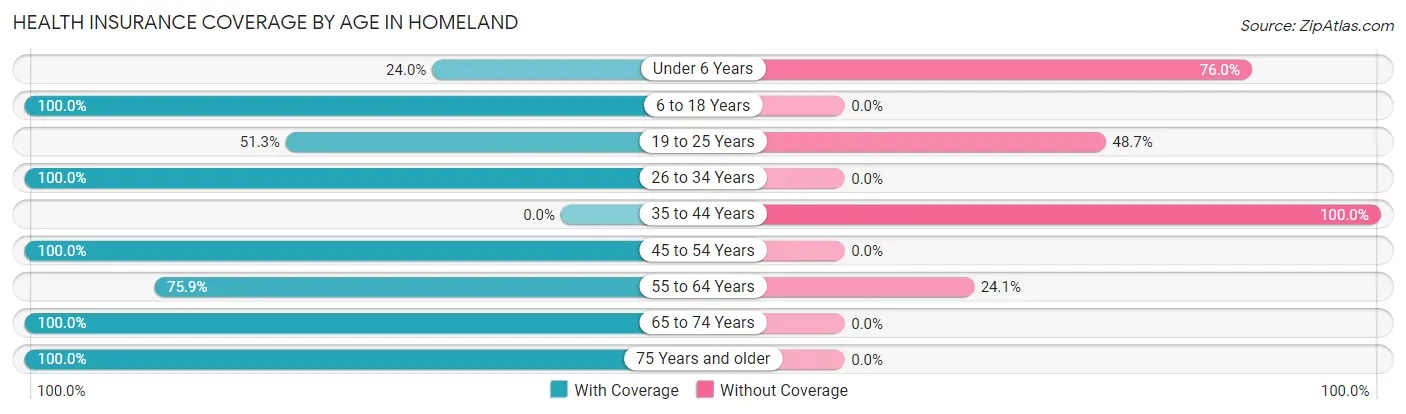
| Age Bracket | With Coverage | Without Coverage |
| Under 6 Years | 6 (24.0%) | 19 (76.0%) |
| 6 to 18 Years | 31 (100.0%) | 0 (0.0%) |
| 19 to 25 Years | 20 (51.3%) | 19 (48.7%) |
| 26 to 34 Years | 14 (100.0%) | 0 (0.0%) |
| 35 to 44 Years | 0 (0.0%) | 32 (100.0%) |
| 45 to 54 Years | 5 (100.0%) | 0 (0.0%) |
| 55 to 64 Years | 44 (75.9%) | 14 (24.1%) |
| 65 to 74 Years | 59 (100.0%) | 0 (0.0%) |
| 75 Years and older | 11 (100.0%) | 0 (0.0%) |
| Total | 190 (69.3%) | 84 (30.7%) |
Health Insurance Coverage by Citizenship Status in Homeland
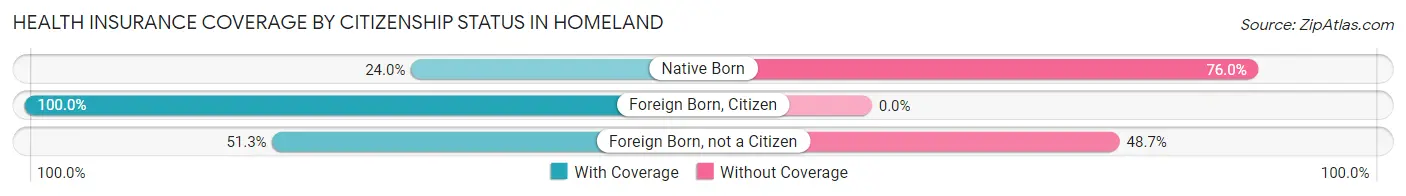
| Citizenship Status | With Coverage | Without Coverage |
| Native Born | 6 (24.0%) | 19 (76.0%) |
| Foreign Born, Citizen | 31 (100.0%) | 0 (0.0%) |
| Foreign Born, not a Citizen | 20 (51.3%) | 19 (48.7%) |
Health Insurance Coverage by Household Income in Homeland
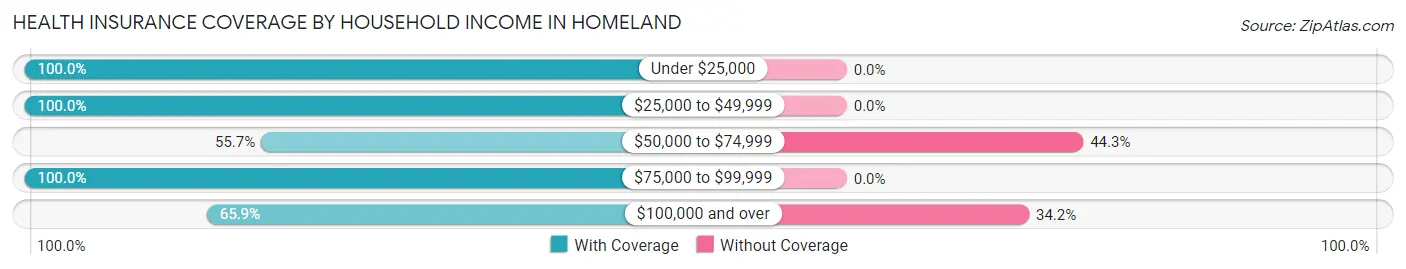
| Household Income | With Coverage | Without Coverage |
| Under $25,000 | 13 (100.0%) | 0 (0.0%) |
| $25,000 to $49,999 | 11 (100.0%) | 0 (0.0%) |
| $50,000 to $74,999 | 88 (55.7%) | 70 (44.3%) |
| $75,000 to $99,999 | 51 (100.0%) | 0 (0.0%) |
| $100,000 and over | 27 (65.8%) | 14 (34.2%) |
Public vs Private Health Insurance Coverage by Age in Homeland
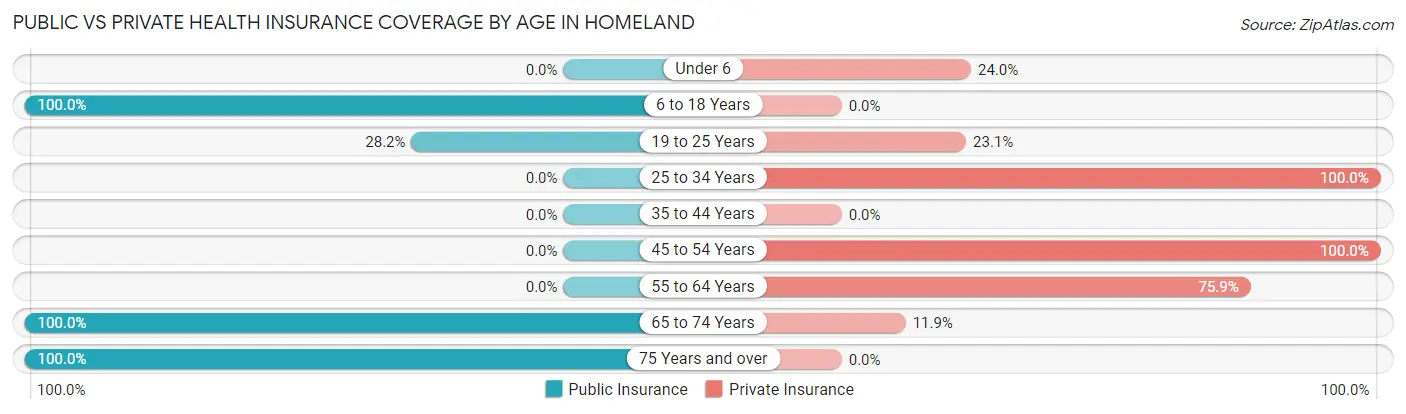
| Age Bracket | Public Insurance | Private Insurance |
| Under 6 | 0 (0.0%) | 6 (24.0%) |
| 6 to 18 Years | 31 (100.0%) | 0 (0.0%) |
| 19 to 25 Years | 11 (28.2%) | 9 (23.1%) |
| 25 to 34 Years | 0 (0.0%) | 14 (100.0%) |
| 35 to 44 Years | 0 (0.0%) | 0 (0.0%) |
| 45 to 54 Years | 0 (0.0%) | 5 (100.0%) |
| 55 to 64 Years | 0 (0.0%) | 44 (75.9%) |
| 65 to 74 Years | 59 (100.0%) | 7 (11.9%) |
| 75 Years and over | 11 (100.0%) | 0 (0.0%) |
| Total | 112 (40.9%) | 85 (31.0%) |
Disability Status by Sex by Age in Homeland
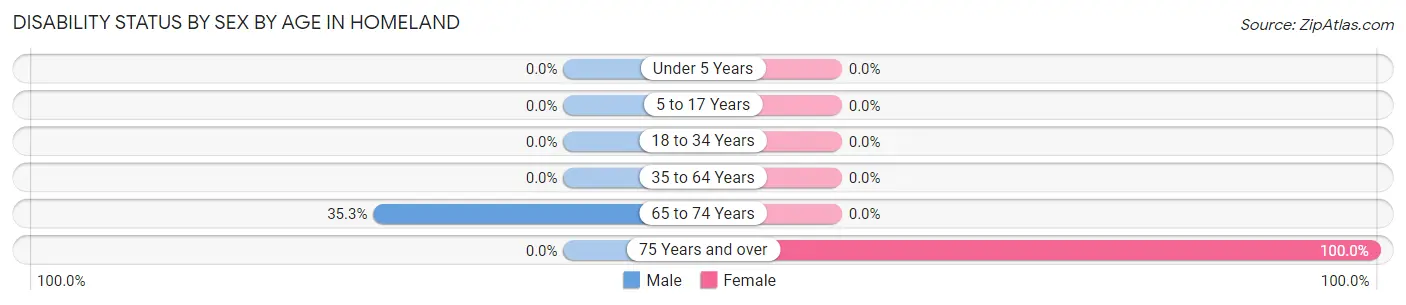
| Age Bracket | Male | Female |
| Under 5 Years | 0 (0.0%) | 0 (0.0%) |
| 5 to 17 Years | 0 (0.0%) | 0 (0.0%) |
| 18 to 34 Years | 0 (0.0%) | 0 (0.0%) |
| 35 to 64 Years | 0 (0.0%) | 0 (0.0%) |
| 65 to 74 Years | 6 (35.3%) | 0 (0.0%) |
| 75 Years and over | 0 (0.0%) | 11 (100.0%) |
Disability Class by Sex by Age in Homeland
Disability Class: Hearing Difficulty
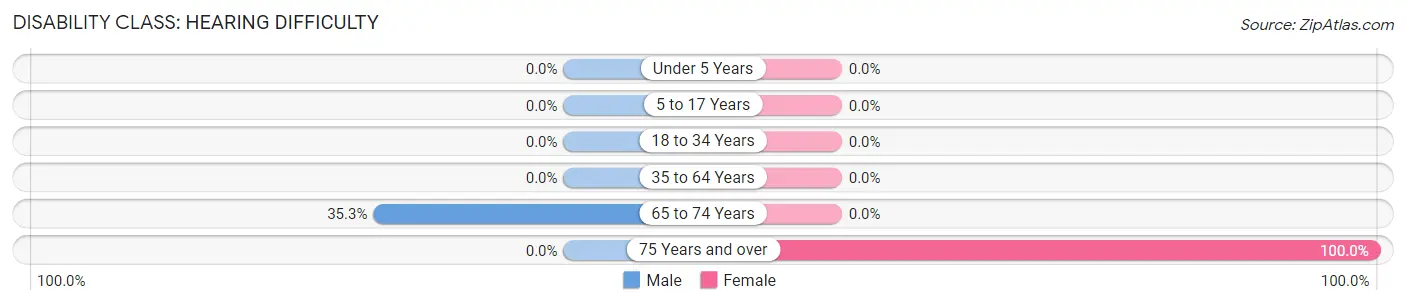
| Age Bracket | Male | Female |
| Under 5 Years | 0 (0.0%) | 0 (0.0%) |
| 5 to 17 Years | 0 (0.0%) | 0 (0.0%) |
| 18 to 34 Years | 0 (0.0%) | 0 (0.0%) |
| 35 to 64 Years | 0 (0.0%) | 0 (0.0%) |
| 65 to 74 Years | 6 (35.3%) | 0 (0.0%) |
| 75 Years and over | 0 (0.0%) | 11 (100.0%) |
Disability Class: Vision Difficulty
| Age Bracket | Male | Female |
| Under 5 Years | 0 (0.0%) | 0 (0.0%) |
| 5 to 17 Years | 0 (0.0%) | 0 (0.0%) |
| 18 to 34 Years | 0 (0.0%) | 0 (0.0%) |
| 35 to 64 Years | 0 (0.0%) | 0 (0.0%) |
| 65 to 74 Years | 0 (0.0%) | 0 (0.0%) |
| 75 Years and over | 0 (0.0%) | 0 (0.0%) |
Disability Class: Cognitive Difficulty
| Age Bracket | Male | Female |
| 5 to 17 Years | 0 (0.0%) | 0 (0.0%) |
| 18 to 34 Years | 0 (0.0%) | 0 (0.0%) |
| 35 to 64 Years | 0 (0.0%) | 0 (0.0%) |
| 65 to 74 Years | 0 (0.0%) | 0 (0.0%) |
| 75 Years and over | 0 (0.0%) | 0 (0.0%) |
Disability Class: Ambulatory Difficulty
| Age Bracket | Male | Female |
| 5 to 17 Years | 0 (0.0%) | 0 (0.0%) |
| 18 to 34 Years | 0 (0.0%) | 0 (0.0%) |
| 35 to 64 Years | 0 (0.0%) | 0 (0.0%) |
| 65 to 74 Years | 0 (0.0%) | 0 (0.0%) |
| 75 Years and over | 0 (0.0%) | 0 (0.0%) |
Disability Class: Self-Care Difficulty
| Age Bracket | Male | Female |
| 5 to 17 Years | 0 (0.0%) | 0 (0.0%) |
| 18 to 34 Years | 0 (0.0%) | 0 (0.0%) |
| 35 to 64 Years | 0 (0.0%) | 0 (0.0%) |
| 65 to 74 Years | 0 (0.0%) | 0 (0.0%) |
| 75 Years and over | 0 (0.0%) | 0 (0.0%) |
Technology Access in Homeland
Computing Device Access in Homeland
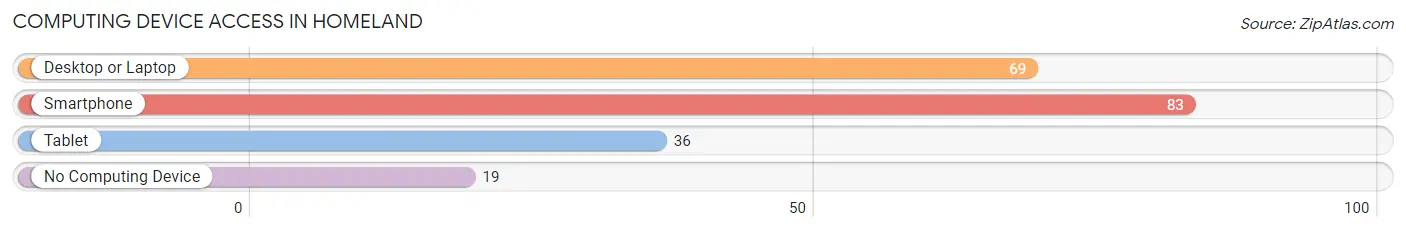
| Device Type | # Households | % Households |
| Desktop or Laptop | 69 | 67.6% |
| Smartphone | 83 | 81.4% |
| Tablet | 36 | 35.3% |
| No Computing Device | 19 | 18.6% |
| Total | 102 | 100.0% |
Internet Access in Homeland
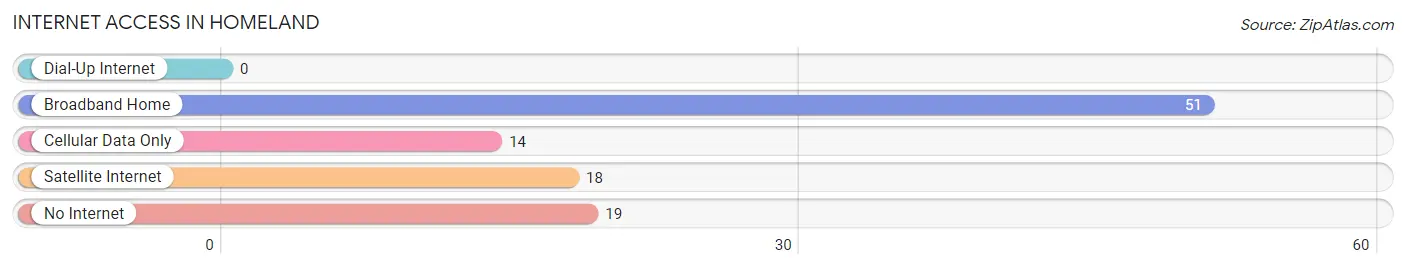
| Internet Type | # Households | % Households |
| Dial-Up Internet | 0 | 0.0% |
| Broadband Home | 51 | 50.0% |
| Cellular Data Only | 14 | 13.7% |
| Satellite Internet | 18 | 17.6% |
| No Internet | 19 | 18.6% |
| Total | 102 | 100.0% |
Homeland Summary
Homeland is a small unincorporated community located in Pasco County, Florida. It is situated in the northern part of the county, approximately 20 miles north of Tampa. The community is bordered by the cities of Zephyrhills and Dade City, and is part of the Tampa-St. Petersburg-Clearwater Metropolitan Statistical Area.
History
The area that is now Homeland was first settled in the late 1800s by a group of settlers from Georgia. The settlers were attracted to the area due to its fertile soil and abundant wildlife. The community was originally known as “Hickory Hill”, but the name was changed to “Homeland” in the early 1900s.
The community was largely agricultural in nature, with citrus groves and cattle ranches being the primary sources of income. The area was also home to a number of small businesses, including a general store, a post office, and a blacksmith shop.
In the 1950s, the area began to experience rapid growth due to the influx of new residents from the northern states. This growth was further accelerated by the construction of the Suncoast Parkway in the late 1990s, which provided easy access to Tampa and other nearby cities.
Geography
Homeland is located in northern Pasco County, approximately 20 miles north of Tampa. The community is bordered by the cities of Zephyrhills and Dade City, and is part of the Tampa-St. Petersburg-Clearwater Metropolitan Statistical Area.
The area is characterized by rolling hills and flatlands, with the highest point being located at an elevation of approximately 100 feet. The area is also home to a number of lakes, including Lake Jovita, Lake Iola, and Lake Geneva.
Economy
The economy of Homeland is largely based on agriculture and tourism. The area is home to a number of citrus groves and cattle ranches, as well as a number of small businesses. The community is also home to a number of tourist attractions, including the Florida State Fairgrounds and the Pasco County Fairgrounds.
In recent years, the area has seen an influx of new businesses, including a number of retail stores, restaurants, and hotels. The area is also home to a number of industrial parks, which provide employment opportunities for local residents.
Demographics
As of the 2010 census, the population of Homeland was 2,845. The racial makeup of the community was 79.3% White, 15.2% African American, 0.7% Native American, 0.7% Asian, 0.1% Pacific Islander, and 3.9% from other races. The median household income was $41,944, and the median family income was $50,944.
The majority of the population (90.2%) identified as Christian, with the largest denominations being Baptist (44.2%), Methodist (17.2%), and Catholic (14.2%). The remaining population identified as non-religious (7.2%) or other religions (2.4%).
Conclusion
Homeland is a small unincorporated community located in Pasco County, Florida. It is situated in the northern part of the county, approximately 20 miles north of Tampa. The community is bordered by the cities of Zephyrhills and Dade City, and is part of the Tampa-St. Petersburg-Clearwater Metropolitan Statistical Area. The area is characterized by rolling hills and flatlands, with the highest point being located at an elevation of approximately 100 feet. The economy of Homeland is largely based on agriculture and tourism, and the population of the community was 2,845 as of the 2010 census. The majority of the population identified as Christian, with the largest denominations being Baptist, Methodist, and Catholic.
Common Questions
What is Per Capita Income in Homeland?
Per Capita income in Homeland is $31,005.
What is the Median Family Income in Homeland?
Median Family Income in Homeland is $66,797.
What is the Median Household income in Homeland?
Median Household Income in Homeland is $65,469.
What is Inequality or Gini Index in Homeland?
Inequality or Gini Index in Homeland is 0.31.
What is the Total Population of Homeland?
Total Population of Homeland is 274.
What is the Total Male Population of Homeland?
Total Male Population of Homeland is 157.
What is the Total Female Population of Homeland?
Total Female Population of Homeland is 117.
What is the Ratio of Males per 100 Females in Homeland?
There are 134.19 Males per 100 Females in Homeland.
What is the Ratio of Females per 100 Males in Homeland?
There are 74.52 Females per 100 Males in Homeland.
What is the Median Population Age in Homeland?
Median Population Age in Homeland is 37.8 Years.
What is the Average Family Size in Homeland
Average Family Size in Homeland is 2.8 People.
What is the Average Household Size in Homeland
Average Household Size in Homeland is 2.7 People.
How Large is the Labor Force in Homeland?
There are 111 People in the Labor Forcein in Homeland.
What is the Percentage of People in the Labor Force in Homeland?
47.8% of People are in the Labor Force in Homeland.