Tangerine, FL Map & Demographics
Tangerine Map
Tangerine Overview
$44,587
PER CAPITA INCOME
$123,438
AVG FAMILY INCOME
$107,880
AVG HOUSEHOLD INCOME
2.2%
WAGE / INCOME GAP [ % ]
97.8¢/ $1
WAGE / INCOME GAP [ $ ]
0.38
INEQUALITY / GINI INDEX
3,870
TOTAL POPULATION
2,118
MALE POPULATION
1,752
FEMALE POPULATION
120.89
MALES / 100 FEMALES
82.72
FEMALES / 100 MALES
41.2
MEDIAN AGE
3.3
AVG FAMILY SIZE
3.0
AVG HOUSEHOLD SIZE
2,092
LABOR FORCE [ PEOPLE ]
65.9%
PERCENT IN LABOR FORCE
2.5%
UNEMPLOYMENT RATE
Tangerine Area Codes
Income in Tangerine
Income Overview in Tangerine
Per Capita Income in Tangerine is $44,587, while median incomes of families and households are $123,438 and $107,880 respectively.
| Characteristic | Number | Measure |
| Per Capita Income | 3,870 | $44,587 |
| Median Family Income | 1,064 | $123,438 |
| Mean Family Income | 1,064 | $140,898 |
| Median Household Income | 1,265 | $107,880 |
| Mean Household Income | 1,265 | $132,382 |
| Income Deficit | 1,064 | $0 |
| Wage / Income Gap (%) | 3,870 | 2.15% |
| Wage / Income Gap ($) | 3,870 | 97.85¢ per $1 |
| Gini / Inequality Index | 3,870 | 0.38 |
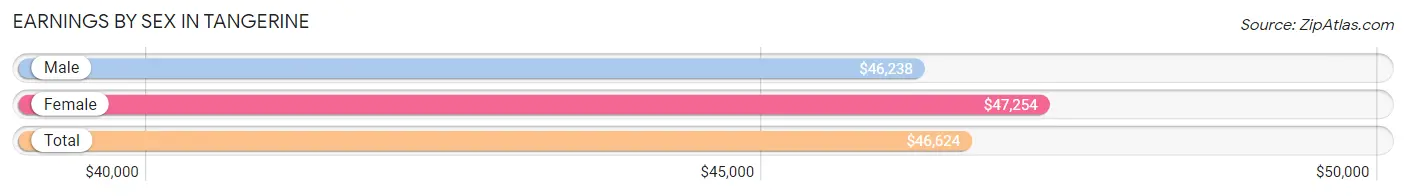
Earnings by Sex in Tangerine
Average Earnings in Tangerine are $46,624, $46,238 for men and $47,254 for women, a difference of 2.1%.
| Sex | Number | Average Earnings |
| Male | 1,263 (58.9%) | $46,238 |
| Female | 881 (41.1%) | $47,254 |
| Total | 2,144 (100.0%) | $46,624 |
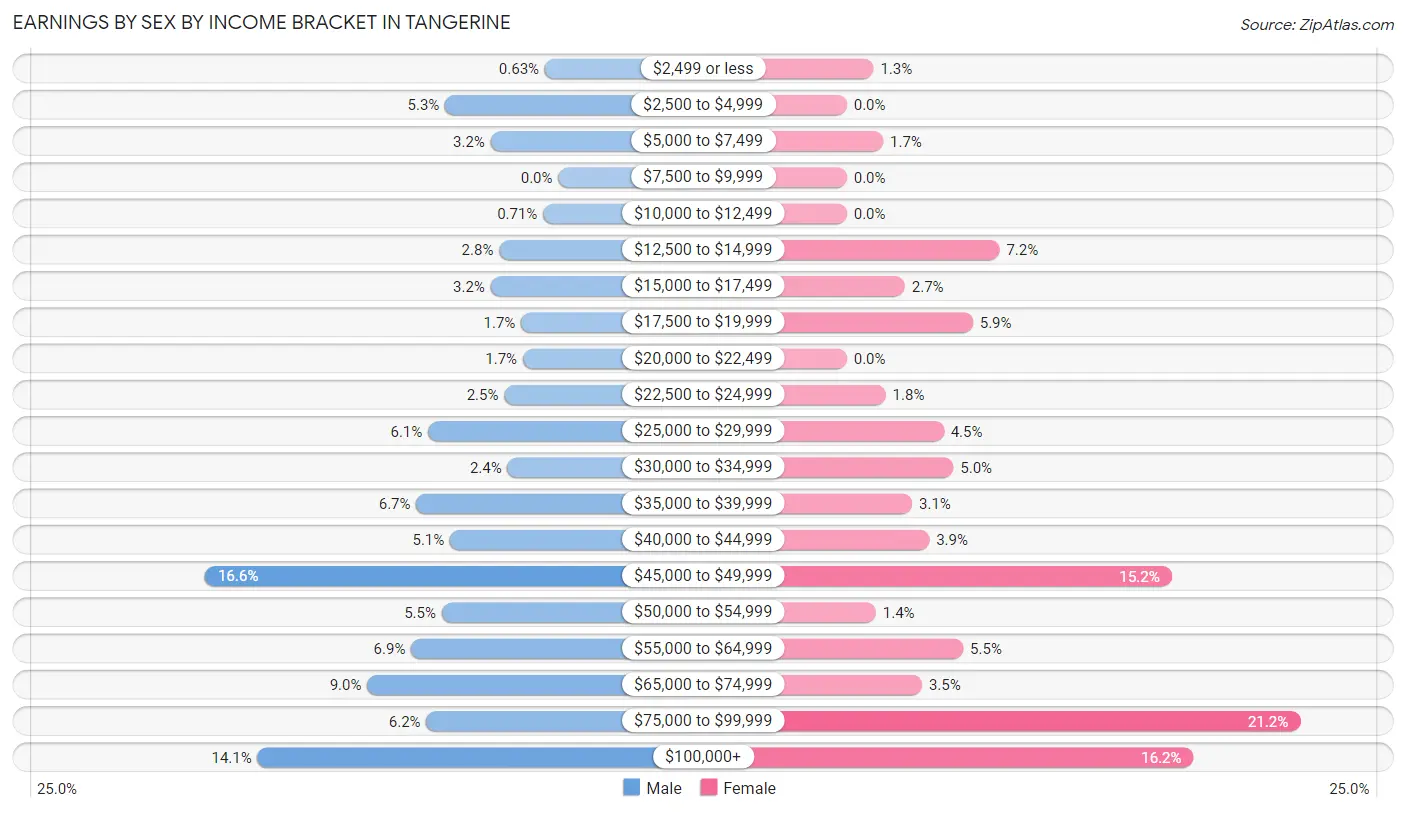
Earnings by Sex by Income Bracket in Tangerine
The most common earnings brackets in Tangerine are $45,000 to $49,999 for men (209 | 16.6%) and $75,000 to $99,999 for women (187 | 21.2%).
| Income | Male | Female |
| $2,499 or less | 8 (0.6%) | 11 (1.3%) |
| $2,500 to $4,999 | 67 (5.3%) | 0 (0.0%) |
| $5,000 to $7,499 | 40 (3.2%) | 15 (1.7%) |
| $7,500 to $9,999 | 0 (0.0%) | 0 (0.0%) |
| $10,000 to $12,499 | 9 (0.7%) | 0 (0.0%) |
| $12,500 to $14,999 | 35 (2.8%) | 63 (7.1%) |
| $15,000 to $17,499 | 40 (3.2%) | 24 (2.7%) |
| $17,500 to $19,999 | 22 (1.7%) | 52 (5.9%) |
| $20,000 to $22,499 | 21 (1.7%) | 0 (0.0%) |
| $22,500 to $24,999 | 32 (2.5%) | 16 (1.8%) |
| $25,000 to $29,999 | 77 (6.1%) | 40 (4.5%) |
| $30,000 to $34,999 | 30 (2.4%) | 44 (5.0%) |
| $35,000 to $39,999 | 84 (6.7%) | 27 (3.1%) |
| $40,000 to $44,999 | 64 (5.1%) | 34 (3.9%) |
| $45,000 to $49,999 | 209 (16.6%) | 134 (15.2%) |
| $50,000 to $54,999 | 69 (5.5%) | 12 (1.4%) |
| $55,000 to $64,999 | 87 (6.9%) | 48 (5.4%) |
| $65,000 to $74,999 | 113 (8.9%) | 31 (3.5%) |
| $75,000 to $99,999 | 78 (6.2%) | 187 (21.2%) |
| $100,000+ | 178 (14.1%) | 143 (16.2%) |
| Total | 1,263 (100.0%) | 881 (100.0%) |
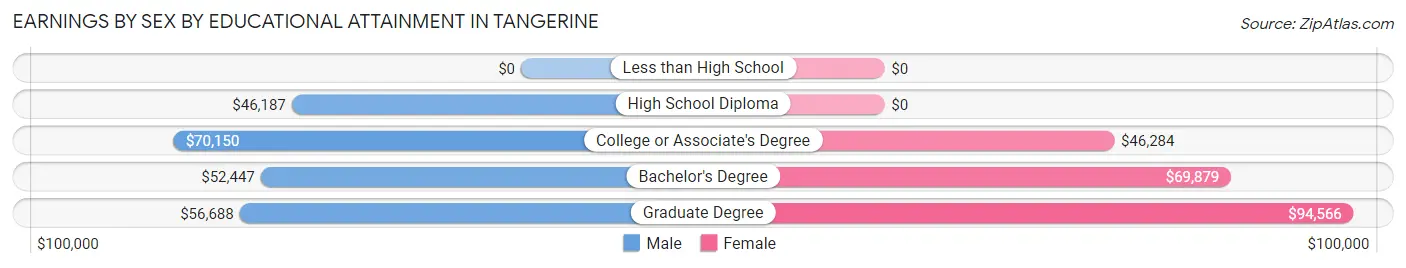
Earnings by Sex by Educational Attainment in Tangerine
Average earnings in Tangerine are $47,337 for men and $47,254 for women, a difference of 0.2%. Men with an educational attainment of college or associate's degree enjoy the highest average annual earnings of $70,150, while those with high school diploma education earn the least with $46,187. Women with an educational attainment of graduate degree earn the most with the average annual earnings of $94,566, while those with college or associate's degree education have the smallest earnings of $46,284.
| Educational Attainment | Male Income | Female Income |
| Less than High School | - | - |
| High School Diploma | $46,187 | $0 |
| College or Associate's Degree | $70,150 | $46,284 |
| Bachelor's Degree | $52,447 | $69,879 |
| Graduate Degree | $56,688 | $94,566 |
| Total | $47,337 | $47,254 |
Family Income in Tangerine
Family Income Brackets in Tangerine
According to the Tangerine family income data, there are 265 families falling into the $100,000 to $149,999 income range, which is the most common income bracket and makes up 24.9% of all families.
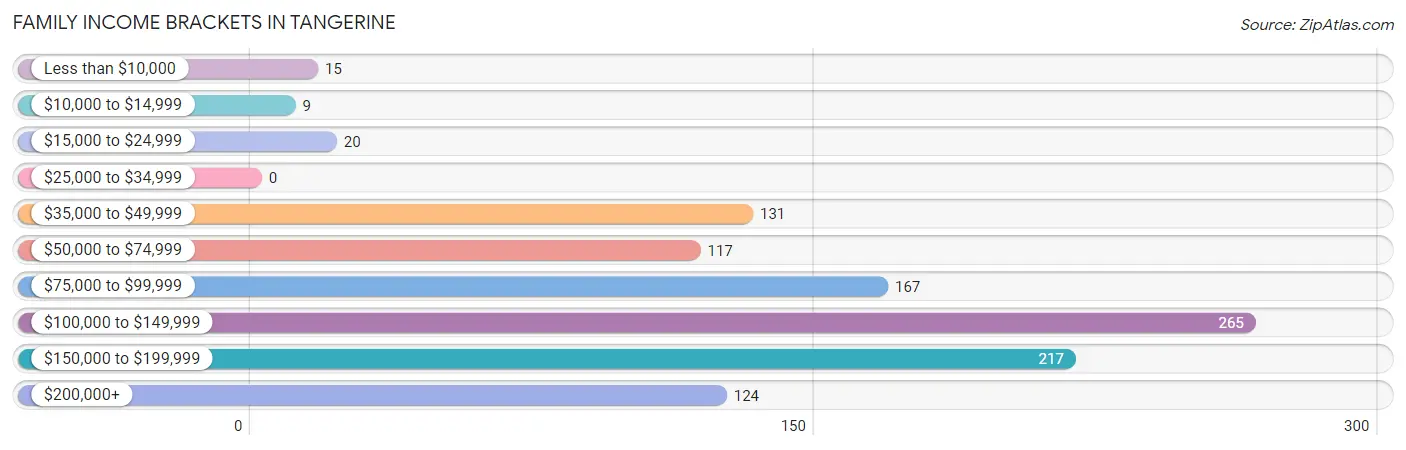
| Income Bracket | # Families | % Families |
| Less than $10,000 | 15 | 1.4% |
| $10,000 to $14,999 | 9 | 0.8% |
| $15,000 to $24,999 | 20 | 1.9% |
| $25,000 to $34,999 | 0 | 0.0% |
| $35,000 to $49,999 | 131 | 12.3% |
| $50,000 to $74,999 | 117 | 11.0% |
| $75,000 to $99,999 | 167 | 15.7% |
| $100,000 to $149,999 | 265 | 24.9% |
| $150,000 to $199,999 | 217 | 20.4% |
| $200,000+ | 124 | 11.7% |
Family Income by Famaliy Size in Tangerine
4-person families (308 | 28.9%) account for the highest median family income in Tangerine with $155,619 per family, while 2-person families (518 | 48.7%) have the highest median income of $49,054 per family member.
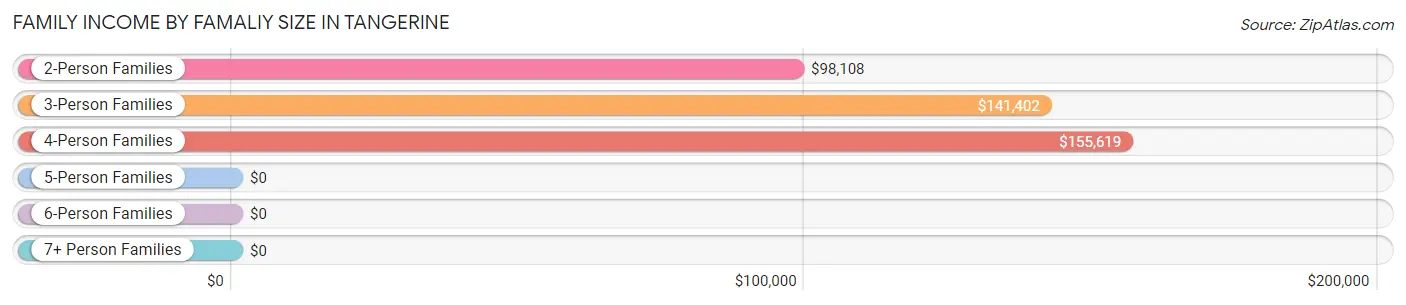
| Income Bracket | # Families | Median Income |
| 2-Person Families | 518 (48.7%) | $98,108 |
| 3-Person Families | 101 (9.5%) | $141,402 |
| 4-Person Families | 308 (28.9%) | $155,619 |
| 5-Person Families | 98 (9.2%) | $0 |
| 6-Person Families | 16 (1.5%) | $0 |
| 7+ Person Families | 23 (2.2%) | $0 |
| Total | 1,064 (100.0%) | $123,438 |
Family Income by Number of Earners in Tangerine
The median family income in Tangerine is $123,438, with families comprising 3+ earners (134) having the highest median family income of $138,462, while families with no earners (140) have the lowest median family income of $49,773, accounting for 12.6% and 13.2% of families, respectively.
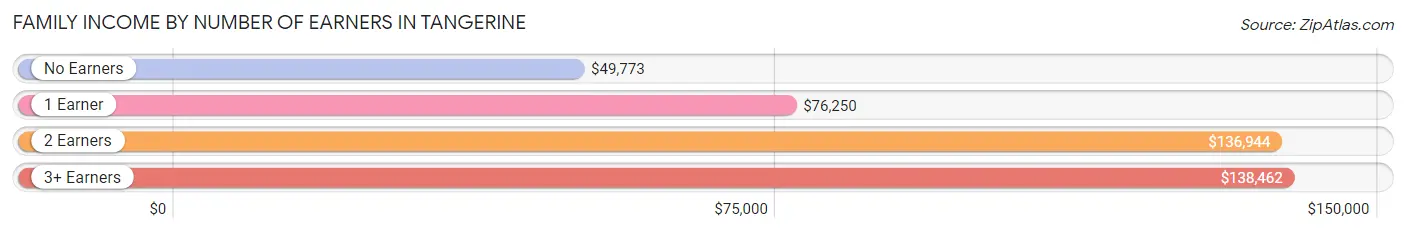
| Number of Earners | # Families | Median Income |
| No Earners | 140 (13.2%) | $49,773 |
| 1 Earner | 210 (19.7%) | $76,250 |
| 2 Earners | 580 (54.5%) | $136,944 |
| 3+ Earners | 134 (12.6%) | $138,462 |
| Total | 1,064 (100.0%) | $123,438 |
Household Income in Tangerine
Household Income Brackets in Tangerine
With 295 households falling in the category, the $100,000 to $149,999 income range is the most frequent in Tangerine, accounting for 23.3% of all households. In contrast, only 8 households (0.6%) fall into the $10,000 to $14,999 income bracket, making it the least populous group.
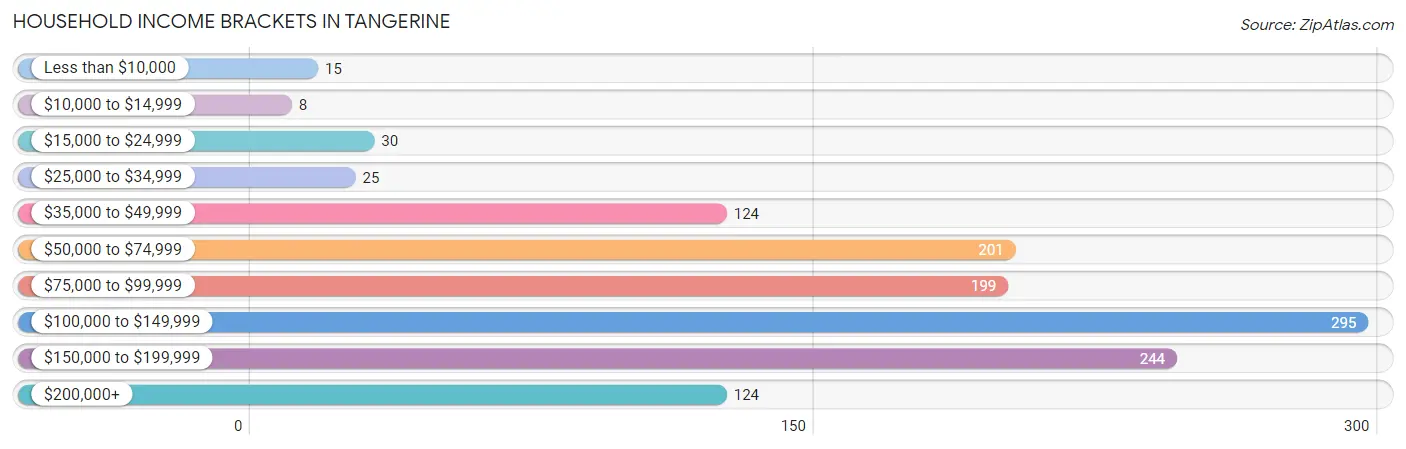
| Income Bracket | # Households | % Households |
| Less than $10,000 | 15 | 1.2% |
| $10,000 to $14,999 | 8 | 0.6% |
| $15,000 to $24,999 | 30 | 2.4% |
| $25,000 to $34,999 | 25 | 2.0% |
| $35,000 to $49,999 | 124 | 9.8% |
| $50,000 to $74,999 | 201 | 15.9% |
| $75,000 to $99,999 | 199 | 15.7% |
| $100,000 to $149,999 | 295 | 23.3% |
| $150,000 to $199,999 | 244 | 19.3% |
| $200,000+ | 124 | 9.8% |
Household Income by Householder Age in Tangerine
The median household income in Tangerine is $107,880, with the highest median household income of $135,602 found in the 25 to 44 years age bracket for the primary householder. A total of 349 households (27.6%) fall into this category.
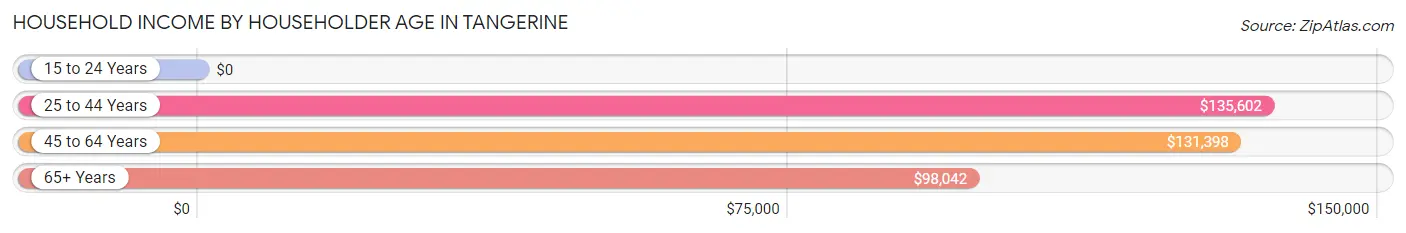
| Income Bracket | # Households | Median Income |
| 15 to 24 Years | 0 (0.0%) | $0 |
| 25 to 44 Years | 349 (27.6%) | $135,602 |
| 45 to 64 Years | 497 (39.3%) | $131,398 |
| 65+ Years | 419 (33.1%) | $98,042 |
| Total | 1,265 (100.0%) | $107,880 |
Poverty in Tangerine
Income Below Poverty by Sex and Age in Tangerine
With 3.5% poverty level for males and 2.7% for females among the residents of Tangerine, 35 to 44 year old males and 18 to 24 year old females are the most vulnerable to poverty, with 42 males (8.5%) and 9 females (19.6%) in their respective age groups living below the poverty level.
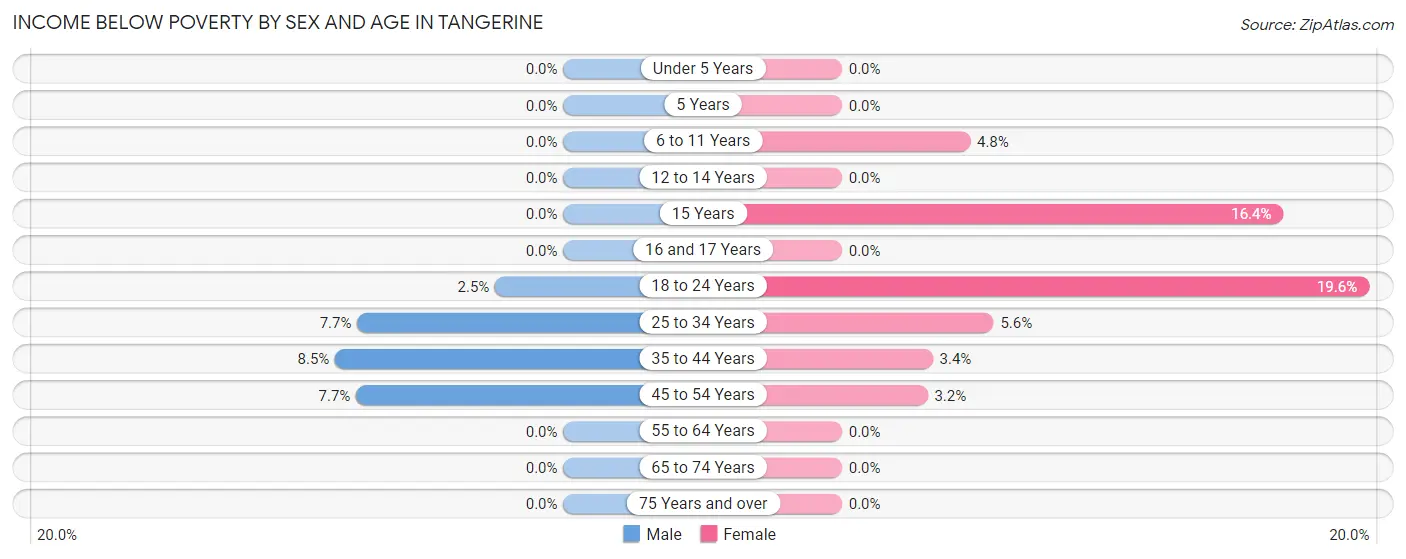
| Age Bracket | Male | Female |
| Under 5 Years | 0 (0.0%) | 0 (0.0%) |
| 5 Years | 0 (0.0%) | 0 (0.0%) |
| 6 to 11 Years | 0 (0.0%) | 6 (4.8%) |
| 12 to 14 Years | 0 (0.0%) | 0 (0.0%) |
| 15 Years | 0 (0.0%) | 10 (16.4%) |
| 16 and 17 Years | 0 (0.0%) | 0 (0.0%) |
| 18 to 24 Years | 7 (2.5%) | 9 (19.6%) |
| 25 to 34 Years | 14 (7.6%) | 8 (5.6%) |
| 35 to 44 Years | 42 (8.5%) | 9 (3.4%) |
| 45 to 54 Years | 10 (7.7%) | 5 (3.2%) |
| 55 to 64 Years | 0 (0.0%) | 0 (0.0%) |
| 65 to 74 Years | 0 (0.0%) | 0 (0.0%) |
| 75 Years and over | 0 (0.0%) | 0 (0.0%) |
| Total | 73 (3.5%) | 47 (2.7%) |
Income Above Poverty by Sex and Age in Tangerine
According to the poverty statistics in Tangerine, males aged under 5 years and females aged under 5 years are the age groups that are most secure financially, with 100.0% of males and 100.0% of females in these age groups living above the poverty line.
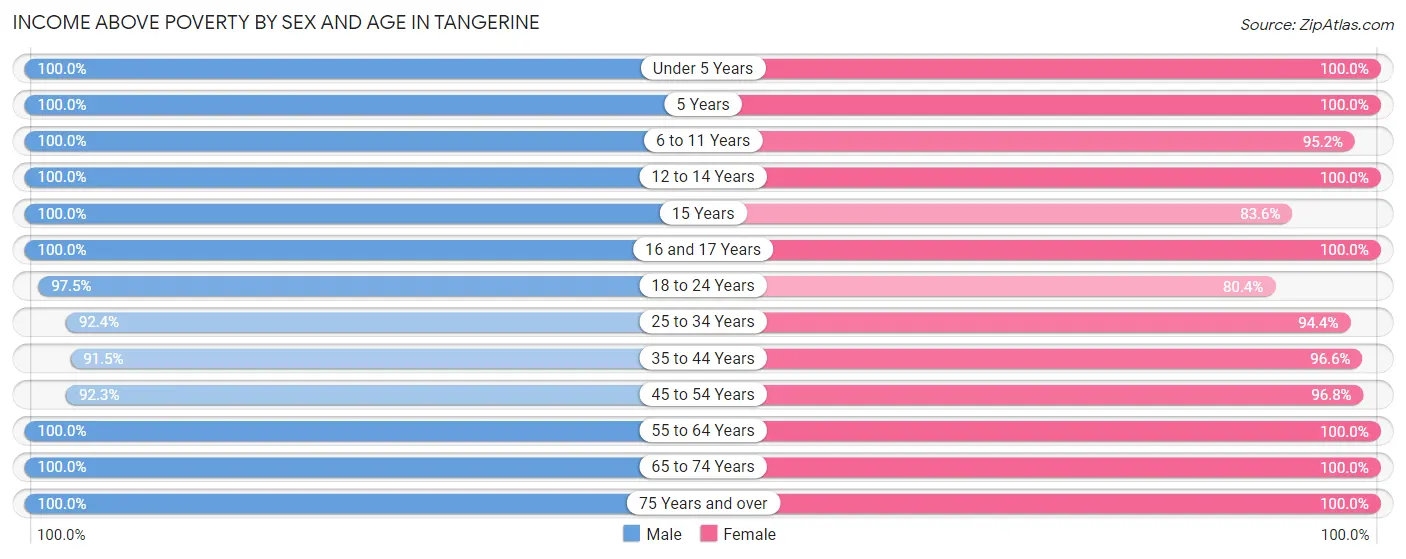
| Age Bracket | Male | Female |
| Under 5 Years | 7 (100.0%) | 102 (100.0%) |
| 5 Years | 11 (100.0%) | 23 (100.0%) |
| 6 to 11 Years | 151 (100.0%) | 120 (95.2%) |
| 12 to 14 Years | 55 (100.0%) | 108 (100.0%) |
| 15 Years | 52 (100.0%) | 51 (83.6%) |
| 16 and 17 Years | 84 (100.0%) | 89 (100.0%) |
| 18 to 24 Years | 270 (97.5%) | 37 (80.4%) |
| 25 to 34 Years | 169 (92.3%) | 134 (94.4%) |
| 35 to 44 Years | 454 (91.5%) | 258 (96.6%) |
| 45 to 54 Years | 120 (92.3%) | 152 (96.8%) |
| 55 to 64 Years | 328 (100.0%) | 284 (100.0%) |
| 65 to 74 Years | 231 (100.0%) | 255 (100.0%) |
| 75 Years and over | 113 (100.0%) | 92 (100.0%) |
| Total | 2,045 (96.6%) | 1,705 (97.3%) |
Income Below Poverty Among Married-Couple Families in Tangerine
The poverty statistics for married-couple families in Tangerine show that 1.3% or 10 of the total 771 families live below the poverty line. Families with 1 or 2 children have the highest poverty rate of 3.8%, comprising of 10 families. On the other hand, families with no children have the lowest poverty rate of 0.0%, which includes 0 families.
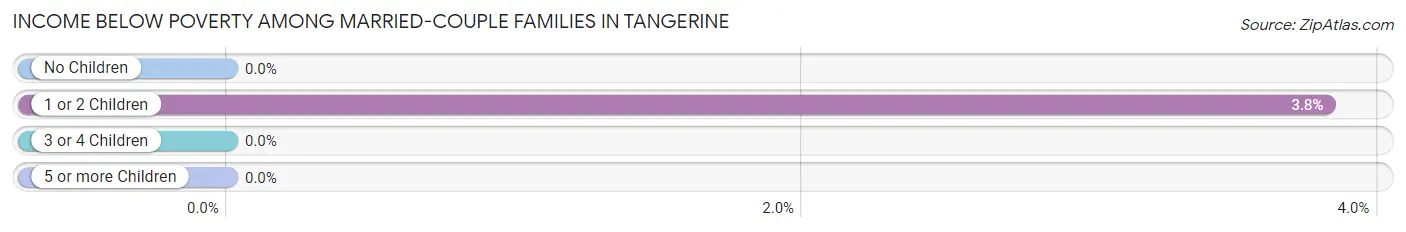
| Children | Above Poverty | Below Poverty |
| No Children | 463 (100.0%) | 0 (0.0%) |
| 1 or 2 Children | 252 (96.2%) | 10 (3.8%) |
| 3 or 4 Children | 46 (100.0%) | 0 (0.0%) |
| 5 or more Children | 0 (0.0%) | 0 (0.0%) |
| Total | 761 (98.7%) | 10 (1.3%) |
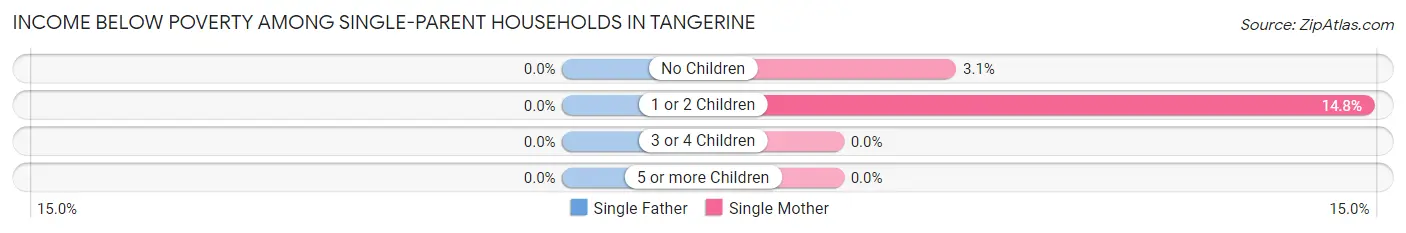
Income Below Poverty Among Single-Parent Households in Tangerine
| Children | Single Father | Single Mother |
| No Children | 0 (0.0%) | 5 (3.1%) |
| 1 or 2 Children | 0 (0.0%) | 8 (14.8%) |
| 3 or 4 Children | 0 (0.0%) | 0 (0.0%) |
| 5 or more Children | 0 (0.0%) | 0 (0.0%) |
| Total | 0 (0.0%) | 13 (6.1%) |
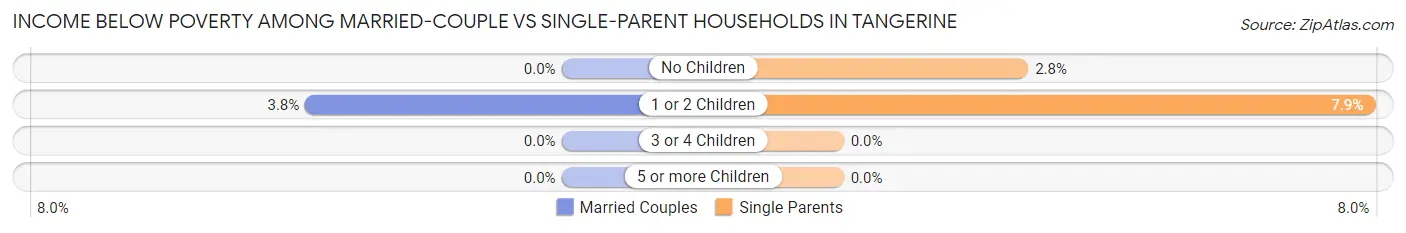
Income Below Poverty Among Married-Couple vs Single-Parent Households in Tangerine
The poverty data for Tangerine shows that 10 of the married-couple family households (1.3%) and 13 of the single-parent households (4.4%) are living below the poverty level. Within the married-couple family households, those with 1 or 2 children have the highest poverty rate, with 10 households (3.8%) falling below the poverty line. Among the single-parent households, those with 1 or 2 children have the highest poverty rate, with 8 household (7.9%) living below poverty.
| Children | Married-Couple Families | Single-Parent Households |
| No Children | 0 (0.0%) | 5 (2.8%) |
| 1 or 2 Children | 10 (3.8%) | 8 (7.9%) |
| 3 or 4 Children | 0 (0.0%) | 0 (0.0%) |
| 5 or more Children | 0 (0.0%) | 0 (0.0%) |
| Total | 10 (1.3%) | 13 (4.4%) |
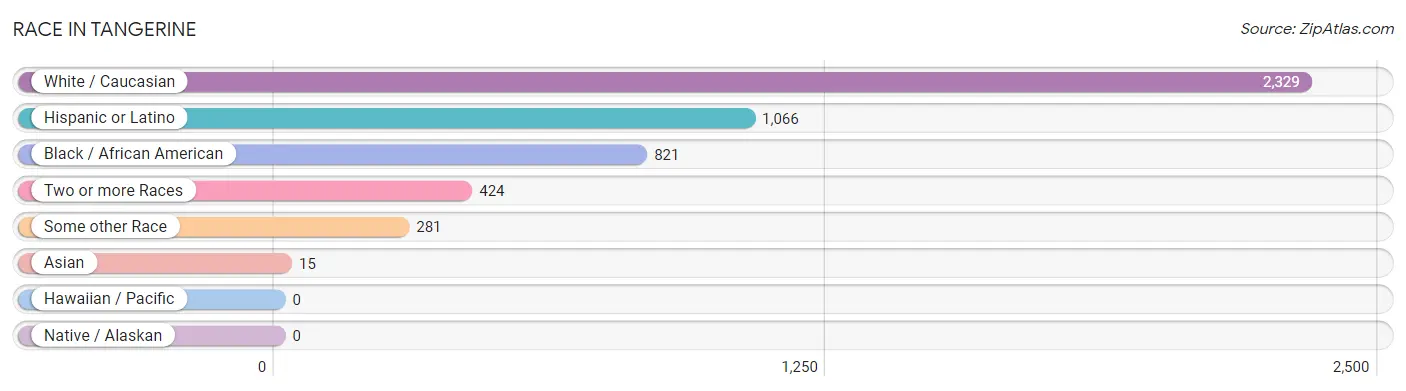
Race in Tangerine
The most populous races in Tangerine are White / Caucasian (2,329 | 60.2%), Hispanic or Latino (1,066 | 27.6%), and Black / African American (821 | 21.2%).
| Race | # Population | % Population |
| Asian | 15 | 0.4% |
| Black / African American | 821 | 21.2% |
| Hawaiian / Pacific | 0 | 0.0% |
| Hispanic or Latino | 1,066 | 27.6% |
| Native / Alaskan | 0 | 0.0% |
| White / Caucasian | 2,329 | 60.2% |
| Two or more Races | 424 | 11.0% |
| Some other Race | 281 | 7.3% |
| Total | 3,870 | 100.0% |
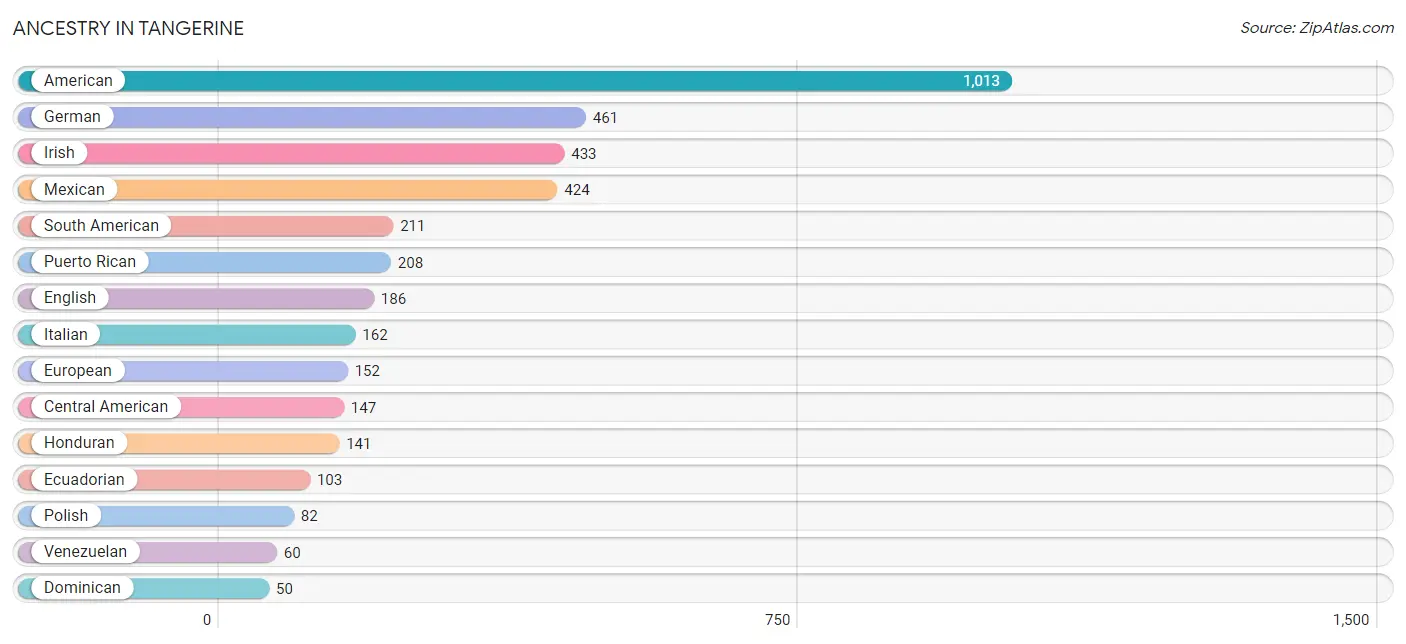
Ancestry in Tangerine
The most populous ancestries reported in Tangerine are American (1,013 | 26.2%), German (461 | 11.9%), Irish (433 | 11.2%), Mexican (424 | 11.0%), and South American (211 | 5.4%), together accounting for 65.7% of all Tangerine residents.
| Ancestry | # Population | % Population |
| American | 1,013 | 26.2% |
| Arab | 2 | 0.1% |
| British | 9 | 0.2% |
| Central American | 147 | 3.8% |
| Colombian | 48 | 1.2% |
| Costa Rican | 6 | 0.2% |
| Cuban | 8 | 0.2% |
| Dominican | 50 | 1.3% |
| Dutch | 31 | 0.8% |
| Eastern European | 8 | 0.2% |
| Ecuadorian | 103 | 2.7% |
| English | 186 | 4.8% |
| European | 152 | 3.9% |
| French | 37 | 1.0% |
| German | 461 | 11.9% |
| Greek | 22 | 0.6% |
| Honduran | 141 | 3.6% |
| Indian (Asian) | 15 | 0.4% |
| Irish | 433 | 11.2% |
| Italian | 162 | 4.2% |
| Jamaican | 13 | 0.3% |
| Mexican | 424 | 11.0% |
| Mexican American Indian | 6 | 0.2% |
| Northern European | 33 | 0.9% |
| Norwegian | 5 | 0.1% |
| Palestinian | 2 | 0.1% |
| Polish | 82 | 2.1% |
| Portuguese | 10 | 0.3% |
| Puerto Rican | 208 | 5.4% |
| Romanian | 6 | 0.2% |
| Russian | 19 | 0.5% |
| Scotch-Irish | 26 | 0.7% |
| Scottish | 7 | 0.2% |
| South American | 211 | 5.4% |
| Swedish | 25 | 0.6% |
| U.S. Virgin Islander | 42 | 1.1% |
| Ukrainian | 9 | 0.2% |
| Venezuelan | 60 | 1.5% |
| Welsh | 26 | 0.7% | View All 39 Rows |
Immigrants in Tangerine
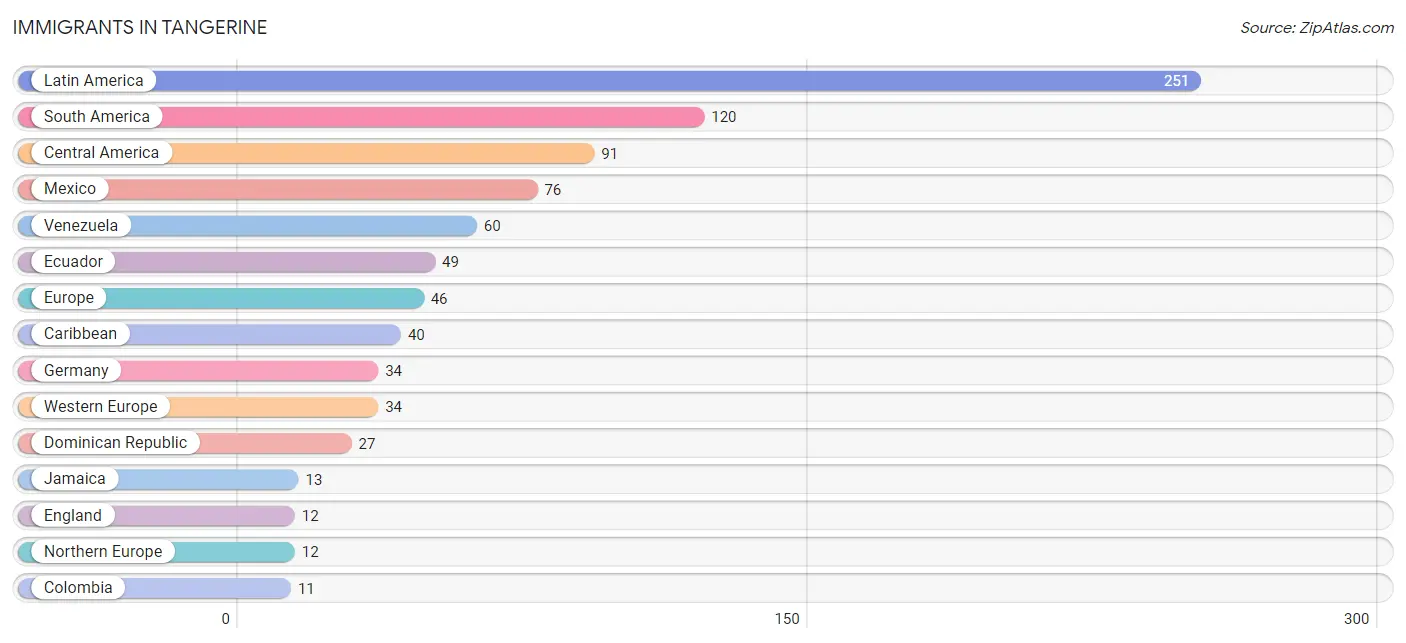
The most numerous immigrant groups reported in Tangerine came from Latin America (251 | 6.5%), South America (120 | 3.1%), Central America (91 | 2.4%), Mexico (76 | 2.0%), and Venezuela (60 | 1.5%), together accounting for 15.5% of all Tangerine residents.
| Immigration Origin | # Population | % Population |
| Caribbean | 40 | 1.0% |
| Central America | 91 | 2.4% |
| Colombia | 11 | 0.3% |
| Costa Rica | 6 | 0.2% |
| Dominican Republic | 27 | 0.7% |
| Ecuador | 49 | 1.3% |
| England | 12 | 0.3% |
| Europe | 46 | 1.2% |
| Germany | 34 | 0.9% |
| Guatemala | 9 | 0.2% |
| Jamaica | 13 | 0.3% |
| Latin America | 251 | 6.5% |
| Mexico | 76 | 2.0% |
| Northern Europe | 12 | 0.3% |
| South America | 120 | 3.1% |
| Venezuela | 60 | 1.5% |
| Western Europe | 34 | 0.9% | View All 17 Rows |
Sex and Age in Tangerine
Sex and Age in Tangerine
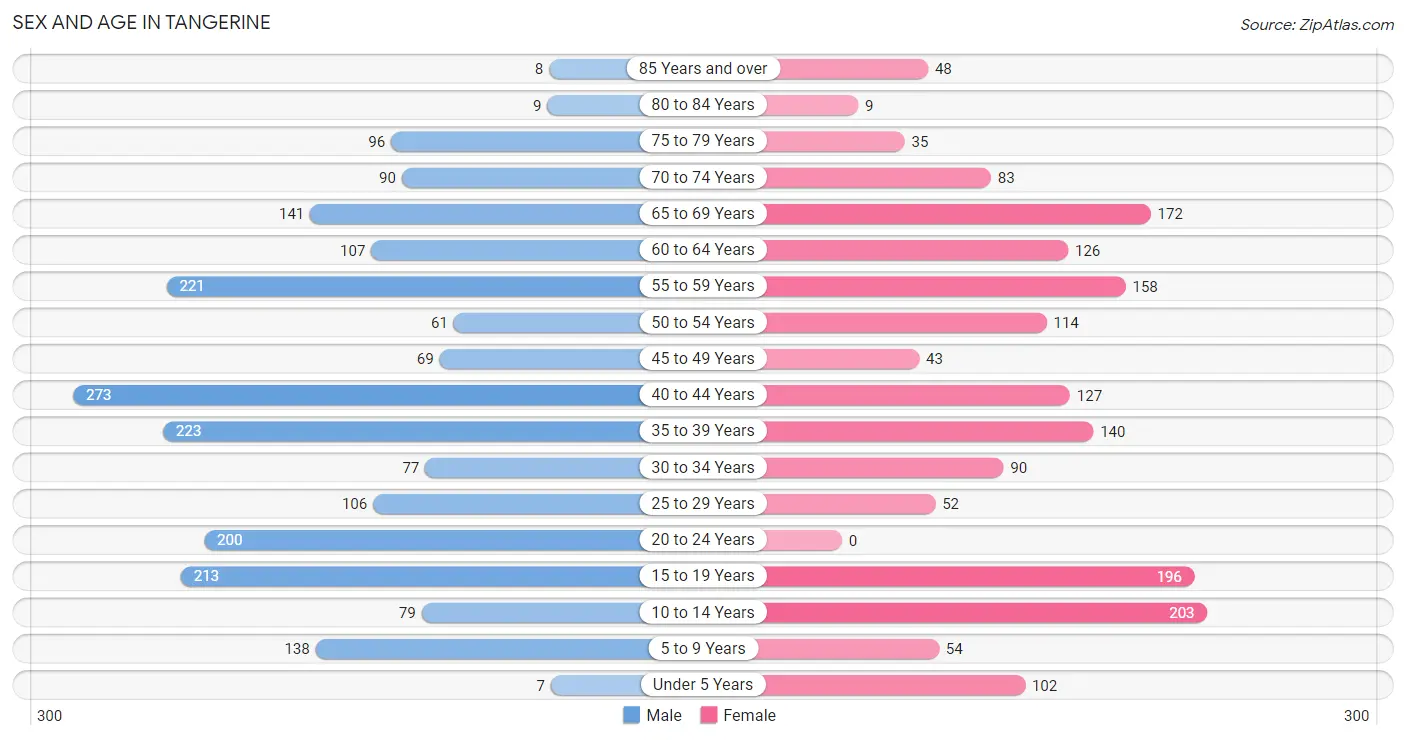
The most populous age groups in Tangerine are 40 to 44 Years (273 | 12.9%) for men and 10 to 14 Years (203 | 11.6%) for women.
| Age Bracket | Male | Female |
| Under 5 Years | 7 (0.3%) | 102 (5.8%) |
| 5 to 9 Years | 138 (6.5%) | 54 (3.1%) |
| 10 to 14 Years | 79 (3.7%) | 203 (11.6%) |
| 15 to 19 Years | 213 (10.1%) | 196 (11.2%) |
| 20 to 24 Years | 200 (9.4%) | 0 (0.0%) |
| 25 to 29 Years | 106 (5.0%) | 52 (3.0%) |
| 30 to 34 Years | 77 (3.6%) | 90 (5.1%) |
| 35 to 39 Years | 223 (10.5%) | 140 (8.0%) |
| 40 to 44 Years | 273 (12.9%) | 127 (7.2%) |
| 45 to 49 Years | 69 (3.3%) | 43 (2.5%) |
| 50 to 54 Years | 61 (2.9%) | 114 (6.5%) |
| 55 to 59 Years | 221 (10.4%) | 158 (9.0%) |
| 60 to 64 Years | 107 (5.1%) | 126 (7.2%) |
| 65 to 69 Years | 141 (6.7%) | 172 (9.8%) |
| 70 to 74 Years | 90 (4.3%) | 83 (4.7%) |
| 75 to 79 Years | 96 (4.5%) | 35 (2.0%) |
| 80 to 84 Years | 9 (0.4%) | 9 (0.5%) |
| 85 Years and over | 8 (0.4%) | 48 (2.7%) |
| Total | 2,118 (100.0%) | 1,752 (100.0%) |
Families and Households in Tangerine
Median Family Size in Tangerine
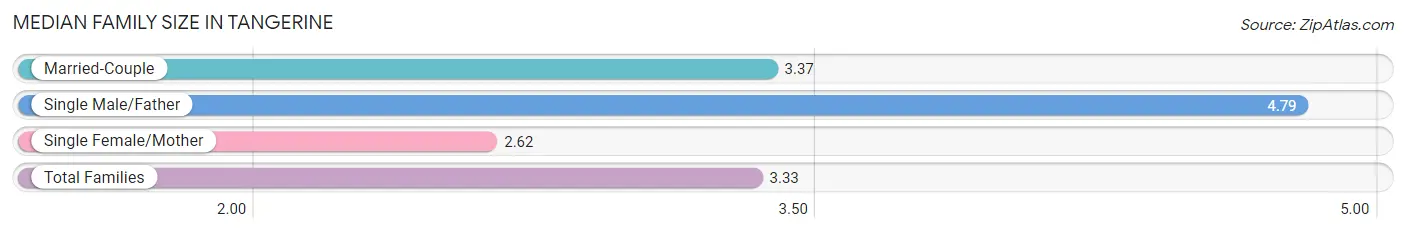
The median family size in Tangerine is 3.33 persons per family, with single male/father families (80 | 7.5%) accounting for the largest median family size of 4.79 persons per family. On the other hand, single female/mother families (213 | 20.0%) represent the smallest median family size with 2.62 persons per family.
| Family Type | # Families | Family Size |
| Married-Couple | 771 (72.5%) | 3.37 |
| Single Male/Father | 80 (7.5%) | 4.79 |
| Single Female/Mother | 213 (20.0%) | 2.62 |
| Total Families | 1,064 (100.0%) | 3.33 |
Median Household Size in Tangerine
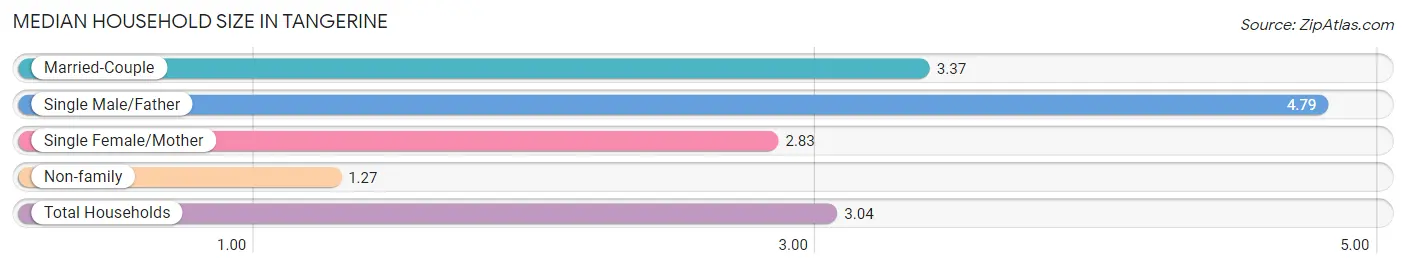
The median household size in Tangerine is 3.04 persons per household, with single male/father households (80 | 6.3%) accounting for the largest median household size of 4.79 persons per household. non-family households (201 | 15.9%) represent the smallest median household size with 1.27 persons per household.
| Household Type | # Households | Household Size |
| Married-Couple | 771 (61.0%) | 3.37 |
| Single Male/Father | 80 (6.3%) | 4.79 |
| Single Female/Mother | 213 (16.8%) | 2.83 |
| Non-family | 201 (15.9%) | 1.27 |
| Total Households | 1,265 (100.0%) | 3.04 |
Household Size by Marriage Status in Tangerine
Out of a total of 1,265 households in Tangerine, 1,064 (84.1%) are family households, while 201 (15.9%) are nonfamily households. The most numerous type of family households are 2-person households, comprising 504, and the most common type of nonfamily households are 1-person households, comprising 156.
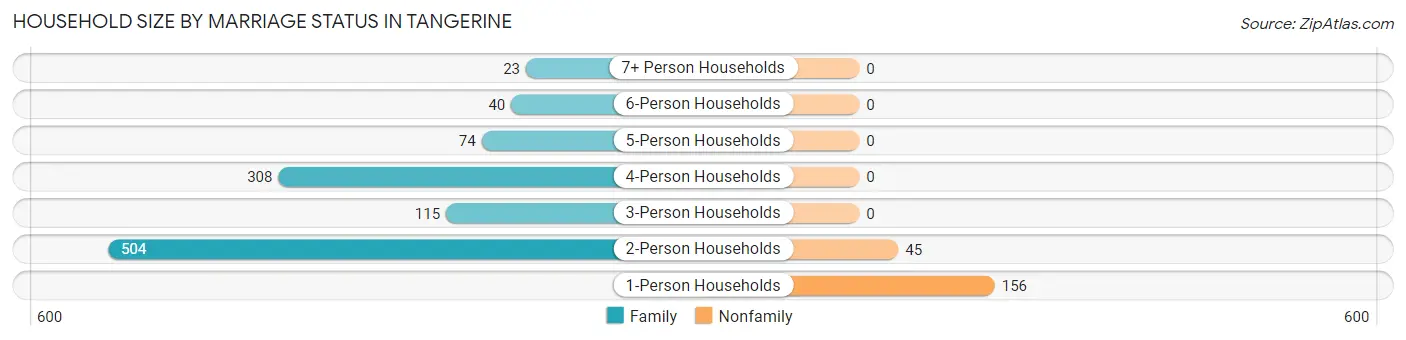
| Household Size | Family Households | Nonfamily Households |
| 1-Person Households | - | 156 (12.3%) |
| 2-Person Households | 504 (39.8%) | 45 (3.6%) |
| 3-Person Households | 115 (9.1%) | 0 (0.0%) |
| 4-Person Households | 308 (24.3%) | 0 (0.0%) |
| 5-Person Households | 74 (5.9%) | 0 (0.0%) |
| 6-Person Households | 40 (3.2%) | 0 (0.0%) |
| 7+ Person Households | 23 (1.8%) | 0 (0.0%) |
| Total | 1,064 (84.1%) | 201 (15.9%) |
Female Fertility in Tangerine
Fertility by Age in Tangerine
Average fertility rate in Tangerine is 15.0 births per 1,000 women. Women in the age bracket of 20 to 34 years have the highest fertility rate with 70.0 births per 1,000 women. Women in the age bracket of 20 to 34 years acount for 100.0% of all women with births.
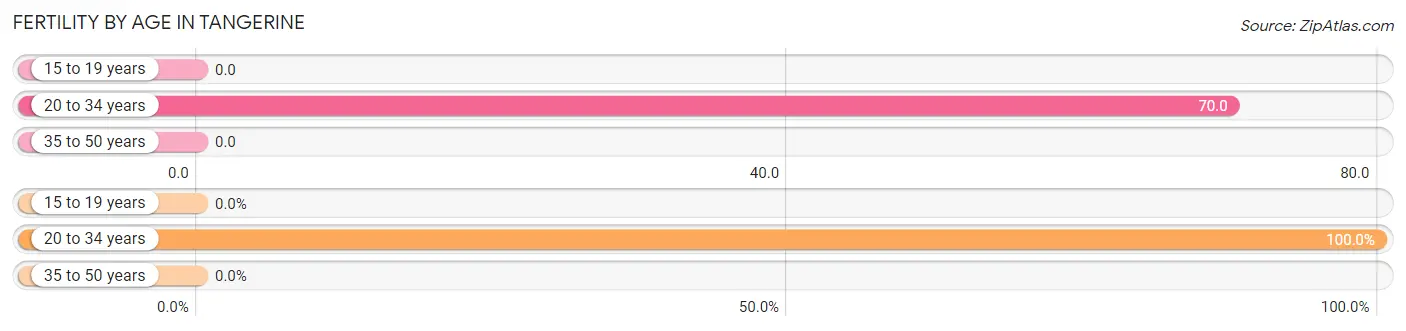
| Age Bracket | Women with Births | Births / 1,000 Women |
| 15 to 19 years | 0 (0.0%) | 0.0 |
| 20 to 34 years | 10 (100.0%) | 70.0 |
| 35 to 50 years | 0 (0.0%) | 0.0 |
| Total | 10 (100.0%) | 15.0 |
Fertility by Age by Marriage Status in Tangerine
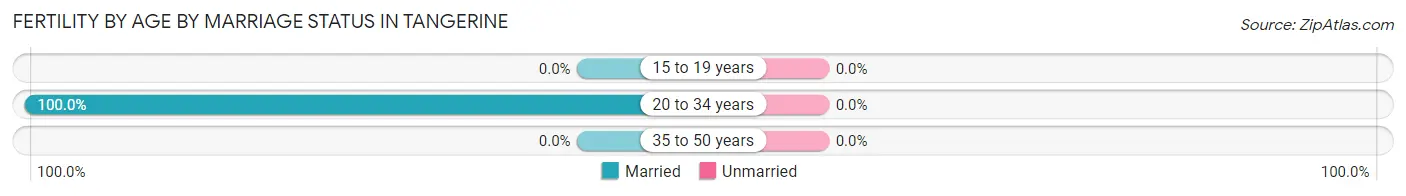
| Age Bracket | Married | Unmarried |
| 15 to 19 years | 0 (0.0%) | 0 (0.0%) |
| 20 to 34 years | 10 (100.0%) | 0 (0.0%) |
| 35 to 50 years | 0 (0.0%) | 0 (0.0%) |
| Total | 10 (100.0%) | 0 (0.0%) |
Fertility by Education in Tangerine
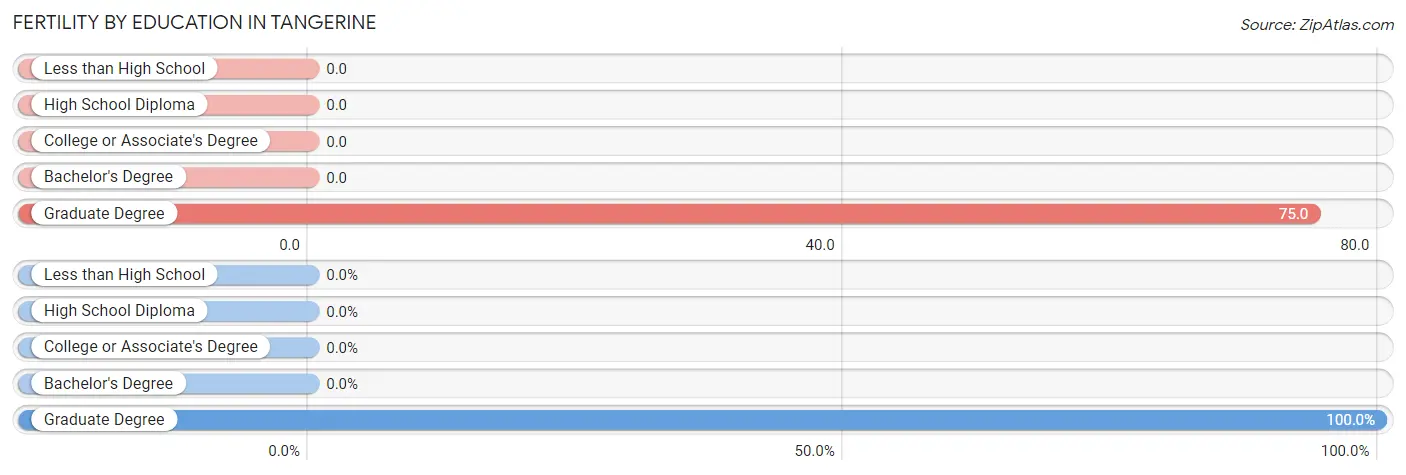
| Educational Attainment | Women with Births | Births / 1,000 Women |
| Less than High School | 0 (0.0%) | 0.0 |
| High School Diploma | 0 (0.0%) | 0.0 |
| College or Associate's Degree | 0 (0.0%) | 0.0 |
| Bachelor's Degree | 0 (0.0%) | 0.0 |
| Graduate Degree | 10 (100.0%) | 75.0 |
| Total | 10 (100.0%) | 15.0 |
Fertility by Education by Marriage Status in Tangerine
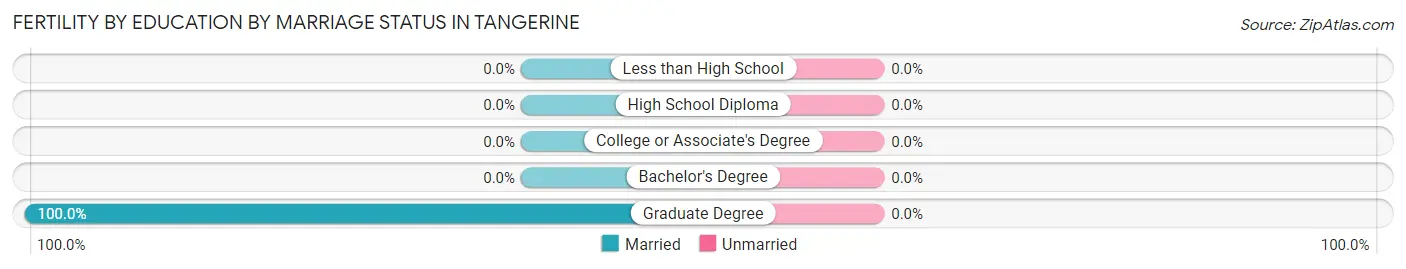
| Educational Attainment | Married | Unmarried |
| Less than High School | 0 (0.0%) | 0 (0.0%) |
| High School Diploma | 0 (0.0%) | 0 (0.0%) |
| College or Associate's Degree | 0 (0.0%) | 0 (0.0%) |
| Bachelor's Degree | 0 (0.0%) | 0 (0.0%) |
| Graduate Degree | 10 (100.0%) | 0 (0.0%) |
| Total | 10 (100.0%) | 0 (0.0%) |
Employment Characteristics in Tangerine
Employment by Class of Employer in Tangerine
Among the 2,031 employed individuals in Tangerine, private company employees (1,437 | 70.8%), self-employed (not incorporated) (172 | 8.5%), and not-for-profit organizations (130 | 6.4%) make up the most common classes of employment.
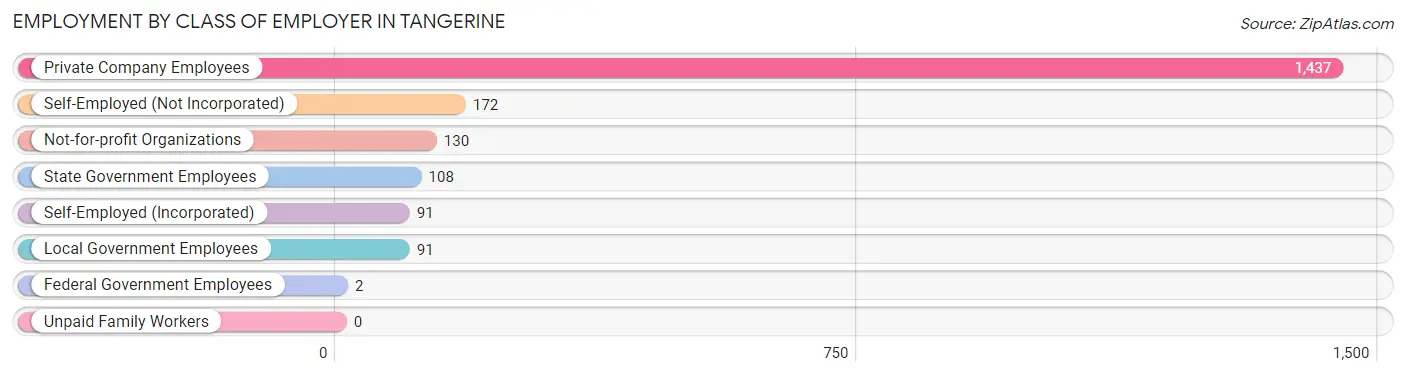
| Employer Class | # Employees | % Employees |
| Private Company Employees | 1,437 | 70.8% |
| Self-Employed (Incorporated) | 91 | 4.5% |
| Self-Employed (Not Incorporated) | 172 | 8.5% |
| Not-for-profit Organizations | 130 | 6.4% |
| Local Government Employees | 91 | 4.5% |
| State Government Employees | 108 | 5.3% |
| Federal Government Employees | 2 | 0.1% |
| Unpaid Family Workers | 0 | 0.0% |
| Total | 2,031 | 100.0% |
Employment Status by Age in Tangerine
According to the labor force statistics for Tangerine, out of the total population over 16 years of age (3,174), 65.9% or 2,092 individuals are in the labor force, with 2.5% or 52 of them unemployed. The age group with the highest labor force participation rate is 55 to 59 years, with 100.0% or 379 individuals in the labor force. Within the labor force, the 35 to 44 years age range has the highest percentage of unemployed individuals, with 6.5% or 47 of them being unemployed.
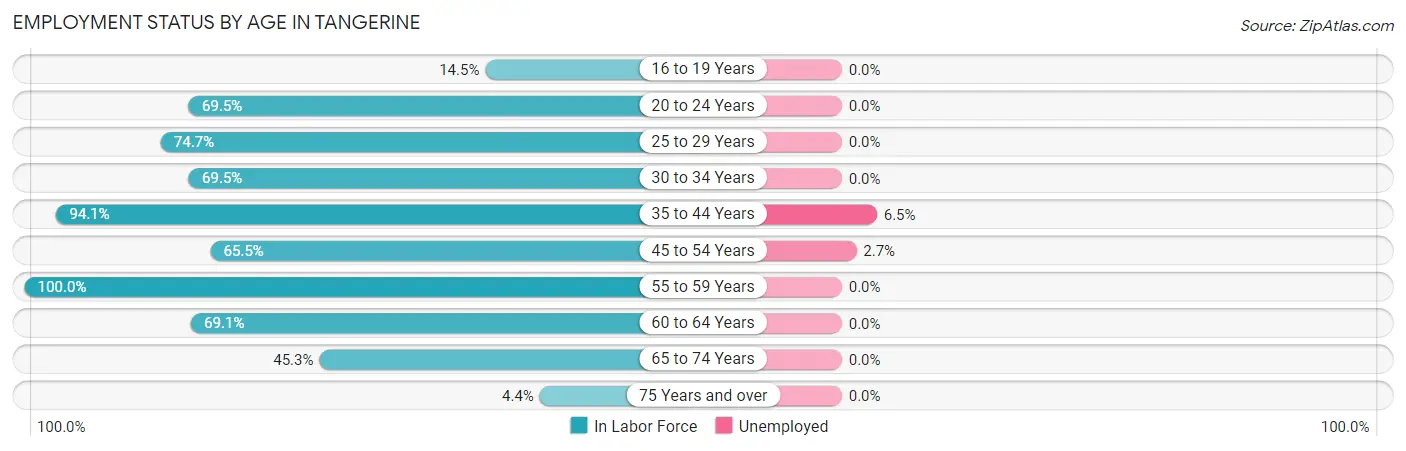
| Age Bracket | In Labor Force | Unemployed |
| 16 to 19 Years | 43 (14.5%) | 0 (0.0%) |
| 20 to 24 Years | 139 (69.5%) | 0 (0.0%) |
| 25 to 29 Years | 118 (74.7%) | 0 (0.0%) |
| 30 to 34 Years | 116 (69.5%) | 0 (0.0%) |
| 35 to 44 Years | 718 (94.1%) | 47 (6.5%) |
| 45 to 54 Years | 188 (65.5%) | 5 (2.7%) |
| 55 to 59 Years | 379 (100.0%) | 0 (0.0%) |
| 60 to 64 Years | 161 (69.1%) | 0 (0.0%) |
| 65 to 74 Years | 220 (45.3%) | 0 (0.0%) |
| 75 Years and over | 9 (4.4%) | 0 (0.0%) |
| Total | 2,092 (65.9%) | 52 (2.5%) |
Employment Status by Educational Attainment in Tangerine
According to labor force statistics for Tangerine, 84.5% of individuals (1,679) out of the total population between 25 and 64 years of age (1,987) are in the labor force, with 3.1% or 52 of them being unemployed. The group with the highest labor force participation rate are those with the educational attainment of college / associate degree, with 88.0% or 456 individuals in the labor force. Within the labor force, individuals with less than high school education have the highest percentage of unemployment, with 18.5% or 5 of them being unemployed.
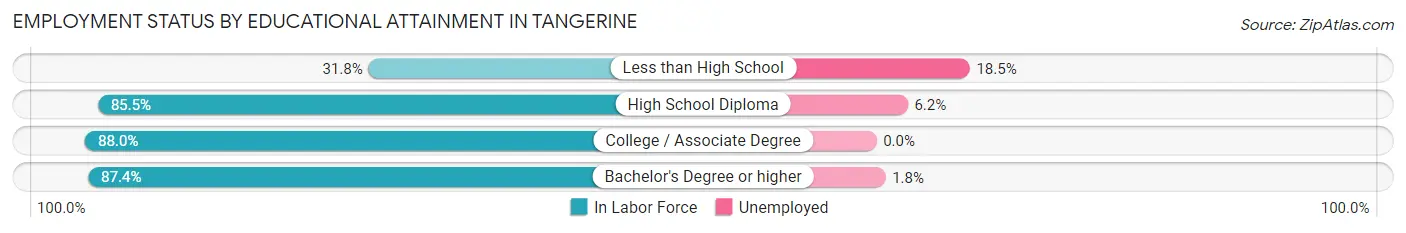
| Educational Attainment | In Labor Force | Unemployed |
| Less than High School | 27 (31.8%) | 16 (18.5%) |
| High School Diploma | 577 (85.5%) | 42 (6.2%) |
| College / Associate Degree | 456 (88.0%) | 0 (0.0%) |
| Bachelor's Degree or higher | 620 (87.4%) | 13 (1.8%) |
| Total | 1,679 (84.5%) | 62 (3.1%) |
Employment Occupations by Sex in Tangerine
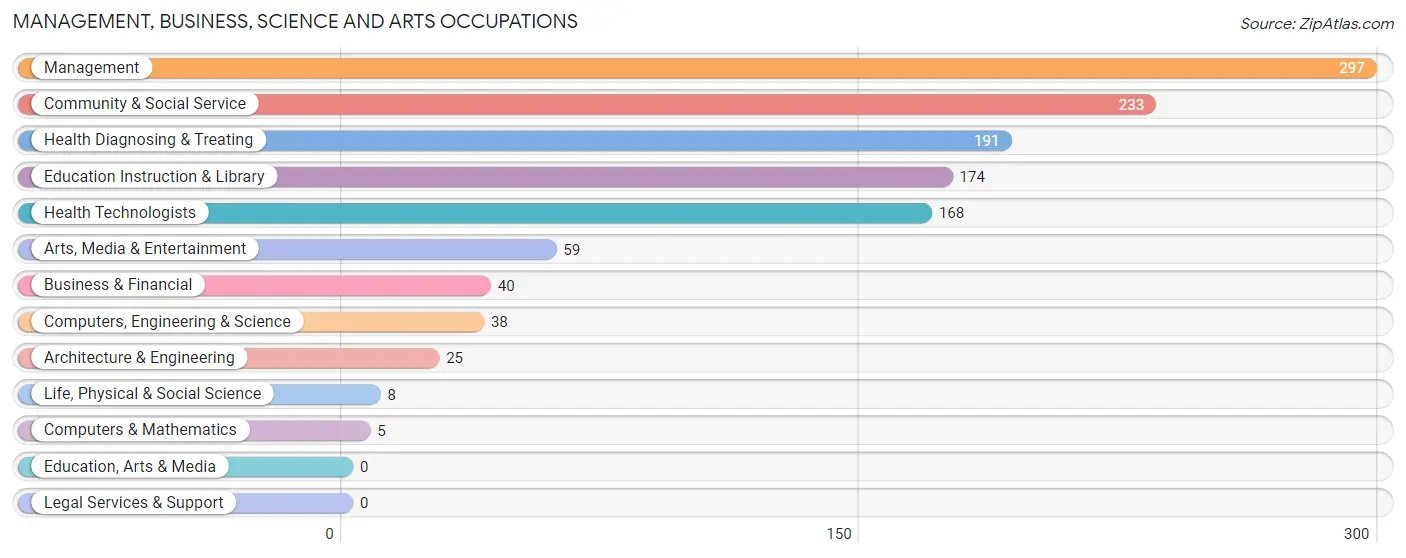
Management, Business, Science and Arts Occupations
The most common Management, Business, Science and Arts occupations in Tangerine are Management (297 | 14.6%), Community & Social Service (233 | 11.4%), Health Diagnosing & Treating (191 | 9.4%), Education Instruction & Library (174 | 8.5%), and Health Technologists (168 | 8.2%).
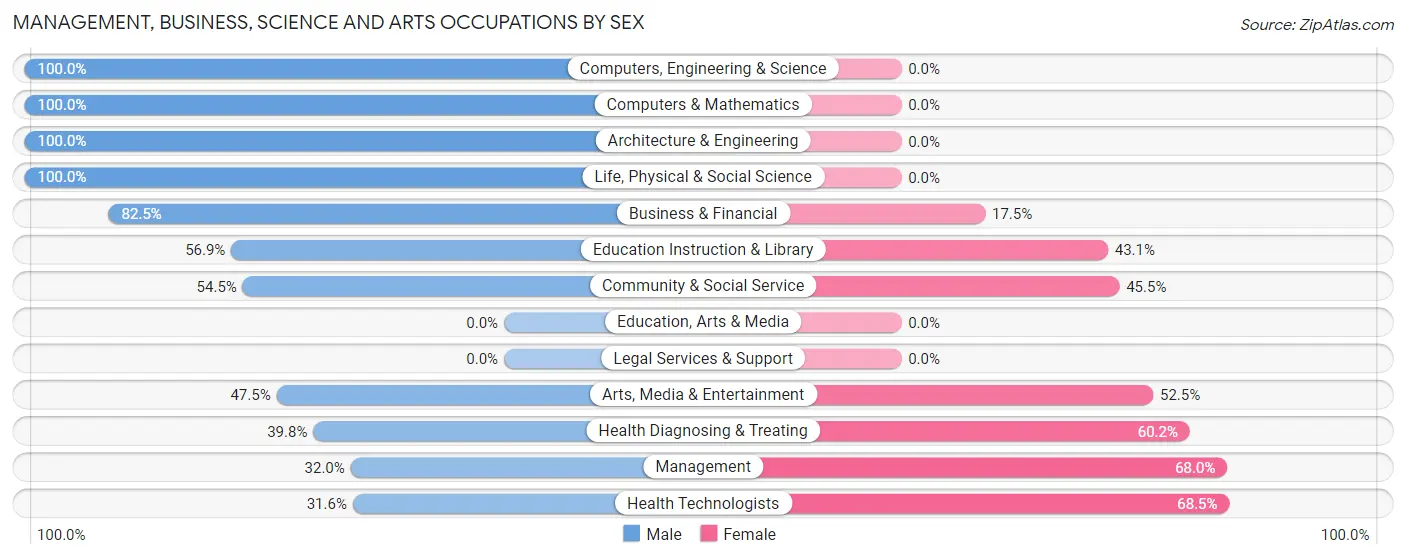
Management, Business, Science and Arts Occupations by Sex
Within the Management, Business, Science and Arts occupations in Tangerine, the most male-oriented occupations are Computers, Engineering & Science (100.0%), Computers & Mathematics (100.0%), and Architecture & Engineering (100.0%), while the most female-oriented occupations are Health Technologists (68.4%), Management (68.0%), and Health Diagnosing & Treating (60.2%).
| Occupation | Male | Female |
| Management | 95 (32.0%) | 202 (68.0%) |
| Business & Financial | 33 (82.5%) | 7 (17.5%) |
| Computers, Engineering & Science | 38 (100.0%) | 0 (0.0%) |
| Computers & Mathematics | 5 (100.0%) | 0 (0.0%) |
| Architecture & Engineering | 25 (100.0%) | 0 (0.0%) |
| Life, Physical & Social Science | 8 (100.0%) | 0 (0.0%) |
| Community & Social Service | 127 (54.5%) | 106 (45.5%) |
| Education, Arts & Media | 0 (0.0%) | 0 (0.0%) |
| Legal Services & Support | 0 (0.0%) | 0 (0.0%) |
| Education Instruction & Library | 99 (56.9%) | 75 (43.1%) |
| Arts, Media & Entertainment | 28 (47.5%) | 31 (52.5%) |
| Health Diagnosing & Treating | 76 (39.8%) | 115 (60.2%) |
| Health Technologists | 53 (31.6%) | 115 (68.4%) |
| Total (Category) | 369 (46.2%) | 430 (53.8%) |
| Total (Overall) | 1,184 (58.1%) | 855 (41.9%) |
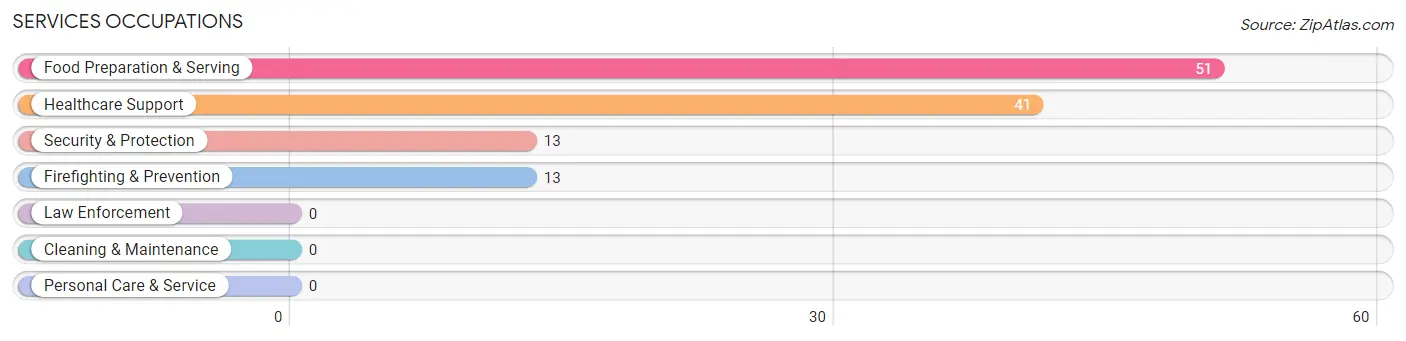
Services Occupations
The most common Services occupations in Tangerine are Food Preparation & Serving (51 | 2.5%), Healthcare Support (41 | 2.0%), Security & Protection (13 | 0.6%), and Firefighting & Prevention (13 | 0.6%).
Services Occupations by Sex
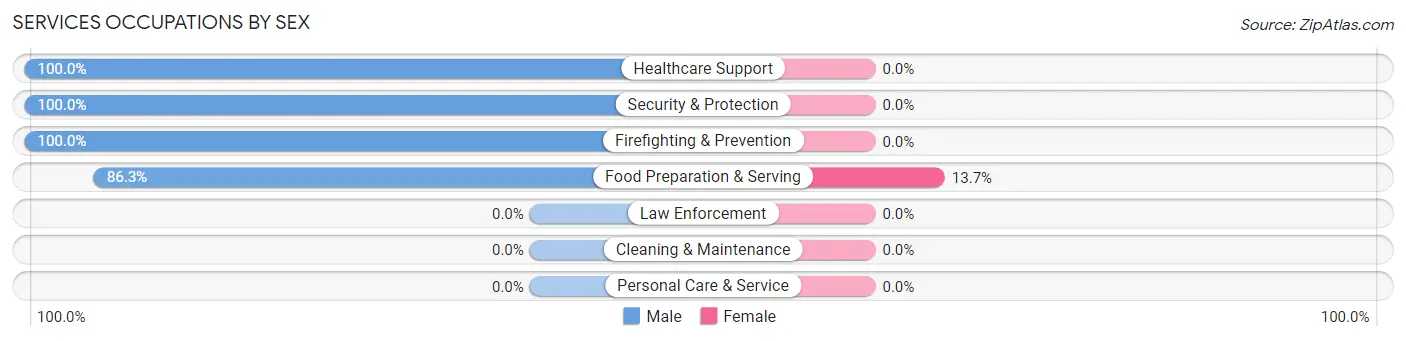
| Occupation | Male | Female |
| Healthcare Support | 41 (100.0%) | 0 (0.0%) |
| Security & Protection | 13 (100.0%) | 0 (0.0%) |
| Firefighting & Prevention | 13 (100.0%) | 0 (0.0%) |
| Law Enforcement | 0 (0.0%) | 0 (0.0%) |
| Food Preparation & Serving | 44 (86.3%) | 7 (13.7%) |
| Cleaning & Maintenance | 0 (0.0%) | 0 (0.0%) |
| Personal Care & Service | 0 (0.0%) | 0 (0.0%) |
| Total (Category) | 98 (93.3%) | 7 (6.7%) |
| Total (Overall) | 1,184 (58.1%) | 855 (41.9%) |
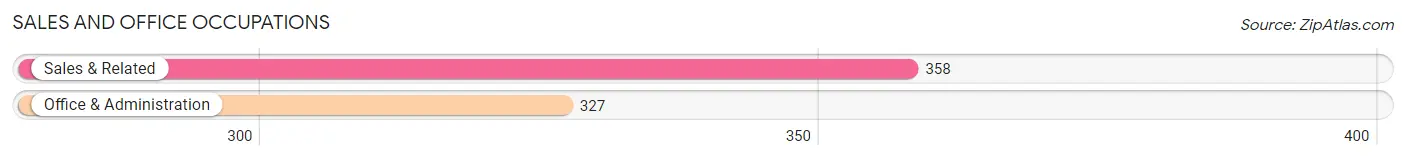
Sales and Office Occupations
The most common Sales and Office occupations in Tangerine are Sales & Related (358 | 17.6%), and Office & Administration (327 | 16.0%).
Sales and Office Occupations by Sex
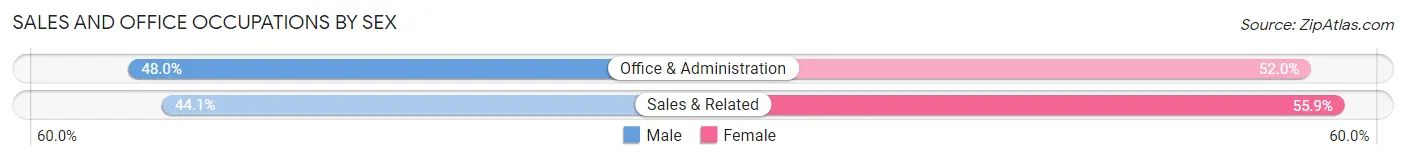
| Occupation | Male | Female |
| Sales & Related | 158 (44.1%) | 200 (55.9%) |
| Office & Administration | 157 (48.0%) | 170 (52.0%) |
| Total (Category) | 315 (46.0%) | 370 (54.0%) |
| Total (Overall) | 1,184 (58.1%) | 855 (41.9%) |
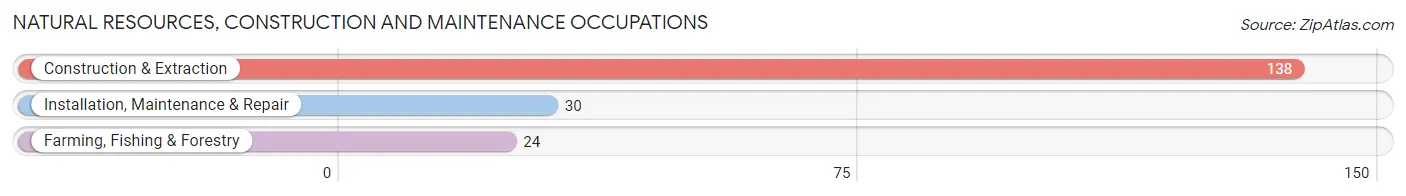
Natural Resources, Construction and Maintenance Occupations
The most common Natural Resources, Construction and Maintenance occupations in Tangerine are Construction & Extraction (138 | 6.8%), Installation, Maintenance & Repair (30 | 1.5%), and Farming, Fishing & Forestry (24 | 1.2%).
Natural Resources, Construction and Maintenance Occupations by Sex
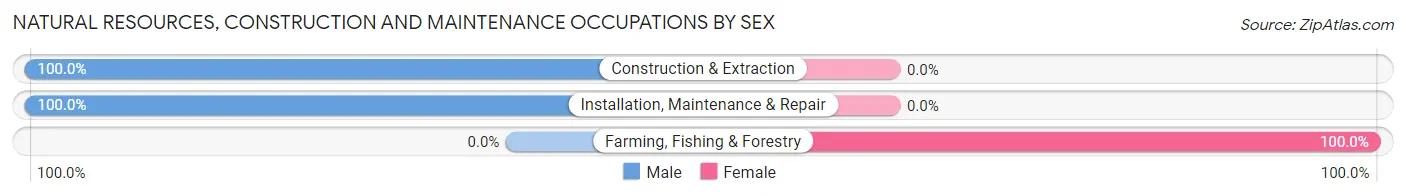
| Occupation | Male | Female |
| Farming, Fishing & Forestry | 0 (0.0%) | 24 (100.0%) |
| Construction & Extraction | 138 (100.0%) | 0 (0.0%) |
| Installation, Maintenance & Repair | 30 (100.0%) | 0 (0.0%) |
| Total (Category) | 168 (87.5%) | 24 (12.5%) |
| Total (Overall) | 1,184 (58.1%) | 855 (41.9%) |
Production, Transportation and Moving Occupations
The most common Production, Transportation and Moving occupations in Tangerine are Production (133 | 6.5%), Transportation (88 | 4.3%), and Material Moving (37 | 1.8%).
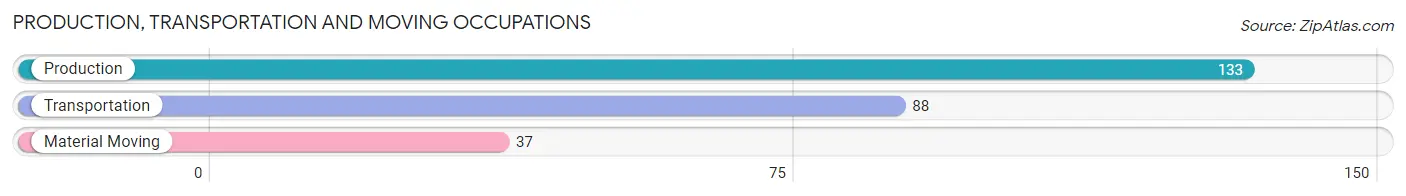
Production, Transportation and Moving Occupations by Sex
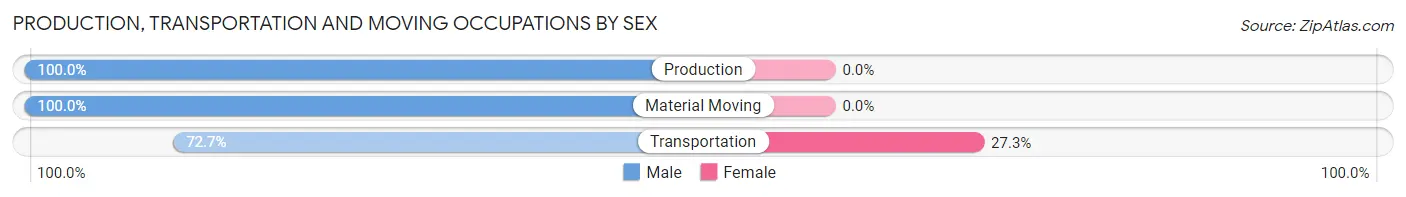
| Occupation | Male | Female |
| Production | 133 (100.0%) | 0 (0.0%) |
| Transportation | 64 (72.7%) | 24 (27.3%) |
| Material Moving | 37 (100.0%) | 0 (0.0%) |
| Total (Category) | 234 (90.7%) | 24 (9.3%) |
| Total (Overall) | 1,184 (58.1%) | 855 (41.9%) |
Employment Industries by Sex in Tangerine
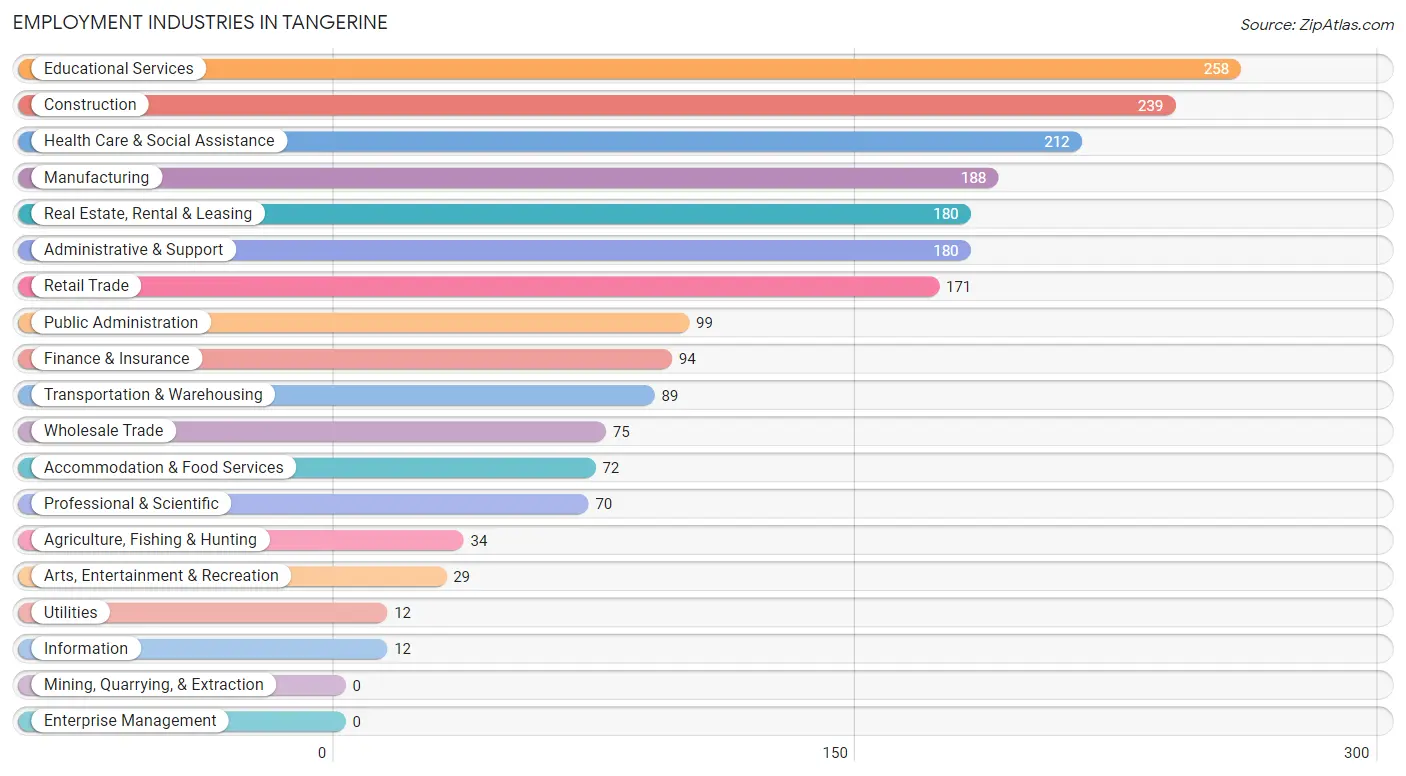
Employment Industries in Tangerine
The major employment industries in Tangerine include Educational Services (258 | 12.7%), Construction (239 | 11.7%), Health Care & Social Assistance (212 | 10.4%), Manufacturing (188 | 9.2%), and Real Estate, Rental & Leasing (180 | 8.8%).
Employment Industries by Sex in Tangerine
The Tangerine industries that see more men than women are Manufacturing (100.0%), Utilities (100.0%), and Information (100.0%), whereas the industries that tend to have a higher number of women are Agriculture, Fishing & Hunting (94.1%), Public Administration (89.9%), and Finance & Insurance (73.4%).
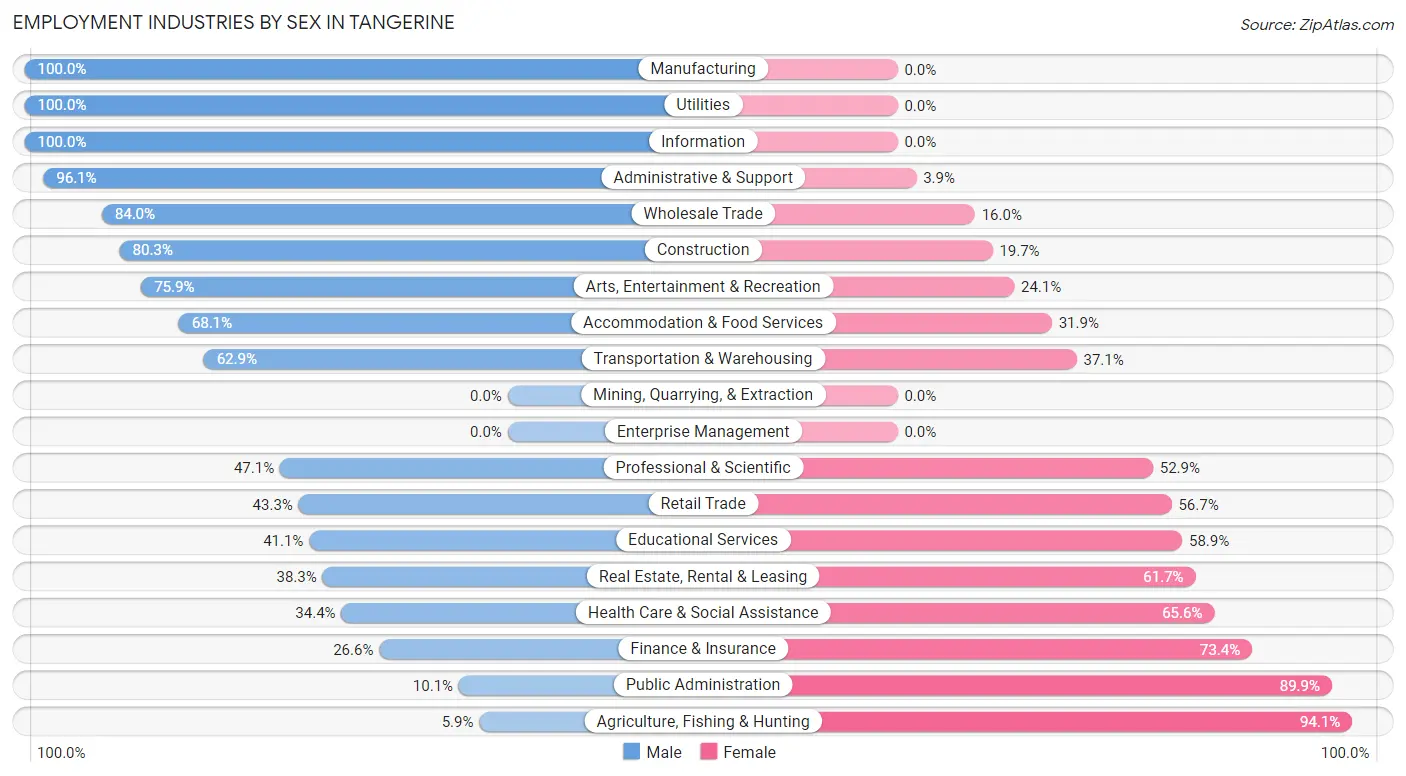
| Industry | Male | Female |
| Agriculture, Fishing & Hunting | 2 (5.9%) | 32 (94.1%) |
| Mining, Quarrying, & Extraction | 0 (0.0%) | 0 (0.0%) |
| Construction | 192 (80.3%) | 47 (19.7%) |
| Manufacturing | 188 (100.0%) | 0 (0.0%) |
| Wholesale Trade | 63 (84.0%) | 12 (16.0%) |
| Retail Trade | 74 (43.3%) | 97 (56.7%) |
| Transportation & Warehousing | 56 (62.9%) | 33 (37.1%) |
| Utilities | 12 (100.0%) | 0 (0.0%) |
| Information | 12 (100.0%) | 0 (0.0%) |
| Finance & Insurance | 25 (26.6%) | 69 (73.4%) |
| Real Estate, Rental & Leasing | 69 (38.3%) | 111 (61.7%) |
| Professional & Scientific | 33 (47.1%) | 37 (52.9%) |
| Enterprise Management | 0 (0.0%) | 0 (0.0%) |
| Administrative & Support | 173 (96.1%) | 7 (3.9%) |
| Educational Services | 106 (41.1%) | 152 (58.9%) |
| Health Care & Social Assistance | 73 (34.4%) | 139 (65.6%) |
| Arts, Entertainment & Recreation | 22 (75.9%) | 7 (24.1%) |
| Accommodation & Food Services | 49 (68.1%) | 23 (31.9%) |
| Public Administration | 10 (10.1%) | 89 (89.9%) |
| Total | 1,184 (58.1%) | 855 (41.9%) |
Education in Tangerine
School Enrollment in Tangerine
The most common levels of schooling among the 896 students in Tangerine are middle school (297 | 33.2%), high school (238 | 26.6%), and elementary school (191 | 21.3%).
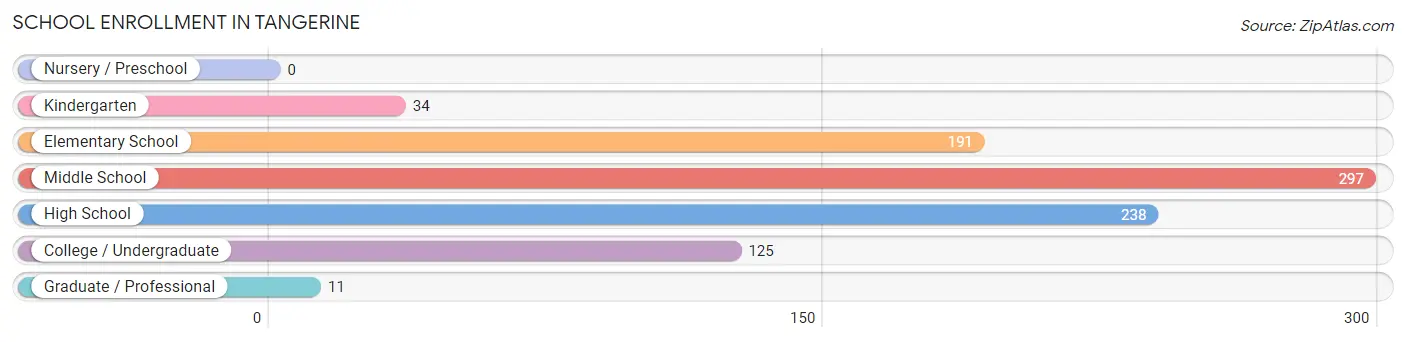
| School Level | # Students | % Students |
| Nursery / Preschool | 0 | 0.0% |
| Kindergarten | 34 | 3.8% |
| Elementary School | 191 | 21.3% |
| Middle School | 297 | 33.2% |
| High School | 238 | 26.6% |
| College / Undergraduate | 125 | 14.0% |
| Graduate / Professional | 11 | 1.2% |
| Total | 896 | 100.0% |
School Enrollment by Age by Funding Source in Tangerine
Out of a total of 896 students who are enrolled in schools in Tangerine, 210 (23.4%) attend a private institution, while the remaining 686 (76.6%) are enrolled in public schools. The age group of 25 to 34 year olds has the highest likelihood of being enrolled in private schools, with 26 (51.0% in the age bracket) enrolled. Conversely, the age group of 20 to 24 year olds has the lowest likelihood of being enrolled in a private school, with 62 (100.0% in the age bracket) attending a public institution.
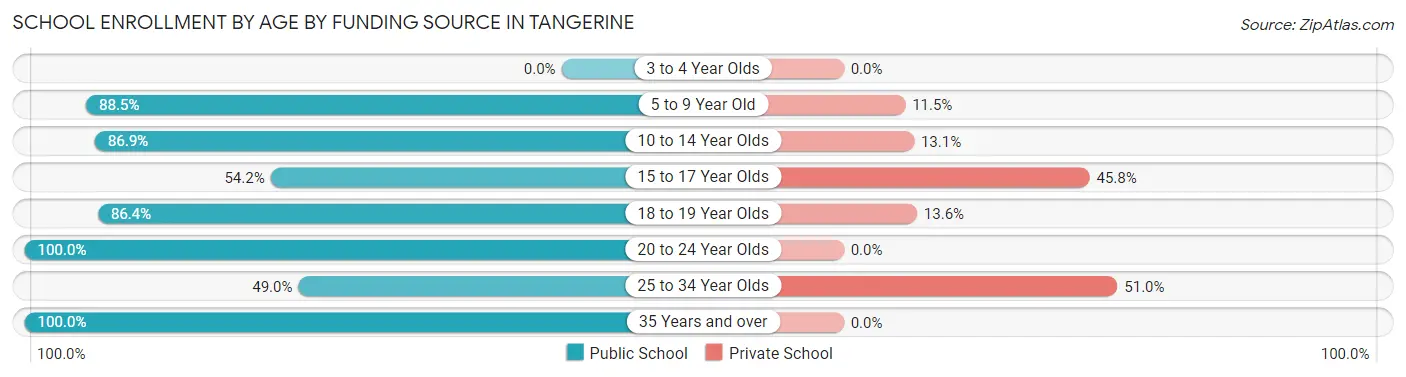
| Age Bracket | Public School | Private School |
| 3 to 4 Year Olds | 0 (0.0%) | 0 (0.0%) |
| 5 to 9 Year Old | 170 (88.5%) | 22 (11.5%) |
| 10 to 14 Year Olds | 219 (86.9%) | 33 (13.1%) |
| 15 to 17 Year Olds | 142 (54.2%) | 120 (45.8%) |
| 18 to 19 Year Olds | 57 (86.4%) | 9 (13.6%) |
| 20 to 24 Year Olds | 62 (100.0%) | 0 (0.0%) |
| 25 to 34 Year Olds | 25 (49.0%) | 26 (51.0%) |
| 35 Years and over | 11 (100.0%) | 0 (0.0%) |
| Total | 686 (76.6%) | 210 (23.4%) |
Educational Attainment by Field of Study in Tangerine
Business (269 | 28.1%), education (152 | 15.9%), science & technology (149 | 15.6%), psychology (55 | 5.8%), and social sciences (52 | 5.4%) are the most common fields of study among 956 individuals in Tangerine who have obtained a bachelor's degree or higher.
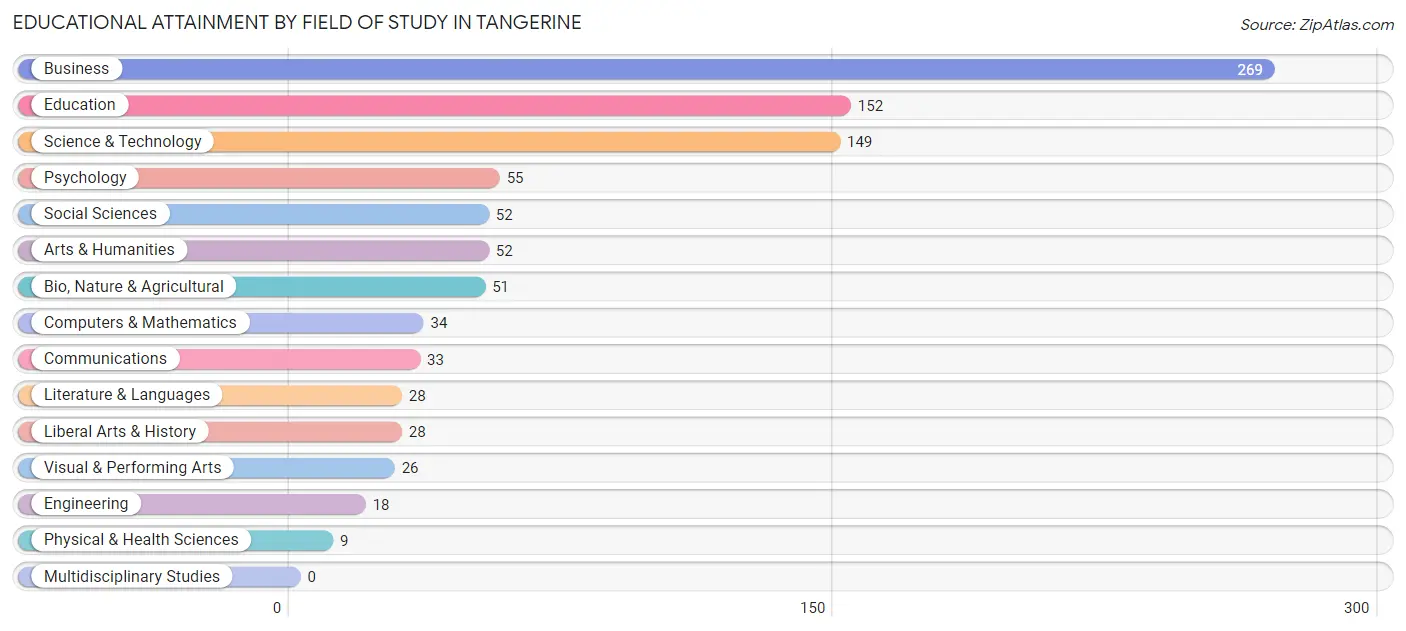
| Field of Study | # Graduates | % Graduates |
| Computers & Mathematics | 34 | 3.6% |
| Bio, Nature & Agricultural | 51 | 5.3% |
| Physical & Health Sciences | 9 | 0.9% |
| Psychology | 55 | 5.8% |
| Social Sciences | 52 | 5.4% |
| Engineering | 18 | 1.9% |
| Multidisciplinary Studies | 0 | 0.0% |
| Science & Technology | 149 | 15.6% |
| Business | 269 | 28.1% |
| Education | 152 | 15.9% |
| Literature & Languages | 28 | 2.9% |
| Liberal Arts & History | 28 | 2.9% |
| Visual & Performing Arts | 26 | 2.7% |
| Communications | 33 | 3.5% |
| Arts & Humanities | 52 | 5.4% |
| Total | 956 | 100.0% |
Transportation & Commute in Tangerine
Vehicle Availability by Sex in Tangerine
The most prevalent vehicle ownership categories in Tangerine are males with 2 vehicles (467, accounting for 40.0%) and females with 2 vehicles (418, making up 55.1%).
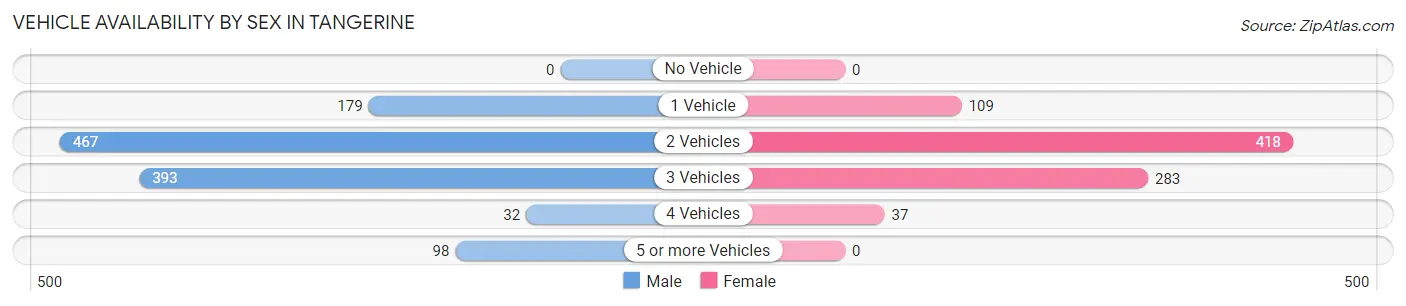
| Vehicles Available | Male | Female |
| No Vehicle | 0 (0.0%) | 0 (0.0%) |
| 1 Vehicle | 179 (15.3%) | 109 (12.9%) |
| 2 Vehicles | 467 (40.0%) | 418 (49.3%) |
| 3 Vehicles | 393 (33.6%) | 283 (33.4%) |
| 4 Vehicles | 32 (2.7%) | 37 (4.4%) |
| 5 or more Vehicles | 98 (8.4%) | 0 (0.0%) |
| Total | 1,169 (100.0%) | 847 (100.0%) |
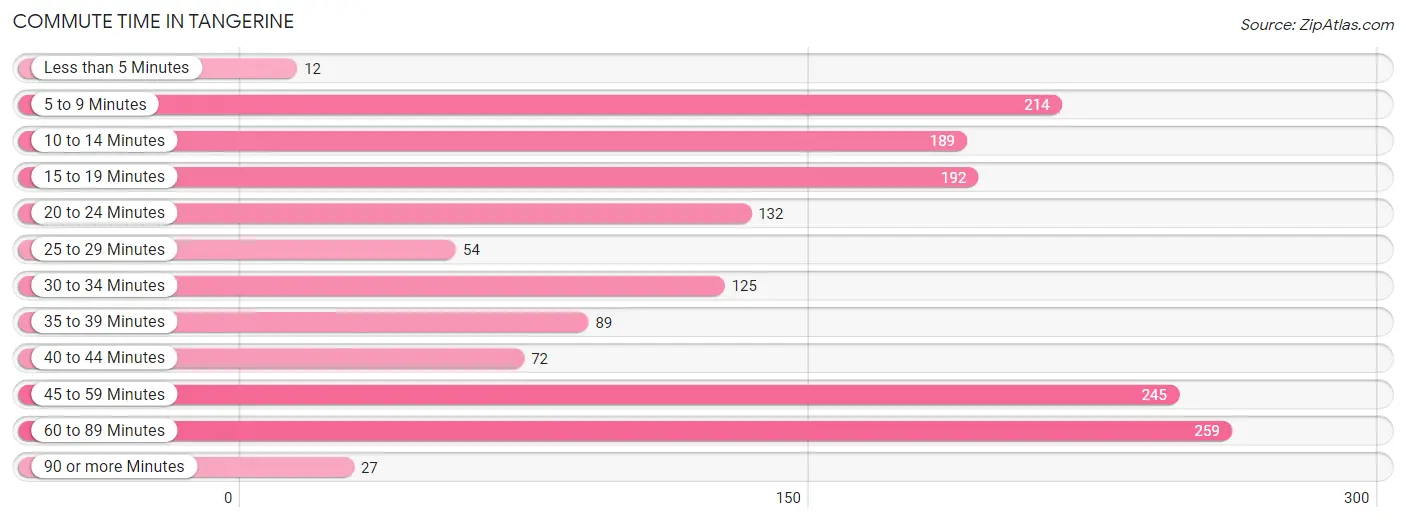
Commute Time in Tangerine
The most frequently occuring commute durations in Tangerine are 60 to 89 minutes (259 commuters, 16.1%), 45 to 59 minutes (245 commuters, 15.2%), and 5 to 9 minutes (214 commuters, 13.3%).
| Commute Time | # Commuters | % Commuters |
| Less than 5 Minutes | 12 | 0.7% |
| 5 to 9 Minutes | 214 | 13.3% |
| 10 to 14 Minutes | 189 | 11.7% |
| 15 to 19 Minutes | 192 | 11.9% |
| 20 to 24 Minutes | 132 | 8.2% |
| 25 to 29 Minutes | 54 | 3.4% |
| 30 to 34 Minutes | 125 | 7.8% |
| 35 to 39 Minutes | 89 | 5.5% |
| 40 to 44 Minutes | 72 | 4.5% |
| 45 to 59 Minutes | 245 | 15.2% |
| 60 to 89 Minutes | 259 | 16.1% |
| 90 or more Minutes | 27 | 1.7% |
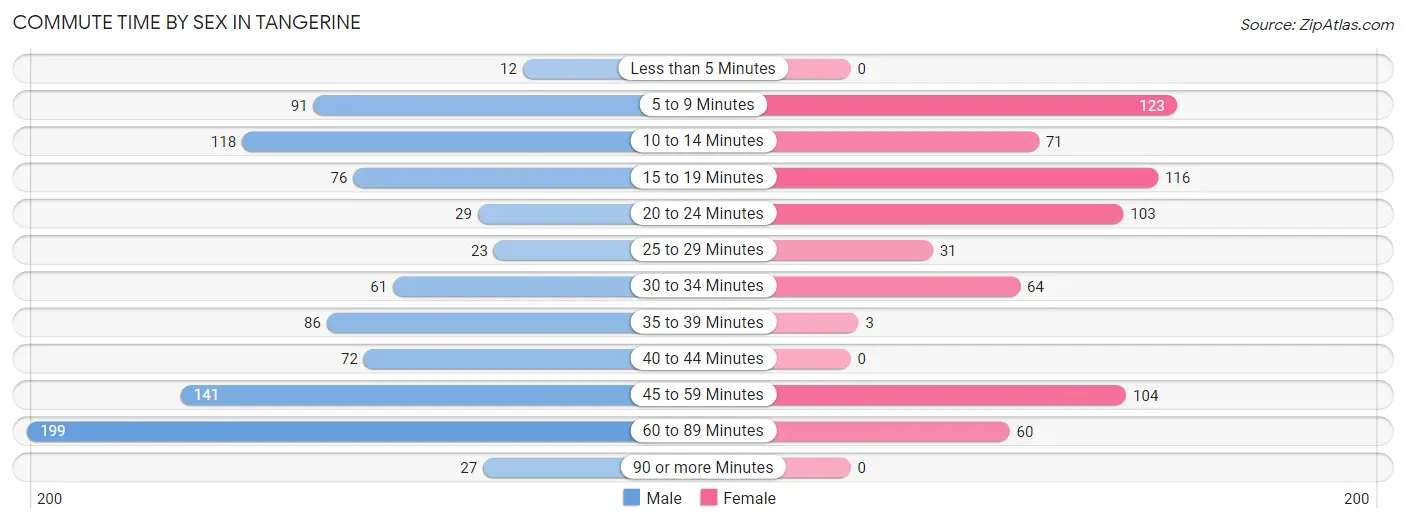
Commute Time by Sex in Tangerine
The most common commute times in Tangerine are 60 to 89 minutes (199 commuters, 21.3%) for males and 5 to 9 minutes (123 commuters, 18.2%) for females.
| Commute Time | Male | Female |
| Less than 5 Minutes | 12 (1.3%) | 0 (0.0%) |
| 5 to 9 Minutes | 91 (9.7%) | 123 (18.2%) |
| 10 to 14 Minutes | 118 (12.6%) | 71 (10.5%) |
| 15 to 19 Minutes | 76 (8.1%) | 116 (17.2%) |
| 20 to 24 Minutes | 29 (3.1%) | 103 (15.3%) |
| 25 to 29 Minutes | 23 (2.5%) | 31 (4.6%) |
| 30 to 34 Minutes | 61 (6.5%) | 64 (9.5%) |
| 35 to 39 Minutes | 86 (9.2%) | 3 (0.4%) |
| 40 to 44 Minutes | 72 (7.7%) | 0 (0.0%) |
| 45 to 59 Minutes | 141 (15.1%) | 104 (15.4%) |
| 60 to 89 Minutes | 199 (21.3%) | 60 (8.9%) |
| 90 or more Minutes | 27 (2.9%) | 0 (0.0%) |
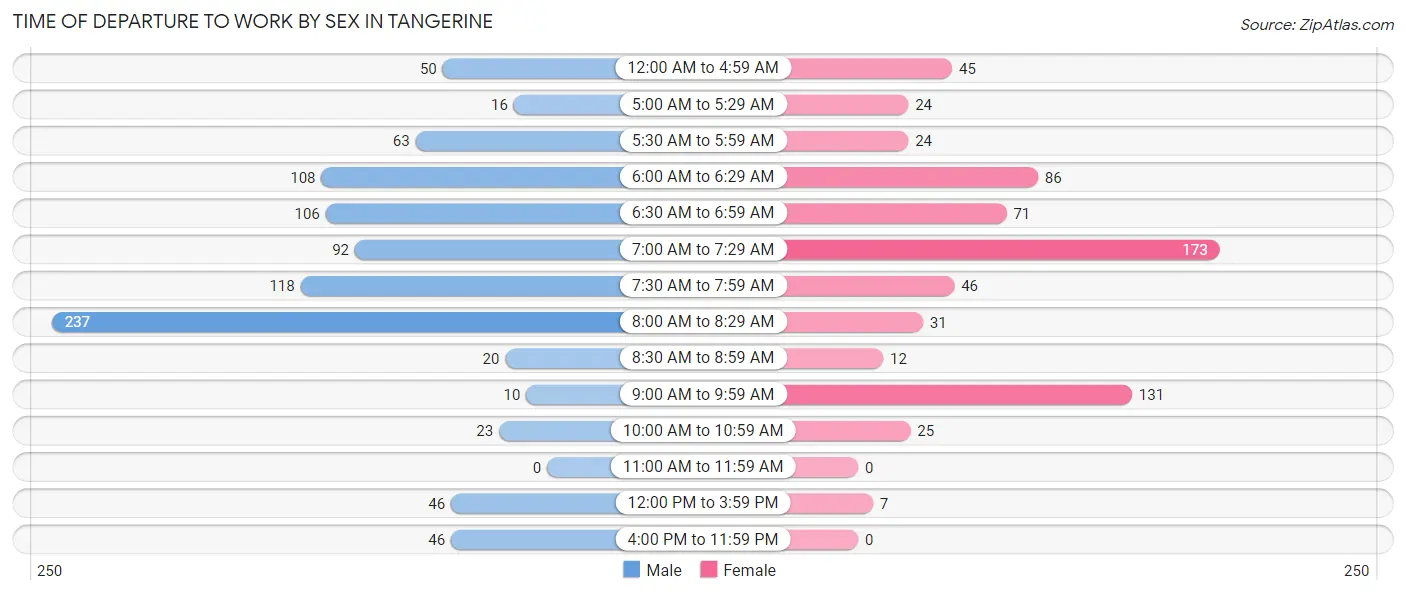
Time of Departure to Work by Sex in Tangerine
The most frequent times of departure to work in Tangerine are 8:00 AM to 8:29 AM (237, 25.4%) for males and 7:00 AM to 7:29 AM (173, 25.6%) for females.
| Time of Departure | Male | Female |
| 12:00 AM to 4:59 AM | 50 (5.3%) | 45 (6.7%) |
| 5:00 AM to 5:29 AM | 16 (1.7%) | 24 (3.6%) |
| 5:30 AM to 5:59 AM | 63 (6.7%) | 24 (3.6%) |
| 6:00 AM to 6:29 AM | 108 (11.6%) | 86 (12.7%) |
| 6:30 AM to 6:59 AM | 106 (11.3%) | 71 (10.5%) |
| 7:00 AM to 7:29 AM | 92 (9.8%) | 173 (25.6%) |
| 7:30 AM to 7:59 AM | 118 (12.6%) | 46 (6.8%) |
| 8:00 AM to 8:29 AM | 237 (25.4%) | 31 (4.6%) |
| 8:30 AM to 8:59 AM | 20 (2.1%) | 12 (1.8%) |
| 9:00 AM to 9:59 AM | 10 (1.1%) | 131 (19.4%) |
| 10:00 AM to 10:59 AM | 23 (2.5%) | 25 (3.7%) |
| 11:00 AM to 11:59 AM | 0 (0.0%) | 0 (0.0%) |
| 12:00 PM to 3:59 PM | 46 (4.9%) | 7 (1.0%) |
| 4:00 PM to 11:59 PM | 46 (4.9%) | 0 (0.0%) |
| Total | 935 (100.0%) | 675 (100.0%) |
Housing Occupancy in Tangerine
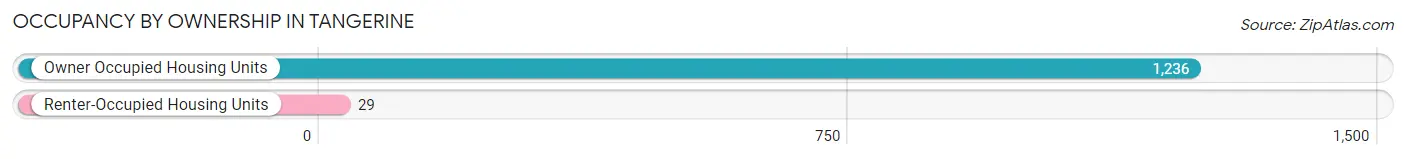
Occupancy by Ownership in Tangerine
Of the total 1,265 dwellings in Tangerine, owner-occupied units account for 1,236 (97.7%), while renter-occupied units make up 29 (2.3%).
| Occupancy | # Housing Units | % Housing Units |
| Owner Occupied Housing Units | 1,236 | 97.7% |
| Renter-Occupied Housing Units | 29 | 2.3% |
| Total Occupied Housing Units | 1,265 | 100.0% |
Occupancy by Household Size in Tangerine
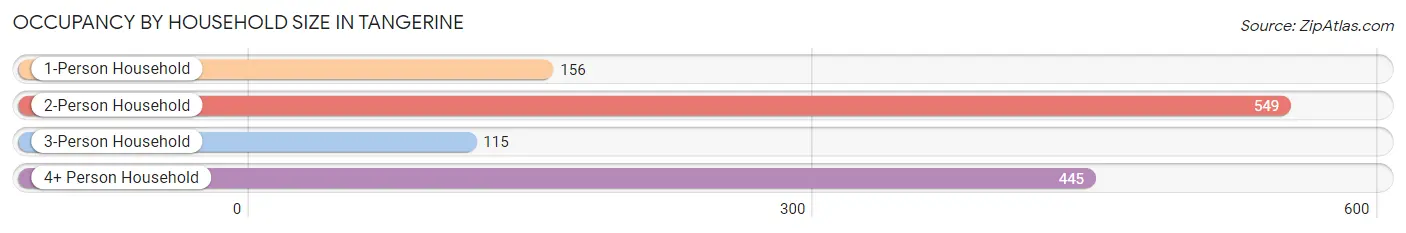
| Household Size | # Housing Units | % Housing Units |
| 1-Person Household | 156 | 12.3% |
| 2-Person Household | 549 | 43.4% |
| 3-Person Household | 115 | 9.1% |
| 4+ Person Household | 445 | 35.2% |
| Total Housing Units | 1,265 | 100.0% |
Occupancy by Ownership by Household Size in Tangerine
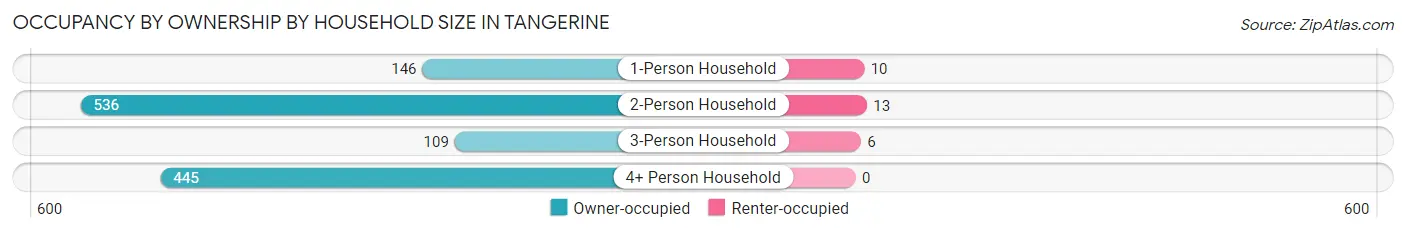
| Household Size | Owner-occupied | Renter-occupied |
| 1-Person Household | 146 (93.6%) | 10 (6.4%) |
| 2-Person Household | 536 (97.6%) | 13 (2.4%) |
| 3-Person Household | 109 (94.8%) | 6 (5.2%) |
| 4+ Person Household | 445 (100.0%) | 0 (0.0%) |
| Total Housing Units | 1,236 (97.7%) | 29 (2.3%) |
Occupancy by Educational Attainment in Tangerine
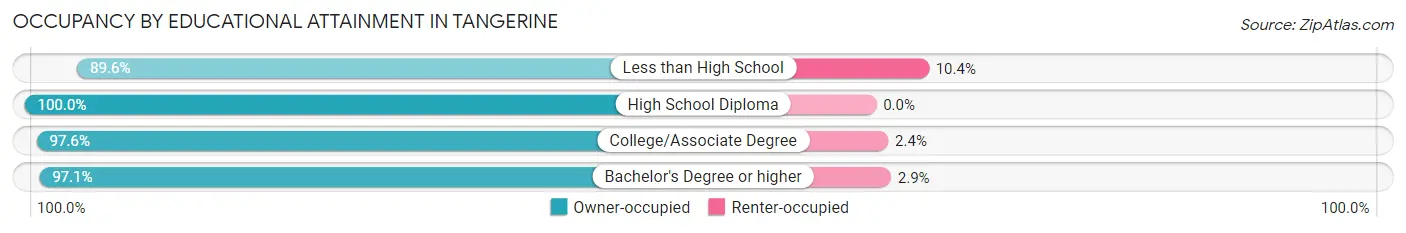
| Household Size | Owner-occupied | Renter-occupied |
| Less than High School | 43 (89.6%) | 5 (10.4%) |
| High School Diploma | 299 (100.0%) | 0 (0.0%) |
| College/Associate Degree | 493 (97.6%) | 12 (2.4%) |
| Bachelor's Degree or higher | 401 (97.1%) | 12 (2.9%) |
Occupancy by Age of Householder in Tangerine
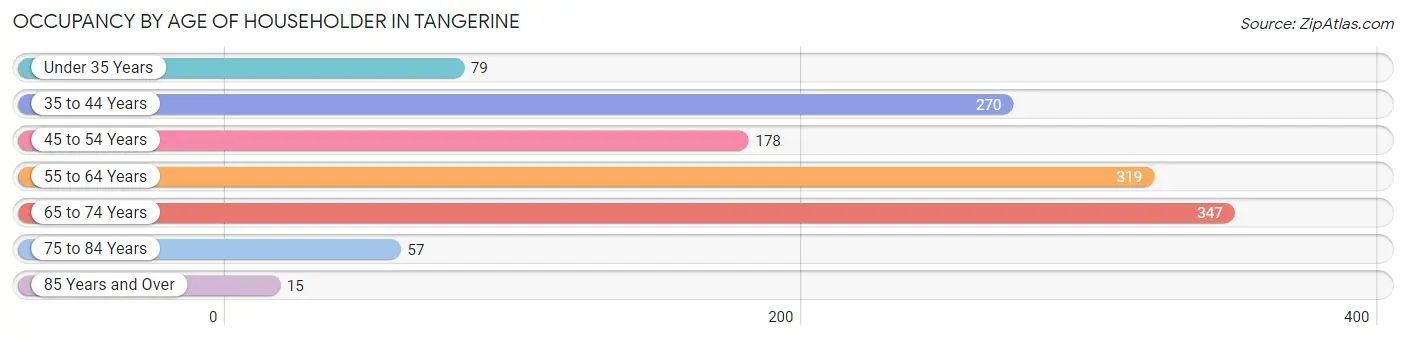
| Age Bracket | # Households | % Households |
| Under 35 Years | 79 | 6.2% |
| 35 to 44 Years | 270 | 21.3% |
| 45 to 54 Years | 178 | 14.1% |
| 55 to 64 Years | 319 | 25.2% |
| 65 to 74 Years | 347 | 27.4% |
| 75 to 84 Years | 57 | 4.5% |
| 85 Years and Over | 15 | 1.2% |
| Total | 1,265 | 100.0% |
Housing Finances in Tangerine
Median Income by Occupancy in Tangerine
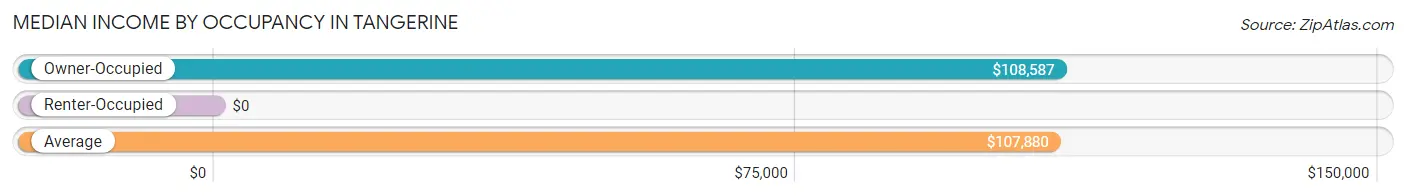
| Occupancy Type | # Households | Median Income |
| Owner-Occupied | 1,236 (97.7%) | $108,587 |
| Renter-Occupied | 29 (2.3%) | $0 |
| Average | 1,265 (100.0%) | $107,880 |
Occupancy by Householder Income Bracket in Tangerine
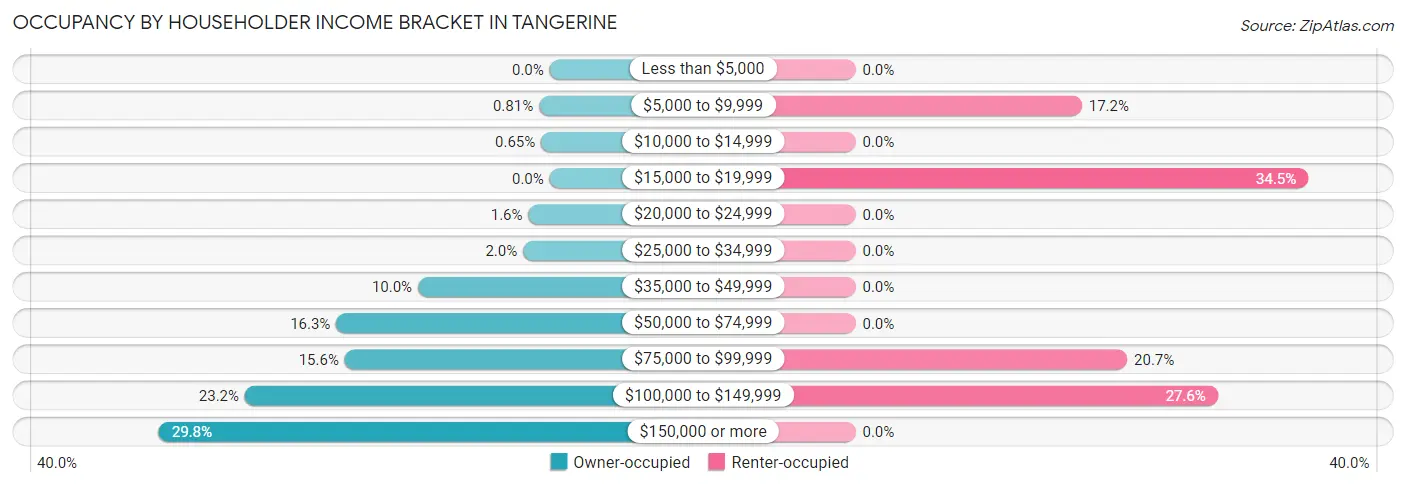
| Income Bracket | Owner-occupied | Renter-occupied |
| Less than $5,000 | 0 (0.0%) | 0 (0.0%) |
| $5,000 to $9,999 | 10 (0.8%) | 5 (17.2%) |
| $10,000 to $14,999 | 8 (0.6%) | 0 (0.0%) |
| $15,000 to $19,999 | 0 (0.0%) | 10 (34.5%) |
| $20,000 to $24,999 | 20 (1.6%) | 0 (0.0%) |
| $25,000 to $34,999 | 25 (2.0%) | 0 (0.0%) |
| $35,000 to $49,999 | 124 (10.0%) | 0 (0.0%) |
| $50,000 to $74,999 | 201 (16.3%) | 0 (0.0%) |
| $75,000 to $99,999 | 193 (15.6%) | 6 (20.7%) |
| $100,000 to $149,999 | 287 (23.2%) | 8 (27.6%) |
| $150,000 or more | 368 (29.8%) | 0 (0.0%) |
| Total | 1,236 (100.0%) | 29 (100.0%) |
Monthly Housing Cost Tiers in Tangerine
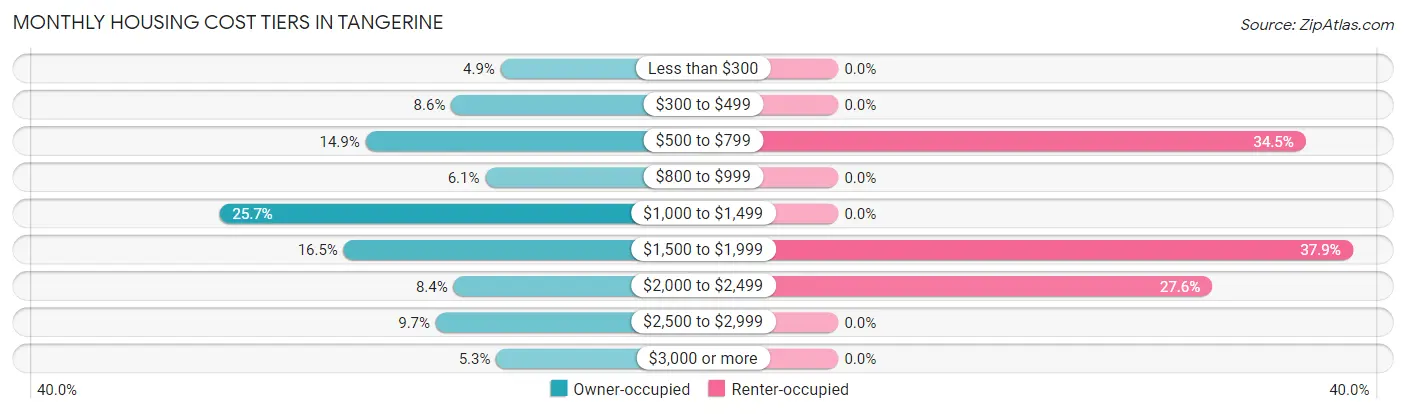
| Monthly Cost | Owner-occupied | Renter-occupied |
| Less than $300 | 61 (4.9%) | 0 (0.0%) |
| $300 to $499 | 106 (8.6%) | 0 (0.0%) |
| $500 to $799 | 184 (14.9%) | 10 (34.5%) |
| $800 to $999 | 75 (6.1%) | 0 (0.0%) |
| $1,000 to $1,499 | 317 (25.7%) | 0 (0.0%) |
| $1,500 to $1,999 | 204 (16.5%) | 11 (37.9%) |
| $2,000 to $2,499 | 104 (8.4%) | 8 (27.6%) |
| $2,500 to $2,999 | 120 (9.7%) | 0 (0.0%) |
| $3,000 or more | 65 (5.3%) | 0 (0.0%) |
| Total | 1,236 (100.0%) | 29 (100.0%) |
Physical Housing Characteristics in Tangerine
Housing Structures in Tangerine
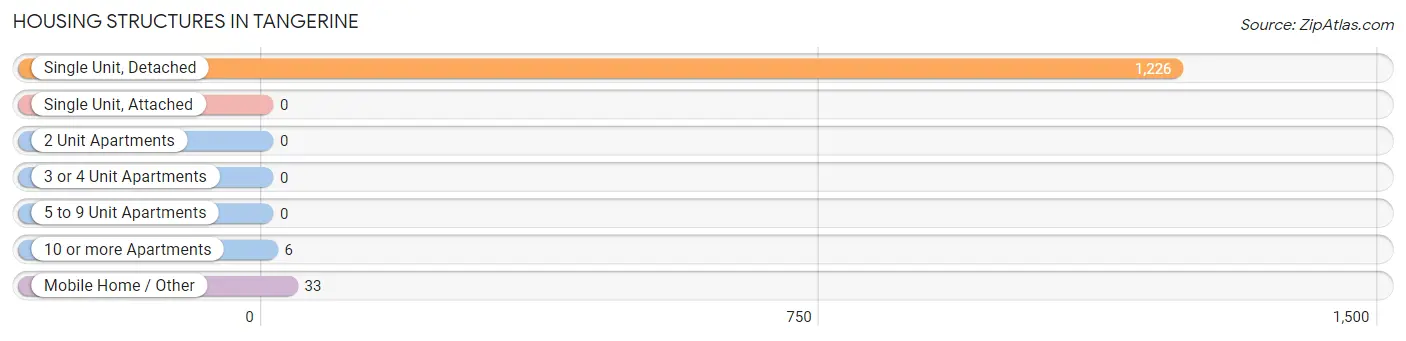
| Structure Type | # Housing Units | % Housing Units |
| Single Unit, Detached | 1,226 | 96.9% |
| Single Unit, Attached | 0 | 0.0% |
| 2 Unit Apartments | 0 | 0.0% |
| 3 or 4 Unit Apartments | 0 | 0.0% |
| 5 to 9 Unit Apartments | 0 | 0.0% |
| 10 or more Apartments | 6 | 0.5% |
| Mobile Home / Other | 33 | 2.6% |
| Total | 1,265 | 100.0% |
Housing Structures by Occupancy in Tangerine
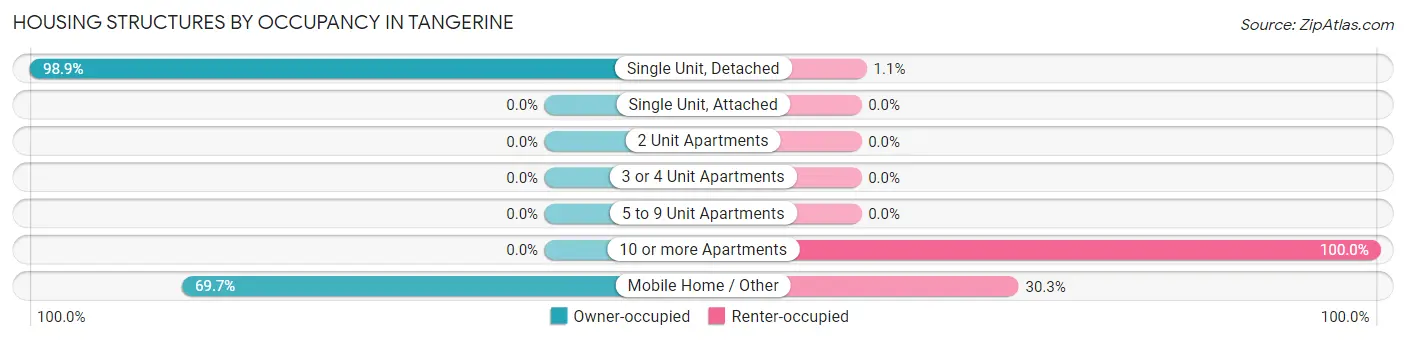
| Structure Type | Owner-occupied | Renter-occupied |
| Single Unit, Detached | 1,213 (98.9%) | 13 (1.1%) |
| Single Unit, Attached | 0 (0.0%) | 0 (0.0%) |
| 2 Unit Apartments | 0 (0.0%) | 0 (0.0%) |
| 3 or 4 Unit Apartments | 0 (0.0%) | 0 (0.0%) |
| 5 to 9 Unit Apartments | 0 (0.0%) | 0 (0.0%) |
| 10 or more Apartments | 0 (0.0%) | 6 (100.0%) |
| Mobile Home / Other | 23 (69.7%) | 10 (30.3%) |
| Total | 1,236 (97.7%) | 29 (2.3%) |
Housing Structures by Number of Rooms in Tangerine
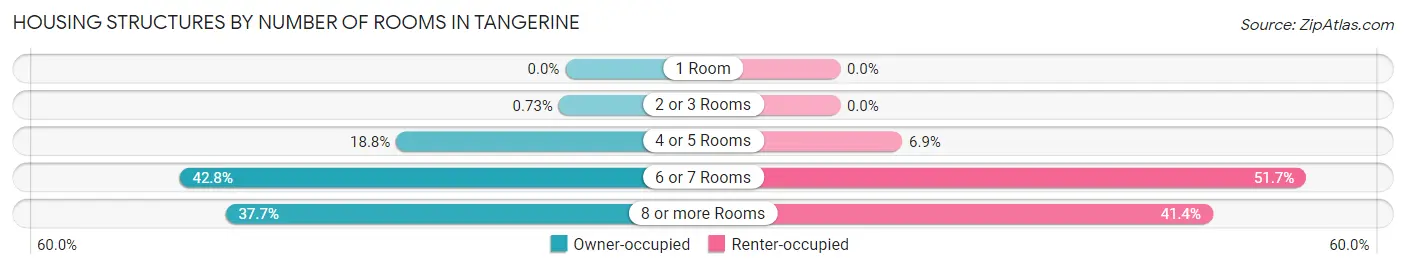
| Number of Rooms | Owner-occupied | Renter-occupied |
| 1 Room | 0 (0.0%) | 0 (0.0%) |
| 2 or 3 Rooms | 9 (0.7%) | 0 (0.0%) |
| 4 or 5 Rooms | 232 (18.8%) | 2 (6.9%) |
| 6 or 7 Rooms | 529 (42.8%) | 15 (51.7%) |
| 8 or more Rooms | 466 (37.7%) | 12 (41.4%) |
| Total | 1,236 (100.0%) | 29 (100.0%) |
Housing Structure by Heating Type in Tangerine
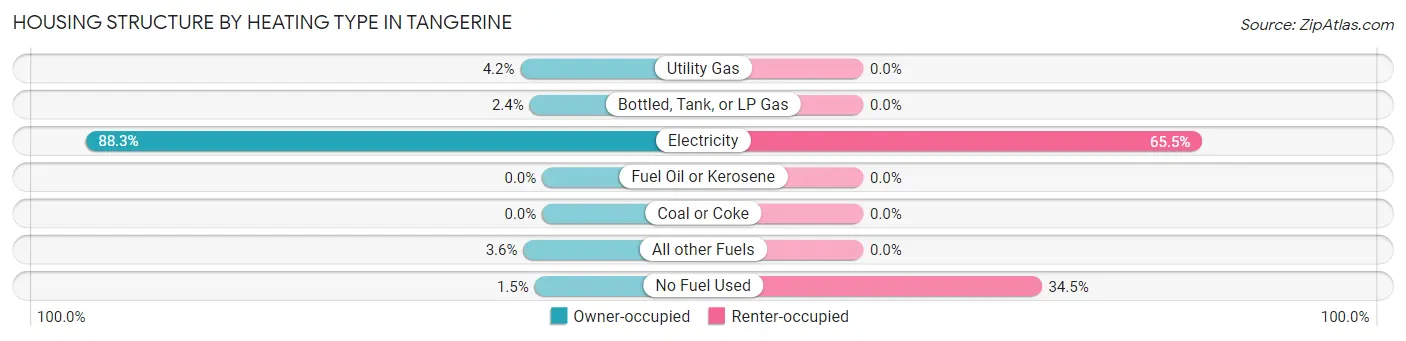
| Heating Type | Owner-occupied | Renter-occupied |
| Utility Gas | 52 (4.2%) | 0 (0.0%) |
| Bottled, Tank, or LP Gas | 30 (2.4%) | 0 (0.0%) |
| Electricity | 1,091 (88.3%) | 19 (65.5%) |
| Fuel Oil or Kerosene | 0 (0.0%) | 0 (0.0%) |
| Coal or Coke | 0 (0.0%) | 0 (0.0%) |
| All other Fuels | 45 (3.6%) | 0 (0.0%) |
| No Fuel Used | 18 (1.5%) | 10 (34.5%) |
| Total | 1,236 (100.0%) | 29 (100.0%) |
Household Vehicle Usage in Tangerine
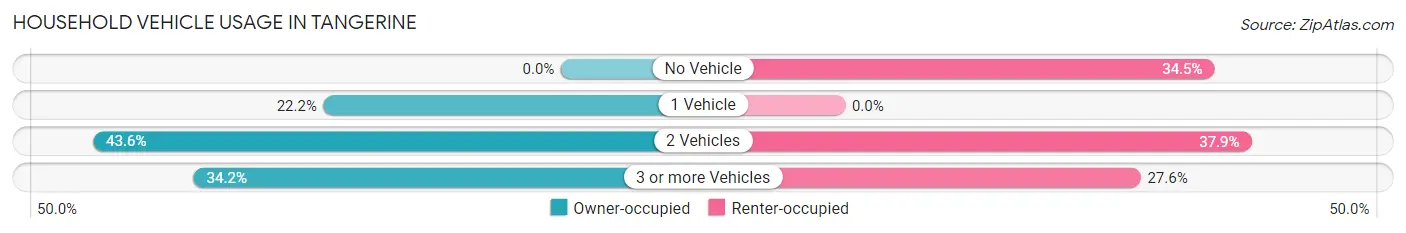
| Vehicles per Household | Owner-occupied | Renter-occupied |
| No Vehicle | 0 (0.0%) | 10 (34.5%) |
| 1 Vehicle | 274 (22.2%) | 0 (0.0%) |
| 2 Vehicles | 539 (43.6%) | 11 (37.9%) |
| 3 or more Vehicles | 423 (34.2%) | 8 (27.6%) |
| Total | 1,236 (100.0%) | 29 (100.0%) |
Real Estate & Mortgages in Tangerine
Real Estate and Mortgage Overview in Tangerine
| Characteristic | Without Mortgage | With Mortgage |
| Housing Units | 442 | 794 |
| Median Property Value | $404,500 | $399,600 |
| Median Household Income | $86,786 | $277 |
| Monthly Housing Costs | $561 | $65 |
| Real Estate Taxes | $2,780 | $34 |
Property Value by Mortgage Status in Tangerine
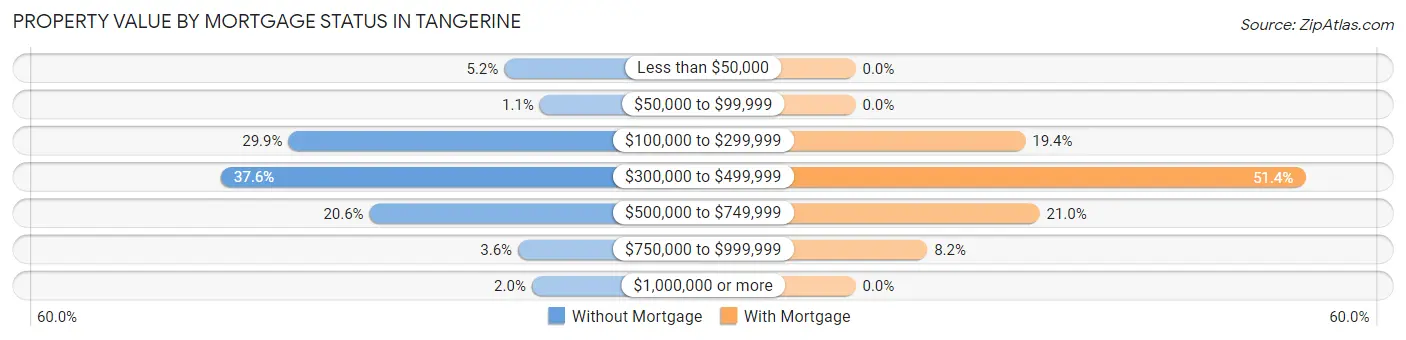
| Property Value | Without Mortgage | With Mortgage |
| Less than $50,000 | 23 (5.2%) | 0 (0.0%) |
| $50,000 to $99,999 | 5 (1.1%) | 0 (0.0%) |
| $100,000 to $299,999 | 132 (29.9%) | 154 (19.4%) |
| $300,000 to $499,999 | 166 (37.6%) | 408 (51.4%) |
| $500,000 to $749,999 | 91 (20.6%) | 167 (21.0%) |
| $750,000 to $999,999 | 16 (3.6%) | 65 (8.2%) |
| $1,000,000 or more | 9 (2.0%) | 0 (0.0%) |
| Total | 442 (100.0%) | 794 (100.0%) |
Household Income by Mortgage Status in Tangerine
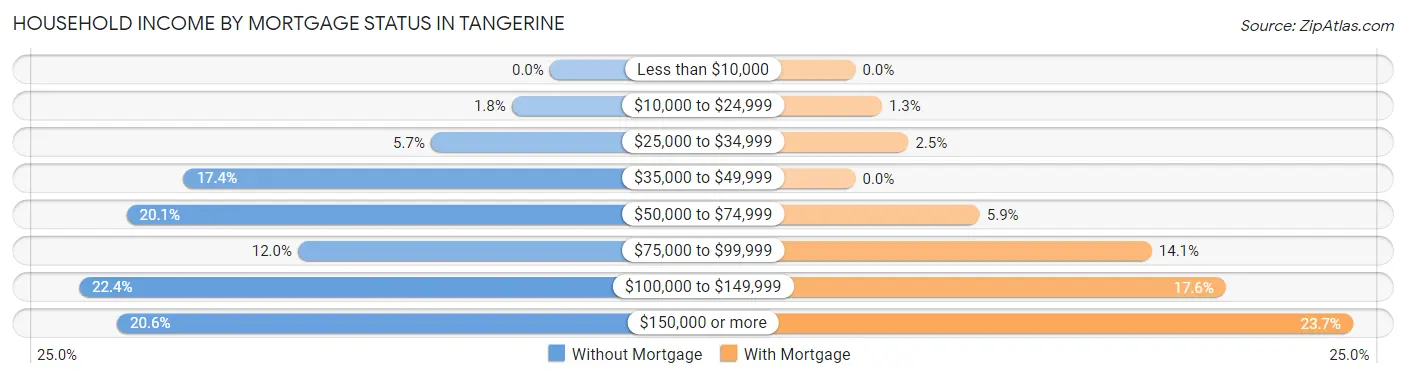
| Household Income | Without Mortgage | With Mortgage |
| Less than $10,000 | 0 (0.0%) | 0 (0.0%) |
| $10,000 to $24,999 | 8 (1.8%) | 10 (1.3%) |
| $25,000 to $34,999 | 25 (5.7%) | 20 (2.5%) |
| $35,000 to $49,999 | 77 (17.4%) | 0 (0.0%) |
| $50,000 to $74,999 | 89 (20.1%) | 47 (5.9%) |
| $75,000 to $99,999 | 53 (12.0%) | 112 (14.1%) |
| $100,000 to $149,999 | 99 (22.4%) | 140 (17.6%) |
| $150,000 or more | 91 (20.6%) | 188 (23.7%) |
| Total | 442 (100.0%) | 794 (100.0%) |
Property Value to Household Income Ratio in Tangerine
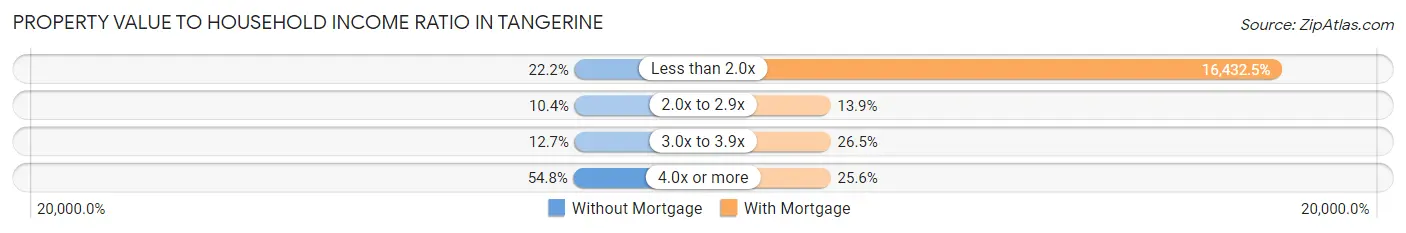
| Value-to-Income Ratio | Without Mortgage | With Mortgage |
| Less than 2.0x | 98 (22.2%) | 130,474 (16,432.5%) |
| 2.0x to 2.9x | 46 (10.4%) | 110 (13.9%) |
| 3.0x to 3.9x | 56 (12.7%) | 210 (26.5%) |
| 4.0x or more | 242 (54.7%) | 203 (25.6%) |
| Total | 442 (100.0%) | 794 (100.0%) |
Real Estate Taxes by Mortgage Status in Tangerine
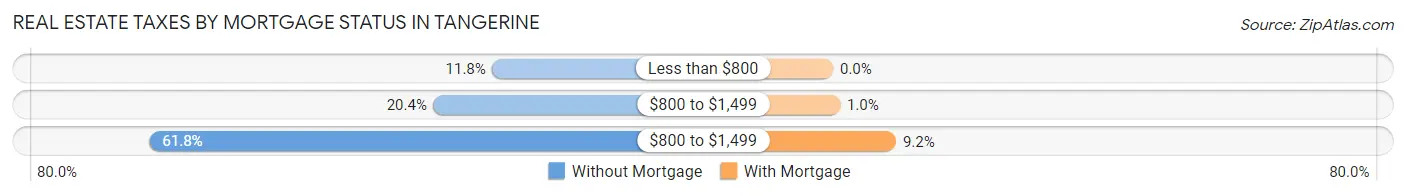
| Property Taxes | Without Mortgage | With Mortgage |
| Less than $800 | 52 (11.8%) | 0 (0.0%) |
| $800 to $1,499 | 90 (20.4%) | 8 (1.0%) |
| $800 to $1,499 | 273 (61.8%) | 73 (9.2%) |
| Total | 442 (100.0%) | 794 (100.0%) |
Health & Disability in Tangerine
Health Insurance Coverage by Age in Tangerine
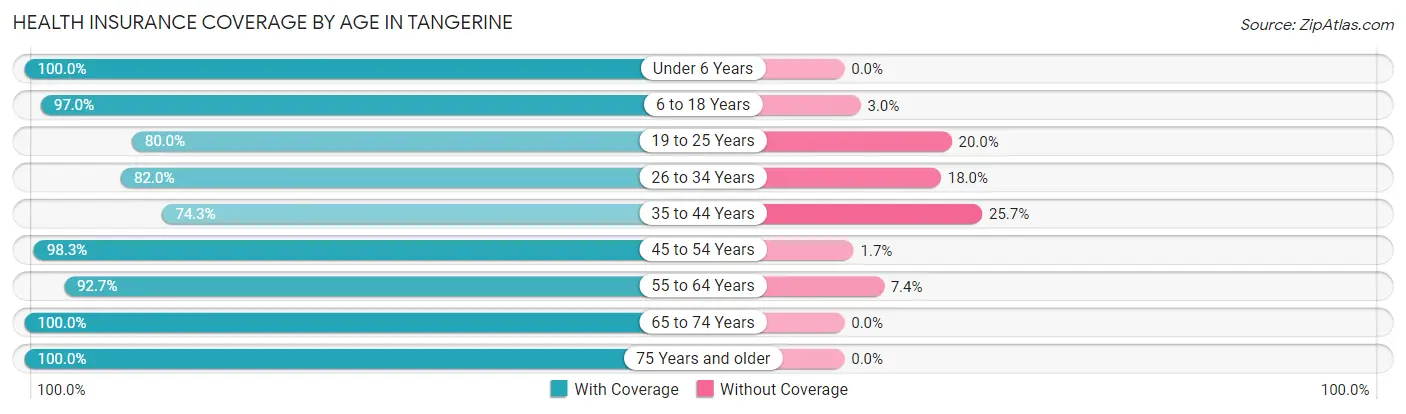
| Age Bracket | With Coverage | Without Coverage |
| Under 6 Years | 143 (100.0%) | 0 (0.0%) |
| 6 to 18 Years | 767 (97.0%) | 24 (3.0%) |
| 19 to 25 Years | 244 (80.0%) | 61 (20.0%) |
| 26 to 34 Years | 228 (82.0%) | 50 (18.0%) |
| 35 to 44 Years | 567 (74.3%) | 196 (25.7%) |
| 45 to 54 Years | 282 (98.3%) | 5 (1.7%) |
| 55 to 64 Years | 567 (92.6%) | 45 (7.3%) |
| 65 to 74 Years | 486 (100.0%) | 0 (0.0%) |
| 75 Years and older | 205 (100.0%) | 0 (0.0%) |
| Total | 3,489 (90.2%) | 381 (9.8%) |
Health Insurance Coverage by Citizenship Status in Tangerine
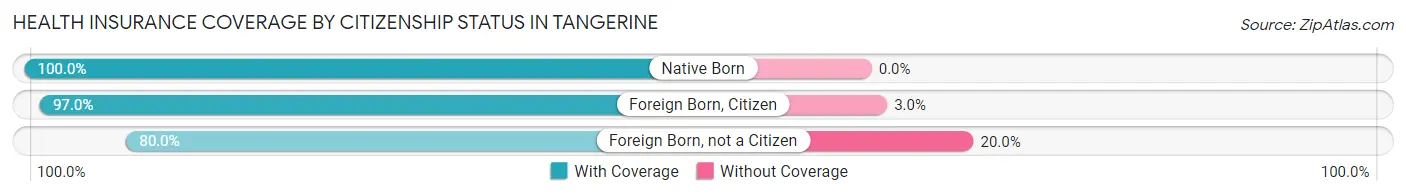
| Citizenship Status | With Coverage | Without Coverage |
| Native Born | 143 (100.0%) | 0 (0.0%) |
| Foreign Born, Citizen | 767 (97.0%) | 24 (3.0%) |
| Foreign Born, not a Citizen | 244 (80.0%) | 61 (20.0%) |
Health Insurance Coverage by Household Income in Tangerine
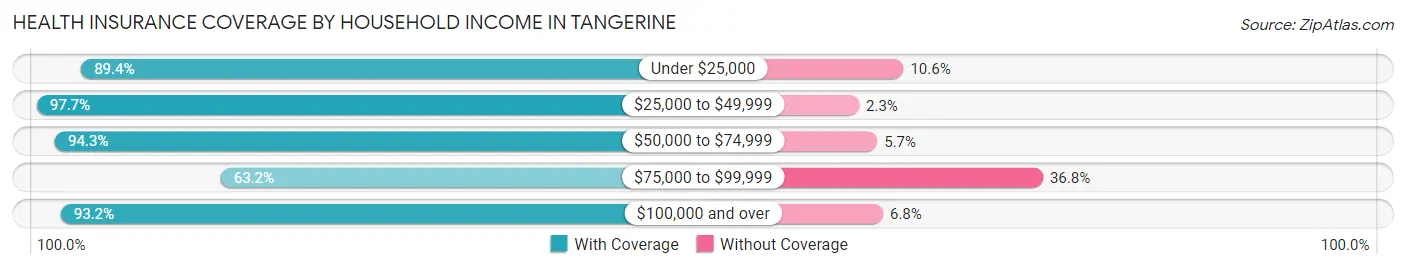
| Household Income | With Coverage | Without Coverage |
| Under $25,000 | 101 (89.4%) | 12 (10.6%) |
| $25,000 to $49,999 | 298 (97.7%) | 7 (2.3%) |
| $50,000 to $74,999 | 594 (94.3%) | 36 (5.7%) |
| $75,000 to $99,999 | 258 (63.2%) | 150 (36.8%) |
| $100,000 and over | 2,223 (93.2%) | 162 (6.8%) |
Public vs Private Health Insurance Coverage by Age in Tangerine
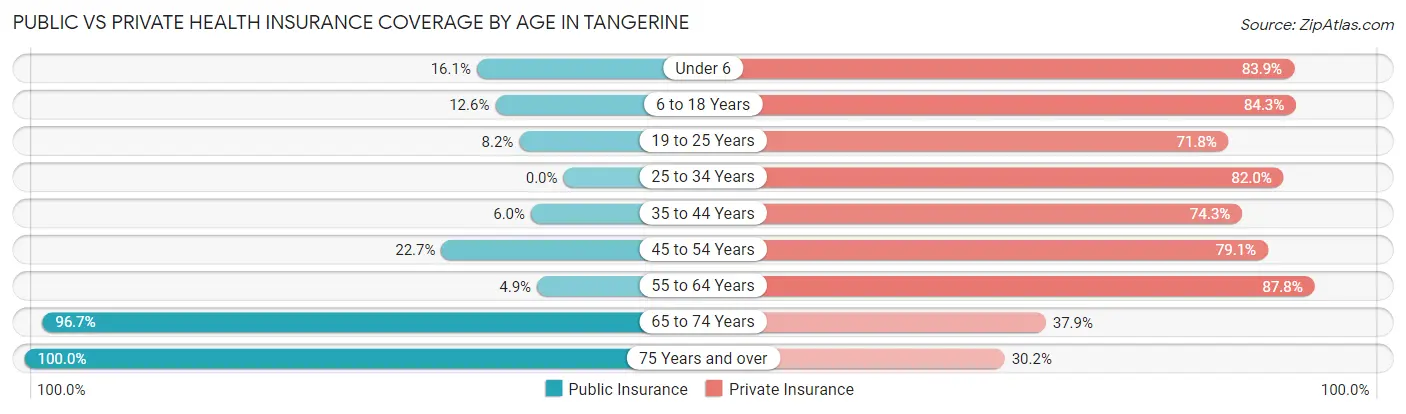
| Age Bracket | Public Insurance | Private Insurance |
| Under 6 | 23 (16.1%) | 120 (83.9%) |
| 6 to 18 Years | 100 (12.6%) | 667 (84.3%) |
| 19 to 25 Years | 25 (8.2%) | 219 (71.8%) |
| 25 to 34 Years | 0 (0.0%) | 228 (82.0%) |
| 35 to 44 Years | 46 (6.0%) | 567 (74.3%) |
| 45 to 54 Years | 65 (22.7%) | 227 (79.1%) |
| 55 to 64 Years | 30 (4.9%) | 537 (87.7%) |
| 65 to 74 Years | 470 (96.7%) | 184 (37.9%) |
| 75 Years and over | 205 (100.0%) | 62 (30.2%) |
| Total | 964 (24.9%) | 2,811 (72.6%) |
Disability Status by Sex by Age in Tangerine
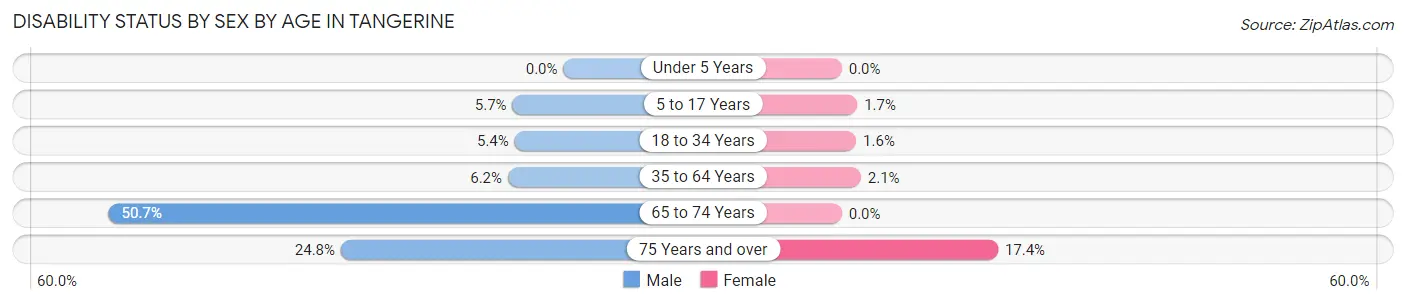
| Age Bracket | Male | Female |
| Under 5 Years | 0 (0.0%) | 0 (0.0%) |
| 5 to 17 Years | 20 (5.7%) | 7 (1.7%) |
| 18 to 34 Years | 25 (5.4%) | 3 (1.6%) |
| 35 to 64 Years | 59 (6.2%) | 15 (2.1%) |
| 65 to 74 Years | 117 (50.6%) | 0 (0.0%) |
| 75 Years and over | 28 (24.8%) | 16 (17.4%) |
Disability Class by Sex by Age in Tangerine
Disability Class: Hearing Difficulty
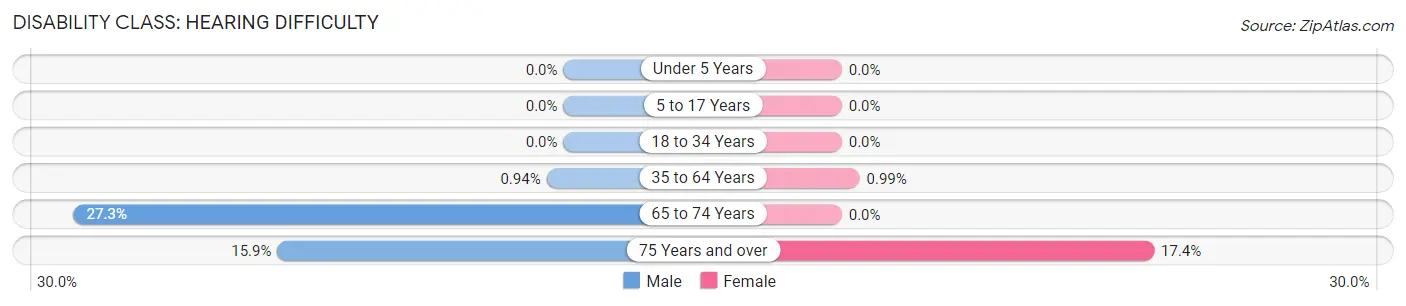
| Age Bracket | Male | Female |
| Under 5 Years | 0 (0.0%) | 0 (0.0%) |
| 5 to 17 Years | 0 (0.0%) | 0 (0.0%) |
| 18 to 34 Years | 0 (0.0%) | 0 (0.0%) |
| 35 to 64 Years | 9 (0.9%) | 7 (1.0%) |
| 65 to 74 Years | 63 (27.3%) | 0 (0.0%) |
| 75 Years and over | 18 (15.9%) | 16 (17.4%) |
Disability Class: Vision Difficulty
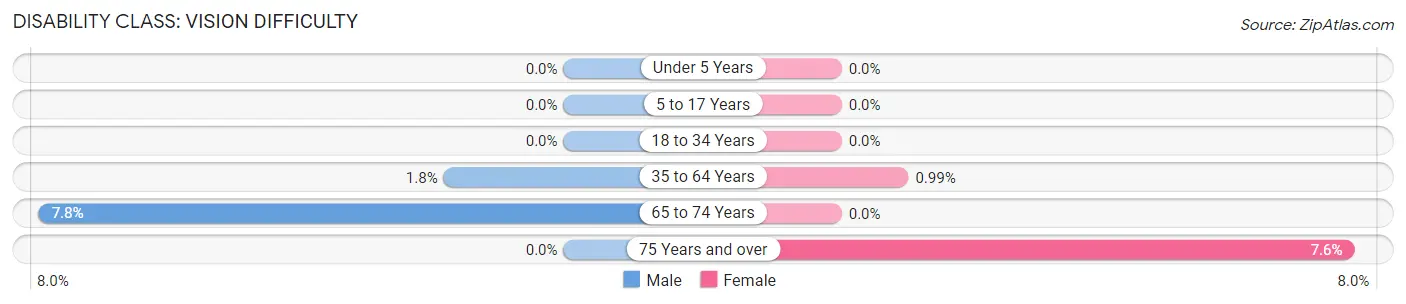
| Age Bracket | Male | Female |
| Under 5 Years | 0 (0.0%) | 0 (0.0%) |
| 5 to 17 Years | 0 (0.0%) | 0 (0.0%) |
| 18 to 34 Years | 0 (0.0%) | 0 (0.0%) |
| 35 to 64 Years | 17 (1.8%) | 7 (1.0%) |
| 65 to 74 Years | 18 (7.8%) | 0 (0.0%) |
| 75 Years and over | 0 (0.0%) | 7 (7.6%) |
Disability Class: Cognitive Difficulty
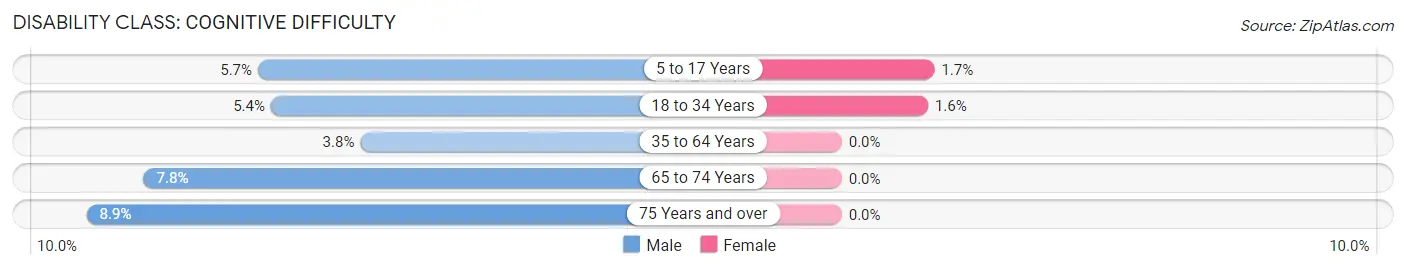
| Age Bracket | Male | Female |
| 5 to 17 Years | 20 (5.7%) | 7 (1.7%) |
| 18 to 34 Years | 25 (5.4%) | 3 (1.6%) |
| 35 to 64 Years | 36 (3.8%) | 0 (0.0%) |
| 65 to 74 Years | 18 (7.8%) | 0 (0.0%) |
| 75 Years and over | 10 (8.8%) | 0 (0.0%) |
Disability Class: Ambulatory Difficulty
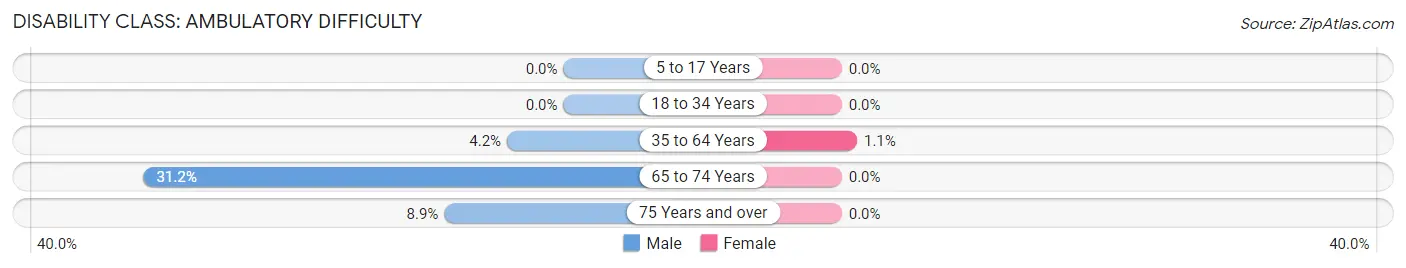
| Age Bracket | Male | Female |
| 5 to 17 Years | 0 (0.0%) | 0 (0.0%) |
| 18 to 34 Years | 0 (0.0%) | 0 (0.0%) |
| 35 to 64 Years | 40 (4.2%) | 8 (1.1%) |
| 65 to 74 Years | 72 (31.2%) | 0 (0.0%) |
| 75 Years and over | 10 (8.8%) | 0 (0.0%) |
Disability Class: Self-Care Difficulty
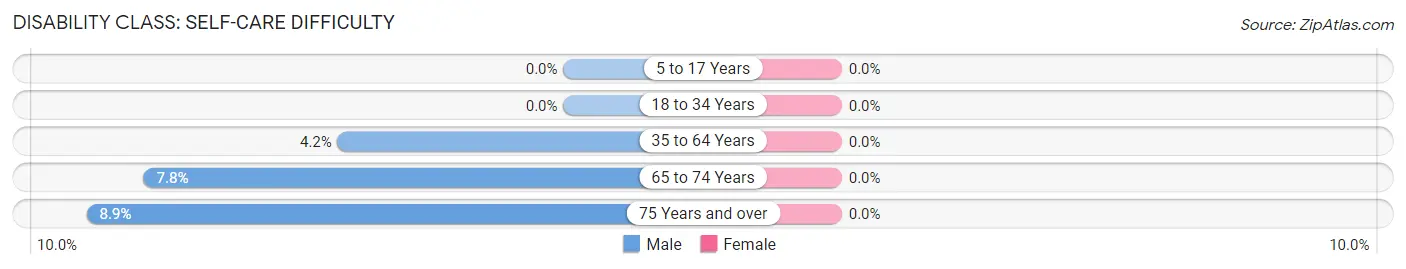
| Age Bracket | Male | Female |
| 5 to 17 Years | 0 (0.0%) | 0 (0.0%) |
| 18 to 34 Years | 0 (0.0%) | 0 (0.0%) |
| 35 to 64 Years | 40 (4.2%) | 0 (0.0%) |
| 65 to 74 Years | 18 (7.8%) | 0 (0.0%) |
| 75 Years and over | 10 (8.8%) | 0 (0.0%) |
Technology Access in Tangerine
Computing Device Access in Tangerine
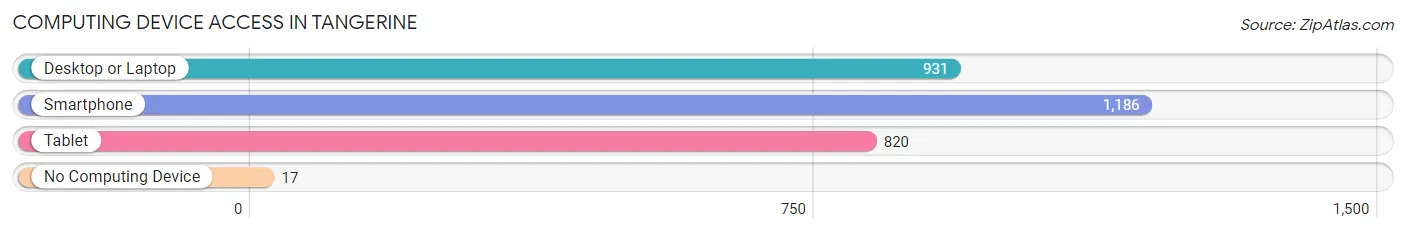
| Device Type | # Households | % Households |
| Desktop or Laptop | 931 | 73.6% |
| Smartphone | 1,186 | 93.8% |
| Tablet | 820 | 64.8% |
| No Computing Device | 17 | 1.3% |
| Total | 1,265 | 100.0% |
Internet Access in Tangerine
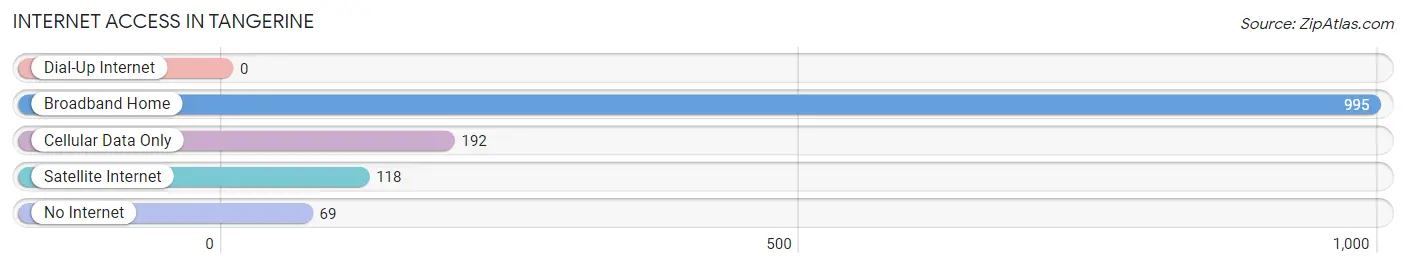
| Internet Type | # Households | % Households |
| Dial-Up Internet | 0 | 0.0% |
| Broadband Home | 995 | 78.7% |
| Cellular Data Only | 192 | 15.2% |
| Satellite Internet | 118 | 9.3% |
| No Internet | 69 | 5.4% |
| Total | 1,265 | 100.0% |
Tangerine Summary
Tangerine, Florida is a small unincorporated community located in Orange County, Florida. It is situated in the northwest corner of the county, just south of the city of Apopka. The population of Tangerine was estimated to be 1,845 in 2019.
History
Tangerine was first settled in the late 1800s by a group of settlers from the nearby town of Apopka. The settlers were attracted to the area due to its fertile soil and abundant wildlife. The town was originally known as “Tangerine Grove” and was named after the abundance of tangerine trees in the area. The town was officially incorporated in 1925 and was renamed “Tangerine”.
In the early 1900s, Tangerine was a thriving agricultural community. The town was known for its citrus groves and was home to several packing houses. The town also had a sawmill and a turpentine still. In the 1920s, the town began to experience a population boom as more people moved to the area to take advantage of the fertile soil and abundant wildlife.
Geography
Tangerine is located in the northwest corner of Orange County, Florida. It is situated just south of the city of Apopka and is bordered by the towns of Zellwood and Plymouth. The town is located on the western edge of the Orlando metropolitan area and is approximately 20 miles from downtown Orlando.
The town is situated on a flat plain and is surrounded by rolling hills. The terrain is mostly flat and is covered with pine and oak trees. The town is located in a humid subtropical climate zone and experiences hot, humid summers and mild winters.
Economy
Tangerine’s economy is largely based on agriculture. The town is home to several citrus groves and packing houses. The town also has a sawmill and a turpentine still. In addition, the town is home to several small businesses, including a gas station, a convenience store, and a restaurant.
Demographics
As of 2019, the population of Tangerine was estimated to be 1,845. The town is predominantly white, with approximately 75% of the population identifying as white. The remaining 25% of the population is made up of African Americans, Hispanics, and other ethnicities. The median household income in Tangerine is $45,000, and the median home value is $150,000.
Conclusion
Tangerine, Florida is a small unincorporated community located in Orange County, Florida. It is situated in the northwest corner of the county, just south of the city of Apopka. The population of Tangerine was estimated to be 1,845 in 2019. The town is predominantly white, with approximately 75% of the population identifying as white. The town’s economy is largely based on agriculture, and the town is home to several citrus groves and packing houses. The median household income in Tangerine is $45,000, and the median home value is $150,000.
Common Questions
What is Per Capita Income in Tangerine?
Per Capita income in Tangerine is $44,587.
What is the Median Family Income in Tangerine?
Median Family Income in Tangerine is $123,438.
What is the Median Household income in Tangerine?
Median Household Income in Tangerine is $107,880.
What is Income or Wage Gap in Tangerine?
Income or Wage Gap in Tangerine is 2.2%.
Women in Tangerine earn 97.8 cents for every dollar earned by a man.
What is Inequality or Gini Index in Tangerine?
Inequality or Gini Index in Tangerine is 0.38.
What is the Total Population of Tangerine?
Total Population of Tangerine is 3,870.
What is the Total Male Population of Tangerine?
Total Male Population of Tangerine is 2,118.
What is the Total Female Population of Tangerine?
Total Female Population of Tangerine is 1,752.
What is the Ratio of Males per 100 Females in Tangerine?
There are 120.89 Males per 100 Females in Tangerine.
What is the Ratio of Females per 100 Males in Tangerine?
There are 82.72 Females per 100 Males in Tangerine.
What is the Median Population Age in Tangerine?
Median Population Age in Tangerine is 41.2 Years.
What is the Average Family Size in Tangerine
Average Family Size in Tangerine is 3.3 People.
What is the Average Household Size in Tangerine
Average Household Size in Tangerine is 3.0 People.
How Large is the Labor Force in Tangerine?
There are 2,092 People in the Labor Forcein in Tangerine.
What is the Percentage of People in the Labor Force in Tangerine?
65.9% of People are in the Labor Force in Tangerine.
What is the Unemployment Rate in Tangerine?
Unemployment Rate in Tangerine is 2.5%.