East Bronson, FL Map & Demographics
East Bronson Map
East Bronson Overview
$29,439
PER CAPITA INCOME
$53,661
AVG FAMILY INCOME
$49,447
AVG HOUSEHOLD INCOME
39.6%
WAGE / INCOME GAP [ % ]
60.4¢/ $1
WAGE / INCOME GAP [ $ ]
0.37
INEQUALITY / GINI INDEX
1,924
TOTAL POPULATION
948
MALE POPULATION
976
FEMALE POPULATION
97.13
MALES / 100 FEMALES
102.95
FEMALES / 100 MALES
50.1
MEDIAN AGE
2.6
AVG FAMILY SIZE
2.1
AVG HOUSEHOLD SIZE
935
LABOR FORCE [ PEOPLE ]
59.0%
PERCENT IN LABOR FORCE
3.1%
UNEMPLOYMENT RATE
Income in East Bronson
Income Overview in East Bronson
Per Capita Income in East Bronson is $29,439, while median incomes of families and households are $53,661 and $49,447 respectively.
| Characteristic | Number | Measure |
| Per Capita Income | 1,924 | $29,439 |
| Median Family Income | 591 | $53,661 |
| Mean Family Income | 591 | $70,774 |
| Median Household Income | 904 | $49,447 |
| Mean Household Income | 904 | $60,242 |
| Income Deficit | 591 | $0 |
| Wage / Income Gap (%) | 1,924 | 39.59% |
| Wage / Income Gap ($) | 1,924 | 60.41¢ per $1 |
| Gini / Inequality Index | 1,924 | 0.37 |
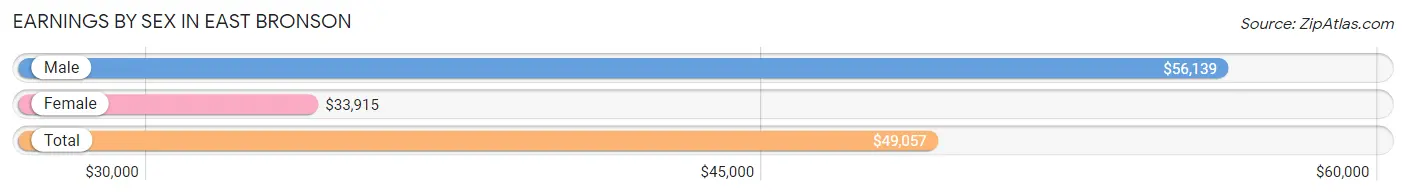
Earnings by Sex in East Bronson
Average Earnings in East Bronson are $49,057, $56,139 for men and $33,915 for women, a difference of 39.6%.
| Sex | Number | Average Earnings |
| Male | 542 (56.2%) | $56,139 |
| Female | 422 (43.8%) | $33,915 |
| Total | 964 (100.0%) | $49,057 |
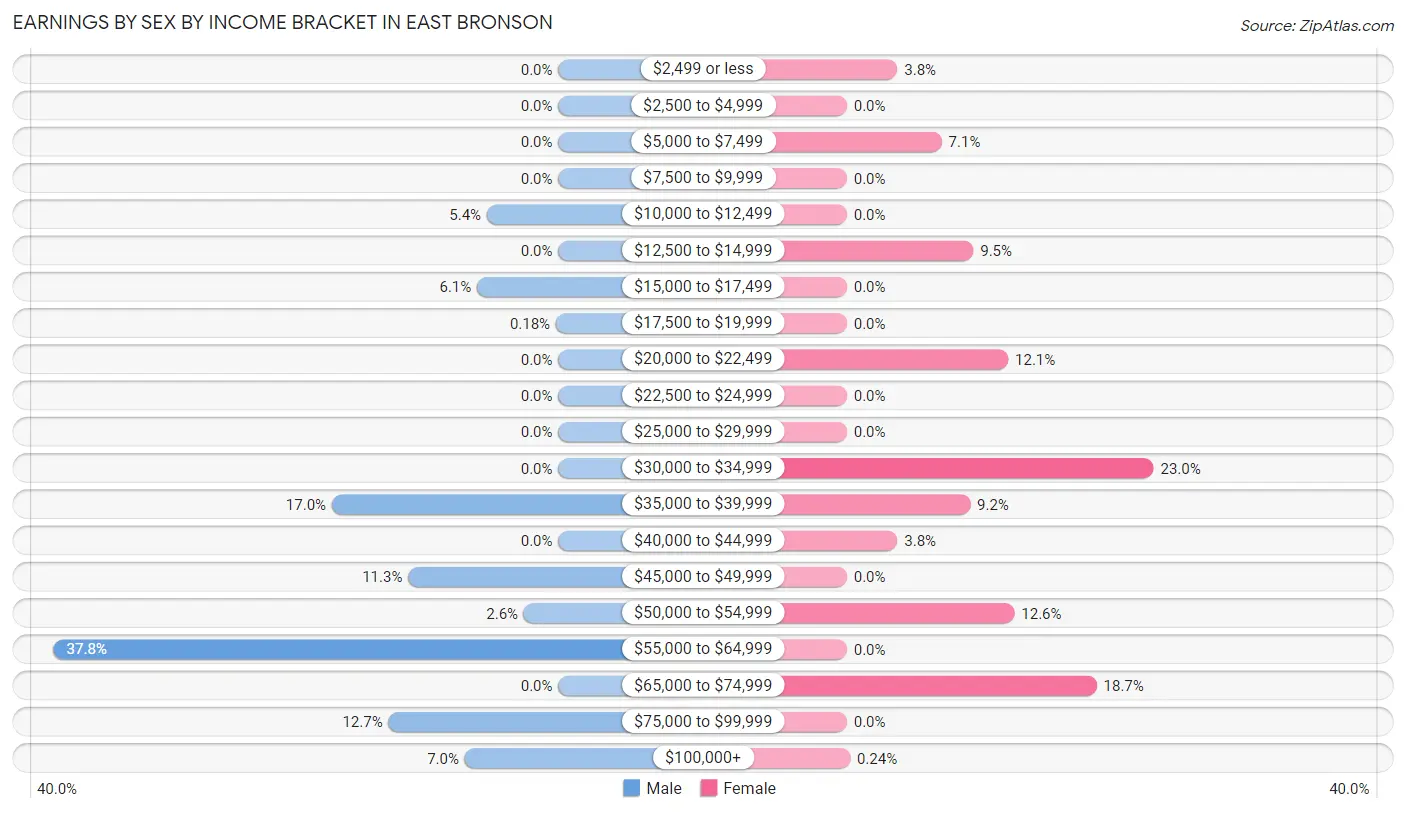
Earnings by Sex by Income Bracket in East Bronson
The most common earnings brackets in East Bronson are $55,000 to $64,999 for men (205 | 37.8%) and $30,000 to $34,999 for women (97 | 23.0%).
| Income | Male | Female |
| $2,499 or less | 0 (0.0%) | 16 (3.8%) |
| $2,500 to $4,999 | 0 (0.0%) | 0 (0.0%) |
| $5,000 to $7,499 | 0 (0.0%) | 30 (7.1%) |
| $7,500 to $9,999 | 0 (0.0%) | 0 (0.0%) |
| $10,000 to $12,499 | 29 (5.3%) | 0 (0.0%) |
| $12,500 to $14,999 | 0 (0.0%) | 40 (9.5%) |
| $15,000 to $17,499 | 33 (6.1%) | 0 (0.0%) |
| $17,500 to $19,999 | 1 (0.2%) | 0 (0.0%) |
| $20,000 to $22,499 | 0 (0.0%) | 51 (12.1%) |
| $22,500 to $24,999 | 0 (0.0%) | 0 (0.0%) |
| $25,000 to $29,999 | 0 (0.0%) | 0 (0.0%) |
| $30,000 to $34,999 | 0 (0.0%) | 97 (23.0%) |
| $35,000 to $39,999 | 92 (17.0%) | 39 (9.2%) |
| $40,000 to $44,999 | 0 (0.0%) | 16 (3.8%) |
| $45,000 to $49,999 | 61 (11.3%) | 0 (0.0%) |
| $50,000 to $54,999 | 14 (2.6%) | 53 (12.6%) |
| $55,000 to $64,999 | 205 (37.8%) | 0 (0.0%) |
| $65,000 to $74,999 | 0 (0.0%) | 79 (18.7%) |
| $75,000 to $99,999 | 69 (12.7%) | 0 (0.0%) |
| $100,000+ | 38 (7.0%) | 1 (0.2%) |
| Total | 542 (100.0%) | 422 (100.0%) |
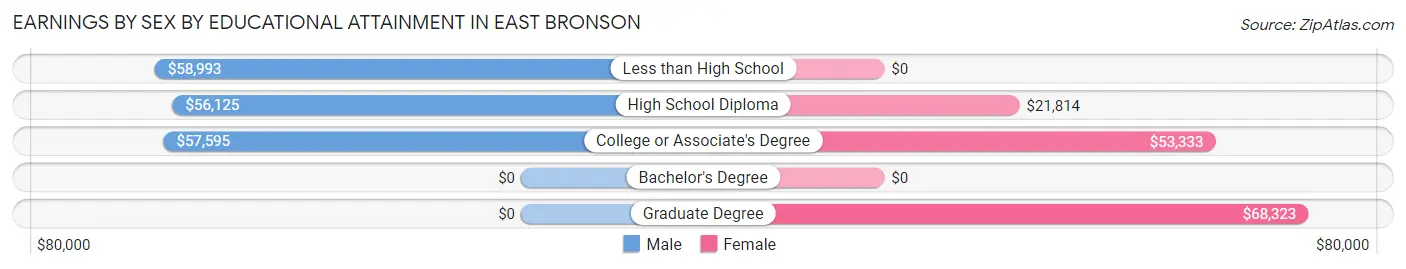
Earnings by Sex by Educational Attainment in East Bronson
Average earnings in East Bronson are $56,139 for men and $36,699 for women, a difference of 34.6%. Men with an educational attainment of less than high school enjoy the highest average annual earnings of $58,993, while those with high school diploma education earn the least with $56,125. Women with an educational attainment of graduate degree earn the most with the average annual earnings of $68,323, while those with high school diploma education have the smallest earnings of $21,814.
| Educational Attainment | Male Income | Female Income |
| Less than High School | $58,993 | $0 |
| High School Diploma | $56,125 | $21,814 |
| College or Associate's Degree | $57,595 | $53,333 |
| Bachelor's Degree | - | - |
| Graduate Degree | - | - |
| Total | $56,139 | $36,699 |
Family Income in East Bronson
Family Income Brackets in East Bronson
According to the East Bronson family income data, there are 149 families falling into the $100,000 to $149,999 income range, which is the most common income bracket and makes up 25.2% of all families.
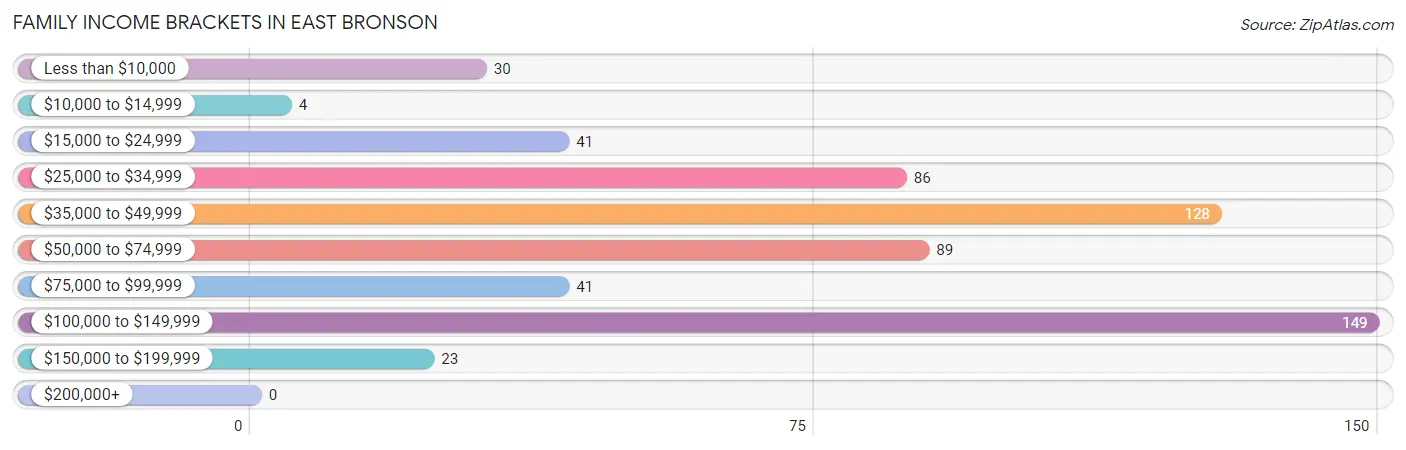
| Income Bracket | # Families | % Families |
| Less than $10,000 | 30 | 5.1% |
| $10,000 to $14,999 | 4 | 0.7% |
| $15,000 to $24,999 | 41 | 6.9% |
| $25,000 to $34,999 | 86 | 14.6% |
| $35,000 to $49,999 | 128 | 21.7% |
| $50,000 to $74,999 | 89 | 15.1% |
| $75,000 to $99,999 | 41 | 6.9% |
| $100,000 to $149,999 | 149 | 25.2% |
| $150,000 to $199,999 | 23 | 3.9% |
| $200,000+ | 0 | 0.0% |
Family Income by Famaliy Size in East Bronson
2-person families (392 | 66.3%) account for the highest median family income in East Bronson with $48,031 per family, while 2-person families (392 | 66.3%) have the highest median income of $24,016 per family member.
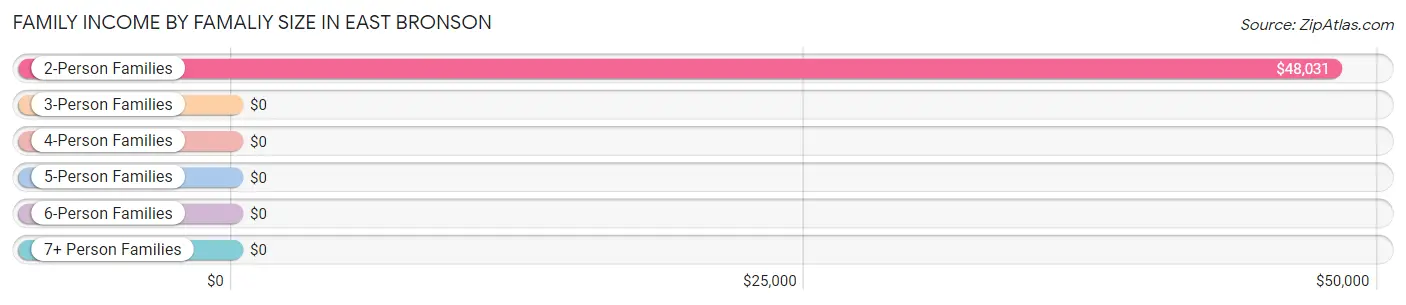
| Income Bracket | # Families | Median Income |
| 2-Person Families | 392 (66.3%) | $48,031 |
| 3-Person Families | 162 (27.4%) | $0 |
| 4-Person Families | 0 (0.0%) | $0 |
| 5-Person Families | 37 (6.3%) | $0 |
| 6-Person Families | 0 (0.0%) | $0 |
| 7+ Person Families | 0 (0.0%) | $0 |
| Total | 591 (100.0%) | $53,661 |
Family Income by Number of Earners in East Bronson
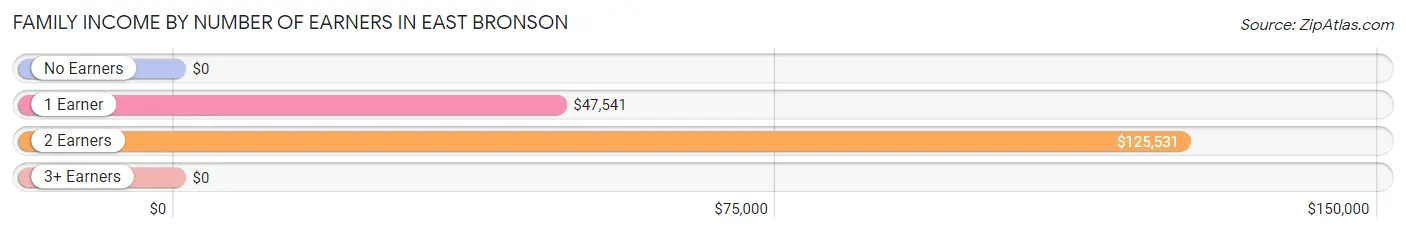
| Number of Earners | # Families | Median Income |
| No Earners | 73 (12.3%) | $0 |
| 1 Earner | 312 (52.8%) | $47,541 |
| 2 Earners | 206 (34.9%) | $125,531 |
| 3+ Earners | 0 (0.0%) | $0 |
| Total | 591 (100.0%) | $53,661 |
Household Income in East Bronson
Household Income Brackets in East Bronson
With 214 households falling in the category, the $50,000 to $74,999 income range is the most frequent in East Bronson, accounting for 23.7% of all households.
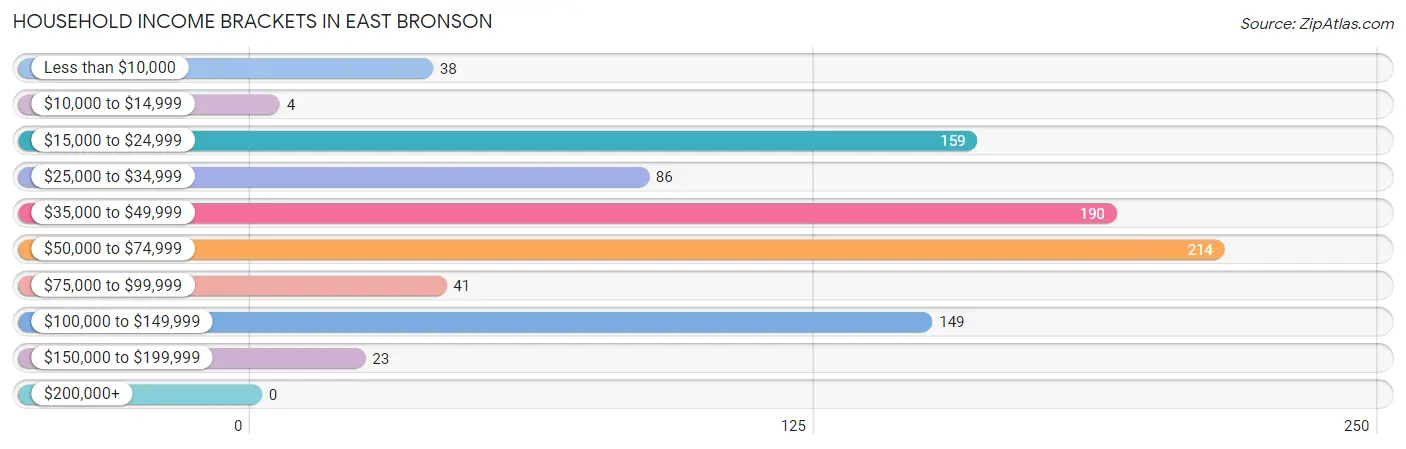
| Income Bracket | # Households | % Households |
| Less than $10,000 | 38 | 4.2% |
| $10,000 to $14,999 | 4 | 0.4% |
| $15,000 to $24,999 | 159 | 17.6% |
| $25,000 to $34,999 | 86 | 9.5% |
| $35,000 to $49,999 | 190 | 21.0% |
| $50,000 to $74,999 | 214 | 23.7% |
| $75,000 to $99,999 | 41 | 4.5% |
| $100,000 to $149,999 | 149 | 16.5% |
| $150,000 to $199,999 | 23 | 2.5% |
| $200,000+ | 0 | 0.0% |
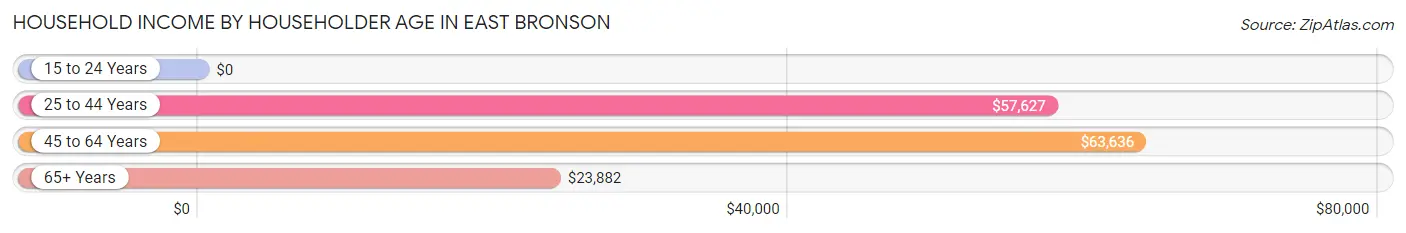
Household Income by Householder Age in East Bronson
The median household income in East Bronson is $49,447, with the highest median household income of $63,636 found in the 45 to 64 years age bracket for the primary householder. A total of 404 households (44.7%) fall into this category. Meanwhile, the 15 to 24 years age bracket for the primary householder has the lowest median household income of $0, with 30 households (3.3%) in this group.
| Income Bracket | # Households | Median Income |
| 15 to 24 Years | 30 (3.3%) | $0 |
| 25 to 44 Years | 152 (16.8%) | $57,627 |
| 45 to 64 Years | 404 (44.7%) | $63,636 |
| 65+ Years | 318 (35.2%) | $23,882 |
| Total | 904 (100.0%) | $49,447 |
Poverty in East Bronson
Income Below Poverty by Sex and Age in East Bronson
With 13.0% poverty level for males and 10.7% for females among the residents of East Bronson, under 5 year old males and under 5 year old females are the most vulnerable to poverty, with 42 males (100.0%) and 40 females (40.0%) in their respective age groups living below the poverty level.
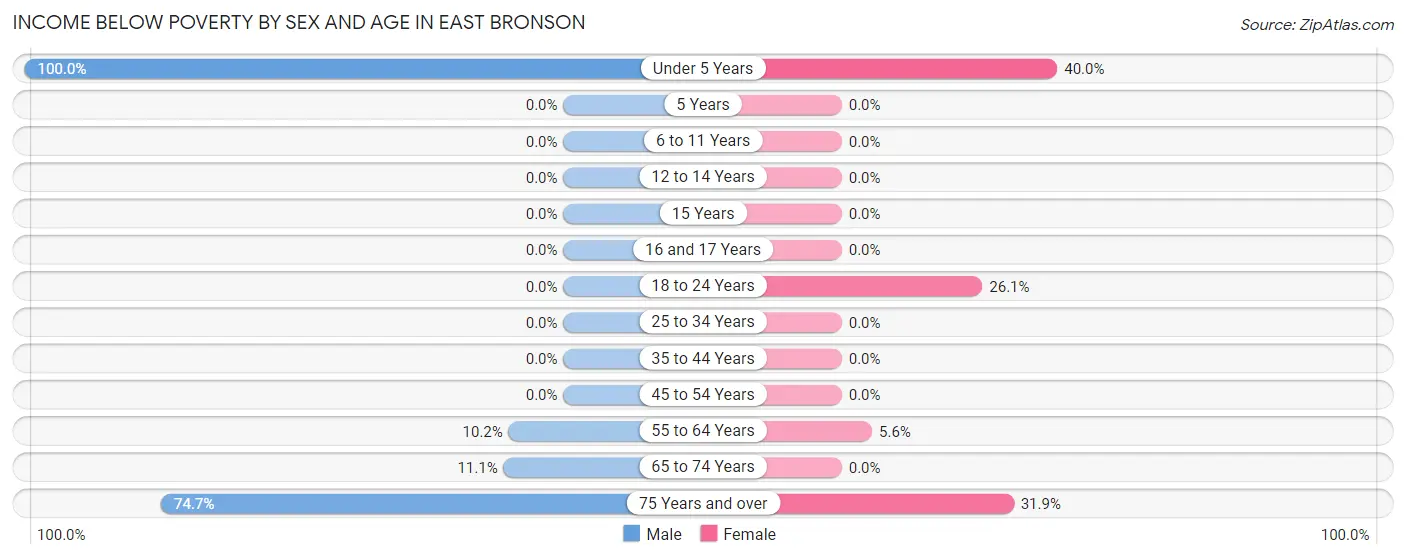
| Age Bracket | Male | Female |
| Under 5 Years | 42 (100.0%) | 40 (40.0%) |
| 5 Years | 0 (0.0%) | 0 (0.0%) |
| 6 to 11 Years | 0 (0.0%) | 0 (0.0%) |
| 12 to 14 Years | 0 (0.0%) | 0 (0.0%) |
| 15 Years | 0 (0.0%) | 0 (0.0%) |
| 16 and 17 Years | 0 (0.0%) | 0 (0.0%) |
| 18 to 24 Years | 0 (0.0%) | 30 (26.1%) |
| 25 to 34 Years | 0 (0.0%) | 0 (0.0%) |
| 35 to 44 Years | 0 (0.0%) | 0 (0.0%) |
| 45 to 54 Years | 0 (0.0%) | 0 (0.0%) |
| 55 to 64 Years | 13 (10.2%) | 4 (5.6%) |
| 65 to 74 Years | 12 (11.1%) | 0 (0.0%) |
| 75 Years and over | 56 (74.7%) | 30 (31.9%) |
| Total | 123 (13.0%) | 104 (10.7%) |
Income Above Poverty by Sex and Age in East Bronson
According to the poverty statistics in East Bronson, males aged 6 to 11 years and females aged 6 to 11 years are the age groups that are most secure financially, with 100.0% of males and 100.0% of females in these age groups living above the poverty line.
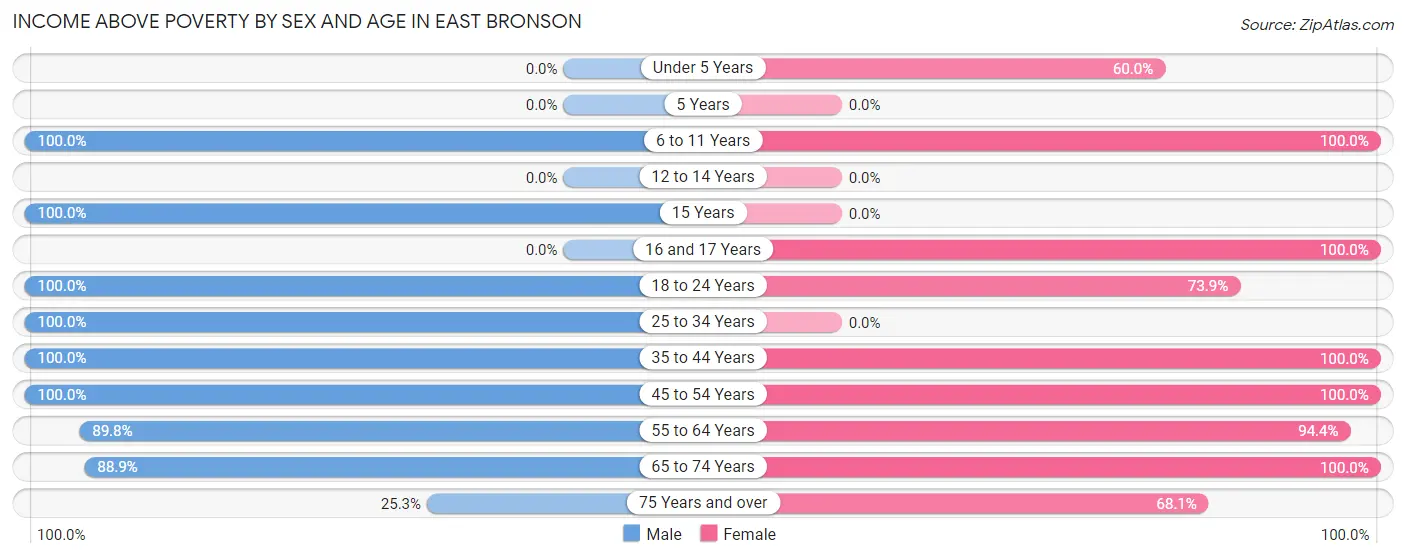
| Age Bracket | Male | Female |
| Under 5 Years | 0 (0.0%) | 60 (60.0%) |
| 5 Years | 0 (0.0%) | 0 (0.0%) |
| 6 to 11 Years | 95 (100.0%) | 60 (100.0%) |
| 12 to 14 Years | 0 (0.0%) | 0 (0.0%) |
| 15 Years | 43 (100.0%) | 0 (0.0%) |
| 16 and 17 Years | 0 (0.0%) | 47 (100.0%) |
| 18 to 24 Years | 18 (100.0%) | 85 (73.9%) |
| 25 to 34 Years | 148 (100.0%) | 0 (0.0%) |
| 35 to 44 Years | 77 (100.0%) | 40 (100.0%) |
| 45 to 54 Years | 214 (100.0%) | 277 (100.0%) |
| 55 to 64 Years | 115 (89.8%) | 67 (94.4%) |
| 65 to 74 Years | 96 (88.9%) | 172 (100.0%) |
| 75 Years and over | 19 (25.3%) | 64 (68.1%) |
| Total | 825 (87.0%) | 872 (89.3%) |
Income Below Poverty Among Married-Couple Families in East Bronson
The poverty statistics for married-couple families in East Bronson show that 5.8% or 26 of the total 452 families live below the poverty line. Families with no children have the highest poverty rate of 9.2%, comprising of 26 families. On the other hand, families with 1 or 2 children have the lowest poverty rate of 0.0%, which includes 0 families.
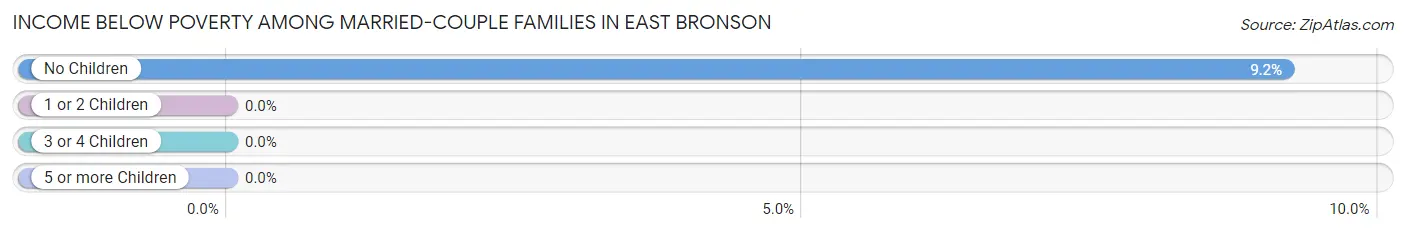
| Children | Above Poverty | Below Poverty |
| No Children | 257 (90.8%) | 26 (9.2%) |
| 1 or 2 Children | 169 (100.0%) | 0 (0.0%) |
| 3 or 4 Children | 0 (0.0%) | 0 (0.0%) |
| 5 or more Children | 0 (0.0%) | 0 (0.0%) |
| Total | 426 (94.3%) | 26 (5.8%) |
Income Below Poverty Among Single-Parent Households in East Bronson
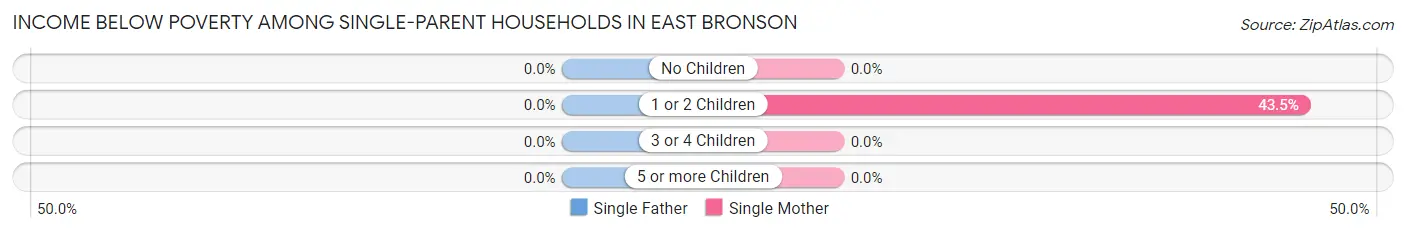
| Children | Single Father | Single Mother |
| No Children | 0 (0.0%) | 0 (0.0%) |
| 1 or 2 Children | 0 (0.0%) | 30 (43.5%) |
| 3 or 4 Children | 0 (0.0%) | 0 (0.0%) |
| 5 or more Children | 0 (0.0%) | 0 (0.0%) |
| Total | 0 (0.0%) | 30 (38.5%) |
Income Below Poverty Among Married-Couple vs Single-Parent Households in East Bronson
The poverty data for East Bronson shows that 26 of the married-couple family households (5.8%) and 30 of the single-parent households (21.6%) are living below the poverty level. Within the married-couple family households, those with no children have the highest poverty rate, with 26 households (9.2%) falling below the poverty line. Among the single-parent households, those with 1 or 2 children have the highest poverty rate, with 30 household (23.1%) living below poverty.
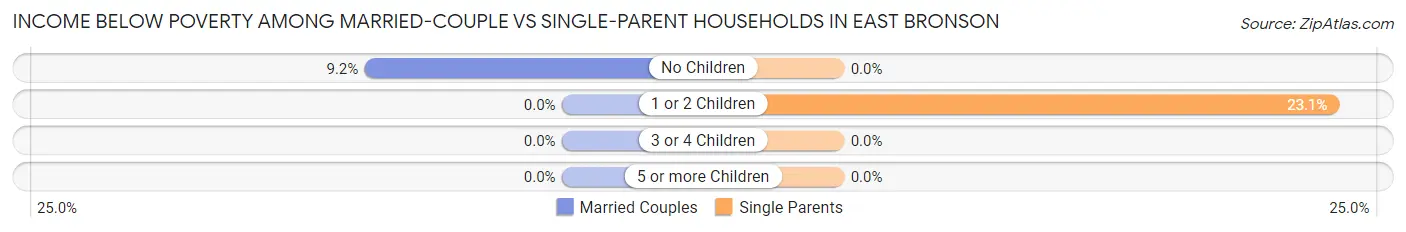
| Children | Married-Couple Families | Single-Parent Households |
| No Children | 26 (9.2%) | 0 (0.0%) |
| 1 or 2 Children | 0 (0.0%) | 30 (23.1%) |
| 3 or 4 Children | 0 (0.0%) | 0 (0.0%) |
| 5 or more Children | 0 (0.0%) | 0 (0.0%) |
| Total | 26 (5.8%) | 30 (21.6%) |
Race in East Bronson
The most populous races in East Bronson are White / Caucasian (1,613 | 83.8%), Hispanic or Latino (273 | 14.2%), and Two or more Races (160 | 8.3%).
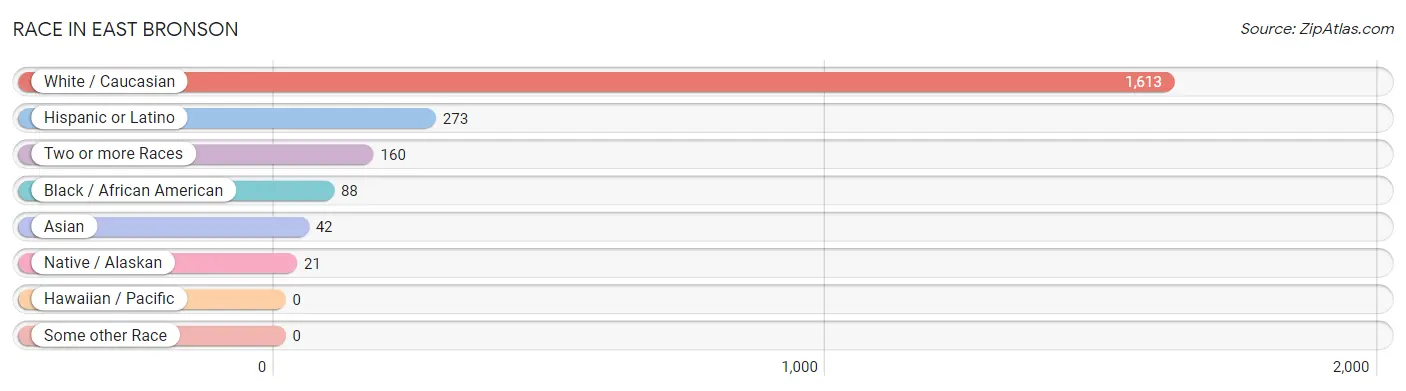
| Race | # Population | % Population |
| Asian | 42 | 2.2% |
| Black / African American | 88 | 4.6% |
| Hawaiian / Pacific | 0 | 0.0% |
| Hispanic or Latino | 273 | 14.2% |
| Native / Alaskan | 21 | 1.1% |
| White / Caucasian | 1,613 | 83.8% |
| Two or more Races | 160 | 8.3% |
| Some other Race | 0 | 0.0% |
| Total | 1,924 | 100.0% |
Ancestry in East Bronson
The most populous ancestries reported in East Bronson are English (497 | 25.8%), Mexican (174 | 9.0%), African (121 | 6.3%), Subsaharan African (121 | 6.3%), and Puerto Rican (84 | 4.4%), together accounting for 51.8% of all East Bronson residents.
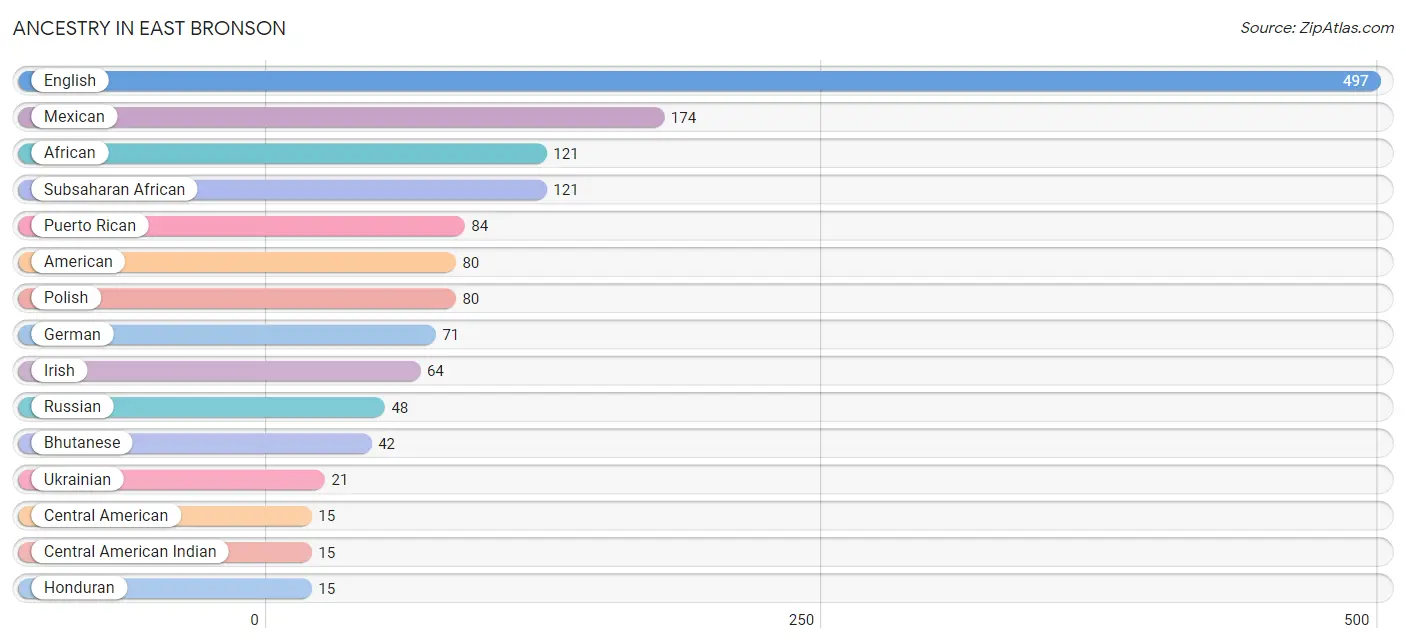
| Ancestry | # Population | % Population |
| African | 121 | 6.3% |
| American | 80 | 4.2% |
| Bhutanese | 42 | 2.2% |
| Central American | 15 | 0.8% |
| Central American Indian | 15 | 0.8% |
| English | 497 | 25.8% |
| German | 71 | 3.7% |
| Honduran | 15 | 0.8% |
| Irish | 64 | 3.3% |
| Italian | 11 | 0.6% |
| Mexican | 174 | 9.0% |
| Polish | 80 | 4.2% |
| Puerto Rican | 84 | 4.4% |
| Russian | 48 | 2.5% |
| Scottish | 13 | 0.7% |
| Subsaharan African | 121 | 6.3% |
| Ukrainian | 21 | 1.1% | View All 17 Rows |
Immigrants in East Bronson
The most numerous immigrant groups reported in East Bronson came from Central America (92 | 4.8%), Latin America (92 | 4.8%), Mexico (77 | 4.0%), Eastern Europe (48 | 2.5%), and Europe (48 | 2.5%), together accounting for 18.5% of all East Bronson residents.
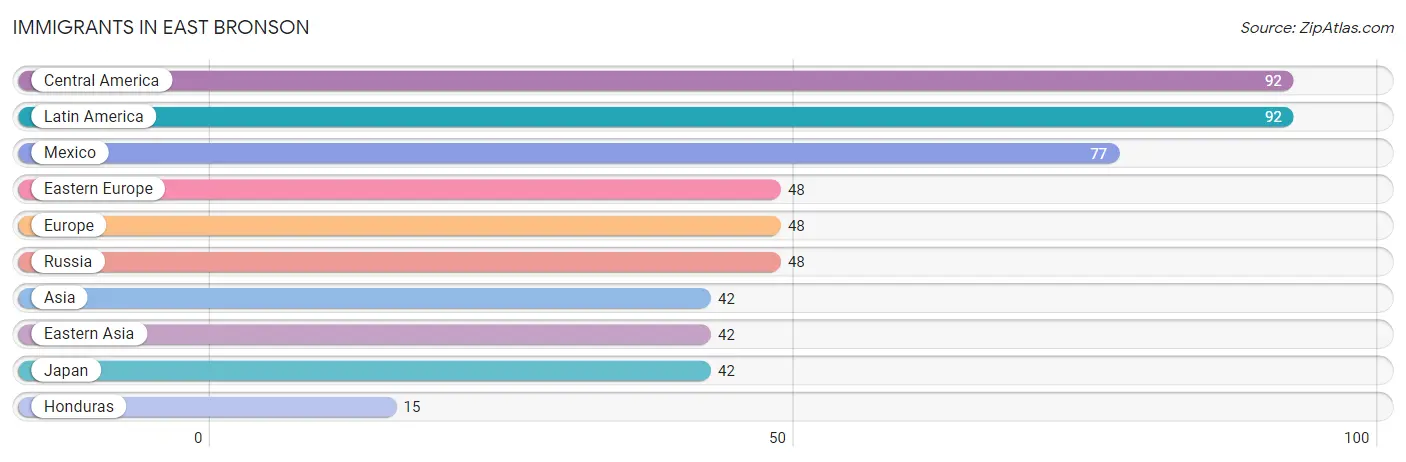
| Immigration Origin | # Population | % Population |
| Asia | 42 | 2.2% |
| Central America | 92 | 4.8% |
| Eastern Asia | 42 | 2.2% |
| Eastern Europe | 48 | 2.5% |
| Europe | 48 | 2.5% |
| Honduras | 15 | 0.8% |
| Japan | 42 | 2.2% |
| Latin America | 92 | 4.8% |
| Mexico | 77 | 4.0% |
| Russia | 48 | 2.5% | View All 10 Rows |
Sex and Age in East Bronson
Sex and Age in East Bronson
The most populous age groups in East Bronson are 50 to 54 Years (115 | 12.1%) for men and 50 to 54 Years (224 | 23.0%) for women.
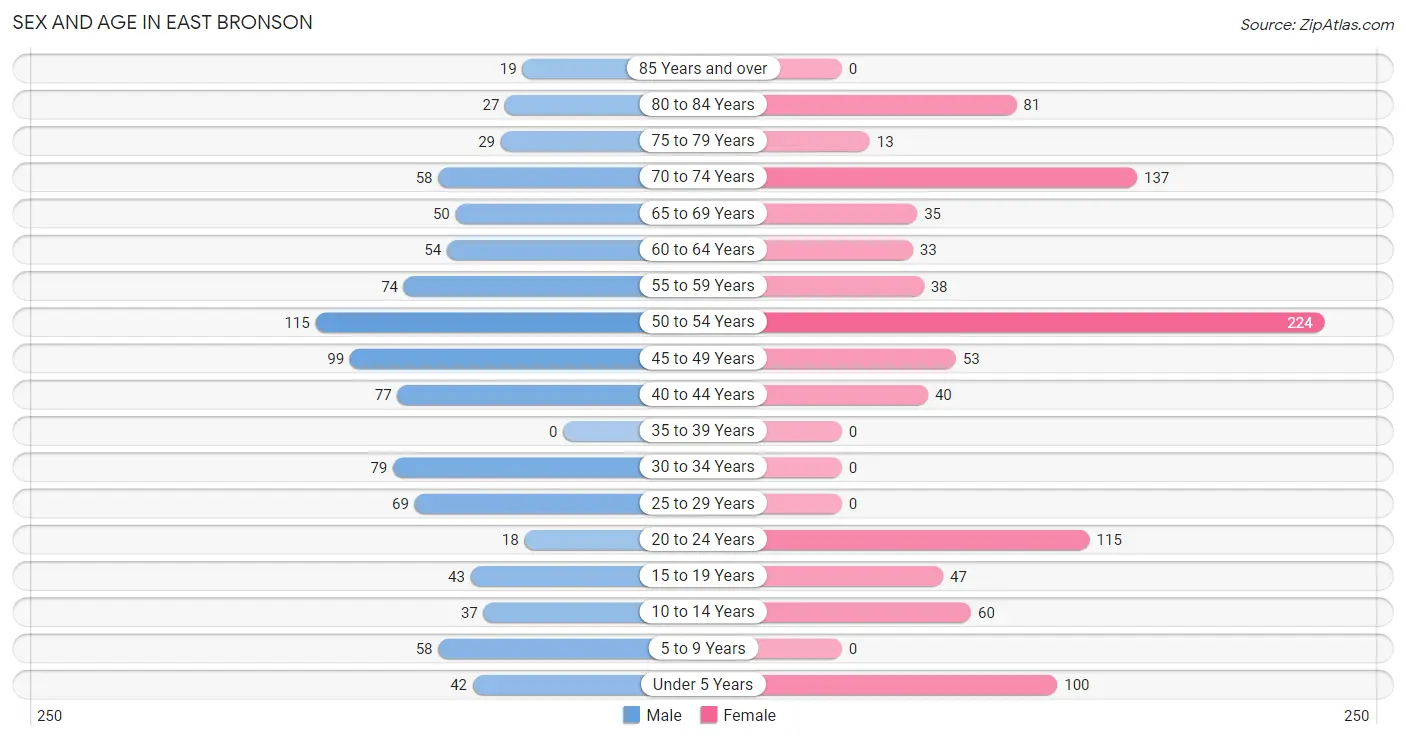
| Age Bracket | Male | Female |
| Under 5 Years | 42 (4.4%) | 100 (10.2%) |
| 5 to 9 Years | 58 (6.1%) | 0 (0.0%) |
| 10 to 14 Years | 37 (3.9%) | 60 (6.1%) |
| 15 to 19 Years | 43 (4.5%) | 47 (4.8%) |
| 20 to 24 Years | 18 (1.9%) | 115 (11.8%) |
| 25 to 29 Years | 69 (7.3%) | 0 (0.0%) |
| 30 to 34 Years | 79 (8.3%) | 0 (0.0%) |
| 35 to 39 Years | 0 (0.0%) | 0 (0.0%) |
| 40 to 44 Years | 77 (8.1%) | 40 (4.1%) |
| 45 to 49 Years | 99 (10.4%) | 53 (5.4%) |
| 50 to 54 Years | 115 (12.1%) | 224 (23.0%) |
| 55 to 59 Years | 74 (7.8%) | 38 (3.9%) |
| 60 to 64 Years | 54 (5.7%) | 33 (3.4%) |
| 65 to 69 Years | 50 (5.3%) | 35 (3.6%) |
| 70 to 74 Years | 58 (6.1%) | 137 (14.0%) |
| 75 to 79 Years | 29 (3.1%) | 13 (1.3%) |
| 80 to 84 Years | 27 (2.9%) | 81 (8.3%) |
| 85 Years and over | 19 (2.0%) | 0 (0.0%) |
| Total | 948 (100.0%) | 976 (100.0%) |
Families and Households in East Bronson
Median Family Size in East Bronson
The median family size in East Bronson is 2.59 persons per family, with single female/mother families (78 | 13.2%) accounting for the largest median family size of 3 persons per family. On the other hand, single male/father families (61 | 10.3%) represent the smallest median family size with 1.98 persons per family.
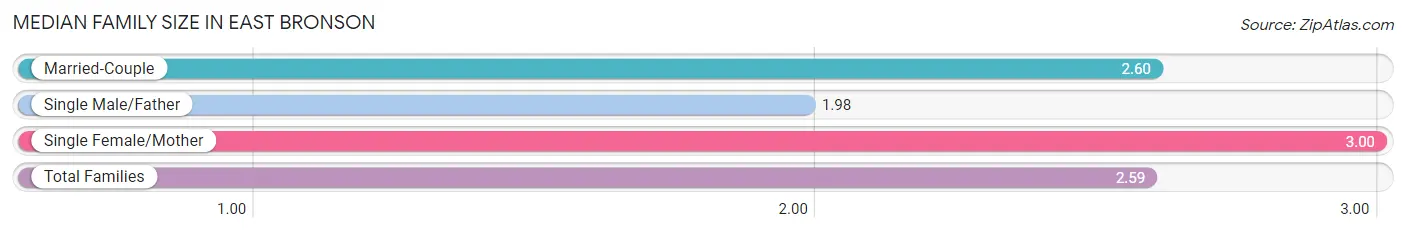
| Family Type | # Families | Family Size |
| Married-Couple | 452 (76.5%) | 2.60 |
| Single Male/Father | 61 (10.3%) | 1.98 |
| Single Female/Mother | 78 (13.2%) | 3.00 |
| Total Families | 591 (100.0%) | 2.59 |
Median Household Size in East Bronson
The median household size in East Bronson is 2.13 persons per household, with single female/mother households (78 | 8.6%) accounting for the largest median household size of 3.46 persons per household. non-family households (313 | 34.6%) represent the smallest median household size with 1.14 persons per household.
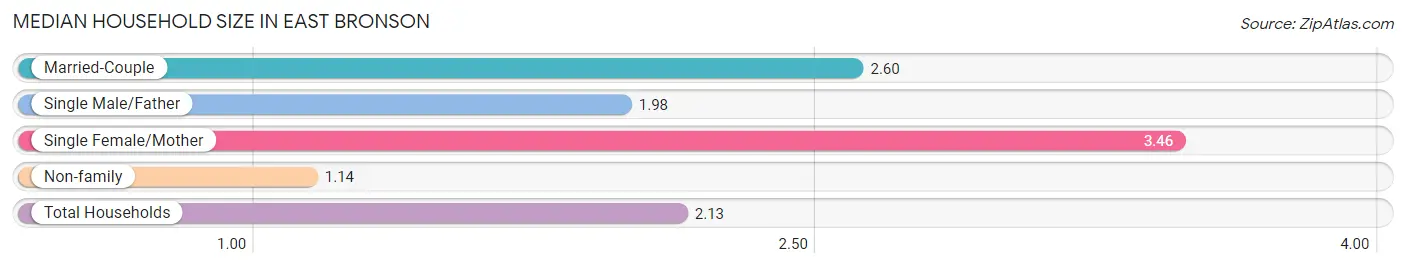
| Household Type | # Households | Household Size |
| Married-Couple | 452 (50.0%) | 2.60 |
| Single Male/Father | 61 (6.8%) | 1.98 |
| Single Female/Mother | 78 (8.6%) | 3.46 |
| Non-family | 313 (34.6%) | 1.14 |
| Total Households | 904 (100.0%) | 2.13 |
Household Size by Marriage Status in East Bronson
Out of a total of 904 households in East Bronson, 591 (65.4%) are family households, while 313 (34.6%) are nonfamily households. The most numerous type of family households are 2-person households, comprising 392, and the most common type of nonfamily households are 1-person households, comprising 251.
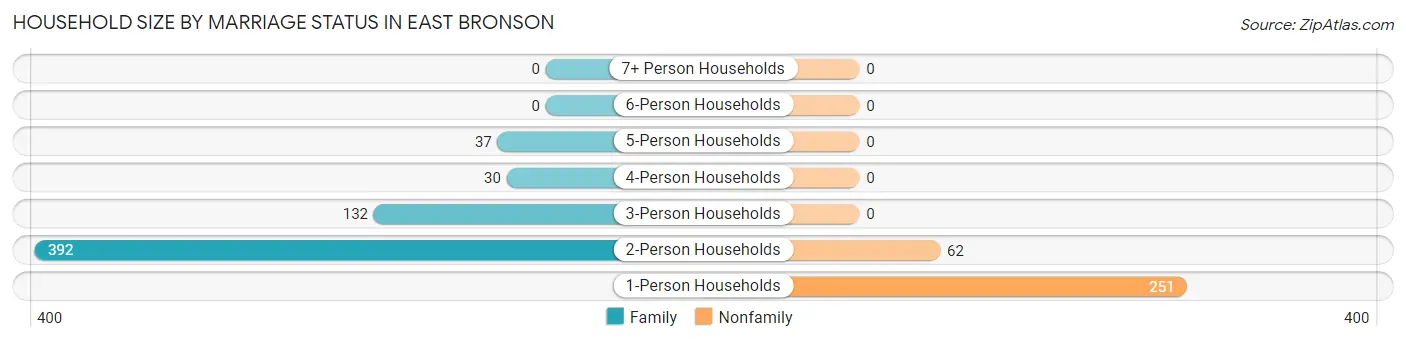
| Household Size | Family Households | Nonfamily Households |
| 1-Person Households | - | 251 (27.8%) |
| 2-Person Households | 392 (43.4%) | 62 (6.9%) |
| 3-Person Households | 132 (14.6%) | 0 (0.0%) |
| 4-Person Households | 30 (3.3%) | 0 (0.0%) |
| 5-Person Households | 37 (4.1%) | 0 (0.0%) |
| 6-Person Households | 0 (0.0%) | 0 (0.0%) |
| 7+ Person Households | 0 (0.0%) | 0 (0.0%) |
| Total | 591 (65.4%) | 313 (34.6%) |
Female Fertility in East Bronson
Fertility by Age in East Bronson
Average fertility rate in East Bronson is 207.0 births per 1,000 women. Women in the age bracket of 20 to 34 years have the highest fertility rate with 261.0 births per 1,000 women. Women in the age bracket of 35 to 50 years acount for 56.5% of all women with births.
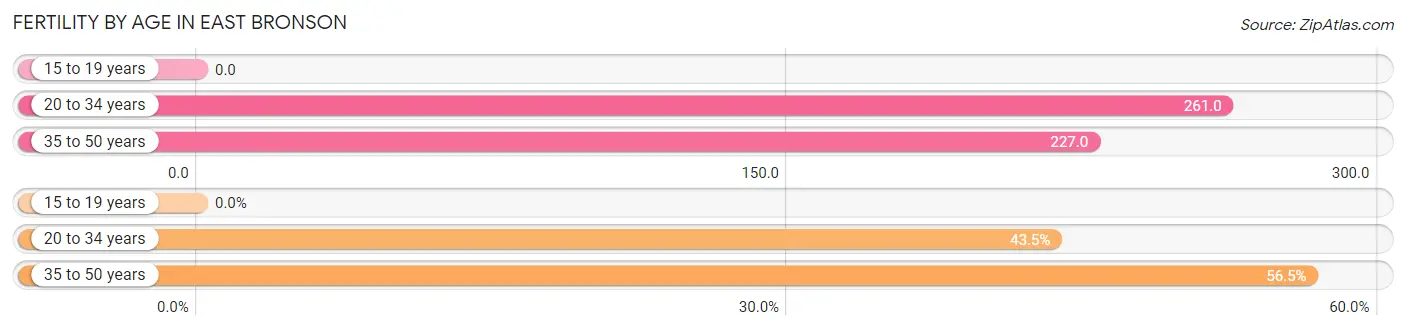
| Age Bracket | Women with Births | Births / 1,000 Women |
| 15 to 19 years | 0 (0.0%) | 0.0 |
| 20 to 34 years | 30 (43.5%) | 261.0 |
| 35 to 50 years | 39 (56.5%) | 227.0 |
| Total | 69 (100.0%) | 207.0 |
Fertility by Age by Marriage Status in East Bronson
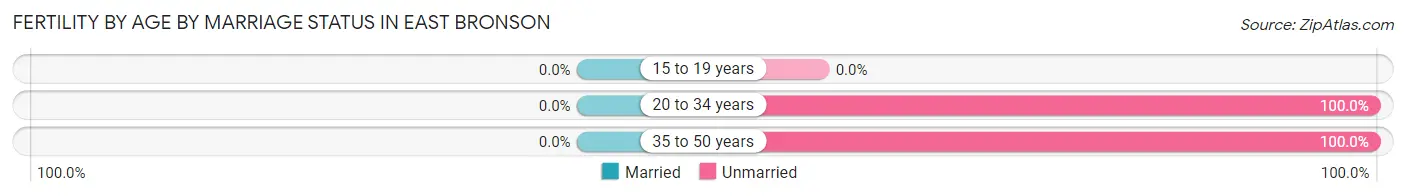
| Age Bracket | Married | Unmarried |
| 15 to 19 years | 0 (0.0%) | 0 (0.0%) |
| 20 to 34 years | 0 (0.0%) | 30 (100.0%) |
| 35 to 50 years | 0 (0.0%) | 39 (100.0%) |
| Total | 0 (0.0%) | 69 (100.0%) |
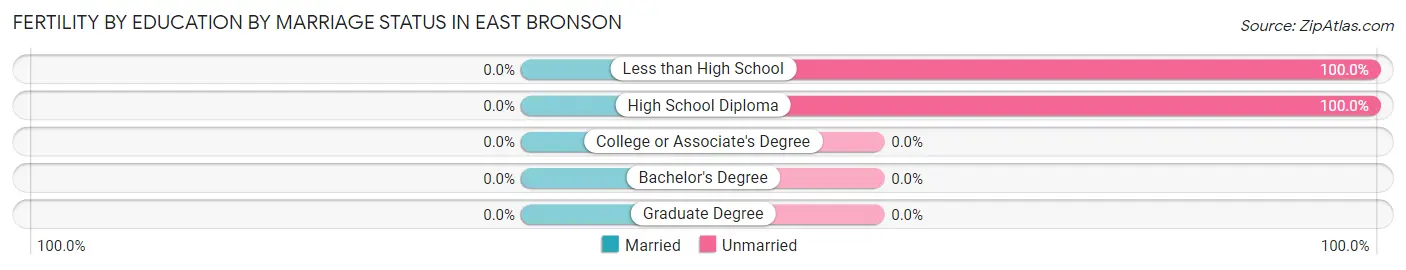
Fertility by Education in East Bronson
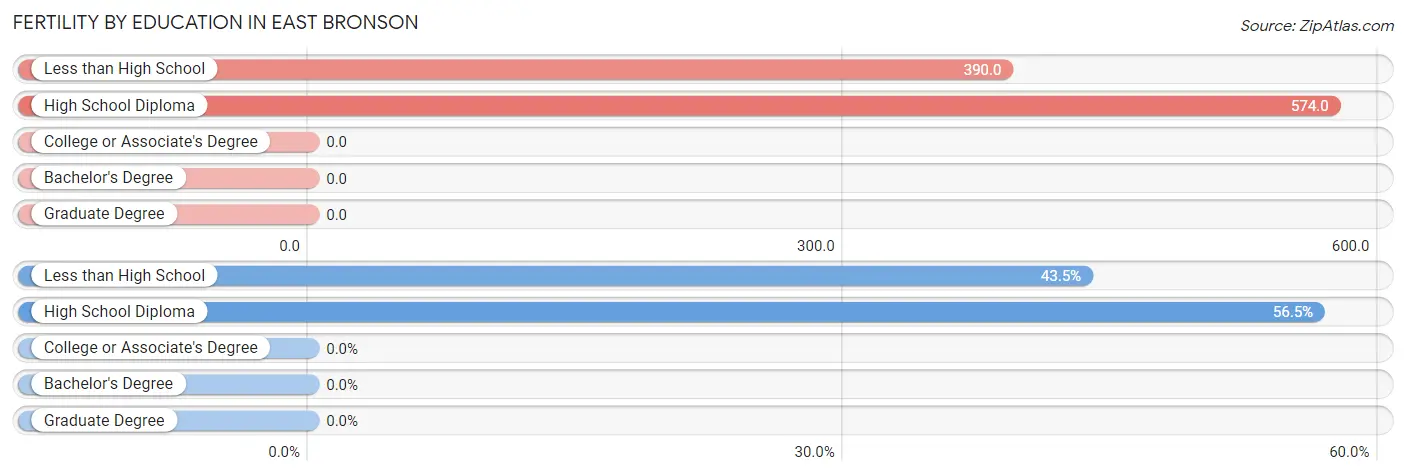
| Educational Attainment | Women with Births | Births / 1,000 Women |
| Less than High School | 30 (43.5%) | 390.0 |
| High School Diploma | 39 (56.5%) | 574.0 |
| College or Associate's Degree | 0 (0.0%) | 0.0 |
| Bachelor's Degree | 0 (0.0%) | 0.0 |
| Graduate Degree | 0 (0.0%) | 0.0 |
| Total | 69 (100.0%) | 207.0 |
Fertility by Education by Marriage Status in East Bronson
| Educational Attainment | Married | Unmarried |
| Less than High School | 0 (0.0%) | 30 (100.0%) |
| High School Diploma | 0 (0.0%) | 39 (100.0%) |
| College or Associate's Degree | 0 (0.0%) | 0 (0.0%) |
| Bachelor's Degree | 0 (0.0%) | 0 (0.0%) |
| Graduate Degree | 0 (0.0%) | 0 (0.0%) |
| Total | 0 (0.0%) | 69 (100.0%) |
Employment Characteristics in East Bronson
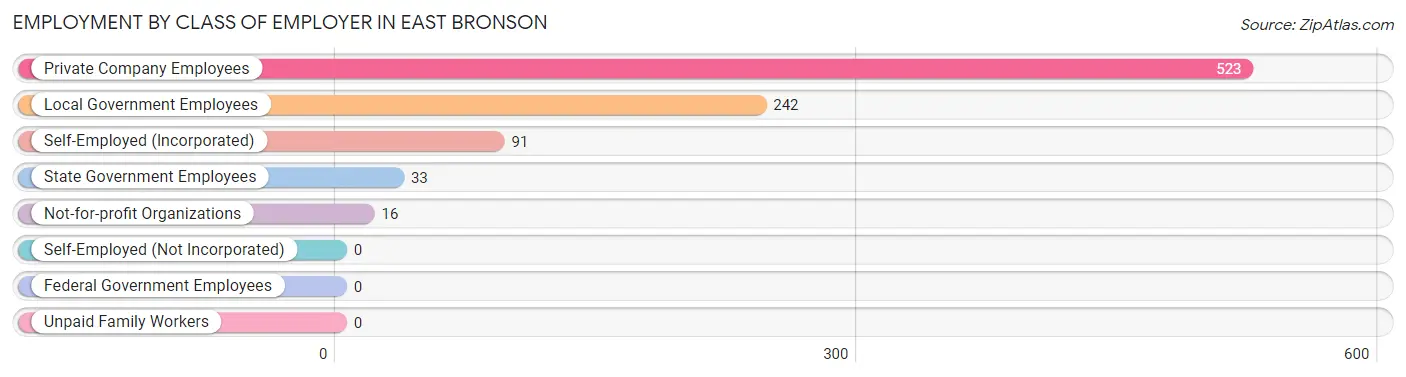
Employment by Class of Employer in East Bronson
Among the 905 employed individuals in East Bronson, private company employees (523 | 57.8%), local government employees (242 | 26.7%), and self-employed (incorporated) (91 | 10.1%) make up the most common classes of employment.
| Employer Class | # Employees | % Employees |
| Private Company Employees | 523 | 57.8% |
| Self-Employed (Incorporated) | 91 | 10.1% |
| Self-Employed (Not Incorporated) | 0 | 0.0% |
| Not-for-profit Organizations | 16 | 1.8% |
| Local Government Employees | 242 | 26.7% |
| State Government Employees | 33 | 3.6% |
| Federal Government Employees | 0 | 0.0% |
| Unpaid Family Workers | 0 | 0.0% |
| Total | 905 | 100.0% |
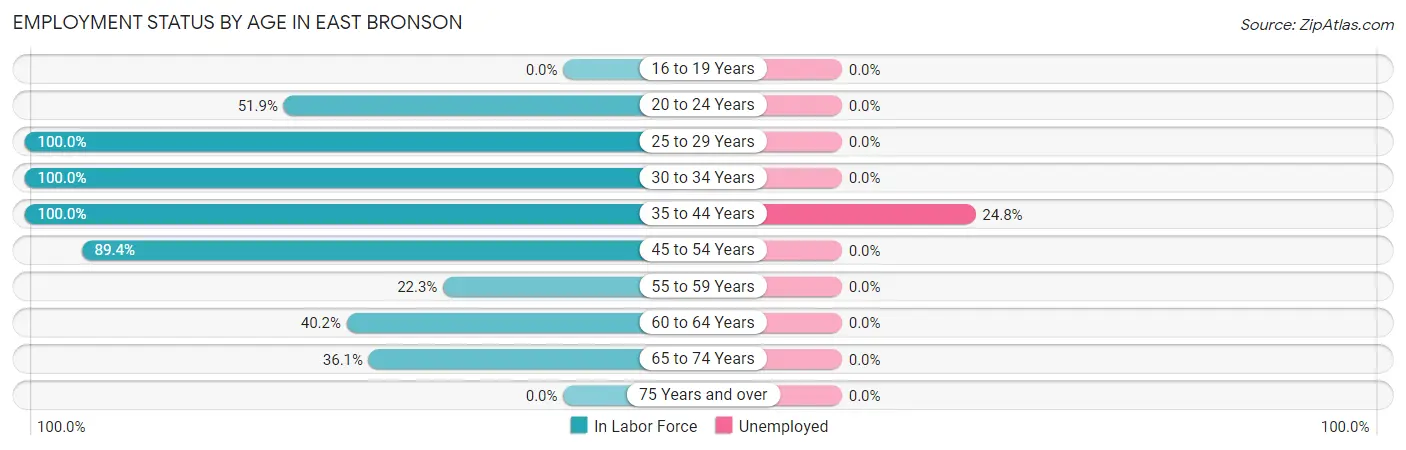
Employment Status by Age in East Bronson
According to the labor force statistics for East Bronson, out of the total population over 16 years of age (1,584), 59.0% or 935 individuals are in the labor force, with 3.1% or 29 of them unemployed. The age group with the highest labor force participation rate is 25 to 29 years, with 100.0% or 69 individuals in the labor force. Within the labor force, the 35 to 44 years age range has the highest percentage of unemployed individuals, with 24.8% or 29 of them being unemployed.
| Age Bracket | In Labor Force | Unemployed |
| 16 to 19 Years | 0 (0.0%) | 0 (0.0%) |
| 20 to 24 Years | 69 (51.9%) | 0 (0.0%) |
| 25 to 29 Years | 69 (100.0%) | 0 (0.0%) |
| 30 to 34 Years | 79 (100.0%) | 0 (0.0%) |
| 35 to 44 Years | 117 (100.0%) | 29 (24.8%) |
| 45 to 54 Years | 439 (89.4%) | 0 (0.0%) |
| 55 to 59 Years | 25 (22.3%) | 0 (0.0%) |
| 60 to 64 Years | 35 (40.2%) | 0 (0.0%) |
| 65 to 74 Years | 101 (36.1%) | 0 (0.0%) |
| 75 Years and over | 0 (0.0%) | 0 (0.0%) |
| Total | 935 (59.0%) | 29 (3.1%) |
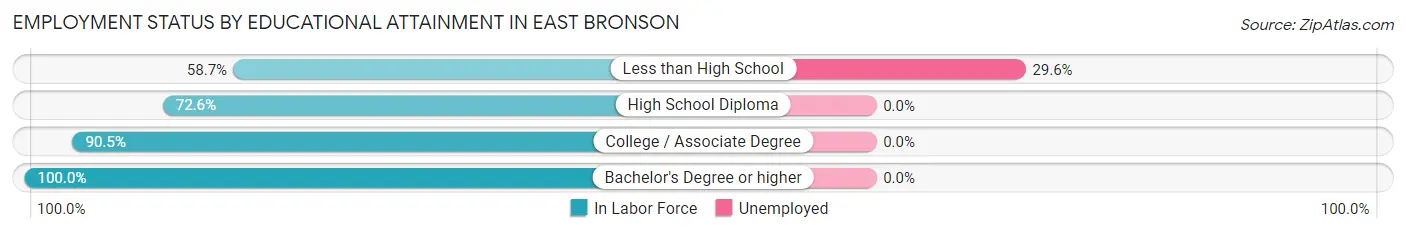
Employment Status by Educational Attainment in East Bronson
According to labor force statistics for East Bronson, 80.0% of individuals (764) out of the total population between 25 and 64 years of age (955) are in the labor force, with 3.8% or 29 of them being unemployed. The group with the highest labor force participation rate are those with the educational attainment of bachelor's degree or higher, with 100.0% or 191 individuals in the labor force. Within the labor force, individuals with less than high school education have the highest percentage of unemployment, with 29.6% or 29 of them being unemployed.
| Educational Attainment | In Labor Force | Unemployed |
| Less than High School | 98 (58.7%) | 49 (29.6%) |
| High School Diploma | 265 (72.6%) | 0 (0.0%) |
| College / Associate Degree | 210 (90.5%) | 0 (0.0%) |
| Bachelor's Degree or higher | 191 (100.0%) | 0 (0.0%) |
| Total | 764 (80.0%) | 36 (3.8%) |
Employment Occupations by Sex in East Bronson
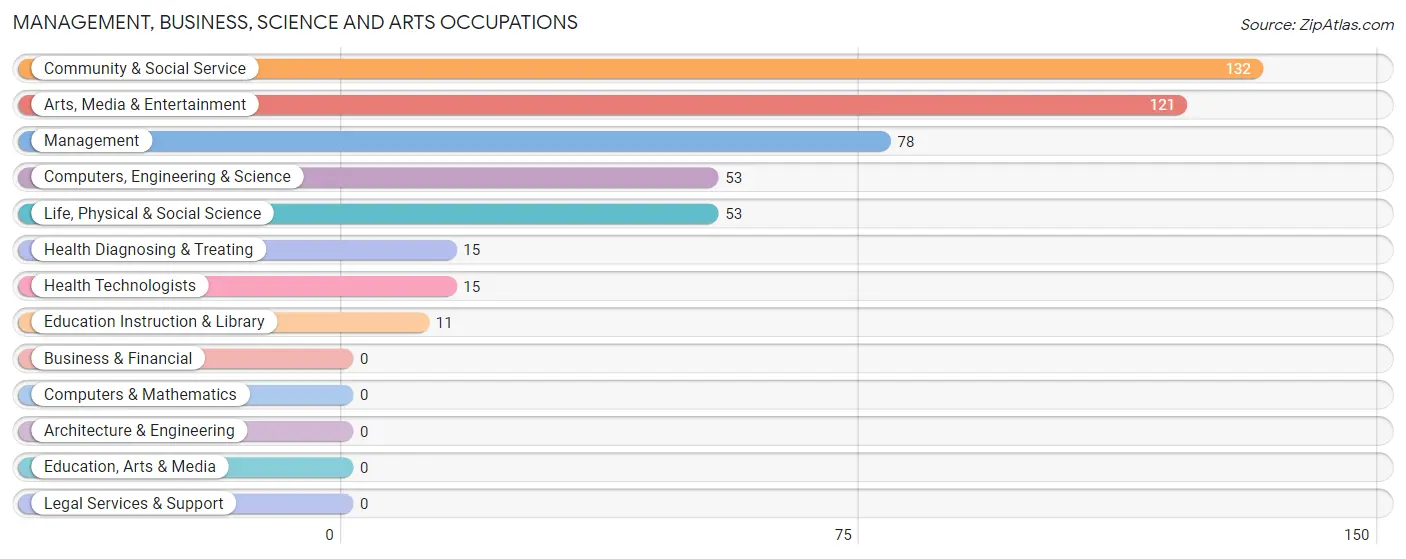
Management, Business, Science and Arts Occupations
The most common Management, Business, Science and Arts occupations in East Bronson are Community & Social Service (132 | 14.6%), Arts, Media & Entertainment (121 | 13.4%), Management (78 | 8.6%), Computers, Engineering & Science (53 | 5.9%), and Life, Physical & Social Science (53 | 5.9%).
Management, Business, Science and Arts Occupations by Sex
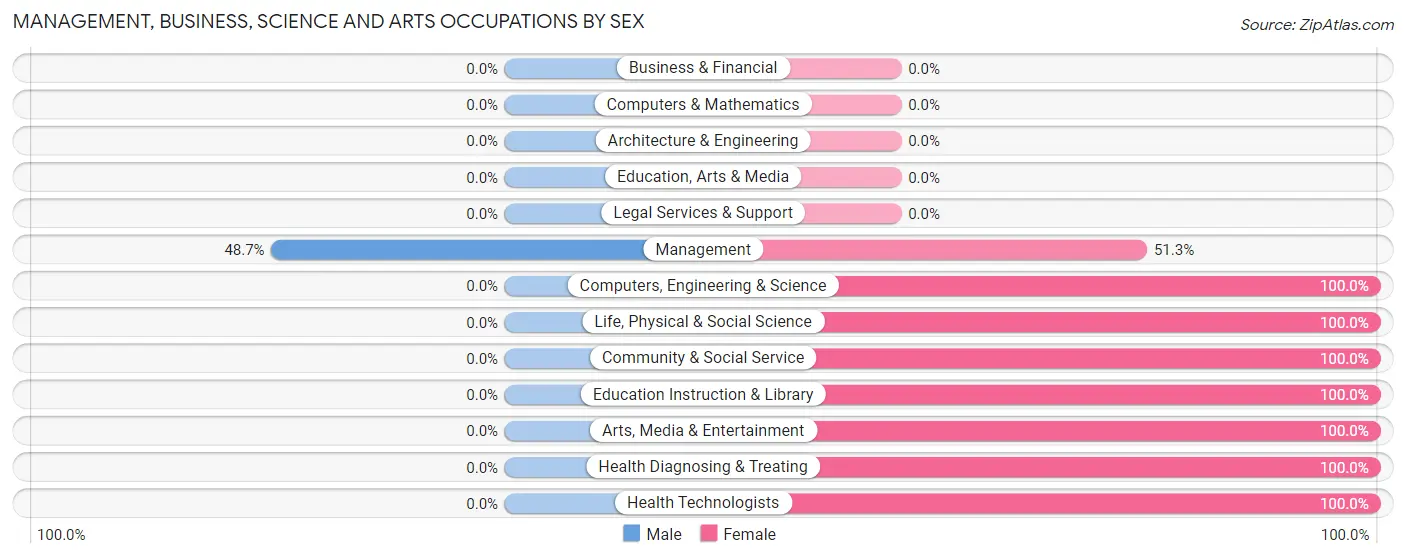
| Occupation | Male | Female |
| Management | 38 (48.7%) | 40 (51.3%) |
| Business & Financial | 0 (0.0%) | 0 (0.0%) |
| Computers, Engineering & Science | 0 (0.0%) | 53 (100.0%) |
| Computers & Mathematics | 0 (0.0%) | 0 (0.0%) |
| Architecture & Engineering | 0 (0.0%) | 0 (0.0%) |
| Life, Physical & Social Science | 0 (0.0%) | 53 (100.0%) |
| Community & Social Service | 0 (0.0%) | 132 (100.0%) |
| Education, Arts & Media | 0 (0.0%) | 0 (0.0%) |
| Legal Services & Support | 0 (0.0%) | 0 (0.0%) |
| Education Instruction & Library | 0 (0.0%) | 11 (100.0%) |
| Arts, Media & Entertainment | 0 (0.0%) | 121 (100.0%) |
| Health Diagnosing & Treating | 0 (0.0%) | 15 (100.0%) |
| Health Technologists | 0 (0.0%) | 15 (100.0%) |
| Total (Category) | 38 (13.7%) | 240 (86.3%) |
| Total (Overall) | 513 (56.7%) | 392 (43.3%) |
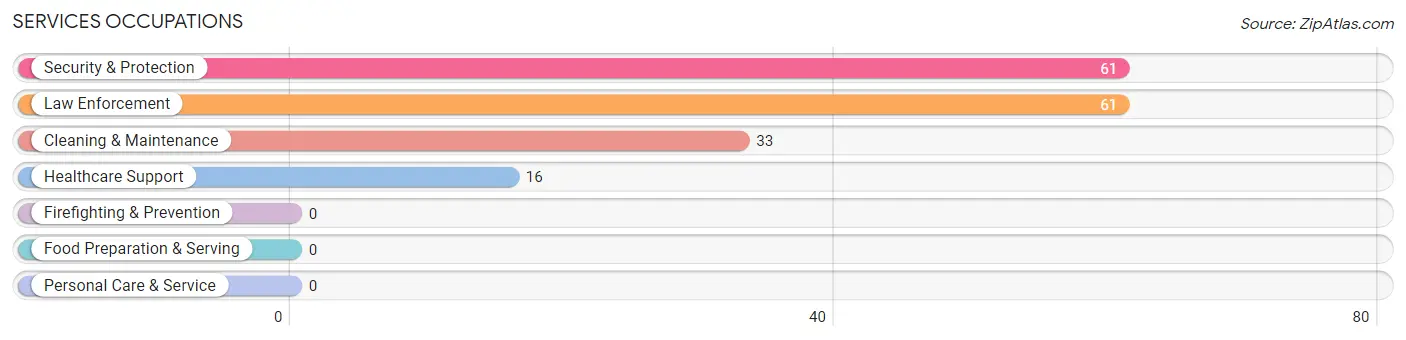
Services Occupations
The most common Services occupations in East Bronson are Security & Protection (61 | 6.7%), Law Enforcement (61 | 6.7%), Cleaning & Maintenance (33 | 3.6%), and Healthcare Support (16 | 1.8%).
Services Occupations by Sex
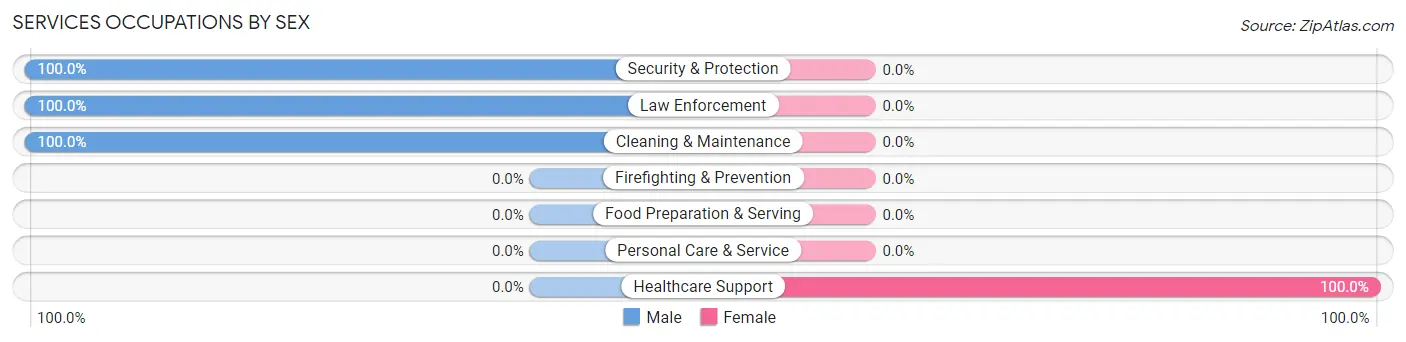
| Occupation | Male | Female |
| Healthcare Support | 0 (0.0%) | 16 (100.0%) |
| Security & Protection | 61 (100.0%) | 0 (0.0%) |
| Firefighting & Prevention | 0 (0.0%) | 0 (0.0%) |
| Law Enforcement | 61 (100.0%) | 0 (0.0%) |
| Food Preparation & Serving | 0 (0.0%) | 0 (0.0%) |
| Cleaning & Maintenance | 33 (100.0%) | 0 (0.0%) |
| Personal Care & Service | 0 (0.0%) | 0 (0.0%) |
| Total (Category) | 94 (85.5%) | 16 (14.5%) |
| Total (Overall) | 513 (56.7%) | 392 (43.3%) |
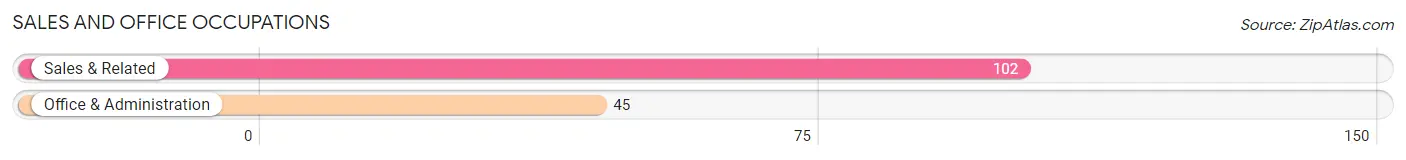
Sales and Office Occupations
The most common Sales and Office occupations in East Bronson are Sales & Related (102 | 11.3%), and Office & Administration (45 | 5.0%).
Sales and Office Occupations by Sex
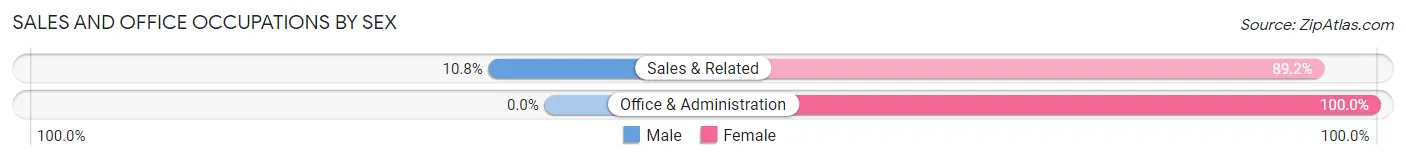
| Occupation | Male | Female |
| Sales & Related | 11 (10.8%) | 91 (89.2%) |
| Office & Administration | 0 (0.0%) | 45 (100.0%) |
| Total (Category) | 11 (7.5%) | 136 (92.5%) |
| Total (Overall) | 513 (56.7%) | 392 (43.3%) |
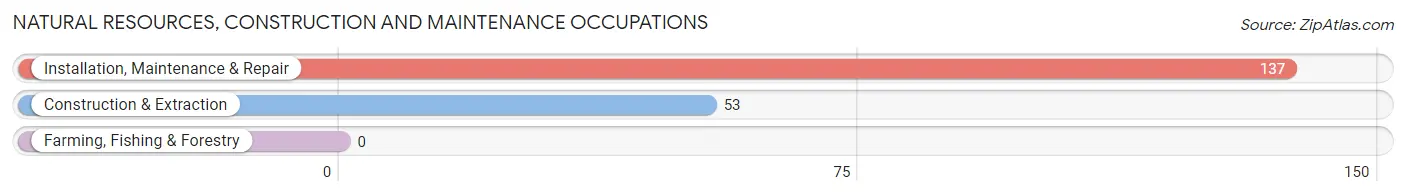
Natural Resources, Construction and Maintenance Occupations
The most common Natural Resources, Construction and Maintenance occupations in East Bronson are Installation, Maintenance & Repair (137 | 15.1%), and Construction & Extraction (53 | 5.9%).
Natural Resources, Construction and Maintenance Occupations by Sex
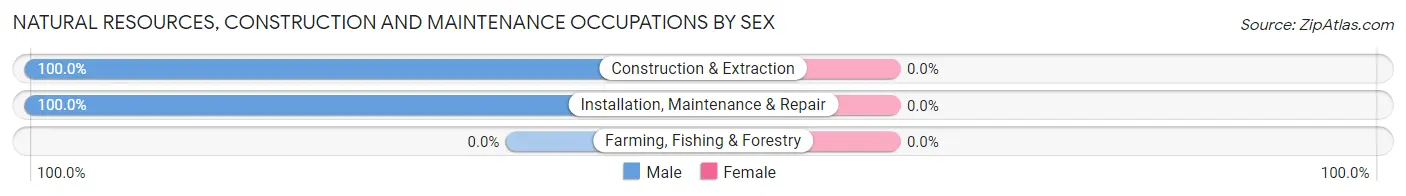
| Occupation | Male | Female |
| Farming, Fishing & Forestry | 0 (0.0%) | 0 (0.0%) |
| Construction & Extraction | 53 (100.0%) | 0 (0.0%) |
| Installation, Maintenance & Repair | 137 (100.0%) | 0 (0.0%) |
| Total (Category) | 190 (100.0%) | 0 (0.0%) |
| Total (Overall) | 513 (56.7%) | 392 (43.3%) |
Production, Transportation and Moving Occupations
The most common Production, Transportation and Moving occupations in East Bronson are Production (96 | 10.6%), Transportation (48 | 5.3%), and Material Moving (36 | 4.0%).
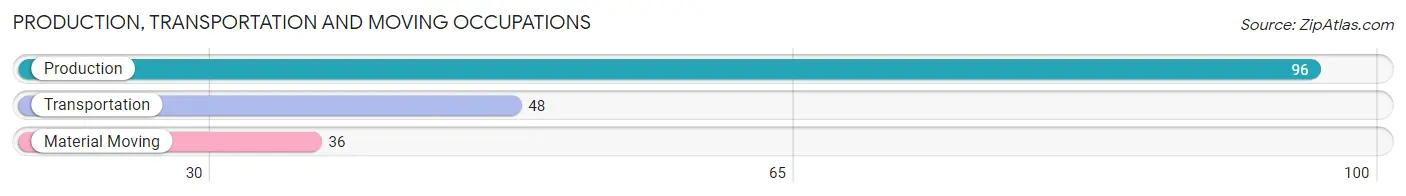
Production, Transportation and Moving Occupations by Sex
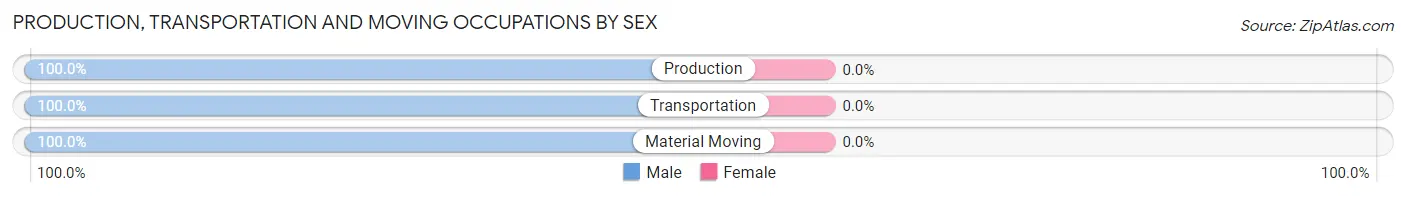
| Occupation | Male | Female |
| Production | 96 (100.0%) | 0 (0.0%) |
| Transportation | 48 (100.0%) | 0 (0.0%) |
| Material Moving | 36 (100.0%) | 0 (0.0%) |
| Total (Category) | 180 (100.0%) | 0 (0.0%) |
| Total (Overall) | 513 (56.7%) | 392 (43.3%) |
Employment Industries by Sex in East Bronson
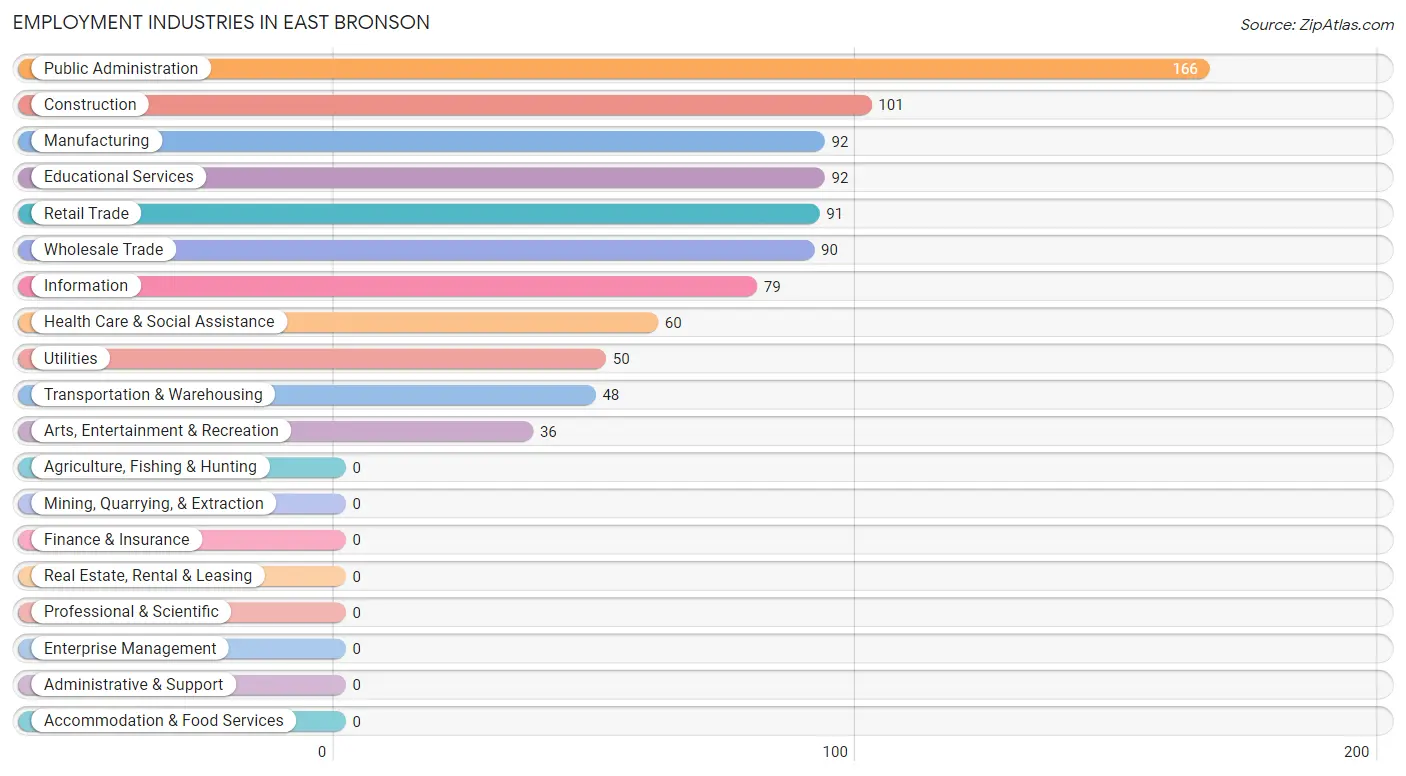
Employment Industries in East Bronson
The major employment industries in East Bronson include Public Administration (166 | 18.3%), Construction (101 | 11.2%), Manufacturing (92 | 10.2%), Educational Services (92 | 10.2%), and Retail Trade (91 | 10.1%).
Employment Industries by Sex in East Bronson
The East Bronson industries that see more men than women are Wholesale Trade (100.0%), Transportation & Warehousing (100.0%), and Utilities (100.0%), whereas the industries that tend to have a higher number of women are Manufacturing (100.0%), Retail Trade (100.0%), and Information (100.0%).
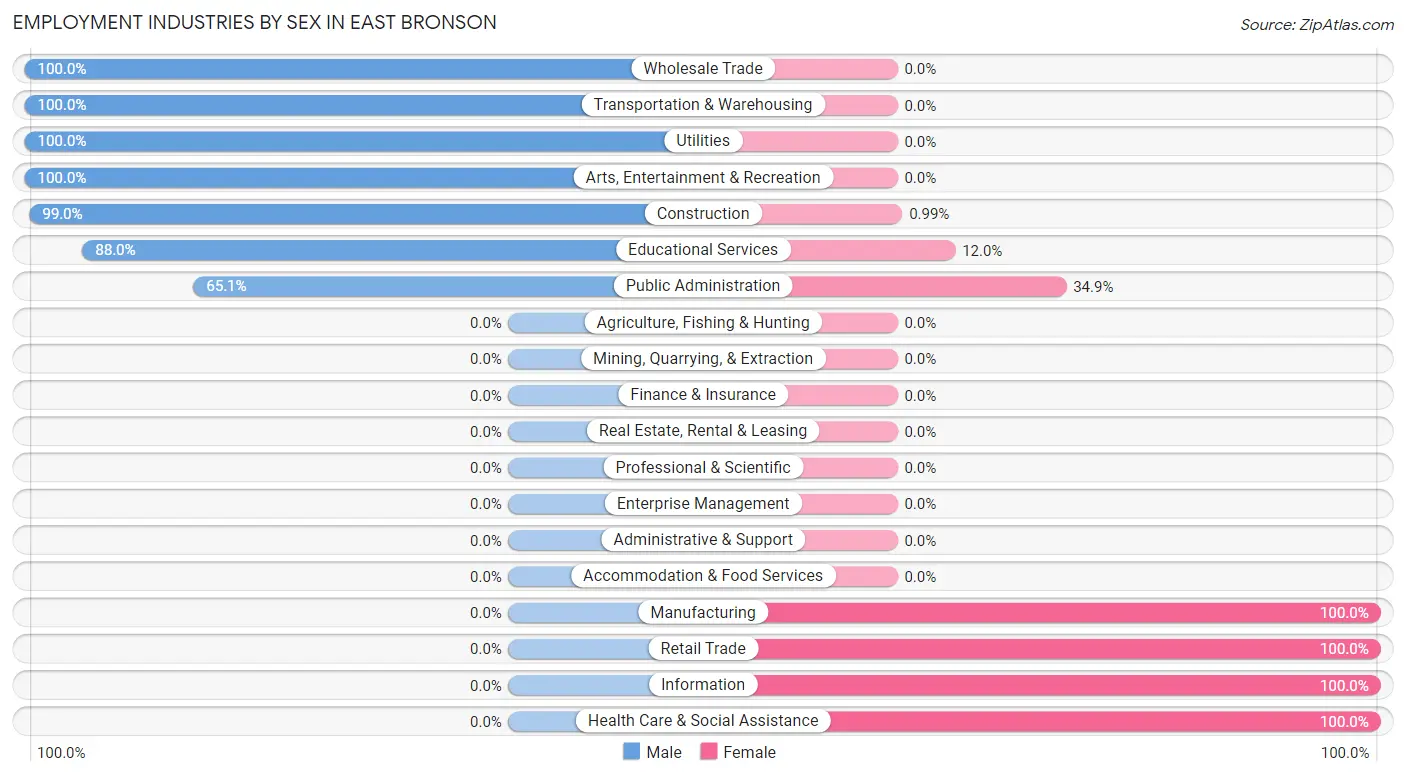
| Industry | Male | Female |
| Agriculture, Fishing & Hunting | 0 (0.0%) | 0 (0.0%) |
| Mining, Quarrying, & Extraction | 0 (0.0%) | 0 (0.0%) |
| Construction | 100 (99.0%) | 1 (1.0%) |
| Manufacturing | 0 (0.0%) | 92 (100.0%) |
| Wholesale Trade | 90 (100.0%) | 0 (0.0%) |
| Retail Trade | 0 (0.0%) | 91 (100.0%) |
| Transportation & Warehousing | 48 (100.0%) | 0 (0.0%) |
| Utilities | 50 (100.0%) | 0 (0.0%) |
| Information | 0 (0.0%) | 79 (100.0%) |
| Finance & Insurance | 0 (0.0%) | 0 (0.0%) |
| Real Estate, Rental & Leasing | 0 (0.0%) | 0 (0.0%) |
| Professional & Scientific | 0 (0.0%) | 0 (0.0%) |
| Enterprise Management | 0 (0.0%) | 0 (0.0%) |
| Administrative & Support | 0 (0.0%) | 0 (0.0%) |
| Educational Services | 81 (88.0%) | 11 (12.0%) |
| Health Care & Social Assistance | 0 (0.0%) | 60 (100.0%) |
| Arts, Entertainment & Recreation | 36 (100.0%) | 0 (0.0%) |
| Accommodation & Food Services | 0 (0.0%) | 0 (0.0%) |
| Public Administration | 108 (65.1%) | 58 (34.9%) |
| Total | 513 (56.7%) | 392 (43.3%) |
Education in East Bronson
School Enrollment in East Bronson
The most common levels of schooling among the 427 students in East Bronson are college / undergraduate (140 | 32.8%), elementary school (118 | 27.6%), and middle school (80 | 18.7%).
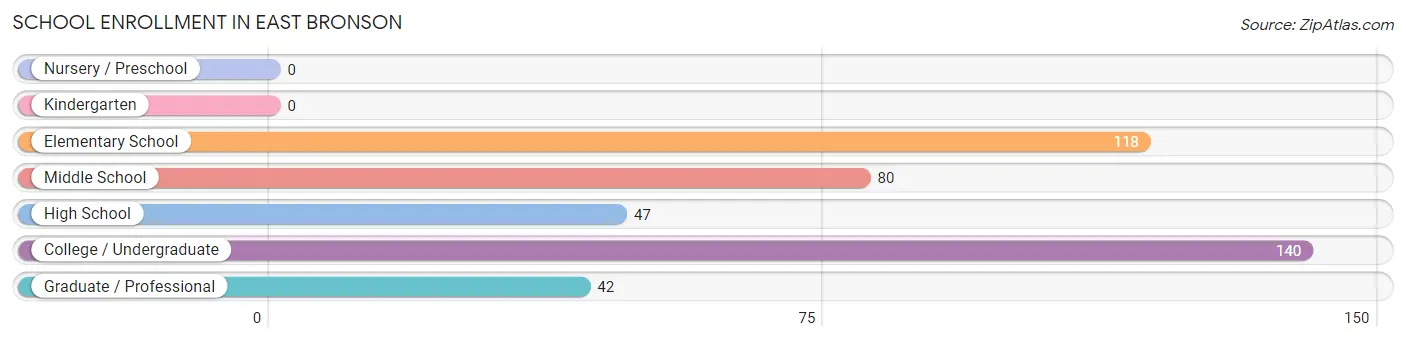
| School Level | # Students | % Students |
| Nursery / Preschool | 0 | 0.0% |
| Kindergarten | 0 | 0.0% |
| Elementary School | 118 | 27.6% |
| Middle School | 80 | 18.7% |
| High School | 47 | 11.0% |
| College / Undergraduate | 140 | 32.8% |
| Graduate / Professional | 42 | 9.8% |
| Total | 427 | 100.0% |
School Enrollment by Age by Funding Source in East Bronson
Out of a total of 427 students who are enrolled in schools in East Bronson, 58 (13.6%) attend a private institution, while the remaining 369 (86.4%) are enrolled in public schools. The age group of 5 to 9 year old has the highest likelihood of being enrolled in private schools, with 58 (100.0% in the age bracket) enrolled. Conversely, the age group of 10 to 14 year olds has the lowest likelihood of being enrolled in a private school, with 97 (100.0% in the age bracket) attending a public institution.
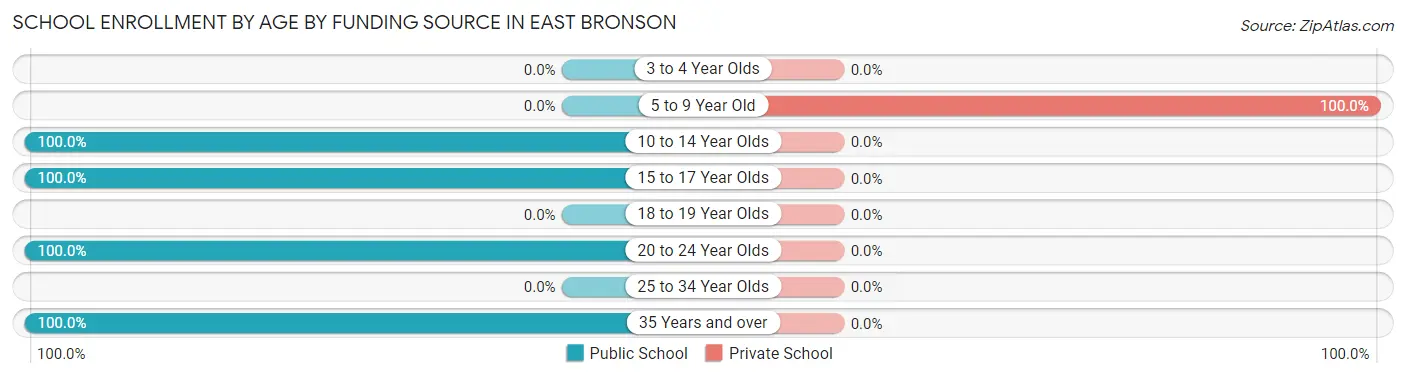
| Age Bracket | Public School | Private School |
| 3 to 4 Year Olds | 0 (0.0%) | 0 (0.0%) |
| 5 to 9 Year Old | 0 (0.0%) | 58 (100.0%) |
| 10 to 14 Year Olds | 97 (100.0%) | 0 (0.0%) |
| 15 to 17 Year Olds | 90 (100.0%) | 0 (0.0%) |
| 18 to 19 Year Olds | 0 (0.0%) | 0 (0.0%) |
| 20 to 24 Year Olds | 74 (100.0%) | 0 (0.0%) |
| 25 to 34 Year Olds | 0 (0.0%) | 0 (0.0%) |
| 35 Years and over | 108 (100.0%) | 0 (0.0%) |
| Total | 369 (86.4%) | 58 (13.6%) |
Educational Attainment by Field of Study in East Bronson
Bio, nature & agricultural (191 | 82.3%), social sciences (19 | 8.2%), education (16 | 6.9%), and business (6 | 2.6%) are the most common fields of study among 232 individuals in East Bronson who have obtained a bachelor's degree or higher.
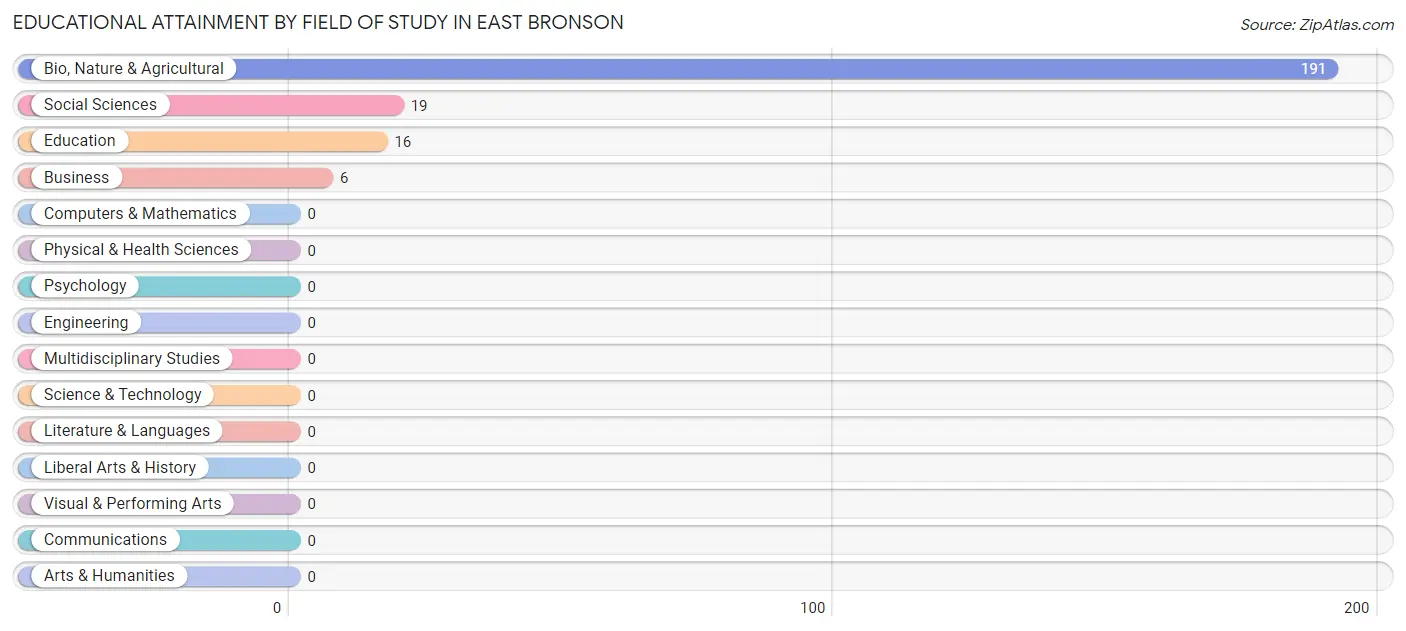
| Field of Study | # Graduates | % Graduates |
| Computers & Mathematics | 0 | 0.0% |
| Bio, Nature & Agricultural | 191 | 82.3% |
| Physical & Health Sciences | 0 | 0.0% |
| Psychology | 0 | 0.0% |
| Social Sciences | 19 | 8.2% |
| Engineering | 0 | 0.0% |
| Multidisciplinary Studies | 0 | 0.0% |
| Science & Technology | 0 | 0.0% |
| Business | 6 | 2.6% |
| Education | 16 | 6.9% |
| Literature & Languages | 0 | 0.0% |
| Liberal Arts & History | 0 | 0.0% |
| Visual & Performing Arts | 0 | 0.0% |
| Communications | 0 | 0.0% |
| Arts & Humanities | 0 | 0.0% |
| Total | 232 | 100.0% |
Transportation & Commute in East Bronson
Vehicle Availability by Sex in East Bronson
The most prevalent vehicle ownership categories in East Bronson are males with 1 vehicle (192, accounting for 37.4%) and females with 1 vehicle (106, making up 49.0%).
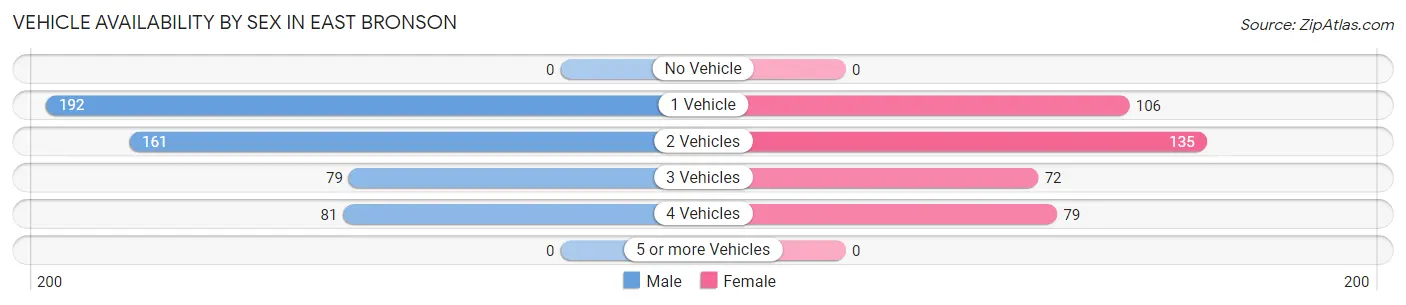
| Vehicles Available | Male | Female |
| No Vehicle | 0 (0.0%) | 0 (0.0%) |
| 1 Vehicle | 192 (37.4%) | 106 (27.0%) |
| 2 Vehicles | 161 (31.4%) | 135 (34.4%) |
| 3 Vehicles | 79 (15.4%) | 72 (18.4%) |
| 4 Vehicles | 81 (15.8%) | 79 (20.2%) |
| 5 or more Vehicles | 0 (0.0%) | 0 (0.0%) |
| Total | 513 (100.0%) | 392 (100.0%) |
Commute Time in East Bronson
The most frequently occuring commute durations in East Bronson are 40 to 44 minutes (235 commuters, 28.4%), 60 to 89 minutes (170 commuters, 20.6%), and 45 to 59 minutes (109 commuters, 13.2%).
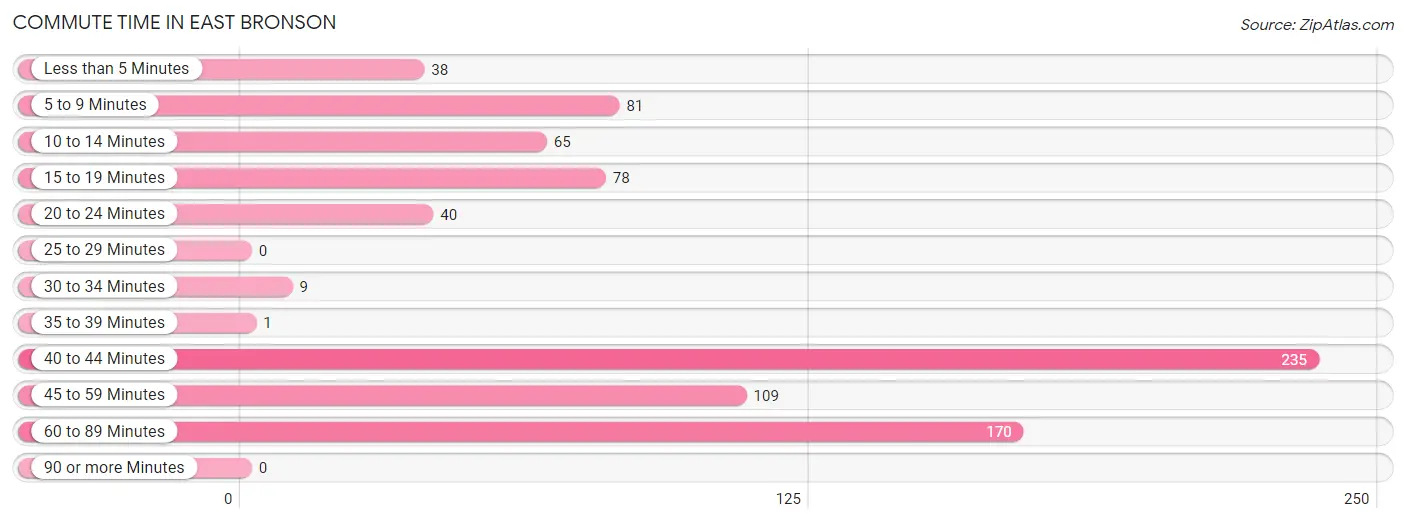
| Commute Time | # Commuters | % Commuters |
| Less than 5 Minutes | 38 | 4.6% |
| 5 to 9 Minutes | 81 | 9.8% |
| 10 to 14 Minutes | 65 | 7.9% |
| 15 to 19 Minutes | 78 | 9.4% |
| 20 to 24 Minutes | 40 | 4.8% |
| 25 to 29 Minutes | 0 | 0.0% |
| 30 to 34 Minutes | 9 | 1.1% |
| 35 to 39 Minutes | 1 | 0.1% |
| 40 to 44 Minutes | 235 | 28.4% |
| 45 to 59 Minutes | 109 | 13.2% |
| 60 to 89 Minutes | 170 | 20.6% |
| 90 or more Minutes | 0 | 0.0% |
Commute Time by Sex in East Bronson
The most common commute times in East Bronson are 60 to 89 minutes (113 commuters, 22.0%) for males and 40 to 44 minutes (124 commuters, 39.6%) for females.
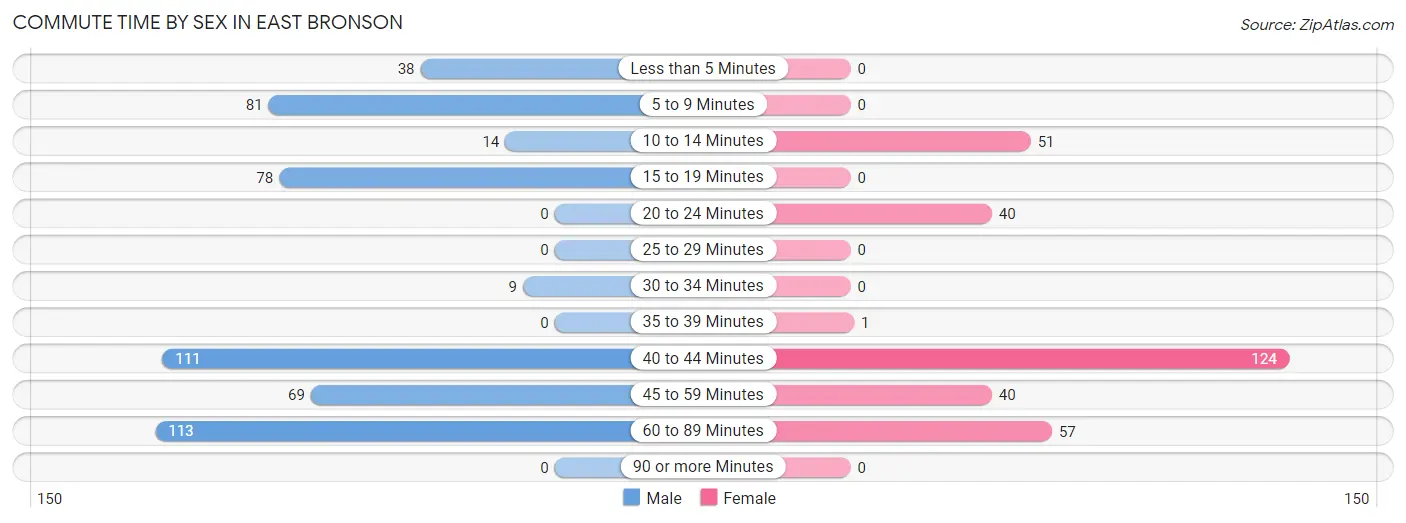
| Commute Time | Male | Female |
| Less than 5 Minutes | 38 (7.4%) | 0 (0.0%) |
| 5 to 9 Minutes | 81 (15.8%) | 0 (0.0%) |
| 10 to 14 Minutes | 14 (2.7%) | 51 (16.3%) |
| 15 to 19 Minutes | 78 (15.2%) | 0 (0.0%) |
| 20 to 24 Minutes | 0 (0.0%) | 40 (12.8%) |
| 25 to 29 Minutes | 0 (0.0%) | 0 (0.0%) |
| 30 to 34 Minutes | 9 (1.8%) | 0 (0.0%) |
| 35 to 39 Minutes | 0 (0.0%) | 1 (0.3%) |
| 40 to 44 Minutes | 111 (21.6%) | 124 (39.6%) |
| 45 to 59 Minutes | 69 (13.5%) | 40 (12.8%) |
| 60 to 89 Minutes | 113 (22.0%) | 57 (18.2%) |
| 90 or more Minutes | 0 (0.0%) | 0 (0.0%) |
Time of Departure to Work by Sex in East Bronson
The most frequent times of departure to work in East Bronson are 6:30 AM to 6:59 AM (174, 33.9%) for males and 12:00 PM to 3:59 PM (90, 28.7%) for females.
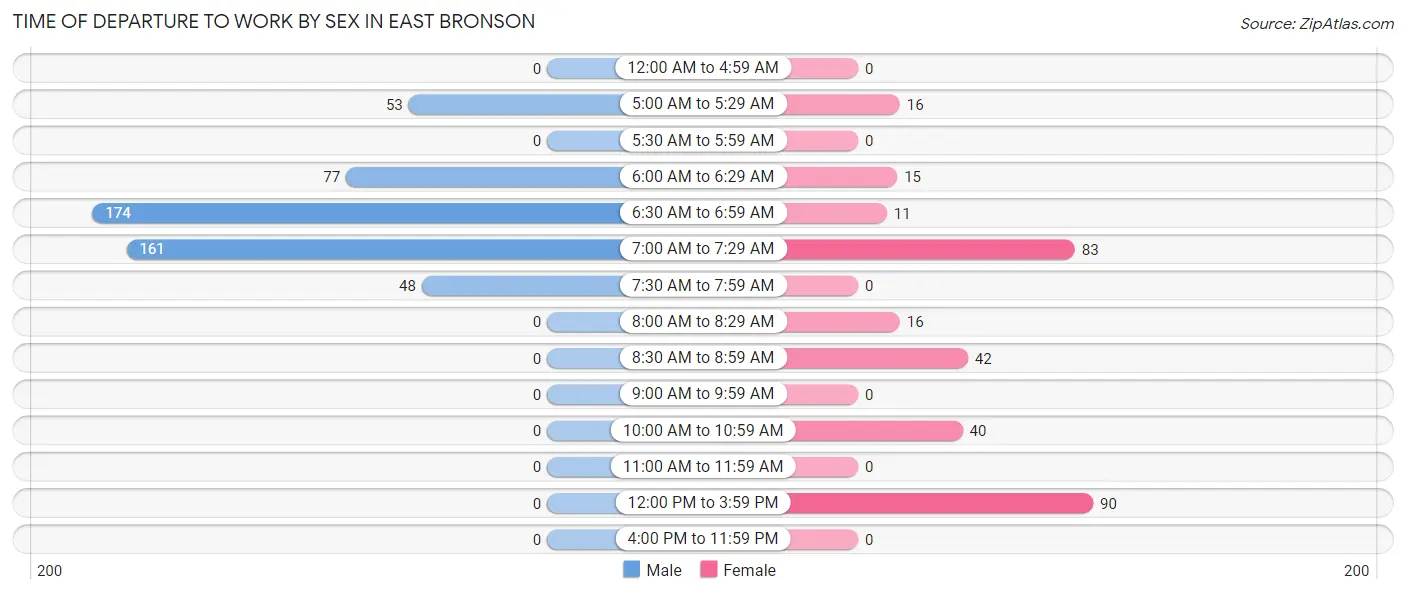
| Time of Departure | Male | Female |
| 12:00 AM to 4:59 AM | 0 (0.0%) | 0 (0.0%) |
| 5:00 AM to 5:29 AM | 53 (10.3%) | 16 (5.1%) |
| 5:30 AM to 5:59 AM | 0 (0.0%) | 0 (0.0%) |
| 6:00 AM to 6:29 AM | 77 (15.0%) | 15 (4.8%) |
| 6:30 AM to 6:59 AM | 174 (33.9%) | 11 (3.5%) |
| 7:00 AM to 7:29 AM | 161 (31.4%) | 83 (26.5%) |
| 7:30 AM to 7:59 AM | 48 (9.4%) | 0 (0.0%) |
| 8:00 AM to 8:29 AM | 0 (0.0%) | 16 (5.1%) |
| 8:30 AM to 8:59 AM | 0 (0.0%) | 42 (13.4%) |
| 9:00 AM to 9:59 AM | 0 (0.0%) | 0 (0.0%) |
| 10:00 AM to 10:59 AM | 0 (0.0%) | 40 (12.8%) |
| 11:00 AM to 11:59 AM | 0 (0.0%) | 0 (0.0%) |
| 12:00 PM to 3:59 PM | 0 (0.0%) | 90 (28.7%) |
| 4:00 PM to 11:59 PM | 0 (0.0%) | 0 (0.0%) |
| Total | 513 (100.0%) | 313 (100.0%) |
Housing Occupancy in East Bronson
Occupancy by Ownership in East Bronson
Of the total 904 dwellings in East Bronson, owner-occupied units account for 835 (92.4%), while renter-occupied units make up 69 (7.6%).
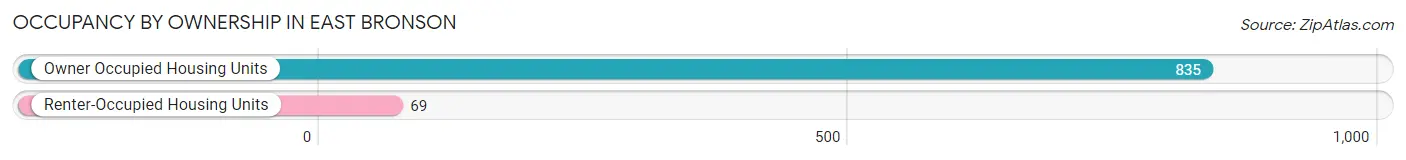
| Occupancy | # Housing Units | % Housing Units |
| Owner Occupied Housing Units | 835 | 92.4% |
| Renter-Occupied Housing Units | 69 | 7.6% |
| Total Occupied Housing Units | 904 | 100.0% |
Occupancy by Household Size in East Bronson
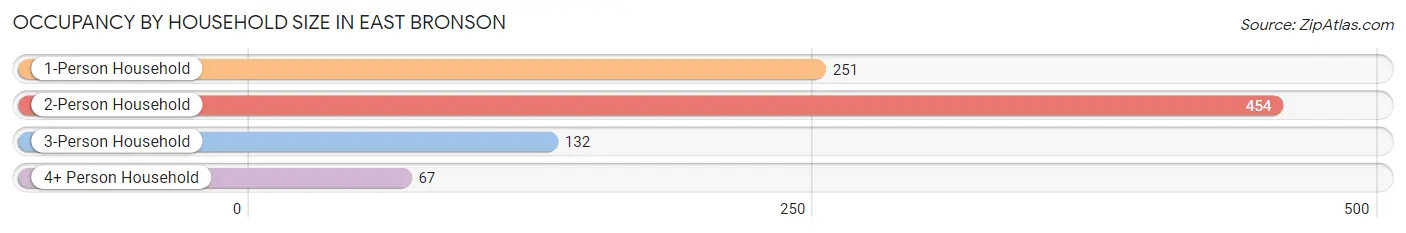
| Household Size | # Housing Units | % Housing Units |
| 1-Person Household | 251 | 27.8% |
| 2-Person Household | 454 | 50.2% |
| 3-Person Household | 132 | 14.6% |
| 4+ Person Household | 67 | 7.4% |
| Total Housing Units | 904 | 100.0% |
Occupancy by Ownership by Household Size in East Bronson
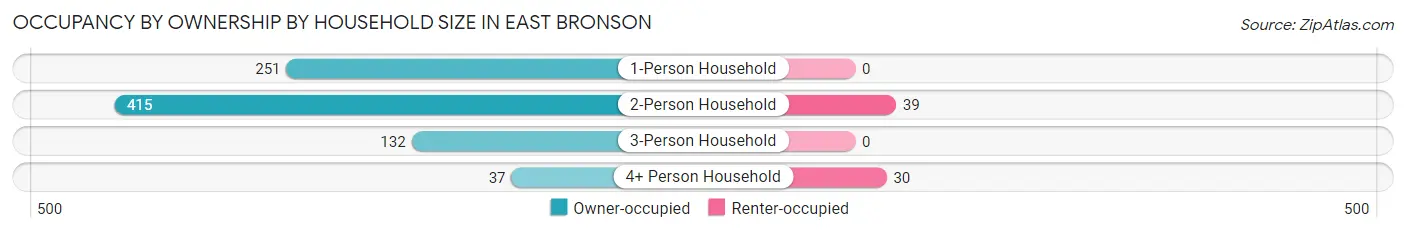
| Household Size | Owner-occupied | Renter-occupied |
| 1-Person Household | 251 (100.0%) | 0 (0.0%) |
| 2-Person Household | 415 (91.4%) | 39 (8.6%) |
| 3-Person Household | 132 (100.0%) | 0 (0.0%) |
| 4+ Person Household | 37 (55.2%) | 30 (44.8%) |
| Total Housing Units | 835 (92.4%) | 69 (7.6%) |
Occupancy by Educational Attainment in East Bronson
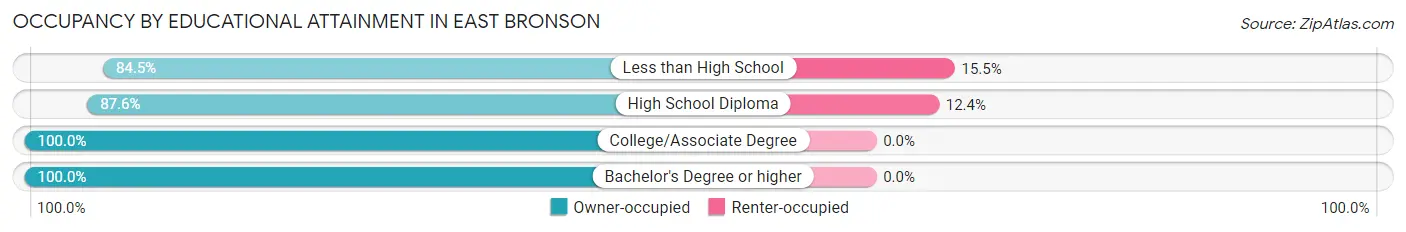
| Household Size | Owner-occupied | Renter-occupied |
| Less than High School | 163 (84.5%) | 30 (15.5%) |
| High School Diploma | 275 (87.6%) | 39 (12.4%) |
| College/Associate Degree | 229 (100.0%) | 0 (0.0%) |
| Bachelor's Degree or higher | 168 (100.0%) | 0 (0.0%) |
Occupancy by Age of Householder in East Bronson
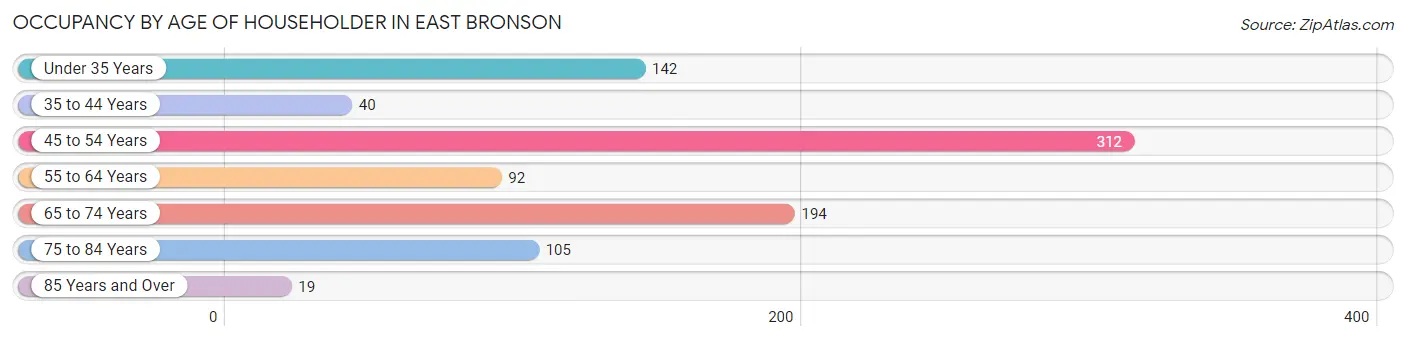
| Age Bracket | # Households | % Households |
| Under 35 Years | 142 | 15.7% |
| 35 to 44 Years | 40 | 4.4% |
| 45 to 54 Years | 312 | 34.5% |
| 55 to 64 Years | 92 | 10.2% |
| 65 to 74 Years | 194 | 21.5% |
| 75 to 84 Years | 105 | 11.6% |
| 85 Years and Over | 19 | 2.1% |
| Total | 904 | 100.0% |
Housing Finances in East Bronson
Median Income by Occupancy in East Bronson
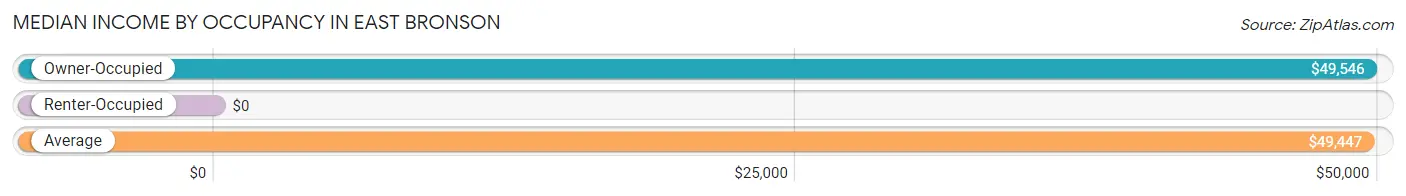
| Occupancy Type | # Households | Median Income |
| Owner-Occupied | 835 (92.4%) | $49,546 |
| Renter-Occupied | 69 (7.6%) | $0 |
| Average | 904 (100.0%) | $49,447 |
Occupancy by Householder Income Bracket in East Bronson
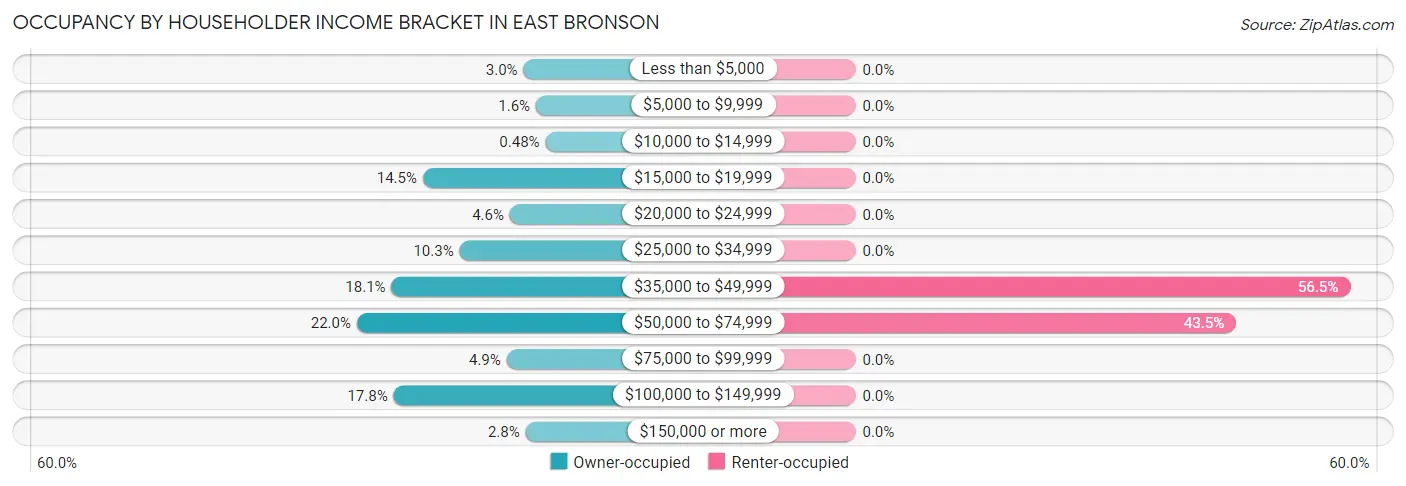
| Income Bracket | Owner-occupied | Renter-occupied |
| Less than $5,000 | 25 (3.0%) | 0 (0.0%) |
| $5,000 to $9,999 | 13 (1.6%) | 0 (0.0%) |
| $10,000 to $14,999 | 4 (0.5%) | 0 (0.0%) |
| $15,000 to $19,999 | 121 (14.5%) | 0 (0.0%) |
| $20,000 to $24,999 | 38 (4.5%) | 0 (0.0%) |
| $25,000 to $34,999 | 86 (10.3%) | 0 (0.0%) |
| $35,000 to $49,999 | 151 (18.1%) | 39 (56.5%) |
| $50,000 to $74,999 | 184 (22.0%) | 30 (43.5%) |
| $75,000 to $99,999 | 41 (4.9%) | 0 (0.0%) |
| $100,000 to $149,999 | 149 (17.8%) | 0 (0.0%) |
| $150,000 or more | 23 (2.8%) | 0 (0.0%) |
| Total | 835 (100.0%) | 69 (100.0%) |
Monthly Housing Cost Tiers in East Bronson
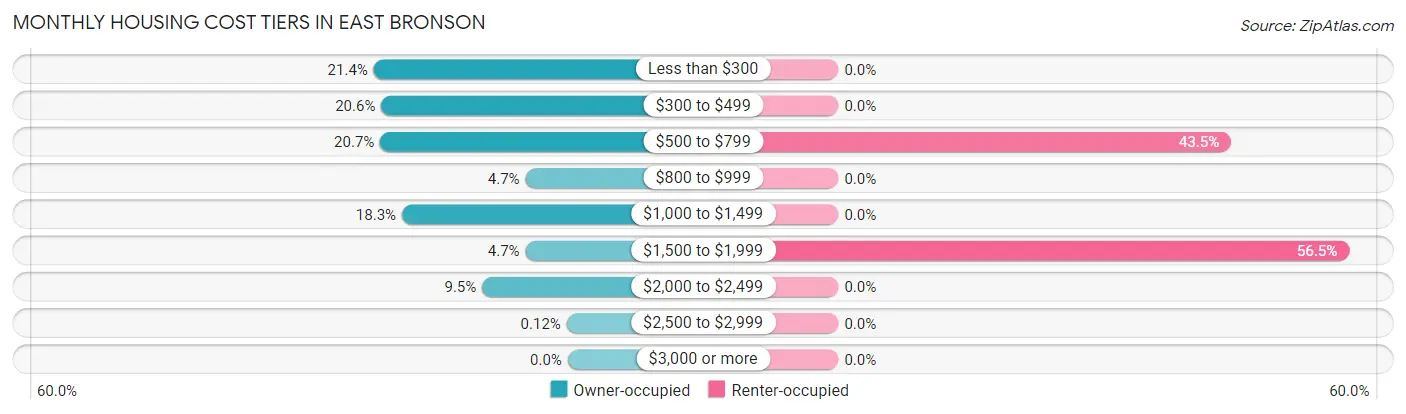
| Monthly Cost | Owner-occupied | Renter-occupied |
| Less than $300 | 179 (21.4%) | 0 (0.0%) |
| $300 to $499 | 172 (20.6%) | 0 (0.0%) |
| $500 to $799 | 173 (20.7%) | 30 (43.5%) |
| $800 to $999 | 39 (4.7%) | 0 (0.0%) |
| $1,000 to $1,499 | 153 (18.3%) | 0 (0.0%) |
| $1,500 to $1,999 | 39 (4.7%) | 39 (56.5%) |
| $2,000 to $2,499 | 79 (9.5%) | 0 (0.0%) |
| $2,500 to $2,999 | 1 (0.1%) | 0 (0.0%) |
| $3,000 or more | 0 (0.0%) | 0 (0.0%) |
| Total | 835 (100.0%) | 69 (100.0%) |
Physical Housing Characteristics in East Bronson
Housing Structures in East Bronson
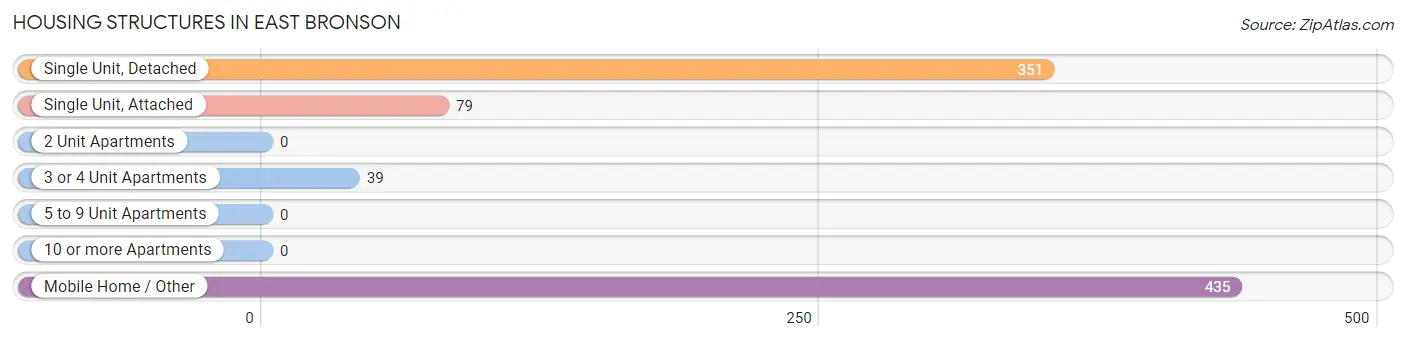
| Structure Type | # Housing Units | % Housing Units |
| Single Unit, Detached | 351 | 38.8% |
| Single Unit, Attached | 79 | 8.7% |
| 2 Unit Apartments | 0 | 0.0% |
| 3 or 4 Unit Apartments | 39 | 4.3% |
| 5 to 9 Unit Apartments | 0 | 0.0% |
| 10 or more Apartments | 0 | 0.0% |
| Mobile Home / Other | 435 | 48.1% |
| Total | 904 | 100.0% |
Housing Structures by Occupancy in East Bronson
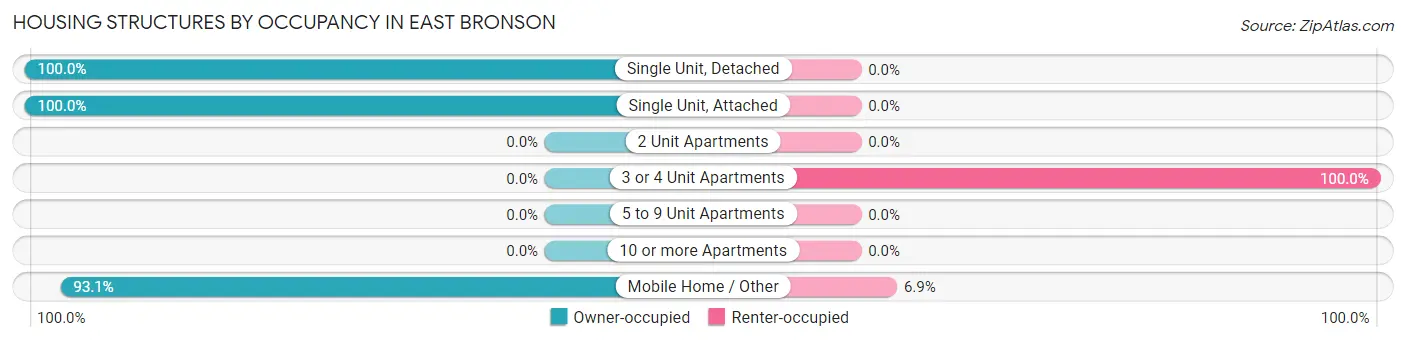
| Structure Type | Owner-occupied | Renter-occupied |
| Single Unit, Detached | 351 (100.0%) | 0 (0.0%) |
| Single Unit, Attached | 79 (100.0%) | 0 (0.0%) |
| 2 Unit Apartments | 0 (0.0%) | 0 (0.0%) |
| 3 or 4 Unit Apartments | 0 (0.0%) | 39 (100.0%) |
| 5 to 9 Unit Apartments | 0 (0.0%) | 0 (0.0%) |
| 10 or more Apartments | 0 (0.0%) | 0 (0.0%) |
| Mobile Home / Other | 405 (93.1%) | 30 (6.9%) |
| Total | 835 (92.4%) | 69 (7.6%) |
Housing Structures by Number of Rooms in East Bronson
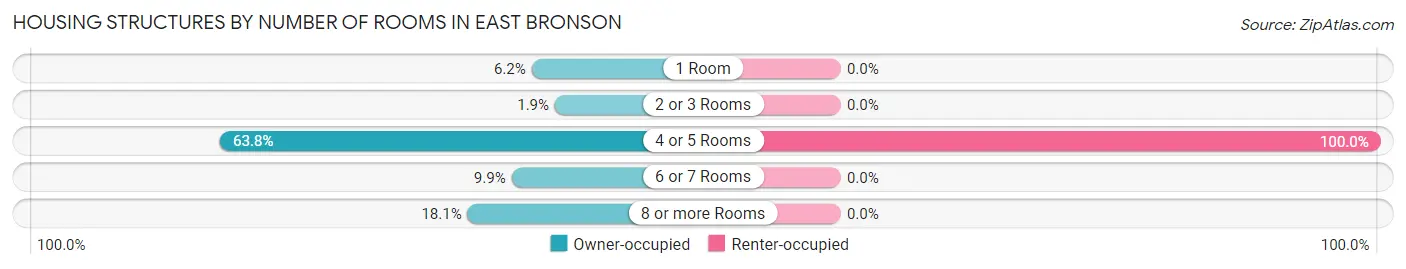
| Number of Rooms | Owner-occupied | Renter-occupied |
| 1 Room | 52 (6.2%) | 0 (0.0%) |
| 2 or 3 Rooms | 16 (1.9%) | 0 (0.0%) |
| 4 or 5 Rooms | 533 (63.8%) | 69 (100.0%) |
| 6 or 7 Rooms | 83 (9.9%) | 0 (0.0%) |
| 8 or more Rooms | 151 (18.1%) | 0 (0.0%) |
| Total | 835 (100.0%) | 69 (100.0%) |
Housing Structure by Heating Type in East Bronson
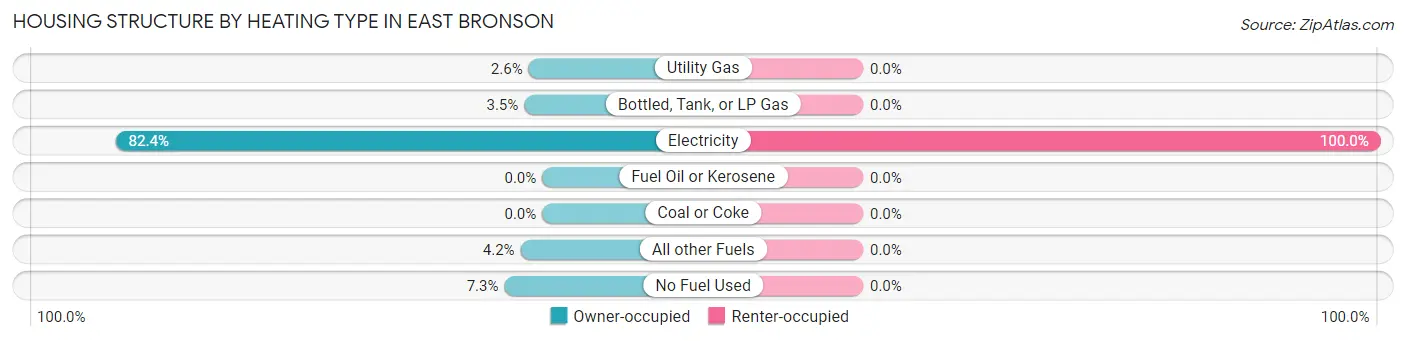
| Heating Type | Owner-occupied | Renter-occupied |
| Utility Gas | 22 (2.6%) | 0 (0.0%) |
| Bottled, Tank, or LP Gas | 29 (3.5%) | 0 (0.0%) |
| Electricity | 688 (82.4%) | 69 (100.0%) |
| Fuel Oil or Kerosene | 0 (0.0%) | 0 (0.0%) |
| Coal or Coke | 0 (0.0%) | 0 (0.0%) |
| All other Fuels | 35 (4.2%) | 0 (0.0%) |
| No Fuel Used | 61 (7.3%) | 0 (0.0%) |
| Total | 835 (100.0%) | 69 (100.0%) |
Household Vehicle Usage in East Bronson
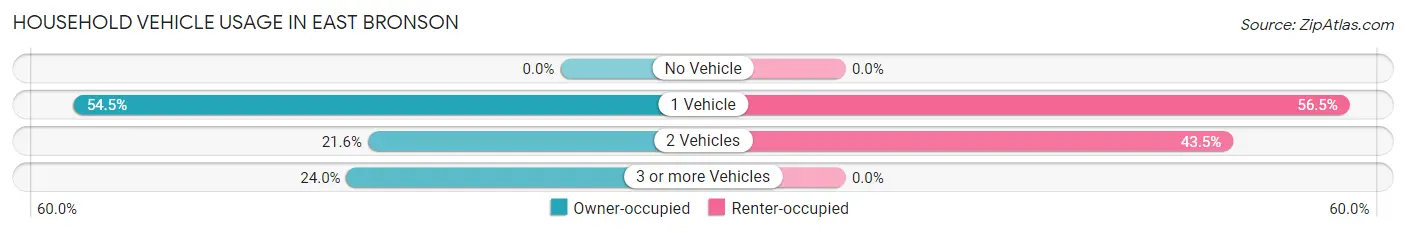
| Vehicles per Household | Owner-occupied | Renter-occupied |
| No Vehicle | 0 (0.0%) | 0 (0.0%) |
| 1 Vehicle | 455 (54.5%) | 39 (56.5%) |
| 2 Vehicles | 180 (21.6%) | 30 (43.5%) |
| 3 or more Vehicles | 200 (23.9%) | 0 (0.0%) |
| Total | 835 (100.0%) | 69 (100.0%) |
Real Estate & Mortgages in East Bronson
Real Estate and Mortgage Overview in East Bronson
| Characteristic | Without Mortgage | With Mortgage |
| Housing Units | 401 | 434 |
| Median Property Value | $154,900 | $139,800 |
| Median Household Income | $41,678 | $23 |
| Monthly Housing Costs | $350 | $0 |
| Real Estate Taxes | $863 | $0 |
Property Value by Mortgage Status in East Bronson
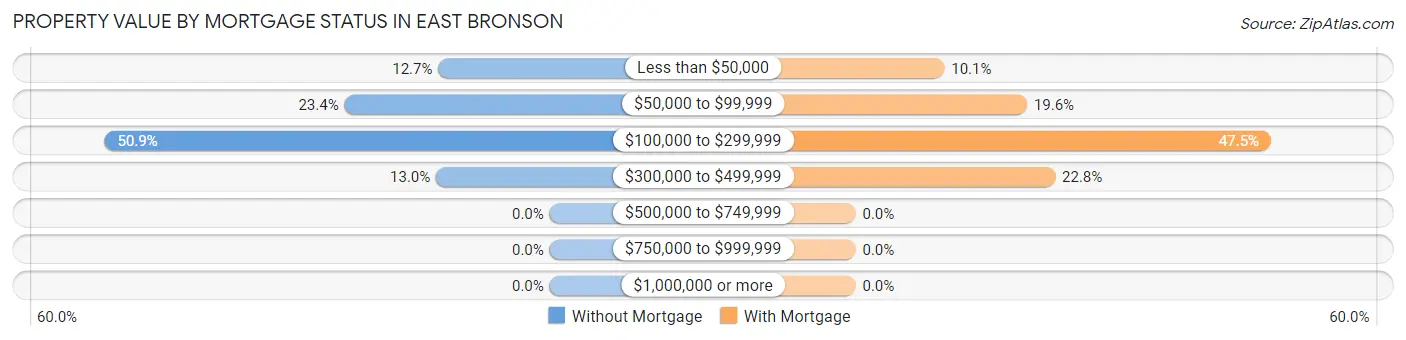
| Property Value | Without Mortgage | With Mortgage |
| Less than $50,000 | 51 (12.7%) | 44 (10.1%) |
| $50,000 to $99,999 | 94 (23.4%) | 85 (19.6%) |
| $100,000 to $299,999 | 204 (50.9%) | 206 (47.5%) |
| $300,000 to $499,999 | 52 (13.0%) | 99 (22.8%) |
| $500,000 to $749,999 | 0 (0.0%) | 0 (0.0%) |
| $750,000 to $999,999 | 0 (0.0%) | 0 (0.0%) |
| $1,000,000 or more | 0 (0.0%) | 0 (0.0%) |
| Total | 401 (100.0%) | 434 (100.0%) |
Household Income by Mortgage Status in East Bronson
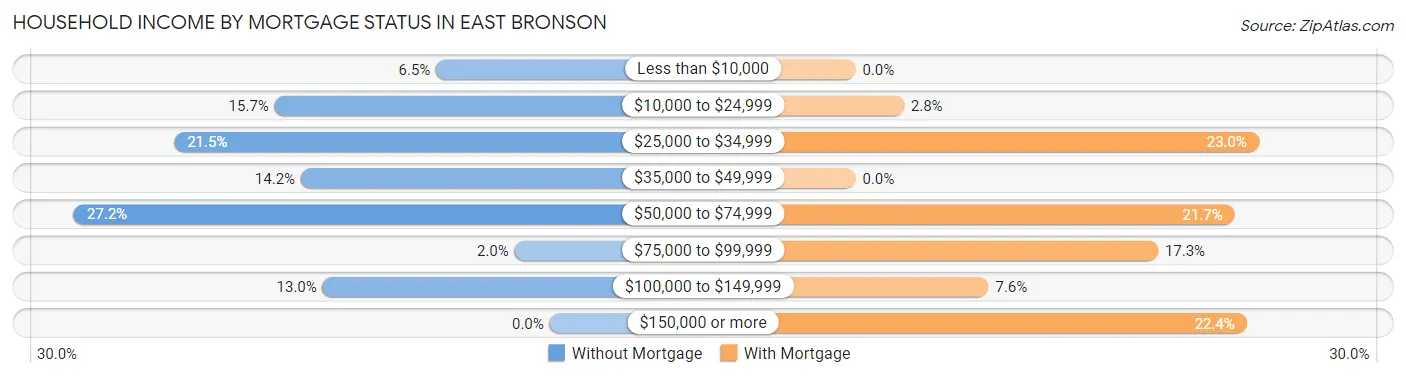
| Household Income | Without Mortgage | With Mortgage |
| Less than $10,000 | 26 (6.5%) | 0 (0.0%) |
| $10,000 to $24,999 | 63 (15.7%) | 12 (2.8%) |
| $25,000 to $34,999 | 86 (21.4%) | 100 (23.0%) |
| $35,000 to $49,999 | 57 (14.2%) | 0 (0.0%) |
| $50,000 to $74,999 | 109 (27.2%) | 94 (21.7%) |
| $75,000 to $99,999 | 8 (2.0%) | 75 (17.3%) |
| $100,000 to $149,999 | 52 (13.0%) | 33 (7.6%) |
| $150,000 or more | 0 (0.0%) | 97 (22.4%) |
| Total | 401 (100.0%) | 434 (100.0%) |
Property Value to Household Income Ratio in East Bronson
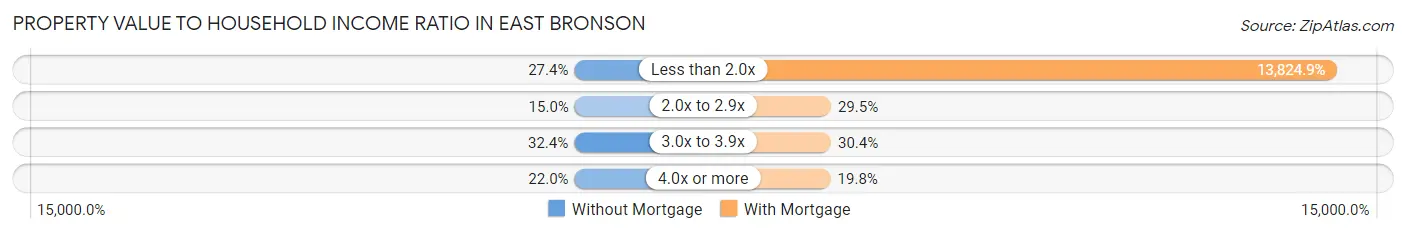
| Value-to-Income Ratio | Without Mortgage | With Mortgage |
| Less than 2.0x | 110 (27.4%) | 60,000 (13,824.9%) |
| 2.0x to 2.9x | 60 (15.0%) | 128 (29.5%) |
| 3.0x to 3.9x | 130 (32.4%) | 132 (30.4%) |
| 4.0x or more | 88 (22.0%) | 86 (19.8%) |
| Total | 401 (100.0%) | 434 (100.0%) |
Real Estate Taxes by Mortgage Status in East Bronson
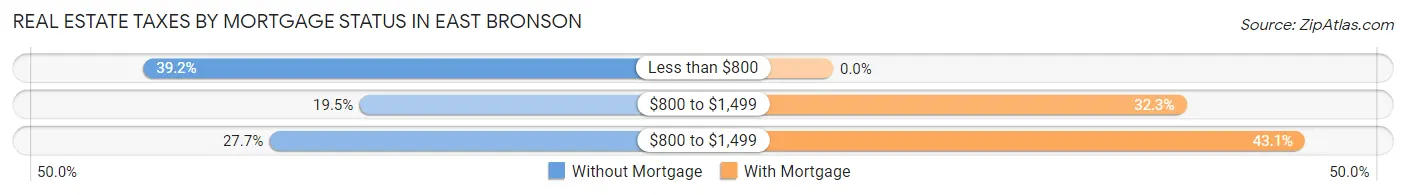
| Property Taxes | Without Mortgage | With Mortgage |
| Less than $800 | 157 (39.2%) | 0 (0.0%) |
| $800 to $1,499 | 78 (19.5%) | 140 (32.3%) |
| $800 to $1,499 | 111 (27.7%) | 187 (43.1%) |
| Total | 401 (100.0%) | 434 (100.0%) |
Health & Disability in East Bronson
Health Insurance Coverage by Age in East Bronson
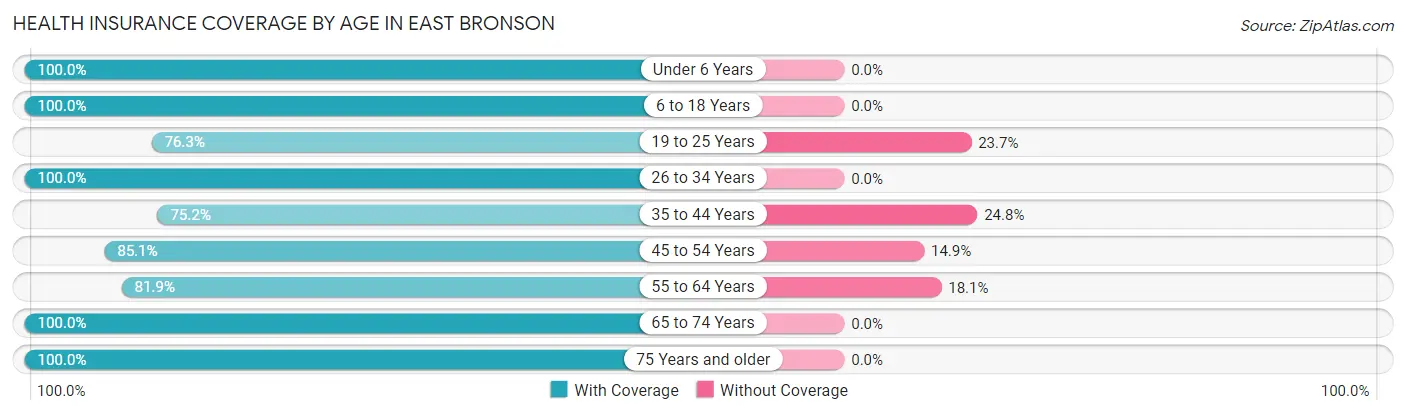
| Age Bracket | With Coverage | Without Coverage |
| Under 6 Years | 142 (100.0%) | 0 (0.0%) |
| 6 to 18 Years | 245 (100.0%) | 0 (0.0%) |
| 19 to 25 Years | 129 (76.3%) | 40 (23.7%) |
| 26 to 34 Years | 112 (100.0%) | 0 (0.0%) |
| 35 to 44 Years | 88 (75.2%) | 29 (24.8%) |
| 45 to 54 Years | 418 (85.1%) | 73 (14.9%) |
| 55 to 64 Years | 163 (81.9%) | 36 (18.1%) |
| 65 to 74 Years | 280 (100.0%) | 0 (0.0%) |
| 75 Years and older | 169 (100.0%) | 0 (0.0%) |
| Total | 1,746 (90.7%) | 178 (9.2%) |
Health Insurance Coverage by Citizenship Status in East Bronson
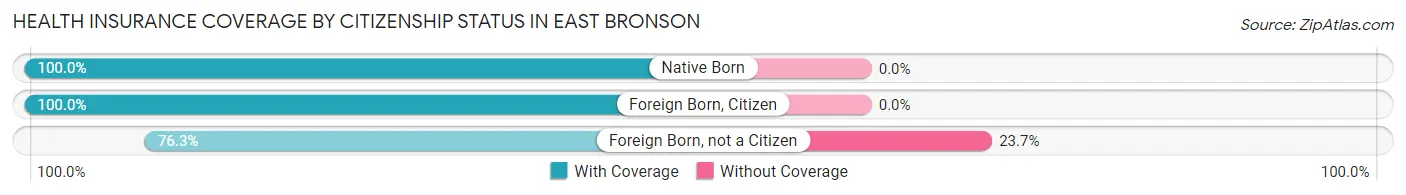
| Citizenship Status | With Coverage | Without Coverage |
| Native Born | 142 (100.0%) | 0 (0.0%) |
| Foreign Born, Citizen | 245 (100.0%) | 0 (0.0%) |
| Foreign Born, not a Citizen | 129 (76.3%) | 40 (23.7%) |
Health Insurance Coverage by Household Income in East Bronson
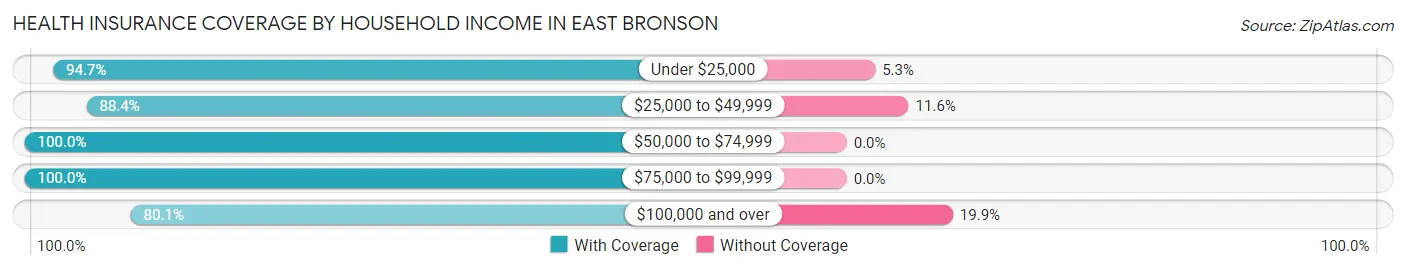
| Household Income | With Coverage | Without Coverage |
| Under $25,000 | 231 (94.7%) | 13 (5.3%) |
| $25,000 to $49,999 | 488 (88.4%) | 64 (11.6%) |
| $50,000 to $74,999 | 528 (100.0%) | 0 (0.0%) |
| $75,000 to $99,999 | 92 (100.0%) | 0 (0.0%) |
| $100,000 and over | 407 (80.1%) | 101 (19.9%) |
Public vs Private Health Insurance Coverage by Age in East Bronson
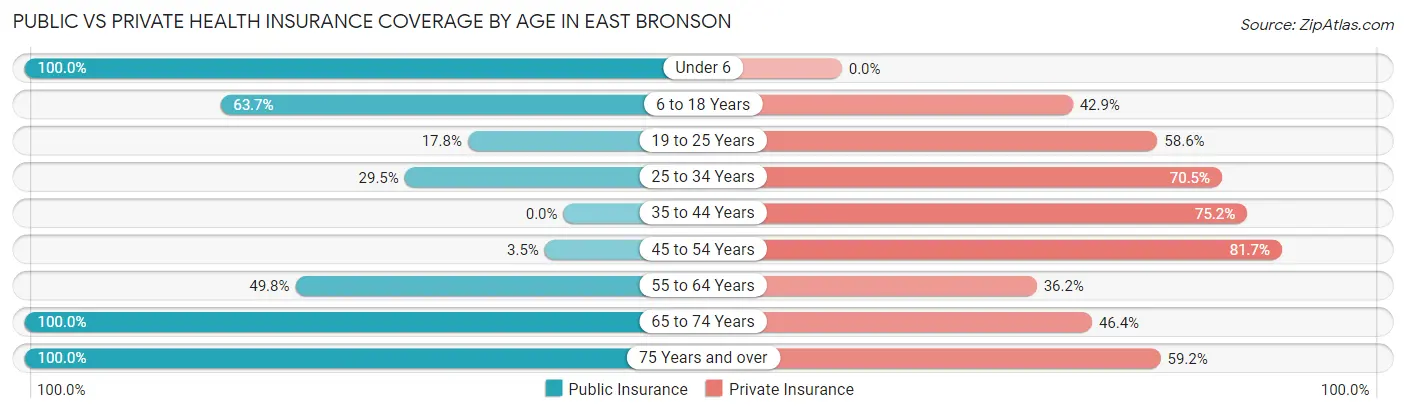
| Age Bracket | Public Insurance | Private Insurance |
| Under 6 | 142 (100.0%) | 0 (0.0%) |
| 6 to 18 Years | 156 (63.7%) | 105 (42.9%) |
| 19 to 25 Years | 30 (17.7%) | 99 (58.6%) |
| 25 to 34 Years | 33 (29.5%) | 79 (70.5%) |
| 35 to 44 Years | 0 (0.0%) | 88 (75.2%) |
| 45 to 54 Years | 17 (3.5%) | 401 (81.7%) |
| 55 to 64 Years | 99 (49.7%) | 72 (36.2%) |
| 65 to 74 Years | 280 (100.0%) | 130 (46.4%) |
| 75 Years and over | 169 (100.0%) | 100 (59.2%) |
| Total | 926 (48.1%) | 1,074 (55.8%) |
Disability Status by Sex by Age in East Bronson
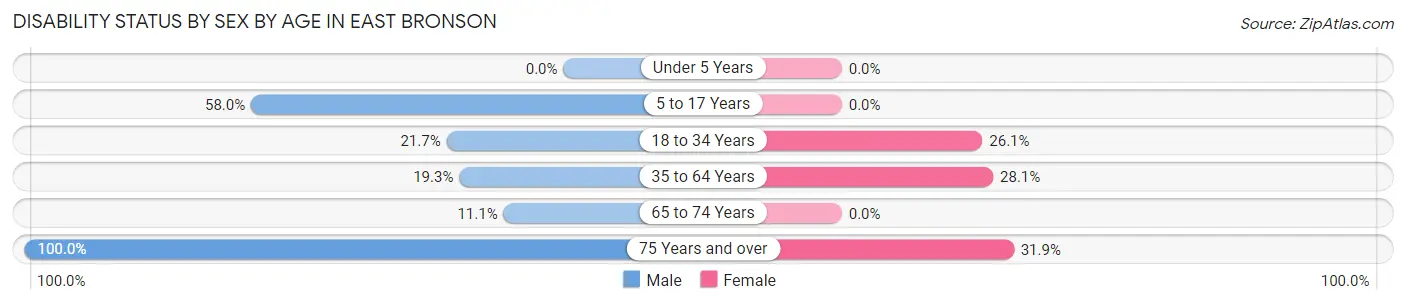
| Age Bracket | Male | Female |
| Under 5 Years | 0 (0.0%) | 0 (0.0%) |
| 5 to 17 Years | 80 (58.0%) | 0 (0.0%) |
| 18 to 34 Years | 36 (21.7%) | 30 (26.1%) |
| 35 to 64 Years | 81 (19.3%) | 109 (28.1%) |
| 65 to 74 Years | 12 (11.1%) | 0 (0.0%) |
| 75 Years and over | 75 (100.0%) | 30 (31.9%) |
Disability Class by Sex by Age in East Bronson
Disability Class: Hearing Difficulty
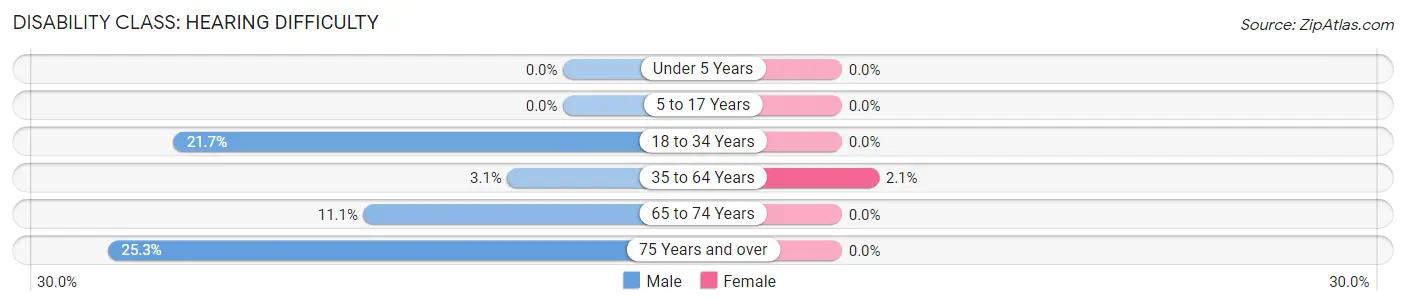
| Age Bracket | Male | Female |
| Under 5 Years | 0 (0.0%) | 0 (0.0%) |
| 5 to 17 Years | 0 (0.0%) | 0 (0.0%) |
| 18 to 34 Years | 36 (21.7%) | 0 (0.0%) |
| 35 to 64 Years | 13 (3.1%) | 8 (2.1%) |
| 65 to 74 Years | 12 (11.1%) | 0 (0.0%) |
| 75 Years and over | 19 (25.3%) | 0 (0.0%) |
Disability Class: Vision Difficulty
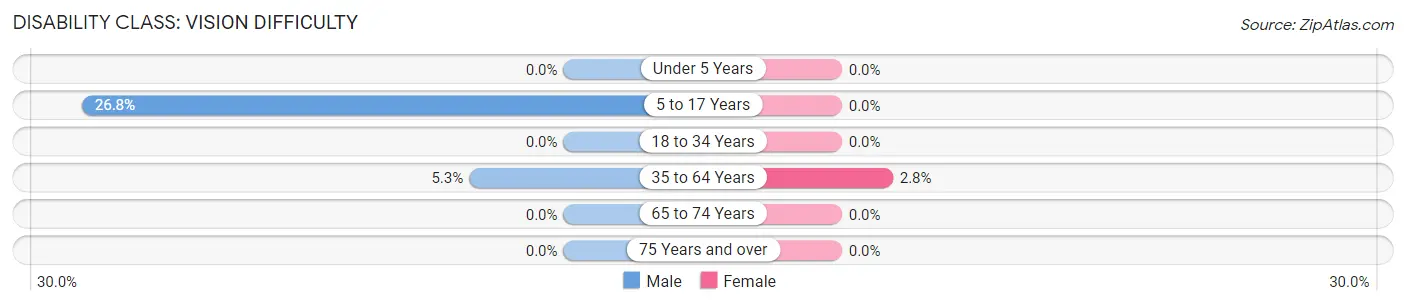
| Age Bracket | Male | Female |
| Under 5 Years | 0 (0.0%) | 0 (0.0%) |
| 5 to 17 Years | 37 (26.8%) | 0 (0.0%) |
| 18 to 34 Years | 0 (0.0%) | 0 (0.0%) |
| 35 to 64 Years | 22 (5.2%) | 11 (2.8%) |
| 65 to 74 Years | 0 (0.0%) | 0 (0.0%) |
| 75 Years and over | 0 (0.0%) | 0 (0.0%) |
Disability Class: Cognitive Difficulty
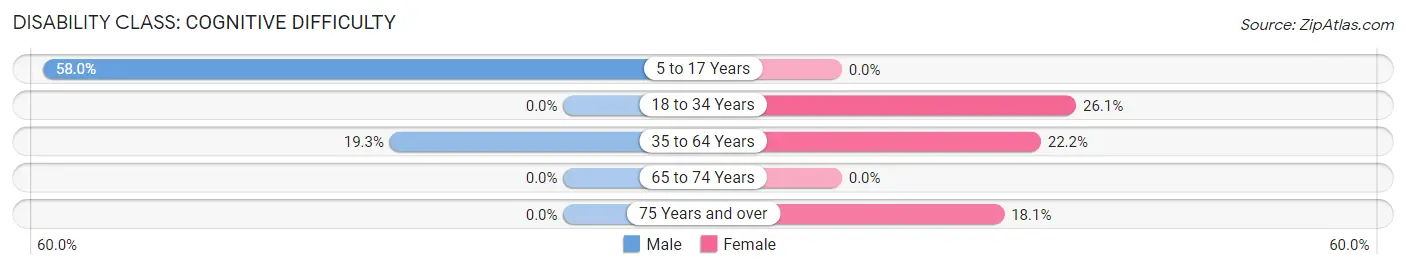
| Age Bracket | Male | Female |
| 5 to 17 Years | 80 (58.0%) | 0 (0.0%) |
| 18 to 34 Years | 0 (0.0%) | 30 (26.1%) |
| 35 to 64 Years | 81 (19.3%) | 86 (22.2%) |
| 65 to 74 Years | 0 (0.0%) | 0 (0.0%) |
| 75 Years and over | 0 (0.0%) | 17 (18.1%) |
Disability Class: Ambulatory Difficulty
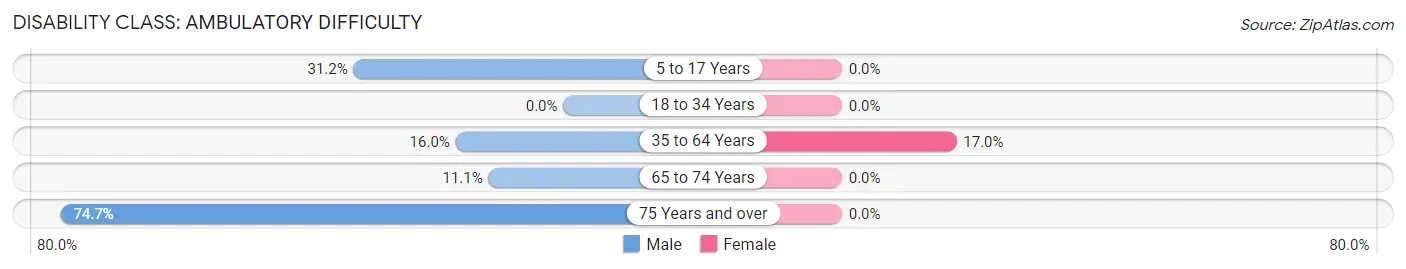
| Age Bracket | Male | Female |
| 5 to 17 Years | 43 (31.2%) | 0 (0.0%) |
| 18 to 34 Years | 0 (0.0%) | 0 (0.0%) |
| 35 to 64 Years | 67 (16.0%) | 66 (17.0%) |
| 65 to 74 Years | 12 (11.1%) | 0 (0.0%) |
| 75 Years and over | 56 (74.7%) | 0 (0.0%) |
Disability Class: Self-Care Difficulty
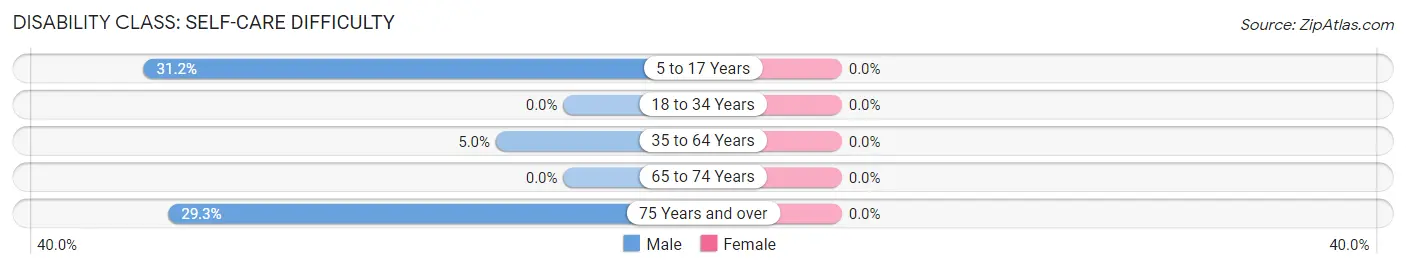
| Age Bracket | Male | Female |
| 5 to 17 Years | 43 (31.2%) | 0 (0.0%) |
| 18 to 34 Years | 0 (0.0%) | 0 (0.0%) |
| 35 to 64 Years | 21 (5.0%) | 0 (0.0%) |
| 65 to 74 Years | 0 (0.0%) | 0 (0.0%) |
| 75 Years and over | 22 (29.3%) | 0 (0.0%) |
Technology Access in East Bronson
Computing Device Access in East Bronson
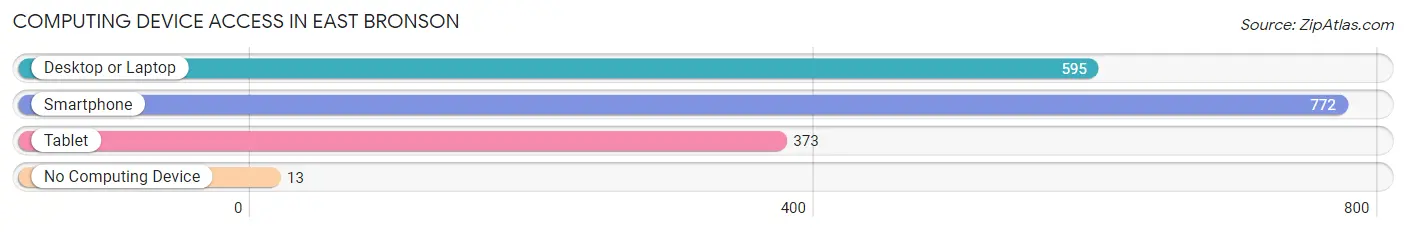
| Device Type | # Households | % Households |
| Desktop or Laptop | 595 | 65.8% |
| Smartphone | 772 | 85.4% |
| Tablet | 373 | 41.3% |
| No Computing Device | 13 | 1.4% |
| Total | 904 | 100.0% |
Internet Access in East Bronson
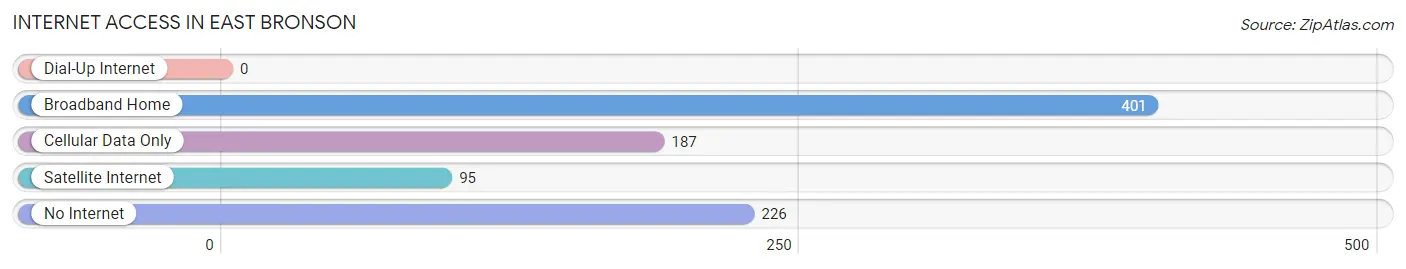
| Internet Type | # Households | % Households |
| Dial-Up Internet | 0 | 0.0% |
| Broadband Home | 401 | 44.4% |
| Cellular Data Only | 187 | 20.7% |
| Satellite Internet | 95 | 10.5% |
| No Internet | 226 | 25.0% |
| Total | 904 | 100.0% |
East Bronson Summary
East Bronson is a small town located in Levy County, Florida. It is situated on the eastern side of the Suwannee River, approximately 20 miles south of Gainesville. The town has a population of approximately 1,000 people and is part of the Gainesville Metropolitan Statistical Area.
History
East Bronson was founded in 1883 by a group of settlers from the nearby town of Bronson. The settlers were looking for a place to settle and start a new life. The town was named after the nearby Bronson family, who had been living in the area since the early 1800s.
The town was originally a farming community, with the main crops being cotton, corn, and peanuts. The town also had a sawmill and a gristmill. In the early 1900s, the town began to grow and develop, with the construction of a railroad line and the opening of a post office.
In the 1920s, the town began to experience a period of growth and prosperity. The population increased and businesses began to open. The town also became a popular tourist destination, with many people coming to visit the nearby Suwannee River.
In the 1950s, the town began to decline. The railroad line was closed and the post office was moved to a nearby town. The population began to decline and businesses began to close.
Geography
East Bronson is located in Levy County, Florida. It is situated on the eastern side of the Suwannee River, approximately 20 miles south of Gainesville. The town is located in a rural area, with the nearest major city being Gainesville.
The town is located in a flat area, with the highest point being only about 50 feet above sea level. The town is surrounded by forests and wetlands, with the nearest body of water being the Suwannee River.
Economy
The economy of East Bronson is largely based on agriculture. The main crops grown in the area are cotton, corn, and peanuts. The town also has a few small businesses, such as a gas station, a grocery store, and a few restaurants.
The town also has a few tourist attractions, such as the Suwannee River and the nearby Manatee Springs State Park. The town also has a few small manufacturing businesses, such as a furniture factory and a woodworking shop.
Demographics
As of the 2010 census, the population of East Bronson was 1,000 people. The racial makeup of the town was 97.2% White, 0.7% African American, 0.3% Native American, 0.2% Asian, 0.1% Pacific Islander, and 1.5% from other races. The median household income was $30,000, and the median family income was $35,000. The per capita income was $14,000.
Common Questions
What is Per Capita Income in East Bronson?
Per Capita income in East Bronson is $29,439.
What is the Median Family Income in East Bronson?
Median Family Income in East Bronson is $53,661.
What is the Median Household income in East Bronson?
Median Household Income in East Bronson is $49,447.
What is Income or Wage Gap in East Bronson?
Income or Wage Gap in East Bronson is 39.6%.
Women in East Bronson earn 60.4 cents for every dollar earned by a man.
What is Inequality or Gini Index in East Bronson?
Inequality or Gini Index in East Bronson is 0.37.
What is the Total Population of East Bronson?
Total Population of East Bronson is 1,924.
What is the Total Male Population of East Bronson?
Total Male Population of East Bronson is 948.
What is the Total Female Population of East Bronson?
Total Female Population of East Bronson is 976.
What is the Ratio of Males per 100 Females in East Bronson?
There are 97.13 Males per 100 Females in East Bronson.
What is the Ratio of Females per 100 Males in East Bronson?
There are 102.95 Females per 100 Males in East Bronson.
What is the Median Population Age in East Bronson?
Median Population Age in East Bronson is 50.1 Years.
What is the Average Family Size in East Bronson
Average Family Size in East Bronson is 2.6 People.
What is the Average Household Size in East Bronson
Average Household Size in East Bronson is 2.1 People.
How Large is the Labor Force in East Bronson?
There are 935 People in the Labor Forcein in East Bronson.
What is the Percentage of People in the Labor Force in East Bronson?
59.0% of People are in the Labor Force in East Bronson.
What is the Unemployment Rate in East Bronson?
Unemployment Rate in East Bronson is 3.1%.