Garden Grove, FL Map & Demographics
Garden Grove Map
Garden Grove Overview
$40,476
PER CAPITA INCOME
$84,474
AVG FAMILY INCOME
$83,190
AVG HOUSEHOLD INCOME
2.3%
WAGE / INCOME GAP [ % ]
97.7¢/ $1
WAGE / INCOME GAP [ $ ]
0.48
INEQUALITY / GINI INDEX
1,035
TOTAL POPULATION
450
MALE POPULATION
585
FEMALE POPULATION
76.92
MALES / 100 FEMALES
130.00
FEMALES / 100 MALES
39.3
MEDIAN AGE
2.6
AVG FAMILY SIZE
2.9
AVG HOUSEHOLD SIZE
588
LABOR FORCE [ PEOPLE ]
69.0%
PERCENT IN LABOR FORCE
1.5%
UNEMPLOYMENT RATE
Income in Garden Grove
Income Overview in Garden Grove
Per Capita Income in Garden Grove is $40,476, while median incomes of families and households are $84,474 and $83,190 respectively.
| Characteristic | Number | Measure |
| Per Capita Income | 1,035 | $40,476 |
| Median Family Income | 286 | $84,474 |
| Mean Family Income | 286 | $118,090 |
| Median Household Income | 360 | $83,190 |
| Mean Household Income | 360 | $109,838 |
| Income Deficit | 286 | $0 |
| Wage / Income Gap (%) | 1,035 | 2.25% |
| Wage / Income Gap ($) | 1,035 | 97.75¢ per $1 |
| Gini / Inequality Index | 1,035 | 0.48 |
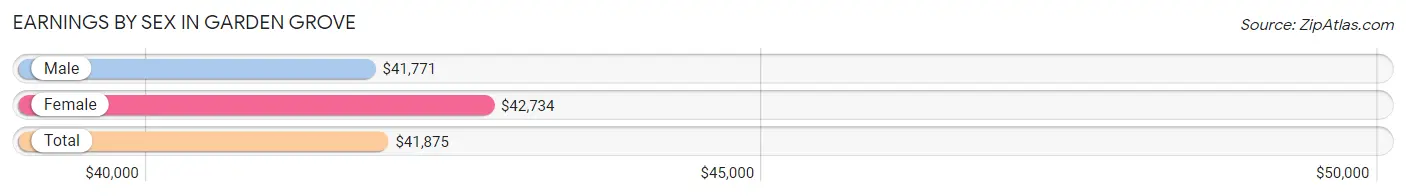
Earnings by Sex in Garden Grove
Average Earnings in Garden Grove are $41,875, $41,771 for men and $42,734 for women, a difference of 2.2%.
| Sex | Number | Average Earnings |
| Male | 313 (53.2%) | $41,771 |
| Female | 275 (46.8%) | $42,734 |
| Total | 588 (100.0%) | $41,875 |
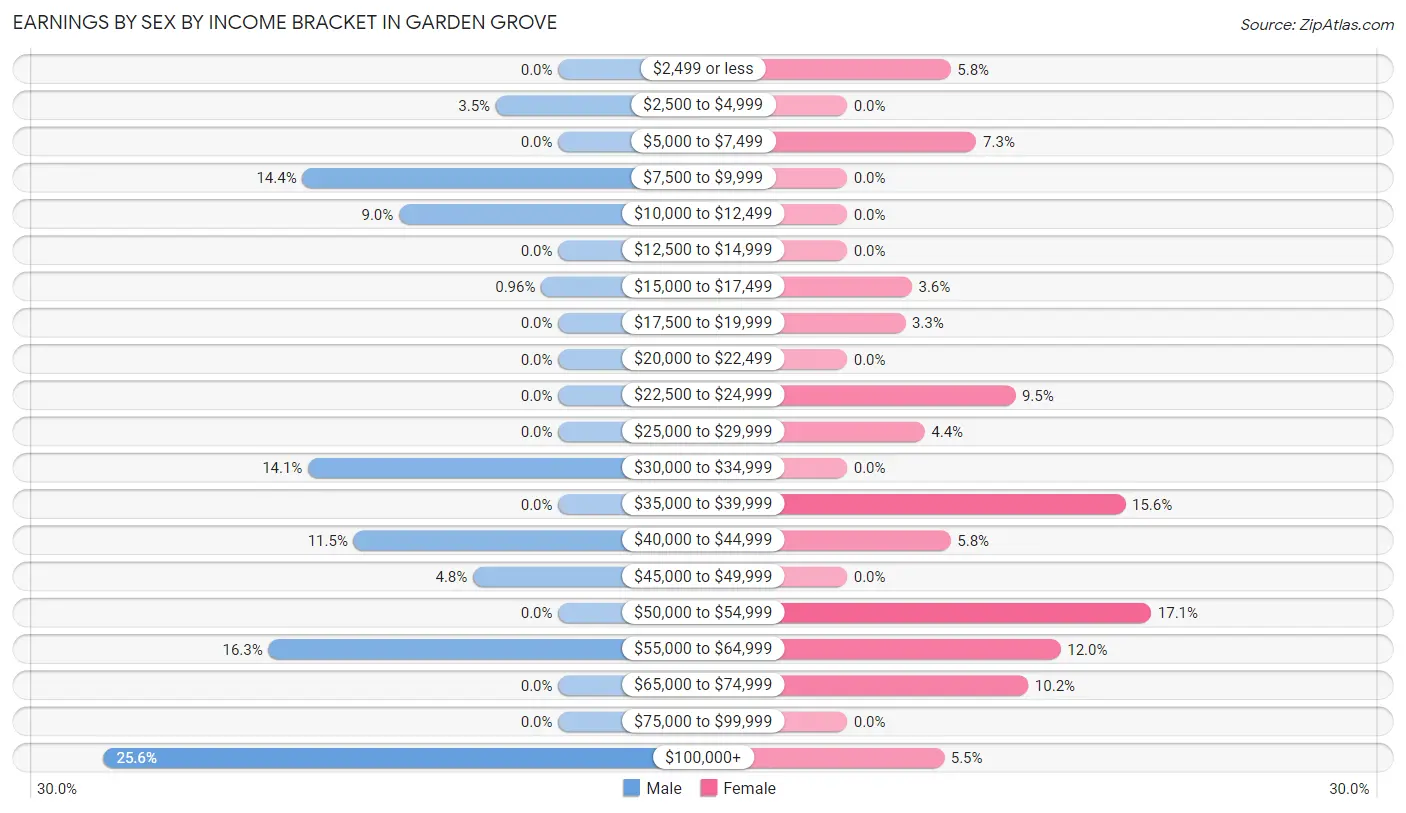
Earnings by Sex by Income Bracket in Garden Grove
The most common earnings brackets in Garden Grove are $100,000+ for men (80 | 25.6%) and $50,000 to $54,999 for women (47 | 17.1%).
| Income | Male | Female |
| $2,499 or less | 0 (0.0%) | 16 (5.8%) |
| $2,500 to $4,999 | 11 (3.5%) | 0 (0.0%) |
| $5,000 to $7,499 | 0 (0.0%) | 20 (7.3%) |
| $7,500 to $9,999 | 45 (14.4%) | 0 (0.0%) |
| $10,000 to $12,499 | 28 (8.9%) | 0 (0.0%) |
| $12,500 to $14,999 | 0 (0.0%) | 0 (0.0%) |
| $15,000 to $17,499 | 3 (1.0%) | 10 (3.6%) |
| $17,500 to $19,999 | 0 (0.0%) | 9 (3.3%) |
| $20,000 to $22,499 | 0 (0.0%) | 0 (0.0%) |
| $22,500 to $24,999 | 0 (0.0%) | 26 (9.5%) |
| $25,000 to $29,999 | 0 (0.0%) | 12 (4.4%) |
| $30,000 to $34,999 | 44 (14.1%) | 0 (0.0%) |
| $35,000 to $39,999 | 0 (0.0%) | 43 (15.6%) |
| $40,000 to $44,999 | 36 (11.5%) | 16 (5.8%) |
| $45,000 to $49,999 | 15 (4.8%) | 0 (0.0%) |
| $50,000 to $54,999 | 0 (0.0%) | 47 (17.1%) |
| $55,000 to $64,999 | 51 (16.3%) | 33 (12.0%) |
| $65,000 to $74,999 | 0 (0.0%) | 28 (10.2%) |
| $75,000 to $99,999 | 0 (0.0%) | 0 (0.0%) |
| $100,000+ | 80 (25.6%) | 15 (5.4%) |
| Total | 313 (100.0%) | 275 (100.0%) |
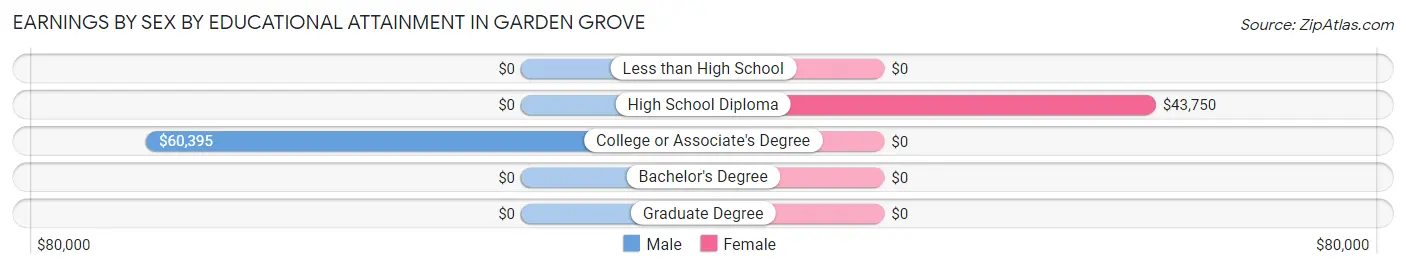
Earnings by Sex by Educational Attainment in Garden Grove
Average earnings in Garden Grove are $42,326 for men and $44,286 for women, a difference of 4.4%. Men with an educational attainment of college or associate's degree enjoy the highest average annual earnings of $60,395, while those with college or associate's degree education earn the least with $60,395. Women with an educational attainment of high school diploma earn the most with the average annual earnings of $43,750, while those with high school diploma education have the smallest earnings of $43,750.
| Educational Attainment | Male Income | Female Income |
| Less than High School | - | - |
| High School Diploma | - | - |
| College or Associate's Degree | $60,395 | $0 |
| Bachelor's Degree | - | - |
| Graduate Degree | - | - |
| Total | $42,326 | $44,286 |
Family Income in Garden Grove
Family Income Brackets in Garden Grove
According to the Garden Grove family income data, there are 87 families falling into the $75,000 to $99,999 income range, which is the most common income bracket and makes up 30.4% of all families.
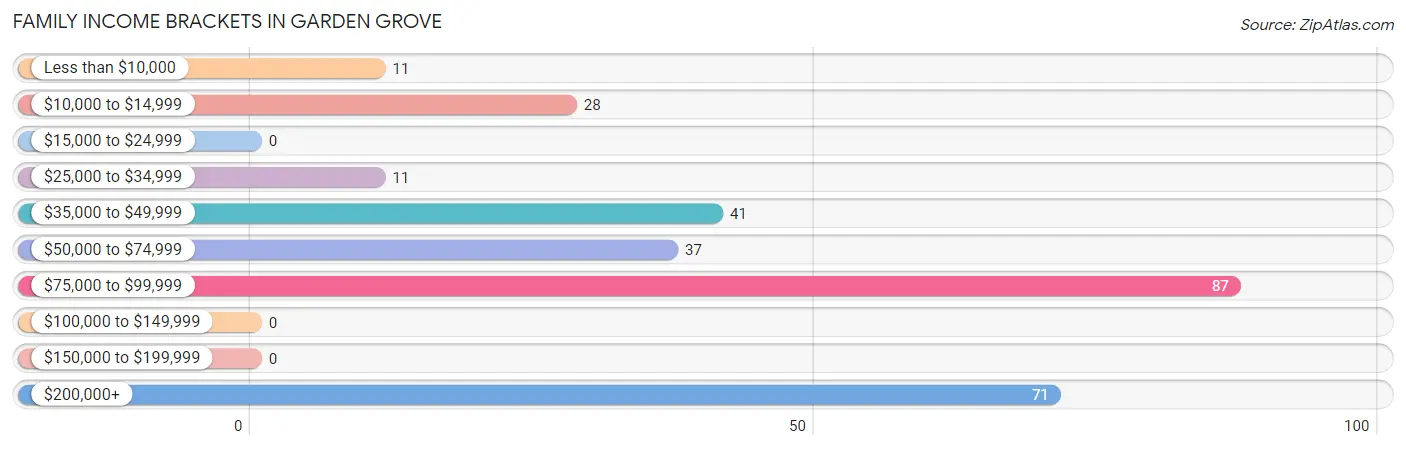
| Income Bracket | # Families | % Families |
| Less than $10,000 | 11 | 3.8% |
| $10,000 to $14,999 | 28 | 9.8% |
| $15,000 to $24,999 | 0 | 0.0% |
| $25,000 to $34,999 | 11 | 3.8% |
| $35,000 to $49,999 | 41 | 14.3% |
| $50,000 to $74,999 | 37 | 12.9% |
| $75,000 to $99,999 | 87 | 30.4% |
| $100,000 to $149,999 | 0 | 0.0% |
| $150,000 to $199,999 | 0 | 0.0% |
| $200,000+ | 71 | 24.8% |
Family Income by Famaliy Size in Garden Grove
3-person families (89 | 31.1%) account for the highest median family income in Garden Grove with $95,697 per family, while 3-person families (89 | 31.1%) have the highest median income of $31,899 per family member.
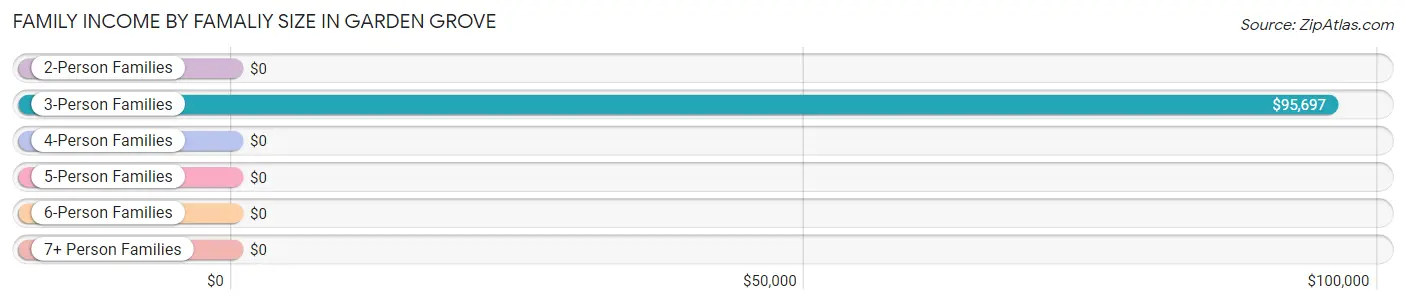
| Income Bracket | # Families | Median Income |
| 2-Person Families | 166 (58.0%) | $0 |
| 3-Person Families | 89 (31.1%) | $95,697 |
| 4-Person Families | 8 (2.8%) | $0 |
| 5-Person Families | 23 (8.0%) | $0 |
| 6-Person Families | 0 (0.0%) | $0 |
| 7+ Person Families | 0 (0.0%) | $0 |
| Total | 286 (100.0%) | $84,474 |
Family Income by Number of Earners in Garden Grove
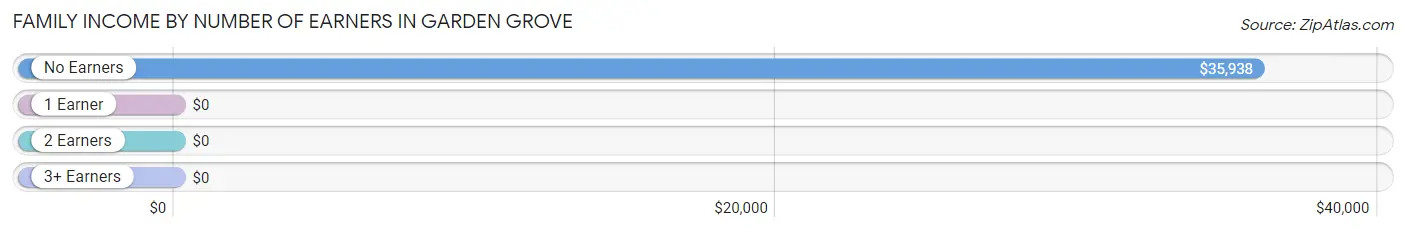
| Number of Earners | # Families | Median Income |
| No Earners | 53 (18.5%) | $35,938 |
| 1 Earner | 49 (17.1%) | $0 |
| 2 Earners | 168 (58.7%) | $0 |
| 3+ Earners | 16 (5.6%) | $0 |
| Total | 286 (100.0%) | $84,474 |
Household Income in Garden Grove
Household Income Brackets in Garden Grove
With 71 households falling in the category, the $200,000+ income range is the most frequent in Garden Grove, accounting for 19.7% of all households.
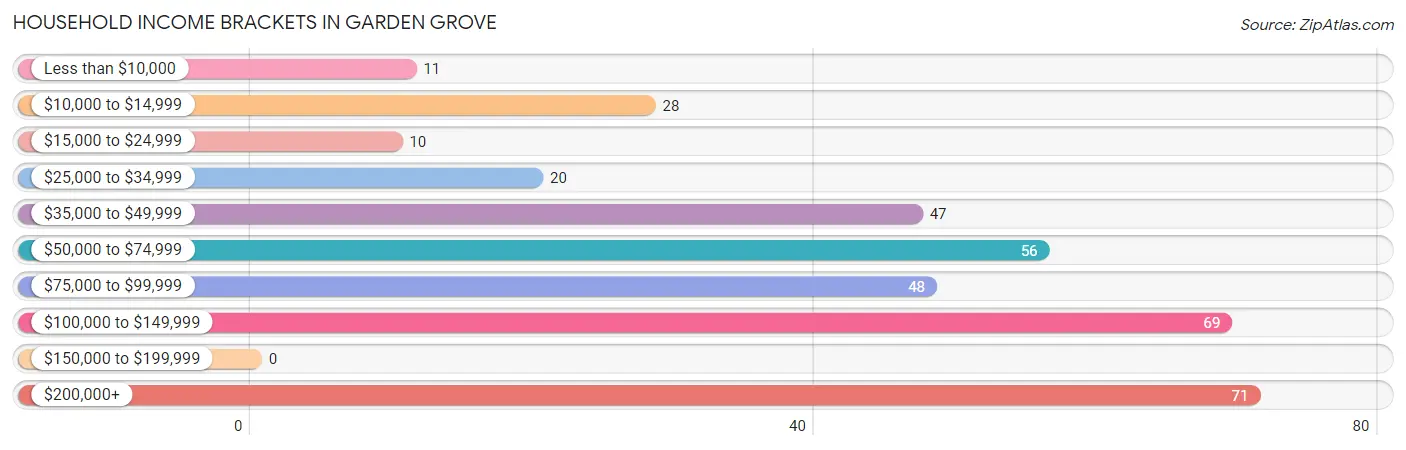
| Income Bracket | # Households | % Households |
| Less than $10,000 | 11 | 3.1% |
| $10,000 to $14,999 | 28 | 7.8% |
| $15,000 to $24,999 | 10 | 2.8% |
| $25,000 to $34,999 | 20 | 5.6% |
| $35,000 to $49,999 | 47 | 13.1% |
| $50,000 to $74,999 | 56 | 15.6% |
| $75,000 to $99,999 | 48 | 13.3% |
| $100,000 to $149,999 | 69 | 19.2% |
| $150,000 to $199,999 | 0 | 0.0% |
| $200,000+ | 71 | 19.7% |
Household Income by Householder Age in Garden Grove
The median household income in Garden Grove is $83,190, with the highest median household income of $84,474 found in the 25 to 44 years age bracket for the primary householder. A total of 126 households (35.0%) fall into this category.
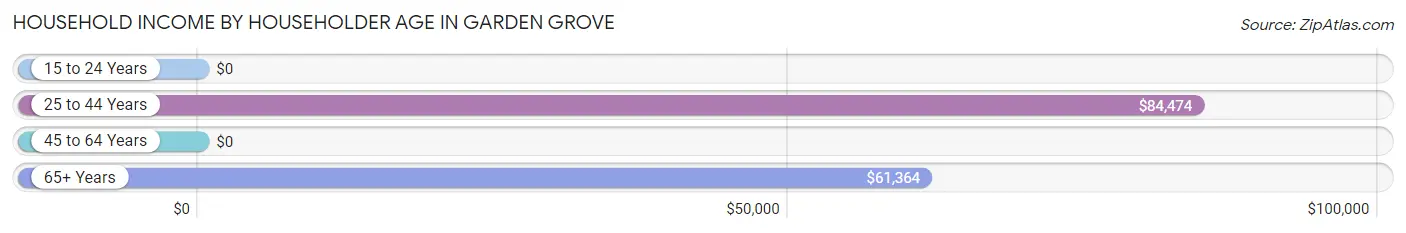
| Income Bracket | # Households | Median Income |
| 15 to 24 Years | 0 (0.0%) | $0 |
| 25 to 44 Years | 126 (35.0%) | $84,474 |
| 45 to 64 Years | 126 (35.0%) | $0 |
| 65+ Years | 108 (30.0%) | $61,364 |
| Total | 360 (100.0%) | $83,190 |
Poverty in Garden Grove
Income Below Poverty by Sex and Age in Garden Grove
With 18.7% poverty level for males and 19.5% for females among the residents of Garden Grove, 55 to 64 year old males and 12 to 14 year old females are the most vulnerable to poverty, with 39 males (88.6%) and 30 females (66.7%) in their respective age groups living below the poverty level.
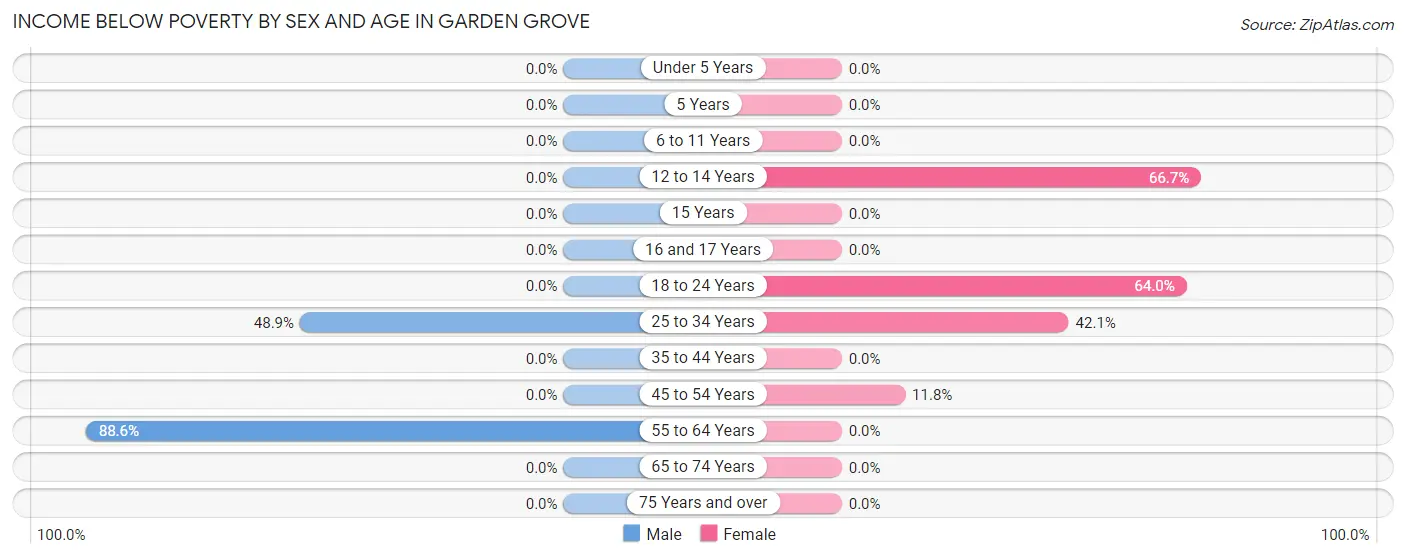
| Age Bracket | Male | Female |
| Under 5 Years | 0 (0.0%) | 0 (0.0%) |
| 5 Years | 0 (0.0%) | 0 (0.0%) |
| 6 to 11 Years | 0 (0.0%) | 0 (0.0%) |
| 12 to 14 Years | 0 (0.0%) | 30 (66.7%) |
| 15 Years | 0 (0.0%) | 0 (0.0%) |
| 16 and 17 Years | 0 (0.0%) | 0 (0.0%) |
| 18 to 24 Years | 0 (0.0%) | 16 (64.0%) |
| 25 to 34 Years | 45 (48.9%) | 48 (42.1%) |
| 35 to 44 Years | 0 (0.0%) | 0 (0.0%) |
| 45 to 54 Years | 0 (0.0%) | 8 (11.8%) |
| 55 to 64 Years | 39 (88.6%) | 0 (0.0%) |
| 65 to 74 Years | 0 (0.0%) | 0 (0.0%) |
| 75 Years and over | 0 (0.0%) | 0 (0.0%) |
| Total | 84 (18.7%) | 102 (19.5%) |
Income Above Poverty by Sex and Age in Garden Grove
According to the poverty statistics in Garden Grove, males aged 5 years and females aged 6 to 11 years are the age groups that are most secure financially, with 100.0% of males and 100.0% of females in these age groups living above the poverty line.
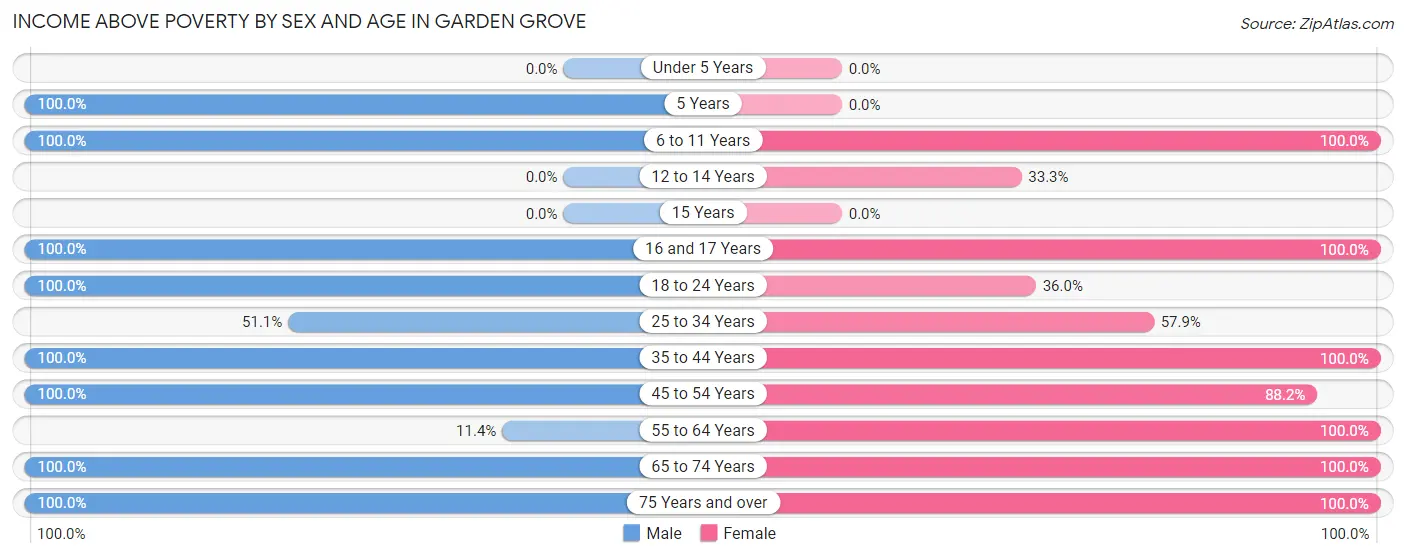
| Age Bracket | Male | Female |
| Under 5 Years | 0 (0.0%) | 0 (0.0%) |
| 5 Years | 7 (100.0%) | 0 (0.0%) |
| 6 to 11 Years | 56 (100.0%) | 14 (100.0%) |
| 12 to 14 Years | 0 (0.0%) | 15 (33.3%) |
| 15 Years | 0 (0.0%) | 0 (0.0%) |
| 16 and 17 Years | 3 (100.0%) | 28 (100.0%) |
| 18 to 24 Years | 13 (100.0%) | 9 (36.0%) |
| 25 to 34 Years | 47 (51.1%) | 66 (57.9%) |
| 35 to 44 Years | 71 (100.0%) | 97 (100.0%) |
| 45 to 54 Years | 60 (100.0%) | 60 (88.2%) |
| 55 to 64 Years | 5 (11.4%) | 25 (100.0%) |
| 65 to 74 Years | 72 (100.0%) | 75 (100.0%) |
| 75 Years and over | 32 (100.0%) | 33 (100.0%) |
| Total | 366 (81.3%) | 422 (80.5%) |
Income Below Poverty Among Married-Couple Families in Garden Grove
The poverty statistics for married-couple families in Garden Grove show that 5.6% or 11 of the total 198 families live below the poverty line. Families with no children have the highest poverty rate of 7.5%, comprising of 11 families. On the other hand, families with 1 or 2 children have the lowest poverty rate of 0.0%, which includes 0 families.
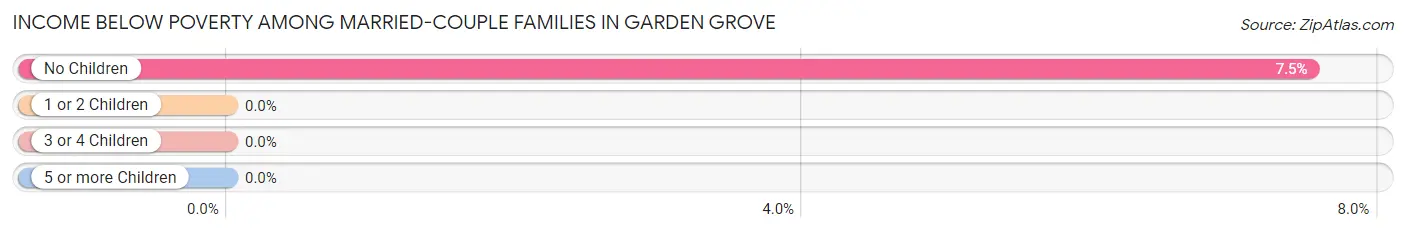
| Children | Above Poverty | Below Poverty |
| No Children | 135 (92.5%) | 11 (7.5%) |
| 1 or 2 Children | 52 (100.0%) | 0 (0.0%) |
| 3 or 4 Children | 0 (0.0%) | 0 (0.0%) |
| 5 or more Children | 0 (0.0%) | 0 (0.0%) |
| Total | 187 (94.4%) | 11 (5.6%) |
Income Below Poverty Among Single-Parent Households in Garden Grove
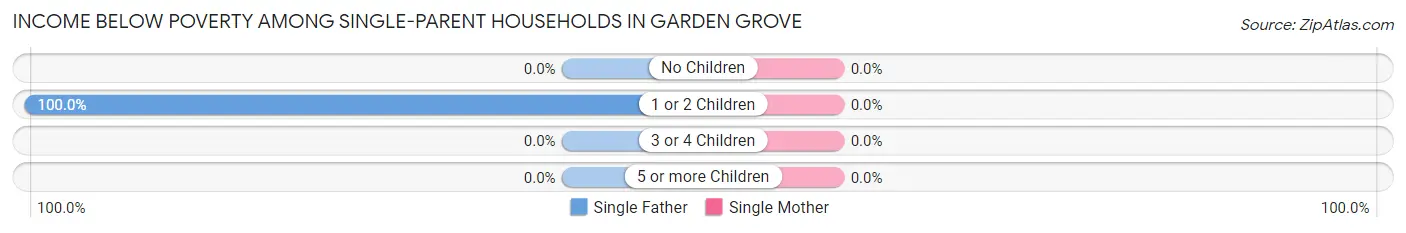
| Children | Single Father | Single Mother |
| No Children | 0 (0.0%) | 0 (0.0%) |
| 1 or 2 Children | 28 (100.0%) | 0 (0.0%) |
| 3 or 4 Children | 0 (0.0%) | 0 (0.0%) |
| 5 or more Children | 0 (0.0%) | 0 (0.0%) |
| Total | 28 (100.0%) | 0 (0.0%) |
Income Below Poverty Among Married-Couple vs Single-Parent Households in Garden Grove
The poverty data for Garden Grove shows that 11 of the married-couple family households (5.6%) and 28 of the single-parent households (31.8%) are living below the poverty level. Within the married-couple family households, those with no children have the highest poverty rate, with 11 households (7.5%) falling below the poverty line. Among the single-parent households, those with 1 or 2 children have the highest poverty rate, with 28 household (39.4%) living below poverty.
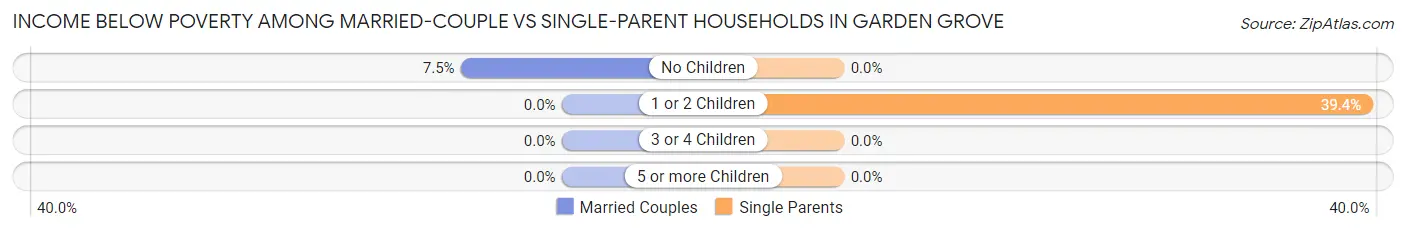
| Children | Married-Couple Families | Single-Parent Households |
| No Children | 11 (7.5%) | 0 (0.0%) |
| 1 or 2 Children | 0 (0.0%) | 28 (39.4%) |
| 3 or 4 Children | 0 (0.0%) | 0 (0.0%) |
| 5 or more Children | 0 (0.0%) | 0 (0.0%) |
| Total | 11 (5.6%) | 28 (31.8%) |
Race in Garden Grove
The most populous races in Garden Grove are White / Caucasian (819 | 79.1%), Some other Race (132 | 12.8%), and Black / African American (68 | 6.6%).
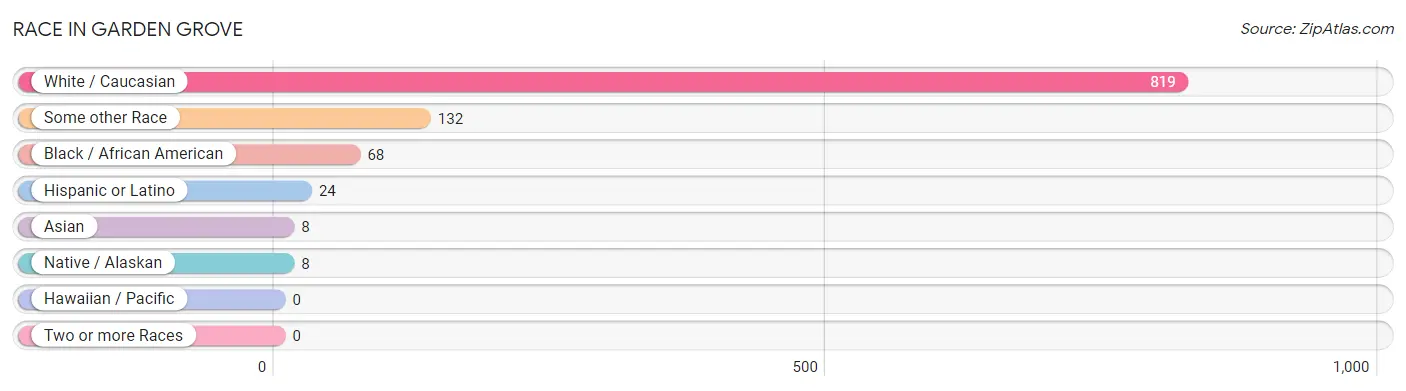
| Race | # Population | % Population |
| Asian | 8 | 0.8% |
| Black / African American | 68 | 6.6% |
| Hawaiian / Pacific | 0 | 0.0% |
| Hispanic or Latino | 24 | 2.3% |
| Native / Alaskan | 8 | 0.8% |
| White / Caucasian | 819 | 79.1% |
| Two or more Races | 0 | 0.0% |
| Some other Race | 132 | 12.8% |
| Total | 1,035 | 100.0% |
Ancestry in Garden Grove
The most populous ancestries reported in Garden Grove are American (264 | 25.5%), German (162 | 15.7%), Irish (149 | 14.4%), English (139 | 13.4%), and Polish (47 | 4.5%), together accounting for 73.5% of all Garden Grove residents.
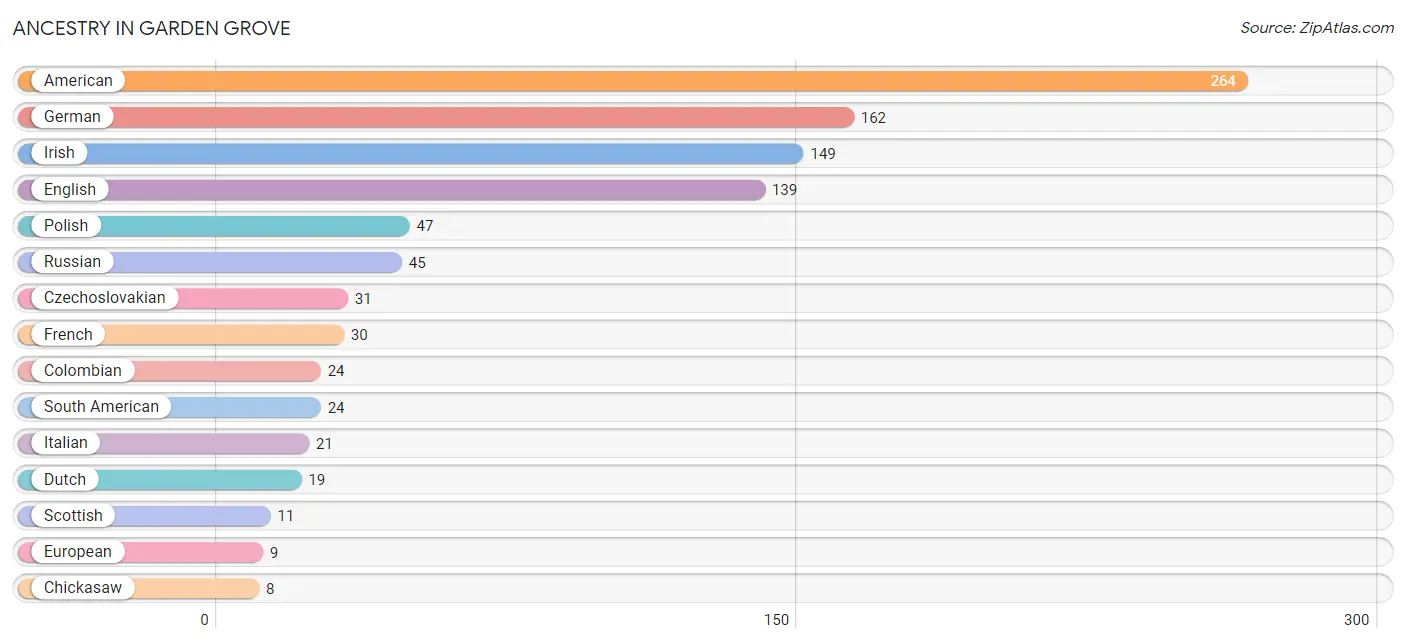
| Ancestry | # Population | % Population |
| American | 264 | 25.5% |
| Chickasaw | 8 | 0.8% |
| Colombian | 24 | 2.3% |
| Czechoslovakian | 31 | 3.0% |
| Dutch | 19 | 1.8% |
| English | 139 | 13.4% |
| European | 9 | 0.9% |
| French | 30 | 2.9% |
| German | 162 | 15.7% |
| Irish | 149 | 14.4% |
| Italian | 21 | 2.0% |
| Korean | 8 | 0.8% |
| Polish | 47 | 4.5% |
| Russian | 45 | 4.3% |
| Scottish | 11 | 1.1% |
| South American | 24 | 2.3% | View All 16 Rows |
Immigrants in Garden Grove
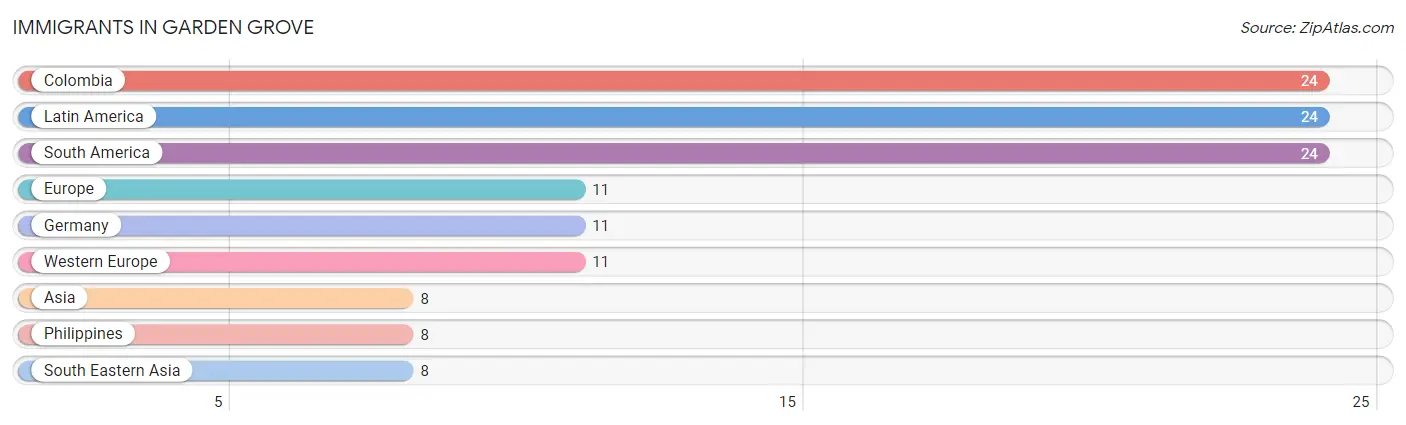
The most numerous immigrant groups reported in Garden Grove came from Colombia (24 | 2.3%), Latin America (24 | 2.3%), South America (24 | 2.3%), Europe (11 | 1.1%), and Germany (11 | 1.1%), together accounting for 9.1% of all Garden Grove residents.
| Immigration Origin | # Population | % Population |
| Asia | 8 | 0.8% |
| Colombia | 24 | 2.3% |
| Europe | 11 | 1.1% |
| Germany | 11 | 1.1% |
| Latin America | 24 | 2.3% |
| Philippines | 8 | 0.8% |
| South America | 24 | 2.3% |
| South Eastern Asia | 8 | 0.8% |
| Western Europe | 11 | 1.1% | View All 9 Rows |
Sex and Age in Garden Grove
Sex and Age in Garden Grove
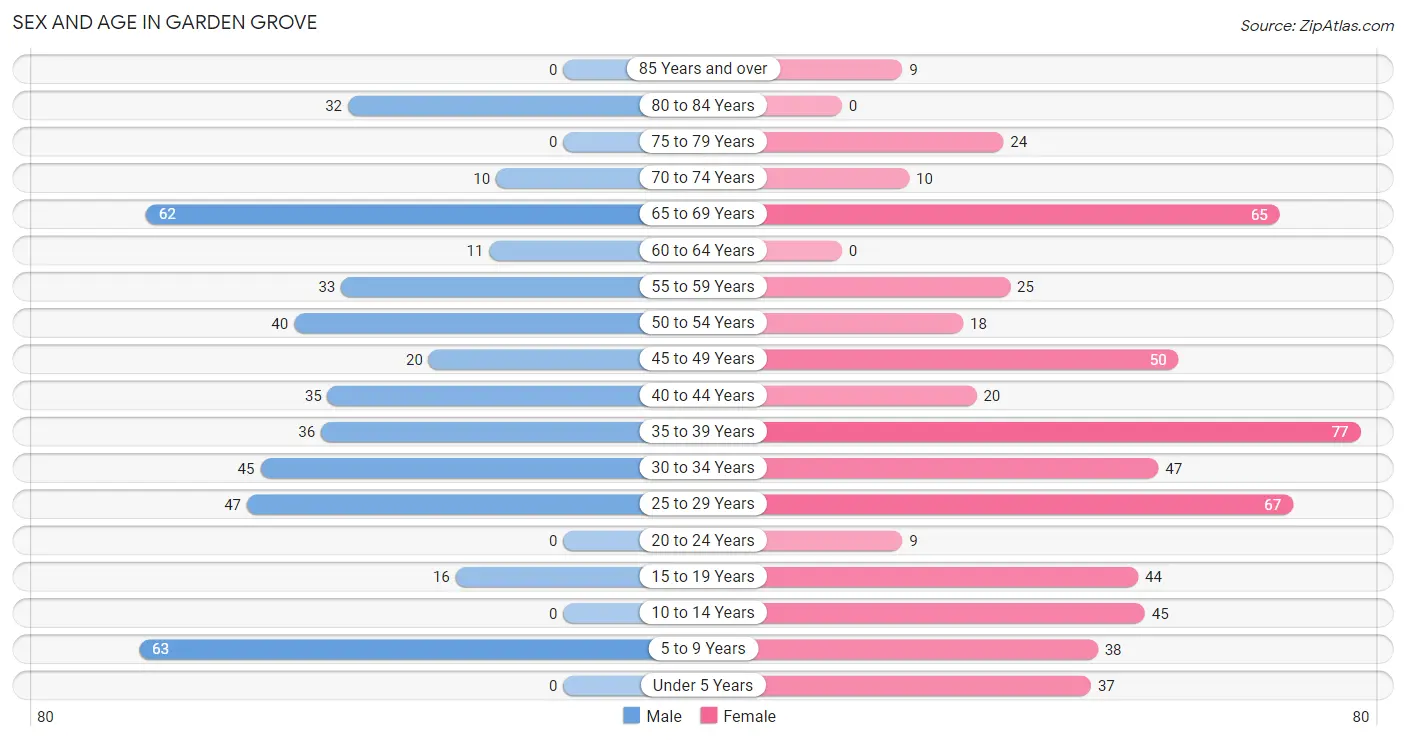
The most populous age groups in Garden Grove are 5 to 9 Years (63 | 14.0%) for men and 35 to 39 Years (77 | 13.2%) for women.
| Age Bracket | Male | Female |
| Under 5 Years | 0 (0.0%) | 37 (6.3%) |
| 5 to 9 Years | 63 (14.0%) | 38 (6.5%) |
| 10 to 14 Years | 0 (0.0%) | 45 (7.7%) |
| 15 to 19 Years | 16 (3.6%) | 44 (7.5%) |
| 20 to 24 Years | 0 (0.0%) | 9 (1.5%) |
| 25 to 29 Years | 47 (10.4%) | 67 (11.5%) |
| 30 to 34 Years | 45 (10.0%) | 47 (8.0%) |
| 35 to 39 Years | 36 (8.0%) | 77 (13.2%) |
| 40 to 44 Years | 35 (7.8%) | 20 (3.4%) |
| 45 to 49 Years | 20 (4.4%) | 50 (8.6%) |
| 50 to 54 Years | 40 (8.9%) | 18 (3.1%) |
| 55 to 59 Years | 33 (7.3%) | 25 (4.3%) |
| 60 to 64 Years | 11 (2.4%) | 0 (0.0%) |
| 65 to 69 Years | 62 (13.8%) | 65 (11.1%) |
| 70 to 74 Years | 10 (2.2%) | 10 (1.7%) |
| 75 to 79 Years | 0 (0.0%) | 24 (4.1%) |
| 80 to 84 Years | 32 (7.1%) | 0 (0.0%) |
| 85 Years and over | 0 (0.0%) | 9 (1.5%) |
| Total | 450 (100.0%) | 585 (100.0%) |
Families and Households in Garden Grove
Median Family Size in Garden Grove
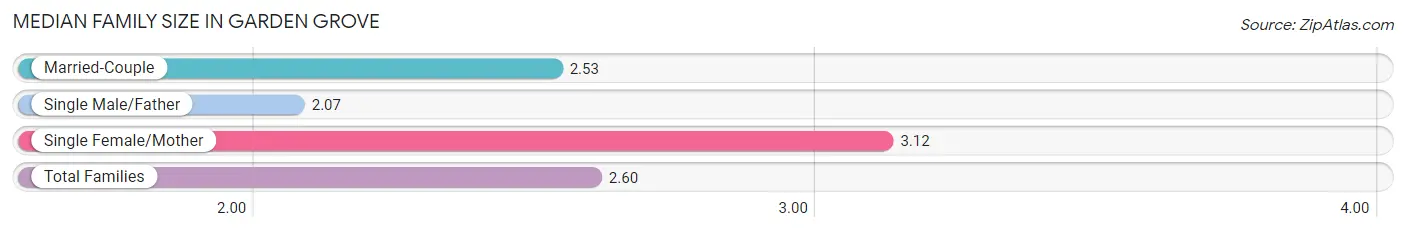
The median family size in Garden Grove is 2.60 persons per family, with single female/mother families (60 | 21.0%) accounting for the largest median family size of 3.12 persons per family. On the other hand, single male/father families (28 | 9.8%) represent the smallest median family size with 2.07 persons per family.
| Family Type | # Families | Family Size |
| Married-Couple | 198 (69.2%) | 2.53 |
| Single Male/Father | 28 (9.8%) | 2.07 |
| Single Female/Mother | 60 (21.0%) | 3.12 |
| Total Families | 286 (100.0%) | 2.60 |
Median Household Size in Garden Grove
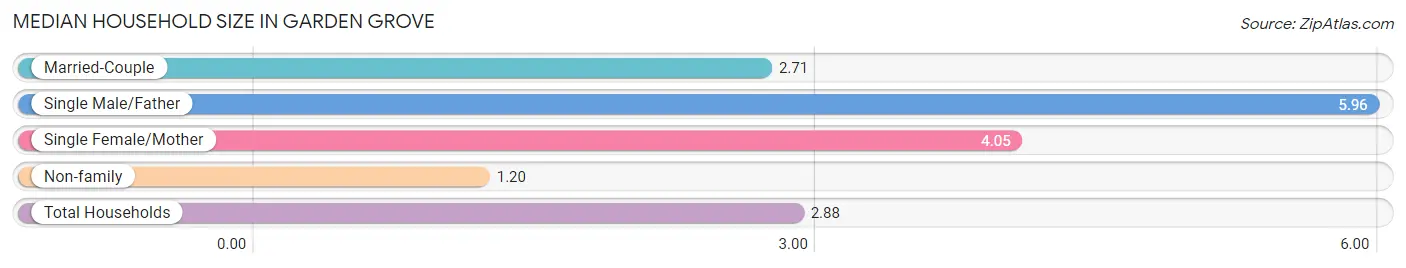
The median household size in Garden Grove is 2.88 persons per household, with single male/father households (28 | 7.8%) accounting for the largest median household size of 5.96 persons per household. non-family households (74 | 20.6%) represent the smallest median household size with 1.20 persons per household.
| Household Type | # Households | Household Size |
| Married-Couple | 198 (55.0%) | 2.71 |
| Single Male/Father | 28 (7.8%) | 5.96 |
| Single Female/Mother | 60 (16.7%) | 4.05 |
| Non-family | 74 (20.6%) | 1.20 |
| Total Households | 360 (100.0%) | 2.88 |
Household Size by Marriage Status in Garden Grove
Out of a total of 360 households in Garden Grove, 286 (79.4%) are family households, while 74 (20.6%) are nonfamily households. The most numerous type of family households are 2-person households, comprising 128, and the most common type of nonfamily households are 1-person households, comprising 62.
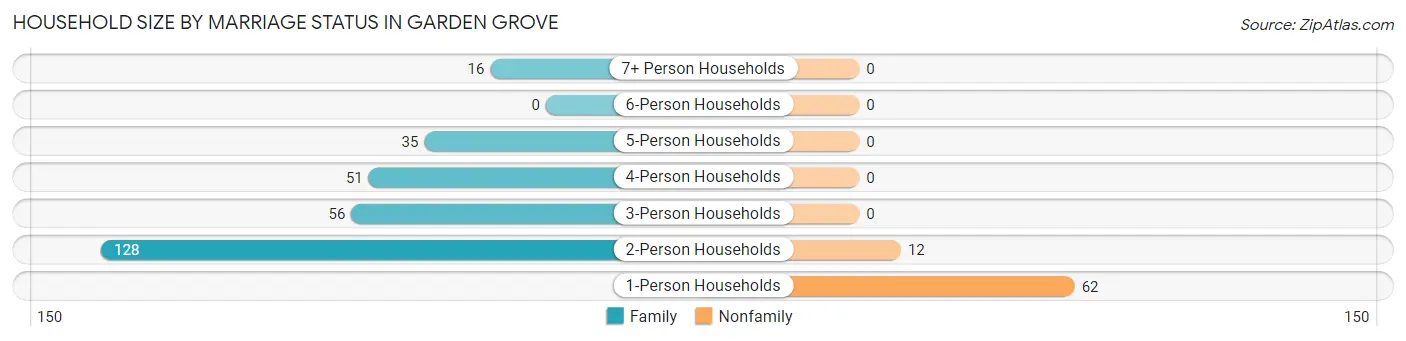
| Household Size | Family Households | Nonfamily Households |
| 1-Person Households | - | 62 (17.2%) |
| 2-Person Households | 128 (35.6%) | 12 (3.3%) |
| 3-Person Households | 56 (15.6%) | 0 (0.0%) |
| 4-Person Households | 51 (14.2%) | 0 (0.0%) |
| 5-Person Households | 35 (9.7%) | 0 (0.0%) |
| 6-Person Households | 0 (0.0%) | 0 (0.0%) |
| 7+ Person Households | 16 (4.4%) | 0 (0.0%) |
| Total | 286 (79.4%) | 74 (20.6%) |
Female Fertility in Garden Grove
Fertility by Age in Garden Grove
| Age Bracket | Women with Births | Births / 1,000 Women |
| 15 to 19 years | 0 (0.0%) | 0.0 |
| 20 to 34 years | 0 (0.0%) | 0.0 |
| 35 to 50 years | 0 (0.0%) | 0.0 |
| Total | 0 (0.0%) | 0.0 |
Fertility by Age by Marriage Status in Garden Grove
| Age Bracket | Married | Unmarried |
| 15 to 19 years | 0 (0.0%) | 0 (0.0%) |
| 20 to 34 years | 0 (0.0%) | 0 (0.0%) |
| 35 to 50 years | 0 (0.0%) | 0 (0.0%) |
| Total | 0 (0.0%) | 0 (0.0%) |
Fertility by Education in Garden Grove
| Educational Attainment | Women with Births | Births / 1,000 Women |
| Less than High School | 0 (0.0%) | 0.0 |
| High School Diploma | 0 (0.0%) | 0.0 |
| College or Associate's Degree | 0 (0.0%) | 0.0 |
| Bachelor's Degree | 0 (0.0%) | 0.0 |
| Graduate Degree | 0 (0.0%) | 0.0 |
| Total | 0 (0.0%) | 0.0 |
Fertility by Education by Marriage Status in Garden Grove
| Educational Attainment | Married | Unmarried |
| Less than High School | 0 (0.0%) | 0 (0.0%) |
| High School Diploma | 0 (0.0%) | 0 (0.0%) |
| College or Associate's Degree | 0 (0.0%) | 0 (0.0%) |
| Bachelor's Degree | 0 (0.0%) | 0 (0.0%) |
| Graduate Degree | 0 (0.0%) | 0 (0.0%) |
| Total | 0 (0.0%) | 0 (0.0%) |
Employment Characteristics in Garden Grove
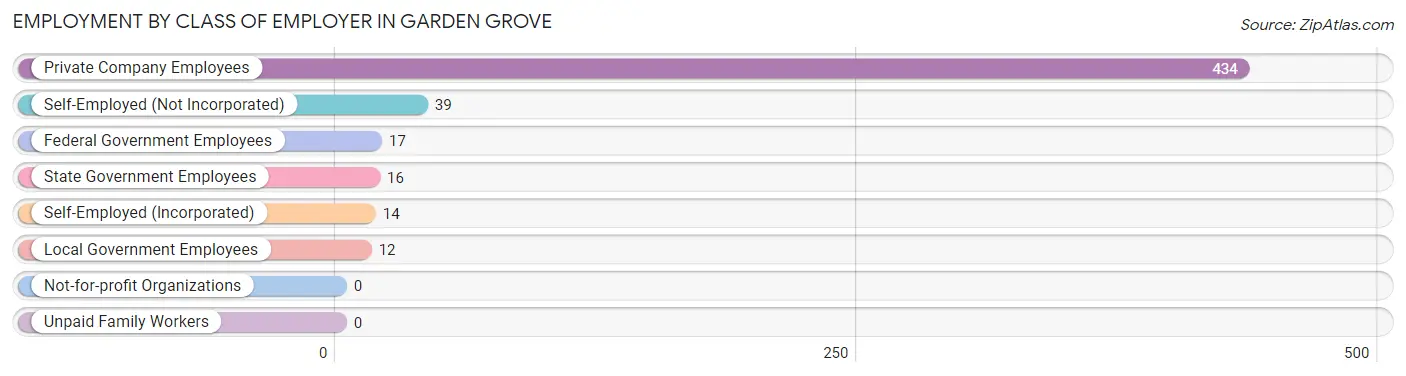
Employment by Class of Employer in Garden Grove
Among the 532 employed individuals in Garden Grove, private company employees (434 | 81.6%), self-employed (not incorporated) (39 | 7.3%), and federal government employees (17 | 3.2%) make up the most common classes of employment.
| Employer Class | # Employees | % Employees |
| Private Company Employees | 434 | 81.6% |
| Self-Employed (Incorporated) | 14 | 2.6% |
| Self-Employed (Not Incorporated) | 39 | 7.3% |
| Not-for-profit Organizations | 0 | 0.0% |
| Local Government Employees | 12 | 2.3% |
| State Government Employees | 16 | 3.0% |
| Federal Government Employees | 17 | 3.2% |
| Unpaid Family Workers | 0 | 0.0% |
| Total | 532 | 100.0% |
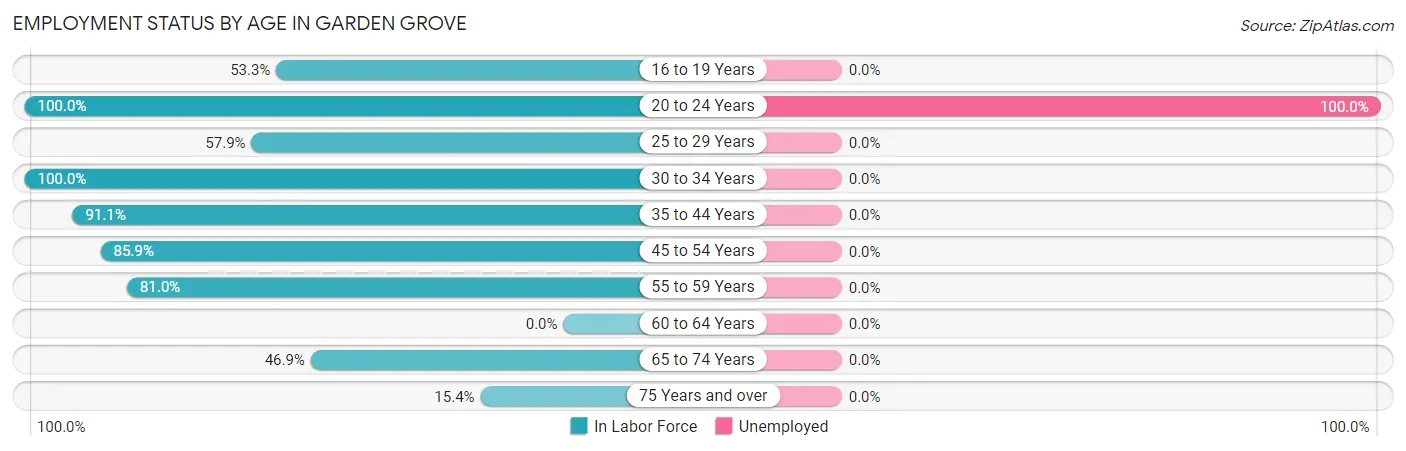
Employment Status by Age in Garden Grove
According to the labor force statistics for Garden Grove, out of the total population over 16 years of age (852), 69.0% or 588 individuals are in the labor force, with 1.5% or 9 of them unemployed. The age group with the highest labor force participation rate is 20 to 24 years, with 100.0% or 9 individuals in the labor force. Within the labor force, the 20 to 24 years age range has the highest percentage of unemployed individuals, with 100.0% or 9 of them being unemployed.
| Age Bracket | In Labor Force | Unemployed |
| 16 to 19 Years | 32 (53.3%) | 0 (0.0%) |
| 20 to 24 Years | 9 (100.0%) | 9 (100.0%) |
| 25 to 29 Years | 66 (57.9%) | 0 (0.0%) |
| 30 to 34 Years | 92 (100.0%) | 0 (0.0%) |
| 35 to 44 Years | 153 (91.1%) | 0 (0.0%) |
| 45 to 54 Years | 110 (85.9%) | 0 (0.0%) |
| 55 to 59 Years | 47 (81.0%) | 0 (0.0%) |
| 60 to 64 Years | 0 (0.0%) | 0 (0.0%) |
| 65 to 74 Years | 69 (46.9%) | 0 (0.0%) |
| 75 Years and over | 10 (15.4%) | 0 (0.0%) |
| Total | 588 (69.0%) | 9 (1.5%) |
Employment Status by Educational Attainment in Garden Grove
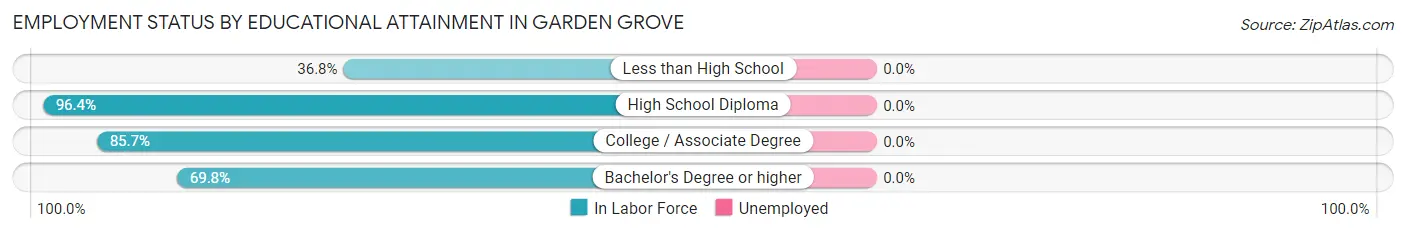
| Educational Attainment | In Labor Force | Unemployed |
| Less than High School | 28 (36.8%) | 0 (0.0%) |
| High School Diploma | 266 (96.4%) | 0 (0.0%) |
| College / Associate Degree | 114 (85.7%) | 0 (0.0%) |
| Bachelor's Degree or higher | 60 (69.8%) | 0 (0.0%) |
| Total | 468 (82.0%) | 0 (0.0%) |
Employment Occupations by Sex in Garden Grove
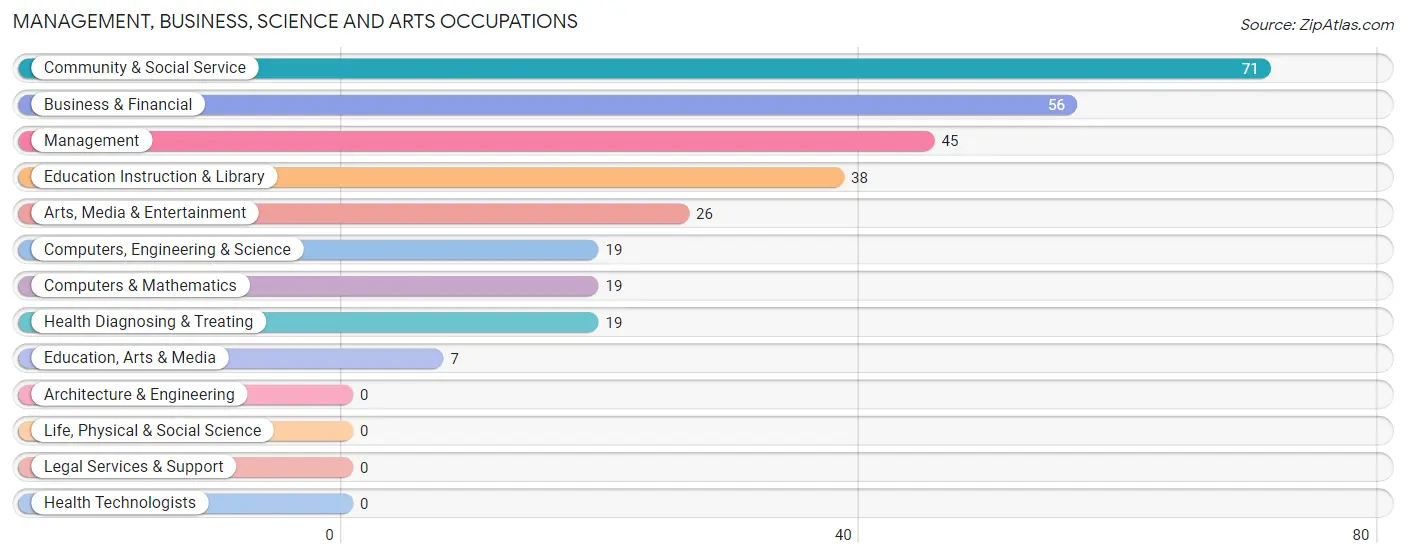
Management, Business, Science and Arts Occupations
The most common Management, Business, Science and Arts occupations in Garden Grove are Community & Social Service (71 | 12.3%), Business & Financial (56 | 9.7%), Management (45 | 7.8%), Education Instruction & Library (38 | 6.6%), and Arts, Media & Entertainment (26 | 4.5%).
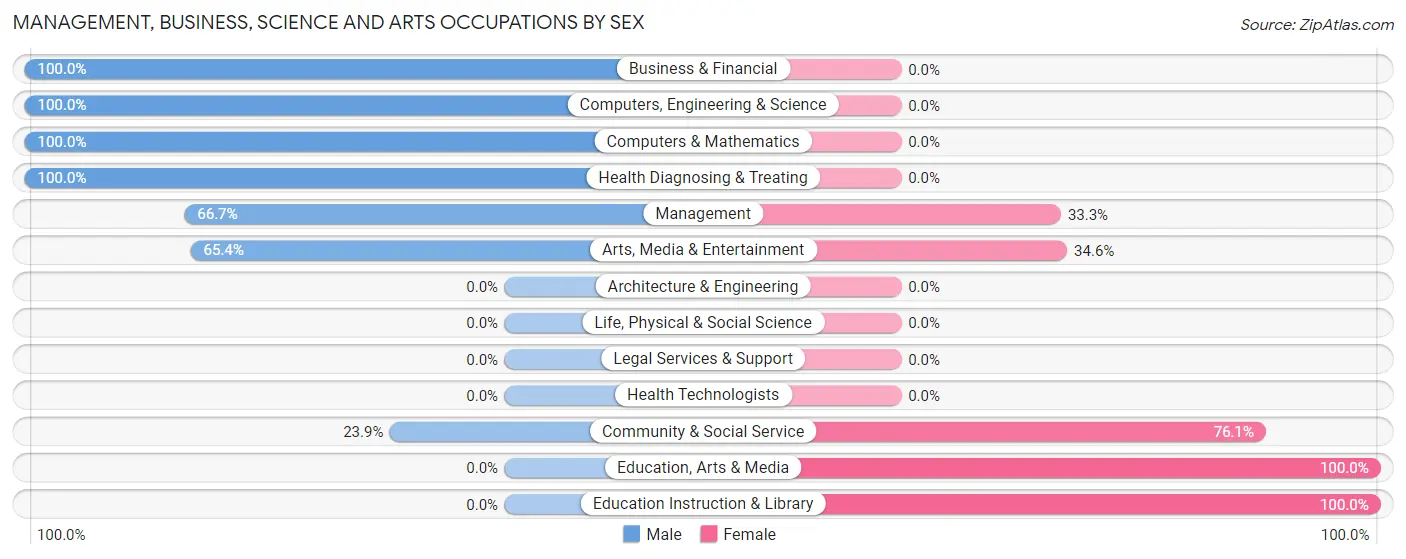
Management, Business, Science and Arts Occupations by Sex
Within the Management, Business, Science and Arts occupations in Garden Grove, the most male-oriented occupations are Business & Financial (100.0%), Computers, Engineering & Science (100.0%), and Computers & Mathematics (100.0%), while the most female-oriented occupations are Education, Arts & Media (100.0%), Education Instruction & Library (100.0%), and Community & Social Service (76.1%).
| Occupation | Male | Female |
| Management | 30 (66.7%) | 15 (33.3%) |
| Business & Financial | 56 (100.0%) | 0 (0.0%) |
| Computers, Engineering & Science | 19 (100.0%) | 0 (0.0%) |
| Computers & Mathematics | 19 (100.0%) | 0 (0.0%) |
| Architecture & Engineering | 0 (0.0%) | 0 (0.0%) |
| Life, Physical & Social Science | 0 (0.0%) | 0 (0.0%) |
| Community & Social Service | 17 (23.9%) | 54 (76.1%) |
| Education, Arts & Media | 0 (0.0%) | 7 (100.0%) |
| Legal Services & Support | 0 (0.0%) | 0 (0.0%) |
| Education Instruction & Library | 0 (0.0%) | 38 (100.0%) |
| Arts, Media & Entertainment | 17 (65.4%) | 9 (34.6%) |
| Health Diagnosing & Treating | 19 (100.0%) | 0 (0.0%) |
| Health Technologists | 0 (0.0%) | 0 (0.0%) |
| Total (Category) | 141 (67.1%) | 69 (32.9%) |
| Total (Overall) | 313 (54.1%) | 266 (45.9%) |
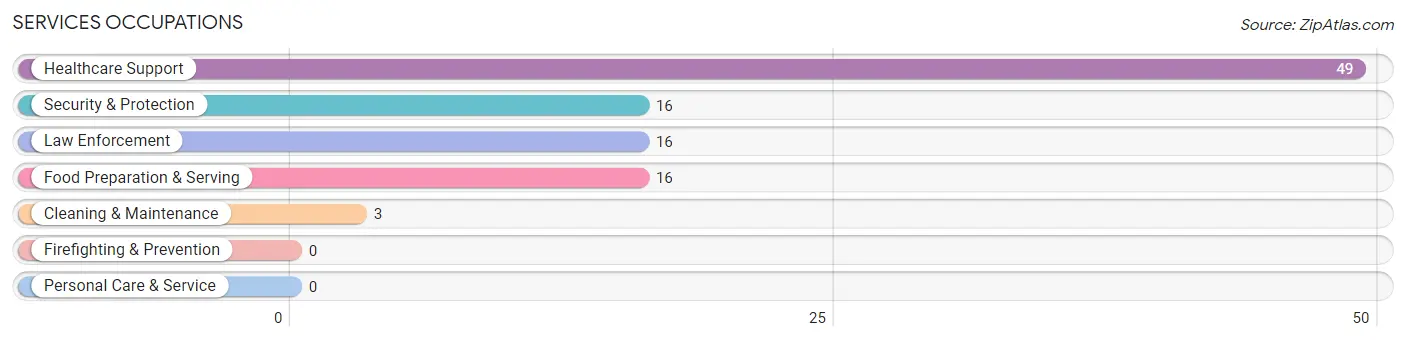
Services Occupations
The most common Services occupations in Garden Grove are Healthcare Support (49 | 8.5%), Security & Protection (16 | 2.8%), Law Enforcement (16 | 2.8%), Food Preparation & Serving (16 | 2.8%), and Cleaning & Maintenance (3 | 0.5%).
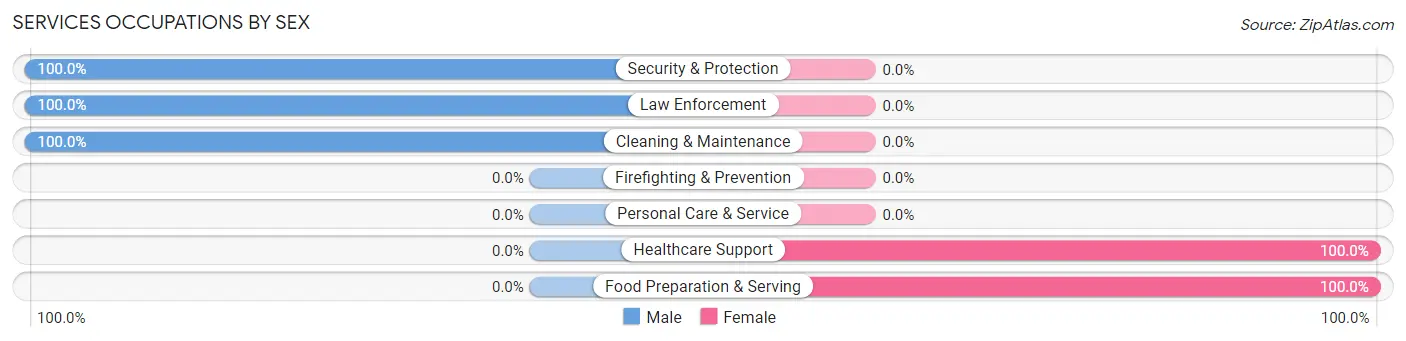
Services Occupations by Sex
Within the Services occupations in Garden Grove, the most male-oriented occupations are Security & Protection (100.0%), Law Enforcement (100.0%), and Cleaning & Maintenance (100.0%), while the most female-oriented occupations are Healthcare Support (100.0%), and Food Preparation & Serving (100.0%).
| Occupation | Male | Female |
| Healthcare Support | 0 (0.0%) | 49 (100.0%) |
| Security & Protection | 16 (100.0%) | 0 (0.0%) |
| Firefighting & Prevention | 0 (0.0%) | 0 (0.0%) |
| Law Enforcement | 16 (100.0%) | 0 (0.0%) |
| Food Preparation & Serving | 0 (0.0%) | 16 (100.0%) |
| Cleaning & Maintenance | 3 (100.0%) | 0 (0.0%) |
| Personal Care & Service | 0 (0.0%) | 0 (0.0%) |
| Total (Category) | 19 (22.6%) | 65 (77.4%) |
| Total (Overall) | 313 (54.1%) | 266 (45.9%) |
Sales and Office Occupations
The most common Sales and Office occupations in Garden Grove are Sales & Related (109 | 18.8%), and Office & Administration (30 | 5.2%).
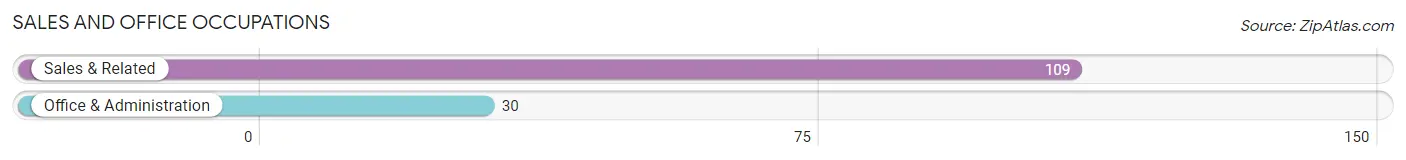
Sales and Office Occupations by Sex
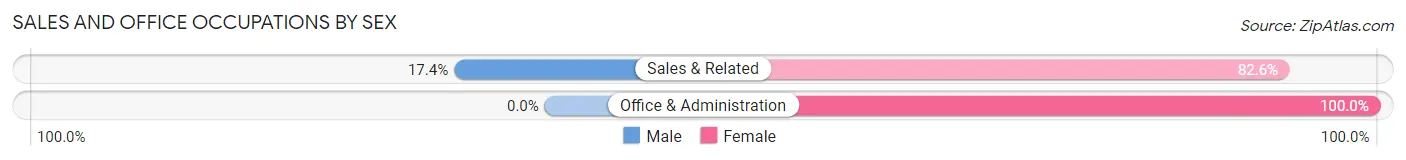
| Occupation | Male | Female |
| Sales & Related | 19 (17.4%) | 90 (82.6%) |
| Office & Administration | 0 (0.0%) | 30 (100.0%) |
| Total (Category) | 19 (13.7%) | 120 (86.3%) |
| Total (Overall) | 313 (54.1%) | 266 (45.9%) |
Natural Resources, Construction and Maintenance Occupations
The most common Natural Resources, Construction and Maintenance occupations in Garden Grove are Installation, Maintenance & Repair (55 | 9.5%), Construction & Extraction (45 | 7.8%), and Farming, Fishing & Forestry (13 | 2.2%).
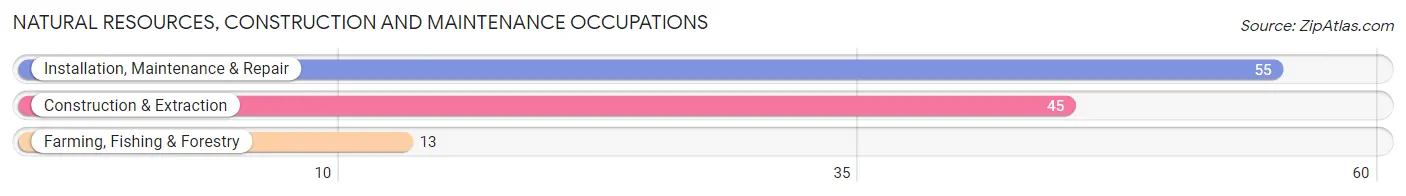
Natural Resources, Construction and Maintenance Occupations by Sex
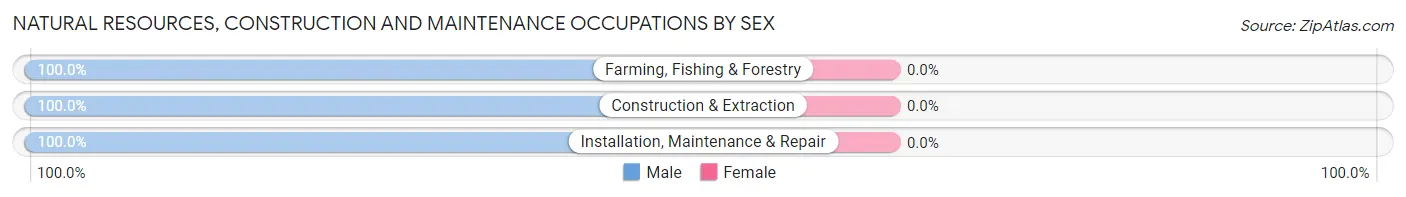
| Occupation | Male | Female |
| Farming, Fishing & Forestry | 13 (100.0%) | 0 (0.0%) |
| Construction & Extraction | 45 (100.0%) | 0 (0.0%) |
| Installation, Maintenance & Repair | 55 (100.0%) | 0 (0.0%) |
| Total (Category) | 113 (100.0%) | 0 (0.0%) |
| Total (Overall) | 313 (54.1%) | 266 (45.9%) |
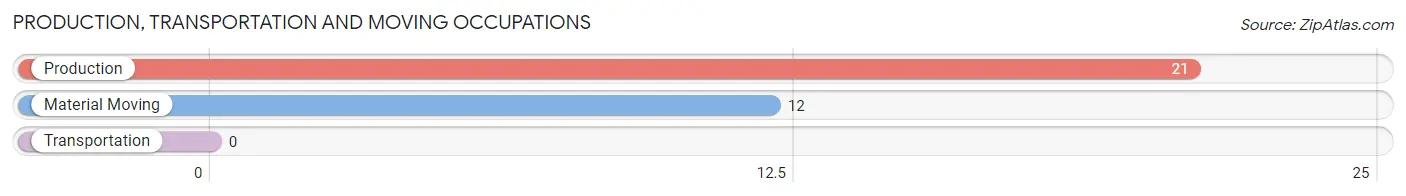
Production, Transportation and Moving Occupations
The most common Production, Transportation and Moving occupations in Garden Grove are Production (21 | 3.6%), and Material Moving (12 | 2.1%).
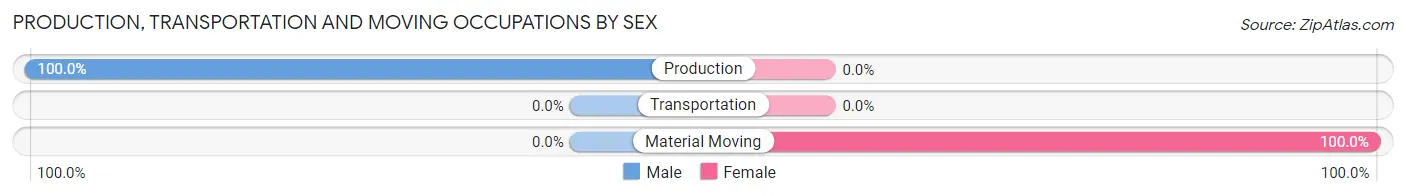
Production, Transportation and Moving Occupations by Sex
| Occupation | Male | Female |
| Production | 21 (100.0%) | 0 (0.0%) |
| Transportation | 0 (0.0%) | 0 (0.0%) |
| Material Moving | 0 (0.0%) | 12 (100.0%) |
| Total (Category) | 21 (63.6%) | 12 (36.4%) |
| Total (Overall) | 313 (54.1%) | 266 (45.9%) |
Employment Industries by Sex in Garden Grove
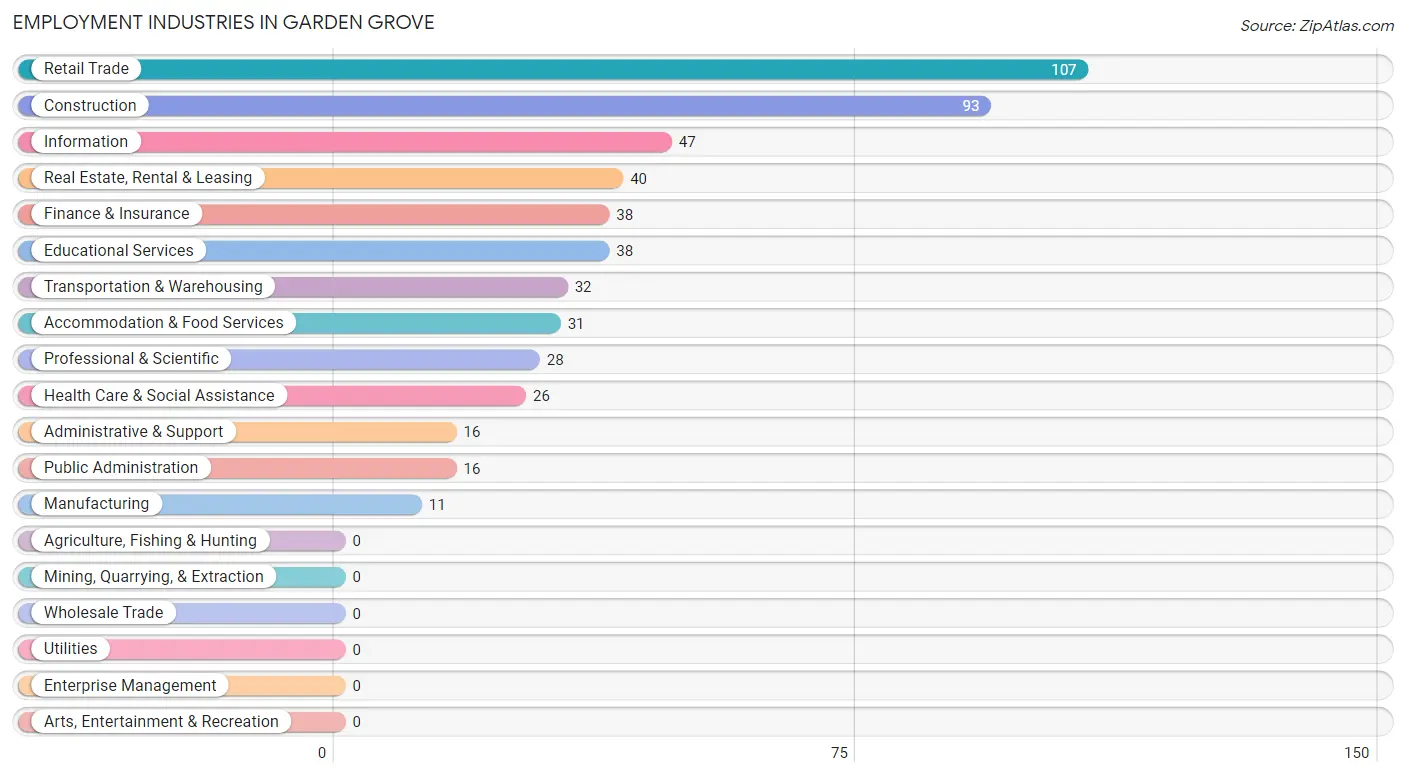
Employment Industries in Garden Grove
The major employment industries in Garden Grove include Retail Trade (107 | 18.5%), Construction (93 | 16.1%), Information (47 | 8.1%), Real Estate, Rental & Leasing (40 | 6.9%), and Finance & Insurance (38 | 6.6%).
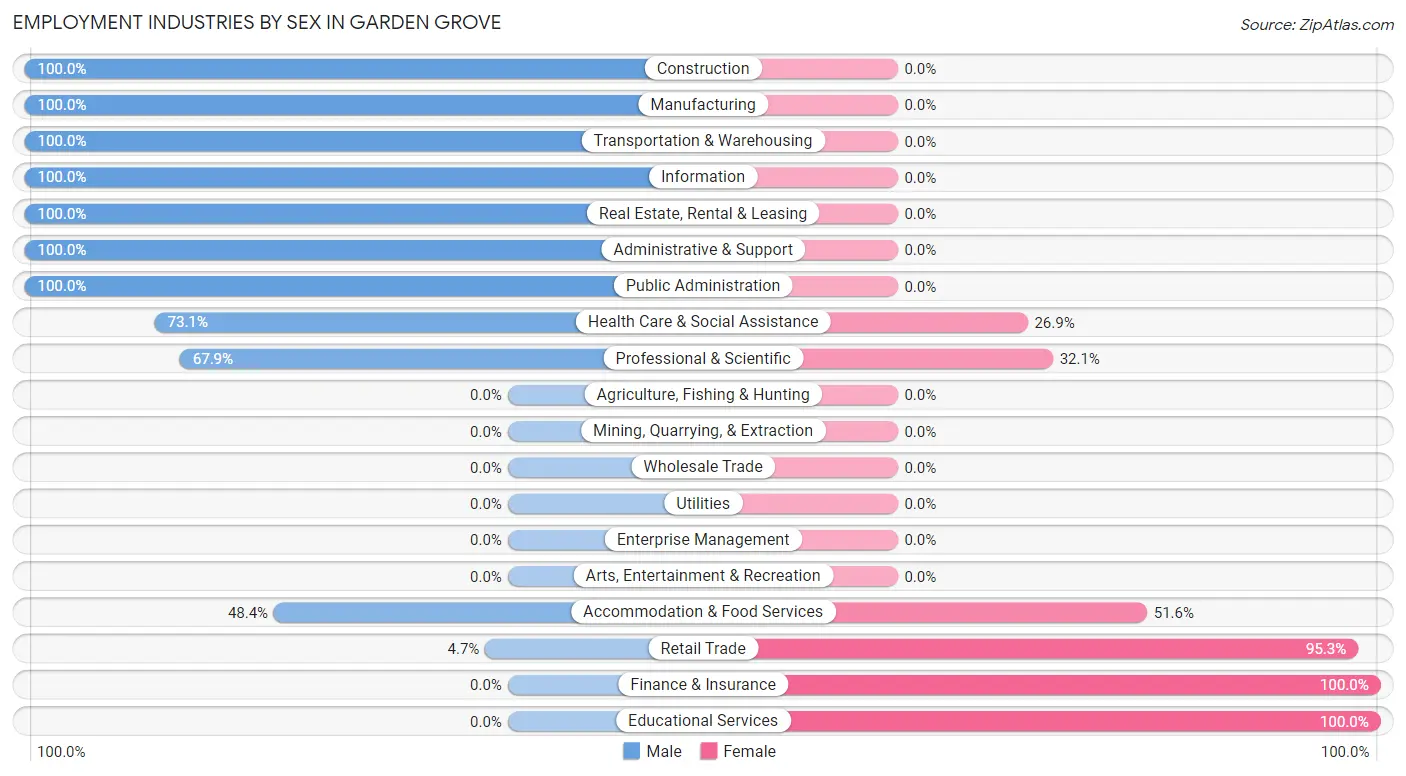
Employment Industries by Sex in Garden Grove
The Garden Grove industries that see more men than women are Construction (100.0%), Manufacturing (100.0%), and Transportation & Warehousing (100.0%), whereas the industries that tend to have a higher number of women are Finance & Insurance (100.0%), Educational Services (100.0%), and Retail Trade (95.3%).
| Industry | Male | Female |
| Agriculture, Fishing & Hunting | 0 (0.0%) | 0 (0.0%) |
| Mining, Quarrying, & Extraction | 0 (0.0%) | 0 (0.0%) |
| Construction | 93 (100.0%) | 0 (0.0%) |
| Manufacturing | 11 (100.0%) | 0 (0.0%) |
| Wholesale Trade | 0 (0.0%) | 0 (0.0%) |
| Retail Trade | 5 (4.7%) | 102 (95.3%) |
| Transportation & Warehousing | 32 (100.0%) | 0 (0.0%) |
| Utilities | 0 (0.0%) | 0 (0.0%) |
| Information | 47 (100.0%) | 0 (0.0%) |
| Finance & Insurance | 0 (0.0%) | 38 (100.0%) |
| Real Estate, Rental & Leasing | 40 (100.0%) | 0 (0.0%) |
| Professional & Scientific | 19 (67.9%) | 9 (32.1%) |
| Enterprise Management | 0 (0.0%) | 0 (0.0%) |
| Administrative & Support | 16 (100.0%) | 0 (0.0%) |
| Educational Services | 0 (0.0%) | 38 (100.0%) |
| Health Care & Social Assistance | 19 (73.1%) | 7 (26.9%) |
| Arts, Entertainment & Recreation | 0 (0.0%) | 0 (0.0%) |
| Accommodation & Food Services | 15 (48.4%) | 16 (51.6%) |
| Public Administration | 16 (100.0%) | 0 (0.0%) |
| Total | 313 (54.1%) | 266 (45.9%) |
Education in Garden Grove
School Enrollment in Garden Grove
The most common levels of schooling among the 210 students in Garden Grove are elementary school (94 | 44.8%), middle school (45 | 21.4%), and college / undergraduate (33 | 15.7%).
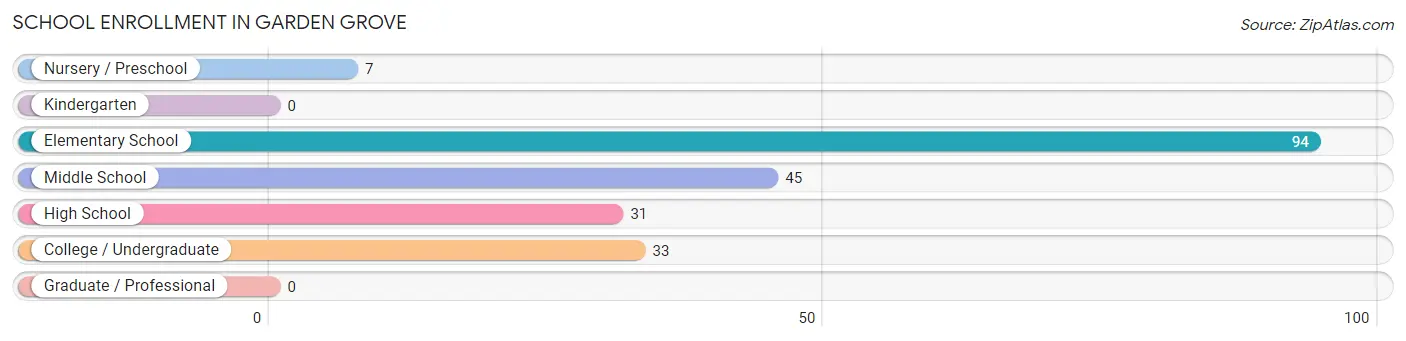
| School Level | # Students | % Students |
| Nursery / Preschool | 7 | 3.3% |
| Kindergarten | 0 | 0.0% |
| Elementary School | 94 | 44.8% |
| Middle School | 45 | 21.4% |
| High School | 31 | 14.8% |
| College / Undergraduate | 33 | 15.7% |
| Graduate / Professional | 0 | 0.0% |
| Total | 210 | 100.0% |
School Enrollment by Age by Funding Source in Garden Grove
Out of a total of 210 students who are enrolled in schools in Garden Grove, 22 (10.5%) attend a private institution, while the remaining 188 (89.5%) are enrolled in public schools. The age group of 35 years and over has the highest likelihood of being enrolled in private schools, with 19 (57.6% in the age bracket) enrolled. Conversely, the age group of 5 to 9 year old has the lowest likelihood of being enrolled in a private school, with 101 (100.0% in the age bracket) attending a public institution.
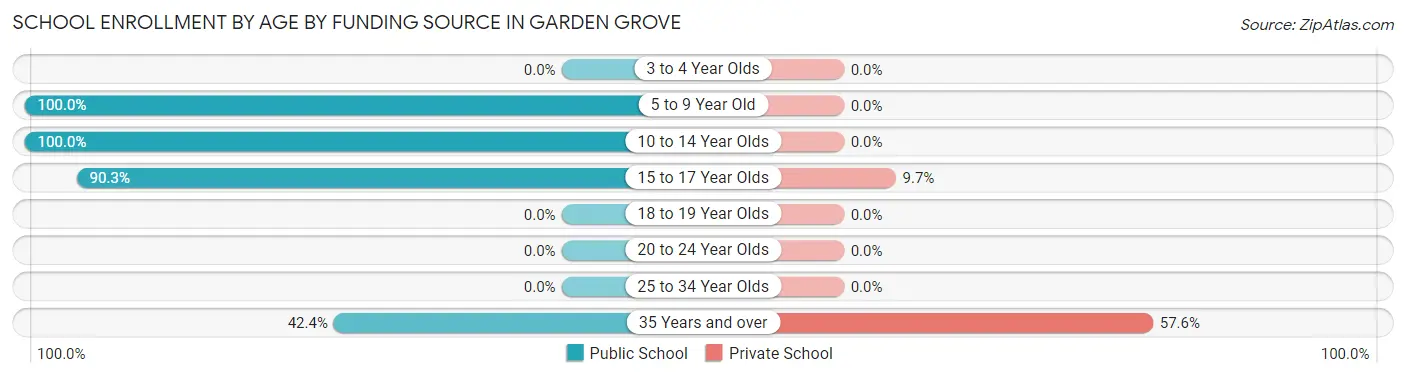
| Age Bracket | Public School | Private School |
| 3 to 4 Year Olds | 0 (0.0%) | 0 (0.0%) |
| 5 to 9 Year Old | 101 (100.0%) | 0 (0.0%) |
| 10 to 14 Year Olds | 45 (100.0%) | 0 (0.0%) |
| 15 to 17 Year Olds | 28 (90.3%) | 3 (9.7%) |
| 18 to 19 Year Olds | 0 (0.0%) | 0 (0.0%) |
| 20 to 24 Year Olds | 0 (0.0%) | 0 (0.0%) |
| 25 to 34 Year Olds | 0 (0.0%) | 0 (0.0%) |
| 35 Years and over | 14 (42.4%) | 19 (57.6%) |
| Total | 188 (89.5%) | 22 (10.5%) |
Educational Attainment by Field of Study in Garden Grove
Science & technology (54 | 31.2%), business (50 | 28.9%), liberal arts & history (26 | 15.0%), psychology (14 | 8.1%), and engineering (12 | 6.9%) are the most common fields of study among 173 individuals in Garden Grove who have obtained a bachelor's degree or higher.
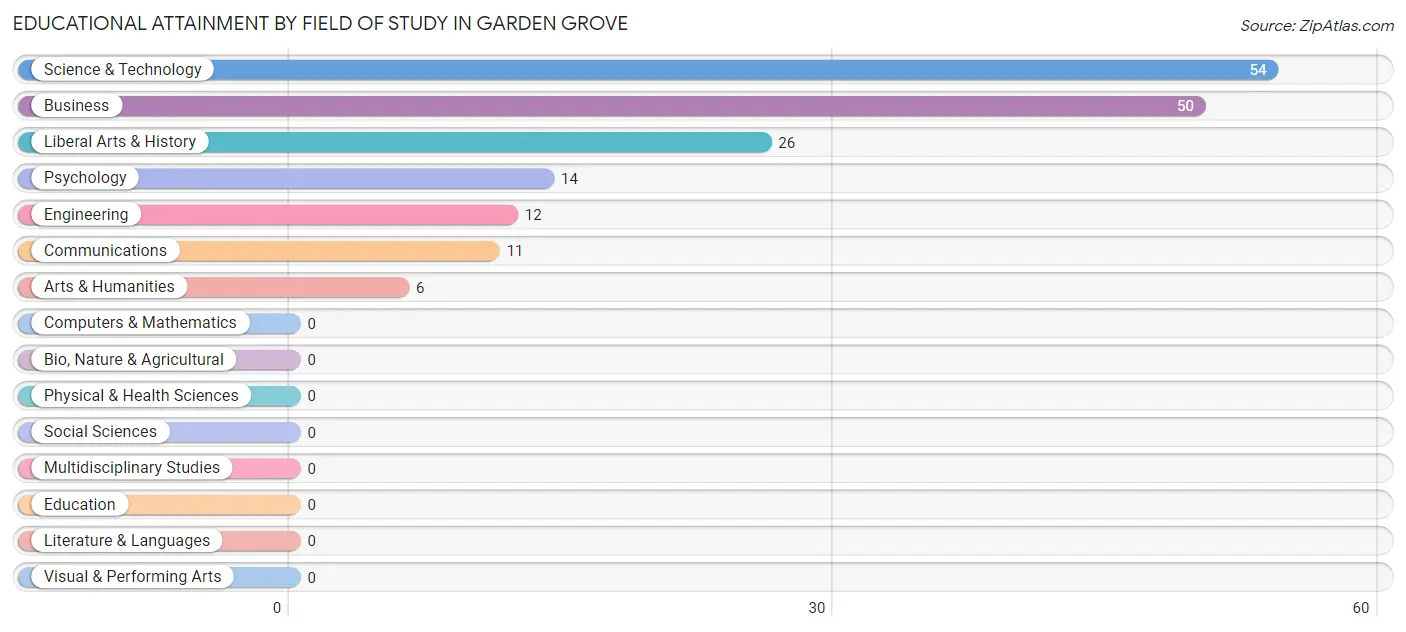
| Field of Study | # Graduates | % Graduates |
| Computers & Mathematics | 0 | 0.0% |
| Bio, Nature & Agricultural | 0 | 0.0% |
| Physical & Health Sciences | 0 | 0.0% |
| Psychology | 14 | 8.1% |
| Social Sciences | 0 | 0.0% |
| Engineering | 12 | 6.9% |
| Multidisciplinary Studies | 0 | 0.0% |
| Science & Technology | 54 | 31.2% |
| Business | 50 | 28.9% |
| Education | 0 | 0.0% |
| Literature & Languages | 0 | 0.0% |
| Liberal Arts & History | 26 | 15.0% |
| Visual & Performing Arts | 0 | 0.0% |
| Communications | 11 | 6.4% |
| Arts & Humanities | 6 | 3.5% |
| Total | 173 | 100.0% |
Transportation & Commute in Garden Grove
Vehicle Availability by Sex in Garden Grove
The most prevalent vehicle ownership categories in Garden Grove are males with 2 vehicles (157, accounting for 50.2%) and females with 2 vehicles (145, making up 71.7%).
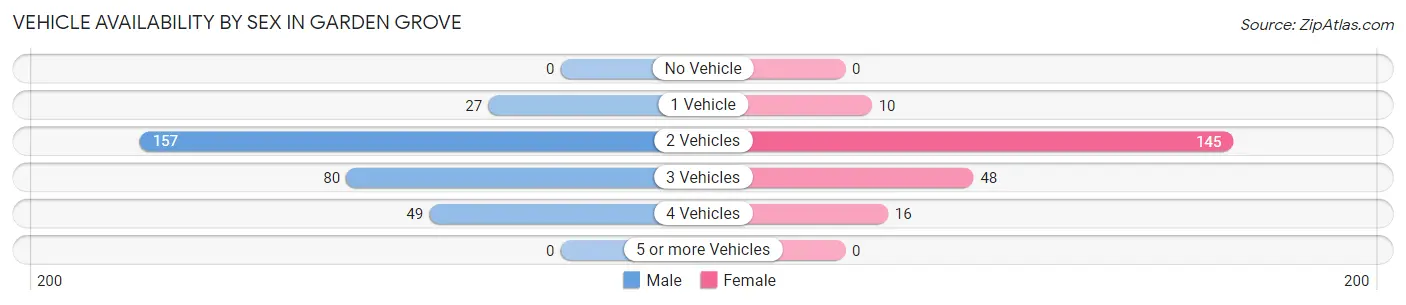
| Vehicles Available | Male | Female |
| No Vehicle | 0 (0.0%) | 0 (0.0%) |
| 1 Vehicle | 27 (8.6%) | 10 (4.6%) |
| 2 Vehicles | 157 (50.2%) | 145 (66.2%) |
| 3 Vehicles | 80 (25.6%) | 48 (21.9%) |
| 4 Vehicles | 49 (15.7%) | 16 (7.3%) |
| 5 or more Vehicles | 0 (0.0%) | 0 (0.0%) |
| Total | 313 (100.0%) | 219 (100.0%) |
Commute Time in Garden Grove
The most frequently occuring commute durations in Garden Grove are 60 to 89 minutes (75 commuters, 15.2%), 15 to 19 minutes (72 commuters, 14.6%), and 20 to 24 minutes (67 commuters, 13.6%).
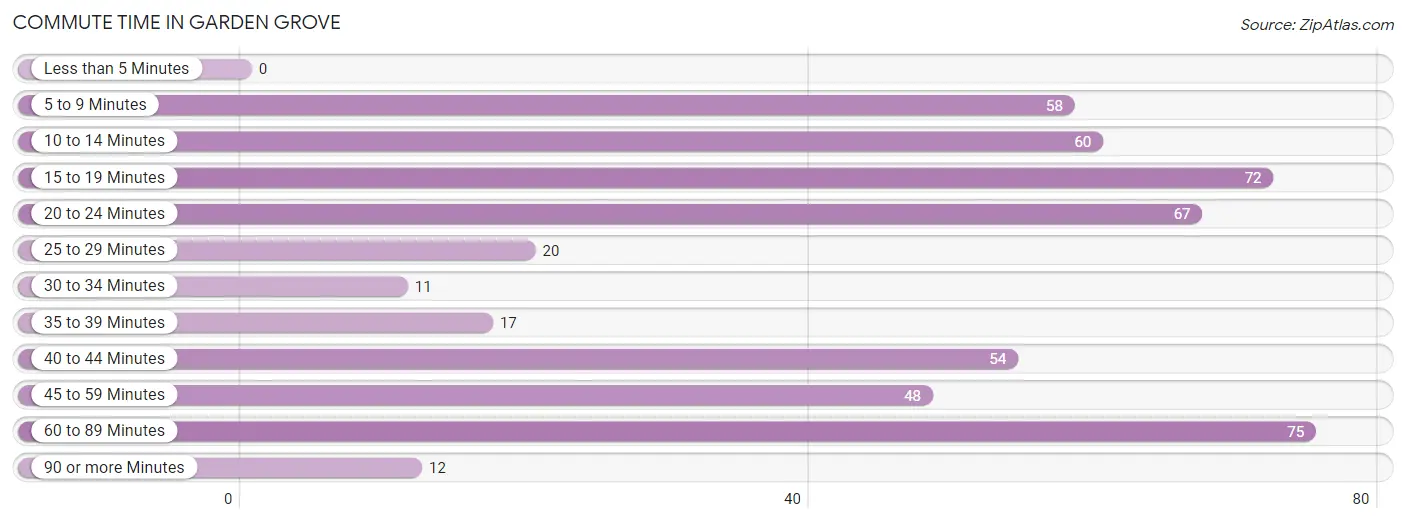
| Commute Time | # Commuters | % Commuters |
| Less than 5 Minutes | 0 | 0.0% |
| 5 to 9 Minutes | 58 | 11.7% |
| 10 to 14 Minutes | 60 | 12.1% |
| 15 to 19 Minutes | 72 | 14.6% |
| 20 to 24 Minutes | 67 | 13.6% |
| 25 to 29 Minutes | 20 | 4.1% |
| 30 to 34 Minutes | 11 | 2.2% |
| 35 to 39 Minutes | 17 | 3.4% |
| 40 to 44 Minutes | 54 | 10.9% |
| 45 to 59 Minutes | 48 | 9.7% |
| 60 to 89 Minutes | 75 | 15.2% |
| 90 or more Minutes | 12 | 2.4% |
Commute Time by Sex in Garden Grove
The most common commute times in Garden Grove are 45 to 59 minutes (48 commuters, 17.0%) for males and 15 to 19 minutes (53 commuters, 25.1%) for females.
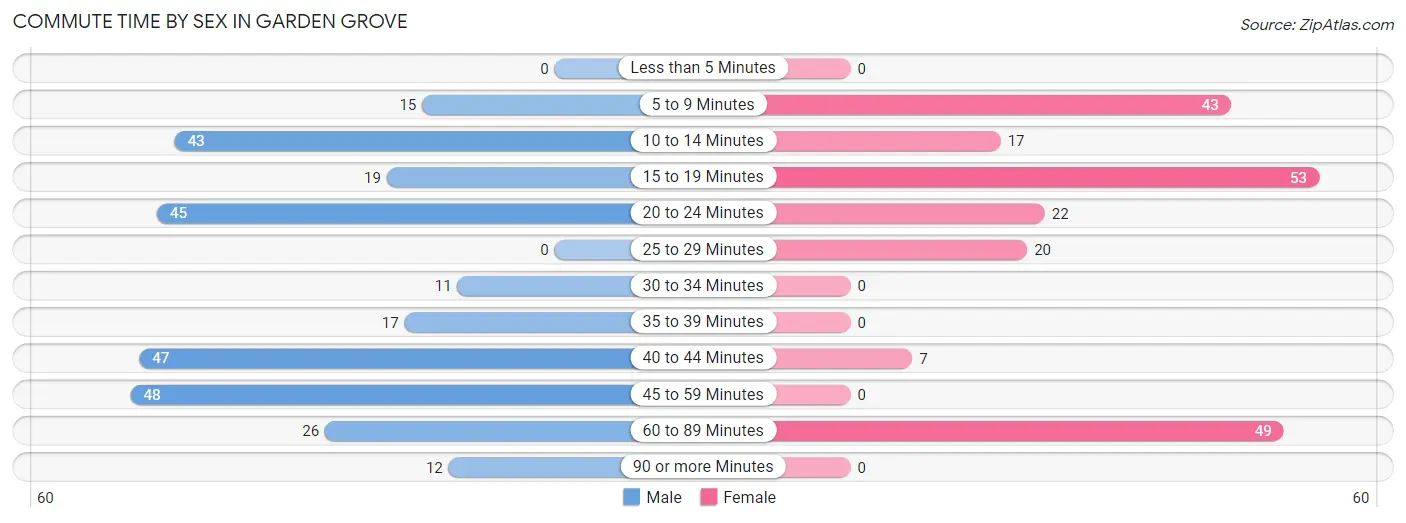
| Commute Time | Male | Female |
| Less than 5 Minutes | 0 (0.0%) | 0 (0.0%) |
| 5 to 9 Minutes | 15 (5.3%) | 43 (20.4%) |
| 10 to 14 Minutes | 43 (15.2%) | 17 (8.1%) |
| 15 to 19 Minutes | 19 (6.7%) | 53 (25.1%) |
| 20 to 24 Minutes | 45 (15.9%) | 22 (10.4%) |
| 25 to 29 Minutes | 0 (0.0%) | 20 (9.5%) |
| 30 to 34 Minutes | 11 (3.9%) | 0 (0.0%) |
| 35 to 39 Minutes | 17 (6.0%) | 0 (0.0%) |
| 40 to 44 Minutes | 47 (16.6%) | 7 (3.3%) |
| 45 to 59 Minutes | 48 (17.0%) | 0 (0.0%) |
| 60 to 89 Minutes | 26 (9.2%) | 49 (23.2%) |
| 90 or more Minutes | 12 (4.2%) | 0 (0.0%) |
Time of Departure to Work by Sex in Garden Grove
The most frequent times of departure to work in Garden Grove are 7:00 AM to 7:29 AM (67, 23.7%) for males and 6:00 AM to 6:29 AM (60, 28.4%) for females.
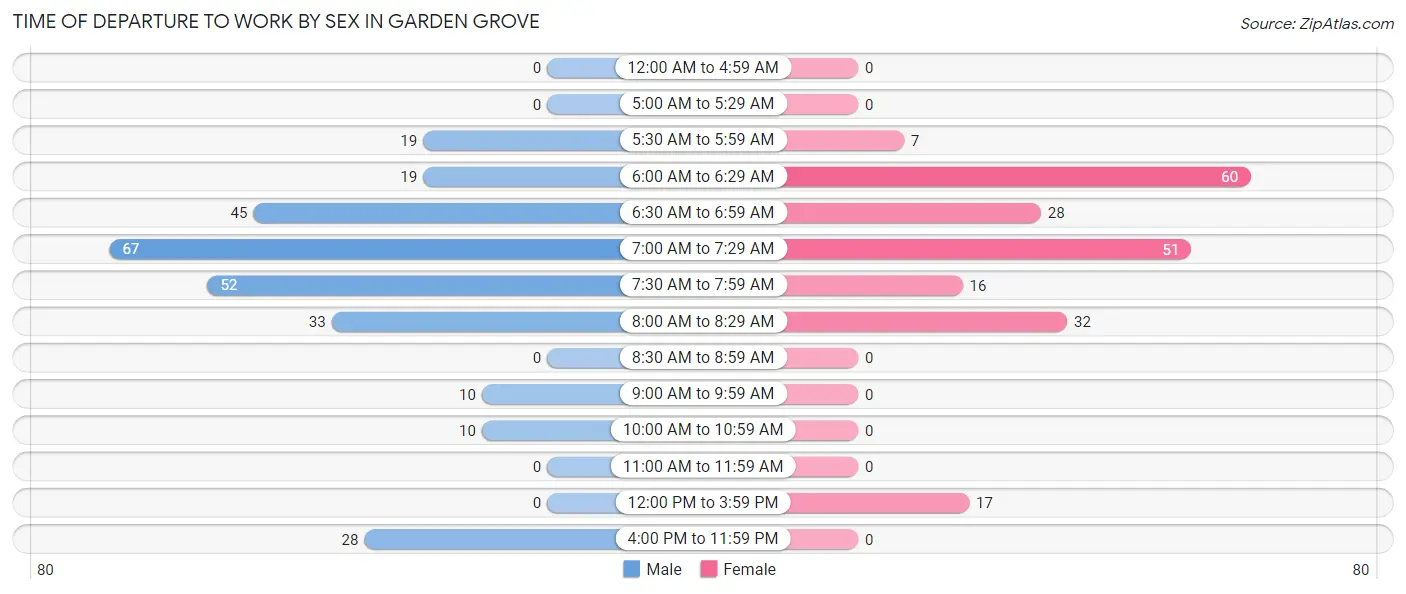
| Time of Departure | Male | Female |
| 12:00 AM to 4:59 AM | 0 (0.0%) | 0 (0.0%) |
| 5:00 AM to 5:29 AM | 0 (0.0%) | 0 (0.0%) |
| 5:30 AM to 5:59 AM | 19 (6.7%) | 7 (3.3%) |
| 6:00 AM to 6:29 AM | 19 (6.7%) | 60 (28.4%) |
| 6:30 AM to 6:59 AM | 45 (15.9%) | 28 (13.3%) |
| 7:00 AM to 7:29 AM | 67 (23.7%) | 51 (24.2%) |
| 7:30 AM to 7:59 AM | 52 (18.4%) | 16 (7.6%) |
| 8:00 AM to 8:29 AM | 33 (11.7%) | 32 (15.2%) |
| 8:30 AM to 8:59 AM | 0 (0.0%) | 0 (0.0%) |
| 9:00 AM to 9:59 AM | 10 (3.5%) | 0 (0.0%) |
| 10:00 AM to 10:59 AM | 10 (3.5%) | 0 (0.0%) |
| 11:00 AM to 11:59 AM | 0 (0.0%) | 0 (0.0%) |
| 12:00 PM to 3:59 PM | 0 (0.0%) | 17 (8.1%) |
| 4:00 PM to 11:59 PM | 28 (9.9%) | 0 (0.0%) |
| Total | 283 (100.0%) | 211 (100.0%) |
Housing Occupancy in Garden Grove
Occupancy by Ownership in Garden Grove
Of the total 360 dwellings in Garden Grove, owner-occupied units account for 258 (71.7%), while renter-occupied units make up 102 (28.3%).
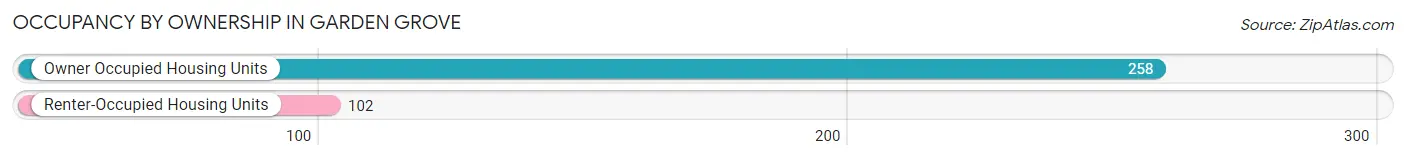
| Occupancy | # Housing Units | % Housing Units |
| Owner Occupied Housing Units | 258 | 71.7% |
| Renter-Occupied Housing Units | 102 | 28.3% |
| Total Occupied Housing Units | 360 | 100.0% |
Occupancy by Household Size in Garden Grove
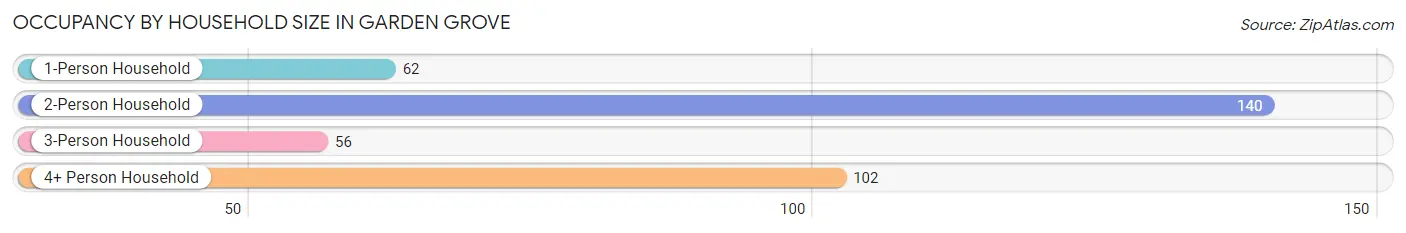
| Household Size | # Housing Units | % Housing Units |
| 1-Person Household | 62 | 17.2% |
| 2-Person Household | 140 | 38.9% |
| 3-Person Household | 56 | 15.6% |
| 4+ Person Household | 102 | 28.3% |
| Total Housing Units | 360 | 100.0% |
Occupancy by Ownership by Household Size in Garden Grove
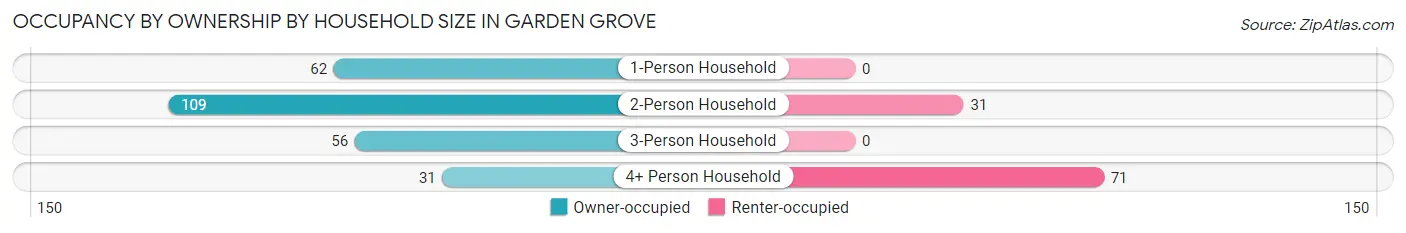
| Household Size | Owner-occupied | Renter-occupied |
| 1-Person Household | 62 (100.0%) | 0 (0.0%) |
| 2-Person Household | 109 (77.9%) | 31 (22.1%) |
| 3-Person Household | 56 (100.0%) | 0 (0.0%) |
| 4+ Person Household | 31 (30.4%) | 71 (69.6%) |
| Total Housing Units | 258 (71.7%) | 102 (28.3%) |
Occupancy by Educational Attainment in Garden Grove
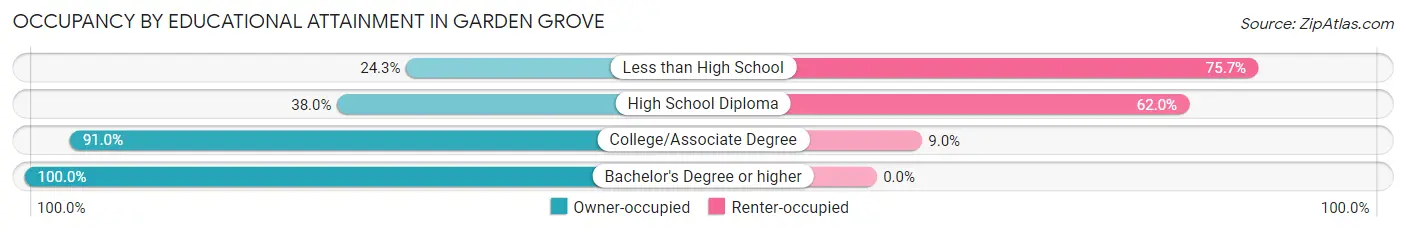
| Household Size | Owner-occupied | Renter-occupied |
| Less than High School | 9 (24.3%) | 28 (75.7%) |
| High School Diploma | 38 (38.0%) | 62 (62.0%) |
| College/Associate Degree | 122 (91.0%) | 12 (9.0%) |
| Bachelor's Degree or higher | 89 (100.0%) | 0 (0.0%) |
Occupancy by Age of Householder in Garden Grove
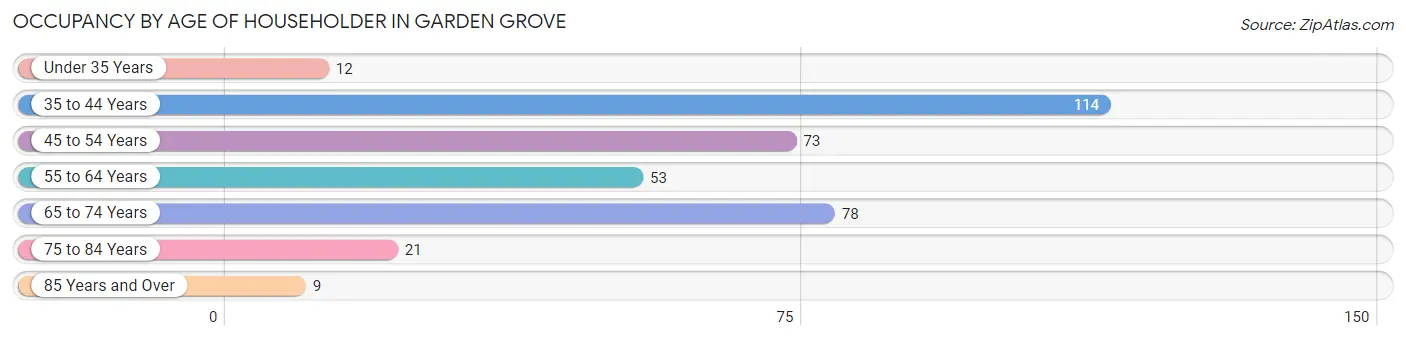
| Age Bracket | # Households | % Households |
| Under 35 Years | 12 | 3.3% |
| 35 to 44 Years | 114 | 31.7% |
| 45 to 54 Years | 73 | 20.3% |
| 55 to 64 Years | 53 | 14.7% |
| 65 to 74 Years | 78 | 21.7% |
| 75 to 84 Years | 21 | 5.8% |
| 85 Years and Over | 9 | 2.5% |
| Total | 360 | 100.0% |
Housing Finances in Garden Grove
Median Income by Occupancy in Garden Grove
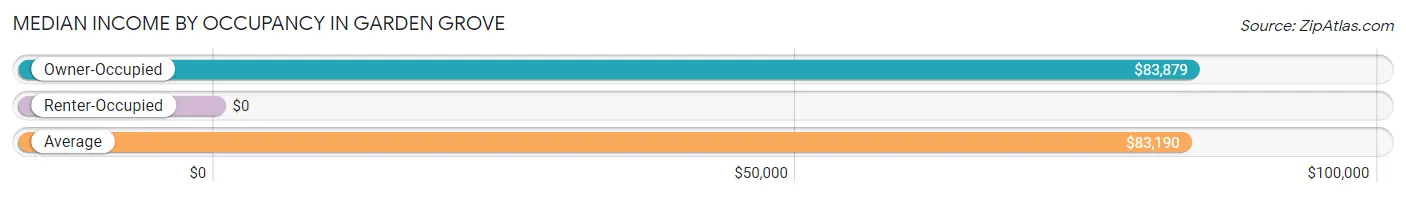
| Occupancy Type | # Households | Median Income |
| Owner-Occupied | 258 (71.7%) | $83,879 |
| Renter-Occupied | 102 (28.3%) | $0 |
| Average | 360 (100.0%) | $83,190 |
Occupancy by Householder Income Bracket in Garden Grove
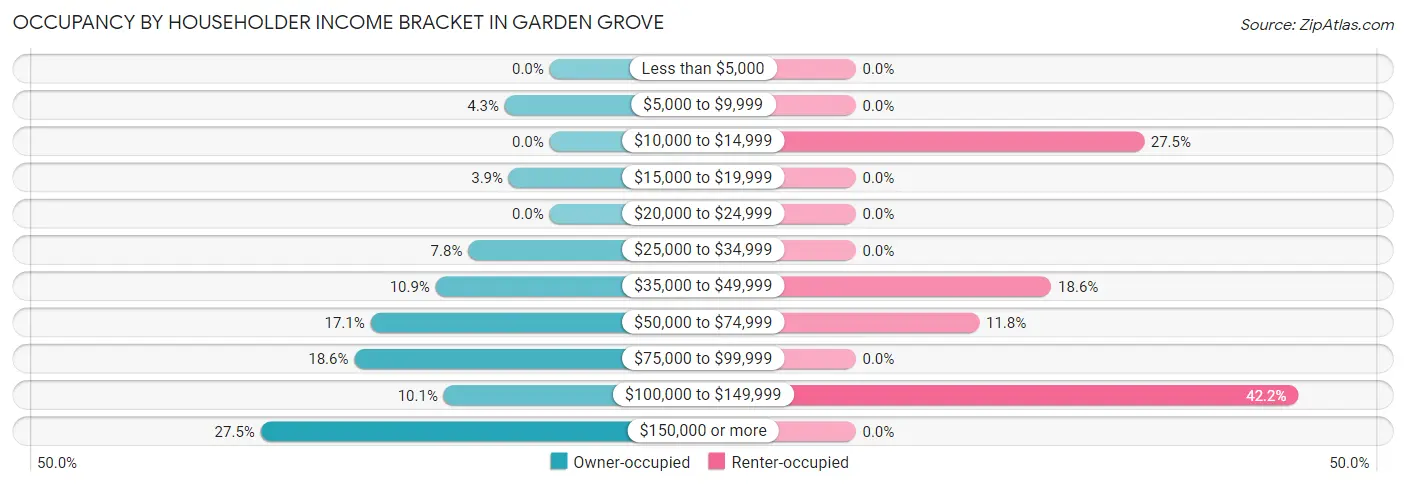
| Income Bracket | Owner-occupied | Renter-occupied |
| Less than $5,000 | 0 (0.0%) | 0 (0.0%) |
| $5,000 to $9,999 | 11 (4.3%) | 0 (0.0%) |
| $10,000 to $14,999 | 0 (0.0%) | 28 (27.5%) |
| $15,000 to $19,999 | 10 (3.9%) | 0 (0.0%) |
| $20,000 to $24,999 | 0 (0.0%) | 0 (0.0%) |
| $25,000 to $34,999 | 20 (7.7%) | 0 (0.0%) |
| $35,000 to $49,999 | 28 (10.8%) | 19 (18.6%) |
| $50,000 to $74,999 | 44 (17.1%) | 12 (11.8%) |
| $75,000 to $99,999 | 48 (18.6%) | 0 (0.0%) |
| $100,000 to $149,999 | 26 (10.1%) | 43 (42.2%) |
| $150,000 or more | 71 (27.5%) | 0 (0.0%) |
| Total | 258 (100.0%) | 102 (100.0%) |
Monthly Housing Cost Tiers in Garden Grove
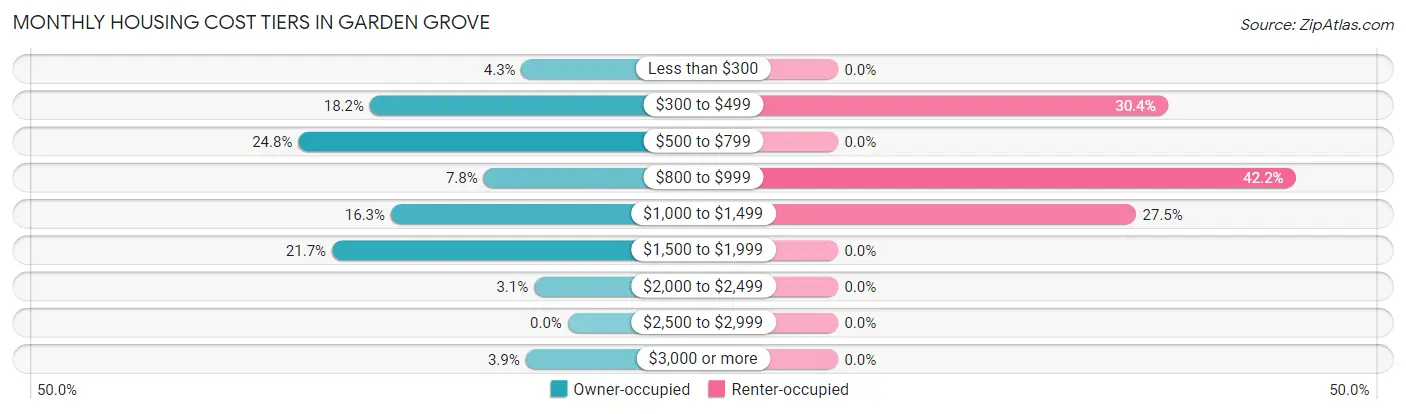
| Monthly Cost | Owner-occupied | Renter-occupied |
| Less than $300 | 11 (4.3%) | 0 (0.0%) |
| $300 to $499 | 47 (18.2%) | 31 (30.4%) |
| $500 to $799 | 64 (24.8%) | 0 (0.0%) |
| $800 to $999 | 20 (7.7%) | 43 (42.2%) |
| $1,000 to $1,499 | 42 (16.3%) | 28 (27.5%) |
| $1,500 to $1,999 | 56 (21.7%) | 0 (0.0%) |
| $2,000 to $2,499 | 8 (3.1%) | 0 (0.0%) |
| $2,500 to $2,999 | 0 (0.0%) | 0 (0.0%) |
| $3,000 or more | 10 (3.9%) | 0 (0.0%) |
| Total | 258 (100.0%) | 102 (100.0%) |
Physical Housing Characteristics in Garden Grove
Housing Structures in Garden Grove
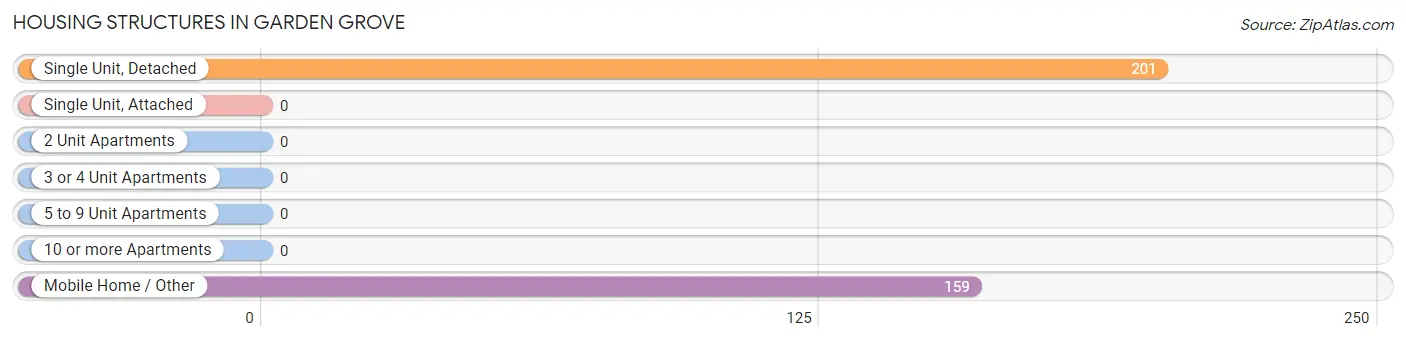
| Structure Type | # Housing Units | % Housing Units |
| Single Unit, Detached | 201 | 55.8% |
| Single Unit, Attached | 0 | 0.0% |
| 2 Unit Apartments | 0 | 0.0% |
| 3 or 4 Unit Apartments | 0 | 0.0% |
| 5 to 9 Unit Apartments | 0 | 0.0% |
| 10 or more Apartments | 0 | 0.0% |
| Mobile Home / Other | 159 | 44.2% |
| Total | 360 | 100.0% |
Housing Structures by Occupancy in Garden Grove
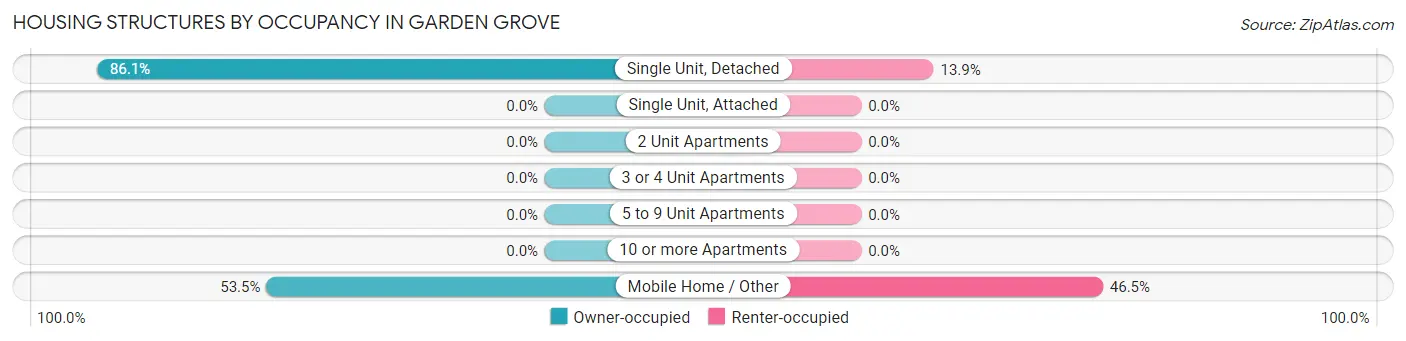
| Structure Type | Owner-occupied | Renter-occupied |
| Single Unit, Detached | 173 (86.1%) | 28 (13.9%) |
| Single Unit, Attached | 0 (0.0%) | 0 (0.0%) |
| 2 Unit Apartments | 0 (0.0%) | 0 (0.0%) |
| 3 or 4 Unit Apartments | 0 (0.0%) | 0 (0.0%) |
| 5 to 9 Unit Apartments | 0 (0.0%) | 0 (0.0%) |
| 10 or more Apartments | 0 (0.0%) | 0 (0.0%) |
| Mobile Home / Other | 85 (53.5%) | 74 (46.5%) |
| Total | 258 (71.7%) | 102 (28.3%) |
Housing Structures by Number of Rooms in Garden Grove
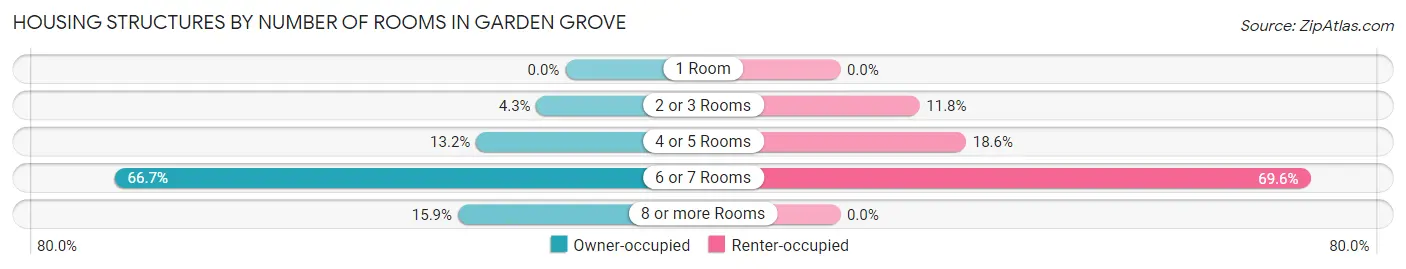
| Number of Rooms | Owner-occupied | Renter-occupied |
| 1 Room | 0 (0.0%) | 0 (0.0%) |
| 2 or 3 Rooms | 11 (4.3%) | 12 (11.8%) |
| 4 or 5 Rooms | 34 (13.2%) | 19 (18.6%) |
| 6 or 7 Rooms | 172 (66.7%) | 71 (69.6%) |
| 8 or more Rooms | 41 (15.9%) | 0 (0.0%) |
| Total | 258 (100.0%) | 102 (100.0%) |
Housing Structure by Heating Type in Garden Grove
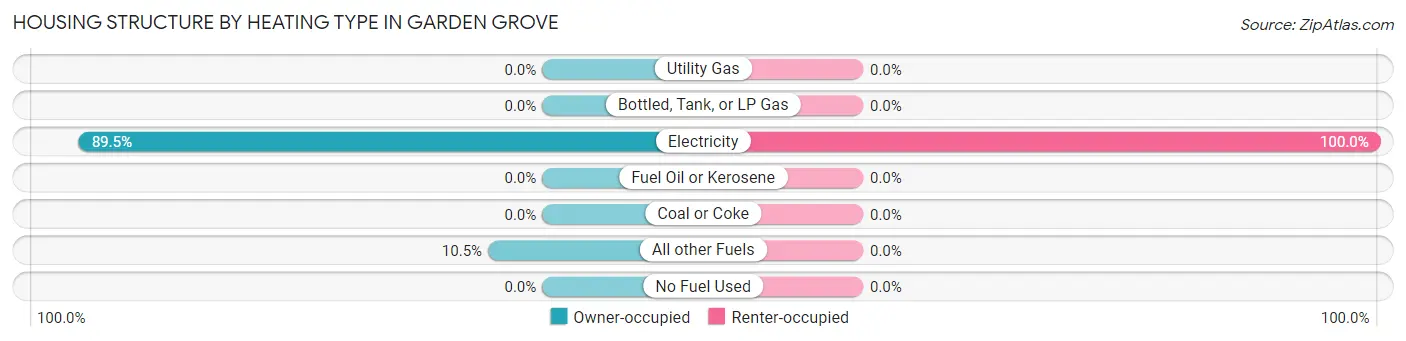
| Heating Type | Owner-occupied | Renter-occupied |
| Utility Gas | 0 (0.0%) | 0 (0.0%) |
| Bottled, Tank, or LP Gas | 0 (0.0%) | 0 (0.0%) |
| Electricity | 231 (89.5%) | 102 (100.0%) |
| Fuel Oil or Kerosene | 0 (0.0%) | 0 (0.0%) |
| Coal or Coke | 0 (0.0%) | 0 (0.0%) |
| All other Fuels | 27 (10.5%) | 0 (0.0%) |
| No Fuel Used | 0 (0.0%) | 0 (0.0%) |
| Total | 258 (100.0%) | 102 (100.0%) |
Household Vehicle Usage in Garden Grove
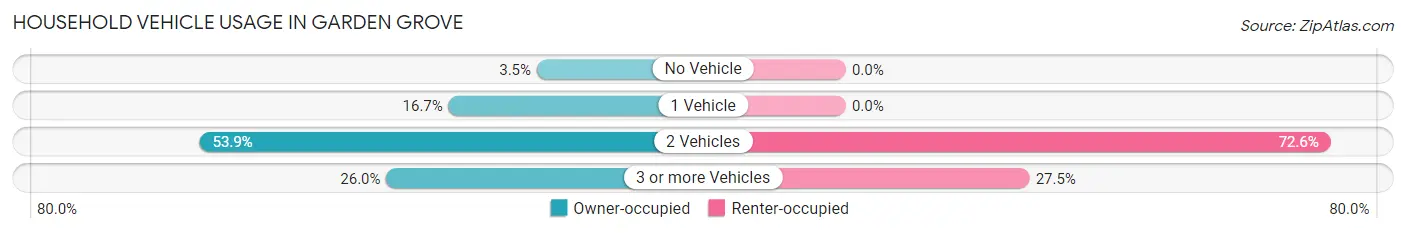
| Vehicles per Household | Owner-occupied | Renter-occupied |
| No Vehicle | 9 (3.5%) | 0 (0.0%) |
| 1 Vehicle | 43 (16.7%) | 0 (0.0%) |
| 2 Vehicles | 139 (53.9%) | 74 (72.6%) |
| 3 or more Vehicles | 67 (26.0%) | 28 (27.5%) |
| Total | 258 (100.0%) | 102 (100.0%) |
Real Estate & Mortgages in Garden Grove
Real Estate and Mortgage Overview in Garden Grove
| Characteristic | Without Mortgage | With Mortgage |
| Housing Units | 90 | 168 |
| Median Property Value | $107,900 | $260,600 |
| Median Household Income | $43,250 | $71 |
| Monthly Housing Costs | $472 | $10 |
| Real Estate Taxes | $1,658 | $17 |
Property Value by Mortgage Status in Garden Grove
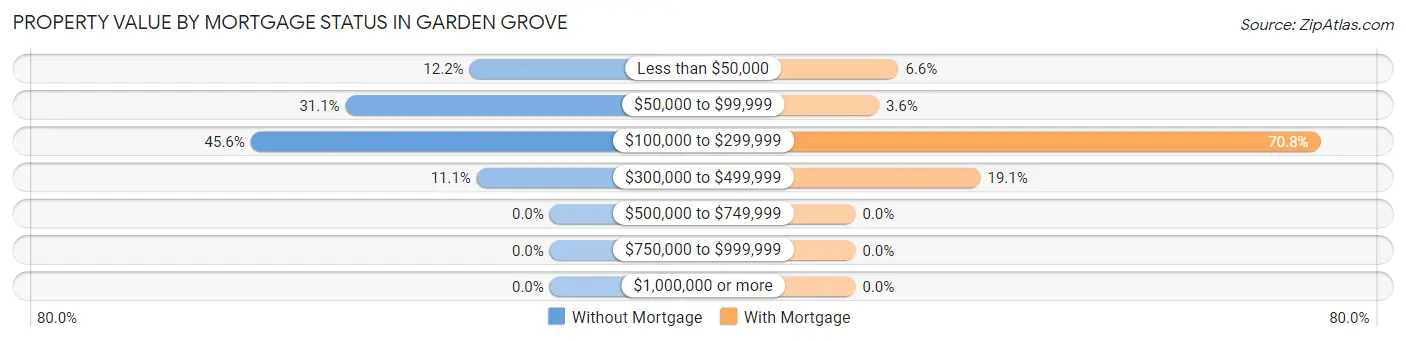
| Property Value | Without Mortgage | With Mortgage |
| Less than $50,000 | 11 (12.2%) | 11 (6.6%) |
| $50,000 to $99,999 | 28 (31.1%) | 6 (3.6%) |
| $100,000 to $299,999 | 41 (45.6%) | 119 (70.8%) |
| $300,000 to $499,999 | 10 (11.1%) | 32 (19.1%) |
| $500,000 to $749,999 | 0 (0.0%) | 0 (0.0%) |
| $750,000 to $999,999 | 0 (0.0%) | 0 (0.0%) |
| $1,000,000 or more | 0 (0.0%) | 0 (0.0%) |
| Total | 90 (100.0%) | 168 (100.0%) |
Household Income by Mortgage Status in Garden Grove
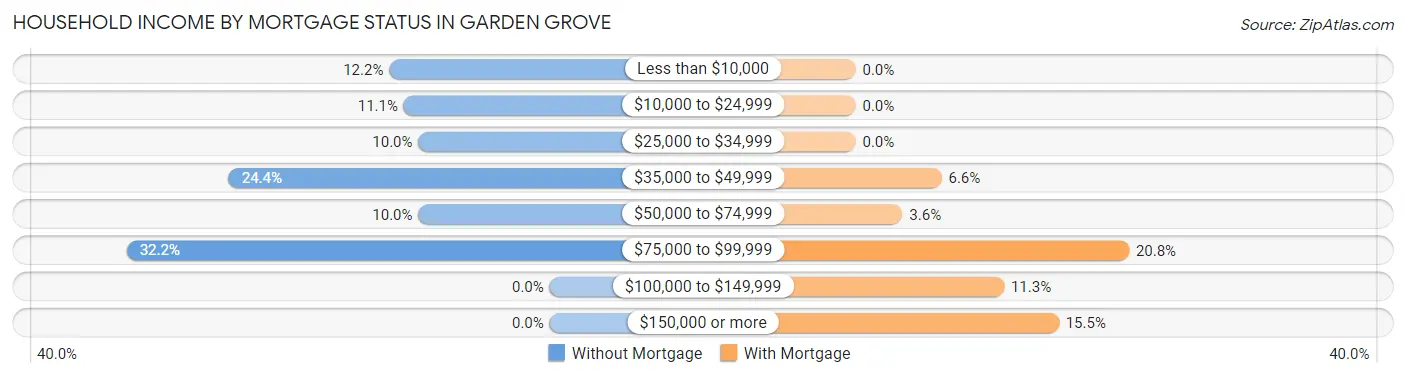
| Household Income | Without Mortgage | With Mortgage |
| Less than $10,000 | 11 (12.2%) | 0 (0.0%) |
| $10,000 to $24,999 | 10 (11.1%) | 0 (0.0%) |
| $25,000 to $34,999 | 9 (10.0%) | 0 (0.0%) |
| $35,000 to $49,999 | 22 (24.4%) | 11 (6.6%) |
| $50,000 to $74,999 | 9 (10.0%) | 6 (3.6%) |
| $75,000 to $99,999 | 29 (32.2%) | 35 (20.8%) |
| $100,000 to $149,999 | 0 (0.0%) | 19 (11.3%) |
| $150,000 or more | 0 (0.0%) | 26 (15.5%) |
| Total | 90 (100.0%) | 168 (100.0%) |
Property Value to Household Income Ratio in Garden Grove
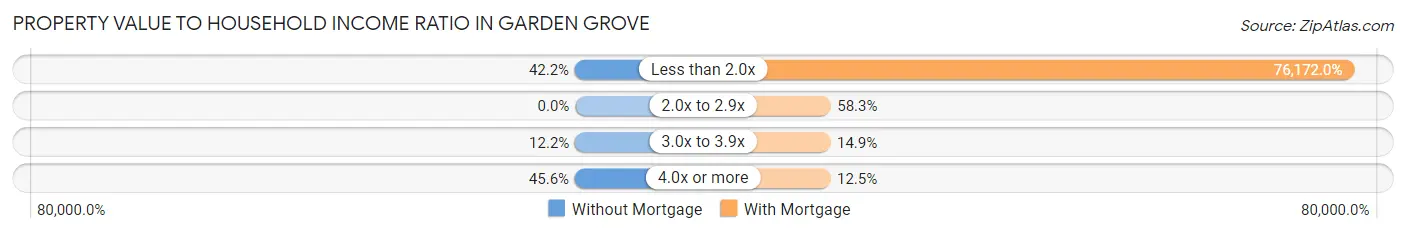
| Value-to-Income Ratio | Without Mortgage | With Mortgage |
| Less than 2.0x | 38 (42.2%) | 127,969 (76,172.0%) |
| 2.0x to 2.9x | 0 (0.0%) | 98 (58.3%) |
| 3.0x to 3.9x | 11 (12.2%) | 25 (14.9%) |
| 4.0x or more | 41 (45.6%) | 21 (12.5%) |
| Total | 90 (100.0%) | 168 (100.0%) |
Real Estate Taxes by Mortgage Status in Garden Grove
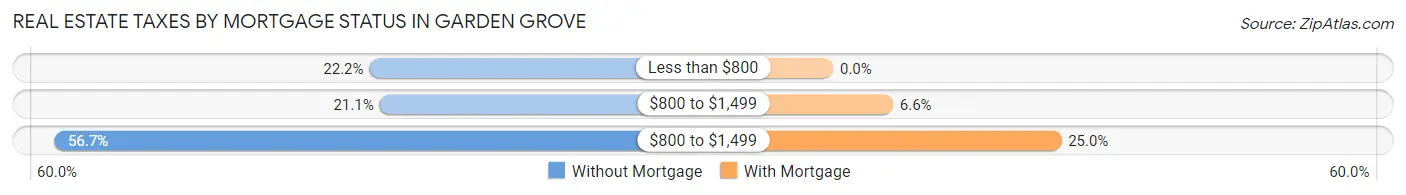
| Property Taxes | Without Mortgage | With Mortgage |
| Less than $800 | 20 (22.2%) | 0 (0.0%) |
| $800 to $1,499 | 19 (21.1%) | 11 (6.6%) |
| $800 to $1,499 | 51 (56.7%) | 42 (25.0%) |
| Total | 90 (100.0%) | 168 (100.0%) |
Health & Disability in Garden Grove
Health Insurance Coverage by Age in Garden Grove
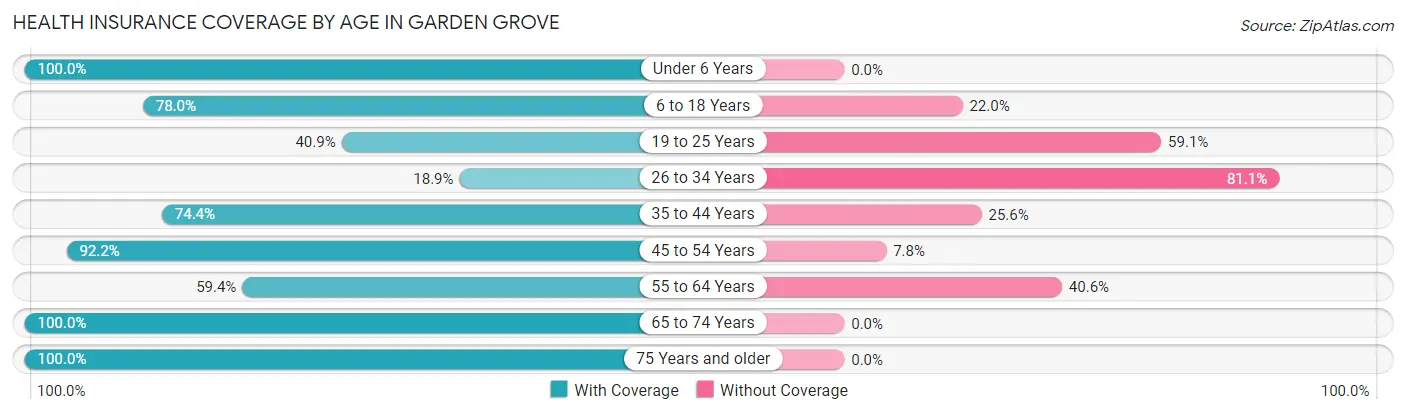
| Age Bracket | With Coverage | Without Coverage |
| Under 6 Years | 44 (100.0%) | 0 (0.0%) |
| 6 to 18 Years | 145 (78.0%) | 41 (22.0%) |
| 19 to 25 Years | 9 (40.9%) | 13 (59.1%) |
| 26 to 34 Years | 39 (18.9%) | 167 (81.1%) |
| 35 to 44 Years | 125 (74.4%) | 43 (25.6%) |
| 45 to 54 Years | 118 (92.2%) | 10 (7.8%) |
| 55 to 64 Years | 41 (59.4%) | 28 (40.6%) |
| 65 to 74 Years | 147 (100.0%) | 0 (0.0%) |
| 75 Years and older | 65 (100.0%) | 0 (0.0%) |
| Total | 733 (70.8%) | 302 (29.2%) |
Health Insurance Coverage by Citizenship Status in Garden Grove
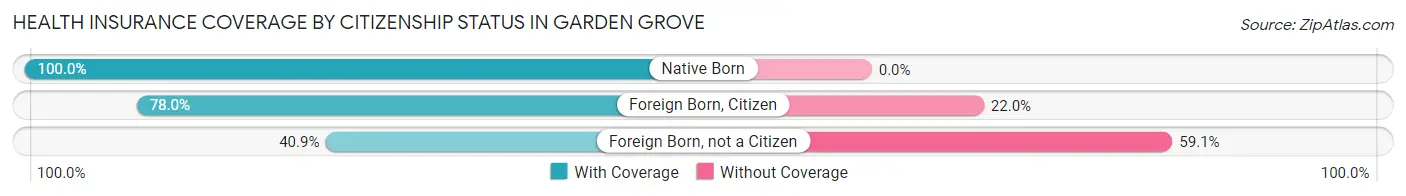
| Citizenship Status | With Coverage | Without Coverage |
| Native Born | 44 (100.0%) | 0 (0.0%) |
| Foreign Born, Citizen | 145 (78.0%) | 41 (22.0%) |
| Foreign Born, not a Citizen | 9 (40.9%) | 13 (59.1%) |
Health Insurance Coverage by Household Income in Garden Grove
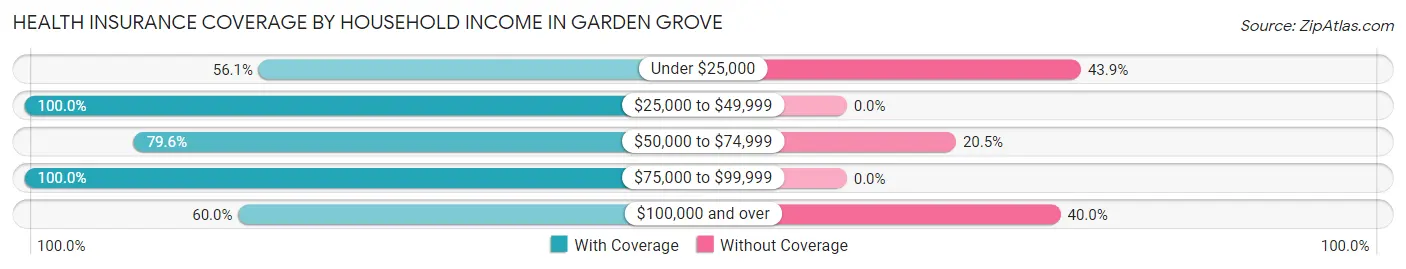
| Household Income | With Coverage | Without Coverage |
| Under $25,000 | 110 (56.1%) | 86 (43.9%) |
| $25,000 to $49,999 | 119 (100.0%) | 0 (0.0%) |
| $50,000 to $74,999 | 105 (79.5%) | 27 (20.4%) |
| $75,000 to $99,999 | 116 (100.0%) | 0 (0.0%) |
| $100,000 and over | 283 (60.0%) | 189 (40.0%) |
Public vs Private Health Insurance Coverage by Age in Garden Grove
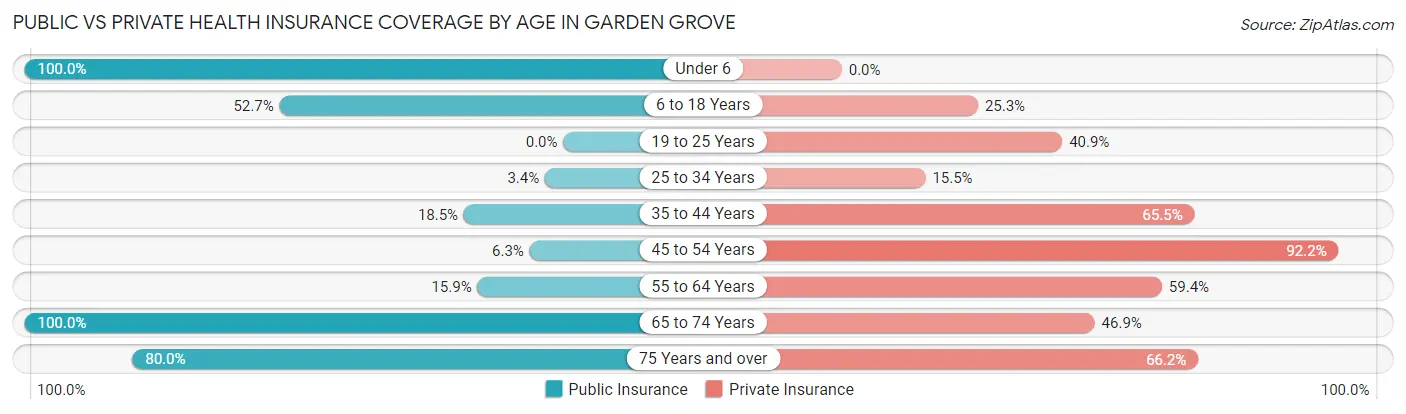
| Age Bracket | Public Insurance | Private Insurance |
| Under 6 | 44 (100.0%) | 0 (0.0%) |
| 6 to 18 Years | 98 (52.7%) | 47 (25.3%) |
| 19 to 25 Years | 0 (0.0%) | 9 (40.9%) |
| 25 to 34 Years | 7 (3.4%) | 32 (15.5%) |
| 35 to 44 Years | 31 (18.4%) | 110 (65.5%) |
| 45 to 54 Years | 8 (6.2%) | 118 (92.2%) |
| 55 to 64 Years | 11 (15.9%) | 41 (59.4%) |
| 65 to 74 Years | 147 (100.0%) | 69 (46.9%) |
| 75 Years and over | 52 (80.0%) | 43 (66.1%) |
| Total | 398 (38.5%) | 469 (45.3%) |
Disability Status by Sex by Age in Garden Grove
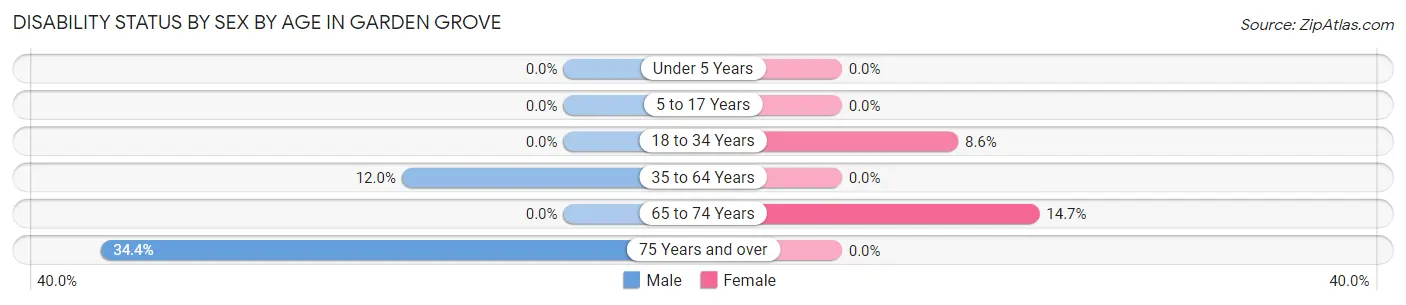
| Age Bracket | Male | Female |
| Under 5 Years | 0 (0.0%) | 0 (0.0%) |
| 5 to 17 Years | 0 (0.0%) | 0 (0.0%) |
| 18 to 34 Years | 0 (0.0%) | 12 (8.6%) |
| 35 to 64 Years | 21 (12.0%) | 0 (0.0%) |
| 65 to 74 Years | 0 (0.0%) | 11 (14.7%) |
| 75 Years and over | 11 (34.4%) | 0 (0.0%) |
Disability Class by Sex by Age in Garden Grove
Disability Class: Hearing Difficulty
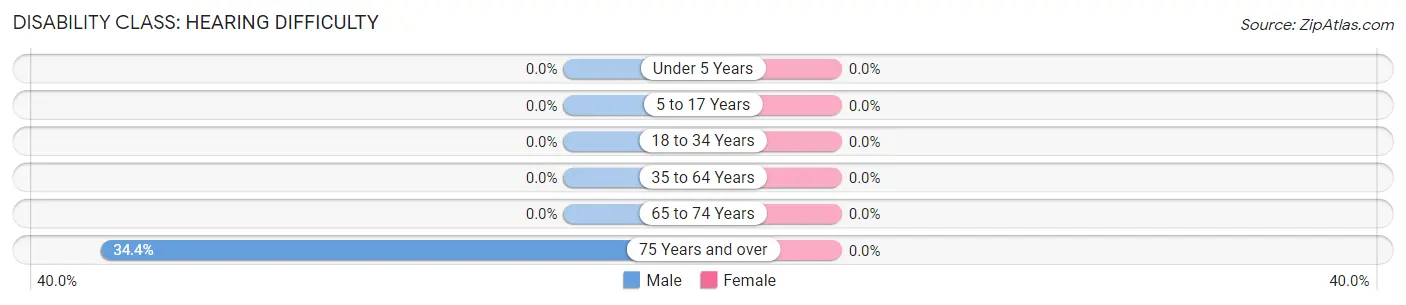
| Age Bracket | Male | Female |
| Under 5 Years | 0 (0.0%) | 0 (0.0%) |
| 5 to 17 Years | 0 (0.0%) | 0 (0.0%) |
| 18 to 34 Years | 0 (0.0%) | 0 (0.0%) |
| 35 to 64 Years | 0 (0.0%) | 0 (0.0%) |
| 65 to 74 Years | 0 (0.0%) | 0 (0.0%) |
| 75 Years and over | 11 (34.4%) | 0 (0.0%) |
Disability Class: Vision Difficulty
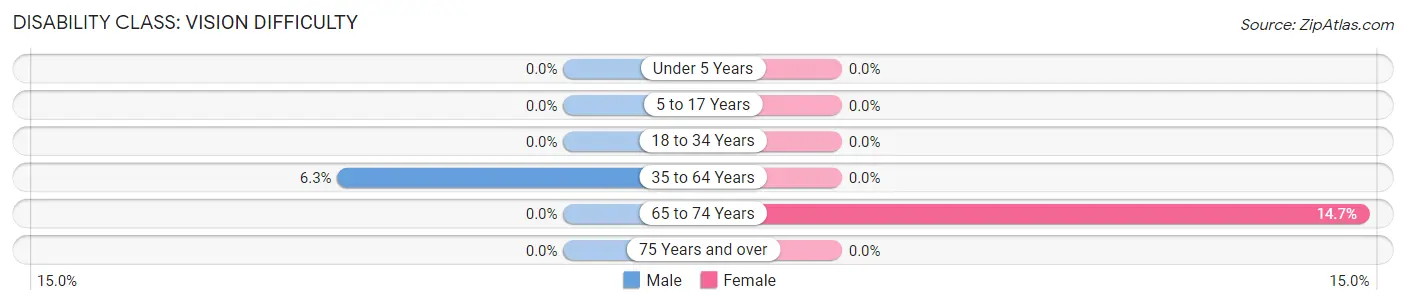
| Age Bracket | Male | Female |
| Under 5 Years | 0 (0.0%) | 0 (0.0%) |
| 5 to 17 Years | 0 (0.0%) | 0 (0.0%) |
| 18 to 34 Years | 0 (0.0%) | 0 (0.0%) |
| 35 to 64 Years | 11 (6.3%) | 0 (0.0%) |
| 65 to 74 Years | 0 (0.0%) | 11 (14.7%) |
| 75 Years and over | 0 (0.0%) | 0 (0.0%) |
Disability Class: Cognitive Difficulty
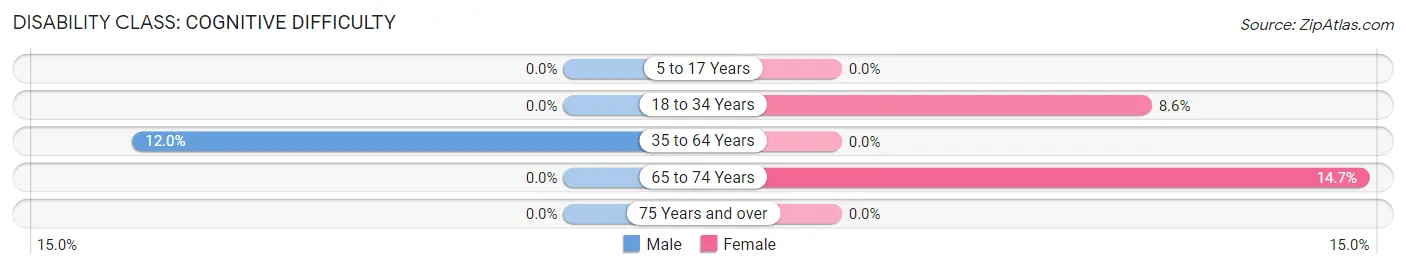
| Age Bracket | Male | Female |
| 5 to 17 Years | 0 (0.0%) | 0 (0.0%) |
| 18 to 34 Years | 0 (0.0%) | 12 (8.6%) |
| 35 to 64 Years | 21 (12.0%) | 0 (0.0%) |
| 65 to 74 Years | 0 (0.0%) | 11 (14.7%) |
| 75 Years and over | 0 (0.0%) | 0 (0.0%) |
Disability Class: Ambulatory Difficulty
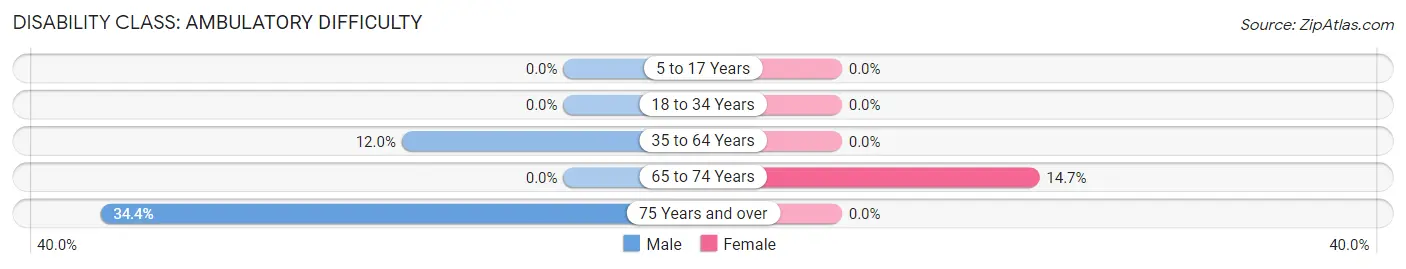
| Age Bracket | Male | Female |
| 5 to 17 Years | 0 (0.0%) | 0 (0.0%) |
| 18 to 34 Years | 0 (0.0%) | 0 (0.0%) |
| 35 to 64 Years | 21 (12.0%) | 0 (0.0%) |
| 65 to 74 Years | 0 (0.0%) | 11 (14.7%) |
| 75 Years and over | 11 (34.4%) | 0 (0.0%) |
Disability Class: Self-Care Difficulty
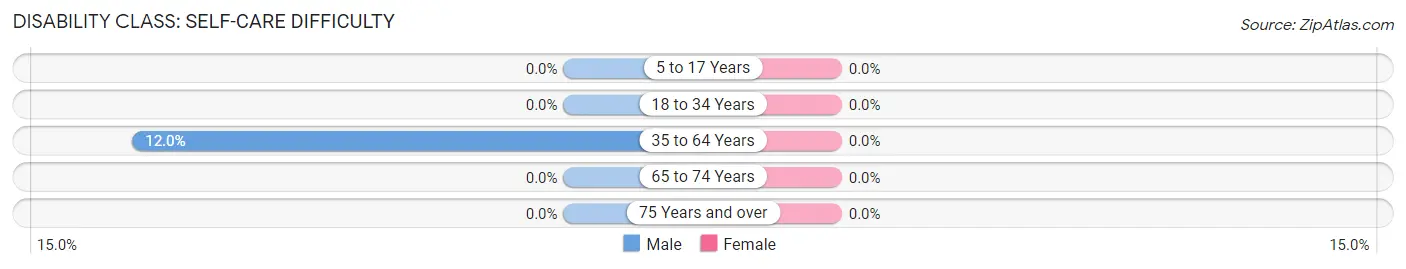
| Age Bracket | Male | Female |
| 5 to 17 Years | 0 (0.0%) | 0 (0.0%) |
| 18 to 34 Years | 0 (0.0%) | 0 (0.0%) |
| 35 to 64 Years | 21 (12.0%) | 0 (0.0%) |
| 65 to 74 Years | 0 (0.0%) | 0 (0.0%) |
| 75 Years and over | 0 (0.0%) | 0 (0.0%) |
Technology Access in Garden Grove
Computing Device Access in Garden Grove
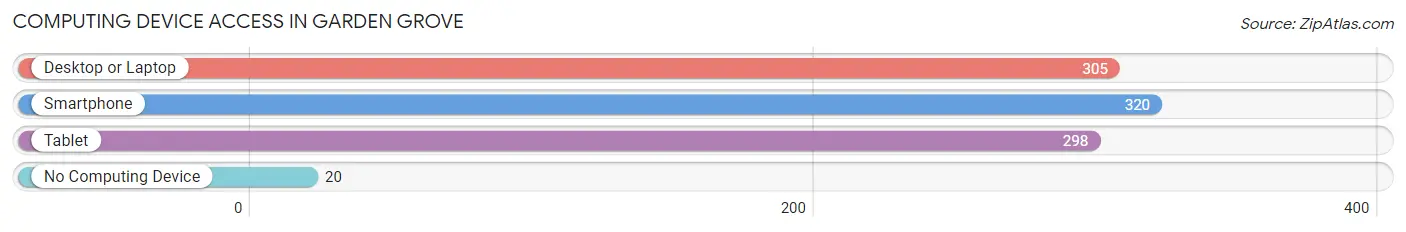
| Device Type | # Households | % Households |
| Desktop or Laptop | 305 | 84.7% |
| Smartphone | 320 | 88.9% |
| Tablet | 298 | 82.8% |
| No Computing Device | 20 | 5.6% |
| Total | 360 | 100.0% |
Internet Access in Garden Grove
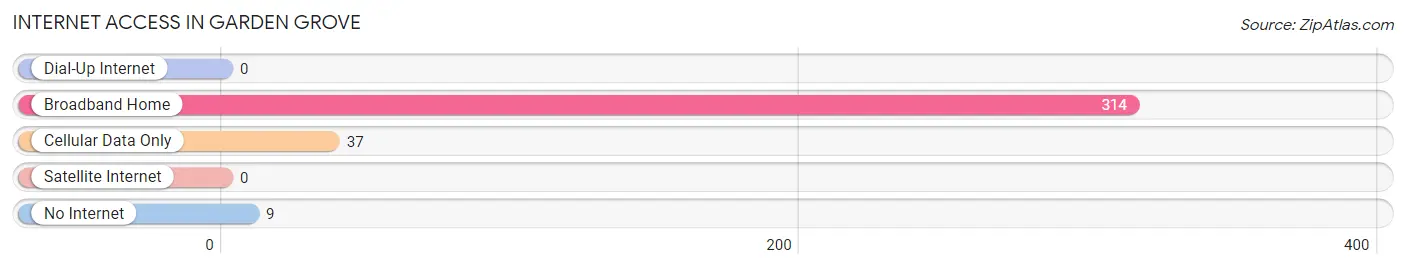
| Internet Type | # Households | % Households |
| Dial-Up Internet | 0 | 0.0% |
| Broadband Home | 314 | 87.2% |
| Cellular Data Only | 37 | 10.3% |
| Satellite Internet | 0 | 0.0% |
| No Internet | 9 | 2.5% |
| Total | 360 | 100.0% |
Garden Grove Summary
Garden Grove is a small town located in Orange County, Florida. It is situated in the center of the county, just south of Orlando. The town has a population of approximately 4,000 people and is known for its small-town charm and friendly atmosphere.
History
Garden Grove was founded in 1883 by a group of settlers from the Midwest. The town was originally called “Garden Grove” because of the abundance of citrus trees in the area. The settlers built a small church and a general store, and the town quickly grew. By the early 1900s, Garden Grove had become a popular destination for tourists and vacationers.
In the 1920s, the town began to experience a period of growth and development. The population increased, and new businesses opened up. The town also became a popular destination for retirees. In the 1950s, the town was incorporated and the population continued to grow.
Geography
Garden Grove is located in the center of Orange County, Florida. It is situated just south of Orlando and is bordered by the cities of Winter Garden, Ocoee, and Windermere. The town is located on the banks of Lake Apopka, which is the largest lake in the county. The town is also located near the Orange County Convention Center and the Orlando International Airport.
The town has a total area of 1.3 square miles, all of which is land. The terrain is mostly flat, with some rolling hills. The town is located in a humid subtropical climate zone, with hot, humid summers and mild winters.
Economy
Garden Grove’s economy is largely based on tourism and retail. The town is home to several small businesses, including restaurants, shops, and other services. The town is also home to a number of small manufacturing companies.
The town is also home to a number of large employers, including Walt Disney World, Universal Studios, and SeaWorld. These companies provide a large number of jobs to the local economy.
Demographics
As of the 2010 census, the population of Garden Grove was 4,000. The population is largely white (83.3%), with a small percentage of African Americans (7.3%), Hispanics (4.7%), and Asians (2.7%). The median household income is $45,000, and the median age is 42.
Conclusion
Garden Grove is a small town located in Orange County, Florida. It is known for its small-town charm and friendly atmosphere. The town has a population of approximately 4,000 people and is home to a number of small businesses and large employers. The town is located near the Orange County Convention Center and the Orlando International Airport. The town has a humid subtropical climate and is largely white, with a small percentage of African Americans, Hispanics, and Asians. The median household income is $45,000, and the median age is 42.
Common Questions
What is Per Capita Income in Garden Grove?
Per Capita income in Garden Grove is $40,476.
What is the Median Family Income in Garden Grove?
Median Family Income in Garden Grove is $84,474.
What is the Median Household income in Garden Grove?
Median Household Income in Garden Grove is $83,190.
What is Income or Wage Gap in Garden Grove?
Income or Wage Gap in Garden Grove is 2.3%.
Women in Garden Grove earn 97.7 cents for every dollar earned by a man.
What is Inequality or Gini Index in Garden Grove?
Inequality or Gini Index in Garden Grove is 0.48.
What is the Total Population of Garden Grove?
Total Population of Garden Grove is 1,035.
What is the Total Male Population of Garden Grove?
Total Male Population of Garden Grove is 450.
What is the Total Female Population of Garden Grove?
Total Female Population of Garden Grove is 585.
What is the Ratio of Males per 100 Females in Garden Grove?
There are 76.92 Males per 100 Females in Garden Grove.
What is the Ratio of Females per 100 Males in Garden Grove?
There are 130.00 Females per 100 Males in Garden Grove.
What is the Median Population Age in Garden Grove?
Median Population Age in Garden Grove is 39.3 Years.
What is the Average Family Size in Garden Grove
Average Family Size in Garden Grove is 2.6 People.
What is the Average Household Size in Garden Grove
Average Household Size in Garden Grove is 2.9 People.
How Large is the Labor Force in Garden Grove?
There are 588 People in the Labor Forcein in Garden Grove.
What is the Percentage of People in the Labor Force in Garden Grove?
69.0% of People are in the Labor Force in Garden Grove.
What is the Unemployment Rate in Garden Grove?
Unemployment Rate in Garden Grove is 1.5%.