Suncoast Estates, FL Map & Demographics
Suncoast Estates Map
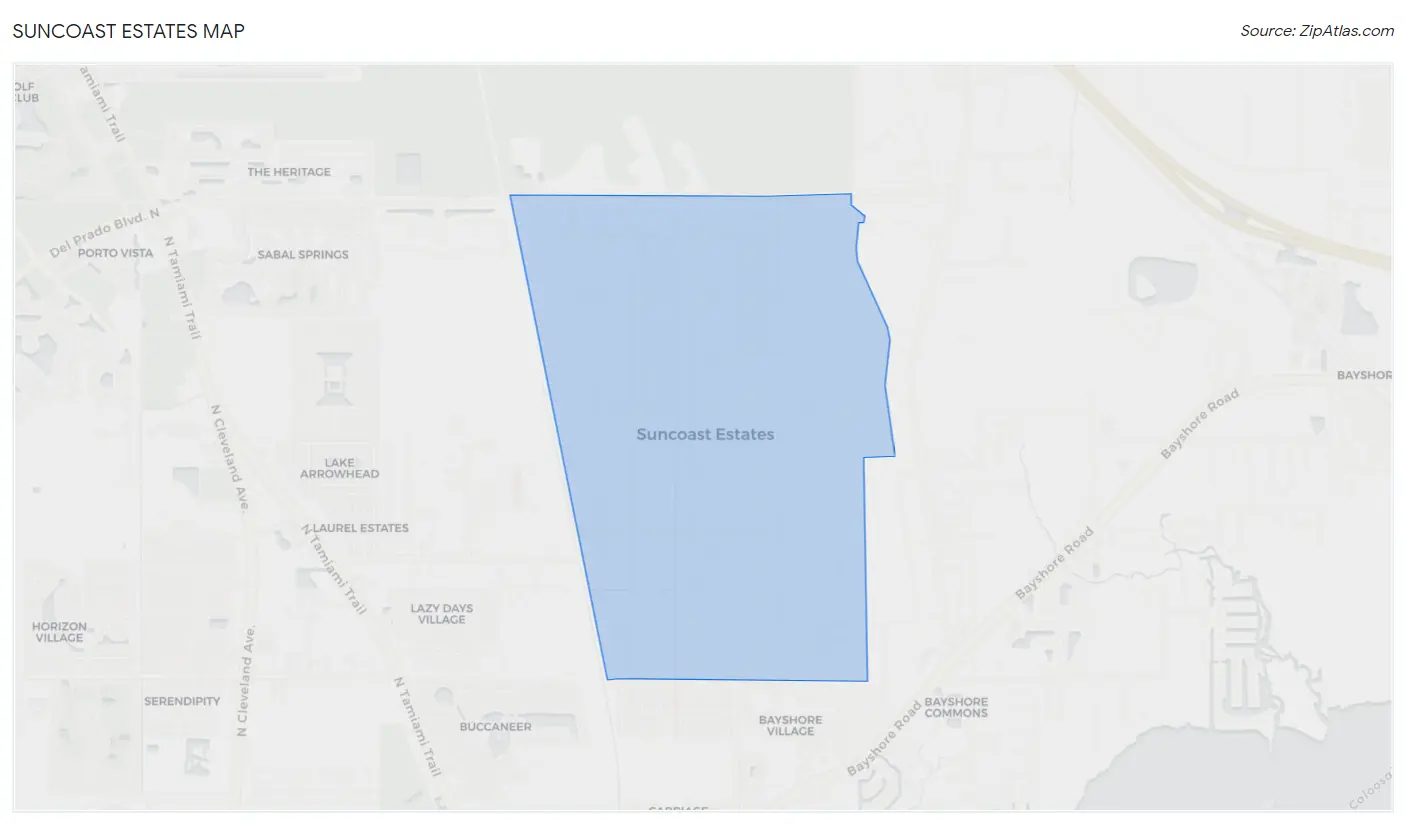
Suncoast Estates Overview
$20,995
PER CAPITA INCOME
$56,208
AVG FAMILY INCOME
$41,188
AVG HOUSEHOLD INCOME
8.8%
WAGE / INCOME GAP [ % ]
91.2¢/ $1
WAGE / INCOME GAP [ $ ]
0.40
INEQUALITY / GINI INDEX
4,208
TOTAL POPULATION
2,258
MALE POPULATION
1,950
FEMALE POPULATION
115.79
MALES / 100 FEMALES
86.36
FEMALES / 100 MALES
48.4
MEDIAN AGE
3.1
AVG FAMILY SIZE
2.4
AVG HOUSEHOLD SIZE
2,048
LABOR FORCE [ PEOPLE ]
55.7%
PERCENT IN LABOR FORCE
8.1%
UNEMPLOYMENT RATE
Income in Suncoast Estates
Income Overview in Suncoast Estates
Per Capita Income in Suncoast Estates is $20,995, while median incomes of families and households are $56,208 and $41,188 respectively.
| Characteristic | Number | Measure |
| Per Capita Income | 4,208 | $20,995 |
| Median Family Income | 1,029 | $56,208 |
| Mean Family Income | 1,029 | $59,403 |
| Median Household Income | 1,767 | $41,188 |
| Mean Household Income | 1,767 | $47,719 |
| Income Deficit | 1,029 | $0 |
| Wage / Income Gap (%) | 4,208 | 8.76% |
| Wage / Income Gap ($) | 4,208 | 91.24¢ per $1 |
| Gini / Inequality Index | 4,208 | 0.40 |
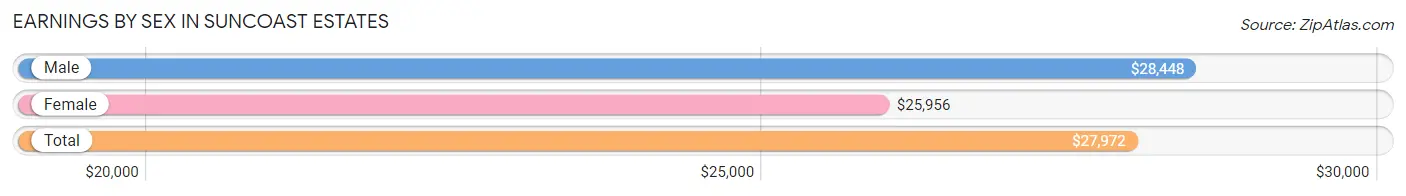
Earnings by Sex in Suncoast Estates
Average Earnings in Suncoast Estates are $27,972, $28,448 for men and $25,956 for women, a difference of 8.8%.
| Sex | Number | Average Earnings |
| Male | 1,107 (55.6%) | $28,448 |
| Female | 885 (44.4%) | $25,956 |
| Total | 1,992 (100.0%) | $27,972 |
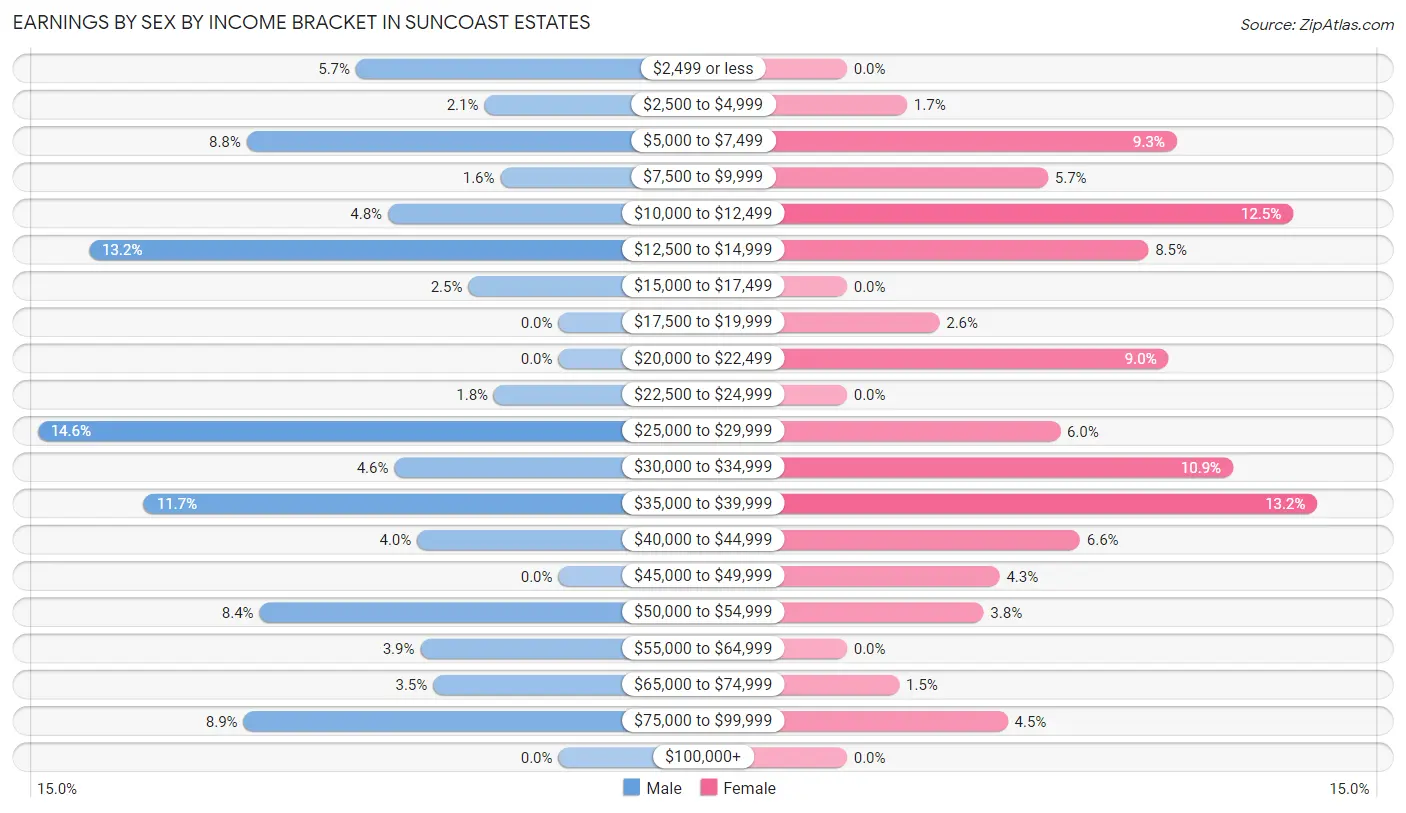
Earnings by Sex by Income Bracket in Suncoast Estates
The most common earnings brackets in Suncoast Estates are $25,000 to $29,999 for men (162 | 14.6%) and $35,000 to $39,999 for women (117 | 13.2%).
| Income | Male | Female |
| $2,499 or less | 63 (5.7%) | 0 (0.0%) |
| $2,500 to $4,999 | 23 (2.1%) | 15 (1.7%) |
| $5,000 to $7,499 | 97 (8.8%) | 82 (9.3%) |
| $7,500 to $9,999 | 18 (1.6%) | 50 (5.7%) |
| $10,000 to $12,499 | 53 (4.8%) | 111 (12.5%) |
| $12,500 to $14,999 | 146 (13.2%) | 75 (8.5%) |
| $15,000 to $17,499 | 28 (2.5%) | 0 (0.0%) |
| $17,500 to $19,999 | 0 (0.0%) | 23 (2.6%) |
| $20,000 to $22,499 | 0 (0.0%) | 80 (9.0%) |
| $22,500 to $24,999 | 20 (1.8%) | 0 (0.0%) |
| $25,000 to $29,999 | 162 (14.6%) | 53 (6.0%) |
| $30,000 to $34,999 | 51 (4.6%) | 96 (10.8%) |
| $35,000 to $39,999 | 129 (11.7%) | 117 (13.2%) |
| $40,000 to $44,999 | 44 (4.0%) | 58 (6.6%) |
| $45,000 to $49,999 | 0 (0.0%) | 38 (4.3%) |
| $50,000 to $54,999 | 93 (8.4%) | 34 (3.8%) |
| $55,000 to $64,999 | 43 (3.9%) | 0 (0.0%) |
| $65,000 to $74,999 | 39 (3.5%) | 13 (1.5%) |
| $75,000 to $99,999 | 98 (8.8%) | 40 (4.5%) |
| $100,000+ | 0 (0.0%) | 0 (0.0%) |
| Total | 1,107 (100.0%) | 885 (100.0%) |
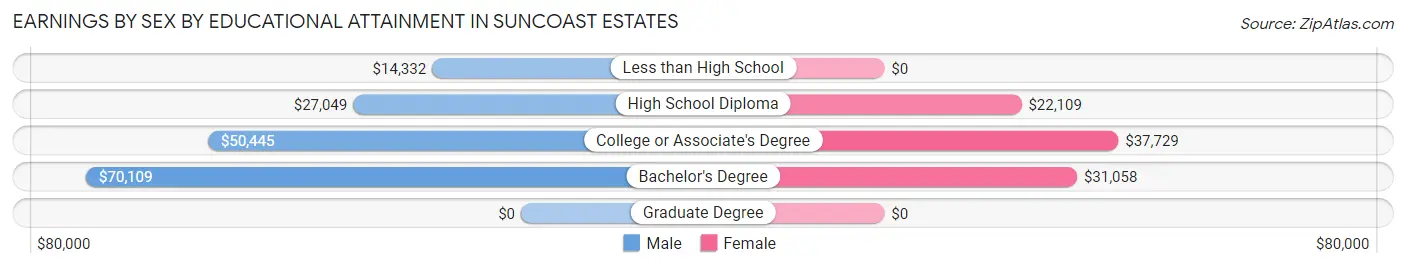
Earnings by Sex by Educational Attainment in Suncoast Estates
Average earnings in Suncoast Estates are $30,781 for men and $30,130 for women, a difference of 2.1%. Men with an educational attainment of bachelor's degree enjoy the highest average annual earnings of $70,109, while those with less than high school education earn the least with $14,332. Women with an educational attainment of college or associate's degree earn the most with the average annual earnings of $37,729, while those with high school diploma education have the smallest earnings of $22,109.
| Educational Attainment | Male Income | Female Income |
| Less than High School | $14,332 | $0 |
| High School Diploma | $27,049 | $22,109 |
| College or Associate's Degree | $50,445 | $37,729 |
| Bachelor's Degree | $70,109 | $31,058 |
| Graduate Degree | - | - |
| Total | $30,781 | $30,130 |
Family Income in Suncoast Estates
Family Income Brackets in Suncoast Estates
According to the Suncoast Estates family income data, there are 226 families falling into the $50,000 to $74,999 income range, which is the most common income bracket and makes up 22.0% of all families.
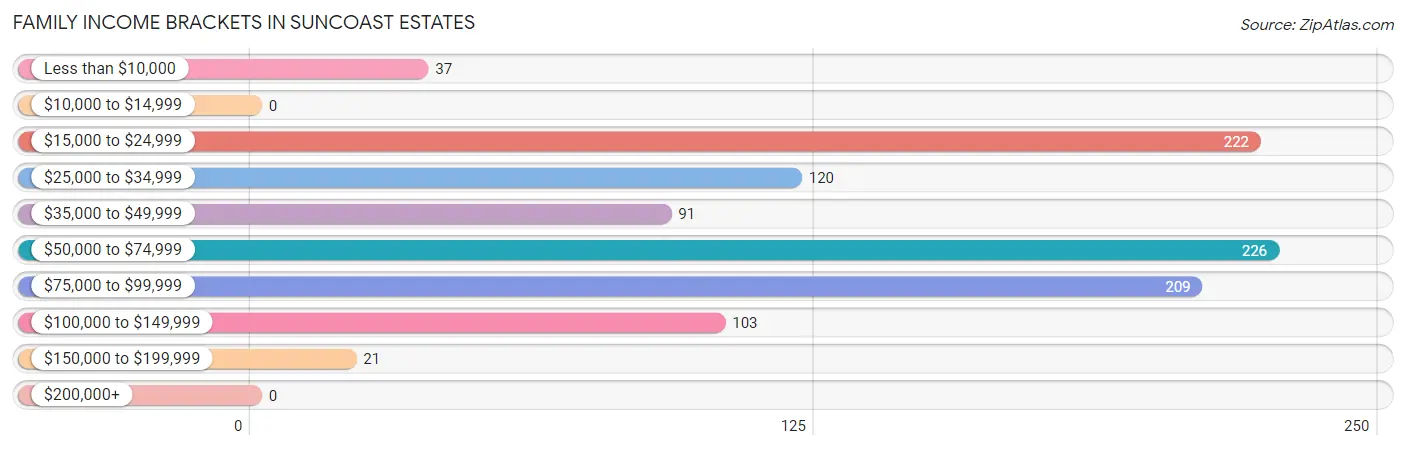
| Income Bracket | # Families | % Families |
| Less than $10,000 | 37 | 3.6% |
| $10,000 to $14,999 | 0 | 0.0% |
| $15,000 to $24,999 | 222 | 21.6% |
| $25,000 to $34,999 | 120 | 11.7% |
| $35,000 to $49,999 | 91 | 8.8% |
| $50,000 to $74,999 | 226 | 22.0% |
| $75,000 to $99,999 | 209 | 20.3% |
| $100,000 to $149,999 | 103 | 10.0% |
| $150,000 to $199,999 | 21 | 2.0% |
| $200,000+ | 0 | 0.0% |
Family Income by Famaliy Size in Suncoast Estates
4-person families (188 | 18.3%) account for the highest median family income in Suncoast Estates with $86,964 per family, while 4-person families (188 | 18.3%) have the highest median income of $21,741 per family member.
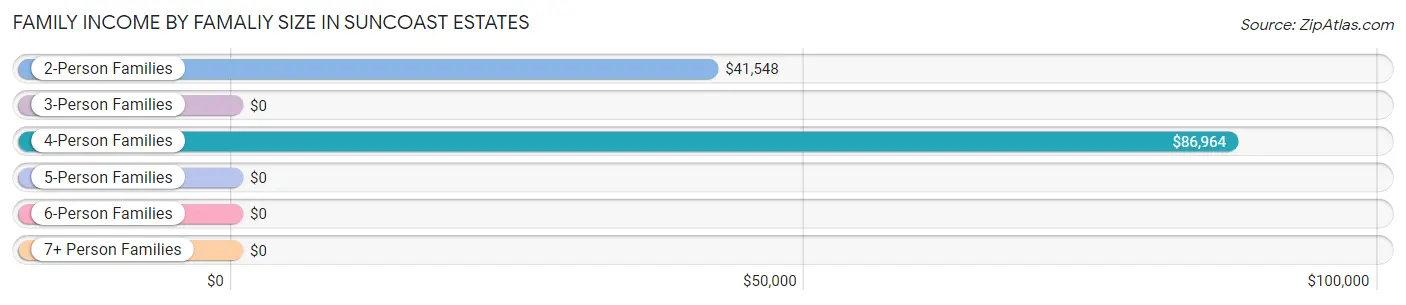
| Income Bracket | # Families | Median Income |
| 2-Person Families | 590 (57.3%) | $41,548 |
| 3-Person Families | 171 (16.6%) | $0 |
| 4-Person Families | 188 (18.3%) | $86,964 |
| 5-Person Families | 46 (4.5%) | $0 |
| 6-Person Families | 34 (3.3%) | $0 |
| 7+ Person Families | 0 (0.0%) | $0 |
| Total | 1,029 (100.0%) | $56,208 |
Family Income by Number of Earners in Suncoast Estates
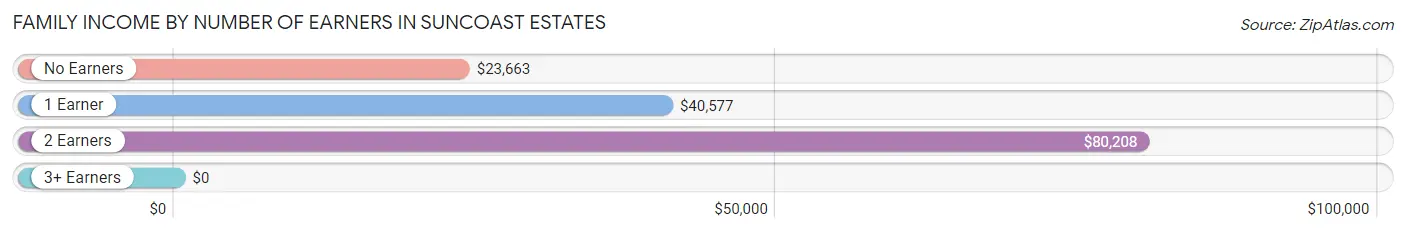
| Number of Earners | # Families | Median Income |
| No Earners | 144 (14.0%) | $23,663 |
| 1 Earner | 368 (35.8%) | $40,577 |
| 2 Earners | 462 (44.9%) | $80,208 |
| 3+ Earners | 55 (5.3%) | $0 |
| Total | 1,029 (100.0%) | $56,208 |
Household Income in Suncoast Estates
Household Income Brackets in Suncoast Estates
With 329 households falling in the category, the $50,000 to $74,999 income range is the most frequent in Suncoast Estates, accounting for 18.6% of all households.
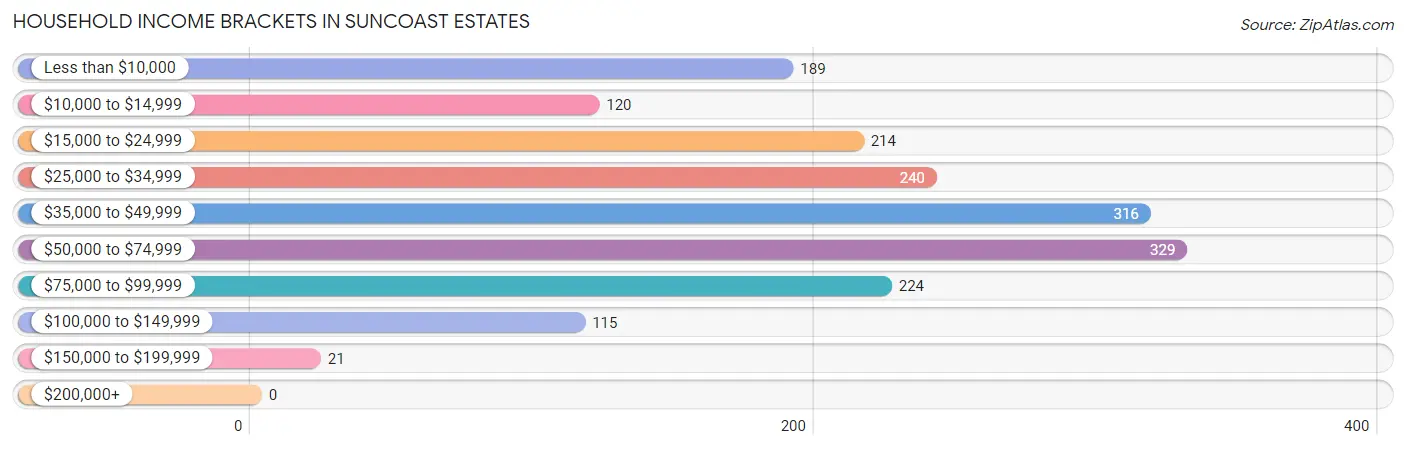
| Income Bracket | # Households | % Households |
| Less than $10,000 | 189 | 10.7% |
| $10,000 to $14,999 | 120 | 6.8% |
| $15,000 to $24,999 | 214 | 12.1% |
| $25,000 to $34,999 | 240 | 13.6% |
| $35,000 to $49,999 | 316 | 17.9% |
| $50,000 to $74,999 | 329 | 18.6% |
| $75,000 to $99,999 | 224 | 12.7% |
| $100,000 to $149,999 | 115 | 6.5% |
| $150,000 to $199,999 | 21 | 1.2% |
| $200,000+ | 0 | 0.0% |
Household Income by Householder Age in Suncoast Estates
The median household income in Suncoast Estates is $41,188, with the highest median household income of $48,490 found in the 65+ years age bracket for the primary householder. A total of 448 households (25.4%) fall into this category. Meanwhile, the 15 to 24 years age bracket for the primary householder has the lowest median household income of $0, with 38 households (2.1%) in this group.
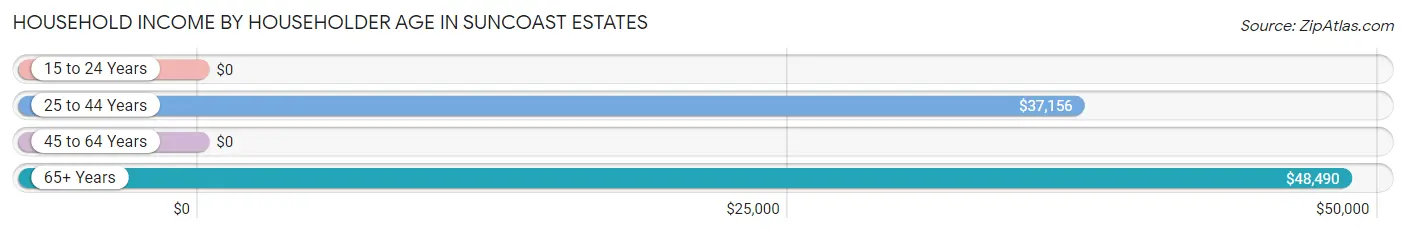
| Income Bracket | # Households | Median Income |
| 15 to 24 Years | 38 (2.1%) | $0 |
| 25 to 44 Years | 398 (22.5%) | $37,156 |
| 45 to 64 Years | 883 (50.0%) | $0 |
| 65+ Years | 448 (25.4%) | $48,490 |
| Total | 1,767 (100.0%) | $41,188 |
Poverty in Suncoast Estates
Income Below Poverty by Sex and Age in Suncoast Estates
With 19.0% poverty level for males and 18.9% for females among the residents of Suncoast Estates, 55 to 64 year old males and 55 to 64 year old females are the most vulnerable to poverty, with 284 males (43.0%) and 113 females (31.2%) in their respective age groups living below the poverty level.
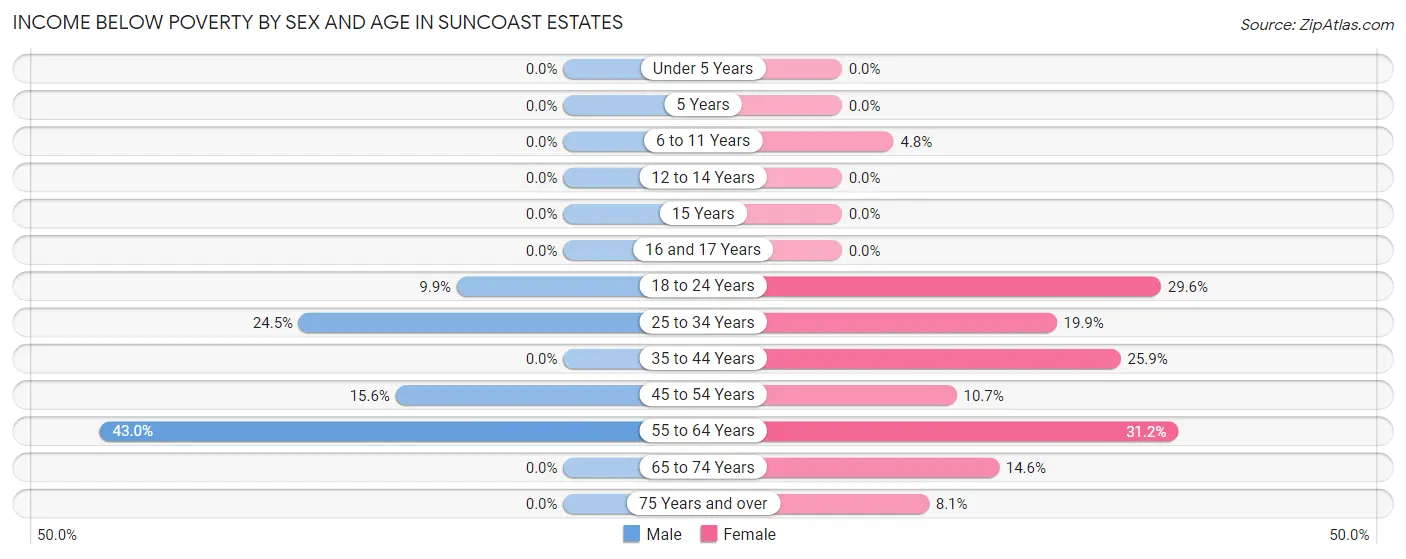
| Age Bracket | Male | Female |
| Under 5 Years | 0 (0.0%) | 0 (0.0%) |
| 5 Years | 0 (0.0%) | 0 (0.0%) |
| 6 to 11 Years | 0 (0.0%) | 6 (4.8%) |
| 12 to 14 Years | 0 (0.0%) | 0 (0.0%) |
| 15 Years | 0 (0.0%) | 0 (0.0%) |
| 16 and 17 Years | 0 (0.0%) | 0 (0.0%) |
| 18 to 24 Years | 24 (9.9%) | 45 (29.6%) |
| 25 to 34 Years | 80 (24.5%) | 54 (19.9%) |
| 35 to 44 Years | 0 (0.0%) | 82 (25.9%) |
| 45 to 54 Years | 42 (15.6%) | 18 (10.6%) |
| 55 to 64 Years | 284 (43.0%) | 113 (31.2%) |
| 65 to 74 Years | 0 (0.0%) | 37 (14.6%) |
| 75 Years and over | 0 (0.0%) | 13 (8.1%) |
| Total | 430 (19.0%) | 368 (18.9%) |
Income Above Poverty by Sex and Age in Suncoast Estates
According to the poverty statistics in Suncoast Estates, males aged 6 to 11 years and females aged under 5 years are the age groups that are most secure financially, with 100.0% of males and 100.0% of females in these age groups living above the poverty line.
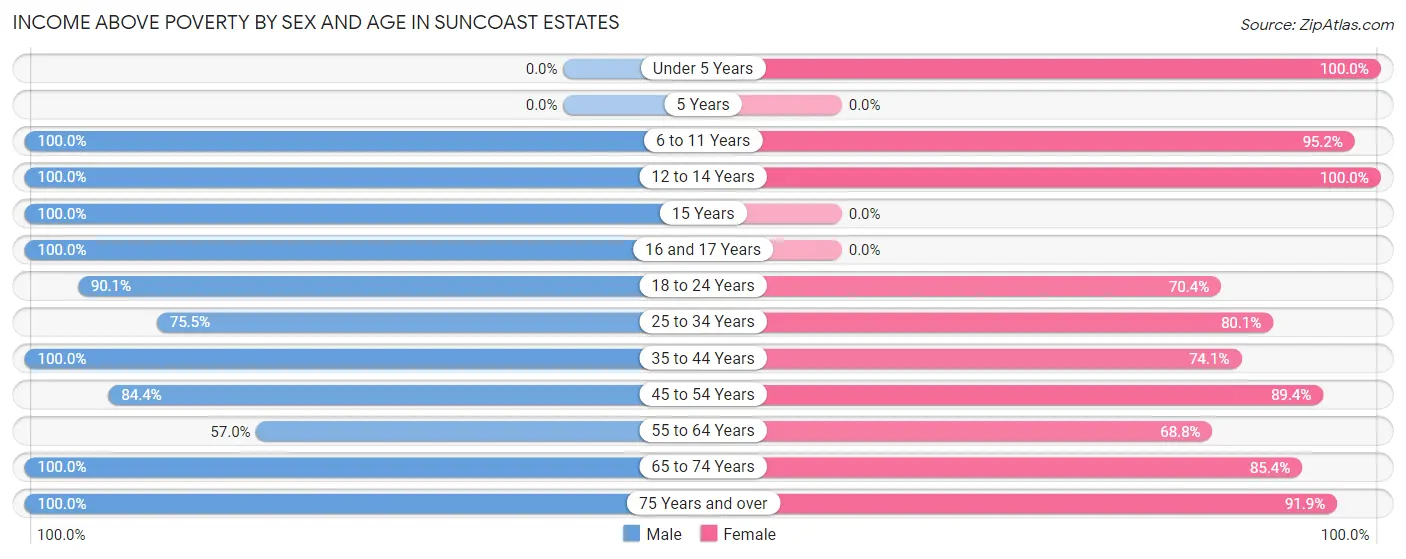
| Age Bracket | Male | Female |
| Under 5 Years | 0 (0.0%) | 112 (100.0%) |
| 5 Years | 0 (0.0%) | 0 (0.0%) |
| 6 to 11 Years | 108 (100.0%) | 119 (95.2%) |
| 12 to 14 Years | 144 (100.0%) | 27 (100.0%) |
| 15 Years | 15 (100.0%) | 0 (0.0%) |
| 16 and 17 Years | 11 (100.0%) | 0 (0.0%) |
| 18 to 24 Years | 219 (90.1%) | 107 (70.4%) |
| 25 to 34 Years | 246 (75.5%) | 217 (80.1%) |
| 35 to 44 Years | 154 (100.0%) | 235 (74.1%) |
| 45 to 54 Years | 228 (84.4%) | 151 (89.3%) |
| 55 to 64 Years | 376 (57.0%) | 249 (68.8%) |
| 65 to 74 Years | 285 (100.0%) | 217 (85.4%) |
| 75 Years and over | 42 (100.0%) | 148 (91.9%) |
| Total | 1,828 (81.0%) | 1,582 (81.1%) |
Income Below Poverty Among Married-Couple Families in Suncoast Estates
The poverty statistics for married-couple families in Suncoast Estates show that 9.7% or 73 of the total 753 families live below the poverty line. Families with no children have the highest poverty rate of 13.7%, comprising of 73 families. On the other hand, families with 1 or 2 children have the lowest poverty rate of 0.0%, which includes 0 families.
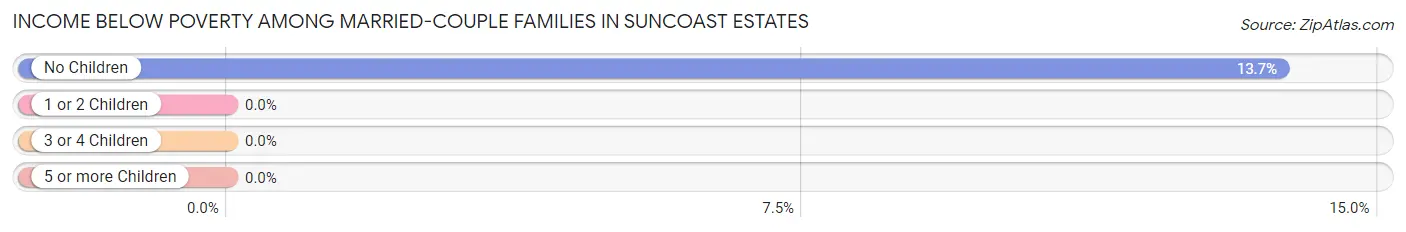
| Children | Above Poverty | Below Poverty |
| No Children | 459 (86.3%) | 73 (13.7%) |
| 1 or 2 Children | 201 (100.0%) | 0 (0.0%) |
| 3 or 4 Children | 20 (100.0%) | 0 (0.0%) |
| 5 or more Children | 0 (0.0%) | 0 (0.0%) |
| Total | 680 (90.3%) | 73 (9.7%) |
Income Below Poverty Among Single-Parent Households in Suncoast Estates
According to the poverty data in Suncoast Estates, 41.8% or 33 single-father households and 5.6% or 11 single-mother households are living below the poverty line. Among single-father households, those with no children have the highest poverty rate, with 33 households (41.8%) experiencing poverty. Likewise, among single-mother households, those with no children have the highest poverty rate, with 6 households (14.3%) falling below the poverty line.
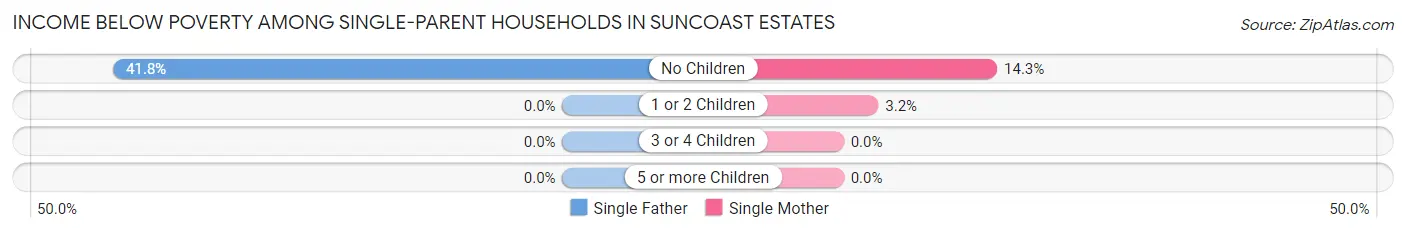
| Children | Single Father | Single Mother |
| No Children | 33 (41.8%) | 6 (14.3%) |
| 1 or 2 Children | 0 (0.0%) | 5 (3.2%) |
| 3 or 4 Children | 0 (0.0%) | 0 (0.0%) |
| 5 or more Children | 0 (0.0%) | 0 (0.0%) |
| Total | 33 (41.8%) | 11 (5.6%) |
Income Below Poverty Among Married-Couple vs Single-Parent Households in Suncoast Estates
The poverty data for Suncoast Estates shows that 73 of the married-couple family households (9.7%) and 44 of the single-parent households (15.9%) are living below the poverty level. Within the married-couple family households, those with no children have the highest poverty rate, with 73 households (13.7%) falling below the poverty line. Among the single-parent households, those with no children have the highest poverty rate, with 39 household (32.2%) living below poverty.
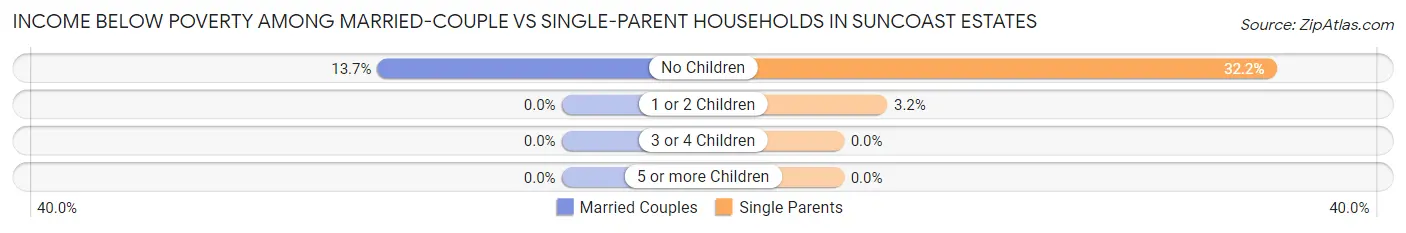
| Children | Married-Couple Families | Single-Parent Households |
| No Children | 73 (13.7%) | 39 (32.2%) |
| 1 or 2 Children | 0 (0.0%) | 5 (3.2%) |
| 3 or 4 Children | 0 (0.0%) | 0 (0.0%) |
| 5 or more Children | 0 (0.0%) | 0 (0.0%) |
| Total | 73 (9.7%) | 44 (15.9%) |
Race in Suncoast Estates
The most populous races in Suncoast Estates are White / Caucasian (3,651 | 86.8%), Hispanic or Latino (408 | 9.7%), and Two or more Races (377 | 9.0%).
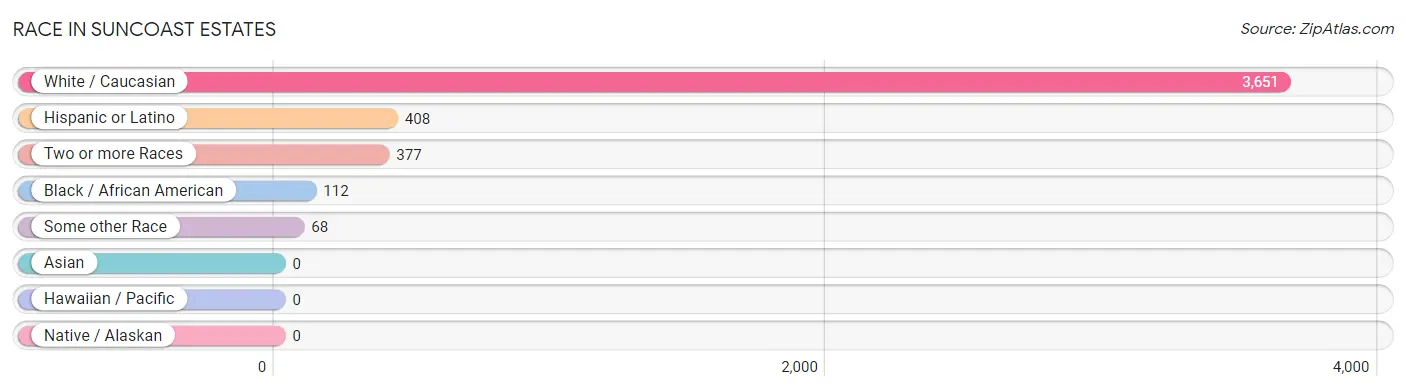
| Race | # Population | % Population |
| Asian | 0 | 0.0% |
| Black / African American | 112 | 2.7% |
| Hawaiian / Pacific | 0 | 0.0% |
| Hispanic or Latino | 408 | 9.7% |
| Native / Alaskan | 0 | 0.0% |
| White / Caucasian | 3,651 | 86.8% |
| Two or more Races | 377 | 9.0% |
| Some other Race | 68 | 1.6% |
| Total | 4,208 | 100.0% |
Ancestry in Suncoast Estates
The most populous ancestries reported in Suncoast Estates are German (689 | 16.4%), American (671 | 16.0%), Irish (514 | 12.2%), Puerto Rican (276 | 6.6%), and English (147 | 3.5%), together accounting for 54.6% of all Suncoast Estates residents.
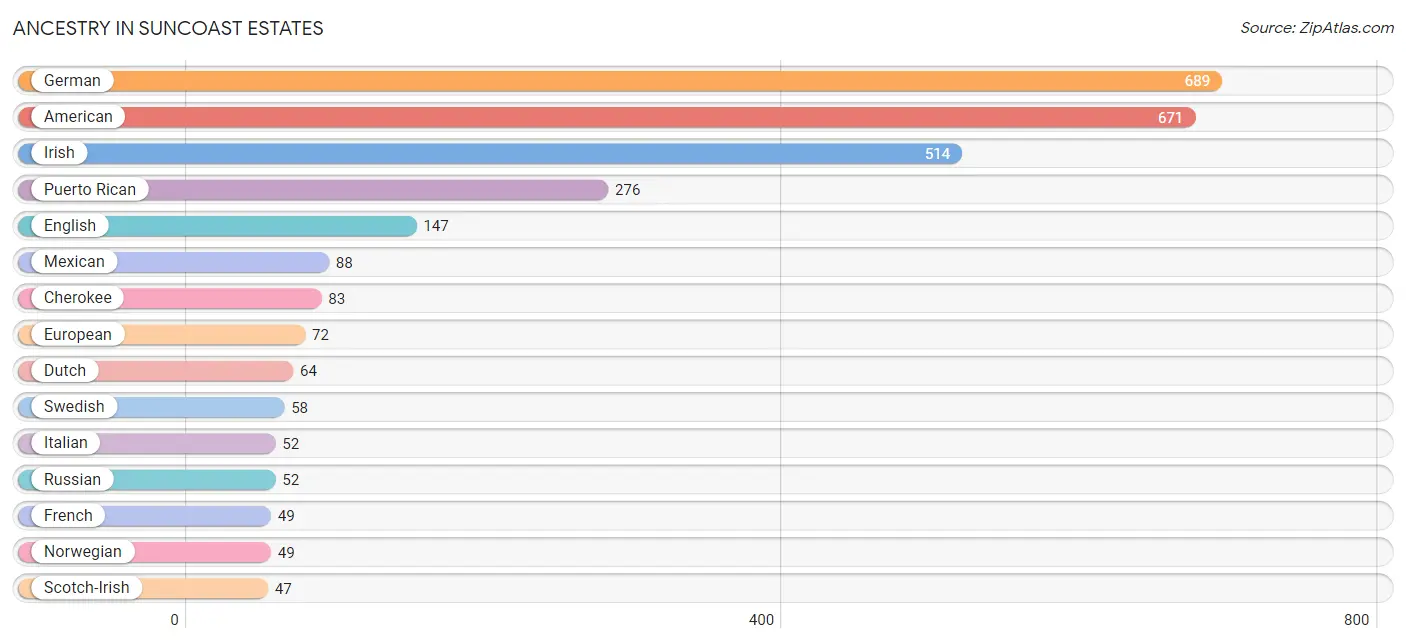
| Ancestry | # Population | % Population |
| American | 671 | 16.0% |
| Armenian | 26 | 0.6% |
| British | 15 | 0.4% |
| Central American | 29 | 0.7% |
| Cherokee | 83 | 2.0% |
| Croatian | 34 | 0.8% |
| Cuban | 15 | 0.4% |
| Czech | 30 | 0.7% |
| Dutch | 64 | 1.5% |
| English | 147 | 3.5% |
| European | 72 | 1.7% |
| French | 49 | 1.2% |
| German | 689 | 16.4% |
| Indian (Asian) | 8 | 0.2% |
| Irish | 514 | 12.2% |
| Italian | 52 | 1.2% |
| Mexican | 88 | 2.1% |
| Nicaraguan | 29 | 0.7% |
| Norwegian | 49 | 1.2% |
| Polish | 8 | 0.2% |
| Portuguese | 10 | 0.2% |
| Puerto Rican | 276 | 6.6% |
| Russian | 52 | 1.2% |
| Scotch-Irish | 47 | 1.1% |
| Scottish | 4 | 0.1% |
| Swedish | 58 | 1.4% | View All 26 Rows |
Immigrants in Suncoast Estates
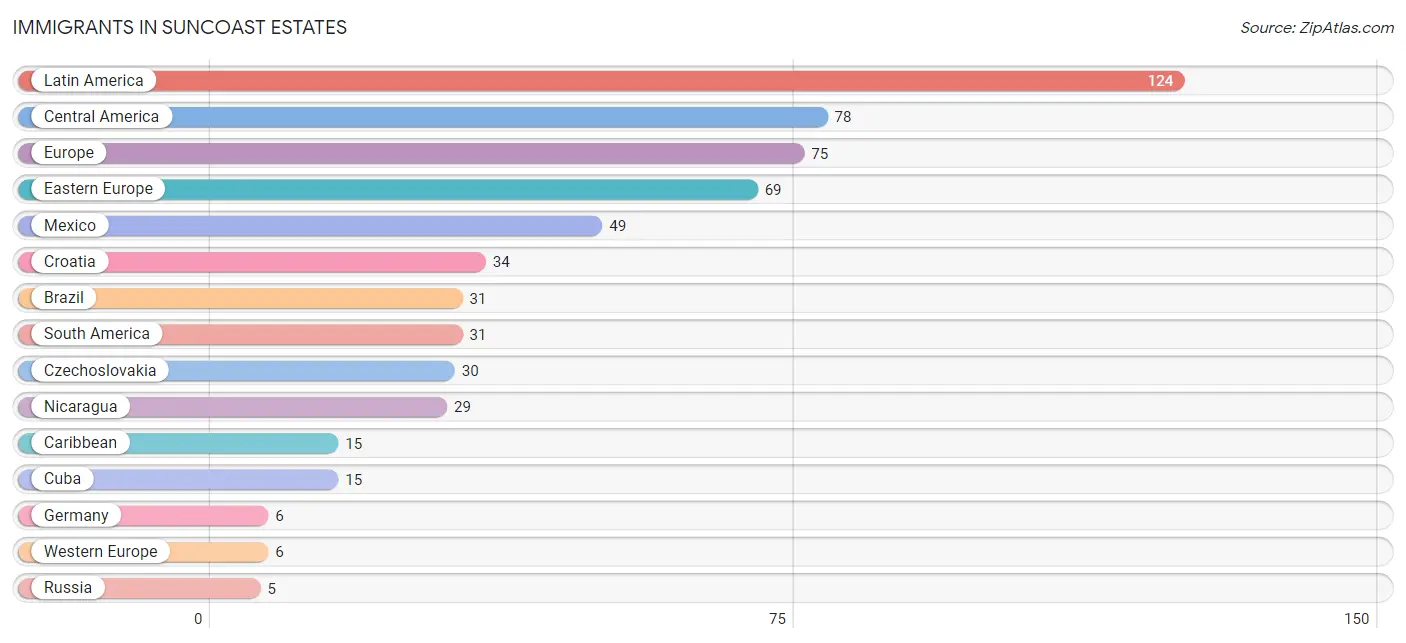
The most numerous immigrant groups reported in Suncoast Estates came from Latin America (124 | 2.9%), Central America (78 | 1.8%), Europe (75 | 1.8%), Eastern Europe (69 | 1.6%), and Mexico (49 | 1.2%), together accounting for 9.4% of all Suncoast Estates residents.
| Immigration Origin | # Population | % Population |
| Brazil | 31 | 0.7% |
| Caribbean | 15 | 0.4% |
| Central America | 78 | 1.8% |
| Croatia | 34 | 0.8% |
| Cuba | 15 | 0.4% |
| Czechoslovakia | 30 | 0.7% |
| Eastern Europe | 69 | 1.6% |
| Europe | 75 | 1.8% |
| Germany | 6 | 0.1% |
| Latin America | 124 | 2.9% |
| Mexico | 49 | 1.2% |
| Nicaragua | 29 | 0.7% |
| Russia | 5 | 0.1% |
| South America | 31 | 0.7% |
| Western Europe | 6 | 0.1% | View All 15 Rows |
Sex and Age in Suncoast Estates
Sex and Age in Suncoast Estates
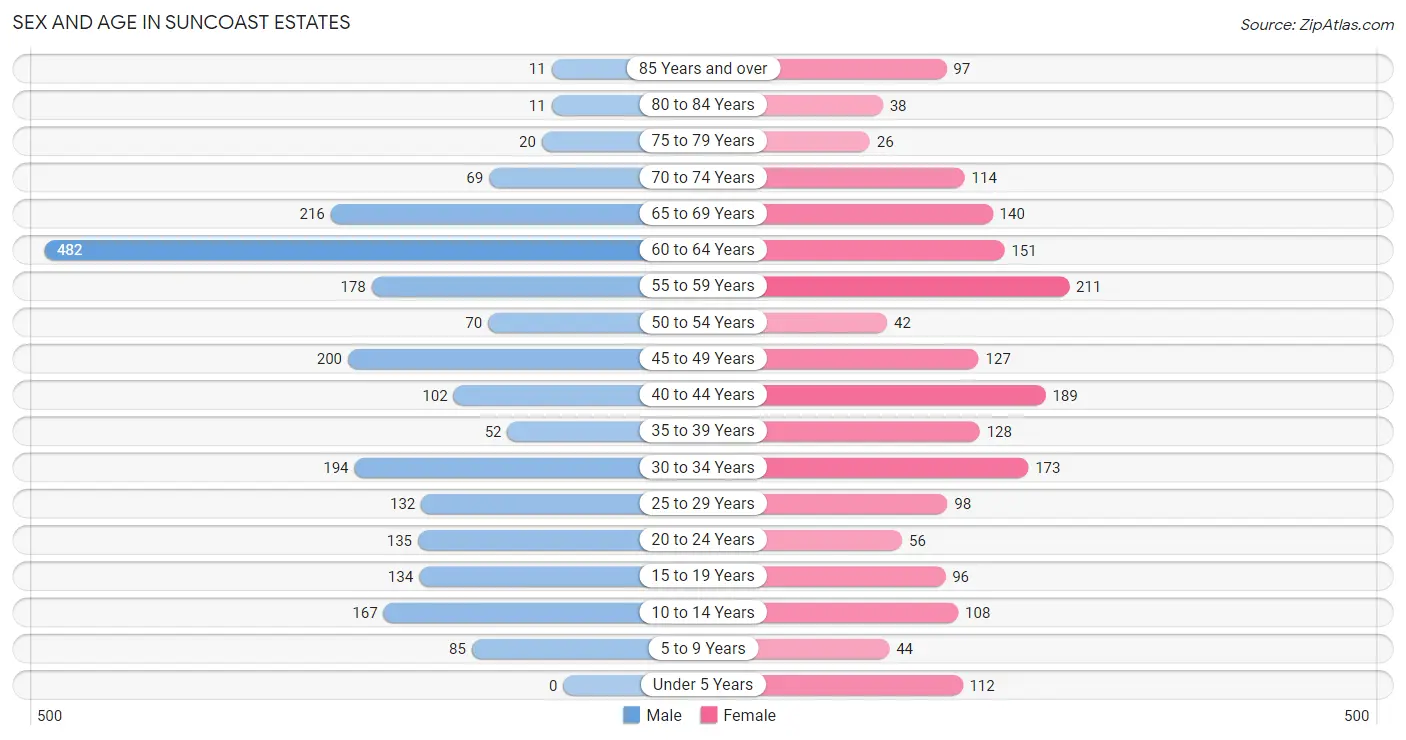
The most populous age groups in Suncoast Estates are 60 to 64 Years (482 | 21.3%) for men and 55 to 59 Years (211 | 10.8%) for women.
| Age Bracket | Male | Female |
| Under 5 Years | 0 (0.0%) | 112 (5.7%) |
| 5 to 9 Years | 85 (3.8%) | 44 (2.3%) |
| 10 to 14 Years | 167 (7.4%) | 108 (5.5%) |
| 15 to 19 Years | 134 (5.9%) | 96 (4.9%) |
| 20 to 24 Years | 135 (6.0%) | 56 (2.9%) |
| 25 to 29 Years | 132 (5.9%) | 98 (5.0%) |
| 30 to 34 Years | 194 (8.6%) | 173 (8.9%) |
| 35 to 39 Years | 52 (2.3%) | 128 (6.6%) |
| 40 to 44 Years | 102 (4.5%) | 189 (9.7%) |
| 45 to 49 Years | 200 (8.9%) | 127 (6.5%) |
| 50 to 54 Years | 70 (3.1%) | 42 (2.1%) |
| 55 to 59 Years | 178 (7.9%) | 211 (10.8%) |
| 60 to 64 Years | 482 (21.3%) | 151 (7.7%) |
| 65 to 69 Years | 216 (9.6%) | 140 (7.2%) |
| 70 to 74 Years | 69 (3.1%) | 114 (5.9%) |
| 75 to 79 Years | 20 (0.9%) | 26 (1.3%) |
| 80 to 84 Years | 11 (0.5%) | 38 (1.9%) |
| 85 Years and over | 11 (0.5%) | 97 (5.0%) |
| Total | 2,258 (100.0%) | 1,950 (100.0%) |
Families and Households in Suncoast Estates
Median Family Size in Suncoast Estates
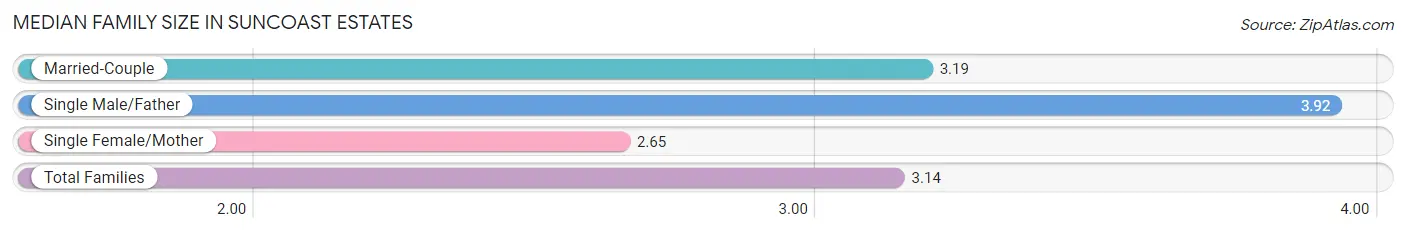
The median family size in Suncoast Estates is 3.14 persons per family, with single male/father families (79 | 7.7%) accounting for the largest median family size of 3.92 persons per family. On the other hand, single female/mother families (197 | 19.1%) represent the smallest median family size with 2.65 persons per family.
| Family Type | # Families | Family Size |
| Married-Couple | 753 (73.2%) | 3.19 |
| Single Male/Father | 79 (7.7%) | 3.92 |
| Single Female/Mother | 197 (19.1%) | 2.65 |
| Total Families | 1,029 (100.0%) | 3.14 |
Median Household Size in Suncoast Estates
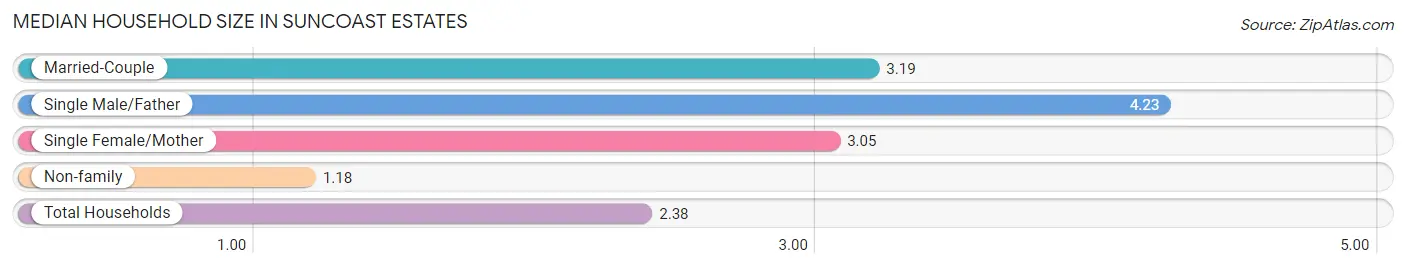
The median household size in Suncoast Estates is 2.38 persons per household, with single male/father households (79 | 4.5%) accounting for the largest median household size of 4.23 persons per household. non-family households (738 | 41.8%) represent the smallest median household size with 1.18 persons per household.
| Household Type | # Households | Household Size |
| Married-Couple | 753 (42.6%) | 3.19 |
| Single Male/Father | 79 (4.5%) | 4.23 |
| Single Female/Mother | 197 (11.2%) | 3.05 |
| Non-family | 738 (41.8%) | 1.18 |
| Total Households | 1,767 (100.0%) | 2.38 |
Household Size by Marriage Status in Suncoast Estates
Out of a total of 1,767 households in Suncoast Estates, 1,029 (58.2%) are family households, while 738 (41.8%) are nonfamily households. The most numerous type of family households are 2-person households, comprising 471, and the most common type of nonfamily households are 1-person households, comprising 653.
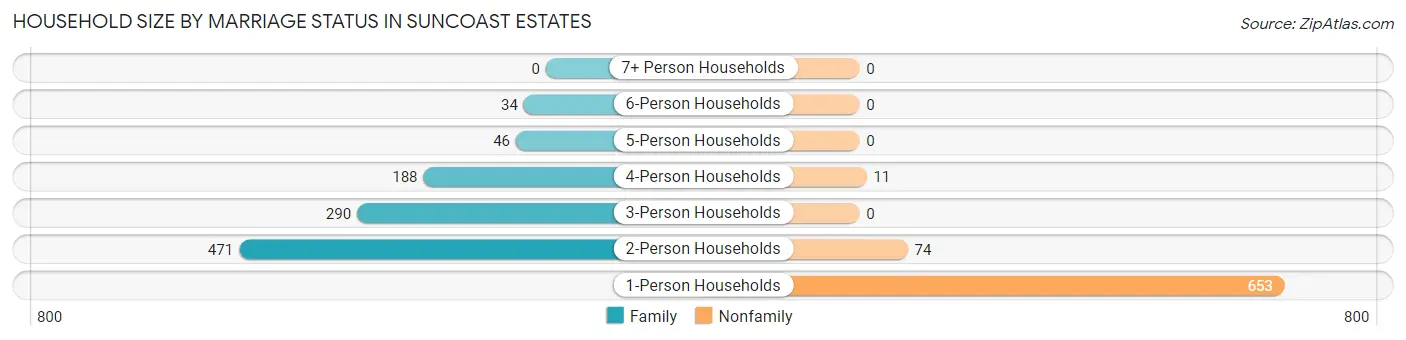
| Household Size | Family Households | Nonfamily Households |
| 1-Person Households | - | 653 (37.0%) |
| 2-Person Households | 471 (26.7%) | 74 (4.2%) |
| 3-Person Households | 290 (16.4%) | 0 (0.0%) |
| 4-Person Households | 188 (10.6%) | 11 (0.6%) |
| 5-Person Households | 46 (2.6%) | 0 (0.0%) |
| 6-Person Households | 34 (1.9%) | 0 (0.0%) |
| 7+ Person Households | 0 (0.0%) | 0 (0.0%) |
| Total | 1,029 (58.2%) | 738 (41.8%) |
Female Fertility in Suncoast Estates
Fertility by Age in Suncoast Estates
| Age Bracket | Women with Births | Births / 1,000 Women |
| 15 to 19 years | 0 (0.0%) | 0.0 |
| 20 to 34 years | 0 (0.0%) | 0.0 |
| 35 to 50 years | 0 (0.0%) | 0.0 |
| Total | 0 (0.0%) | 0.0 |
Fertility by Age by Marriage Status in Suncoast Estates
| Age Bracket | Married | Unmarried |
| 15 to 19 years | 0 (0.0%) | 0 (0.0%) |
| 20 to 34 years | 0 (0.0%) | 0 (0.0%) |
| 35 to 50 years | 0 (0.0%) | 0 (0.0%) |
| Total | 0 (0.0%) | 0 (0.0%) |
Fertility by Education in Suncoast Estates
| Educational Attainment | Women with Births | Births / 1,000 Women |
| Less than High School | 0 (0.0%) | 0.0 |
| High School Diploma | 0 (0.0%) | 0.0 |
| College or Associate's Degree | 0 (0.0%) | 0.0 |
| Bachelor's Degree | 0 (0.0%) | 0.0 |
| Graduate Degree | 0 (0.0%) | 0.0 |
| Total | 0 (0.0%) | 0.0 |
Fertility by Education by Marriage Status in Suncoast Estates
| Educational Attainment | Married | Unmarried |
| Less than High School | 0 (0.0%) | 0 (0.0%) |
| High School Diploma | 0 (0.0%) | 0 (0.0%) |
| College or Associate's Degree | 0 (0.0%) | 0 (0.0%) |
| Bachelor's Degree | 0 (0.0%) | 0 (0.0%) |
| Graduate Degree | 0 (0.0%) | 0 (0.0%) |
| Total | 0 (0.0%) | 0 (0.0%) |
Employment Characteristics in Suncoast Estates
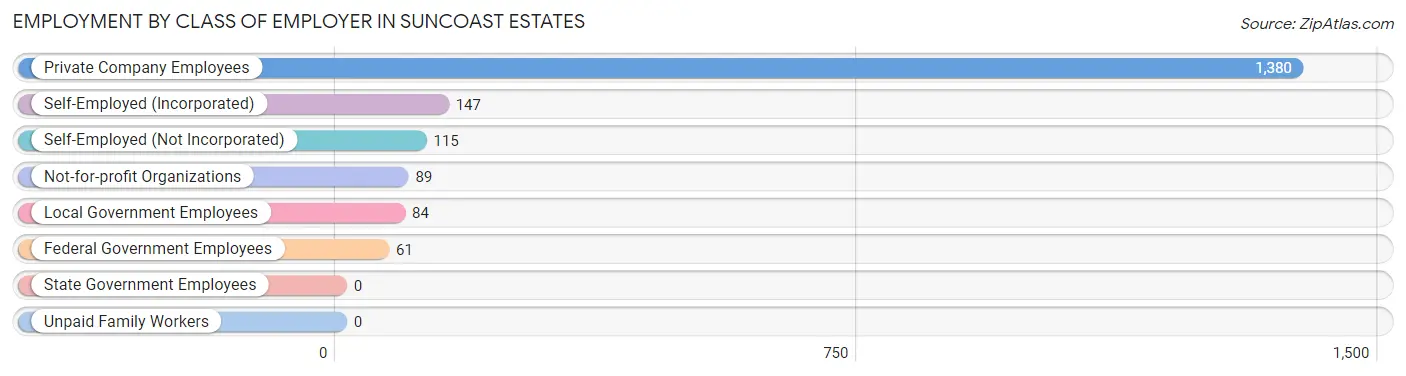
Employment by Class of Employer in Suncoast Estates
Among the 1,876 employed individuals in Suncoast Estates, private company employees (1,380 | 73.6%), self-employed (incorporated) (147 | 7.8%), and self-employed (not incorporated) (115 | 6.1%) make up the most common classes of employment.
| Employer Class | # Employees | % Employees |
| Private Company Employees | 1,380 | 73.6% |
| Self-Employed (Incorporated) | 147 | 7.8% |
| Self-Employed (Not Incorporated) | 115 | 6.1% |
| Not-for-profit Organizations | 89 | 4.7% |
| Local Government Employees | 84 | 4.5% |
| State Government Employees | 0 | 0.0% |
| Federal Government Employees | 61 | 3.3% |
| Unpaid Family Workers | 0 | 0.0% |
| Total | 1,876 | 100.0% |
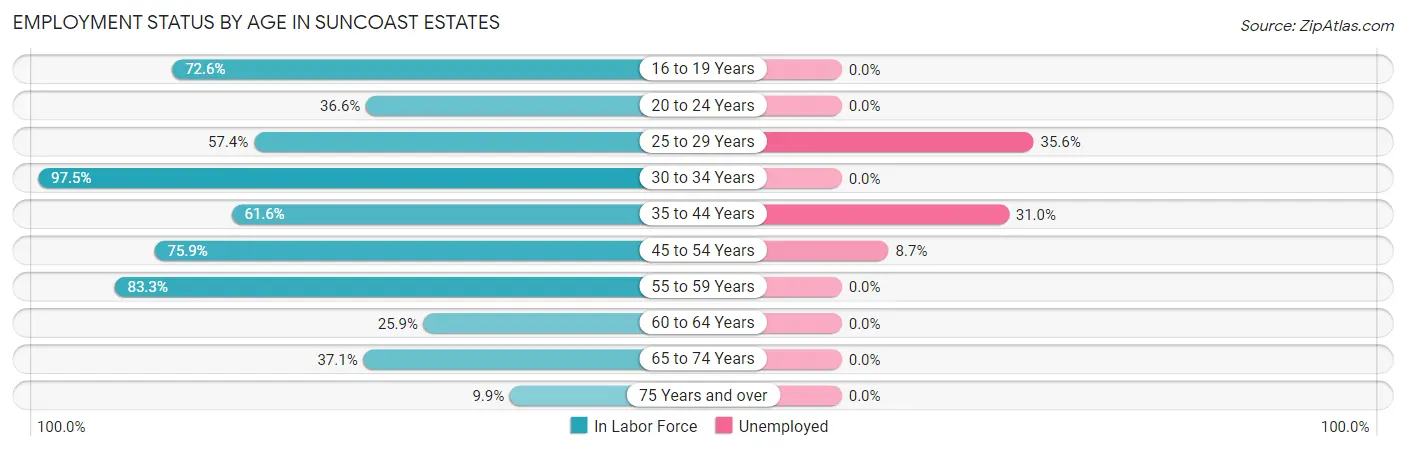
Employment Status by Age in Suncoast Estates
According to the labor force statistics for Suncoast Estates, out of the total population over 16 years of age (3,677), 55.7% or 2,048 individuals are in the labor force, with 8.1% or 166 of them unemployed. The age group with the highest labor force participation rate is 30 to 34 years, with 97.5% or 358 individuals in the labor force. Within the labor force, the 25 to 29 years age range has the highest percentage of unemployed individuals, with 35.6% or 47 of them being unemployed.
| Age Bracket | In Labor Force | Unemployed |
| 16 to 19 Years | 156 (72.6%) | 0 (0.0%) |
| 20 to 24 Years | 70 (36.6%) | 0 (0.0%) |
| 25 to 29 Years | 132 (57.4%) | 47 (35.6%) |
| 30 to 34 Years | 358 (97.5%) | 0 (0.0%) |
| 35 to 44 Years | 290 (61.6%) | 90 (31.0%) |
| 45 to 54 Years | 333 (75.9%) | 29 (8.7%) |
| 55 to 59 Years | 324 (83.3%) | 0 (0.0%) |
| 60 to 64 Years | 164 (25.9%) | 0 (0.0%) |
| 65 to 74 Years | 200 (37.1%) | 0 (0.0%) |
| 75 Years and over | 20 (9.9%) | 0 (0.0%) |
| Total | 2,048 (55.7%) | 166 (8.1%) |
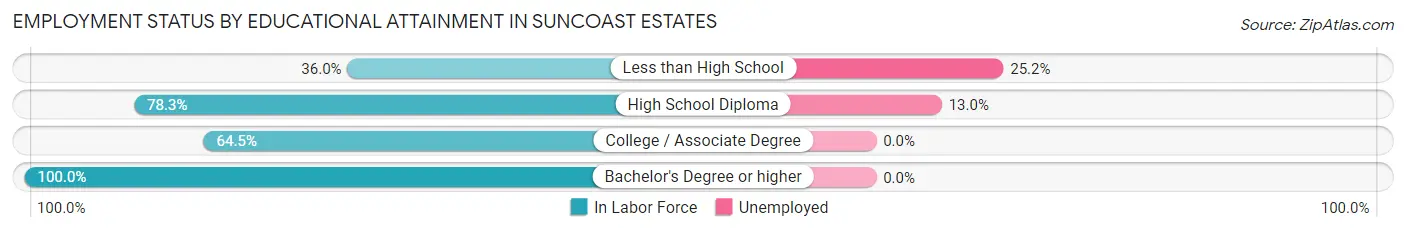
Employment Status by Educational Attainment in Suncoast Estates
According to labor force statistics for Suncoast Estates, 63.3% of individuals (1,601) out of the total population between 25 and 64 years of age (2,529) are in the labor force, with 10.4% or 167 of them being unemployed. The group with the highest labor force participation rate are those with the educational attainment of bachelor's degree or higher, with 100.0% or 91 individuals in the labor force. Within the labor force, individuals with less than high school education have the highest percentage of unemployment, with 25.2% or 64 of them being unemployed.
| Educational Attainment | In Labor Force | Unemployed |
| Less than High School | 254 (36.0%) | 178 (25.2%) |
| High School Diploma | 785 (78.3%) | 130 (13.0%) |
| College / Associate Degree | 471 (64.5%) | 0 (0.0%) |
| Bachelor's Degree or higher | 91 (100.0%) | 0 (0.0%) |
| Total | 1,601 (63.3%) | 263 (10.4%) |
Employment Occupations by Sex in Suncoast Estates
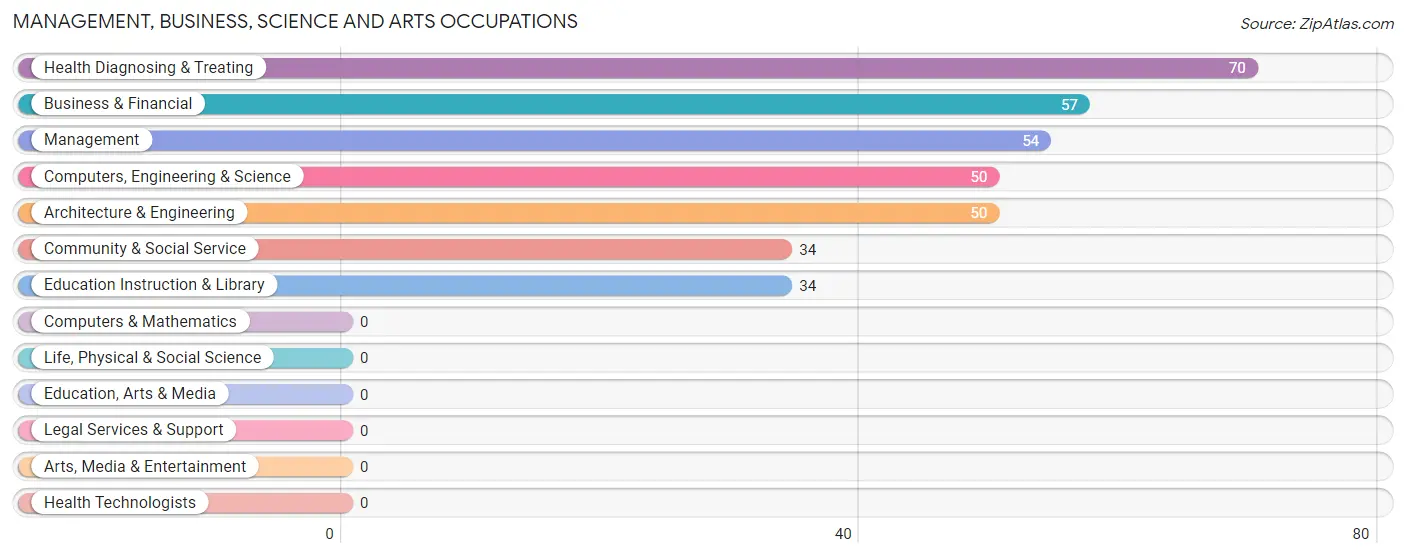
Management, Business, Science and Arts Occupations
The most common Management, Business, Science and Arts occupations in Suncoast Estates are Health Diagnosing & Treating (70 | 3.7%), Business & Financial (57 | 3.0%), Management (54 | 2.9%), Computers, Engineering & Science (50 | 2.7%), and Architecture & Engineering (50 | 2.7%).
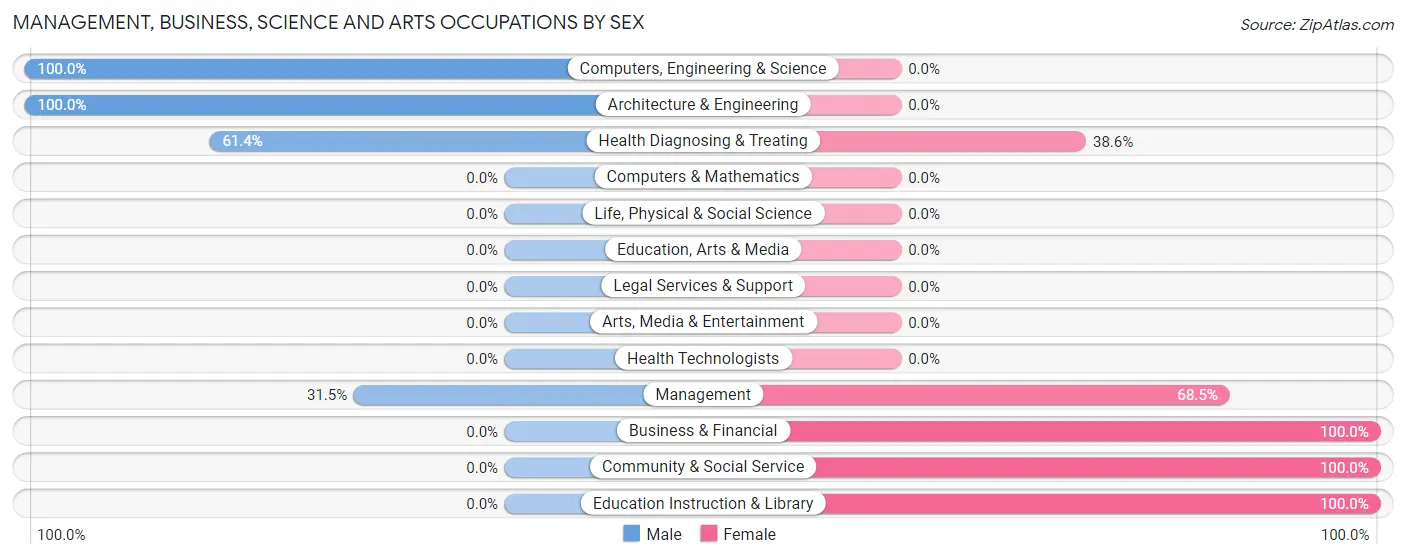
Management, Business, Science and Arts Occupations by Sex
Within the Management, Business, Science and Arts occupations in Suncoast Estates, the most male-oriented occupations are Computers, Engineering & Science (100.0%), Architecture & Engineering (100.0%), and Health Diagnosing & Treating (61.4%), while the most female-oriented occupations are Business & Financial (100.0%), Community & Social Service (100.0%), and Education Instruction & Library (100.0%).
| Occupation | Male | Female |
| Management | 17 (31.5%) | 37 (68.5%) |
| Business & Financial | 0 (0.0%) | 57 (100.0%) |
| Computers, Engineering & Science | 50 (100.0%) | 0 (0.0%) |
| Computers & Mathematics | 0 (0.0%) | 0 (0.0%) |
| Architecture & Engineering | 50 (100.0%) | 0 (0.0%) |
| Life, Physical & Social Science | 0 (0.0%) | 0 (0.0%) |
| Community & Social Service | 0 (0.0%) | 34 (100.0%) |
| Education, Arts & Media | 0 (0.0%) | 0 (0.0%) |
| Legal Services & Support | 0 (0.0%) | 0 (0.0%) |
| Education Instruction & Library | 0 (0.0%) | 34 (100.0%) |
| Arts, Media & Entertainment | 0 (0.0%) | 0 (0.0%) |
| Health Diagnosing & Treating | 43 (61.4%) | 27 (38.6%) |
| Health Technologists | 0 (0.0%) | 0 (0.0%) |
| Total (Category) | 110 (41.5%) | 155 (58.5%) |
| Total (Overall) | 1,037 (55.1%) | 844 (44.9%) |
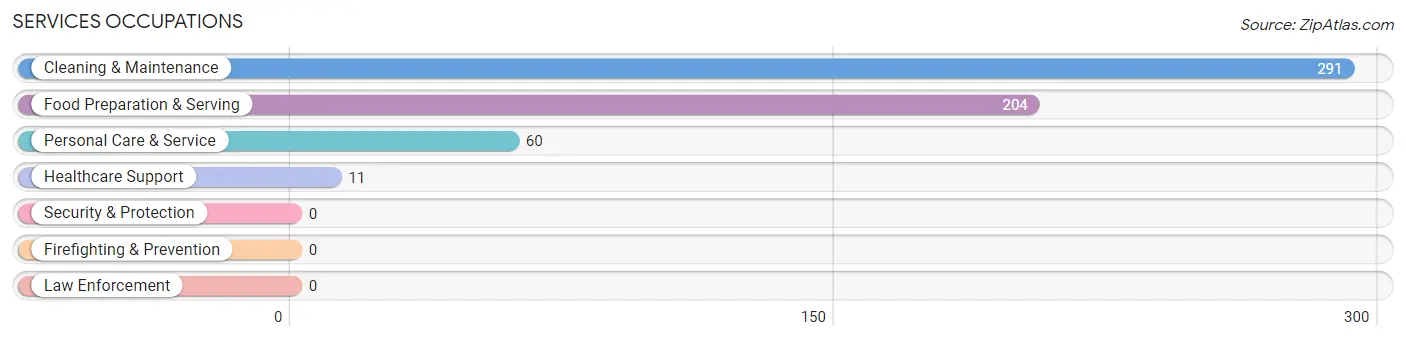
Services Occupations
The most common Services occupations in Suncoast Estates are Cleaning & Maintenance (291 | 15.5%), Food Preparation & Serving (204 | 10.8%), Personal Care & Service (60 | 3.2%), and Healthcare Support (11 | 0.6%).
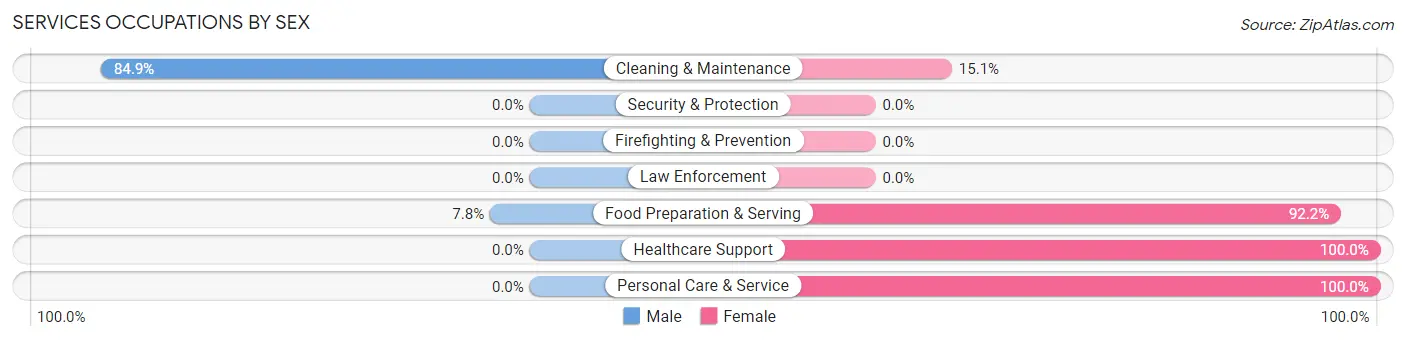
Services Occupations by Sex
Within the Services occupations in Suncoast Estates, the most male-oriented occupations are Cleaning & Maintenance (84.9%), and Food Preparation & Serving (7.8%), while the most female-oriented occupations are Healthcare Support (100.0%), Personal Care & Service (100.0%), and Food Preparation & Serving (92.2%).
| Occupation | Male | Female |
| Healthcare Support | 0 (0.0%) | 11 (100.0%) |
| Security & Protection | 0 (0.0%) | 0 (0.0%) |
| Firefighting & Prevention | 0 (0.0%) | 0 (0.0%) |
| Law Enforcement | 0 (0.0%) | 0 (0.0%) |
| Food Preparation & Serving | 16 (7.8%) | 188 (92.2%) |
| Cleaning & Maintenance | 247 (84.9%) | 44 (15.1%) |
| Personal Care & Service | 0 (0.0%) | 60 (100.0%) |
| Total (Category) | 263 (46.5%) | 303 (53.5%) |
| Total (Overall) | 1,037 (55.1%) | 844 (44.9%) |
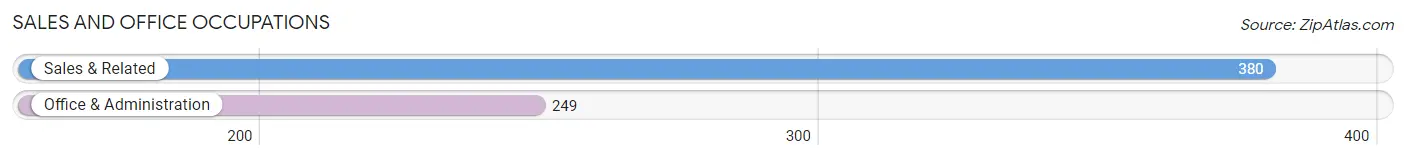
Sales and Office Occupations
The most common Sales and Office occupations in Suncoast Estates are Sales & Related (380 | 20.2%), and Office & Administration (249 | 13.2%).
Sales and Office Occupations by Sex
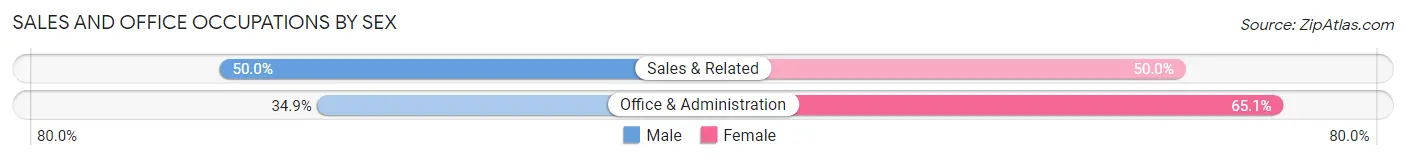
| Occupation | Male | Female |
| Sales & Related | 190 (50.0%) | 190 (50.0%) |
| Office & Administration | 87 (34.9%) | 162 (65.1%) |
| Total (Category) | 277 (44.0%) | 352 (56.0%) |
| Total (Overall) | 1,037 (55.1%) | 844 (44.9%) |
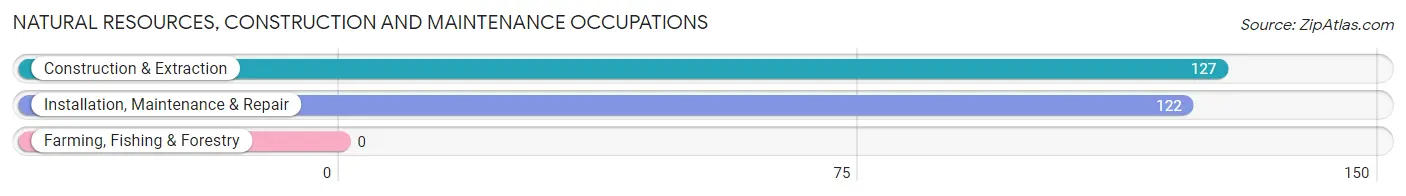
Natural Resources, Construction and Maintenance Occupations
The most common Natural Resources, Construction and Maintenance occupations in Suncoast Estates are Construction & Extraction (127 | 6.8%), and Installation, Maintenance & Repair (122 | 6.5%).
Natural Resources, Construction and Maintenance Occupations by Sex
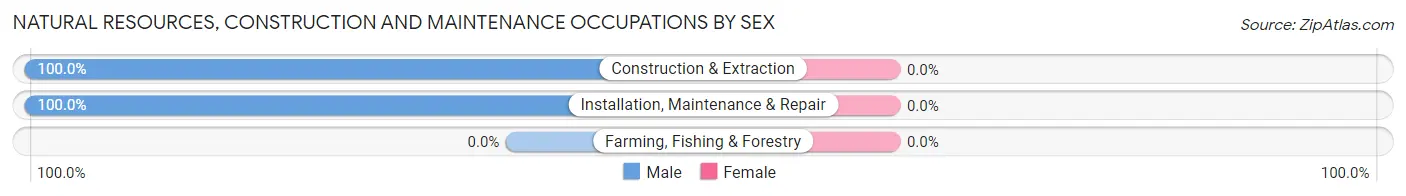
| Occupation | Male | Female |
| Farming, Fishing & Forestry | 0 (0.0%) | 0 (0.0%) |
| Construction & Extraction | 127 (100.0%) | 0 (0.0%) |
| Installation, Maintenance & Repair | 122 (100.0%) | 0 (0.0%) |
| Total (Category) | 249 (100.0%) | 0 (0.0%) |
| Total (Overall) | 1,037 (55.1%) | 844 (44.9%) |
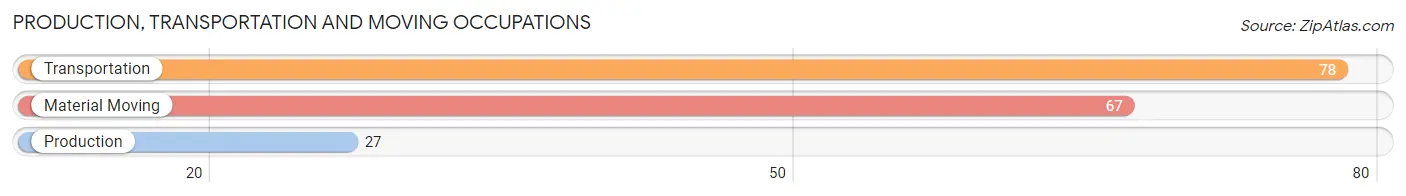
Production, Transportation and Moving Occupations
The most common Production, Transportation and Moving occupations in Suncoast Estates are Transportation (78 | 4.2%), Material Moving (67 | 3.6%), and Production (27 | 1.4%).
Production, Transportation and Moving Occupations by Sex
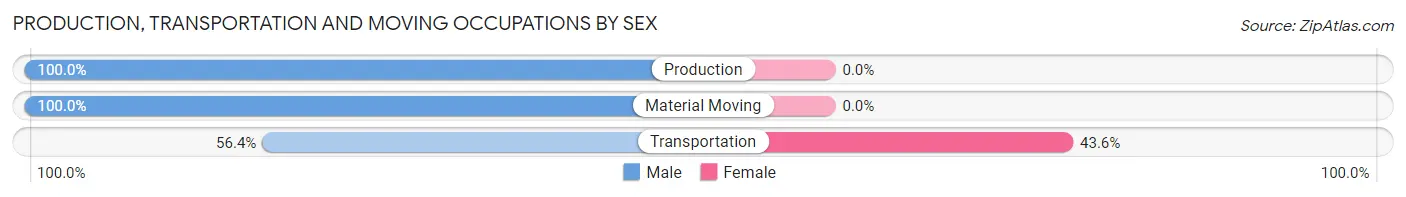
| Occupation | Male | Female |
| Production | 27 (100.0%) | 0 (0.0%) |
| Transportation | 44 (56.4%) | 34 (43.6%) |
| Material Moving | 67 (100.0%) | 0 (0.0%) |
| Total (Category) | 138 (80.2%) | 34 (19.8%) |
| Total (Overall) | 1,037 (55.1%) | 844 (44.9%) |
Employment Industries by Sex in Suncoast Estates
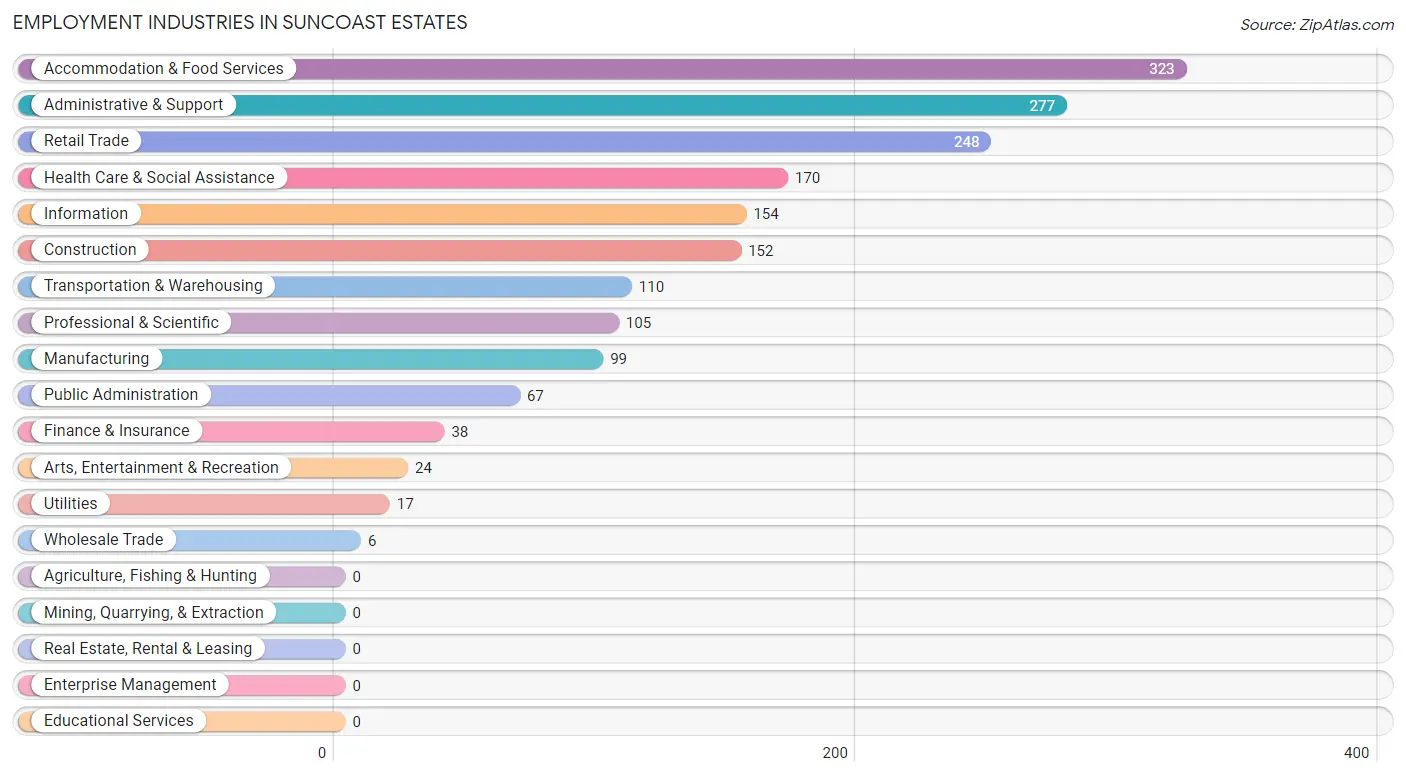
Employment Industries in Suncoast Estates
The major employment industries in Suncoast Estates include Accommodation & Food Services (323 | 17.2%), Administrative & Support (277 | 14.7%), Retail Trade (248 | 13.2%), Health Care & Social Assistance (170 | 9.0%), and Information (154 | 8.2%).
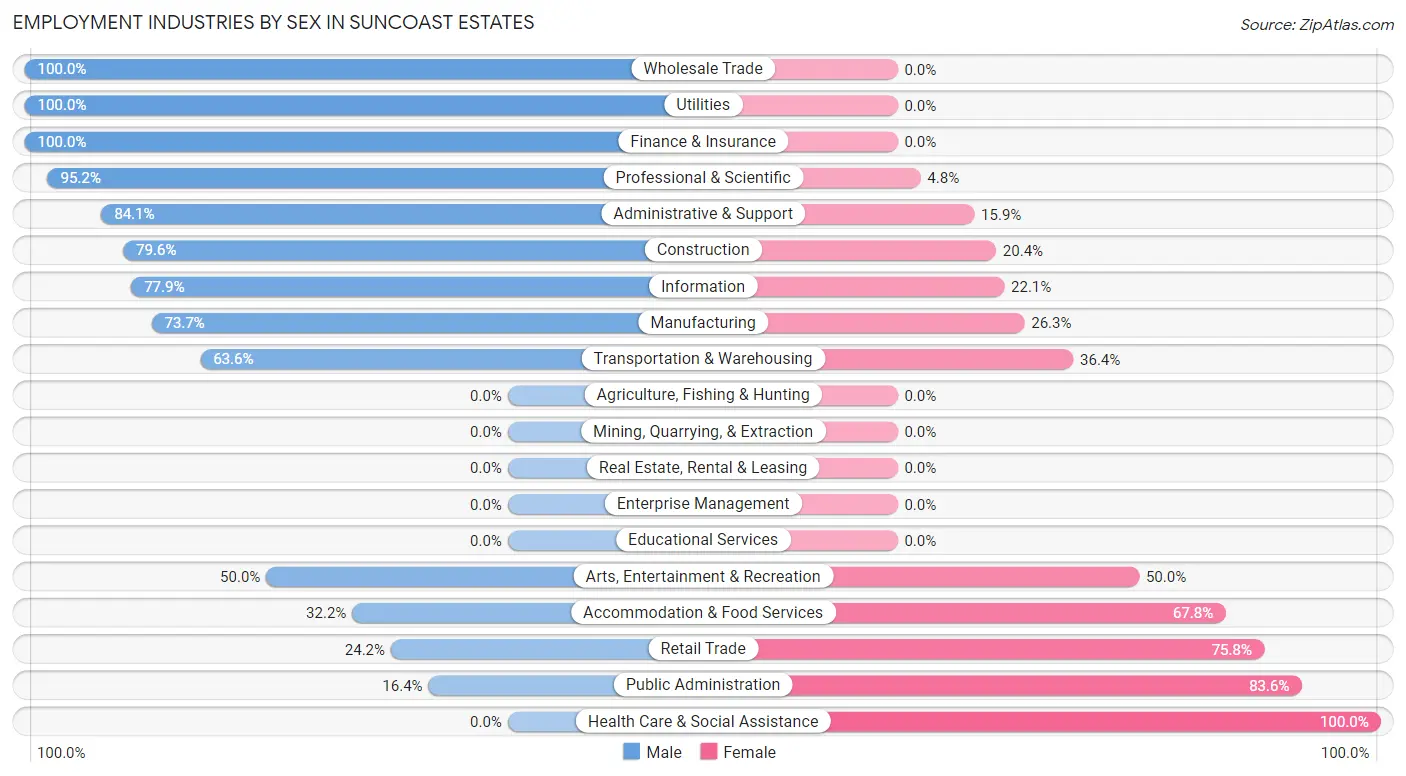
Employment Industries by Sex in Suncoast Estates
The Suncoast Estates industries that see more men than women are Wholesale Trade (100.0%), Utilities (100.0%), and Finance & Insurance (100.0%), whereas the industries that tend to have a higher number of women are Health Care & Social Assistance (100.0%), Public Administration (83.6%), and Retail Trade (75.8%).
| Industry | Male | Female |
| Agriculture, Fishing & Hunting | 0 (0.0%) | 0 (0.0%) |
| Mining, Quarrying, & Extraction | 0 (0.0%) | 0 (0.0%) |
| Construction | 121 (79.6%) | 31 (20.4%) |
| Manufacturing | 73 (73.7%) | 26 (26.3%) |
| Wholesale Trade | 6 (100.0%) | 0 (0.0%) |
| Retail Trade | 60 (24.2%) | 188 (75.8%) |
| Transportation & Warehousing | 70 (63.6%) | 40 (36.4%) |
| Utilities | 17 (100.0%) | 0 (0.0%) |
| Information | 120 (77.9%) | 34 (22.1%) |
| Finance & Insurance | 38 (100.0%) | 0 (0.0%) |
| Real Estate, Rental & Leasing | 0 (0.0%) | 0 (0.0%) |
| Professional & Scientific | 100 (95.2%) | 5 (4.8%) |
| Enterprise Management | 0 (0.0%) | 0 (0.0%) |
| Administrative & Support | 233 (84.1%) | 44 (15.9%) |
| Educational Services | 0 (0.0%) | 0 (0.0%) |
| Health Care & Social Assistance | 0 (0.0%) | 170 (100.0%) |
| Arts, Entertainment & Recreation | 12 (50.0%) | 12 (50.0%) |
| Accommodation & Food Services | 104 (32.2%) | 219 (67.8%) |
| Public Administration | 11 (16.4%) | 56 (83.6%) |
| Total | 1,037 (55.1%) | 844 (44.9%) |
Education in Suncoast Estates
School Enrollment in Suncoast Estates
The most common levels of schooling among the 683 students in Suncoast Estates are middle school (275 | 40.3%), high school (178 | 26.1%), and elementary school (111 | 16.3%).
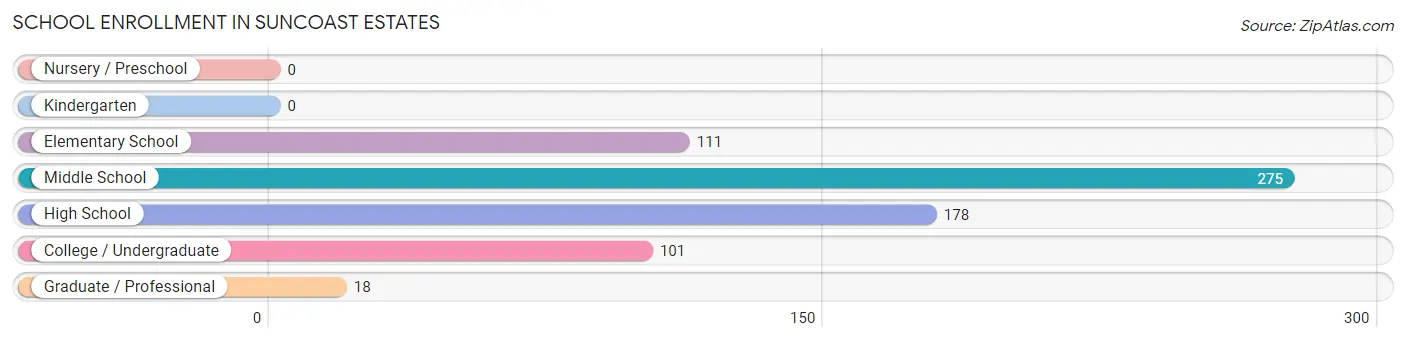
| School Level | # Students | % Students |
| Nursery / Preschool | 0 | 0.0% |
| Kindergarten | 0 | 0.0% |
| Elementary School | 111 | 16.3% |
| Middle School | 275 | 40.3% |
| High School | 178 | 26.1% |
| College / Undergraduate | 101 | 14.8% |
| Graduate / Professional | 18 | 2.6% |
| Total | 683 | 100.0% |
School Enrollment by Age by Funding Source in Suncoast Estates
Out of a total of 683 students who are enrolled in schools in Suncoast Estates, 87 (12.7%) attend a private institution, while the remaining 596 (87.3%) are enrolled in public schools. The age group of 15 to 17 year olds has the highest likelihood of being enrolled in private schools, with 15 (57.7% in the age bracket) enrolled. Conversely, the age group of 5 to 9 year old has the lowest likelihood of being enrolled in a private school, with 111 (100.0% in the age bracket) attending a public institution.
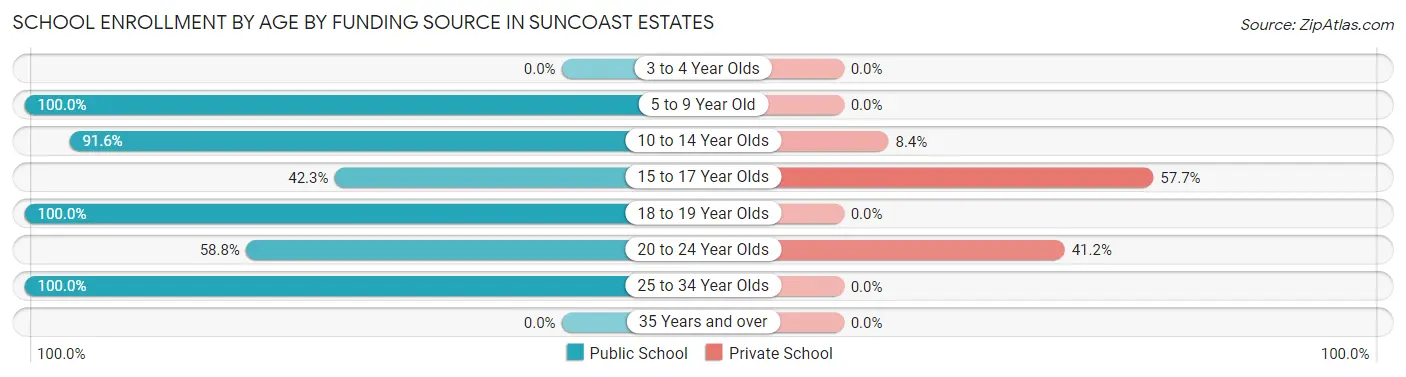
| Age Bracket | Public School | Private School |
| 3 to 4 Year Olds | 0 (0.0%) | 0 (0.0%) |
| 5 to 9 Year Old | 111 (100.0%) | 0 (0.0%) |
| 10 to 14 Year Olds | 252 (91.6%) | 23 (8.4%) |
| 15 to 17 Year Olds | 11 (42.3%) | 15 (57.7%) |
| 18 to 19 Year Olds | 145 (100.0%) | 0 (0.0%) |
| 20 to 24 Year Olds | 70 (58.8%) | 49 (41.2%) |
| 25 to 34 Year Olds | 7 (100.0%) | 0 (0.0%) |
| 35 Years and over | 0 (0.0%) | 0 (0.0%) |
| Total | 596 (87.3%) | 87 (12.7%) |
Educational Attainment by Field of Study in Suncoast Estates
Business (60 | 31.9%), visual & performing arts (26 | 13.8%), communications (23 | 12.2%), computers & mathematics (16 | 8.5%), and science & technology (16 | 8.5%) are the most common fields of study among 188 individuals in Suncoast Estates who have obtained a bachelor's degree or higher.
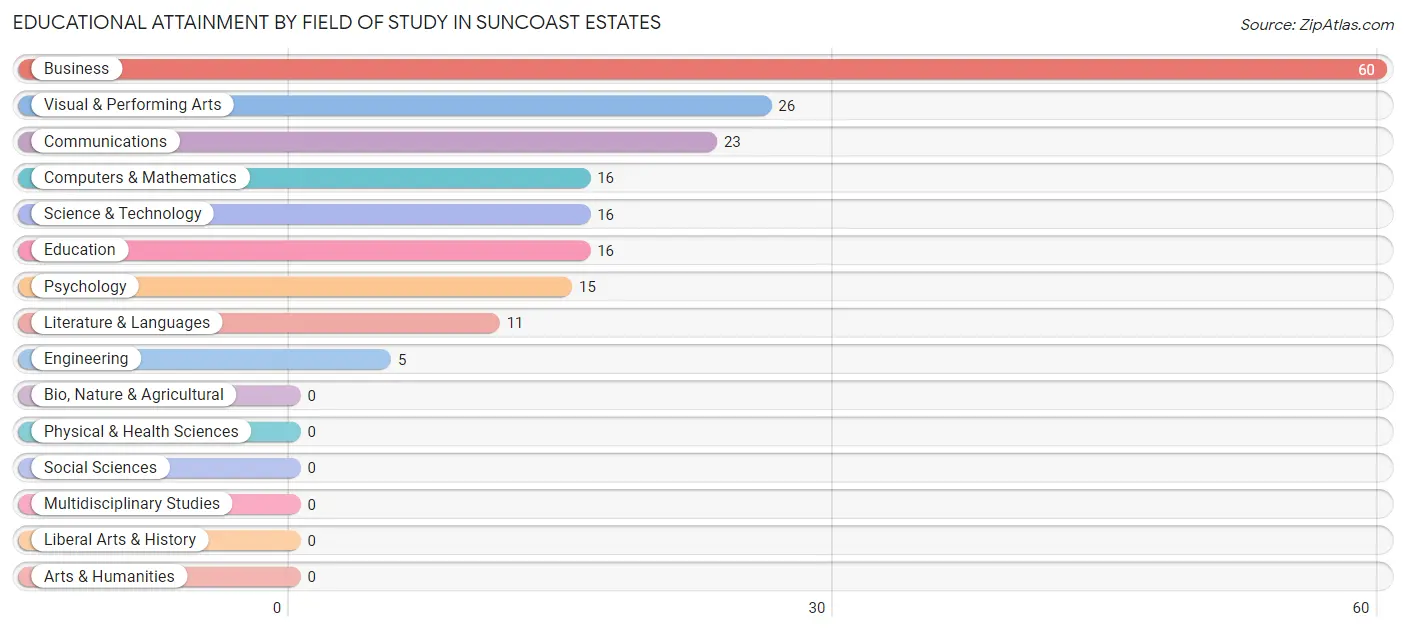
| Field of Study | # Graduates | % Graduates |
| Computers & Mathematics | 16 | 8.5% |
| Bio, Nature & Agricultural | 0 | 0.0% |
| Physical & Health Sciences | 0 | 0.0% |
| Psychology | 15 | 8.0% |
| Social Sciences | 0 | 0.0% |
| Engineering | 5 | 2.7% |
| Multidisciplinary Studies | 0 | 0.0% |
| Science & Technology | 16 | 8.5% |
| Business | 60 | 31.9% |
| Education | 16 | 8.5% |
| Literature & Languages | 11 | 5.9% |
| Liberal Arts & History | 0 | 0.0% |
| Visual & Performing Arts | 26 | 13.8% |
| Communications | 23 | 12.2% |
| Arts & Humanities | 0 | 0.0% |
| Total | 188 | 100.0% |
Transportation & Commute in Suncoast Estates
Vehicle Availability by Sex in Suncoast Estates
The most prevalent vehicle ownership categories in Suncoast Estates are males with 1 vehicle (441, accounting for 42.7%) and females with 1 vehicle (339, making up 52.2%).
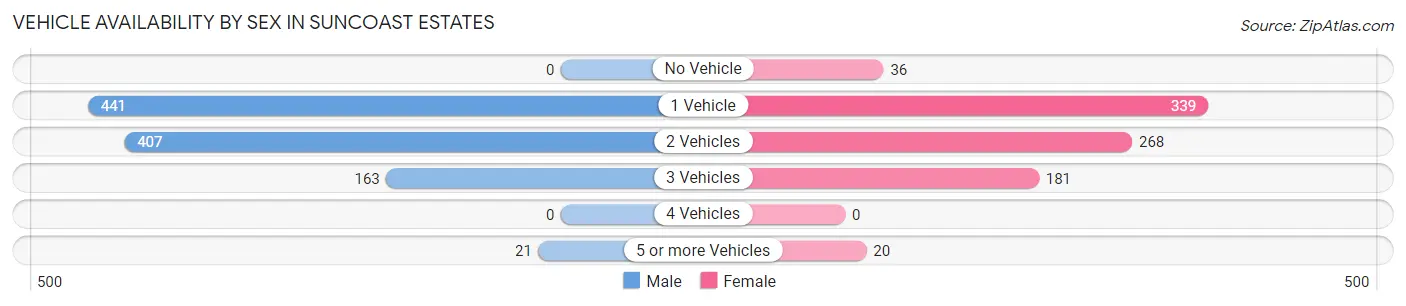
| Vehicles Available | Male | Female |
| No Vehicle | 0 (0.0%) | 36 (4.3%) |
| 1 Vehicle | 441 (42.7%) | 339 (40.2%) |
| 2 Vehicles | 407 (39.4%) | 268 (31.8%) |
| 3 Vehicles | 163 (15.8%) | 181 (21.4%) |
| 4 Vehicles | 0 (0.0%) | 0 (0.0%) |
| 5 or more Vehicles | 21 (2.0%) | 20 (2.4%) |
| Total | 1,032 (100.0%) | 844 (100.0%) |
Commute Time in Suncoast Estates
The most frequently occuring commute durations in Suncoast Estates are 30 to 34 minutes (425 commuters, 24.0%), 20 to 24 minutes (400 commuters, 22.6%), and 15 to 19 minutes (279 commuters, 15.7%).
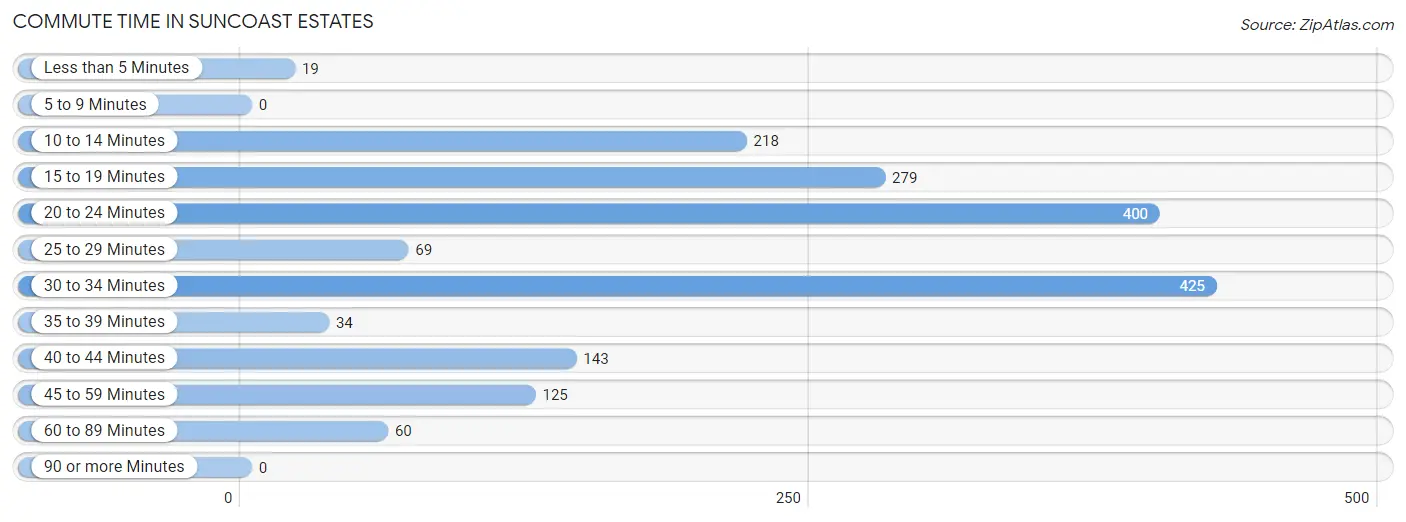
| Commute Time | # Commuters | % Commuters |
| Less than 5 Minutes | 19 | 1.1% |
| 5 to 9 Minutes | 0 | 0.0% |
| 10 to 14 Minutes | 218 | 12.3% |
| 15 to 19 Minutes | 279 | 15.7% |
| 20 to 24 Minutes | 400 | 22.6% |
| 25 to 29 Minutes | 69 | 3.9% |
| 30 to 34 Minutes | 425 | 24.0% |
| 35 to 39 Minutes | 34 | 1.9% |
| 40 to 44 Minutes | 143 | 8.1% |
| 45 to 59 Minutes | 125 | 7.0% |
| 60 to 89 Minutes | 60 | 3.4% |
| 90 or more Minutes | 0 | 0.0% |
Commute Time by Sex in Suncoast Estates
The most common commute times in Suncoast Estates are 20 to 24 minutes (244 commuters, 26.3%) for males and 30 to 34 minutes (207 commuters, 24.5%) for females.
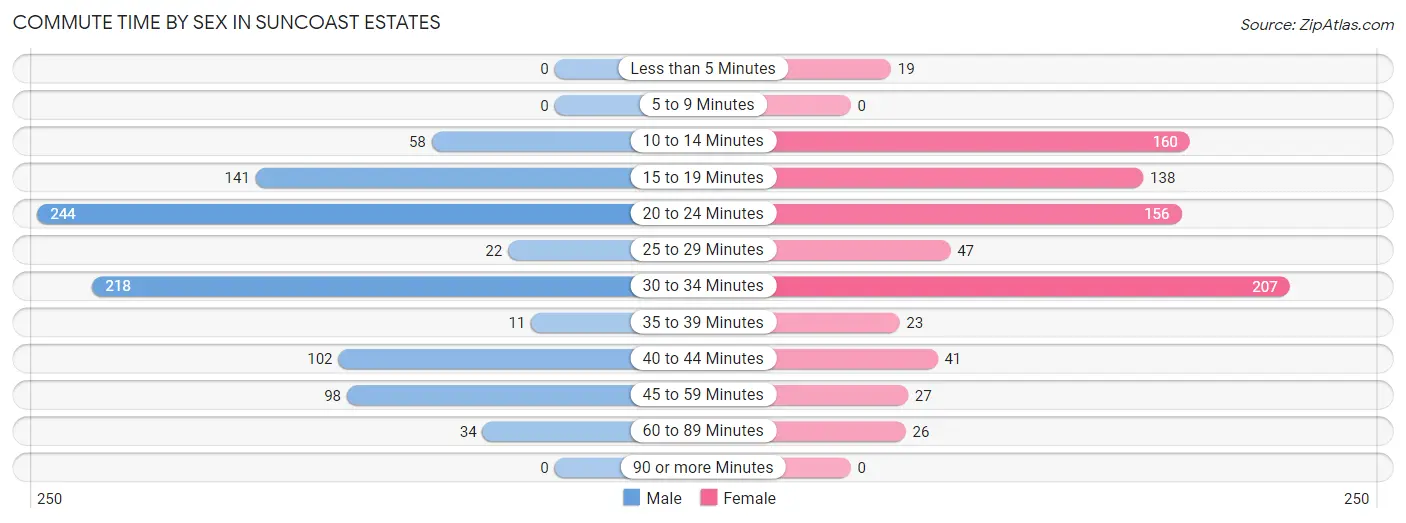
| Commute Time | Male | Female |
| Less than 5 Minutes | 0 (0.0%) | 19 (2.2%) |
| 5 to 9 Minutes | 0 (0.0%) | 0 (0.0%) |
| 10 to 14 Minutes | 58 (6.2%) | 160 (19.0%) |
| 15 to 19 Minutes | 141 (15.2%) | 138 (16.4%) |
| 20 to 24 Minutes | 244 (26.3%) | 156 (18.5%) |
| 25 to 29 Minutes | 22 (2.4%) | 47 (5.6%) |
| 30 to 34 Minutes | 218 (23.5%) | 207 (24.5%) |
| 35 to 39 Minutes | 11 (1.2%) | 23 (2.7%) |
| 40 to 44 Minutes | 102 (11.0%) | 41 (4.9%) |
| 45 to 59 Minutes | 98 (10.6%) | 27 (3.2%) |
| 60 to 89 Minutes | 34 (3.7%) | 26 (3.1%) |
| 90 or more Minutes | 0 (0.0%) | 0 (0.0%) |
Time of Departure to Work by Sex in Suncoast Estates
The most frequent times of departure to work in Suncoast Estates are 6:00 AM to 6:29 AM (196, 21.1%) for males and 8:00 AM to 8:29 AM (120, 14.2%) for females.
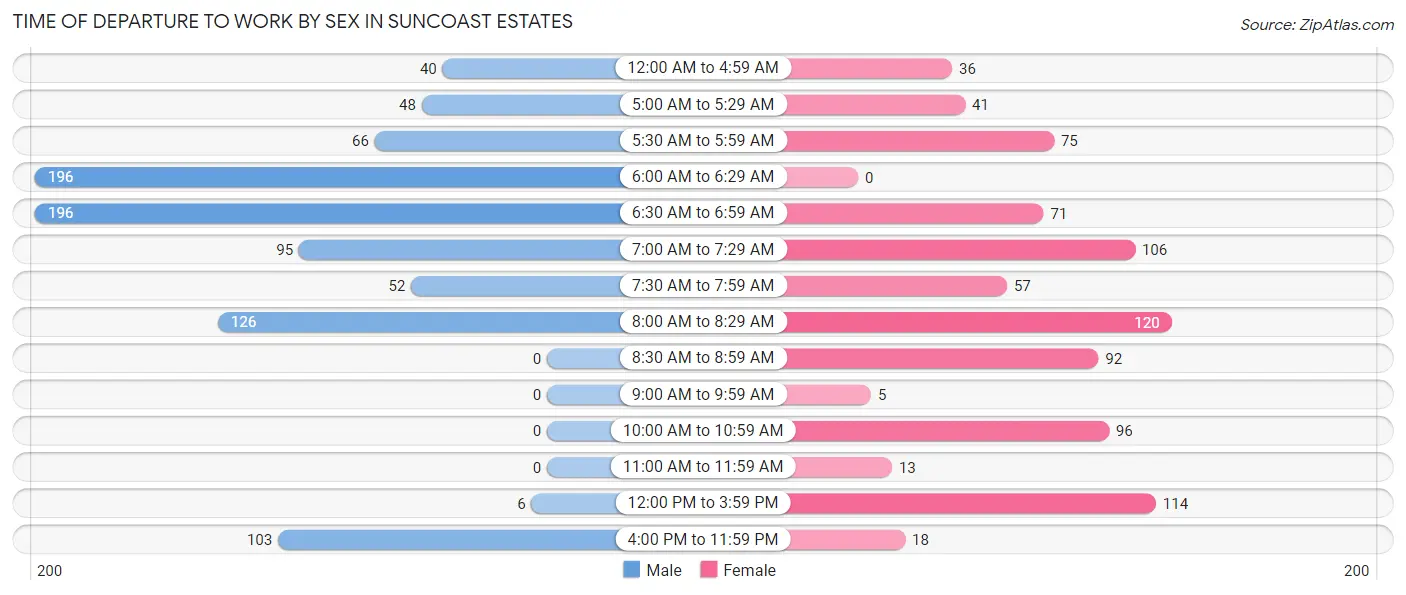
| Time of Departure | Male | Female |
| 12:00 AM to 4:59 AM | 40 (4.3%) | 36 (4.3%) |
| 5:00 AM to 5:29 AM | 48 (5.2%) | 41 (4.9%) |
| 5:30 AM to 5:59 AM | 66 (7.1%) | 75 (8.9%) |
| 6:00 AM to 6:29 AM | 196 (21.1%) | 0 (0.0%) |
| 6:30 AM to 6:59 AM | 196 (21.1%) | 71 (8.4%) |
| 7:00 AM to 7:29 AM | 95 (10.2%) | 106 (12.6%) |
| 7:30 AM to 7:59 AM | 52 (5.6%) | 57 (6.8%) |
| 8:00 AM to 8:29 AM | 126 (13.6%) | 120 (14.2%) |
| 8:30 AM to 8:59 AM | 0 (0.0%) | 92 (10.9%) |
| 9:00 AM to 9:59 AM | 0 (0.0%) | 5 (0.6%) |
| 10:00 AM to 10:59 AM | 0 (0.0%) | 96 (11.4%) |
| 11:00 AM to 11:59 AM | 0 (0.0%) | 13 (1.5%) |
| 12:00 PM to 3:59 PM | 6 (0.6%) | 114 (13.5%) |
| 4:00 PM to 11:59 PM | 103 (11.1%) | 18 (2.1%) |
| Total | 928 (100.0%) | 844 (100.0%) |
Housing Occupancy in Suncoast Estates
Occupancy by Ownership in Suncoast Estates
Of the total 1,767 dwellings in Suncoast Estates, owner-occupied units account for 982 (55.6%), while renter-occupied units make up 785 (44.4%).
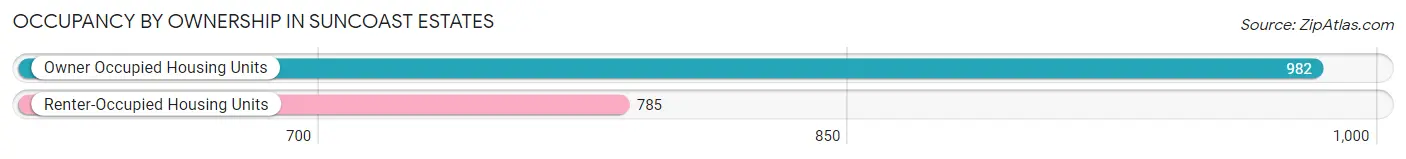
| Occupancy | # Housing Units | % Housing Units |
| Owner Occupied Housing Units | 982 | 55.6% |
| Renter-Occupied Housing Units | 785 | 44.4% |
| Total Occupied Housing Units | 1,767 | 100.0% |
Occupancy by Household Size in Suncoast Estates
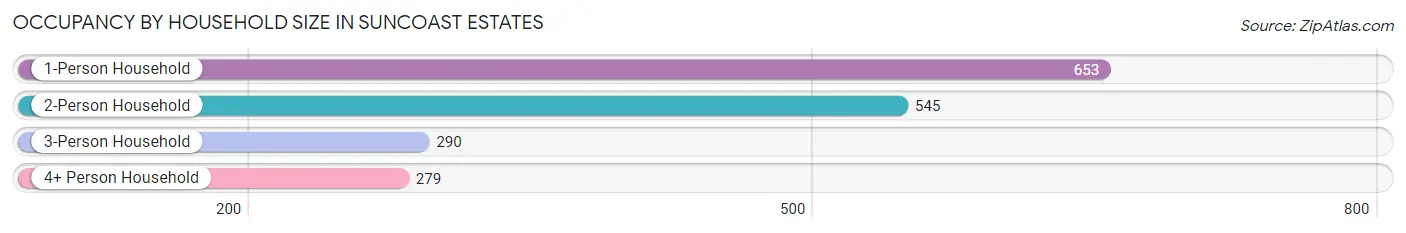
| Household Size | # Housing Units | % Housing Units |
| 1-Person Household | 653 | 37.0% |
| 2-Person Household | 545 | 30.8% |
| 3-Person Household | 290 | 16.4% |
| 4+ Person Household | 279 | 15.8% |
| Total Housing Units | 1,767 | 100.0% |
Occupancy by Ownership by Household Size in Suncoast Estates
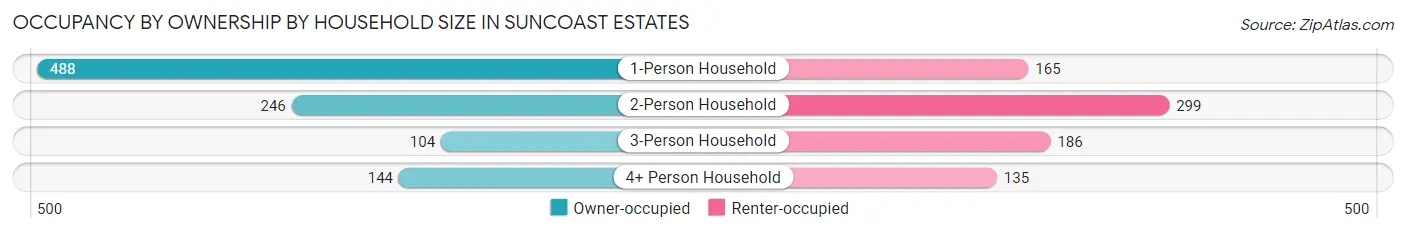
| Household Size | Owner-occupied | Renter-occupied |
| 1-Person Household | 488 (74.7%) | 165 (25.3%) |
| 2-Person Household | 246 (45.1%) | 299 (54.9%) |
| 3-Person Household | 104 (35.9%) | 186 (64.1%) |
| 4+ Person Household | 144 (51.6%) | 135 (48.4%) |
| Total Housing Units | 982 (55.6%) | 785 (44.4%) |
Occupancy by Educational Attainment in Suncoast Estates
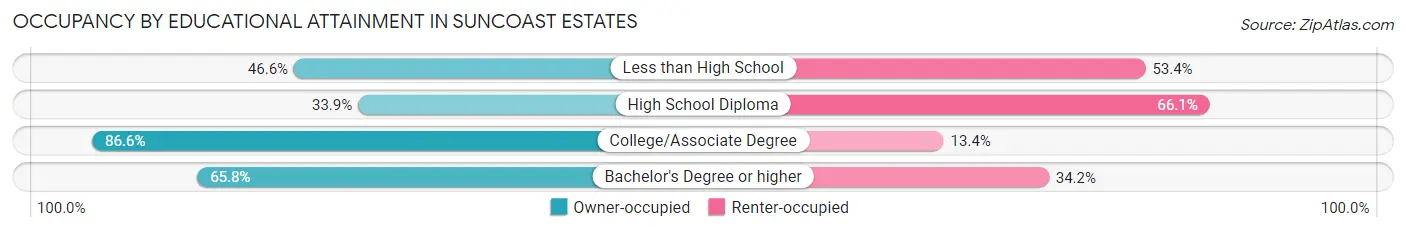
| Household Size | Owner-occupied | Renter-occupied |
| Less than High School | 206 (46.6%) | 236 (53.4%) |
| High School Diploma | 224 (33.9%) | 437 (66.1%) |
| College/Associate Degree | 479 (86.6%) | 74 (13.4%) |
| Bachelor's Degree or higher | 73 (65.8%) | 38 (34.2%) |
Occupancy by Age of Householder in Suncoast Estates
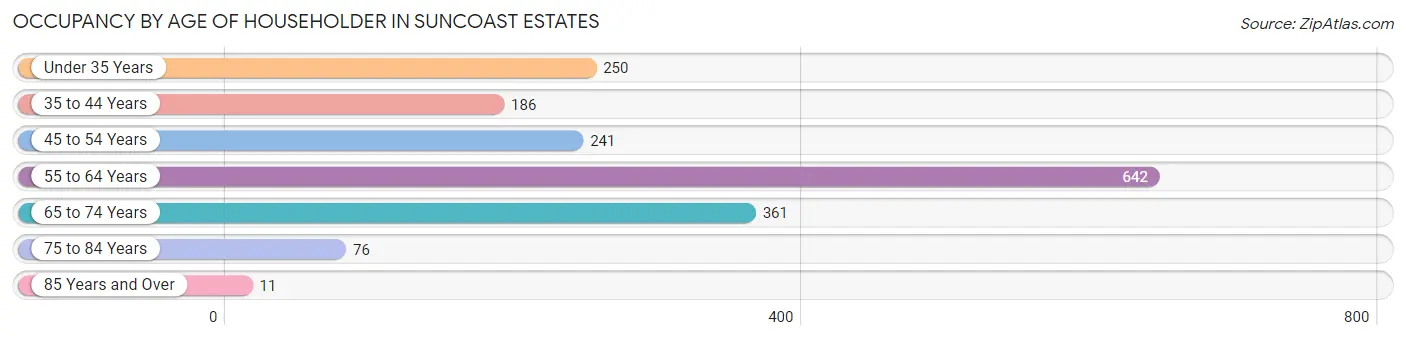
| Age Bracket | # Households | % Households |
| Under 35 Years | 250 | 14.1% |
| 35 to 44 Years | 186 | 10.5% |
| 45 to 54 Years | 241 | 13.6% |
| 55 to 64 Years | 642 | 36.3% |
| 65 to 74 Years | 361 | 20.4% |
| 75 to 84 Years | 76 | 4.3% |
| 85 Years and Over | 11 | 0.6% |
| Total | 1,767 | 100.0% |
Housing Finances in Suncoast Estates
Median Income by Occupancy in Suncoast Estates
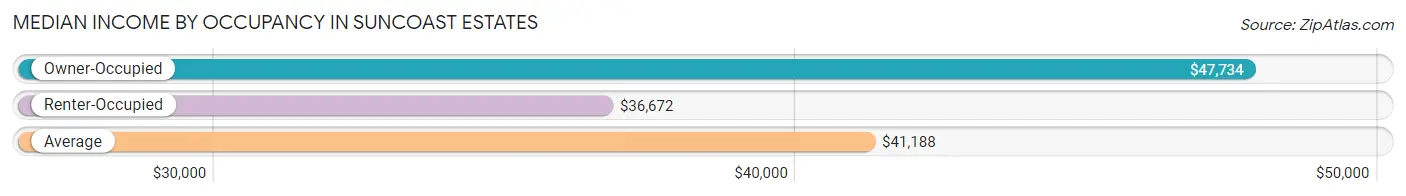
| Occupancy Type | # Households | Median Income |
| Owner-Occupied | 982 (55.6%) | $47,734 |
| Renter-Occupied | 785 (44.4%) | $36,672 |
| Average | 1,767 (100.0%) | $41,188 |
Occupancy by Householder Income Bracket in Suncoast Estates
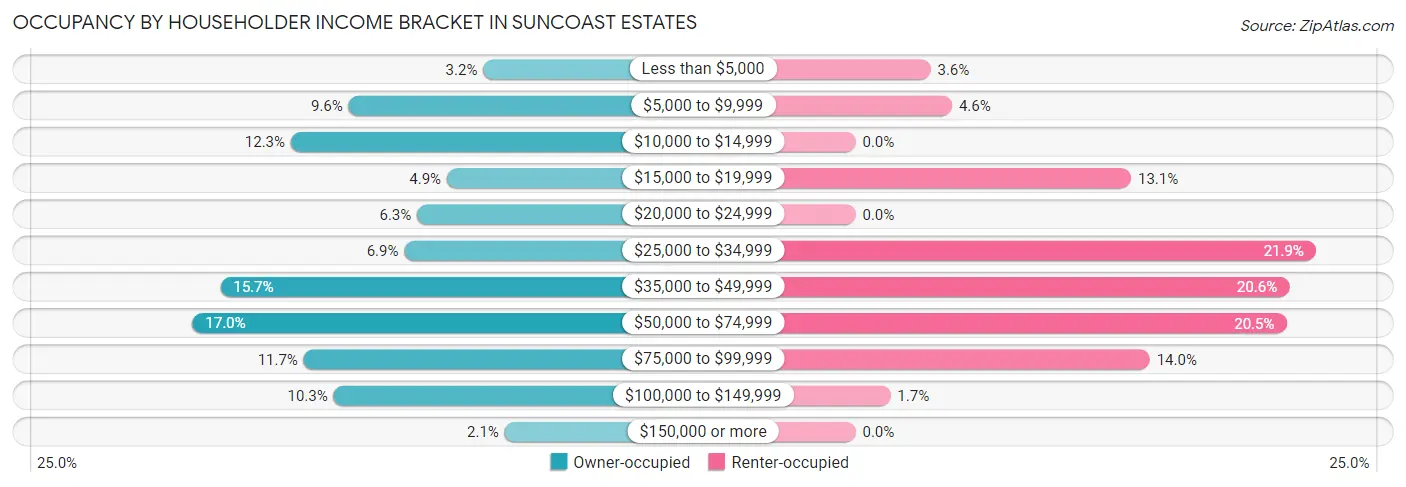
| Income Bracket | Owner-occupied | Renter-occupied |
| Less than $5,000 | 31 (3.2%) | 28 (3.6%) |
| $5,000 to $9,999 | 94 (9.6%) | 36 (4.6%) |
| $10,000 to $14,999 | 121 (12.3%) | 0 (0.0%) |
| $15,000 to $19,999 | 48 (4.9%) | 103 (13.1%) |
| $20,000 to $24,999 | 62 (6.3%) | 0 (0.0%) |
| $25,000 to $34,999 | 68 (6.9%) | 172 (21.9%) |
| $35,000 to $49,999 | 154 (15.7%) | 162 (20.6%) |
| $50,000 to $74,999 | 167 (17.0%) | 161 (20.5%) |
| $75,000 to $99,999 | 115 (11.7%) | 110 (14.0%) |
| $100,000 to $149,999 | 101 (10.3%) | 13 (1.7%) |
| $150,000 or more | 21 (2.1%) | 0 (0.0%) |
| Total | 982 (100.0%) | 785 (100.0%) |
Monthly Housing Cost Tiers in Suncoast Estates
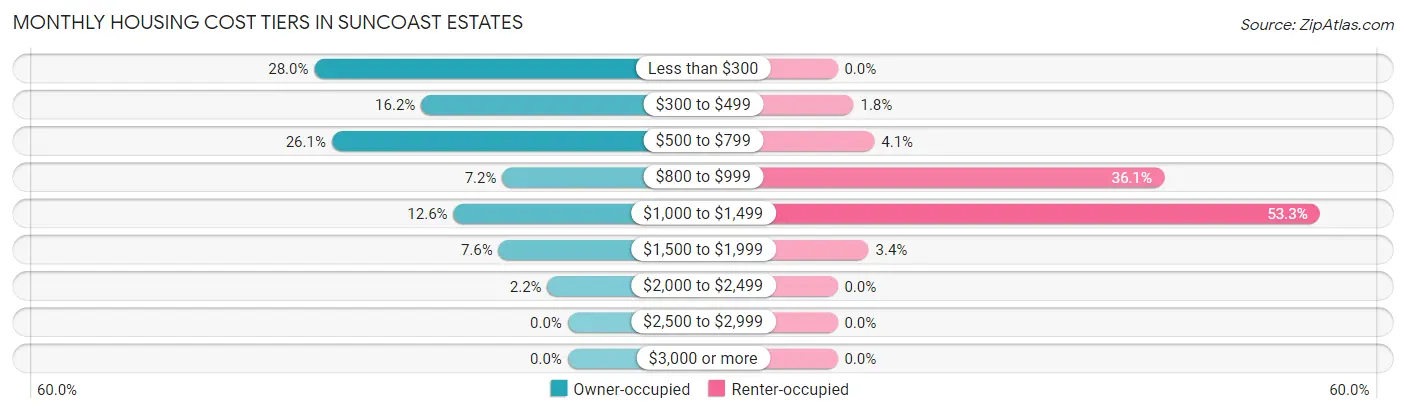
| Monthly Cost | Owner-occupied | Renter-occupied |
| Less than $300 | 275 (28.0%) | 0 (0.0%) |
| $300 to $499 | 159 (16.2%) | 14 (1.8%) |
| $500 to $799 | 256 (26.1%) | 32 (4.1%) |
| $800 to $999 | 71 (7.2%) | 283 (36.0%) |
| $1,000 to $1,499 | 124 (12.6%) | 418 (53.2%) |
| $1,500 to $1,999 | 75 (7.6%) | 27 (3.4%) |
| $2,000 to $2,499 | 22 (2.2%) | 0 (0.0%) |
| $2,500 to $2,999 | 0 (0.0%) | 0 (0.0%) |
| $3,000 or more | 0 (0.0%) | 0 (0.0%) |
| Total | 982 (100.0%) | 785 (100.0%) |
Physical Housing Characteristics in Suncoast Estates
Housing Structures in Suncoast Estates
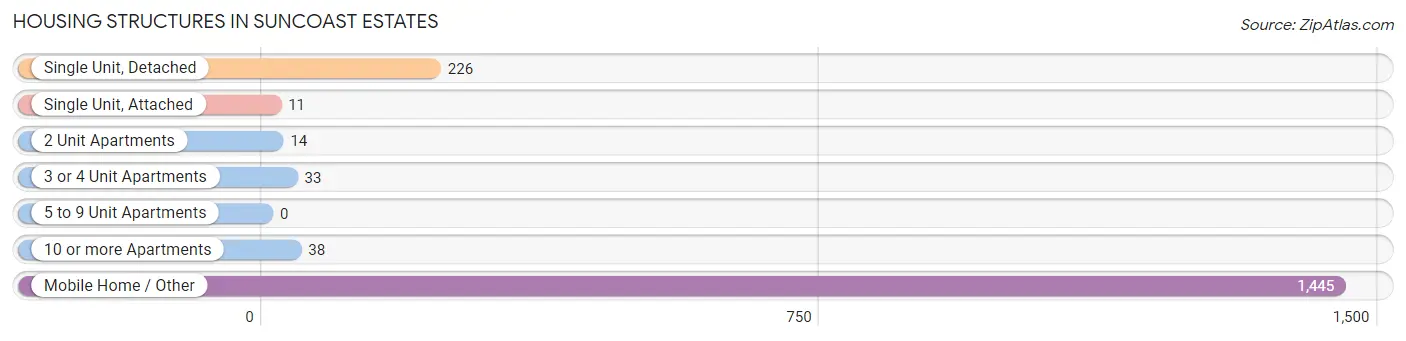
| Structure Type | # Housing Units | % Housing Units |
| Single Unit, Detached | 226 | 12.8% |
| Single Unit, Attached | 11 | 0.6% |
| 2 Unit Apartments | 14 | 0.8% |
| 3 or 4 Unit Apartments | 33 | 1.9% |
| 5 to 9 Unit Apartments | 0 | 0.0% |
| 10 or more Apartments | 38 | 2.1% |
| Mobile Home / Other | 1,445 | 81.8% |
| Total | 1,767 | 100.0% |
Housing Structures by Occupancy in Suncoast Estates
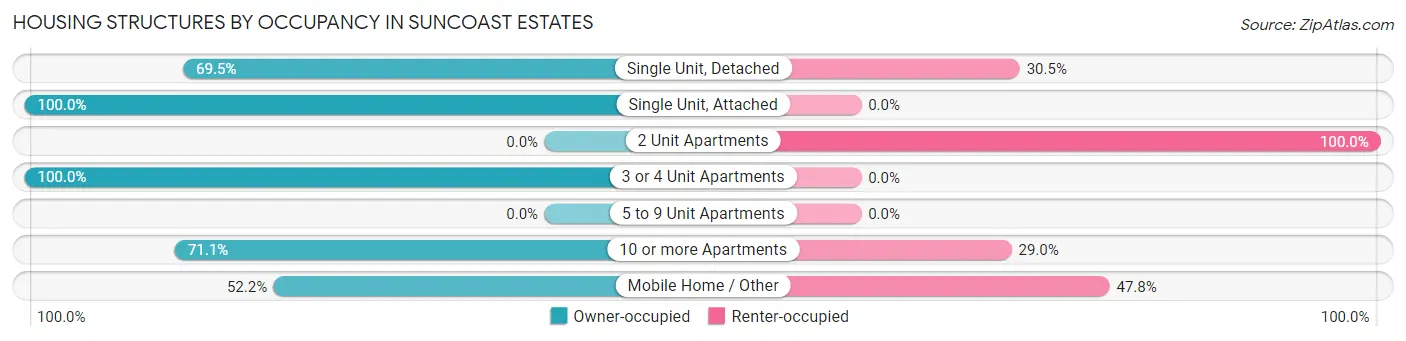
| Structure Type | Owner-occupied | Renter-occupied |
| Single Unit, Detached | 157 (69.5%) | 69 (30.5%) |
| Single Unit, Attached | 11 (100.0%) | 0 (0.0%) |
| 2 Unit Apartments | 0 (0.0%) | 14 (100.0%) |
| 3 or 4 Unit Apartments | 33 (100.0%) | 0 (0.0%) |
| 5 to 9 Unit Apartments | 0 (0.0%) | 0 (0.0%) |
| 10 or more Apartments | 27 (71.1%) | 11 (28.9%) |
| Mobile Home / Other | 754 (52.2%) | 691 (47.8%) |
| Total | 982 (55.6%) | 785 (44.4%) |
Housing Structures by Number of Rooms in Suncoast Estates
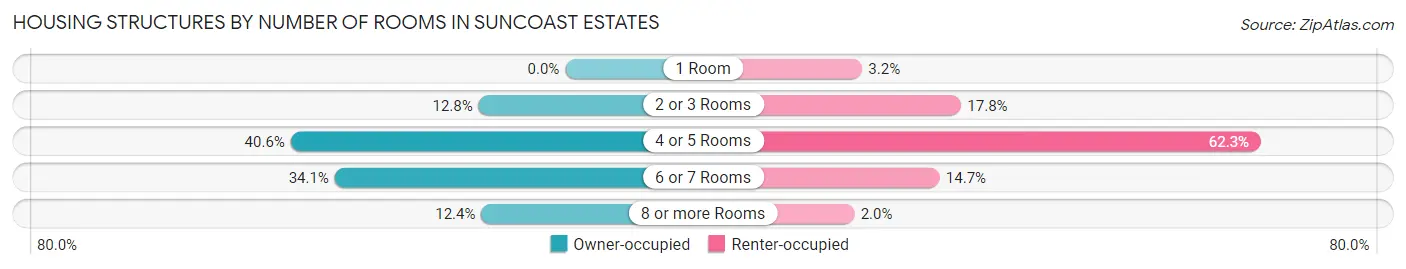
| Number of Rooms | Owner-occupied | Renter-occupied |
| 1 Room | 0 (0.0%) | 25 (3.2%) |
| 2 or 3 Rooms | 126 (12.8%) | 140 (17.8%) |
| 4 or 5 Rooms | 399 (40.6%) | 489 (62.3%) |
| 6 or 7 Rooms | 335 (34.1%) | 115 (14.6%) |
| 8 or more Rooms | 122 (12.4%) | 16 (2.0%) |
| Total | 982 (100.0%) | 785 (100.0%) |
Housing Structure by Heating Type in Suncoast Estates
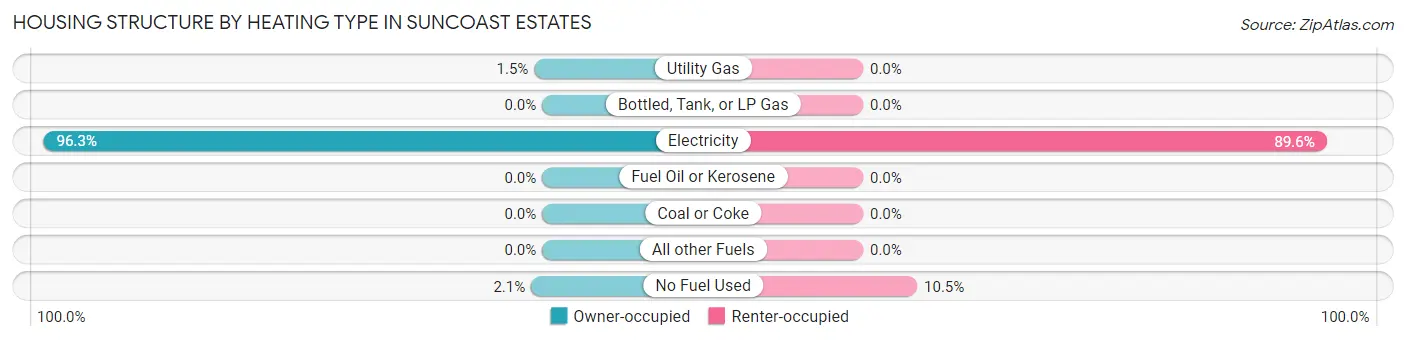
| Heating Type | Owner-occupied | Renter-occupied |
| Utility Gas | 15 (1.5%) | 0 (0.0%) |
| Bottled, Tank, or LP Gas | 0 (0.0%) | 0 (0.0%) |
| Electricity | 946 (96.3%) | 703 (89.5%) |
| Fuel Oil or Kerosene | 0 (0.0%) | 0 (0.0%) |
| Coal or Coke | 0 (0.0%) | 0 (0.0%) |
| All other Fuels | 0 (0.0%) | 0 (0.0%) |
| No Fuel Used | 21 (2.1%) | 82 (10.4%) |
| Total | 982 (100.0%) | 785 (100.0%) |
Household Vehicle Usage in Suncoast Estates
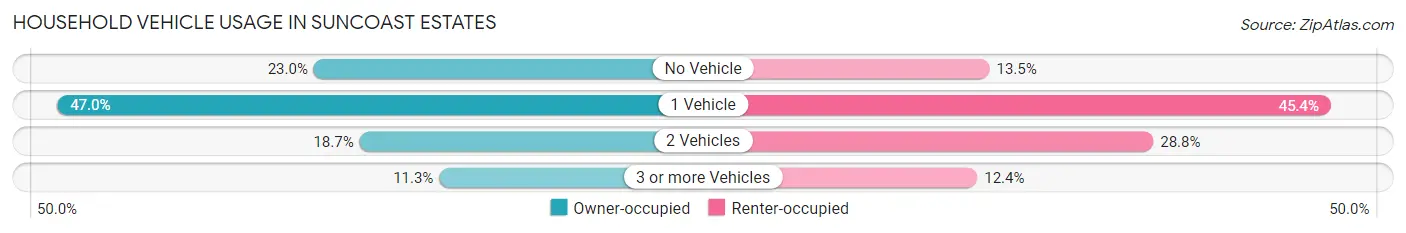
| Vehicles per Household | Owner-occupied | Renter-occupied |
| No Vehicle | 226 (23.0%) | 106 (13.5%) |
| 1 Vehicle | 461 (46.9%) | 356 (45.4%) |
| 2 Vehicles | 184 (18.7%) | 226 (28.8%) |
| 3 or more Vehicles | 111 (11.3%) | 97 (12.4%) |
| Total | 982 (100.0%) | 785 (100.0%) |
Real Estate & Mortgages in Suncoast Estates
Real Estate and Mortgage Overview in Suncoast Estates
| Characteristic | Without Mortgage | With Mortgage |
| Housing Units | 637 | 345 |
| Median Property Value | $97,300 | $85,500 |
| Median Household Income | $48,086 | $21 |
| Monthly Housing Costs | $366 | $0 |
| Real Estate Taxes | $756 | $14 |
Property Value by Mortgage Status in Suncoast Estates
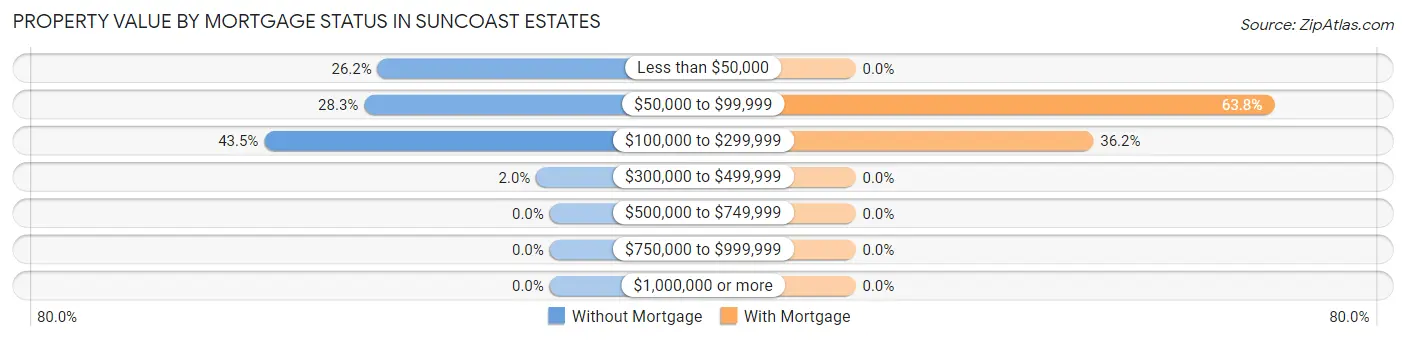
| Property Value | Without Mortgage | With Mortgage |
| Less than $50,000 | 167 (26.2%) | 0 (0.0%) |
| $50,000 to $99,999 | 180 (28.3%) | 220 (63.8%) |
| $100,000 to $299,999 | 277 (43.5%) | 125 (36.2%) |
| $300,000 to $499,999 | 13 (2.0%) | 0 (0.0%) |
| $500,000 to $749,999 | 0 (0.0%) | 0 (0.0%) |
| $750,000 to $999,999 | 0 (0.0%) | 0 (0.0%) |
| $1,000,000 or more | 0 (0.0%) | 0 (0.0%) |
| Total | 637 (100.0%) | 345 (100.0%) |
Household Income by Mortgage Status in Suncoast Estates
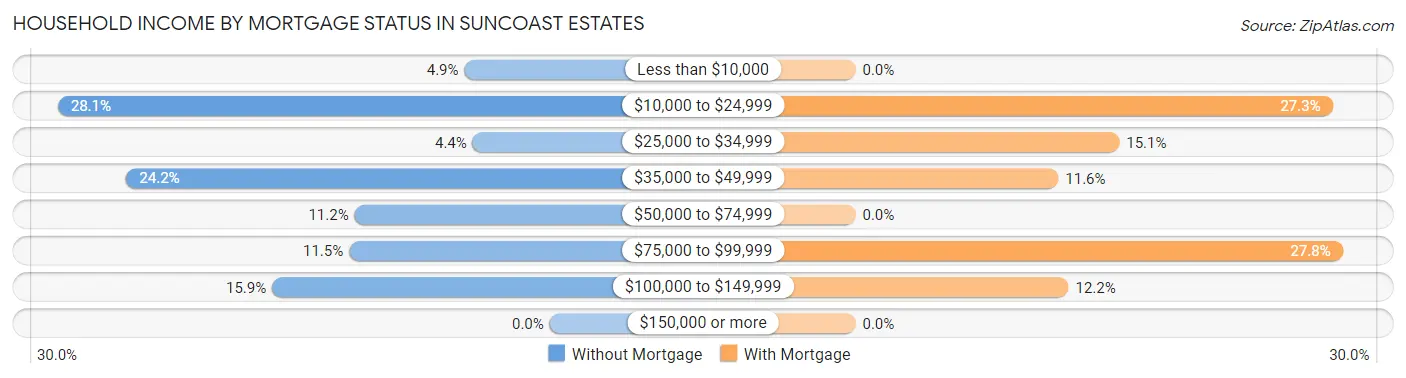
| Household Income | Without Mortgage | With Mortgage |
| Less than $10,000 | 31 (4.9%) | 0 (0.0%) |
| $10,000 to $24,999 | 179 (28.1%) | 94 (27.3%) |
| $25,000 to $34,999 | 28 (4.4%) | 52 (15.1%) |
| $35,000 to $49,999 | 154 (24.2%) | 40 (11.6%) |
| $50,000 to $74,999 | 71 (11.2%) | 0 (0.0%) |
| $75,000 to $99,999 | 73 (11.5%) | 96 (27.8%) |
| $100,000 to $149,999 | 101 (15.9%) | 42 (12.2%) |
| $150,000 or more | 0 (0.0%) | 0 (0.0%) |
| Total | 637 (100.0%) | 345 (100.0%) |
Property Value to Household Income Ratio in Suncoast Estates
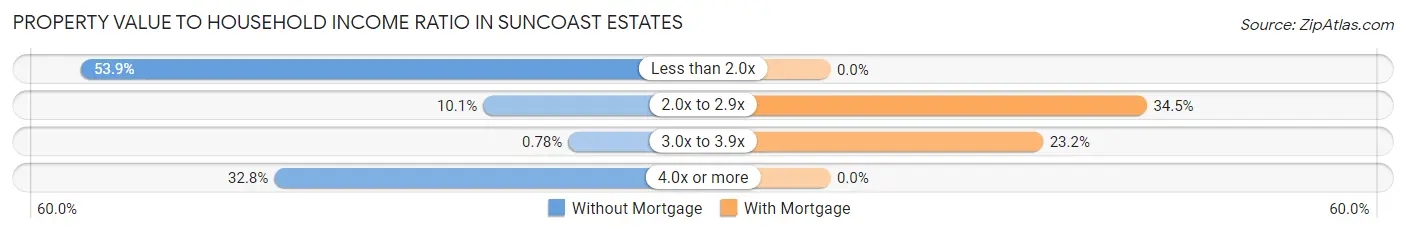
| Value-to-Income Ratio | Without Mortgage | With Mortgage |
| Less than 2.0x | 343 (53.8%) | 0 (0.0%) |
| 2.0x to 2.9x | 64 (10.1%) | 119 (34.5%) |
| 3.0x to 3.9x | 5 (0.8%) | 80 (23.2%) |
| 4.0x or more | 209 (32.8%) | 0 (0.0%) |
| Total | 637 (100.0%) | 345 (100.0%) |
Real Estate Taxes by Mortgage Status in Suncoast Estates
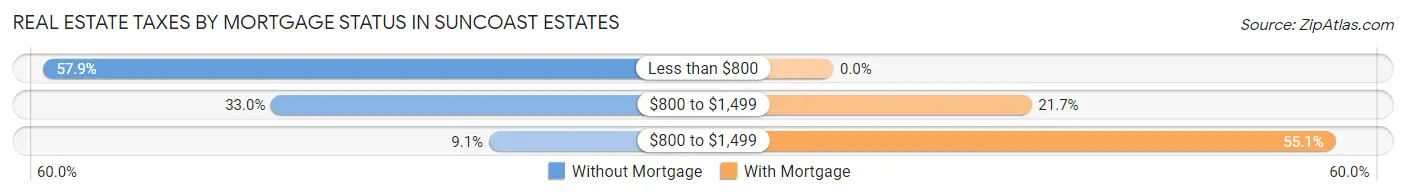
| Property Taxes | Without Mortgage | With Mortgage |
| Less than $800 | 369 (57.9%) | 0 (0.0%) |
| $800 to $1,499 | 210 (33.0%) | 75 (21.7%) |
| $800 to $1,499 | 58 (9.1%) | 190 (55.1%) |
| Total | 637 (100.0%) | 345 (100.0%) |
Health & Disability in Suncoast Estates
Health Insurance Coverage by Age in Suncoast Estates
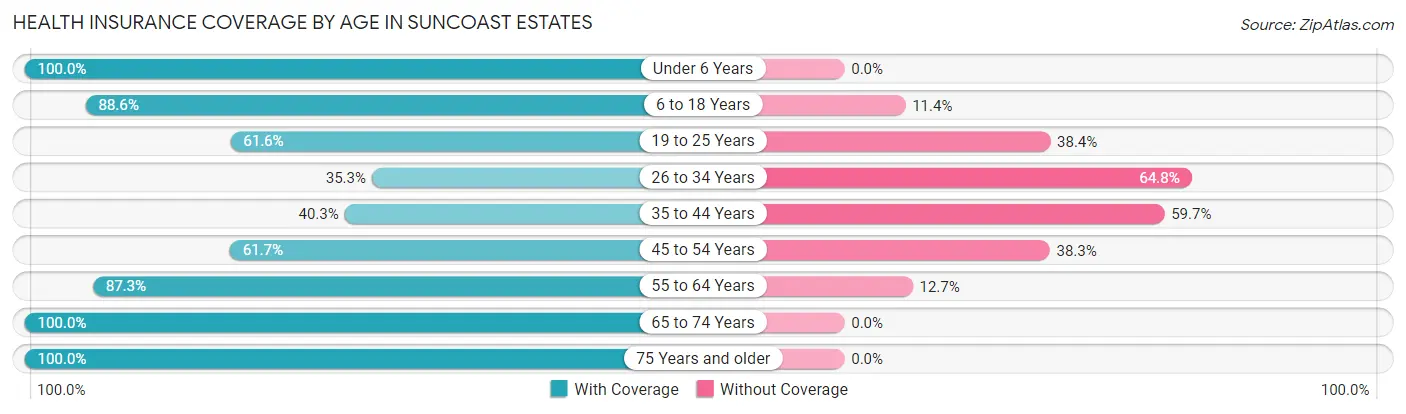
| Age Bracket | With Coverage | Without Coverage |
| Under 6 Years | 112 (100.0%) | 0 (0.0%) |
| 6 to 18 Years | 562 (88.6%) | 72 (11.4%) |
| 19 to 25 Years | 122 (61.6%) | 76 (38.4%) |
| 26 to 34 Years | 208 (35.2%) | 382 (64.7%) |
| 35 to 44 Years | 190 (40.3%) | 281 (59.7%) |
| 45 to 54 Years | 271 (61.7%) | 168 (38.3%) |
| 55 to 64 Years | 892 (87.3%) | 130 (12.7%) |
| 65 to 74 Years | 539 (100.0%) | 0 (0.0%) |
| 75 Years and older | 203 (100.0%) | 0 (0.0%) |
| Total | 3,099 (73.7%) | 1,109 (26.4%) |
Health Insurance Coverage by Citizenship Status in Suncoast Estates
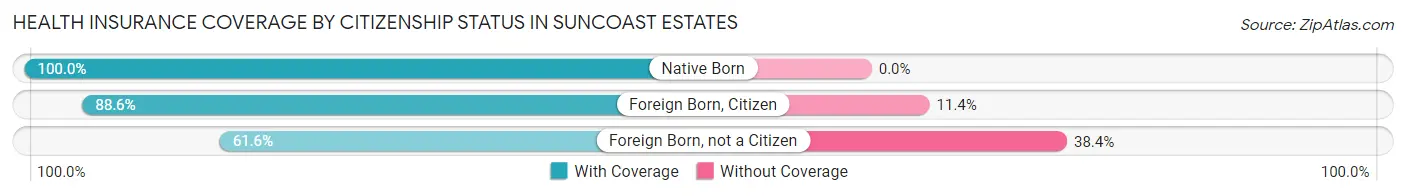
| Citizenship Status | With Coverage | Without Coverage |
| Native Born | 112 (100.0%) | 0 (0.0%) |
| Foreign Born, Citizen | 562 (88.6%) | 72 (11.4%) |
| Foreign Born, not a Citizen | 122 (61.6%) | 76 (38.4%) |
Health Insurance Coverage by Household Income in Suncoast Estates
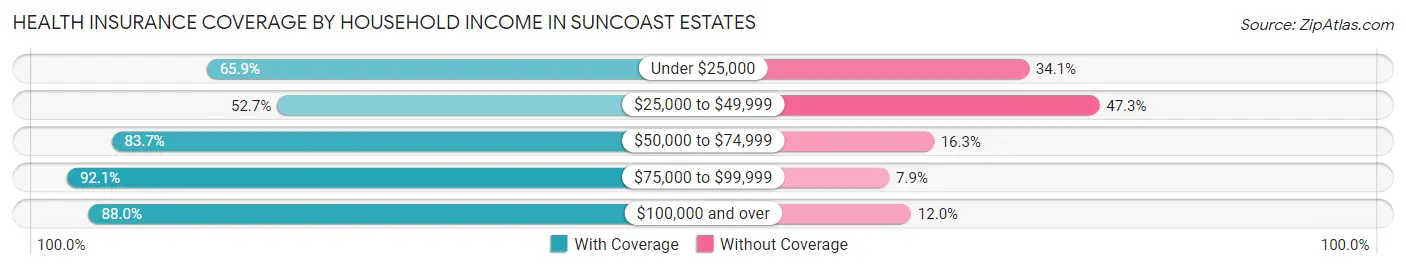
| Household Income | With Coverage | Without Coverage |
| Under $25,000 | 533 (65.9%) | 276 (34.1%) |
| $25,000 to $49,999 | 635 (52.7%) | 570 (47.3%) |
| $50,000 to $74,999 | 653 (83.7%) | 127 (16.3%) |
| $75,000 to $99,999 | 765 (92.1%) | 66 (7.9%) |
| $100,000 and over | 513 (88.0%) | 70 (12.0%) |
Public vs Private Health Insurance Coverage by Age in Suncoast Estates
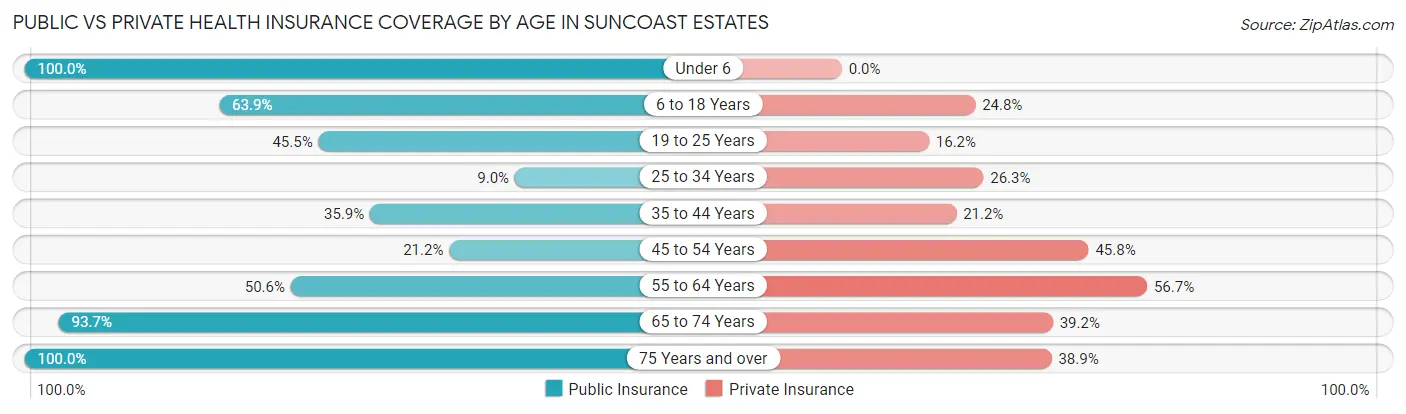
| Age Bracket | Public Insurance | Private Insurance |
| Under 6 | 112 (100.0%) | 0 (0.0%) |
| 6 to 18 Years | 405 (63.9%) | 157 (24.8%) |
| 19 to 25 Years | 90 (45.5%) | 32 (16.2%) |
| 25 to 34 Years | 53 (9.0%) | 155 (26.3%) |
| 35 to 44 Years | 169 (35.9%) | 100 (21.2%) |
| 45 to 54 Years | 93 (21.2%) | 201 (45.8%) |
| 55 to 64 Years | 517 (50.6%) | 579 (56.7%) |
| 65 to 74 Years | 505 (93.7%) | 211 (39.2%) |
| 75 Years and over | 203 (100.0%) | 79 (38.9%) |
| Total | 2,147 (51.0%) | 1,514 (36.0%) |
Disability Status by Sex by Age in Suncoast Estates
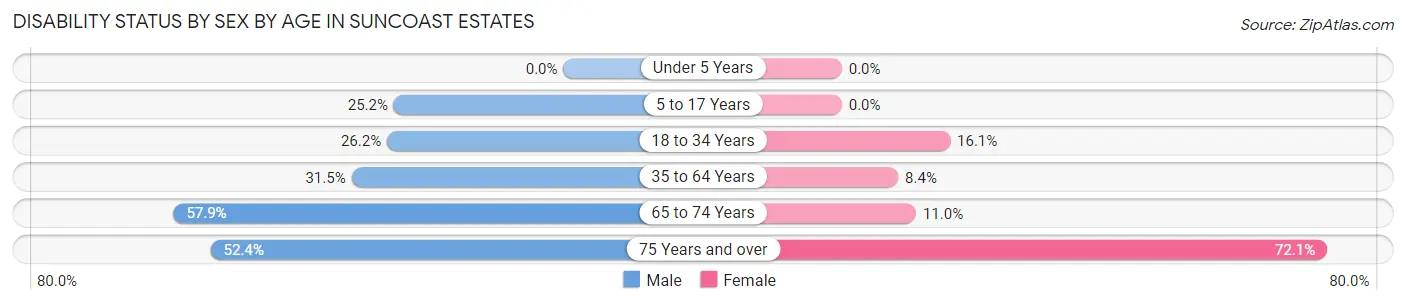
| Age Bracket | Male | Female |
| Under 5 Years | 0 (0.0%) | 0 (0.0%) |
| 5 to 17 Years | 70 (25.2%) | 0 (0.0%) |
| 18 to 34 Years | 149 (26.2%) | 68 (16.1%) |
| 35 to 64 Years | 341 (31.5%) | 71 (8.4%) |
| 65 to 74 Years | 165 (57.9%) | 28 (11.0%) |
| 75 Years and over | 22 (52.4%) | 116 (72.1%) |
Disability Class by Sex by Age in Suncoast Estates
Disability Class: Hearing Difficulty
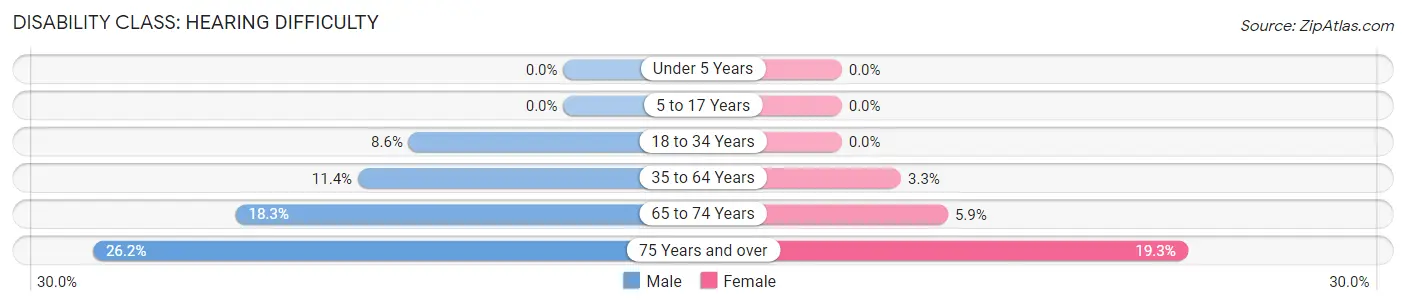
| Age Bracket | Male | Female |
| Under 5 Years | 0 (0.0%) | 0 (0.0%) |
| 5 to 17 Years | 0 (0.0%) | 0 (0.0%) |
| 18 to 34 Years | 49 (8.6%) | 0 (0.0%) |
| 35 to 64 Years | 124 (11.4%) | 28 (3.3%) |
| 65 to 74 Years | 52 (18.2%) | 15 (5.9%) |
| 75 Years and over | 11 (26.2%) | 31 (19.3%) |
Disability Class: Vision Difficulty
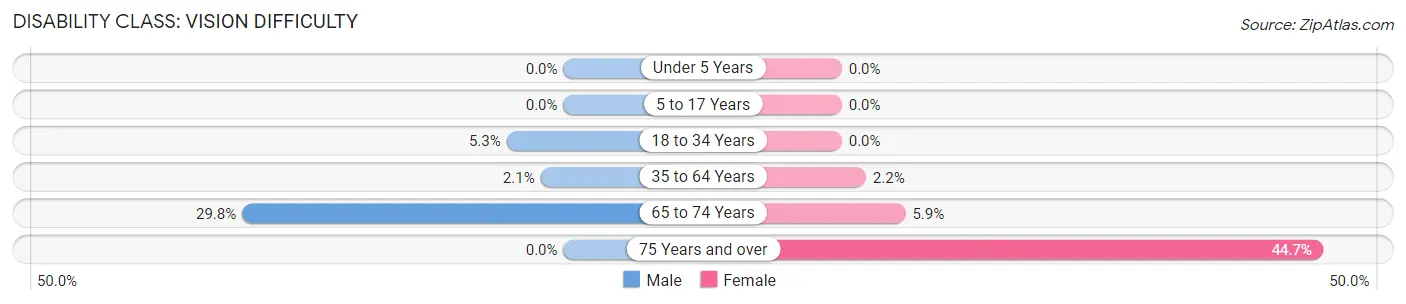
| Age Bracket | Male | Female |
| Under 5 Years | 0 (0.0%) | 0 (0.0%) |
| 5 to 17 Years | 0 (0.0%) | 0 (0.0%) |
| 18 to 34 Years | 30 (5.3%) | 0 (0.0%) |
| 35 to 64 Years | 23 (2.1%) | 19 (2.2%) |
| 65 to 74 Years | 85 (29.8%) | 15 (5.9%) |
| 75 Years and over | 0 (0.0%) | 72 (44.7%) |
Disability Class: Cognitive Difficulty
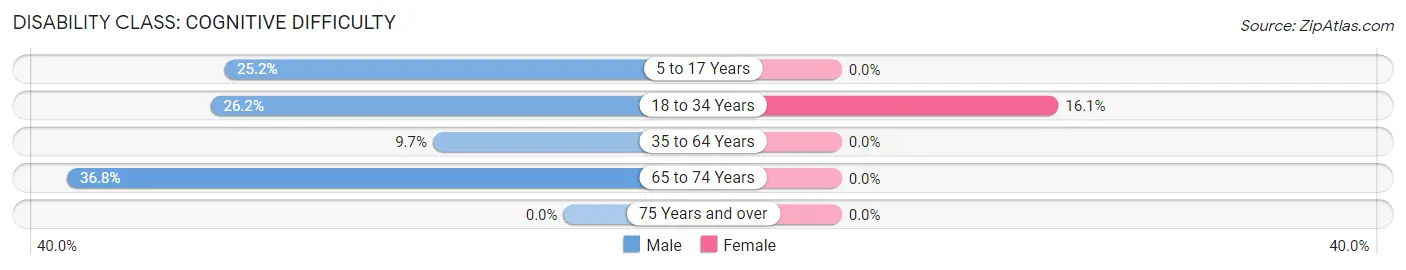
| Age Bracket | Male | Female |
| 5 to 17 Years | 70 (25.2%) | 0 (0.0%) |
| 18 to 34 Years | 149 (26.2%) | 68 (16.1%) |
| 35 to 64 Years | 105 (9.7%) | 0 (0.0%) |
| 65 to 74 Years | 105 (36.8%) | 0 (0.0%) |
| 75 Years and over | 0 (0.0%) | 0 (0.0%) |
Disability Class: Ambulatory Difficulty
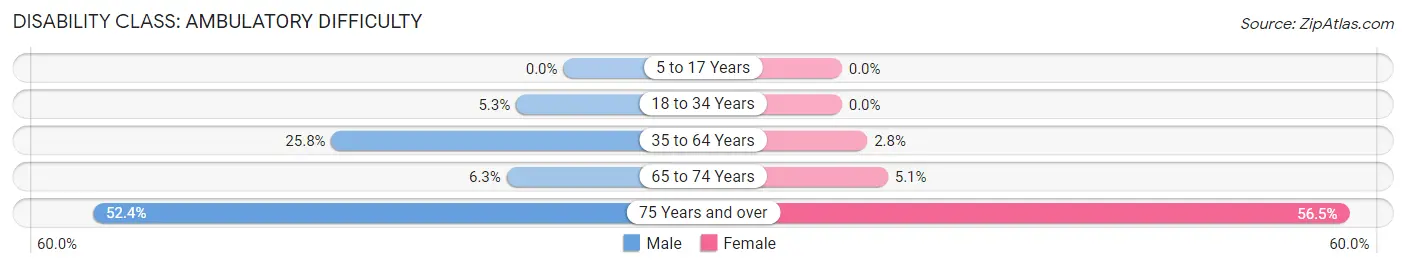
| Age Bracket | Male | Female |
| 5 to 17 Years | 0 (0.0%) | 0 (0.0%) |
| 18 to 34 Years | 30 (5.3%) | 0 (0.0%) |
| 35 to 64 Years | 280 (25.8%) | 24 (2.8%) |
| 65 to 74 Years | 18 (6.3%) | 13 (5.1%) |
| 75 Years and over | 22 (52.4%) | 91 (56.5%) |
Disability Class: Self-Care Difficulty
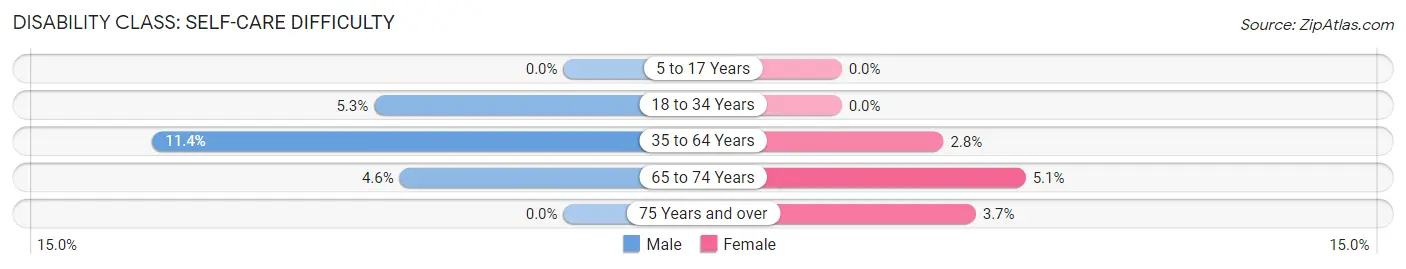
| Age Bracket | Male | Female |
| 5 to 17 Years | 0 (0.0%) | 0 (0.0%) |
| 18 to 34 Years | 30 (5.3%) | 0 (0.0%) |
| 35 to 64 Years | 124 (11.4%) | 24 (2.8%) |
| 65 to 74 Years | 13 (4.6%) | 13 (5.1%) |
| 75 Years and over | 0 (0.0%) | 6 (3.7%) |
Technology Access in Suncoast Estates
Computing Device Access in Suncoast Estates
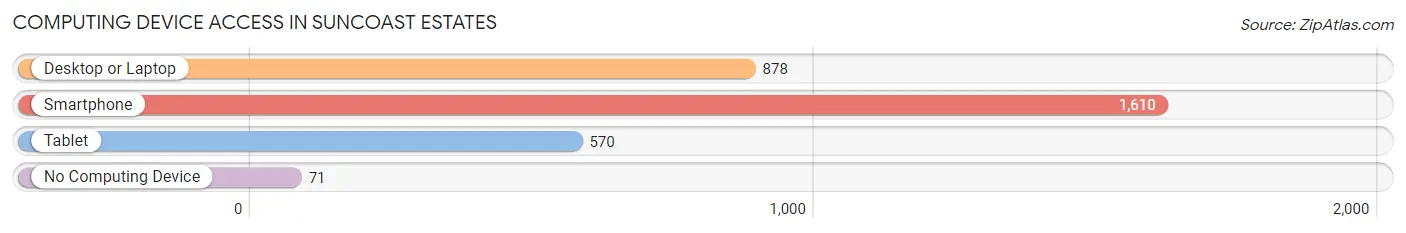
| Device Type | # Households | % Households |
| Desktop or Laptop | 878 | 49.7% |
| Smartphone | 1,610 | 91.1% |
| Tablet | 570 | 32.3% |
| No Computing Device | 71 | 4.0% |
| Total | 1,767 | 100.0% |
Internet Access in Suncoast Estates
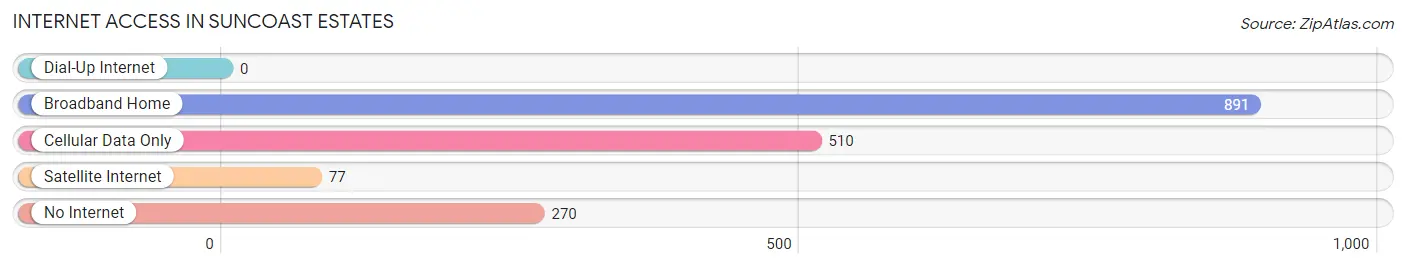
| Internet Type | # Households | % Households |
| Dial-Up Internet | 0 | 0.0% |
| Broadband Home | 891 | 50.4% |
| Cellular Data Only | 510 | 28.9% |
| Satellite Internet | 77 | 4.4% |
| No Internet | 270 | 15.3% |
| Total | 1,767 | 100.0% |
Suncoast Estates Summary
Suncoast Estates is a census-designated place (CDP) located in Lee County, Florida, United States. The population was 2,845 at the 2010 census. It is part of the Cape Coral-Fort Myers Metropolitan Statistical Area.
History
Suncoast Estates was originally part of the Seminole Indian Reservation. The area was first settled in the late 1800s by homesteaders who were attracted to the area by the abundance of wildlife and the fertile soil. The area was known as “Suncoast” because of its location on the Gulf Coast.
In the early 1900s, the area was developed as a citrus grove and a small community began to form. The area was incorporated as the Town of Suncoast Estates in 1925. The town was named after the nearby Suncoast Estates, a large citrus grove owned by the prominent local family of the same name.
The town grew slowly over the years, but it was not until the 1950s that the population began to increase significantly. This was due to the development of the nearby Cape Coral and Fort Myers areas, which attracted many new residents to the area.
Geography
Suncoast Estates is located at 26°37'17" North, 81°50'45" West (26.6214, -81.8459). According to the United States Census Bureau, the CDP has a total area of 4.2 square miles (10.8 km2), of which 4.1 square miles (10.6 km2) is land and 0.1 square miles (0.2 km2) (2.45%) is water.
Economy
The economy of Suncoast Estates is largely based on tourism and agriculture. The area is home to several citrus groves, as well as a number of small businesses. The area is also home to a number of resorts and hotels, which attract visitors from all over the world.
Demographics
As of the census of 2000, there were 2,845 people, 1,093 households, and 790 families residing in the CDP. The population density was 690.3 people per square mile (266.7/km2). There were 1,179 housing units at an average density of 285.2/sq mi (110.2/km2). The racial makeup of the CDP was 94.45% White, 0.53% African American, 0.35% Native American, 0.53% Asian, 0.04% Pacific Islander, 2.90% from other races, and 1.14% from two or more races. Hispanic or Latino of any race were 8.45% of the population.
There were 1,093 households, out of which 33.2% had children under the age of 18 living with them, 54.2% were married couples living together, 11.7% had a female householder with no husband present, and 28.2% were non-families. 21.2% of all households were made up of individuals, and 8.2% had someone living alone who was 65 years of age or older. The average household size was 2.60 and the average family size was 3.02.
In the CDP, the population was spread out, with 25.2% under the age of 18, 8.2% from 18 to 24, 28.2% from 25 to 44, 24.2% from 45 to 64, and 14.2% who were 65 years of age or older. The median age was 38 years. For every 100 females, there were 97.2 males. For every 100 females age 18 and over, there were 94.2 males.
The median income for a household in the CDP was $35,938, and the median income for a family was $41,250. Males had a median income of $30,000 versus $21,250 for females. The per capita income for the CDP was $17,845. About 8.2% of families and 10.2% of the population were below the poverty line, including 13.2% of those under age 18 and 8.2% of those age 65 or over.
Common Questions
What is Per Capita Income in Suncoast Estates?
Per Capita income in Suncoast Estates is $20,995.
What is the Median Family Income in Suncoast Estates?
Median Family Income in Suncoast Estates is $56,208.
What is the Median Household income in Suncoast Estates?
Median Household Income in Suncoast Estates is $41,188.
What is Income or Wage Gap in Suncoast Estates?
Income or Wage Gap in Suncoast Estates is 8.8%.
Women in Suncoast Estates earn 91.2 cents for every dollar earned by a man.
What is Inequality or Gini Index in Suncoast Estates?
Inequality or Gini Index in Suncoast Estates is 0.40.
What is the Total Population of Suncoast Estates?
Total Population of Suncoast Estates is 4,208.
What is the Total Male Population of Suncoast Estates?
Total Male Population of Suncoast Estates is 2,258.
What is the Total Female Population of Suncoast Estates?
Total Female Population of Suncoast Estates is 1,950.
What is the Ratio of Males per 100 Females in Suncoast Estates?
There are 115.79 Males per 100 Females in Suncoast Estates.
What is the Ratio of Females per 100 Males in Suncoast Estates?
There are 86.36 Females per 100 Males in Suncoast Estates.
What is the Median Population Age in Suncoast Estates?
Median Population Age in Suncoast Estates is 48.4 Years.
What is the Average Family Size in Suncoast Estates
Average Family Size in Suncoast Estates is 3.1 People.
What is the Average Household Size in Suncoast Estates
Average Household Size in Suncoast Estates is 2.4 People.
How Large is the Labor Force in Suncoast Estates?
There are 2,048 People in the Labor Forcein in Suncoast Estates.
What is the Percentage of People in the Labor Force in Suncoast Estates?
55.7% of People are in the Labor Force in Suncoast Estates.
What is the Unemployment Rate in Suncoast Estates?
Unemployment Rate in Suncoast Estates is 8.1%.