June Park, FL Map & Demographics
June Park Map
June Park Overview
$37,254
PER CAPITA INCOME
$98,190
AVG FAMILY INCOME
$78,675
AVG HOUSEHOLD INCOME
47.2%
WAGE / INCOME GAP [ % ]
52.8¢/ $1
WAGE / INCOME GAP [ $ ]
0.40
INEQUALITY / GINI INDEX
4,757
TOTAL POPULATION
2,268
MALE POPULATION
2,489
FEMALE POPULATION
91.12
MALES / 100 FEMALES
109.74
FEMALES / 100 MALES
41.1
MEDIAN AGE
3.4
AVG FAMILY SIZE
2.9
AVG HOUSEHOLD SIZE
2,729
LABOR FORCE [ PEOPLE ]
67.7%
PERCENT IN LABOR FORCE
2.8%
UNEMPLOYMENT RATE
Income in June Park
Income Overview in June Park
Per Capita Income in June Park is $37,254, while median incomes of families and households are $98,190 and $78,675 respectively.
| Characteristic | Number | Measure |
| Per Capita Income | 4,757 | $37,254 |
| Median Family Income | 1,170 | $98,190 |
| Mean Family Income | 1,170 | $115,243 |
| Median Household Income | 1,630 | $78,675 |
| Mean Household Income | 1,630 | $101,213 |
| Income Deficit | 1,170 | $0 |
| Wage / Income Gap (%) | 4,757 | 47.25% |
| Wage / Income Gap ($) | 4,757 | 52.75¢ per $1 |
| Gini / Inequality Index | 4,757 | 0.40 |
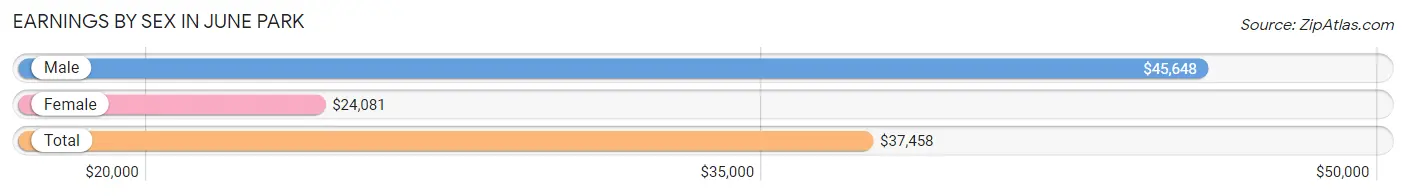
Earnings by Sex in June Park
Average Earnings in June Park are $37,458, $45,648 for men and $24,081 for women, a difference of 47.2%.
| Sex | Number | Average Earnings |
| Male | 1,401 (50.2%) | $45,648 |
| Female | 1,391 (49.8%) | $24,081 |
| Total | 2,792 (100.0%) | $37,458 |
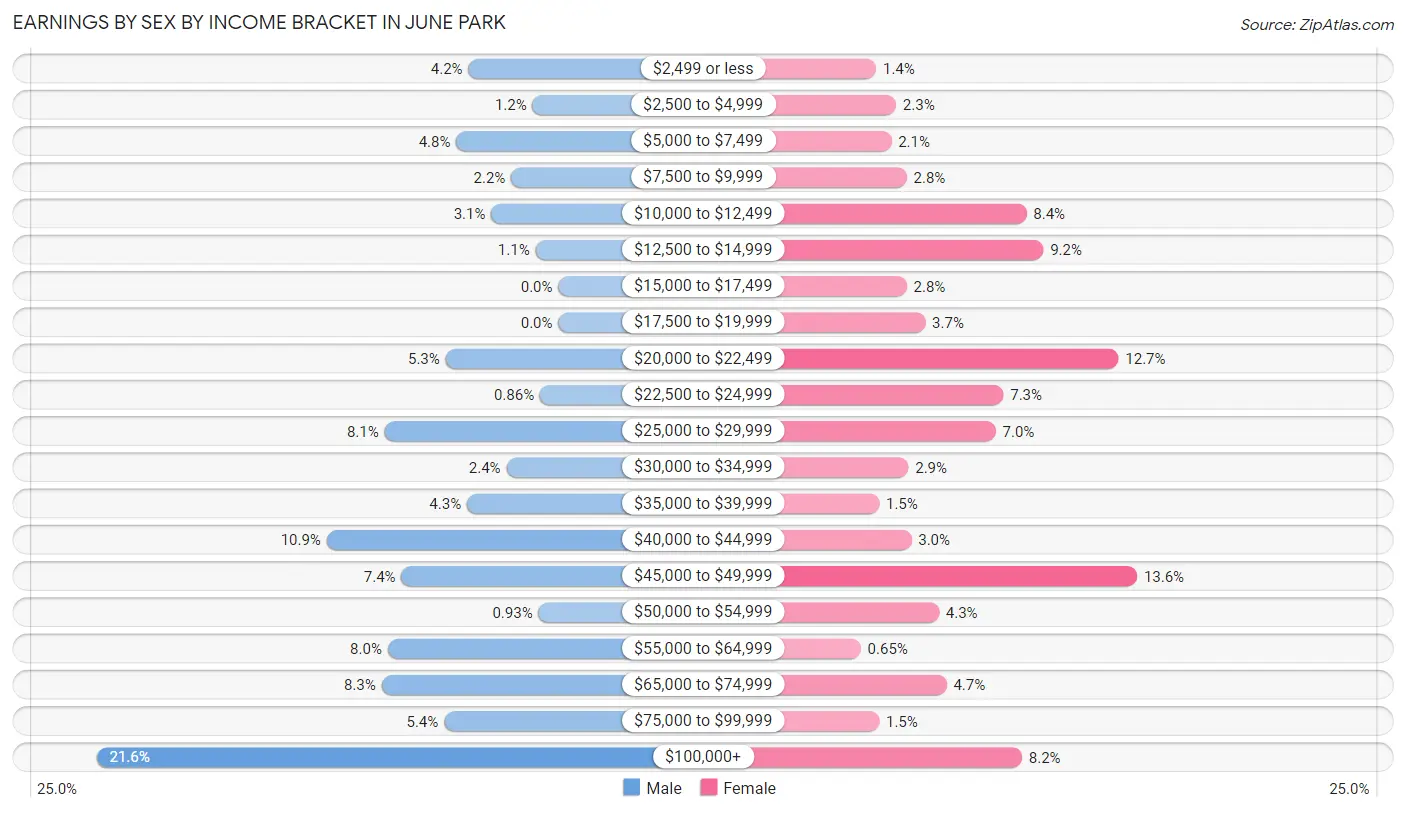
Earnings by Sex by Income Bracket in June Park
The most common earnings brackets in June Park are $100,000+ for men (303 | 21.6%) and $45,000 to $49,999 for women (189 | 13.6%).
| Income | Male | Female |
| $2,499 or less | 59 (4.2%) | 19 (1.4%) |
| $2,500 to $4,999 | 17 (1.2%) | 32 (2.3%) |
| $5,000 to $7,499 | 67 (4.8%) | 29 (2.1%) |
| $7,500 to $9,999 | 31 (2.2%) | 39 (2.8%) |
| $10,000 to $12,499 | 44 (3.1%) | 117 (8.4%) |
| $12,500 to $14,999 | 15 (1.1%) | 128 (9.2%) |
| $15,000 to $17,499 | 0 (0.0%) | 39 (2.8%) |
| $17,500 to $19,999 | 0 (0.0%) | 51 (3.7%) |
| $20,000 to $22,499 | 74 (5.3%) | 177 (12.7%) |
| $22,500 to $24,999 | 12 (0.9%) | 102 (7.3%) |
| $25,000 to $29,999 | 114 (8.1%) | 97 (7.0%) |
| $30,000 to $34,999 | 34 (2.4%) | 40 (2.9%) |
| $35,000 to $39,999 | 60 (4.3%) | 21 (1.5%) |
| $40,000 to $44,999 | 152 (10.8%) | 42 (3.0%) |
| $45,000 to $49,999 | 103 (7.3%) | 189 (13.6%) |
| $50,000 to $54,999 | 13 (0.9%) | 60 (4.3%) |
| $55,000 to $64,999 | 112 (8.0%) | 9 (0.6%) |
| $65,000 to $74,999 | 116 (8.3%) | 65 (4.7%) |
| $75,000 to $99,999 | 75 (5.3%) | 21 (1.5%) |
| $100,000+ | 303 (21.6%) | 114 (8.2%) |
| Total | 1,401 (100.0%) | 1,391 (100.0%) |
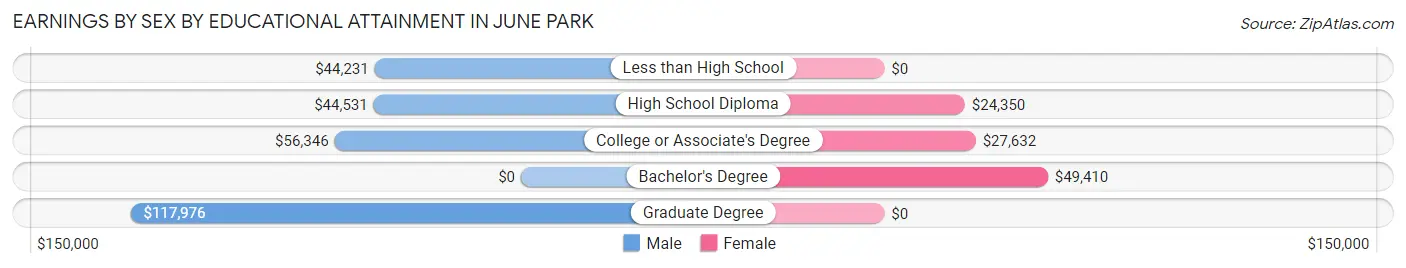
Earnings by Sex by Educational Attainment in June Park
Average earnings in June Park are $47,750 for men and $33,839 for women, a difference of 29.1%. Men with an educational attainment of graduate degree enjoy the highest average annual earnings of $117,976, while those with less than high school education earn the least with $44,231. Women with an educational attainment of bachelor's degree earn the most with the average annual earnings of $49,410, while those with high school diploma education have the smallest earnings of $24,350.
| Educational Attainment | Male Income | Female Income |
| Less than High School | $44,231 | $0 |
| High School Diploma | $44,531 | $24,350 |
| College or Associate's Degree | $56,346 | $27,632 |
| Bachelor's Degree | - | - |
| Graduate Degree | $117,976 | $0 |
| Total | $47,750 | $33,839 |
Family Income in June Park
Family Income Brackets in June Park
According to the June Park family income data, there are 271 families falling into the $100,000 to $149,999 income range, which is the most common income bracket and makes up 23.2% of all families.
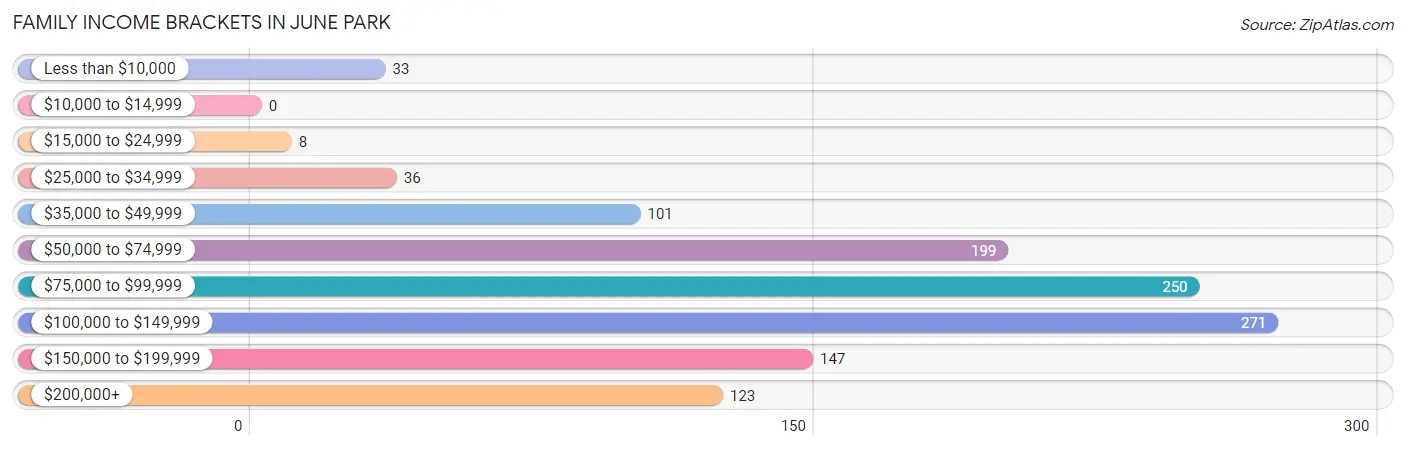
| Income Bracket | # Families | % Families |
| Less than $10,000 | 33 | 2.8% |
| $10,000 to $14,999 | 0 | 0.0% |
| $15,000 to $24,999 | 8 | 0.7% |
| $25,000 to $34,999 | 36 | 3.1% |
| $35,000 to $49,999 | 101 | 8.6% |
| $50,000 to $74,999 | 199 | 17.0% |
| $75,000 to $99,999 | 250 | 21.4% |
| $100,000 to $149,999 | 271 | 23.2% |
| $150,000 to $199,999 | 147 | 12.6% |
| $200,000+ | 123 | 10.5% |
Family Income by Famaliy Size in June Park
5-person families (93 | 8.0%) account for the highest median family income in June Park with $195,386 per family, while 2-person families (460 | 39.3%) have the highest median income of $45,000 per family member.
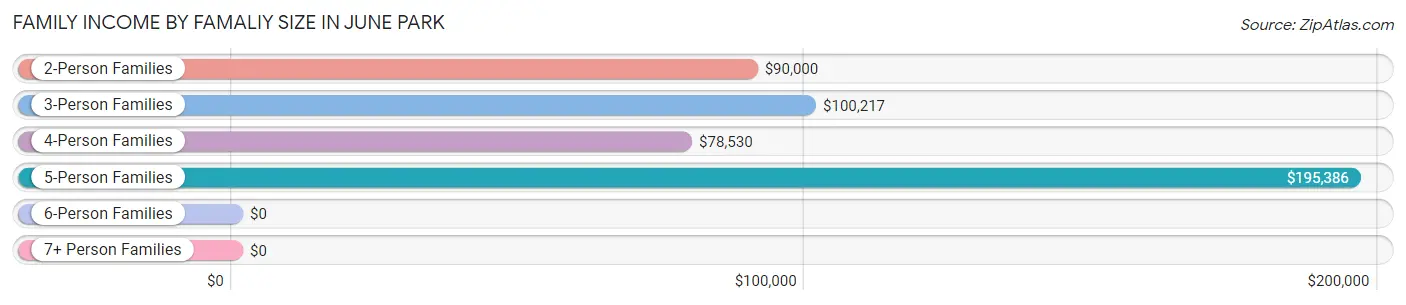
| Income Bracket | # Families | Median Income |
| 2-Person Families | 460 (39.3%) | $90,000 |
| 3-Person Families | 258 (22.1%) | $100,217 |
| 4-Person Families | 313 (26.8%) | $78,530 |
| 5-Person Families | 93 (8.0%) | $195,386 |
| 6-Person Families | 22 (1.9%) | $0 |
| 7+ Person Families | 24 (2.1%) | $0 |
| Total | 1,170 (100.0%) | $98,190 |
Family Income by Number of Earners in June Park
The median family income in June Park is $98,190, with families comprising 2 earners (497) having the highest median family income of $124,485, while families with 1 earner (342) have the lowest median family income of $60,250, accounting for 42.5% and 29.2% of families, respectively.
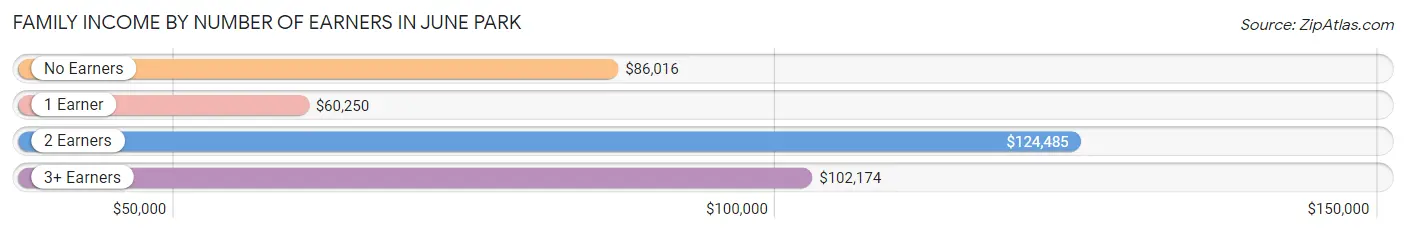
| Number of Earners | # Families | Median Income |
| No Earners | 103 (8.8%) | $86,016 |
| 1 Earner | 342 (29.2%) | $60,250 |
| 2 Earners | 497 (42.5%) | $124,485 |
| 3+ Earners | 228 (19.5%) | $102,174 |
| Total | 1,170 (100.0%) | $98,190 |
Household Income in June Park
Household Income Brackets in June Park
With 305 households falling in the category, the $75,000 to $99,999 income range is the most frequent in June Park, accounting for 18.7% of all households. In contrast, only 41 households (2.5%) fall into the $10,000 to $14,999 income bracket, making it the least populous group.
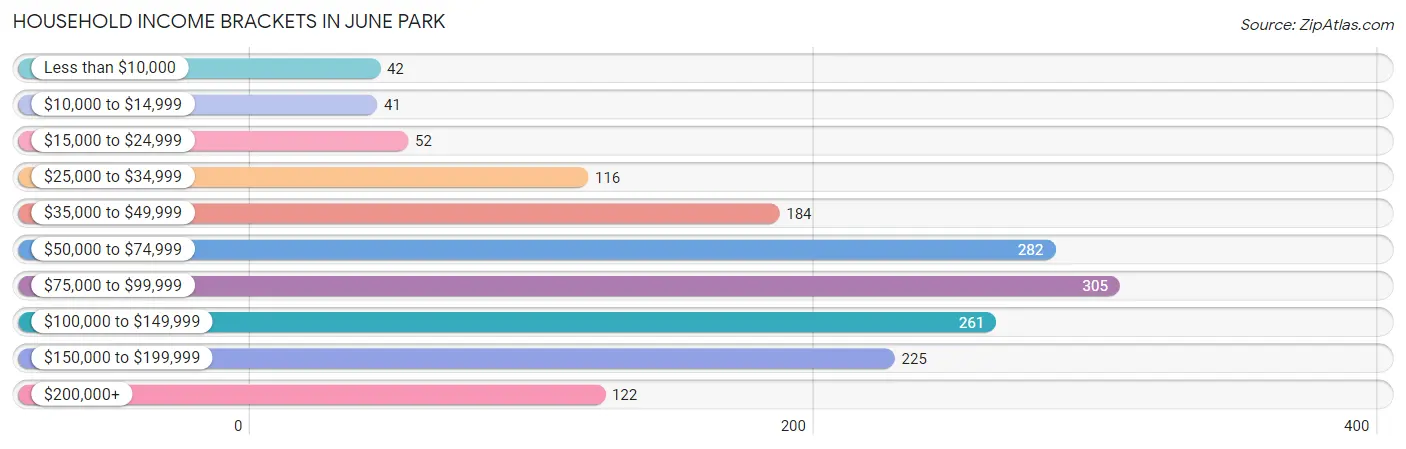
| Income Bracket | # Households | % Households |
| Less than $10,000 | 42 | 2.6% |
| $10,000 to $14,999 | 41 | 2.5% |
| $15,000 to $24,999 | 52 | 3.2% |
| $25,000 to $34,999 | 116 | 7.1% |
| $35,000 to $49,999 | 184 | 11.3% |
| $50,000 to $74,999 | 282 | 17.3% |
| $75,000 to $99,999 | 305 | 18.7% |
| $100,000 to $149,999 | 261 | 16.0% |
| $150,000 to $199,999 | 225 | 13.8% |
| $200,000+ | 122 | 7.5% |
Household Income by Householder Age in June Park
The median household income in June Park is $78,675, with the highest median household income of $100,810 found in the 45 to 64 years age bracket for the primary householder. A total of 651 households (39.9%) fall into this category. Meanwhile, the 15 to 24 years age bracket for the primary householder has the lowest median household income of $0, with 23 households (1.4%) in this group.
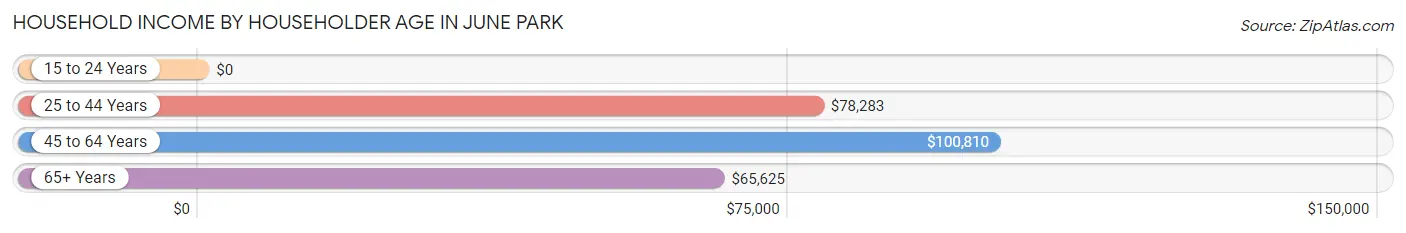
| Income Bracket | # Households | Median Income |
| 15 to 24 Years | 23 (1.4%) | $0 |
| 25 to 44 Years | 476 (29.2%) | $78,283 |
| 45 to 64 Years | 651 (39.9%) | $100,810 |
| 65+ Years | 480 (29.4%) | $65,625 |
| Total | 1,630 (100.0%) | $78,675 |
Poverty in June Park
Income Below Poverty by Sex and Age in June Park
With 3.9% poverty level for males and 4.7% for females among the residents of June Park, 75 year old and over males and 16 and 17 year old females are the most vulnerable to poverty, with 41 males (23.4%) and 21 females (42.0%) in their respective age groups living below the poverty level.
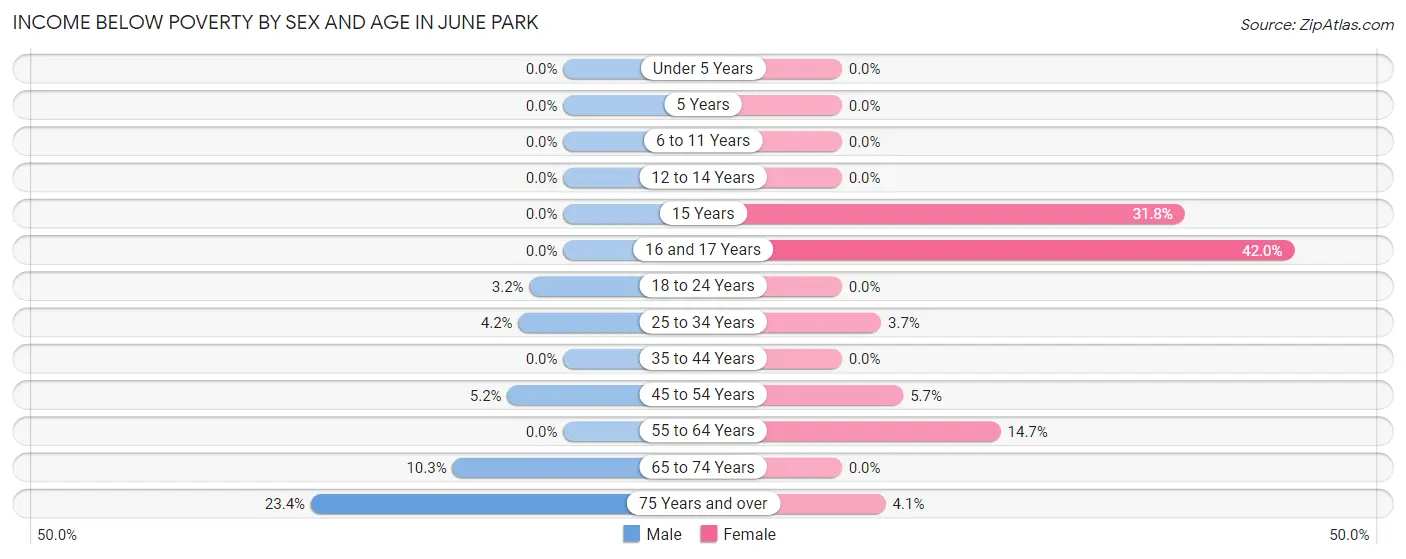
| Age Bracket | Male | Female |
| Under 5 Years | 0 (0.0%) | 0 (0.0%) |
| 5 Years | 0 (0.0%) | 0 (0.0%) |
| 6 to 11 Years | 0 (0.0%) | 0 (0.0%) |
| 12 to 14 Years | 0 (0.0%) | 0 (0.0%) |
| 15 Years | 0 (0.0%) | 21 (31.8%) |
| 16 and 17 Years | 0 (0.0%) | 21 (42.0%) |
| 18 to 24 Years | 8 (3.2%) | 0 (0.0%) |
| 25 to 34 Years | 11 (4.2%) | 12 (3.6%) |
| 35 to 44 Years | 0 (0.0%) | 0 (0.0%) |
| 45 to 54 Years | 8 (5.2%) | 26 (5.7%) |
| 55 to 64 Years | 0 (0.0%) | 28 (14.7%) |
| 65 to 74 Years | 21 (10.3%) | 0 (0.0%) |
| 75 Years and over | 41 (23.4%) | 9 (4.1%) |
| Total | 89 (3.9%) | 117 (4.7%) |
Income Above Poverty by Sex and Age in June Park
According to the poverty statistics in June Park, males aged under 5 years and females aged under 5 years are the age groups that are most secure financially, with 100.0% of males and 100.0% of females in these age groups living above the poverty line.
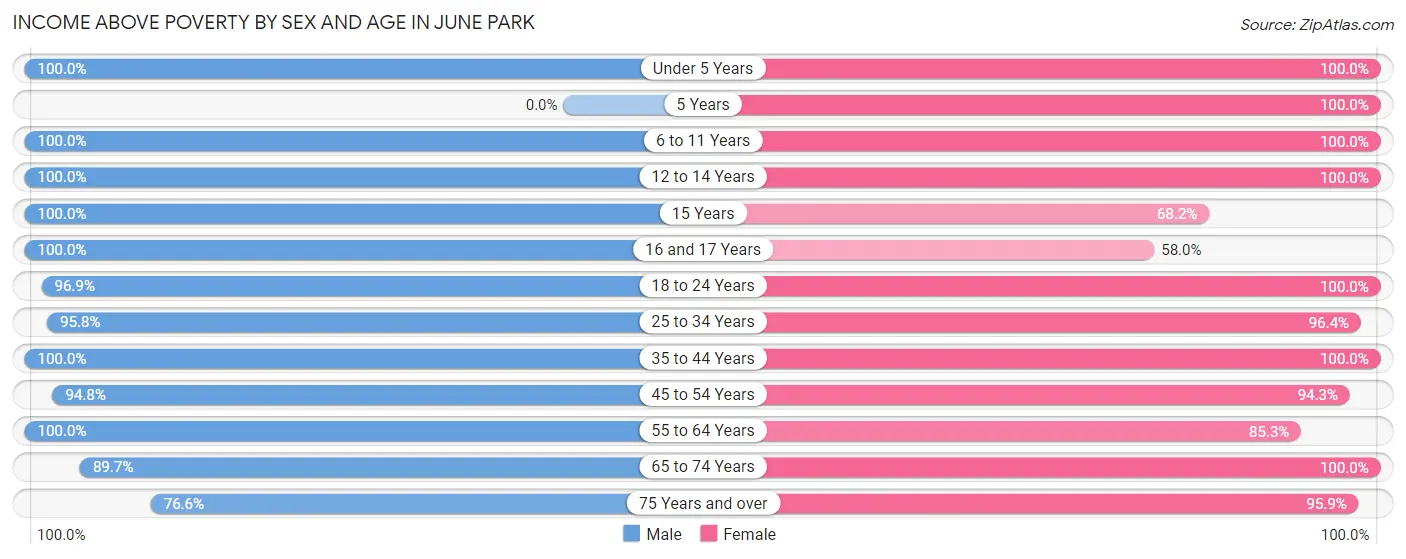
| Age Bracket | Male | Female |
| Under 5 Years | 162 (100.0%) | 43 (100.0%) |
| 5 Years | 0 (0.0%) | 10 (100.0%) |
| 6 to 11 Years | 133 (100.0%) | 114 (100.0%) |
| 12 to 14 Years | 117 (100.0%) | 52 (100.0%) |
| 15 Years | 29 (100.0%) | 45 (68.2%) |
| 16 and 17 Years | 117 (100.0%) | 29 (58.0%) |
| 18 to 24 Years | 246 (96.9%) | 336 (100.0%) |
| 25 to 34 Years | 253 (95.8%) | 317 (96.4%) |
| 35 to 44 Years | 218 (100.0%) | 411 (100.0%) |
| 45 to 54 Years | 146 (94.8%) | 430 (94.3%) |
| 55 to 64 Years | 439 (100.0%) | 162 (85.3%) |
| 65 to 74 Years | 183 (89.7%) | 210 (100.0%) |
| 75 Years and over | 134 (76.6%) | 212 (95.9%) |
| Total | 2,177 (96.1%) | 2,371 (95.3%) |
Income Below Poverty Among Married-Couple Families in June Park
The poverty statistics for married-couple families in June Park show that 0.8% or 6 of the total 761 families live below the poverty line. Families with no children have the highest poverty rate of 1.2%, comprising of 6 families. On the other hand, families with 1 or 2 children have the lowest poverty rate of 0.0%, which includes 0 families.
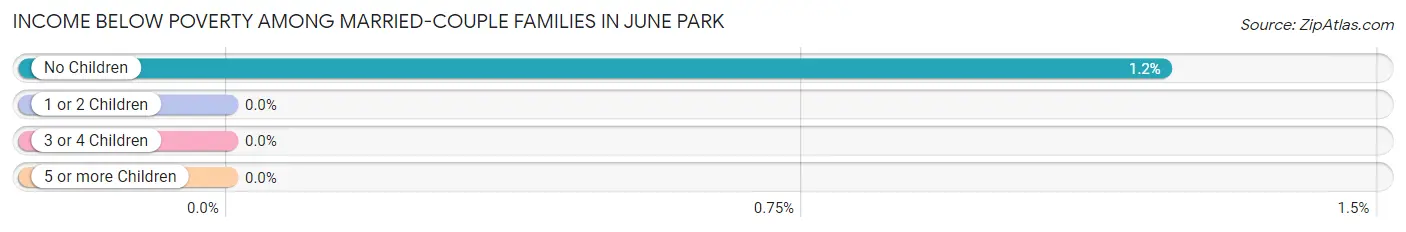
| Children | Above Poverty | Below Poverty |
| No Children | 485 (98.8%) | 6 (1.2%) |
| 1 or 2 Children | 180 (100.0%) | 0 (0.0%) |
| 3 or 4 Children | 90 (100.0%) | 0 (0.0%) |
| 5 or more Children | 0 (0.0%) | 0 (0.0%) |
| Total | 755 (99.2%) | 6 (0.8%) |
Income Below Poverty Among Single-Parent Households in June Park
According to the poverty data in June Park, 11.3% or 8 single-father households and 5.6% or 19 single-mother households are living below the poverty line. Among single-father households, those with no children have the highest poverty rate, with 8 households (13.3%) experiencing poverty. Likewise, among single-mother households, those with 1 or 2 children have the highest poverty rate, with 19 households (9.8%) falling below the poverty line.
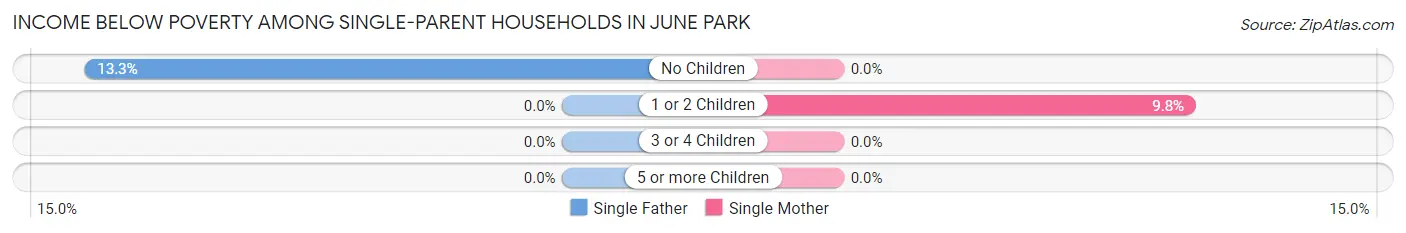
| Children | Single Father | Single Mother |
| No Children | 8 (13.3%) | 0 (0.0%) |
| 1 or 2 Children | 0 (0.0%) | 19 (9.8%) |
| 3 or 4 Children | 0 (0.0%) | 0 (0.0%) |
| 5 or more Children | 0 (0.0%) | 0 (0.0%) |
| Total | 8 (11.3%) | 19 (5.6%) |
Income Below Poverty Among Married-Couple vs Single-Parent Households in June Park
The poverty data for June Park shows that 6 of the married-couple family households (0.8%) and 27 of the single-parent households (6.6%) are living below the poverty level. Within the married-couple family households, those with no children have the highest poverty rate, with 6 households (1.2%) falling below the poverty line. Among the single-parent households, those with 1 or 2 children have the highest poverty rate, with 19 household (9.3%) living below poverty.
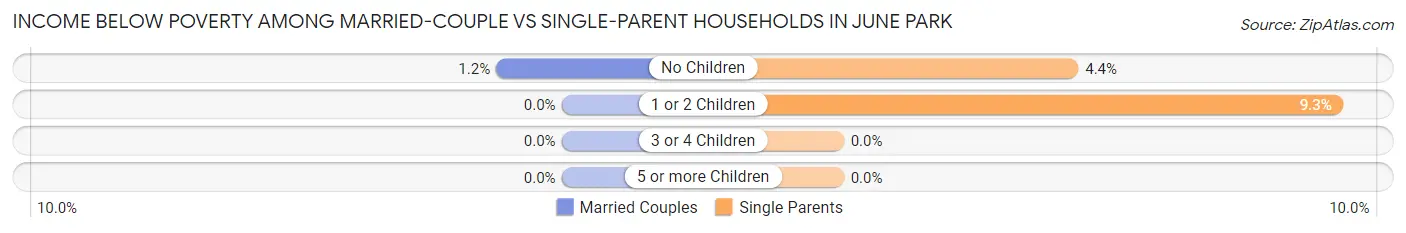
| Children | Married-Couple Families | Single-Parent Households |
| No Children | 6 (1.2%) | 8 (4.4%) |
| 1 or 2 Children | 0 (0.0%) | 19 (9.3%) |
| 3 or 4 Children | 0 (0.0%) | 0 (0.0%) |
| 5 or more Children | 0 (0.0%) | 0 (0.0%) |
| Total | 6 (0.8%) | 27 (6.6%) |
Race in June Park
The most populous races in June Park are White / Caucasian (3,972 | 83.5%), Hispanic or Latino (805 | 16.9%), and Two or more Races (544 | 11.4%).
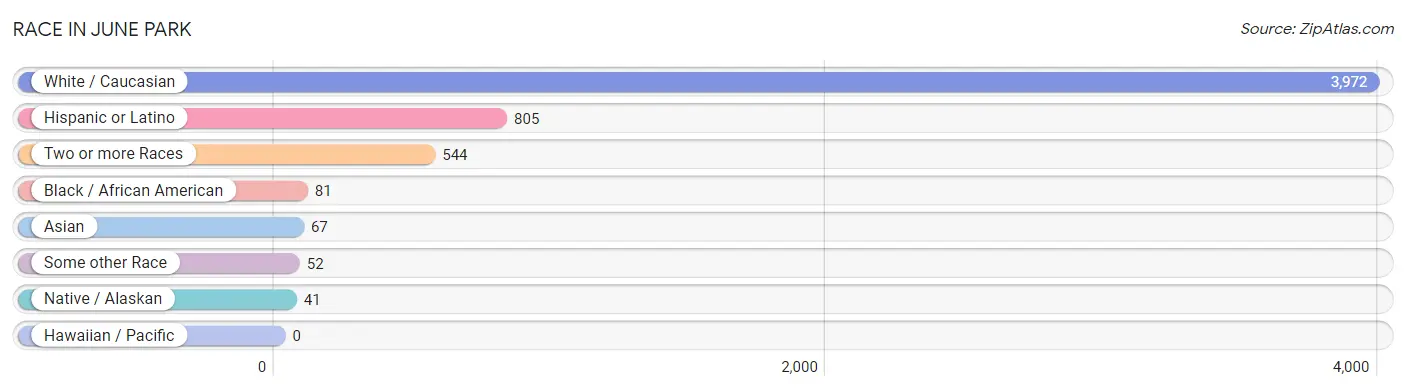
| Race | # Population | % Population |
| Asian | 67 | 1.4% |
| Black / African American | 81 | 1.7% |
| Hawaiian / Pacific | 0 | 0.0% |
| Hispanic or Latino | 805 | 16.9% |
| Native / Alaskan | 41 | 0.9% |
| White / Caucasian | 3,972 | 83.5% |
| Two or more Races | 544 | 11.4% |
| Some other Race | 52 | 1.1% |
| Total | 4,757 | 100.0% |
Ancestry in June Park
The most populous ancestries reported in June Park are German (796 | 16.7%), English (776 | 16.3%), Irish (699 | 14.7%), Puerto Rican (633 | 13.3%), and American (614 | 12.9%), together accounting for 74.0% of all June Park residents.
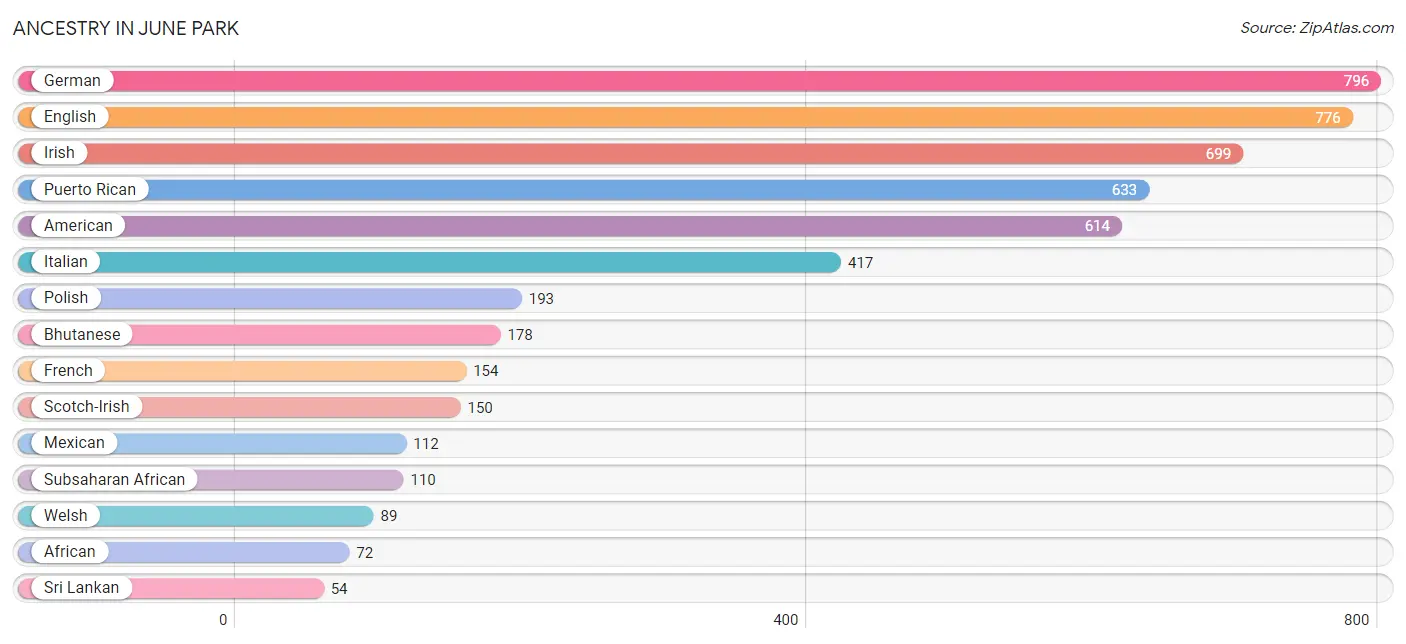
| Ancestry | # Population | % Population |
| African | 72 | 1.5% |
| American | 614 | 12.9% |
| Belgian | 9 | 0.2% |
| Bhutanese | 178 | 3.7% |
| British | 12 | 0.3% |
| Canadian | 16 | 0.3% |
| Central American | 51 | 1.1% |
| Colombian | 7 | 0.2% |
| Cuban | 2 | 0.0% |
| Czechoslovakian | 22 | 0.5% |
| Dutch | 33 | 0.7% |
| English | 776 | 16.3% |
| European | 53 | 1.1% |
| French | 154 | 3.2% |
| German | 796 | 16.7% |
| Hungarian | 20 | 0.4% |
| Irish | 699 | 14.7% |
| Italian | 417 | 8.8% |
| Mexican | 112 | 2.4% |
| Nigerian | 38 | 0.8% |
| Norwegian | 36 | 0.8% |
| Panamanian | 51 | 1.1% |
| Polish | 193 | 4.1% |
| Portuguese | 9 | 0.2% |
| Puerto Rican | 633 | 13.3% |
| Scandinavian | 22 | 0.5% |
| Scotch-Irish | 150 | 3.2% |
| Scottish | 35 | 0.7% |
| Seminole | 31 | 0.6% |
| Slovene | 7 | 0.2% |
| South American | 7 | 0.2% |
| Sri Lankan | 54 | 1.1% |
| Subsaharan African | 110 | 2.3% |
| Swedish | 48 | 1.0% |
| Thai | 13 | 0.3% |
| Welsh | 89 | 1.9% | View All 36 Rows |
Immigrants in June Park
The most numerous immigrant groups reported in June Park came from Europe (44 | 0.9%), Africa (38 | 0.8%), Nigeria (38 | 0.8%), Western Africa (38 | 0.8%), and Germany (27 | 0.6%), together accounting for 3.9% of all June Park residents.
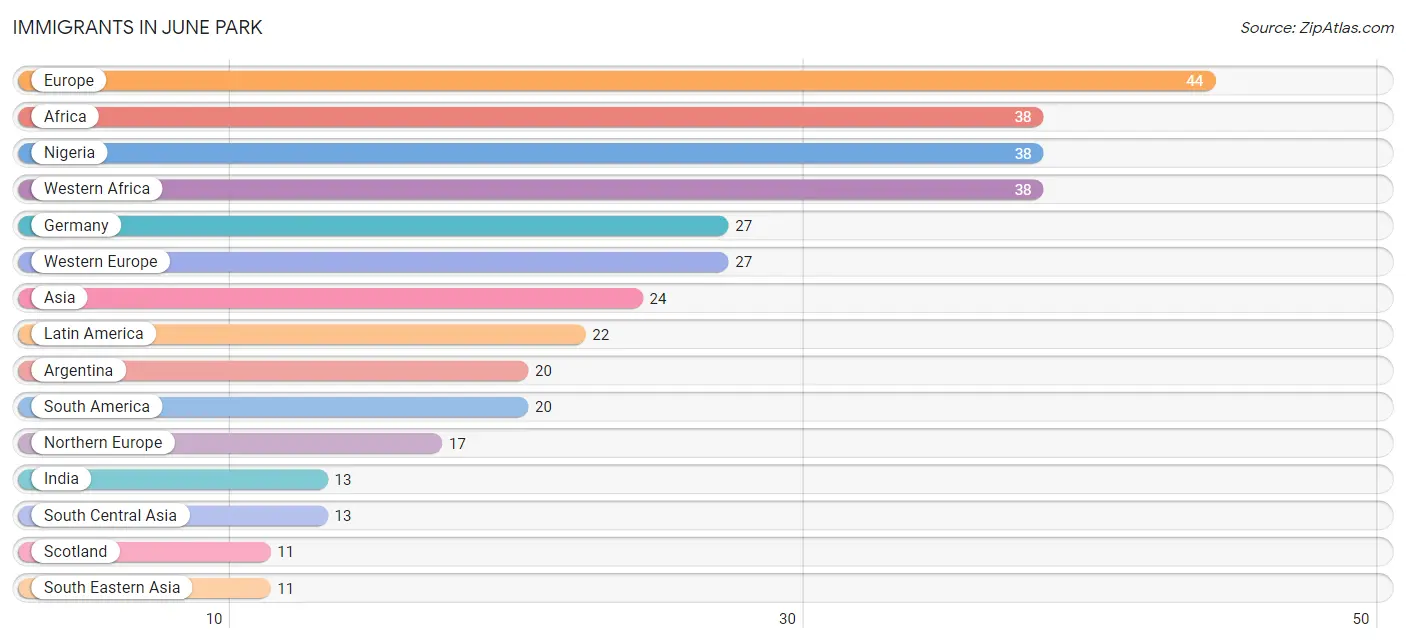
| Immigration Origin | # Population | % Population |
| Africa | 38 | 0.8% |
| Argentina | 20 | 0.4% |
| Asia | 24 | 0.5% |
| Caribbean | 2 | 0.0% |
| Cuba | 2 | 0.0% |
| England | 6 | 0.1% |
| Europe | 44 | 0.9% |
| Germany | 27 | 0.6% |
| India | 13 | 0.3% |
| Latin America | 22 | 0.5% |
| Nigeria | 38 | 0.8% |
| Northern Europe | 17 | 0.4% |
| Scotland | 11 | 0.2% |
| South America | 20 | 0.4% |
| South Central Asia | 13 | 0.3% |
| South Eastern Asia | 11 | 0.2% |
| Vietnam | 11 | 0.2% |
| Western Africa | 38 | 0.8% |
| Western Europe | 27 | 0.6% | View All 19 Rows |
Sex and Age in June Park
Sex and Age in June Park
The most populous age groups in June Park are 55 to 59 Years (288 | 12.7%) for men and 50 to 54 Years (327 | 13.1%) for women.
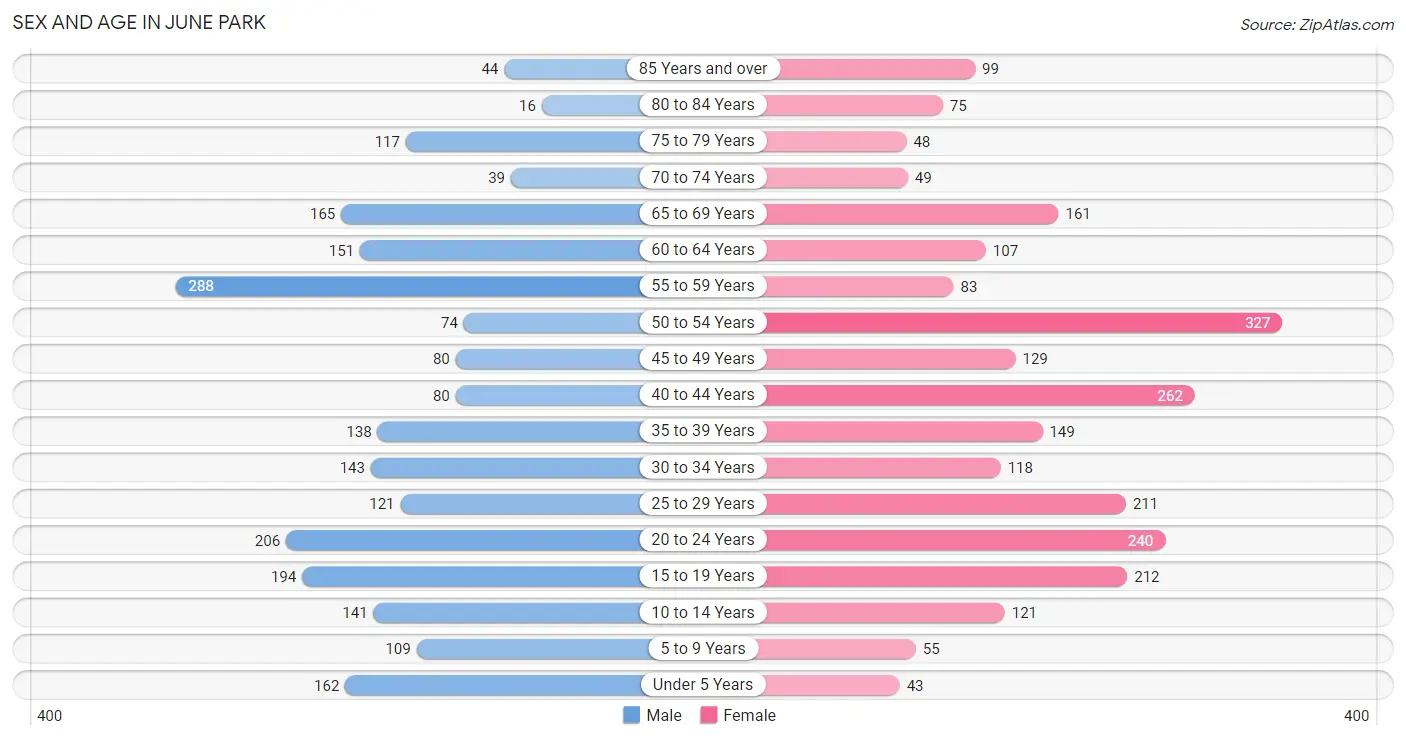
| Age Bracket | Male | Female |
| Under 5 Years | 162 (7.1%) | 43 (1.7%) |
| 5 to 9 Years | 109 (4.8%) | 55 (2.2%) |
| 10 to 14 Years | 141 (6.2%) | 121 (4.9%) |
| 15 to 19 Years | 194 (8.6%) | 212 (8.5%) |
| 20 to 24 Years | 206 (9.1%) | 240 (9.6%) |
| 25 to 29 Years | 121 (5.3%) | 211 (8.5%) |
| 30 to 34 Years | 143 (6.3%) | 118 (4.7%) |
| 35 to 39 Years | 138 (6.1%) | 149 (6.0%) |
| 40 to 44 Years | 80 (3.5%) | 262 (10.5%) |
| 45 to 49 Years | 80 (3.5%) | 129 (5.2%) |
| 50 to 54 Years | 74 (3.3%) | 327 (13.1%) |
| 55 to 59 Years | 288 (12.7%) | 83 (3.3%) |
| 60 to 64 Years | 151 (6.7%) | 107 (4.3%) |
| 65 to 69 Years | 165 (7.3%) | 161 (6.5%) |
| 70 to 74 Years | 39 (1.7%) | 49 (2.0%) |
| 75 to 79 Years | 117 (5.2%) | 48 (1.9%) |
| 80 to 84 Years | 16 (0.7%) | 75 (3.0%) |
| 85 Years and over | 44 (1.9%) | 99 (4.0%) |
| Total | 2,268 (100.0%) | 2,489 (100.0%) |
Families and Households in June Park
Median Family Size in June Park
The median family size in June Park is 3.44 persons per family, with single female/mother families (338 | 28.9%) accounting for the largest median family size of 4.26 persons per family. On the other hand, single male/father families (71 | 6.1%) represent the smallest median family size with 2.69 persons per family.
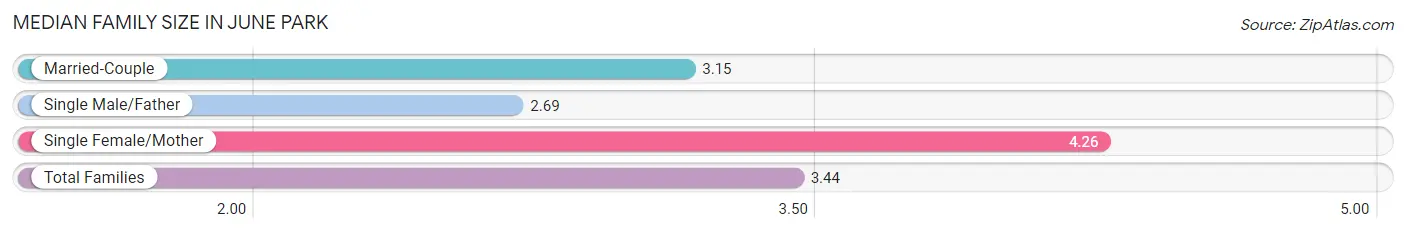
| Family Type | # Families | Family Size |
| Married-Couple | 761 (65.0%) | 3.15 |
| Single Male/Father | 71 (6.1%) | 2.69 |
| Single Female/Mother | 338 (28.9%) | 4.26 |
| Total Families | 1,170 (100.0%) | 3.44 |
Median Household Size in June Park
The median household size in June Park is 2.92 persons per household, with single female/mother households (338 | 20.7%) accounting for the largest median household size of 4.54 persons per household. non-family households (460 | 28.2%) represent the smallest median household size with 1.26 persons per household.
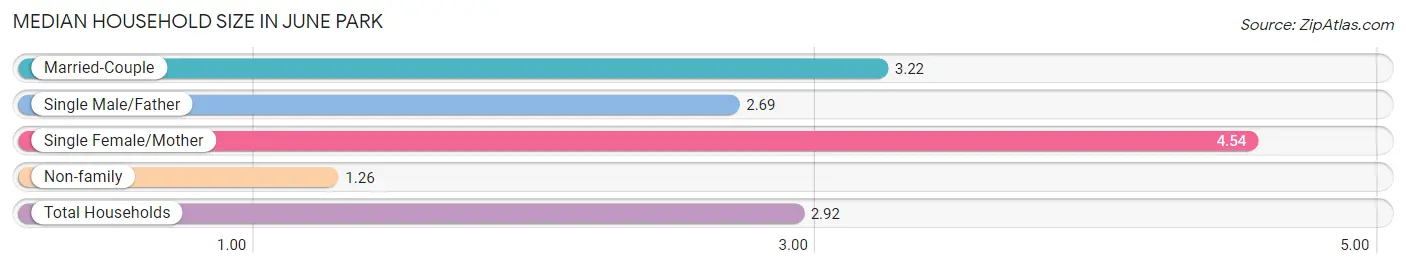
| Household Type | # Households | Household Size |
| Married-Couple | 761 (46.7%) | 3.22 |
| Single Male/Father | 71 (4.4%) | 2.69 |
| Single Female/Mother | 338 (20.7%) | 4.54 |
| Non-family | 460 (28.2%) | 1.26 |
| Total Households | 1,630 (100.0%) | 2.92 |
Household Size by Marriage Status in June Park
Out of a total of 1,630 households in June Park, 1,170 (71.8%) are family households, while 460 (28.2%) are nonfamily households. The most numerous type of family households are 2-person households, comprising 431, and the most common type of nonfamily households are 1-person households, comprising 373.
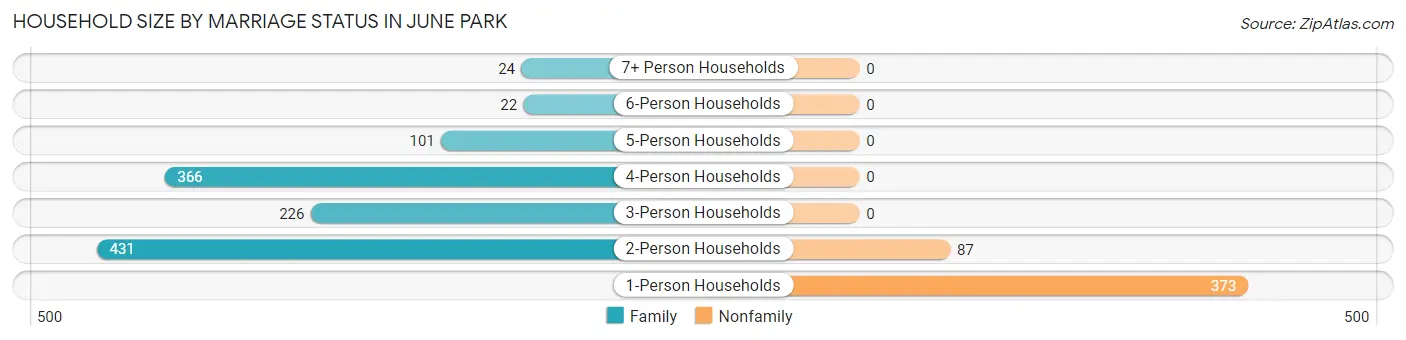
| Household Size | Family Households | Nonfamily Households |
| 1-Person Households | - | 373 (22.9%) |
| 2-Person Households | 431 (26.4%) | 87 (5.3%) |
| 3-Person Households | 226 (13.9%) | 0 (0.0%) |
| 4-Person Households | 366 (22.5%) | 0 (0.0%) |
| 5-Person Households | 101 (6.2%) | 0 (0.0%) |
| 6-Person Households | 22 (1.3%) | 0 (0.0%) |
| 7+ Person Households | 24 (1.5%) | 0 (0.0%) |
| Total | 1,170 (71.8%) | 460 (28.2%) |
Female Fertility in June Park
Fertility by Age in June Park
Average fertility rate in June Park is 101.0 births per 1,000 women. Women in the age bracket of 20 to 34 years have the highest fertility rate with 248.0 births per 1,000 women. Women in the age bracket of 20 to 34 years acount for 100.0% of all women with births.
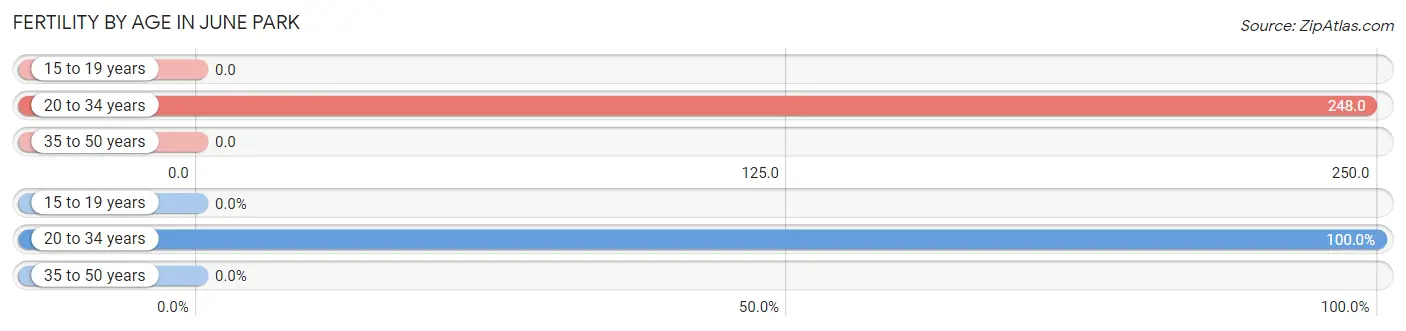
| Age Bracket | Women with Births | Births / 1,000 Women |
| 15 to 19 years | 0 (0.0%) | 0.0 |
| 20 to 34 years | 141 (100.0%) | 248.0 |
| 35 to 50 years | 0 (0.0%) | 0.0 |
| Total | 141 (100.0%) | 101.0 |
Fertility by Age by Marriage Status in June Park
6.4% of women with births (141) in June Park are married. The highest percentage of unmarried women with births falls into 20 to 34 years age bracket with 93.6% of them unmarried at the time of birth, while the lowest percentage of unmarried women with births belong to 20 to 34 years age bracket with 93.6% of them unmarried.
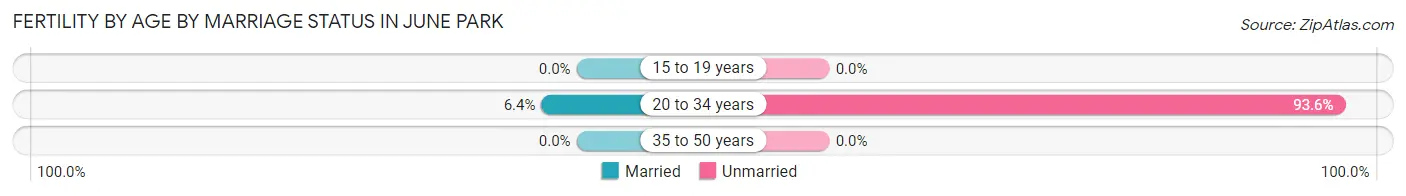
| Age Bracket | Married | Unmarried |
| 15 to 19 years | 0 (0.0%) | 0 (0.0%) |
| 20 to 34 years | 9 (6.4%) | 132 (93.6%) |
| 35 to 50 years | 0 (0.0%) | 0 (0.0%) |
| Total | 9 (6.4%) | 132 (93.6%) |
Fertility by Education in June Park
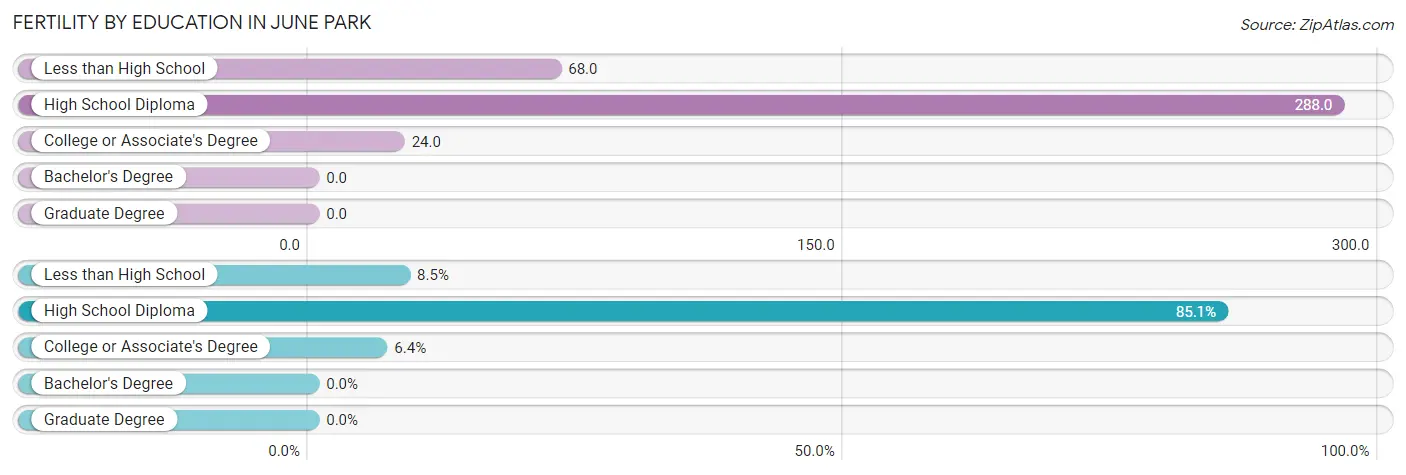
| Educational Attainment | Women with Births | Births / 1,000 Women |
| Less than High School | 12 (8.5%) | 68.0 |
| High School Diploma | 120 (85.1%) | 288.0 |
| College or Associate's Degree | 9 (6.4%) | 24.0 |
| Bachelor's Degree | 0 (0.0%) | 0.0 |
| Graduate Degree | 0 (0.0%) | 0.0 |
| Total | 141 (100.0%) | 101.0 |
Fertility by Education by Marriage Status in June Park
93.6% of women with births in June Park are unmarried. Women with the educational attainment of college or associate's degree are most likely to be married with 100.0% of them married at childbirth, while women with the educational attainment of less than high school are least likely to be married with 100.0% of them unmarried at childbirth.
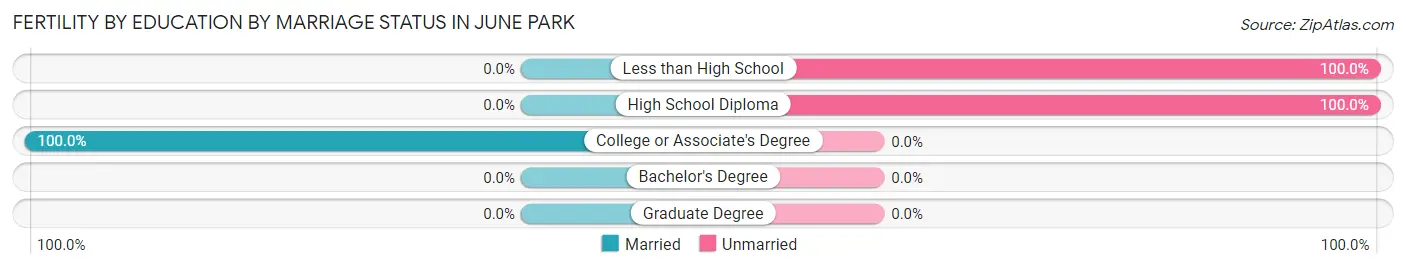
| Educational Attainment | Married | Unmarried |
| Less than High School | 0 (0.0%) | 12 (100.0%) |
| High School Diploma | 0 (0.0%) | 120 (100.0%) |
| College or Associate's Degree | 9 (100.0%) | 0 (0.0%) |
| Bachelor's Degree | 0 (0.0%) | 0 (0.0%) |
| Graduate Degree | 0 (0.0%) | 0 (0.0%) |
| Total | 9 (6.4%) | 132 (93.6%) |
Employment Characteristics in June Park
Employment by Class of Employer in June Park
Among the 2,627 employed individuals in June Park, private company employees (1,823 | 69.4%), local government employees (253 | 9.6%), and not-for-profit organizations (224 | 8.5%) make up the most common classes of employment.
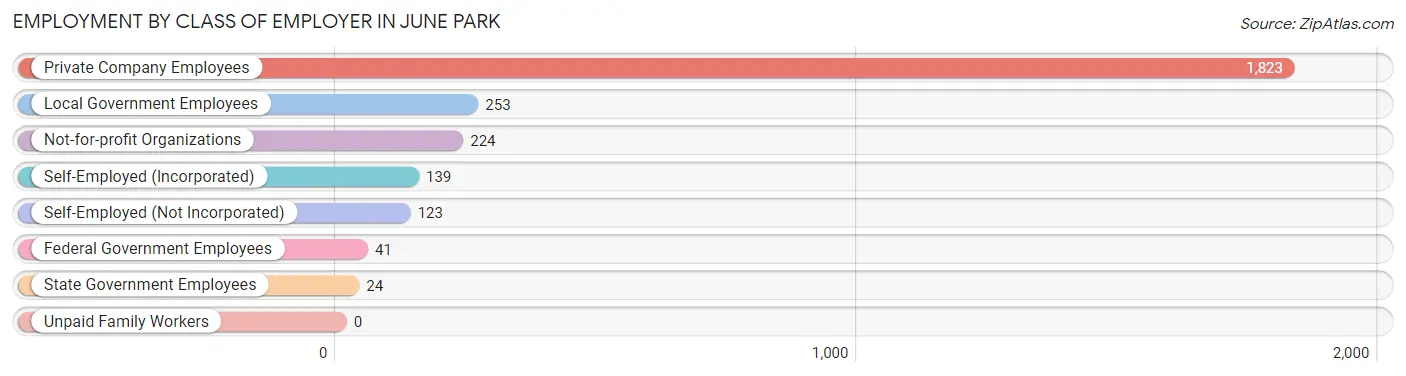
| Employer Class | # Employees | % Employees |
| Private Company Employees | 1,823 | 69.4% |
| Self-Employed (Incorporated) | 139 | 5.3% |
| Self-Employed (Not Incorporated) | 123 | 4.7% |
| Not-for-profit Organizations | 224 | 8.5% |
| Local Government Employees | 253 | 9.6% |
| State Government Employees | 24 | 0.9% |
| Federal Government Employees | 41 | 1.6% |
| Unpaid Family Workers | 0 | 0.0% |
| Total | 2,627 | 100.0% |
Employment Status by Age in June Park
According to the labor force statistics for June Park, out of the total population over 16 years of age (4,031), 67.7% or 2,729 individuals are in the labor force, with 2.8% or 76 of them unemployed. The age group with the highest labor force participation rate is 25 to 29 years, with 96.7% or 321 individuals in the labor force. Within the labor force, the 25 to 29 years age range has the highest percentage of unemployed individuals, with 7.8% or 25 of them being unemployed.
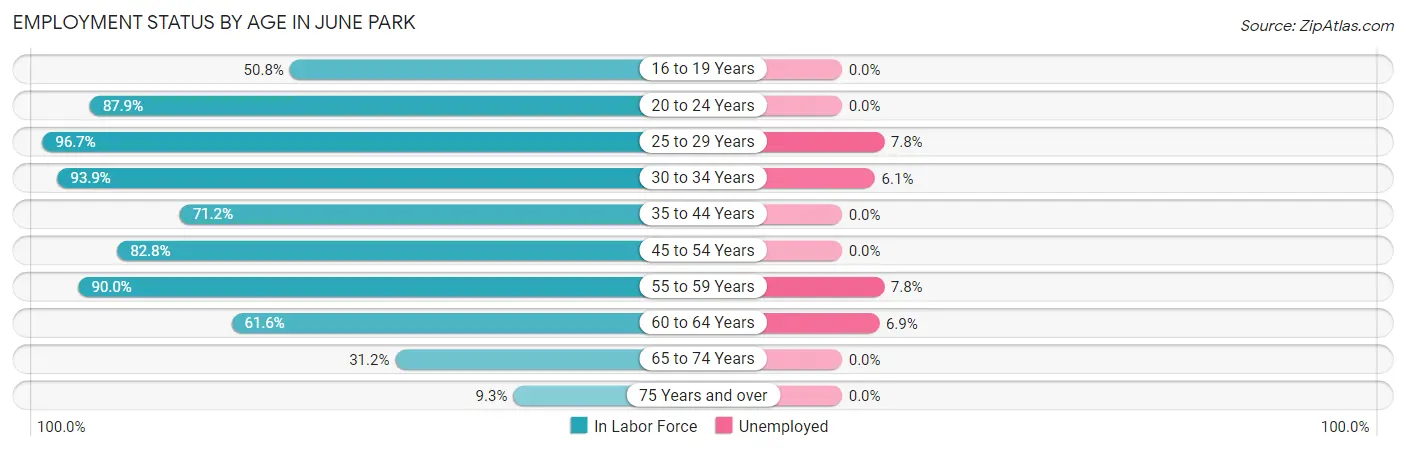
| Age Bracket | In Labor Force | Unemployed |
| 16 to 19 Years | 158 (50.8%) | 0 (0.0%) |
| 20 to 24 Years | 392 (87.9%) | 0 (0.0%) |
| 25 to 29 Years | 321 (96.7%) | 25 (7.8%) |
| 30 to 34 Years | 245 (93.9%) | 15 (6.1%) |
| 35 to 44 Years | 448 (71.2%) | 0 (0.0%) |
| 45 to 54 Years | 505 (82.8%) | 0 (0.0%) |
| 55 to 59 Years | 334 (90.0%) | 26 (7.8%) |
| 60 to 64 Years | 159 (61.6%) | 11 (6.9%) |
| 65 to 74 Years | 129 (31.2%) | 0 (0.0%) |
| 75 Years and over | 37 (9.3%) | 0 (0.0%) |
| Total | 2,729 (67.7%) | 76 (2.8%) |
Employment Status by Educational Attainment in June Park
According to labor force statistics for June Park, 81.8% of individuals (2,013) out of the total population between 25 and 64 years of age (2,461) are in the labor force, with 3.8% or 76 of them being unemployed. The group with the highest labor force participation rate are those with the educational attainment of bachelor's degree or higher, with 86.8% or 719 individuals in the labor force. Within the labor force, individuals with less than high school education have the highest percentage of unemployment, with 13.2% or 9 of them being unemployed.
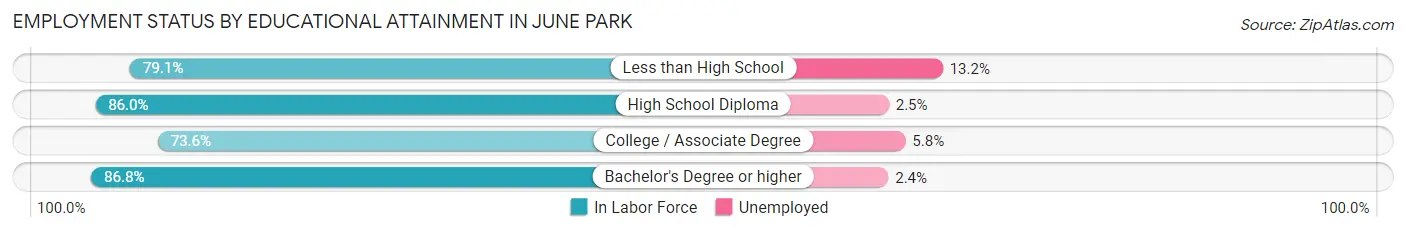
| Educational Attainment | In Labor Force | Unemployed |
| Less than High School | 68 (79.1%) | 11 (13.2%) |
| High School Diploma | 601 (86.0%) | 17 (2.5%) |
| College / Associate Degree | 624 (73.6%) | 49 (5.8%) |
| Bachelor's Degree or higher | 719 (86.8%) | 20 (2.4%) |
| Total | 2,013 (81.8%) | 94 (3.8%) |
Employment Occupations by Sex in June Park
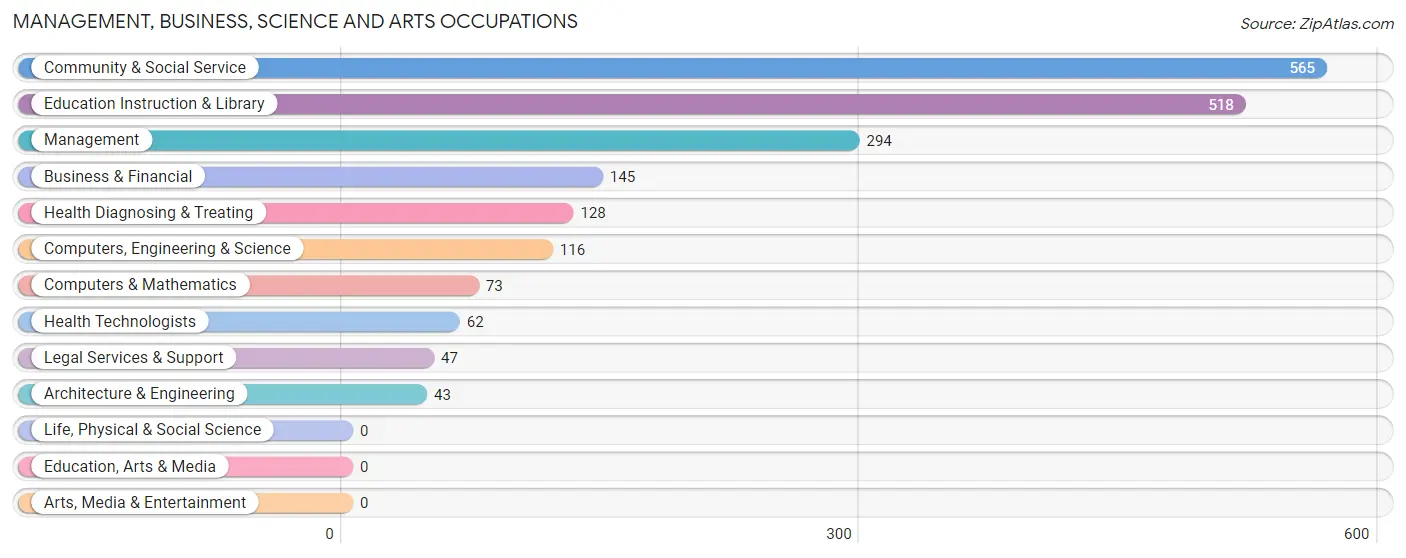
Management, Business, Science and Arts Occupations
The most common Management, Business, Science and Arts occupations in June Park are Community & Social Service (565 | 21.3%), Education Instruction & Library (518 | 19.5%), Management (294 | 11.1%), Business & Financial (145 | 5.5%), and Health Diagnosing & Treating (128 | 4.8%).
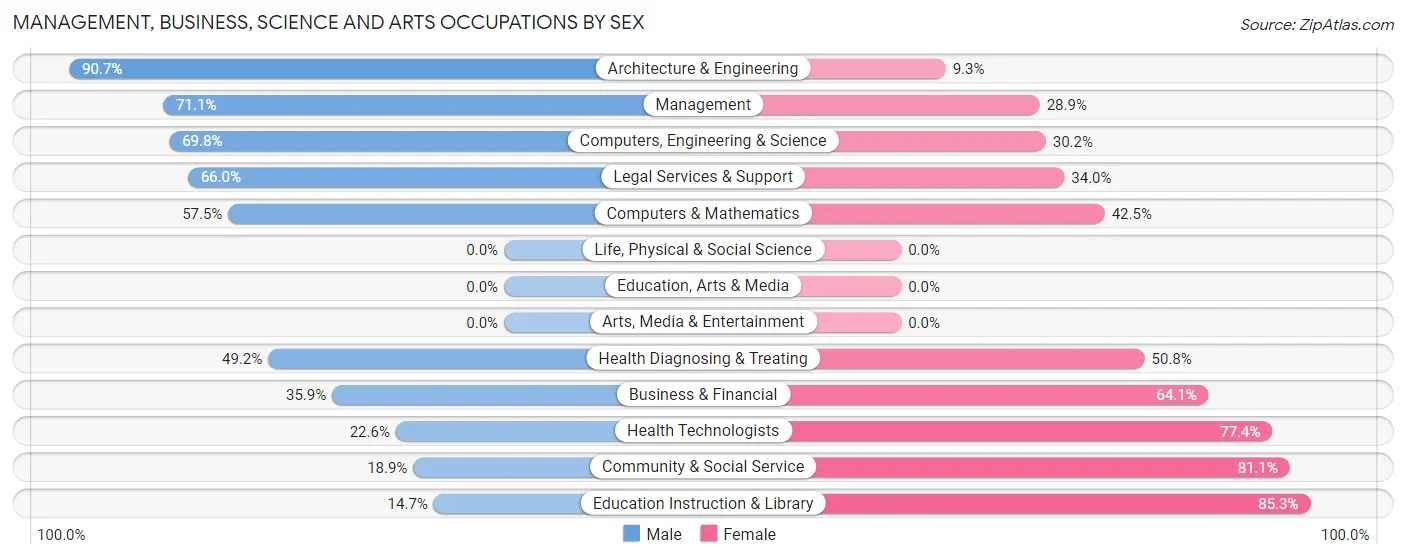
Management, Business, Science and Arts Occupations by Sex
Within the Management, Business, Science and Arts occupations in June Park, the most male-oriented occupations are Architecture & Engineering (90.7%), Management (71.1%), and Computers, Engineering & Science (69.8%), while the most female-oriented occupations are Education Instruction & Library (85.3%), Community & Social Service (81.1%), and Health Technologists (77.4%).
| Occupation | Male | Female |
| Management | 209 (71.1%) | 85 (28.9%) |
| Business & Financial | 52 (35.9%) | 93 (64.1%) |
| Computers, Engineering & Science | 81 (69.8%) | 35 (30.2%) |
| Computers & Mathematics | 42 (57.5%) | 31 (42.5%) |
| Architecture & Engineering | 39 (90.7%) | 4 (9.3%) |
| Life, Physical & Social Science | 0 (0.0%) | 0 (0.0%) |
| Community & Social Service | 107 (18.9%) | 458 (81.1%) |
| Education, Arts & Media | 0 (0.0%) | 0 (0.0%) |
| Legal Services & Support | 31 (66.0%) | 16 (34.0%) |
| Education Instruction & Library | 76 (14.7%) | 442 (85.3%) |
| Arts, Media & Entertainment | 0 (0.0%) | 0 (0.0%) |
| Health Diagnosing & Treating | 63 (49.2%) | 65 (50.8%) |
| Health Technologists | 14 (22.6%) | 48 (77.4%) |
| Total (Category) | 512 (41.0%) | 736 (59.0%) |
| Total (Overall) | 1,311 (49.4%) | 1,340 (50.5%) |
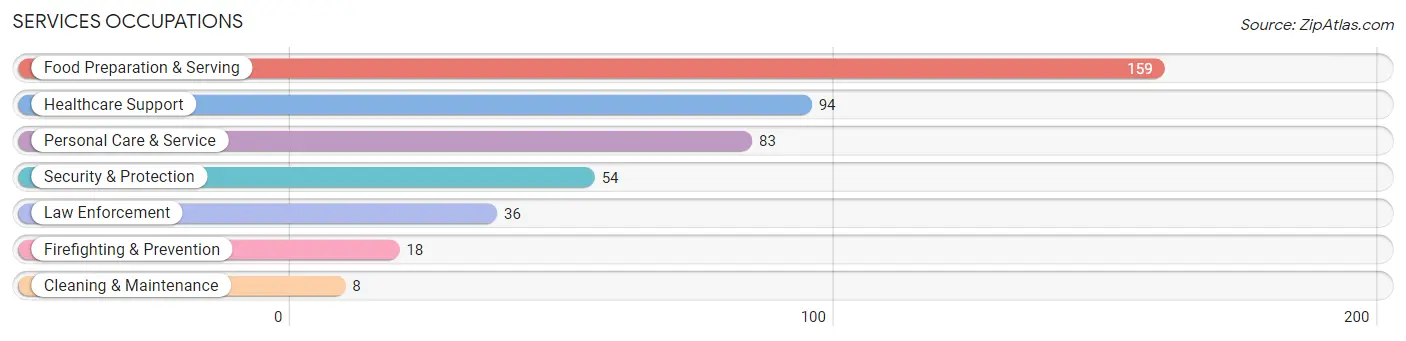
Services Occupations
The most common Services occupations in June Park are Food Preparation & Serving (159 | 6.0%), Healthcare Support (94 | 3.5%), Personal Care & Service (83 | 3.1%), Security & Protection (54 | 2.0%), and Law Enforcement (36 | 1.4%).
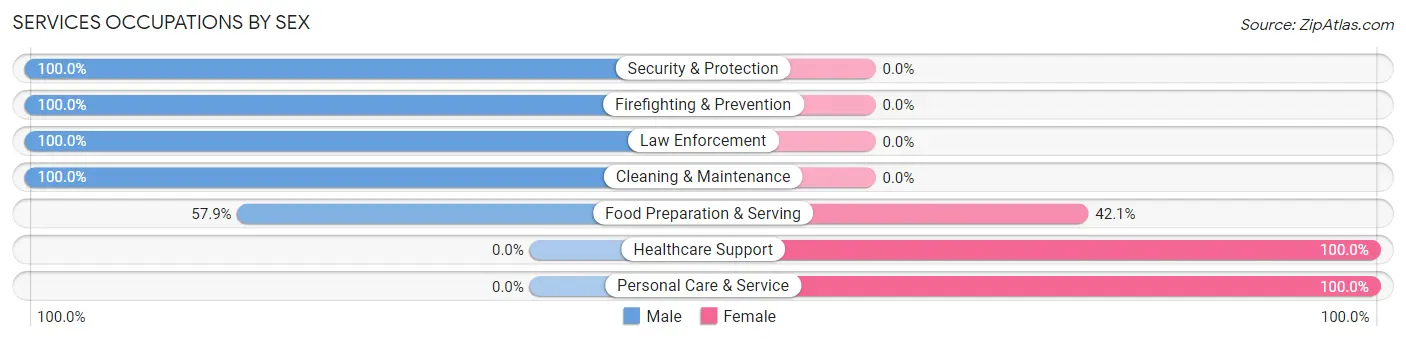
Services Occupations by Sex
Within the Services occupations in June Park, the most male-oriented occupations are Security & Protection (100.0%), Firefighting & Prevention (100.0%), and Law Enforcement (100.0%), while the most female-oriented occupations are Healthcare Support (100.0%), Personal Care & Service (100.0%), and Food Preparation & Serving (42.1%).
| Occupation | Male | Female |
| Healthcare Support | 0 (0.0%) | 94 (100.0%) |
| Security & Protection | 54 (100.0%) | 0 (0.0%) |
| Firefighting & Prevention | 18 (100.0%) | 0 (0.0%) |
| Law Enforcement | 36 (100.0%) | 0 (0.0%) |
| Food Preparation & Serving | 92 (57.9%) | 67 (42.1%) |
| Cleaning & Maintenance | 8 (100.0%) | 0 (0.0%) |
| Personal Care & Service | 0 (0.0%) | 83 (100.0%) |
| Total (Category) | 154 (38.7%) | 244 (61.3%) |
| Total (Overall) | 1,311 (49.4%) | 1,340 (50.5%) |
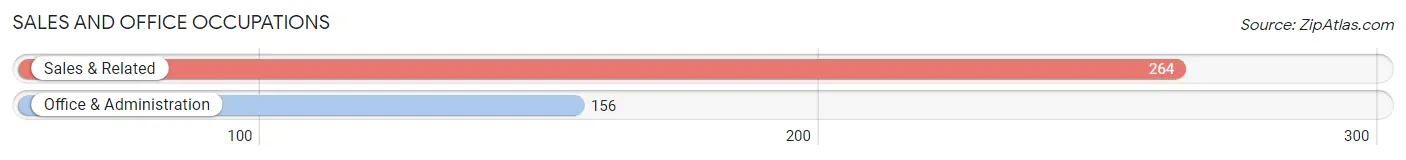
Sales and Office Occupations
The most common Sales and Office occupations in June Park are Sales & Related (264 | 10.0%), and Office & Administration (156 | 5.9%).
Sales and Office Occupations by Sex
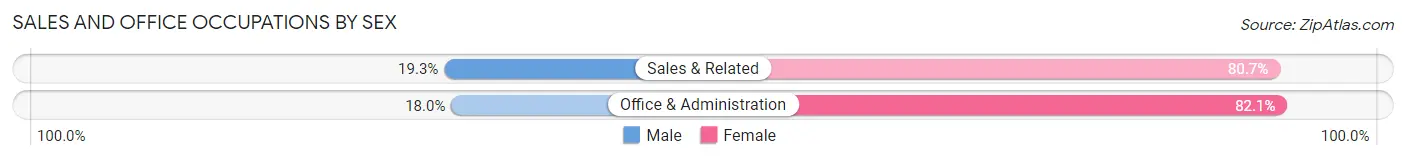
| Occupation | Male | Female |
| Sales & Related | 51 (19.3%) | 213 (80.7%) |
| Office & Administration | 28 (17.9%) | 128 (82.1%) |
| Total (Category) | 79 (18.8%) | 341 (81.2%) |
| Total (Overall) | 1,311 (49.4%) | 1,340 (50.5%) |
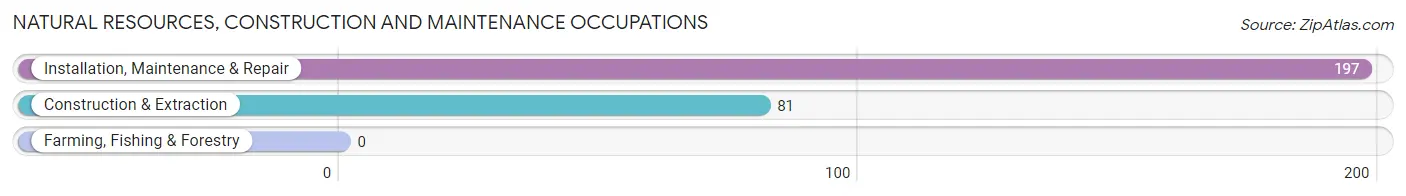
Natural Resources, Construction and Maintenance Occupations
The most common Natural Resources, Construction and Maintenance occupations in June Park are Installation, Maintenance & Repair (197 | 7.4%), and Construction & Extraction (81 | 3.1%).
Natural Resources, Construction and Maintenance Occupations by Sex
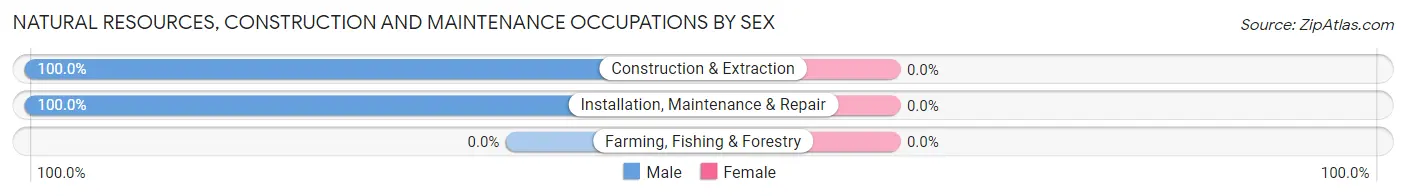
| Occupation | Male | Female |
| Farming, Fishing & Forestry | 0 (0.0%) | 0 (0.0%) |
| Construction & Extraction | 81 (100.0%) | 0 (0.0%) |
| Installation, Maintenance & Repair | 197 (100.0%) | 0 (0.0%) |
| Total (Category) | 278 (100.0%) | 0 (0.0%) |
| Total (Overall) | 1,311 (49.4%) | 1,340 (50.5%) |
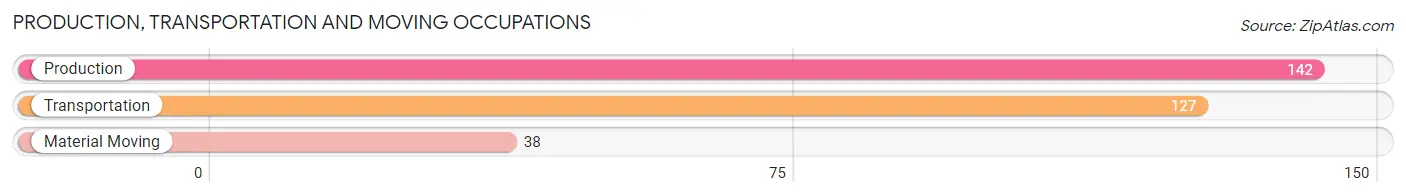
Production, Transportation and Moving Occupations
The most common Production, Transportation and Moving occupations in June Park are Production (142 | 5.4%), Transportation (127 | 4.8%), and Material Moving (38 | 1.4%).
Production, Transportation and Moving Occupations by Sex
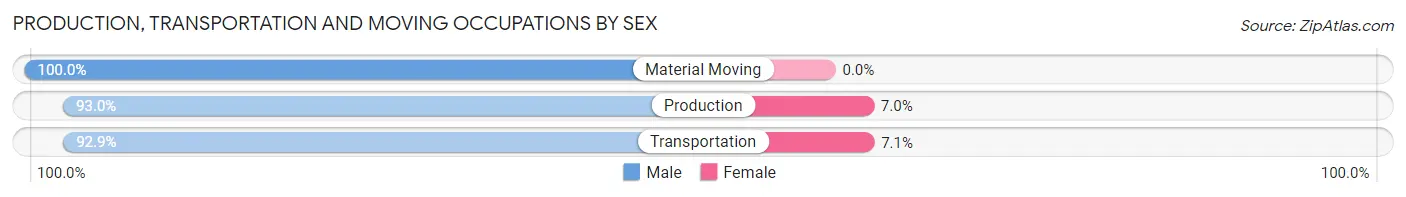
| Occupation | Male | Female |
| Production | 132 (93.0%) | 10 (7.0%) |
| Transportation | 118 (92.9%) | 9 (7.1%) |
| Material Moving | 38 (100.0%) | 0 (0.0%) |
| Total (Category) | 288 (93.8%) | 19 (6.2%) |
| Total (Overall) | 1,311 (49.4%) | 1,340 (50.5%) |
Employment Industries by Sex in June Park
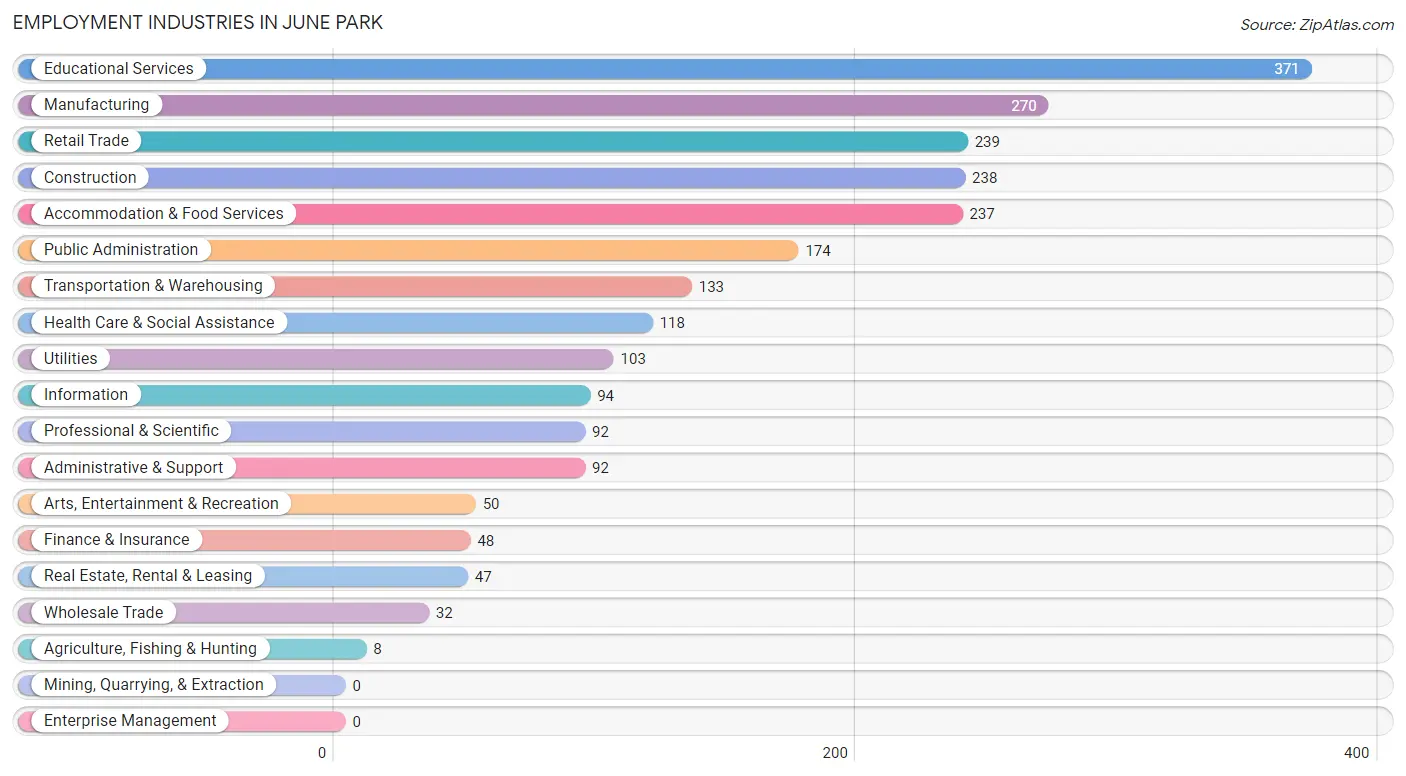
Employment Industries in June Park
The major employment industries in June Park include Educational Services (371 | 14.0%), Manufacturing (270 | 10.2%), Retail Trade (239 | 9.0%), Construction (238 | 9.0%), and Accommodation & Food Services (237 | 8.9%).
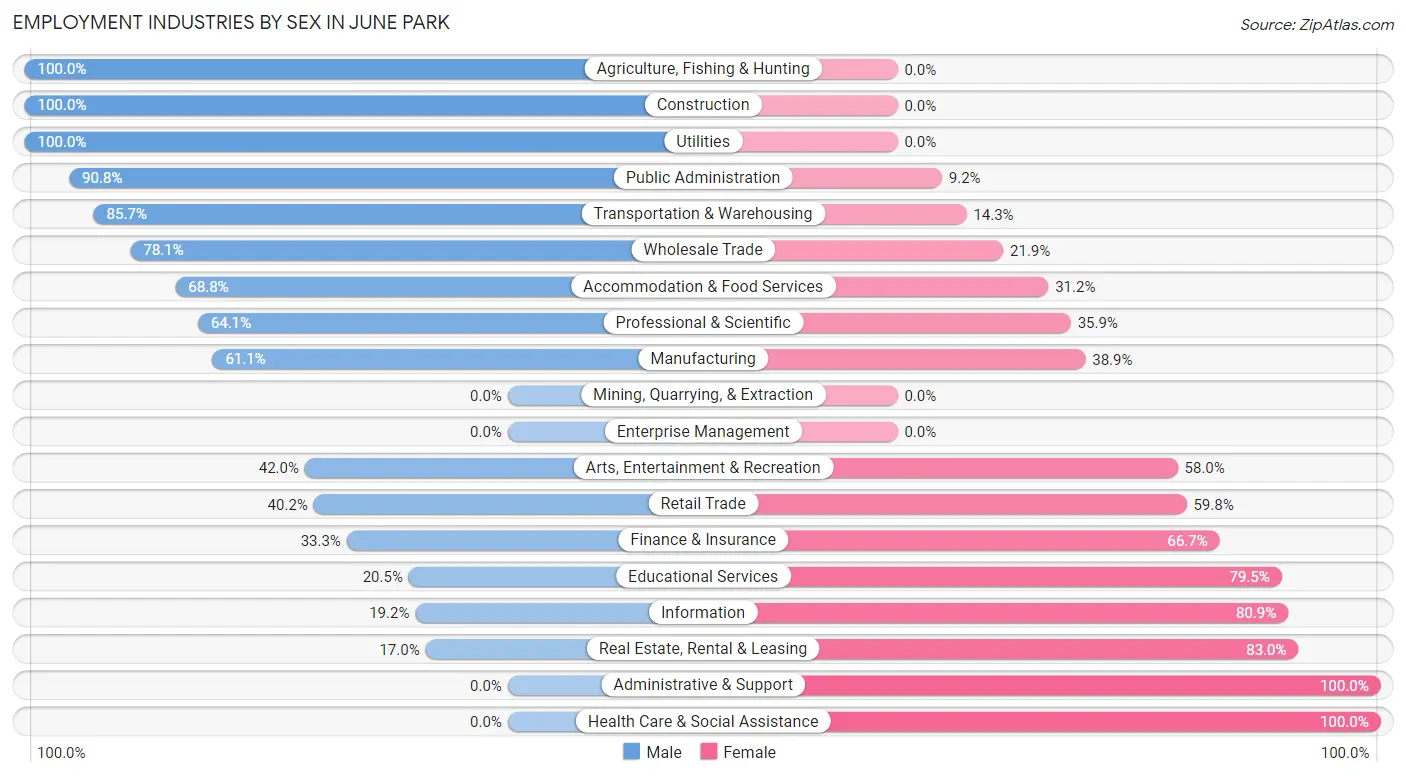
Employment Industries by Sex in June Park
The June Park industries that see more men than women are Agriculture, Fishing & Hunting (100.0%), Construction (100.0%), and Utilities (100.0%), whereas the industries that tend to have a higher number of women are Administrative & Support (100.0%), Health Care & Social Assistance (100.0%), and Real Estate, Rental & Leasing (83.0%).
| Industry | Male | Female |
| Agriculture, Fishing & Hunting | 8 (100.0%) | 0 (0.0%) |
| Mining, Quarrying, & Extraction | 0 (0.0%) | 0 (0.0%) |
| Construction | 238 (100.0%) | 0 (0.0%) |
| Manufacturing | 165 (61.1%) | 105 (38.9%) |
| Wholesale Trade | 25 (78.1%) | 7 (21.9%) |
| Retail Trade | 96 (40.2%) | 143 (59.8%) |
| Transportation & Warehousing | 114 (85.7%) | 19 (14.3%) |
| Utilities | 103 (100.0%) | 0 (0.0%) |
| Information | 18 (19.2%) | 76 (80.8%) |
| Finance & Insurance | 16 (33.3%) | 32 (66.7%) |
| Real Estate, Rental & Leasing | 8 (17.0%) | 39 (83.0%) |
| Professional & Scientific | 59 (64.1%) | 33 (35.9%) |
| Enterprise Management | 0 (0.0%) | 0 (0.0%) |
| Administrative & Support | 0 (0.0%) | 92 (100.0%) |
| Educational Services | 76 (20.5%) | 295 (79.5%) |
| Health Care & Social Assistance | 0 (0.0%) | 118 (100.0%) |
| Arts, Entertainment & Recreation | 21 (42.0%) | 29 (58.0%) |
| Accommodation & Food Services | 163 (68.8%) | 74 (31.2%) |
| Public Administration | 158 (90.8%) | 16 (9.2%) |
| Total | 1,311 (49.4%) | 1,340 (50.5%) |
Education in June Park
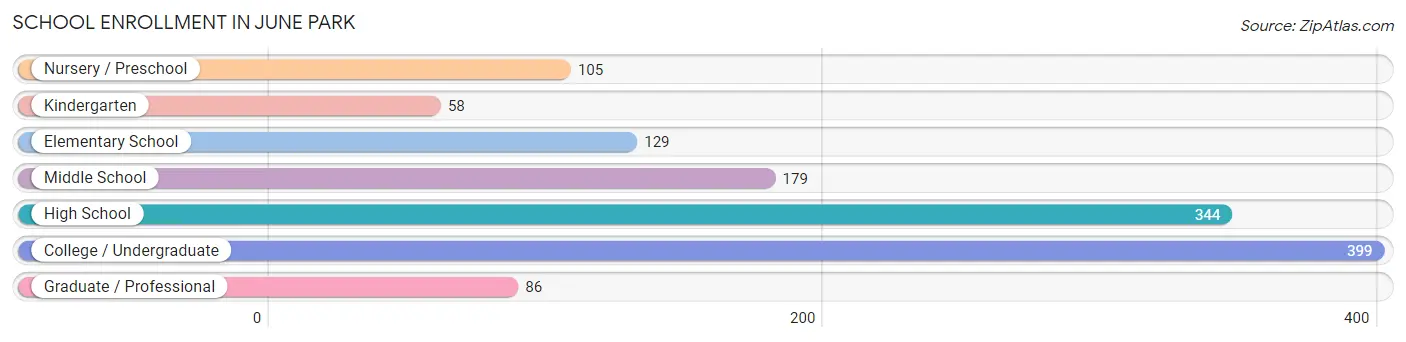
School Enrollment in June Park
The most common levels of schooling among the 1,300 students in June Park are college / undergraduate (399 | 30.7%), high school (344 | 26.5%), and middle school (179 | 13.8%).
| School Level | # Students | % Students |
| Nursery / Preschool | 105 | 8.1% |
| Kindergarten | 58 | 4.5% |
| Elementary School | 129 | 9.9% |
| Middle School | 179 | 13.8% |
| High School | 344 | 26.5% |
| College / Undergraduate | 399 | 30.7% |
| Graduate / Professional | 86 | 6.6% |
| Total | 1,300 | 100.0% |
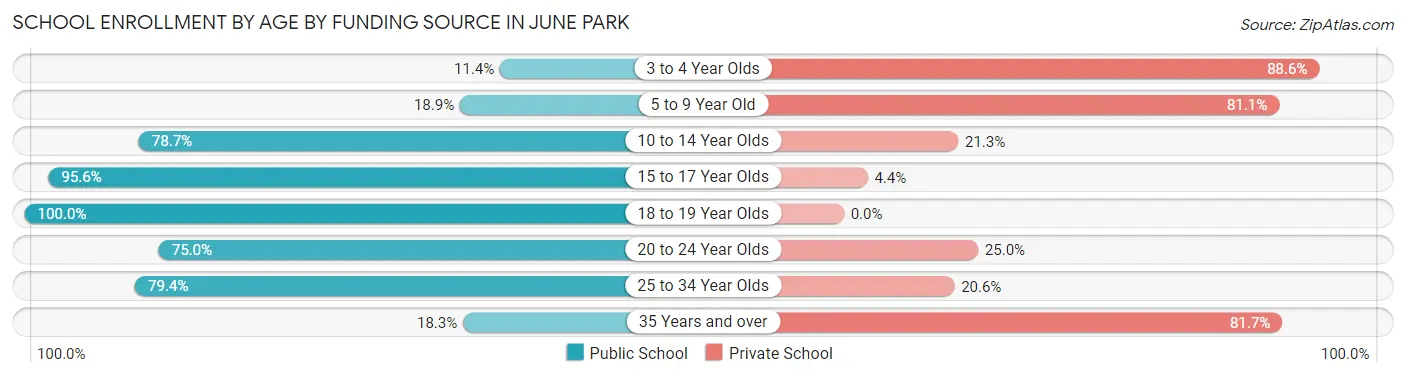
School Enrollment by Age by Funding Source in June Park
Out of a total of 1,300 students who are enrolled in schools in June Park, 429 (33.0%) attend a private institution, while the remaining 871 (67.0%) are enrolled in public schools. The age group of 3 to 4 year olds has the highest likelihood of being enrolled in private schools, with 93 (88.6% in the age bracket) enrolled. Conversely, the age group of 18 to 19 year olds has the lowest likelihood of being enrolled in a private school, with 105 (100.0% in the age bracket) attending a public institution.
| Age Bracket | Public School | Private School |
| 3 to 4 Year Olds | 12 (11.4%) | 93 (88.6%) |
| 5 to 9 Year Old | 31 (18.9%) | 133 (81.1%) |
| 10 to 14 Year Olds | 181 (78.7%) | 49 (21.3%) |
| 15 to 17 Year Olds | 237 (95.6%) | 11 (4.4%) |
| 18 to 19 Year Olds | 105 (100.0%) | 0 (0.0%) |
| 20 to 24 Year Olds | 240 (75.0%) | 80 (25.0%) |
| 25 to 34 Year Olds | 54 (79.4%) | 14 (20.6%) |
| 35 Years and over | 11 (18.3%) | 49 (81.7%) |
| Total | 871 (67.0%) | 429 (33.0%) |
Educational Attainment by Field of Study in June Park
Engineering (177 | 16.7%), business (170 | 16.0%), education (112 | 10.6%), psychology (90 | 8.5%), and literature & languages (89 | 8.4%) are the most common fields of study among 1,061 individuals in June Park who have obtained a bachelor's degree or higher.
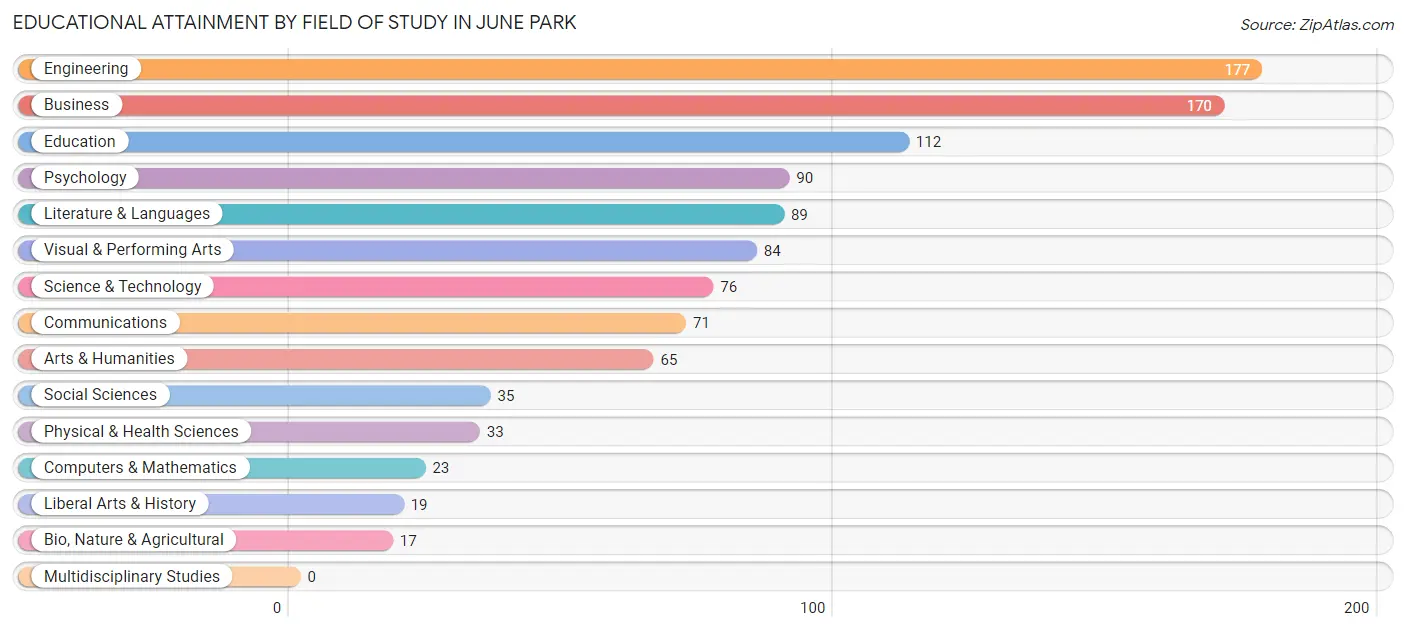
| Field of Study | # Graduates | % Graduates |
| Computers & Mathematics | 23 | 2.2% |
| Bio, Nature & Agricultural | 17 | 1.6% |
| Physical & Health Sciences | 33 | 3.1% |
| Psychology | 90 | 8.5% |
| Social Sciences | 35 | 3.3% |
| Engineering | 177 | 16.7% |
| Multidisciplinary Studies | 0 | 0.0% |
| Science & Technology | 76 | 7.2% |
| Business | 170 | 16.0% |
| Education | 112 | 10.6% |
| Literature & Languages | 89 | 8.4% |
| Liberal Arts & History | 19 | 1.8% |
| Visual & Performing Arts | 84 | 7.9% |
| Communications | 71 | 6.7% |
| Arts & Humanities | 65 | 6.1% |
| Total | 1,061 | 100.0% |
Transportation & Commute in June Park
Vehicle Availability by Sex in June Park
The most prevalent vehicle ownership categories in June Park are males with 3 vehicles (486, accounting for 37.5%) and females with 3 vehicles (360, making up 36.5%).
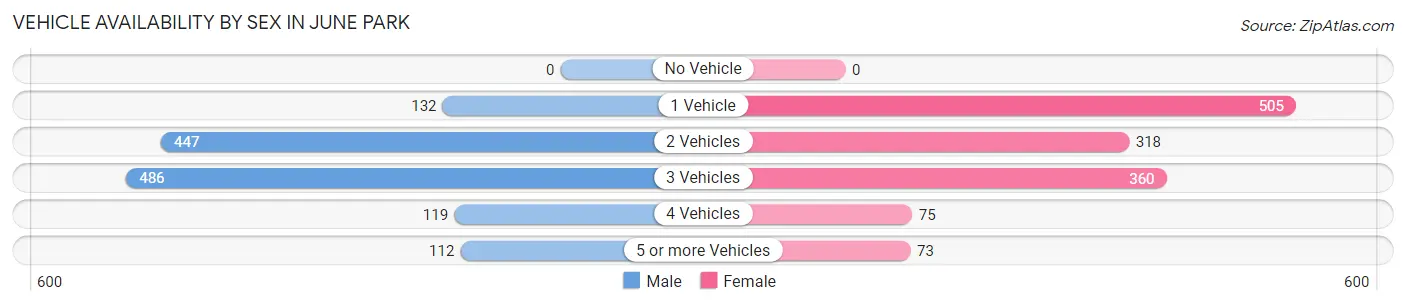
| Vehicles Available | Male | Female |
| No Vehicle | 0 (0.0%) | 0 (0.0%) |
| 1 Vehicle | 132 (10.2%) | 505 (37.9%) |
| 2 Vehicles | 447 (34.5%) | 318 (23.9%) |
| 3 Vehicles | 486 (37.5%) | 360 (27.1%) |
| 4 Vehicles | 119 (9.2%) | 75 (5.6%) |
| 5 or more Vehicles | 112 (8.6%) | 73 (5.5%) |
| Total | 1,296 (100.0%) | 1,331 (100.0%) |
Commute Time in June Park
The most frequently occuring commute durations in June Park are 10 to 14 minutes (548 commuters, 22.7%), 15 to 19 minutes (382 commuters, 15.8%), and 20 to 24 minutes (313 commuters, 13.0%).
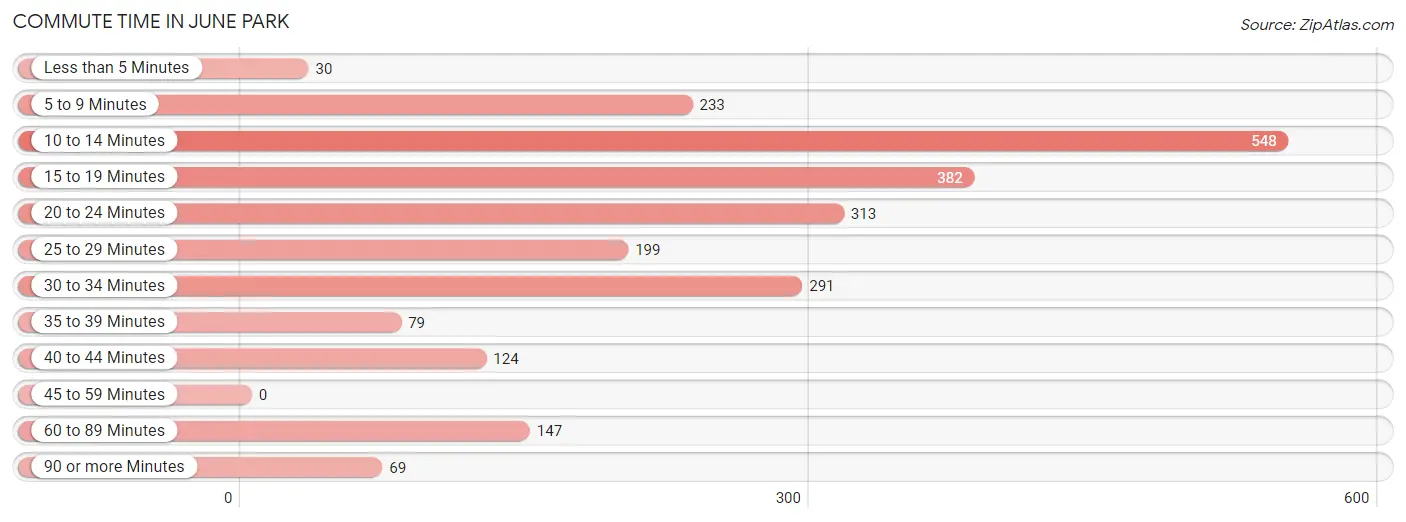
| Commute Time | # Commuters | % Commuters |
| Less than 5 Minutes | 30 | 1.2% |
| 5 to 9 Minutes | 233 | 9.7% |
| 10 to 14 Minutes | 548 | 22.7% |
| 15 to 19 Minutes | 382 | 15.8% |
| 20 to 24 Minutes | 313 | 13.0% |
| 25 to 29 Minutes | 199 | 8.2% |
| 30 to 34 Minutes | 291 | 12.0% |
| 35 to 39 Minutes | 79 | 3.3% |
| 40 to 44 Minutes | 124 | 5.1% |
| 45 to 59 Minutes | 0 | 0.0% |
| 60 to 89 Minutes | 147 | 6.1% |
| 90 or more Minutes | 69 | 2.9% |
Commute Time by Sex in June Park
The most common commute times in June Park are 20 to 24 minutes (216 commuters, 18.1%) for males and 10 to 14 minutes (377 commuters, 30.8%) for females.
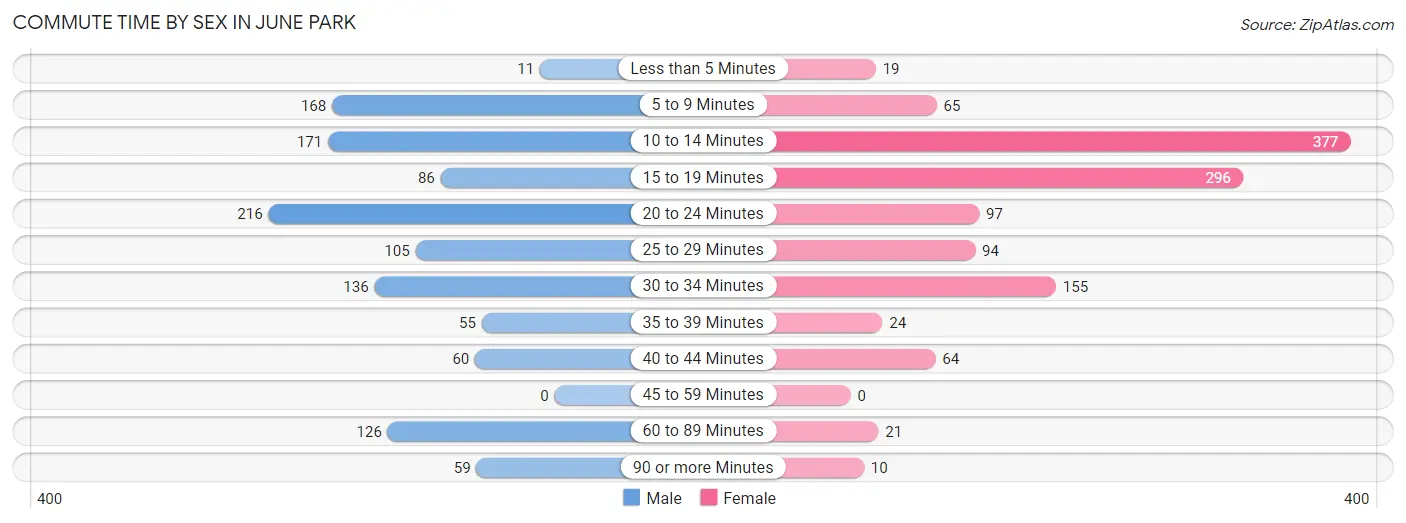
| Commute Time | Male | Female |
| Less than 5 Minutes | 11 (0.9%) | 19 (1.5%) |
| 5 to 9 Minutes | 168 (14.1%) | 65 (5.3%) |
| 10 to 14 Minutes | 171 (14.3%) | 377 (30.8%) |
| 15 to 19 Minutes | 86 (7.2%) | 296 (24.2%) |
| 20 to 24 Minutes | 216 (18.1%) | 97 (7.9%) |
| 25 to 29 Minutes | 105 (8.8%) | 94 (7.7%) |
| 30 to 34 Minutes | 136 (11.4%) | 155 (12.7%) |
| 35 to 39 Minutes | 55 (4.6%) | 24 (2.0%) |
| 40 to 44 Minutes | 60 (5.0%) | 64 (5.2%) |
| 45 to 59 Minutes | 0 (0.0%) | 0 (0.0%) |
| 60 to 89 Minutes | 126 (10.6%) | 21 (1.7%) |
| 90 or more Minutes | 59 (5.0%) | 10 (0.8%) |
Time of Departure to Work by Sex in June Park
The most frequent times of departure to work in June Park are 7:00 AM to 7:29 AM (204, 17.1%) for males and 7:30 AM to 7:59 AM (261, 21.4%) for females.
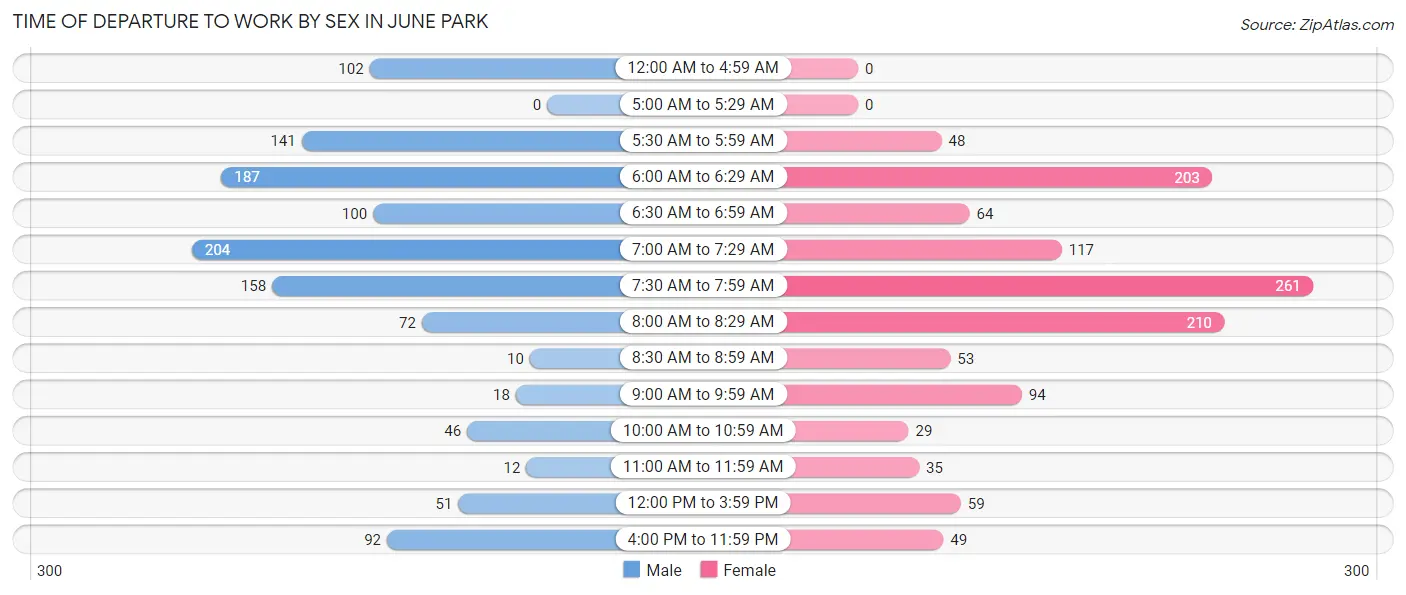
| Time of Departure | Male | Female |
| 12:00 AM to 4:59 AM | 102 (8.6%) | 0 (0.0%) |
| 5:00 AM to 5:29 AM | 0 (0.0%) | 0 (0.0%) |
| 5:30 AM to 5:59 AM | 141 (11.8%) | 48 (3.9%) |
| 6:00 AM to 6:29 AM | 187 (15.7%) | 203 (16.6%) |
| 6:30 AM to 6:59 AM | 100 (8.4%) | 64 (5.2%) |
| 7:00 AM to 7:29 AM | 204 (17.1%) | 117 (9.6%) |
| 7:30 AM to 7:59 AM | 158 (13.2%) | 261 (21.4%) |
| 8:00 AM to 8:29 AM | 72 (6.0%) | 210 (17.2%) |
| 8:30 AM to 8:59 AM | 10 (0.8%) | 53 (4.3%) |
| 9:00 AM to 9:59 AM | 18 (1.5%) | 94 (7.7%) |
| 10:00 AM to 10:59 AM | 46 (3.9%) | 29 (2.4%) |
| 11:00 AM to 11:59 AM | 12 (1.0%) | 35 (2.9%) |
| 12:00 PM to 3:59 PM | 51 (4.3%) | 59 (4.8%) |
| 4:00 PM to 11:59 PM | 92 (7.7%) | 49 (4.0%) |
| Total | 1,193 (100.0%) | 1,222 (100.0%) |
Housing Occupancy in June Park
Occupancy by Ownership in June Park
Of the total 1,630 dwellings in June Park, owner-occupied units account for 1,433 (87.9%), while renter-occupied units make up 197 (12.1%).
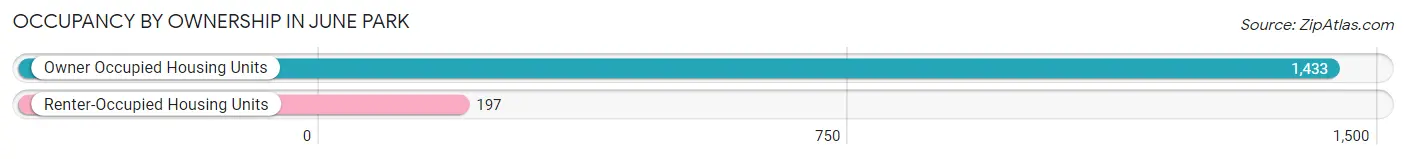
| Occupancy | # Housing Units | % Housing Units |
| Owner Occupied Housing Units | 1,433 | 87.9% |
| Renter-Occupied Housing Units | 197 | 12.1% |
| Total Occupied Housing Units | 1,630 | 100.0% |
Occupancy by Household Size in June Park
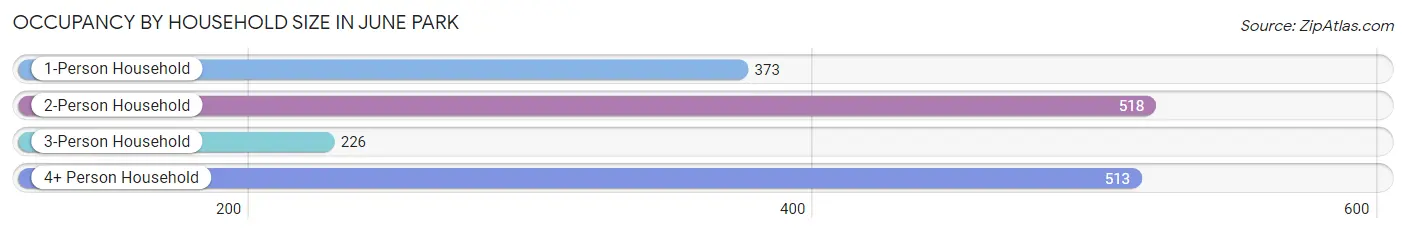
| Household Size | # Housing Units | % Housing Units |
| 1-Person Household | 373 | 22.9% |
| 2-Person Household | 518 | 31.8% |
| 3-Person Household | 226 | 13.9% |
| 4+ Person Household | 513 | 31.5% |
| Total Housing Units | 1,630 | 100.0% |
Occupancy by Ownership by Household Size in June Park
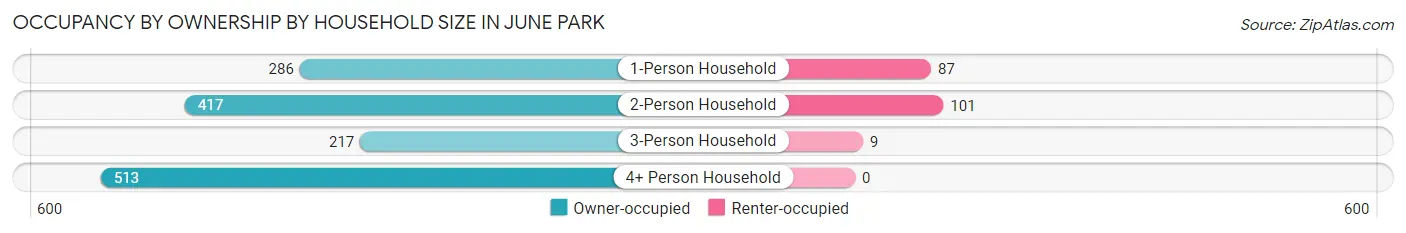
| Household Size | Owner-occupied | Renter-occupied |
| 1-Person Household | 286 (76.7%) | 87 (23.3%) |
| 2-Person Household | 417 (80.5%) | 101 (19.5%) |
| 3-Person Household | 217 (96.0%) | 9 (4.0%) |
| 4+ Person Household | 513 (100.0%) | 0 (0.0%) |
| Total Housing Units | 1,433 (87.9%) | 197 (12.1%) |
Occupancy by Educational Attainment in June Park
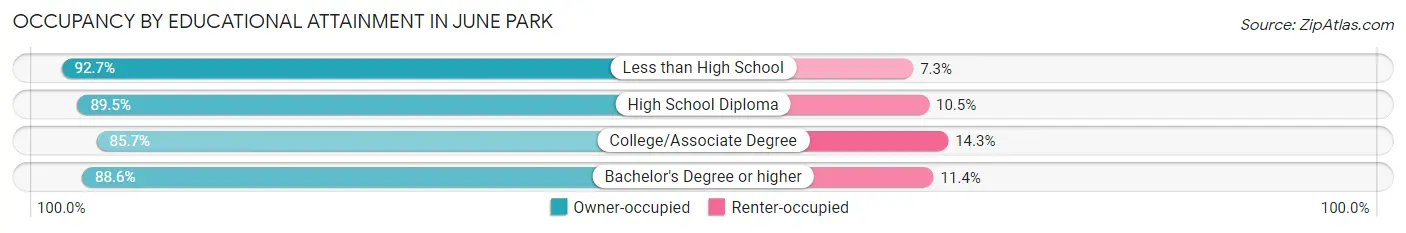
| Household Size | Owner-occupied | Renter-occupied |
| Less than High School | 101 (92.7%) | 8 (7.3%) |
| High School Diploma | 273 (89.5%) | 32 (10.5%) |
| College/Associate Degree | 546 (85.7%) | 91 (14.3%) |
| Bachelor's Degree or higher | 513 (88.6%) | 66 (11.4%) |
Occupancy by Age of Householder in June Park
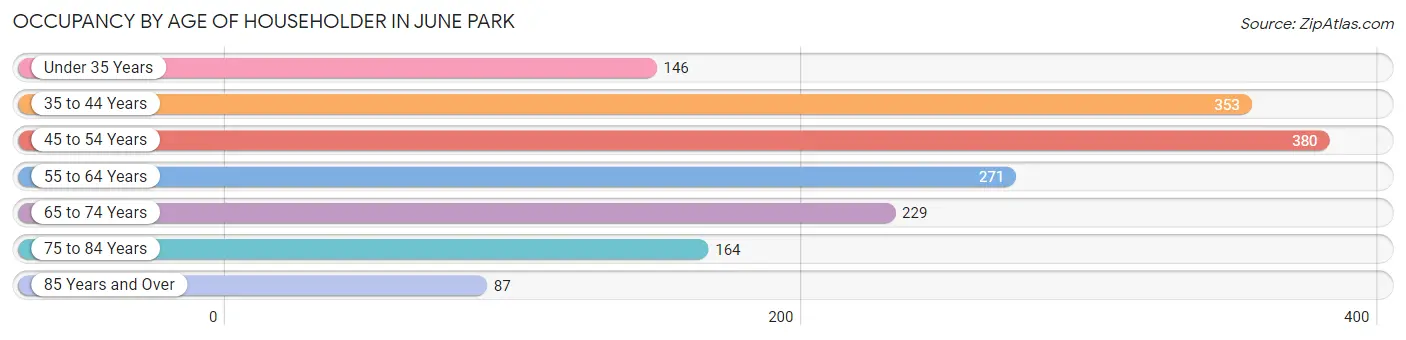
| Age Bracket | # Households | % Households |
| Under 35 Years | 146 | 9.0% |
| 35 to 44 Years | 353 | 21.7% |
| 45 to 54 Years | 380 | 23.3% |
| 55 to 64 Years | 271 | 16.6% |
| 65 to 74 Years | 229 | 14.1% |
| 75 to 84 Years | 164 | 10.1% |
| 85 Years and Over | 87 | 5.3% |
| Total | 1,630 | 100.0% |
Housing Finances in June Park
Median Income by Occupancy in June Park
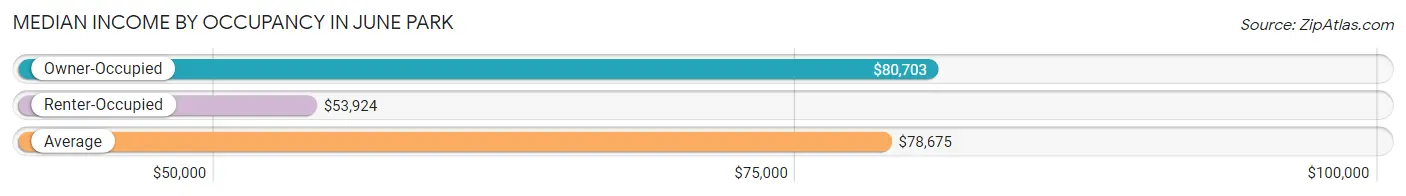
| Occupancy Type | # Households | Median Income |
| Owner-Occupied | 1,433 (87.9%) | $80,703 |
| Renter-Occupied | 197 (12.1%) | $53,924 |
| Average | 1,630 (100.0%) | $78,675 |
Occupancy by Householder Income Bracket in June Park
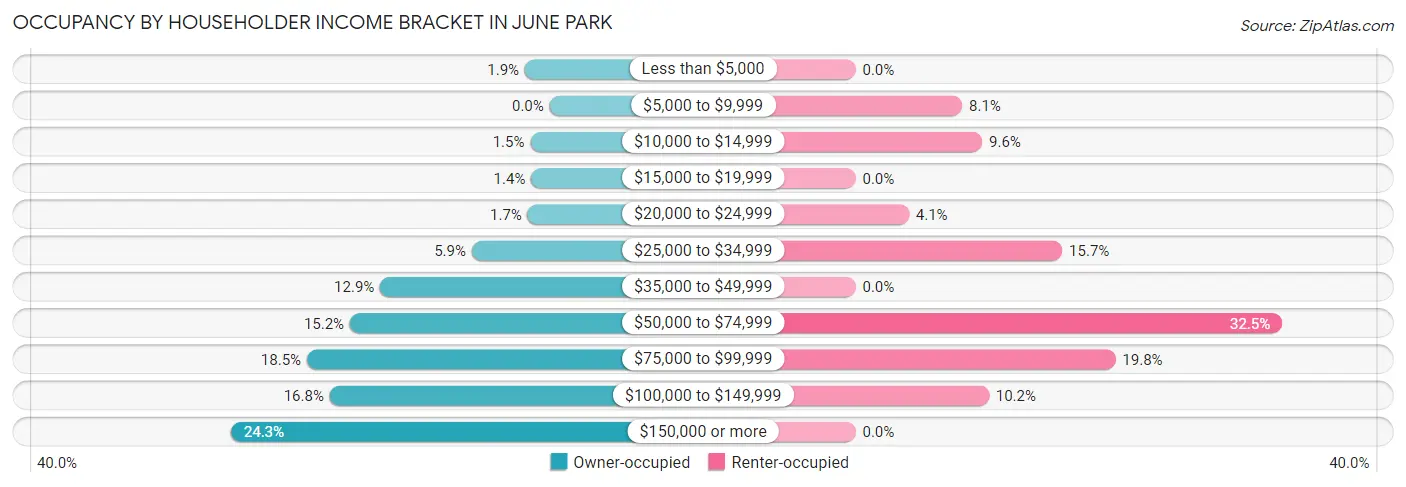
| Income Bracket | Owner-occupied | Renter-occupied |
| Less than $5,000 | 27 (1.9%) | 0 (0.0%) |
| $5,000 to $9,999 | 0 (0.0%) | 16 (8.1%) |
| $10,000 to $14,999 | 21 (1.5%) | 19 (9.6%) |
| $15,000 to $19,999 | 20 (1.4%) | 0 (0.0%) |
| $20,000 to $24,999 | 24 (1.7%) | 8 (4.1%) |
| $25,000 to $34,999 | 85 (5.9%) | 31 (15.7%) |
| $35,000 to $49,999 | 185 (12.9%) | 0 (0.0%) |
| $50,000 to $74,999 | 218 (15.2%) | 64 (32.5%) |
| $75,000 to $99,999 | 265 (18.5%) | 39 (19.8%) |
| $100,000 to $149,999 | 240 (16.8%) | 20 (10.2%) |
| $150,000 or more | 348 (24.3%) | 0 (0.0%) |
| Total | 1,433 (100.0%) | 197 (100.0%) |
Monthly Housing Cost Tiers in June Park
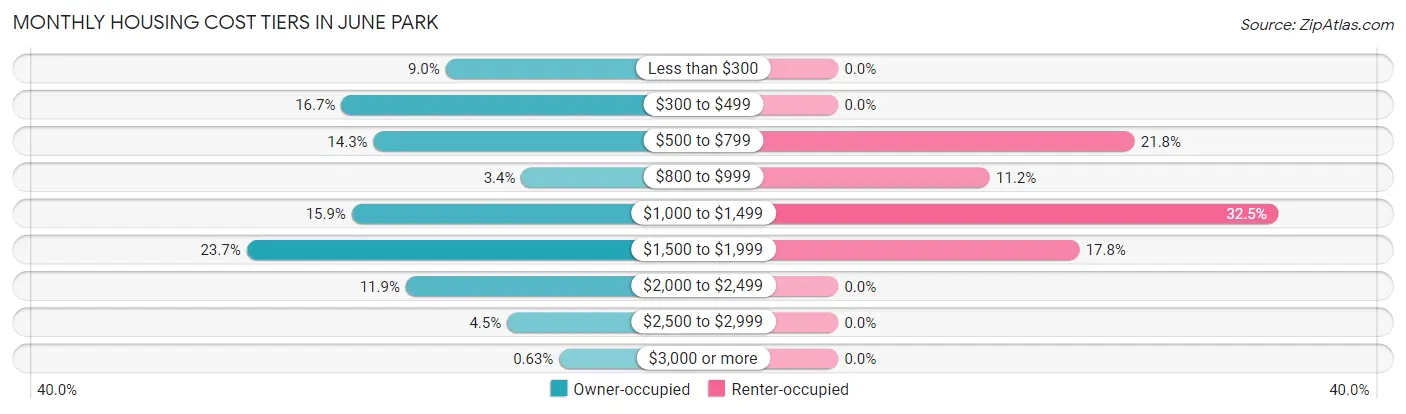
| Monthly Cost | Owner-occupied | Renter-occupied |
| Less than $300 | 129 (9.0%) | 0 (0.0%) |
| $300 to $499 | 239 (16.7%) | 0 (0.0%) |
| $500 to $799 | 205 (14.3%) | 43 (21.8%) |
| $800 to $999 | 49 (3.4%) | 22 (11.2%) |
| $1,000 to $1,499 | 228 (15.9%) | 64 (32.5%) |
| $1,500 to $1,999 | 339 (23.7%) | 35 (17.8%) |
| $2,000 to $2,499 | 171 (11.9%) | 0 (0.0%) |
| $2,500 to $2,999 | 64 (4.5%) | 0 (0.0%) |
| $3,000 or more | 9 (0.6%) | 0 (0.0%) |
| Total | 1,433 (100.0%) | 197 (100.0%) |
Physical Housing Characteristics in June Park
Housing Structures in June Park
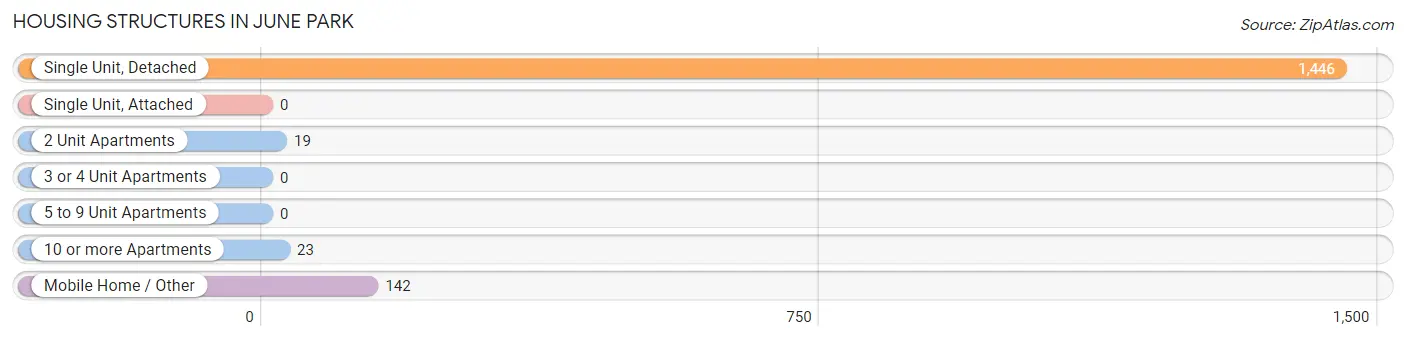
| Structure Type | # Housing Units | % Housing Units |
| Single Unit, Detached | 1,446 | 88.7% |
| Single Unit, Attached | 0 | 0.0% |
| 2 Unit Apartments | 19 | 1.2% |
| 3 or 4 Unit Apartments | 0 | 0.0% |
| 5 to 9 Unit Apartments | 0 | 0.0% |
| 10 or more Apartments | 23 | 1.4% |
| Mobile Home / Other | 142 | 8.7% |
| Total | 1,630 | 100.0% |
Housing Structures by Occupancy in June Park
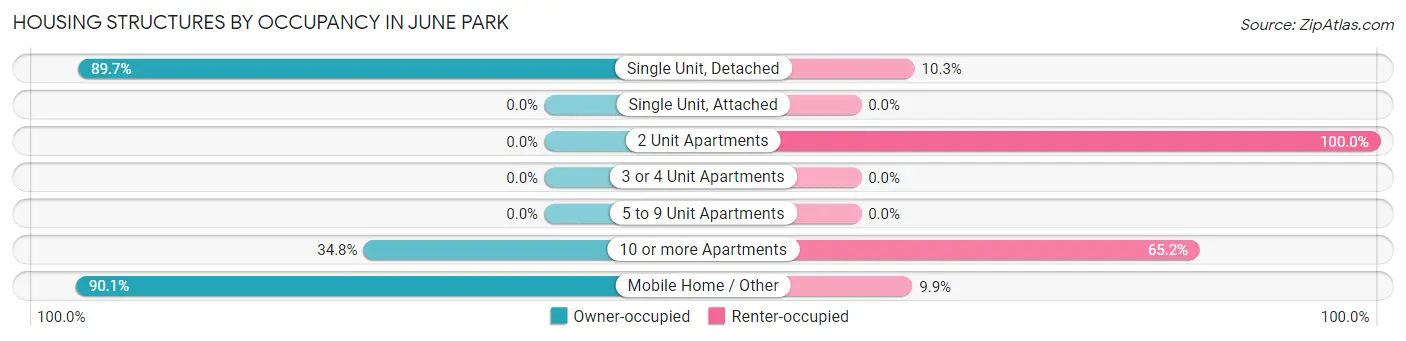
| Structure Type | Owner-occupied | Renter-occupied |
| Single Unit, Detached | 1,297 (89.7%) | 149 (10.3%) |
| Single Unit, Attached | 0 (0.0%) | 0 (0.0%) |
| 2 Unit Apartments | 0 (0.0%) | 19 (100.0%) |
| 3 or 4 Unit Apartments | 0 (0.0%) | 0 (0.0%) |
| 5 to 9 Unit Apartments | 0 (0.0%) | 0 (0.0%) |
| 10 or more Apartments | 8 (34.8%) | 15 (65.2%) |
| Mobile Home / Other | 128 (90.1%) | 14 (9.9%) |
| Total | 1,433 (87.9%) | 197 (12.1%) |
Housing Structures by Number of Rooms in June Park
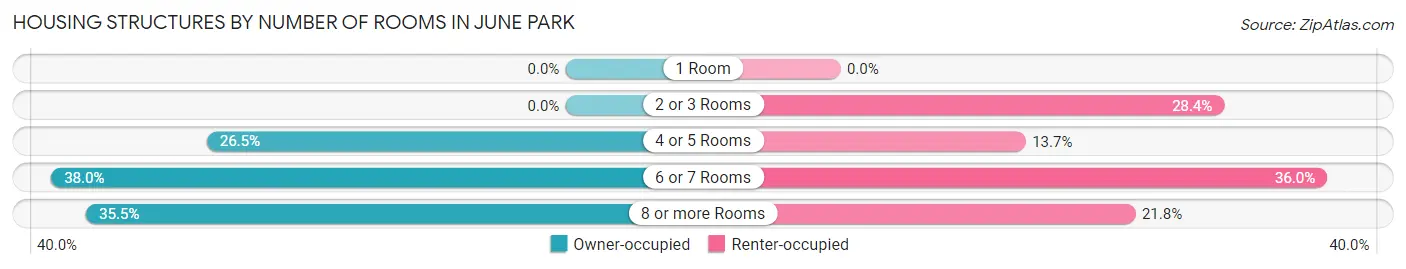
| Number of Rooms | Owner-occupied | Renter-occupied |
| 1 Room | 0 (0.0%) | 0 (0.0%) |
| 2 or 3 Rooms | 0 (0.0%) | 56 (28.4%) |
| 4 or 5 Rooms | 380 (26.5%) | 27 (13.7%) |
| 6 or 7 Rooms | 545 (38.0%) | 71 (36.0%) |
| 8 or more Rooms | 508 (35.4%) | 43 (21.8%) |
| Total | 1,433 (100.0%) | 197 (100.0%) |
Housing Structure by Heating Type in June Park
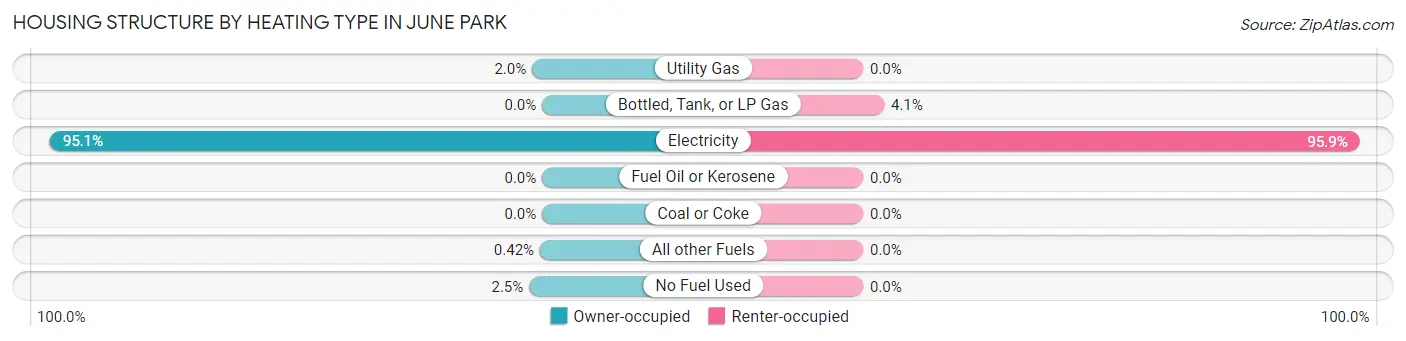
| Heating Type | Owner-occupied | Renter-occupied |
| Utility Gas | 28 (1.9%) | 0 (0.0%) |
| Bottled, Tank, or LP Gas | 0 (0.0%) | 8 (4.1%) |
| Electricity | 1,363 (95.1%) | 189 (95.9%) |
| Fuel Oil or Kerosene | 0 (0.0%) | 0 (0.0%) |
| Coal or Coke | 0 (0.0%) | 0 (0.0%) |
| All other Fuels | 6 (0.4%) | 0 (0.0%) |
| No Fuel Used | 36 (2.5%) | 0 (0.0%) |
| Total | 1,433 (100.0%) | 197 (100.0%) |
Household Vehicle Usage in June Park
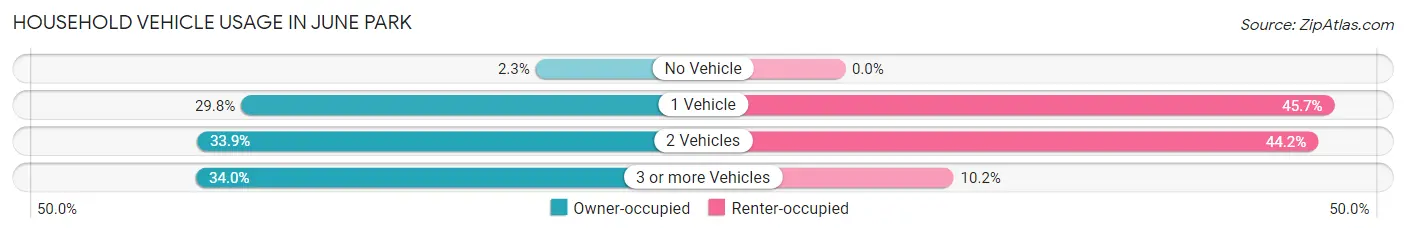
| Vehicles per Household | Owner-occupied | Renter-occupied |
| No Vehicle | 33 (2.3%) | 0 (0.0%) |
| 1 Vehicle | 427 (29.8%) | 90 (45.7%) |
| 2 Vehicles | 486 (33.9%) | 87 (44.2%) |
| 3 or more Vehicles | 487 (34.0%) | 20 (10.2%) |
| Total | 1,433 (100.0%) | 197 (100.0%) |
Real Estate & Mortgages in June Park
Real Estate and Mortgage Overview in June Park
| Characteristic | Without Mortgage | With Mortgage |
| Housing Units | 574 | 859 |
| Median Property Value | $311,700 | $322,700 |
| Median Household Income | $68,839 | $272 |
| Monthly Housing Costs | $419 | $9 |
| Real Estate Taxes | $1,861 | $32 |
Property Value by Mortgage Status in June Park
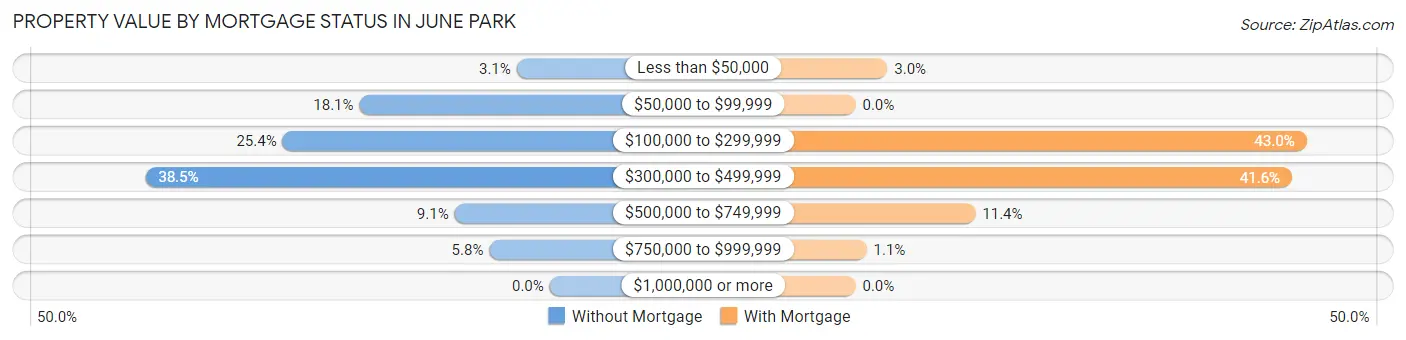
| Property Value | Without Mortgage | With Mortgage |
| Less than $50,000 | 18 (3.1%) | 26 (3.0%) |
| $50,000 to $99,999 | 104 (18.1%) | 0 (0.0%) |
| $100,000 to $299,999 | 146 (25.4%) | 369 (43.0%) |
| $300,000 to $499,999 | 221 (38.5%) | 357 (41.6%) |
| $500,000 to $749,999 | 52 (9.1%) | 98 (11.4%) |
| $750,000 to $999,999 | 33 (5.8%) | 9 (1.1%) |
| $1,000,000 or more | 0 (0.0%) | 0 (0.0%) |
| Total | 574 (100.0%) | 859 (100.0%) |
Household Income by Mortgage Status in June Park
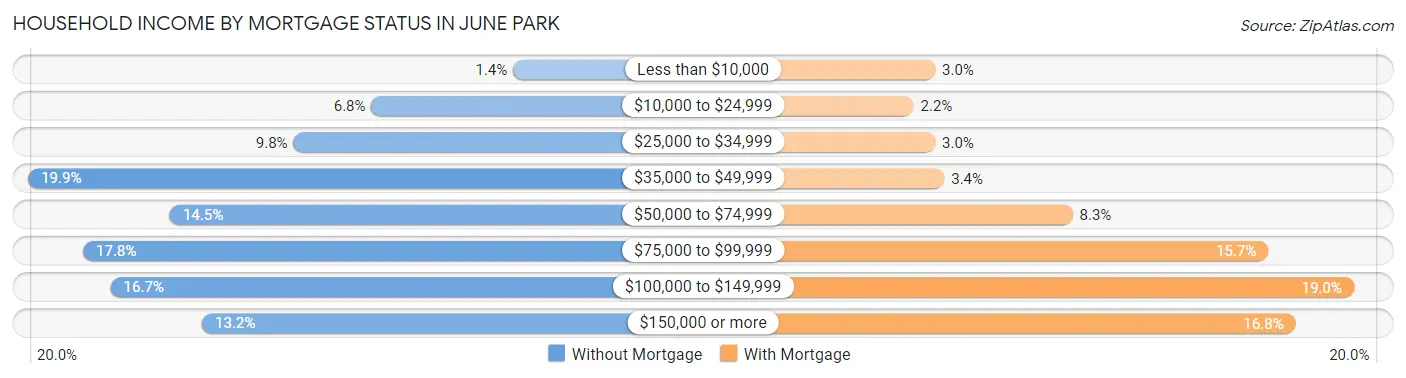
| Household Income | Without Mortgage | With Mortgage |
| Less than $10,000 | 8 (1.4%) | 26 (3.0%) |
| $10,000 to $24,999 | 39 (6.8%) | 19 (2.2%) |
| $25,000 to $34,999 | 56 (9.8%) | 26 (3.0%) |
| $35,000 to $49,999 | 114 (19.9%) | 29 (3.4%) |
| $50,000 to $74,999 | 83 (14.5%) | 71 (8.3%) |
| $75,000 to $99,999 | 102 (17.8%) | 135 (15.7%) |
| $100,000 to $149,999 | 96 (16.7%) | 163 (19.0%) |
| $150,000 or more | 76 (13.2%) | 144 (16.8%) |
| Total | 574 (100.0%) | 859 (100.0%) |
Property Value to Household Income Ratio in June Park
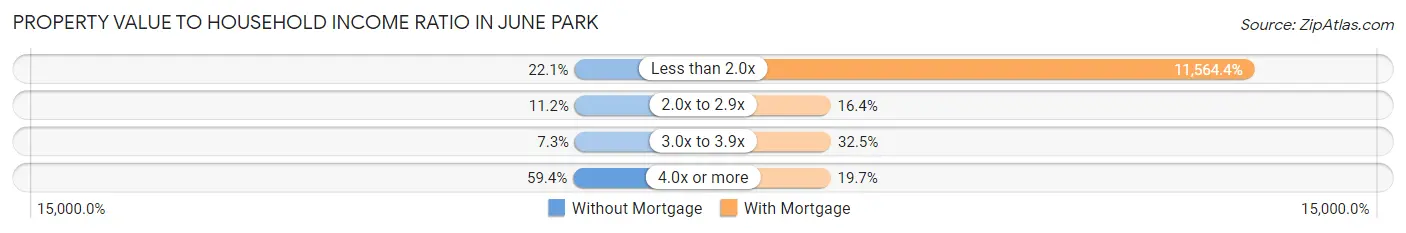
| Value-to-Income Ratio | Without Mortgage | With Mortgage |
| Less than 2.0x | 127 (22.1%) | 99,338 (11,564.4%) |
| 2.0x to 2.9x | 64 (11.2%) | 141 (16.4%) |
| 3.0x to 3.9x | 42 (7.3%) | 279 (32.5%) |
| 4.0x or more | 341 (59.4%) | 169 (19.7%) |
| Total | 574 (100.0%) | 859 (100.0%) |
Real Estate Taxes by Mortgage Status in June Park
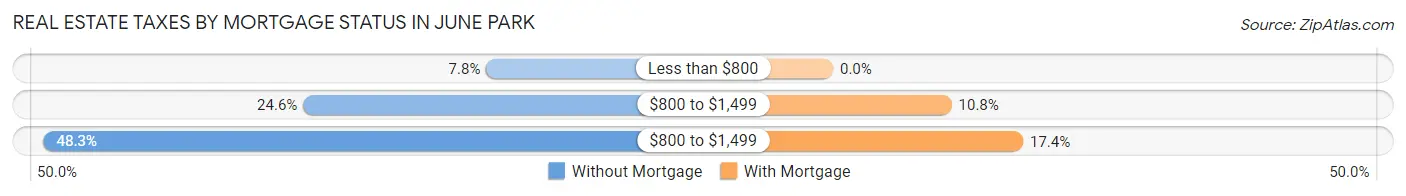
| Property Taxes | Without Mortgage | With Mortgage |
| Less than $800 | 45 (7.8%) | 0 (0.0%) |
| $800 to $1,499 | 141 (24.6%) | 93 (10.8%) |
| $800 to $1,499 | 277 (48.3%) | 149 (17.3%) |
| Total | 574 (100.0%) | 859 (100.0%) |
Health & Disability in June Park
Health Insurance Coverage by Age in June Park
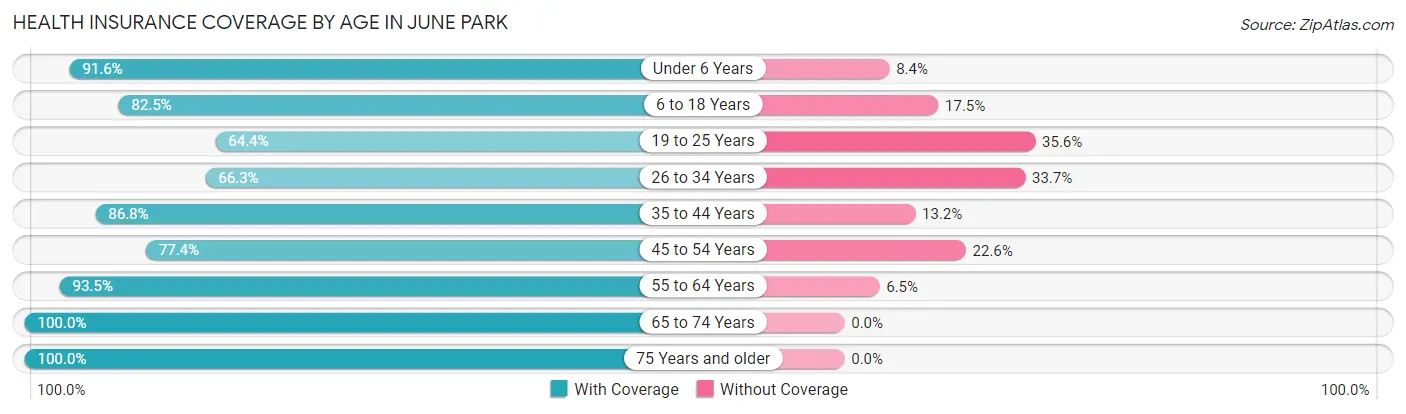
| Age Bracket | With Coverage | Without Coverage |
| Under 6 Years | 197 (91.6%) | 18 (8.4%) |
| 6 to 18 Years | 646 (82.5%) | 137 (17.5%) |
| 19 to 25 Years | 402 (64.4%) | 222 (35.6%) |
| 26 to 34 Years | 301 (66.3%) | 153 (33.7%) |
| 35 to 44 Years | 546 (86.8%) | 83 (13.2%) |
| 45 to 54 Years | 472 (77.4%) | 138 (22.6%) |
| 55 to 64 Years | 588 (93.5%) | 41 (6.5%) |
| 65 to 74 Years | 414 (100.0%) | 0 (0.0%) |
| 75 Years and older | 396 (100.0%) | 0 (0.0%) |
| Total | 3,962 (83.3%) | 792 (16.7%) |
Health Insurance Coverage by Citizenship Status in June Park
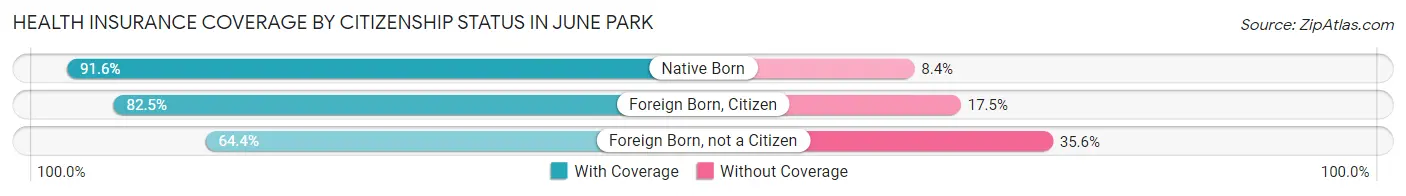
| Citizenship Status | With Coverage | Without Coverage |
| Native Born | 197 (91.6%) | 18 (8.4%) |
| Foreign Born, Citizen | 646 (82.5%) | 137 (17.5%) |
| Foreign Born, not a Citizen | 402 (64.4%) | 222 (35.6%) |
Health Insurance Coverage by Household Income in June Park
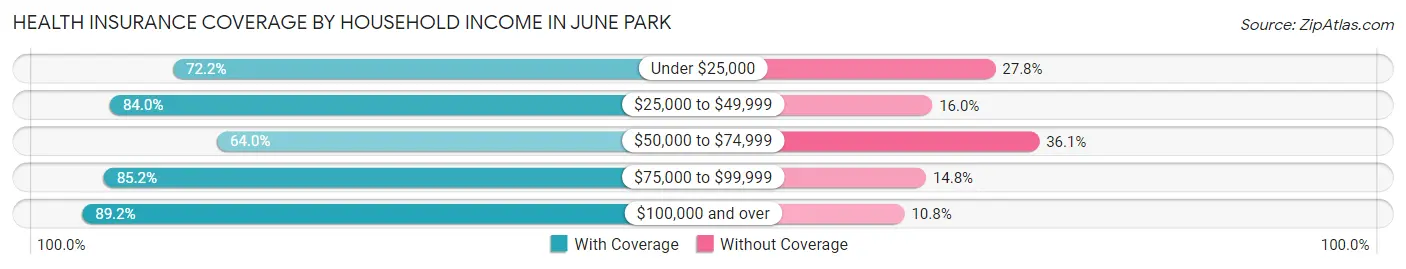
| Household Income | With Coverage | Without Coverage |
| Under $25,000 | 153 (72.2%) | 59 (27.8%) |
| $25,000 to $49,999 | 525 (84.0%) | 100 (16.0%) |
| $50,000 to $74,999 | 424 (63.9%) | 239 (36.0%) |
| $75,000 to $99,999 | 896 (85.2%) | 156 (14.8%) |
| $100,000 and over | 1,964 (89.2%) | 238 (10.8%) |
Public vs Private Health Insurance Coverage by Age in June Park
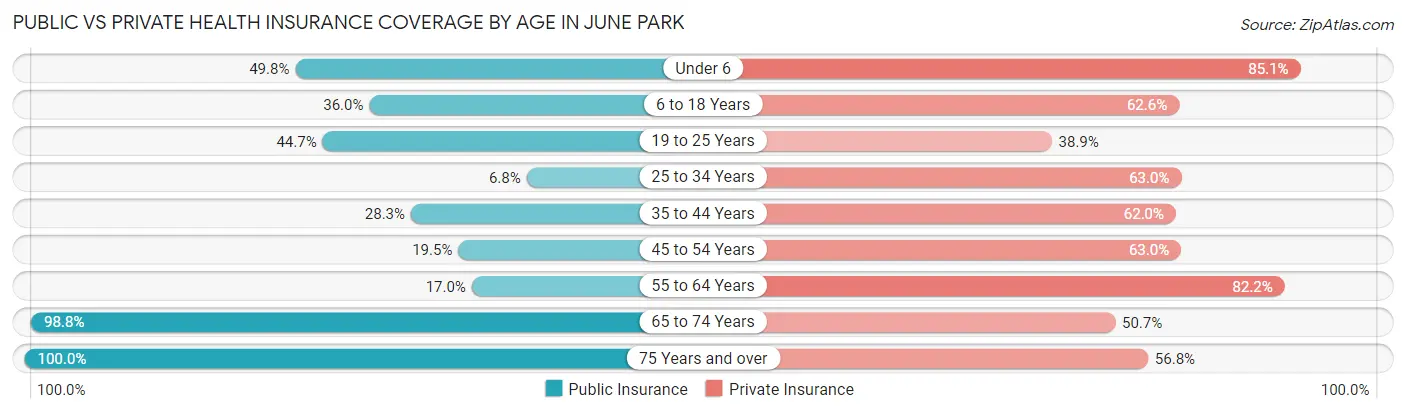
| Age Bracket | Public Insurance | Private Insurance |
| Under 6 | 107 (49.8%) | 183 (85.1%) |
| 6 to 18 Years | 282 (36.0%) | 490 (62.6%) |
| 19 to 25 Years | 279 (44.7%) | 243 (38.9%) |
| 25 to 34 Years | 31 (6.8%) | 286 (63.0%) |
| 35 to 44 Years | 178 (28.3%) | 390 (62.0%) |
| 45 to 54 Years | 119 (19.5%) | 384 (62.9%) |
| 55 to 64 Years | 107 (17.0%) | 517 (82.2%) |
| 65 to 74 Years | 409 (98.8%) | 210 (50.7%) |
| 75 Years and over | 396 (100.0%) | 225 (56.8%) |
| Total | 1,908 (40.1%) | 2,928 (61.6%) |
Disability Status by Sex by Age in June Park
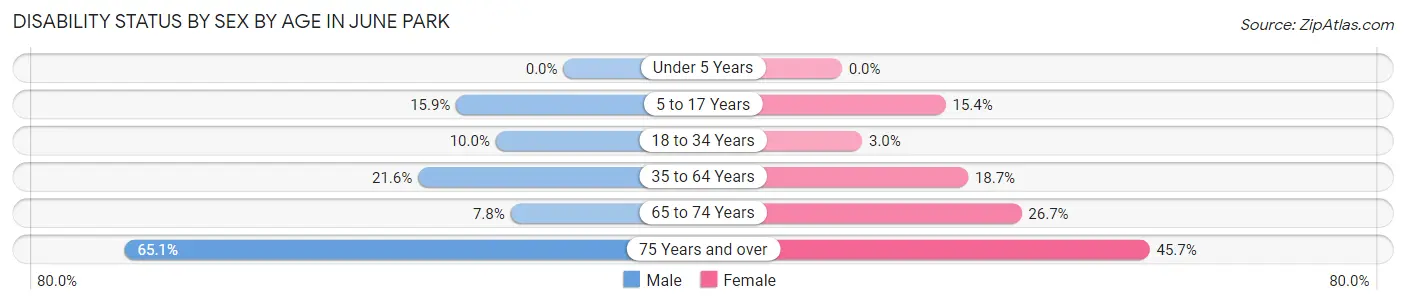
| Age Bracket | Male | Female |
| Under 5 Years | 0 (0.0%) | 0 (0.0%) |
| 5 to 17 Years | 63 (15.9%) | 45 (15.4%) |
| 18 to 34 Years | 52 (10.0%) | 20 (3.0%) |
| 35 to 64 Years | 175 (21.6%) | 198 (18.7%) |
| 65 to 74 Years | 16 (7.8%) | 56 (26.7%) |
| 75 Years and over | 114 (65.1%) | 101 (45.7%) |
Disability Class by Sex by Age in June Park
Disability Class: Hearing Difficulty
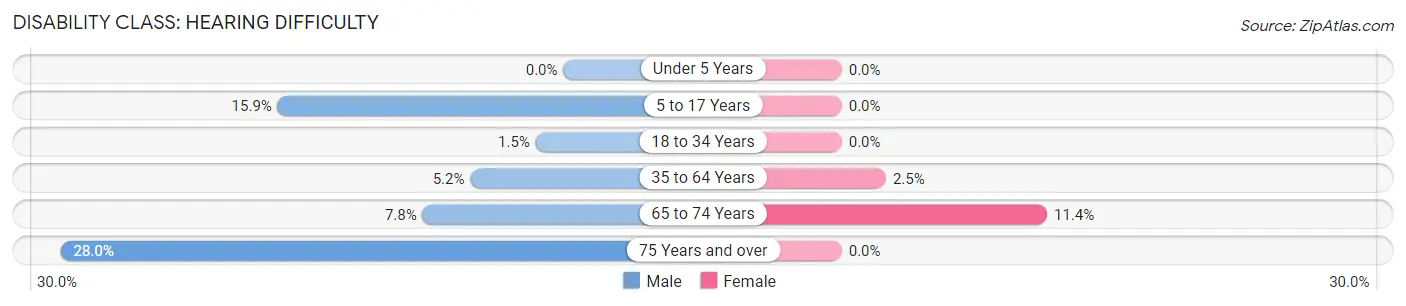
| Age Bracket | Male | Female |
| Under 5 Years | 0 (0.0%) | 0 (0.0%) |
| 5 to 17 Years | 63 (15.9%) | 0 (0.0%) |
| 18 to 34 Years | 8 (1.5%) | 0 (0.0%) |
| 35 to 64 Years | 42 (5.2%) | 26 (2.5%) |
| 65 to 74 Years | 16 (7.8%) | 24 (11.4%) |
| 75 Years and over | 49 (28.0%) | 0 (0.0%) |
Disability Class: Vision Difficulty
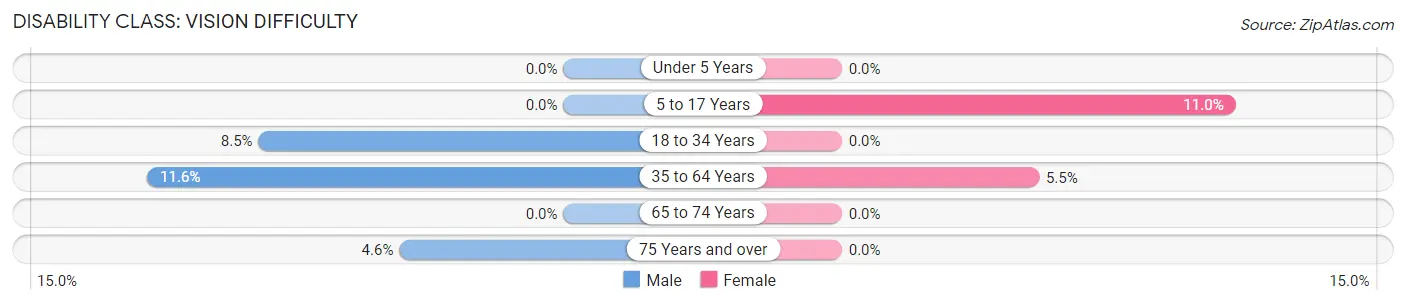
| Age Bracket | Male | Female |
| Under 5 Years | 0 (0.0%) | 0 (0.0%) |
| 5 to 17 Years | 0 (0.0%) | 32 (11.0%) |
| 18 to 34 Years | 44 (8.5%) | 0 (0.0%) |
| 35 to 64 Years | 94 (11.6%) | 58 (5.5%) |
| 65 to 74 Years | 0 (0.0%) | 0 (0.0%) |
| 75 Years and over | 8 (4.6%) | 0 (0.0%) |
Disability Class: Cognitive Difficulty
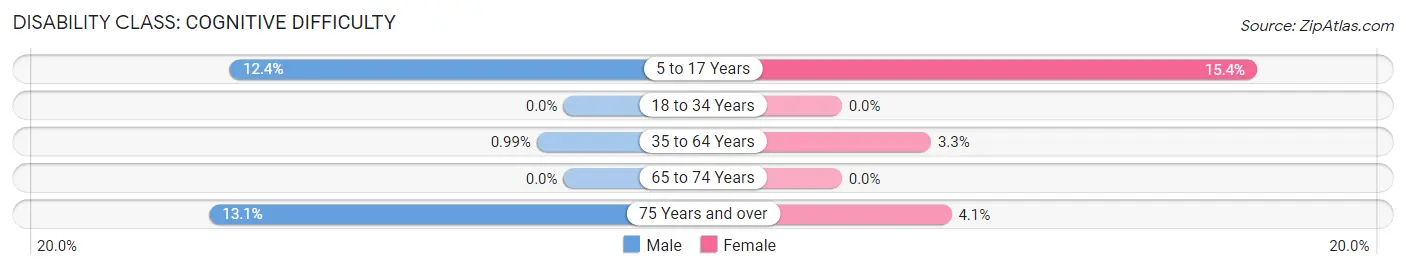
| Age Bracket | Male | Female |
| 5 to 17 Years | 49 (12.4%) | 45 (15.4%) |
| 18 to 34 Years | 0 (0.0%) | 0 (0.0%) |
| 35 to 64 Years | 8 (1.0%) | 35 (3.3%) |
| 65 to 74 Years | 0 (0.0%) | 0 (0.0%) |
| 75 Years and over | 23 (13.1%) | 9 (4.1%) |
Disability Class: Ambulatory Difficulty
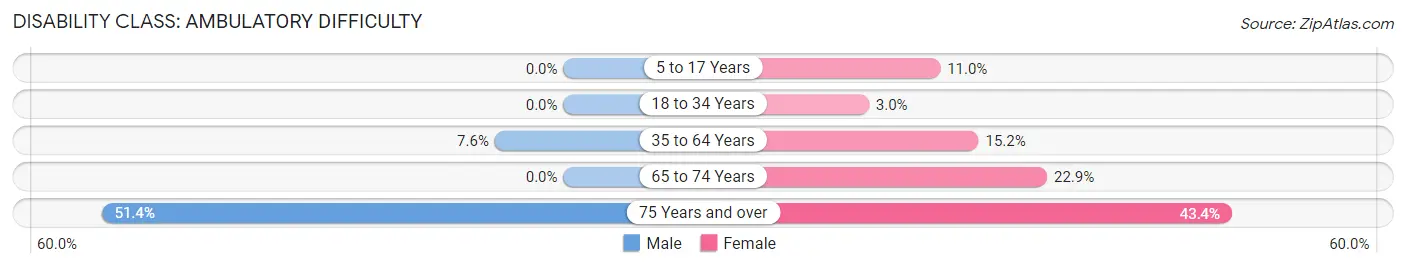
| Age Bracket | Male | Female |
| 5 to 17 Years | 0 (0.0%) | 32 (11.0%) |
| 18 to 34 Years | 0 (0.0%) | 20 (3.0%) |
| 35 to 64 Years | 62 (7.6%) | 161 (15.2%) |
| 65 to 74 Years | 0 (0.0%) | 48 (22.9%) |
| 75 Years and over | 90 (51.4%) | 96 (43.4%) |
Disability Class: Self-Care Difficulty
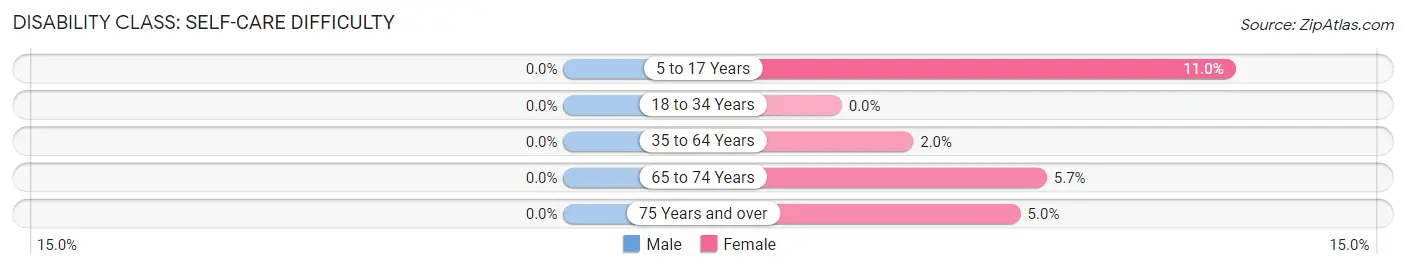
| Age Bracket | Male | Female |
| 5 to 17 Years | 0 (0.0%) | 32 (11.0%) |
| 18 to 34 Years | 0 (0.0%) | 0 (0.0%) |
| 35 to 64 Years | 0 (0.0%) | 21 (2.0%) |
| 65 to 74 Years | 0 (0.0%) | 12 (5.7%) |
| 75 Years and over | 0 (0.0%) | 11 (5.0%) |
Technology Access in June Park
Computing Device Access in June Park
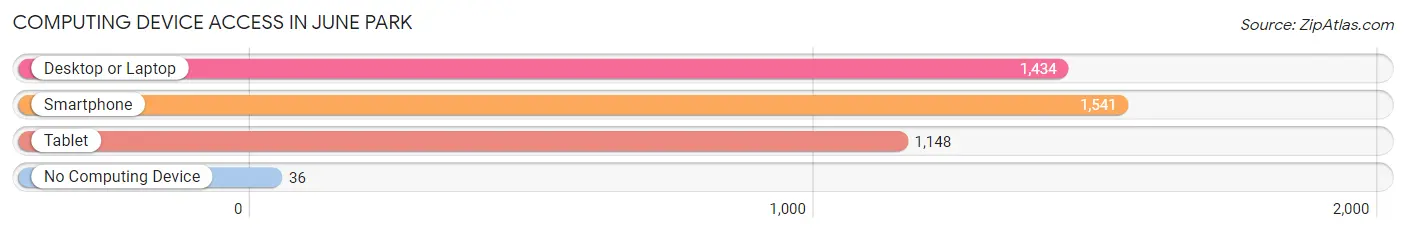
| Device Type | # Households | % Households |
| Desktop or Laptop | 1,434 | 88.0% |
| Smartphone | 1,541 | 94.5% |
| Tablet | 1,148 | 70.4% |
| No Computing Device | 36 | 2.2% |
| Total | 1,630 | 100.0% |
Internet Access in June Park
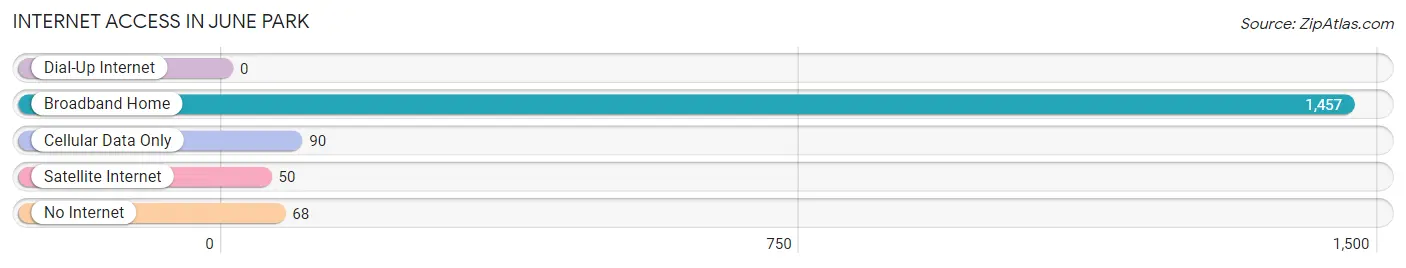
| Internet Type | # Households | % Households |
| Dial-Up Internet | 0 | 0.0% |
| Broadband Home | 1,457 | 89.4% |
| Cellular Data Only | 90 | 5.5% |
| Satellite Internet | 50 | 3.1% |
| No Internet | 68 | 4.2% |
| Total | 1,630 | 100.0% |
June Park Summary
June Park is a census-designated place located in Orange County, Florida. It is part of the Orlando-Kissimmee-Sanford Metropolitan Statistical Area. As of the 2010 census, the population of June Park was 8,945.
History
June Park was originally part of the Seminole Indian Reservation, which was established in 1842. The area was later developed as a citrus grove and was known as the June Park Groves. The groves were owned by the June family, who were among the first settlers in the area. In the early 1900s, the groves were sold to the Florida Land and Mortgage Company, which developed the area into a residential community. The community was named after the June family and was officially incorporated in 1925.
Geography
June Park is located in central Florida, approximately 20 miles north of Orlando. It is situated in Orange County, just south of the Seminole County line. The area is bordered by the cities of Winter Park to the north, Maitland to the east, and Altamonte Springs to the south. The total area of June Park is 4.3 square miles, of which 0.1 square miles is water.
Economy
June Park is primarily a residential community, with most of its residents employed in the nearby cities of Orlando and Maitland. The area is home to several small businesses, including restaurants, retail stores, and professional services. The largest employer in the area is the Orange County Public Schools, which employs over 1,000 people.
Demographics
As of the 2010 census, the population of June Park was 8,945. The racial makeup of the area was 79.3% White, 11.2% African American, 4.2% Hispanic or Latino, and 5.3% other. The median household income was $50,945, and the median age was 37.
Conclusion
June Park is a small residential community located in Orange County, Florida. It is part of the Orlando-Kissimmee-Sanford Metropolitan Statistical Area and is home to 8,945 people. The area is primarily residential, with most of its residents employed in nearby cities. The largest employer in the area is the Orange County Public Schools.
Common Questions
What is Per Capita Income in June Park?
Per Capita income in June Park is $37,254.
What is the Median Family Income in June Park?
Median Family Income in June Park is $98,190.
What is the Median Household income in June Park?
Median Household Income in June Park is $78,675.
What is Income or Wage Gap in June Park?
Income or Wage Gap in June Park is 47.2%.
Women in June Park earn 52.8 cents for every dollar earned by a man.
What is Inequality or Gini Index in June Park?
Inequality or Gini Index in June Park is 0.40.
What is the Total Population of June Park?
Total Population of June Park is 4,757.
What is the Total Male Population of June Park?
Total Male Population of June Park is 2,268.
What is the Total Female Population of June Park?
Total Female Population of June Park is 2,489.
What is the Ratio of Males per 100 Females in June Park?
There are 91.12 Males per 100 Females in June Park.
What is the Ratio of Females per 100 Males in June Park?
There are 109.74 Females per 100 Males in June Park.
What is the Median Population Age in June Park?
Median Population Age in June Park is 41.1 Years.
What is the Average Family Size in June Park
Average Family Size in June Park is 3.4 People.
What is the Average Household Size in June Park
Average Household Size in June Park is 2.9 People.
How Large is the Labor Force in June Park?
There are 2,729 People in the Labor Forcein in June Park.
What is the Percentage of People in the Labor Force in June Park?
67.7% of People are in the Labor Force in June Park.
What is the Unemployment Rate in June Park?
Unemployment Rate in June Park is 2.8%.