Stonewall Gap, CO Map & Demographics
Stonewall Gap Map
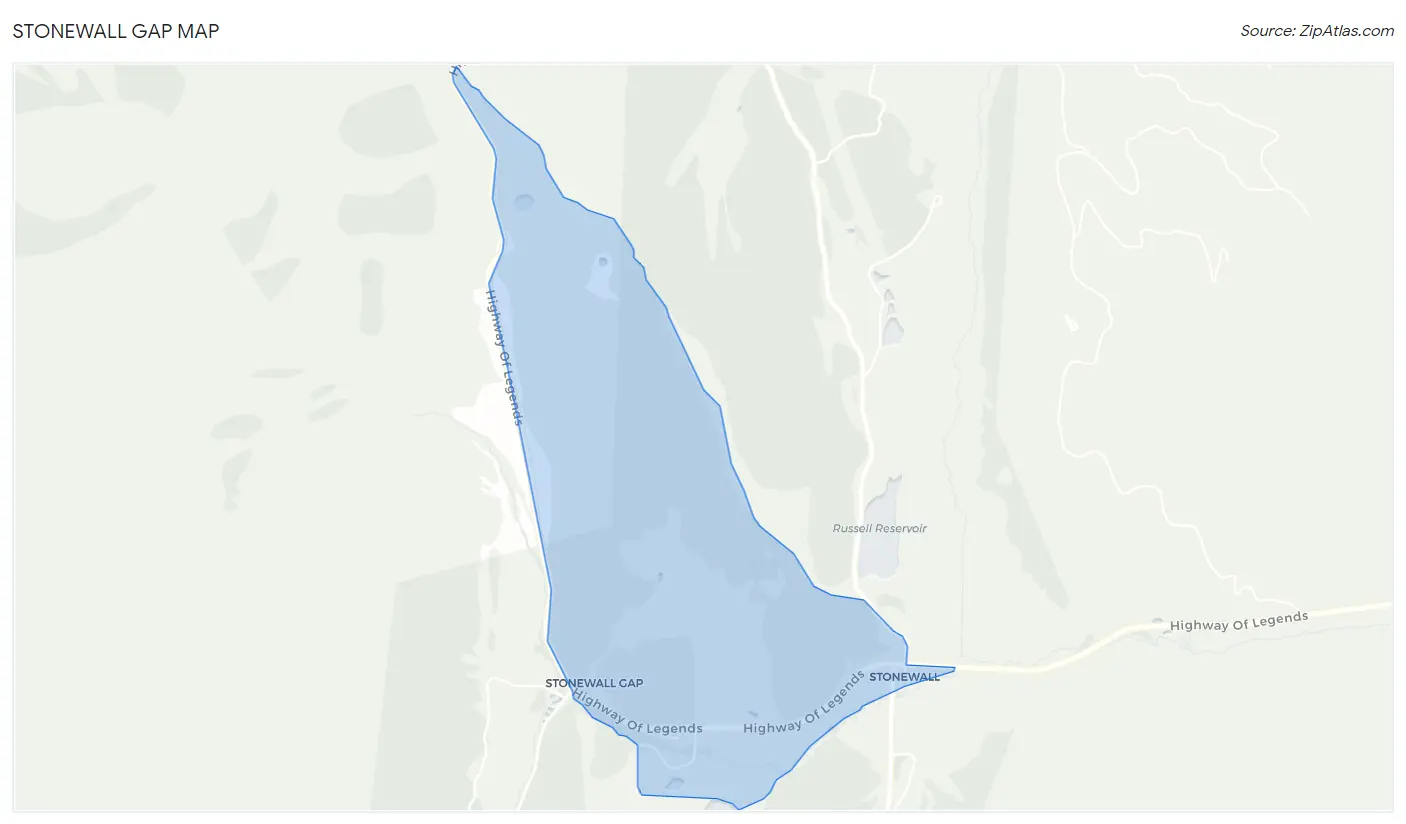
Stonewall Gap Overview
$21,169
PER CAPITA INCOME
0.31
INEQUALITY / GINI INDEX
95
TOTAL POPULATION
36
MALE POPULATION
59
FEMALE POPULATION
61.02
MALES / 100 FEMALES
163.89
FEMALES / 100 MALES
72.4
MEDIAN AGE
2.0
AVG FAMILY SIZE
1.7
AVG HOUSEHOLD SIZE
12
LABOR FORCE [ PEOPLE ]
12.6%
PERCENT IN LABOR FORCE
8.3%
UNEMPLOYMENT RATE
Income in Stonewall Gap
Income Overview in Stonewall Gap
| Characteristic | Number | Measure |
| Per Capita Income | 95 | $21,169 |
| Median Family Income | 38 | $0 |
| Mean Family Income | 38 | $39,182 |
| Median Household Income | 55 | $0 |
| Mean Household Income | 55 | $36,922 |
| Income Deficit | 38 | $0 |
| Wage / Income Gap (%) | 95 | 0.00% |
| Wage / Income Gap ($) | 95 | 100.00¢ per $1 |
| Gini / Inequality Index | 95 | 0.31 |
Earnings by Sex in Stonewall Gap
| Sex | Number | Average Earnings |
| Male | 4 (36.4%) | $0 |
| Female | 7 (63.6%) | $0 |
| Total | 11 (100.0%) | $0 |
Earnings by Sex by Income Bracket in Stonewall Gap
The most common earnings brackets in Stonewall Gap are $7,500 to $9,999 for men (4 | 100.0%) and $55,000 to $64,999 for women (7 | 100.0%).
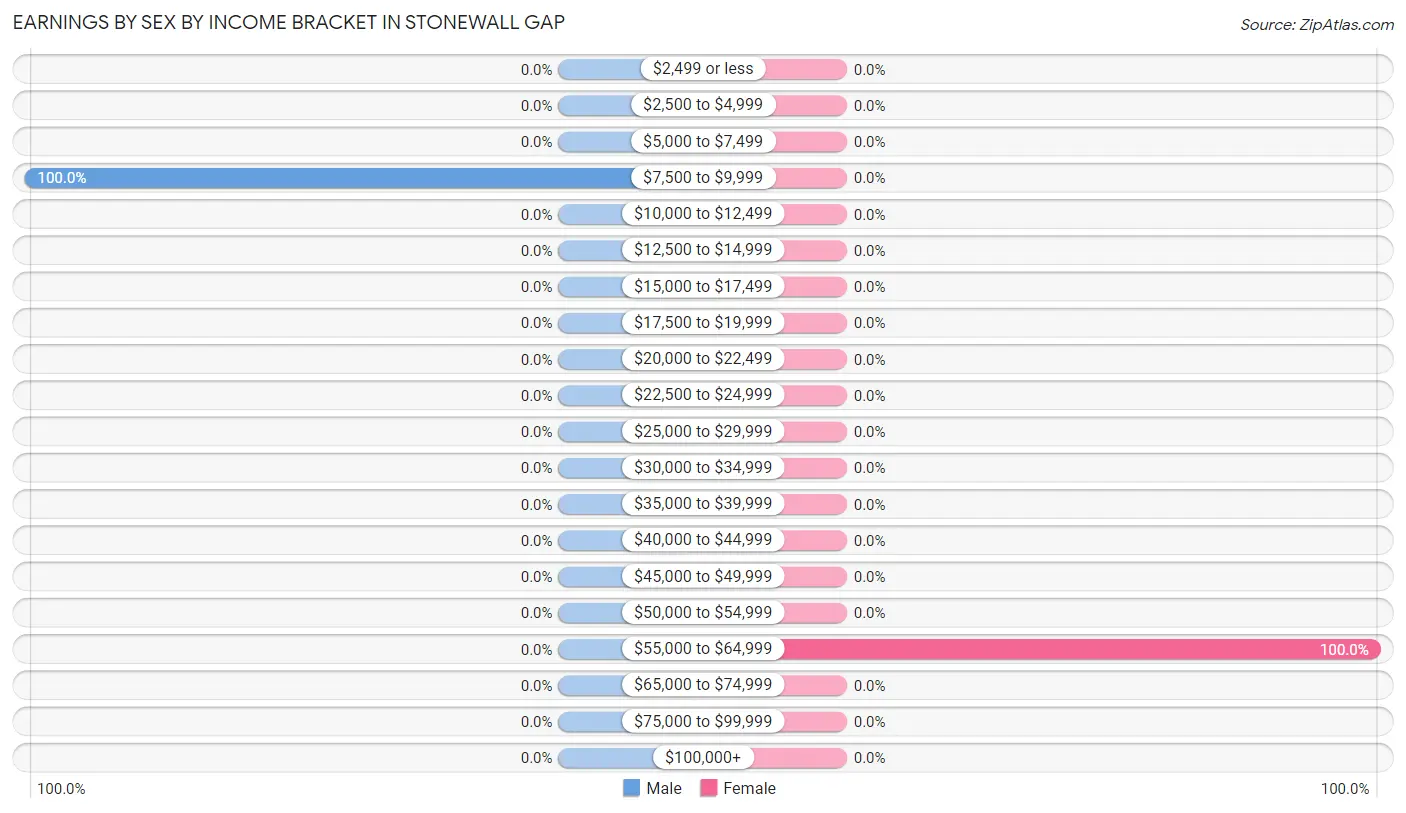
| Income | Male | Female |
| $2,499 or less | 0 (0.0%) | 0 (0.0%) |
| $2,500 to $4,999 | 0 (0.0%) | 0 (0.0%) |
| $5,000 to $7,499 | 0 (0.0%) | 0 (0.0%) |
| $7,500 to $9,999 | 4 (100.0%) | 0 (0.0%) |
| $10,000 to $12,499 | 0 (0.0%) | 0 (0.0%) |
| $12,500 to $14,999 | 0 (0.0%) | 0 (0.0%) |
| $15,000 to $17,499 | 0 (0.0%) | 0 (0.0%) |
| $17,500 to $19,999 | 0 (0.0%) | 0 (0.0%) |
| $20,000 to $22,499 | 0 (0.0%) | 0 (0.0%) |
| $22,500 to $24,999 | 0 (0.0%) | 0 (0.0%) |
| $25,000 to $29,999 | 0 (0.0%) | 0 (0.0%) |
| $30,000 to $34,999 | 0 (0.0%) | 0 (0.0%) |
| $35,000 to $39,999 | 0 (0.0%) | 0 (0.0%) |
| $40,000 to $44,999 | 0 (0.0%) | 0 (0.0%) |
| $45,000 to $49,999 | 0 (0.0%) | 0 (0.0%) |
| $50,000 to $54,999 | 0 (0.0%) | 0 (0.0%) |
| $55,000 to $64,999 | 0 (0.0%) | 7 (100.0%) |
| $65,000 to $74,999 | 0 (0.0%) | 0 (0.0%) |
| $75,000 to $99,999 | 0 (0.0%) | 0 (0.0%) |
| $100,000+ | 0 (0.0%) | 0 (0.0%) |
| Total | 4 (100.0%) | 7 (100.0%) |
Earnings by Sex by Educational Attainment in Stonewall Gap
| Educational Attainment | Male Income | Female Income |
| Less than High School | - | - |
| High School Diploma | - | - |
| College or Associate's Degree | - | - |
| Bachelor's Degree | - | - |
| Graduate Degree | - | - |
| Total | - | - |
Family Income in Stonewall Gap
Family Income Brackets in Stonewall Gap
According to the Stonewall Gap family income data, there are 16 families falling into the $15,000 to $24,999 income range, which is the most common income bracket and makes up 42.1% of all families.
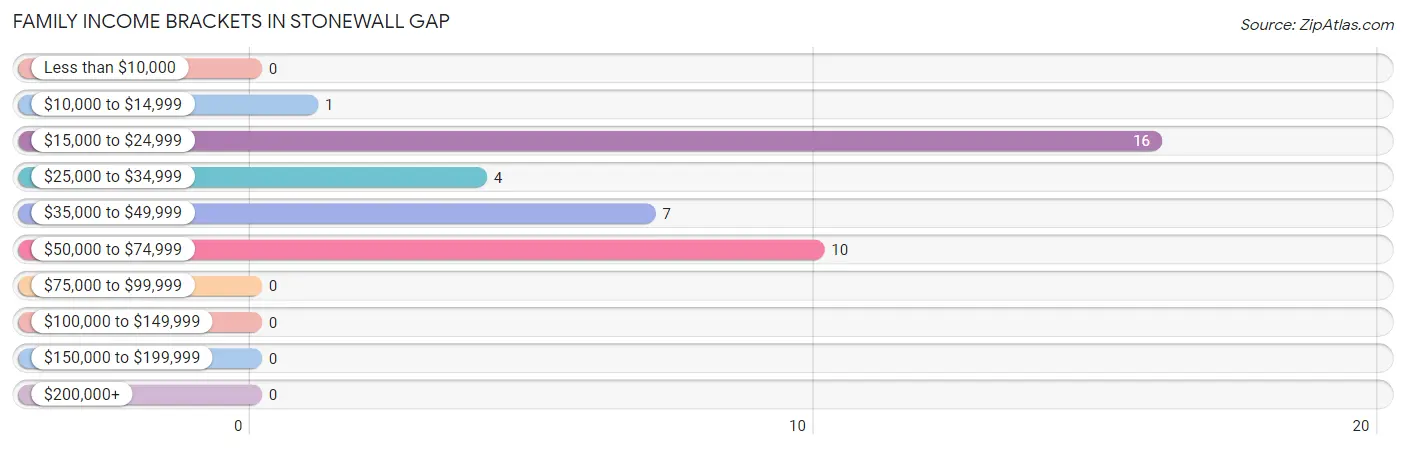
| Income Bracket | # Families | % Families |
| Less than $10,000 | 0 | 0.0% |
| $10,000 to $14,999 | 1 | 2.6% |
| $15,000 to $24,999 | 16 | 42.1% |
| $25,000 to $34,999 | 4 | 10.5% |
| $35,000 to $49,999 | 7 | 18.4% |
| $50,000 to $74,999 | 10 | 26.3% |
| $75,000 to $99,999 | 0 | 0.0% |
| $100,000 to $149,999 | 0 | 0.0% |
| $150,000 to $199,999 | 0 | 0.0% |
| $200,000+ | 0 | 0.0% |
Family Income by Famaliy Size in Stonewall Gap
| Income Bracket | # Families | Median Income |
| 2-Person Families | 34 (89.5%) | $0 |
| 3-Person Families | 4 (10.5%) | $0 |
| 4-Person Families | 0 (0.0%) | $0 |
| 5-Person Families | 0 (0.0%) | $0 |
| 6-Person Families | 0 (0.0%) | $0 |
| 7+ Person Families | 0 (0.0%) | $0 |
| Total | 38 (100.0%) | $0 |
Family Income by Number of Earners in Stonewall Gap
| Number of Earners | # Families | Median Income |
| No Earners | 34 (89.5%) | $0 |
| 1 Earner | 4 (10.5%) | $0 |
| 2 Earners | 0 (0.0%) | $0 |
| 3+ Earners | 0 (0.0%) | $0 |
| Total | 38 (100.0%) | $0 |
Household Income in Stonewall Gap
Household Income Brackets in Stonewall Gap
With 17 households falling in the category, the $50,000 to $74,999 income range is the most frequent in Stonewall Gap, accounting for 30.9% of all households.
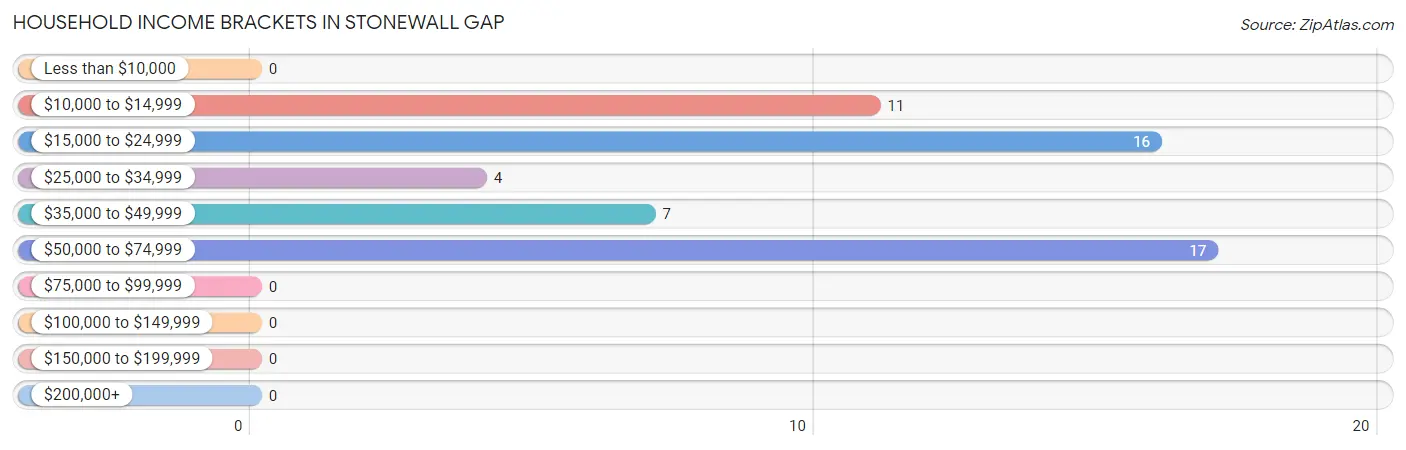
| Income Bracket | # Households | % Households |
| Less than $10,000 | 0 | 0.0% |
| $10,000 to $14,999 | 11 | 20.0% |
| $15,000 to $24,999 | 16 | 29.1% |
| $25,000 to $34,999 | 4 | 7.3% |
| $35,000 to $49,999 | 7 | 12.7% |
| $50,000 to $74,999 | 17 | 30.9% |
| $75,000 to $99,999 | 0 | 0.0% |
| $100,000 to $149,999 | 0 | 0.0% |
| $150,000 to $199,999 | 0 | 0.0% |
| $200,000+ | 0 | 0.0% |
Household Income by Householder Age in Stonewall Gap
| Income Bracket | # Households | Median Income |
| 15 to 24 Years | 0 (0.0%) | $0 |
| 25 to 44 Years | 0 (0.0%) | $0 |
| 45 to 64 Years | 0 (0.0%) | $0 |
| 65+ Years | 55 (100.0%) | $0 |
| Total | 55 (100.0%) | $0 |
Poverty in Stonewall Gap
Income Below Poverty by Sex and Age in Stonewall Gap
With 2.8% poverty level for males and 18.6% for females among the residents of Stonewall Gap, 25 to 34 year old males and 65 to 74 year old females are the most vulnerable to poverty, with 1 males (100.0%) and 11 females (28.9%) in their respective age groups living below the poverty level.
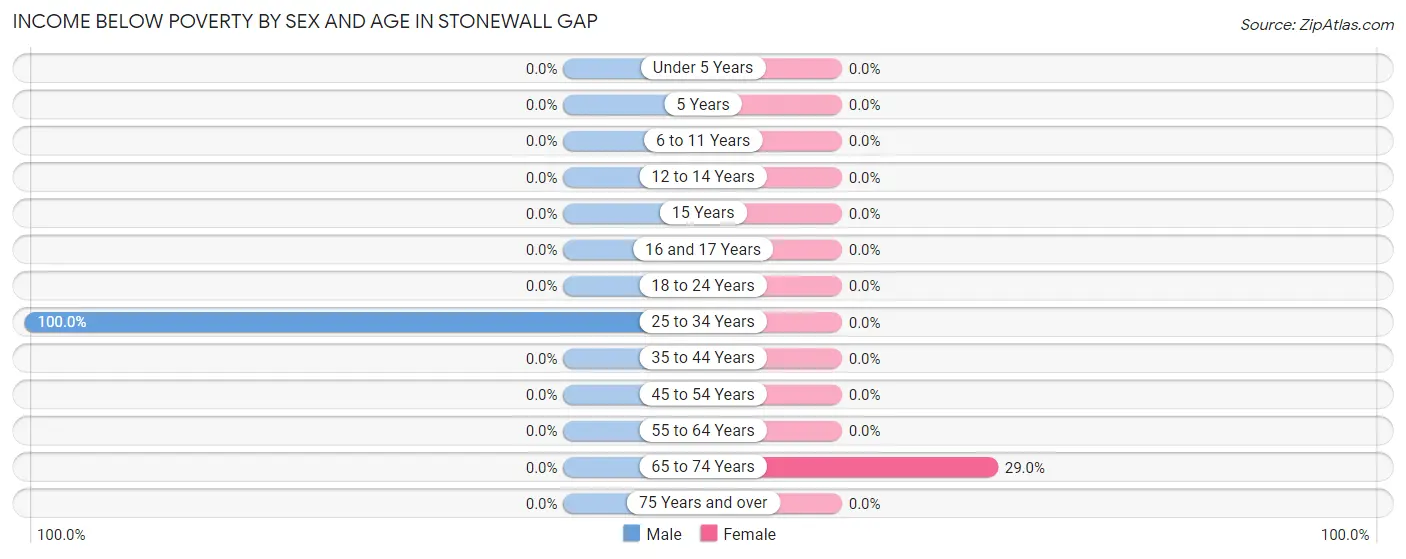
| Age Bracket | Male | Female |
| Under 5 Years | 0 (0.0%) | 0 (0.0%) |
| 5 Years | 0 (0.0%) | 0 (0.0%) |
| 6 to 11 Years | 0 (0.0%) | 0 (0.0%) |
| 12 to 14 Years | 0 (0.0%) | 0 (0.0%) |
| 15 Years | 0 (0.0%) | 0 (0.0%) |
| 16 and 17 Years | 0 (0.0%) | 0 (0.0%) |
| 18 to 24 Years | 0 (0.0%) | 0 (0.0%) |
| 25 to 34 Years | 1 (100.0%) | 0 (0.0%) |
| 35 to 44 Years | 0 (0.0%) | 0 (0.0%) |
| 45 to 54 Years | 0 (0.0%) | 0 (0.0%) |
| 55 to 64 Years | 0 (0.0%) | 0 (0.0%) |
| 65 to 74 Years | 0 (0.0%) | 11 (28.9%) |
| 75 Years and over | 0 (0.0%) | 0 (0.0%) |
| Total | 1 (2.8%) | 11 (18.6%) |
Income Above Poverty by Sex and Age in Stonewall Gap
According to the poverty statistics in Stonewall Gap, males aged 35 to 44 years and females aged 55 to 64 years are the age groups that are most secure financially, with 100.0% of males and 100.0% of females in these age groups living above the poverty line.
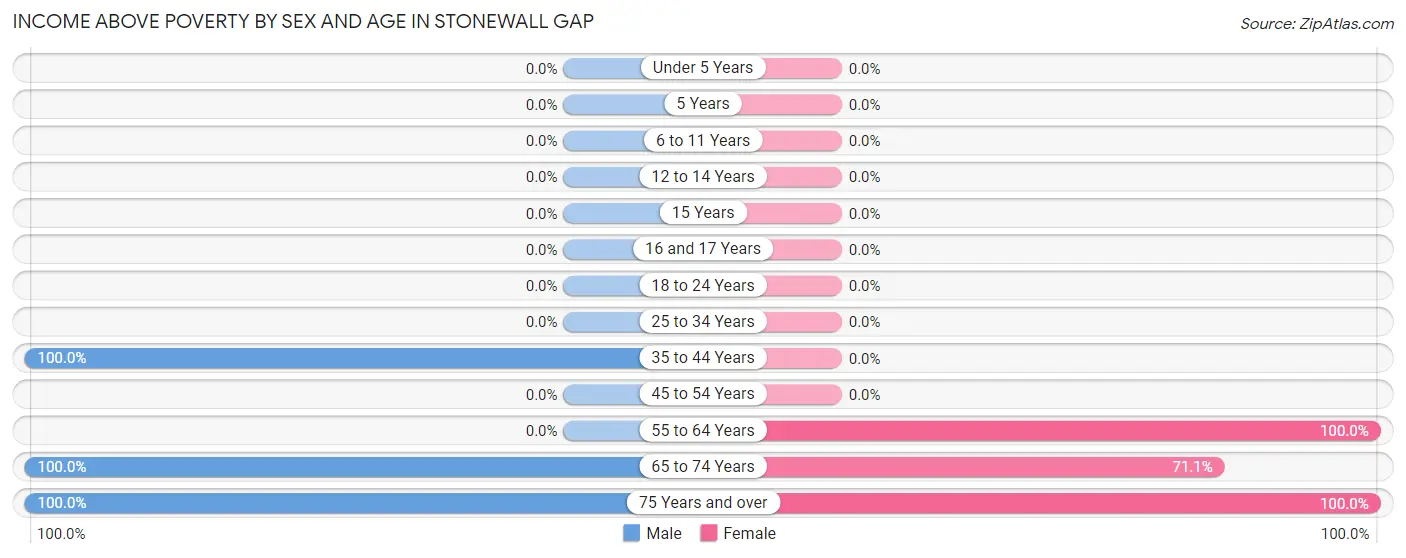
| Age Bracket | Male | Female |
| Under 5 Years | 0 (0.0%) | 0 (0.0%) |
| 5 Years | 0 (0.0%) | 0 (0.0%) |
| 6 to 11 Years | 0 (0.0%) | 0 (0.0%) |
| 12 to 14 Years | 0 (0.0%) | 0 (0.0%) |
| 15 Years | 0 (0.0%) | 0 (0.0%) |
| 16 and 17 Years | 0 (0.0%) | 0 (0.0%) |
| 18 to 24 Years | 0 (0.0%) | 0 (0.0%) |
| 25 to 34 Years | 0 (0.0%) | 0 (0.0%) |
| 35 to 44 Years | 3 (100.0%) | 0 (0.0%) |
| 45 to 54 Years | 0 (0.0%) | 0 (0.0%) |
| 55 to 64 Years | 0 (0.0%) | 6 (100.0%) |
| 65 to 74 Years | 26 (100.0%) | 27 (71.1%) |
| 75 Years and over | 6 (100.0%) | 15 (100.0%) |
| Total | 35 (97.2%) | 48 (81.4%) |
Income Below Poverty Among Married-Couple Families in Stonewall Gap
| Children | Above Poverty | Below Poverty |
| No Children | 30 (100.0%) | 0 (0.0%) |
| 1 or 2 Children | 0 (0.0%) | 0 (0.0%) |
| 3 or 4 Children | 0 (0.0%) | 0 (0.0%) |
| 5 or more Children | 0 (0.0%) | 0 (0.0%) |
| Total | 30 (100.0%) | 0 (0.0%) |
Income Below Poverty Among Single-Parent Households in Stonewall Gap
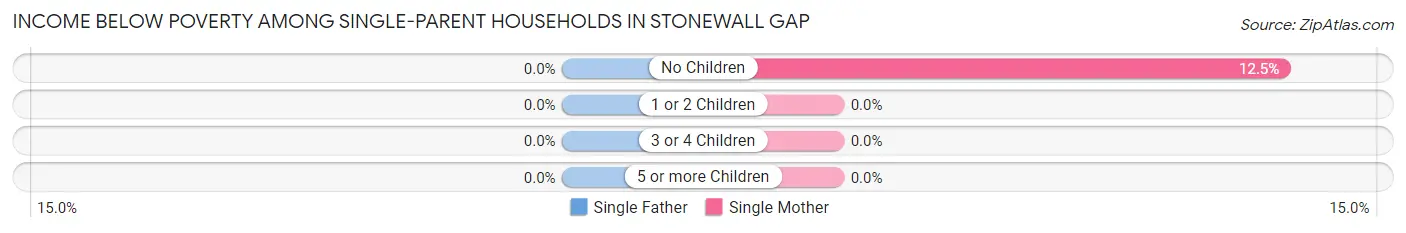
| Children | Single Father | Single Mother |
| No Children | 0 (0.0%) | 1 (12.5%) |
| 1 or 2 Children | 0 (0.0%) | 0 (0.0%) |
| 3 or 4 Children | 0 (0.0%) | 0 (0.0%) |
| 5 or more Children | 0 (0.0%) | 0 (0.0%) |
| Total | 0 (0.0%) | 1 (12.5%) |
Income Below Poverty Among Married-Couple vs Single-Parent Households in Stonewall Gap
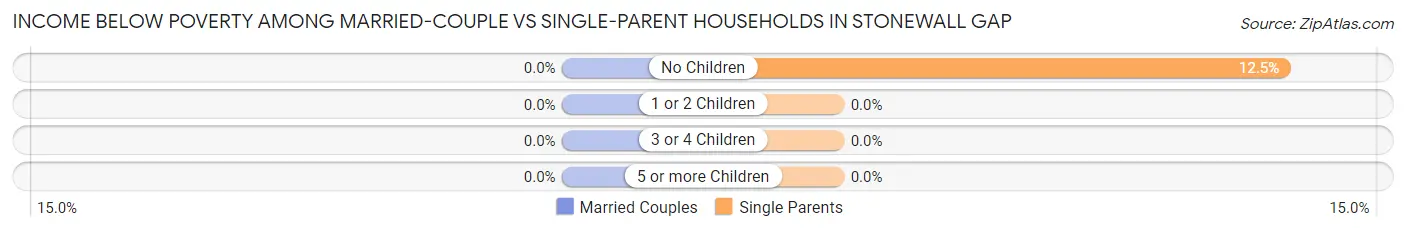
| Children | Married-Couple Families | Single-Parent Households |
| No Children | 0 (0.0%) | 1 (12.5%) |
| 1 or 2 Children | 0 (0.0%) | 0 (0.0%) |
| 3 or 4 Children | 0 (0.0%) | 0 (0.0%) |
| 5 or more Children | 0 (0.0%) | 0 (0.0%) |
| Total | 0 (0.0%) | 1 (12.5%) |
Race in Stonewall Gap
The most populous races in Stonewall Gap are White / Caucasian (91 | 95.8%), Hispanic or Latino (6 | 6.3%), and Two or more Races (3 | 3.2%).
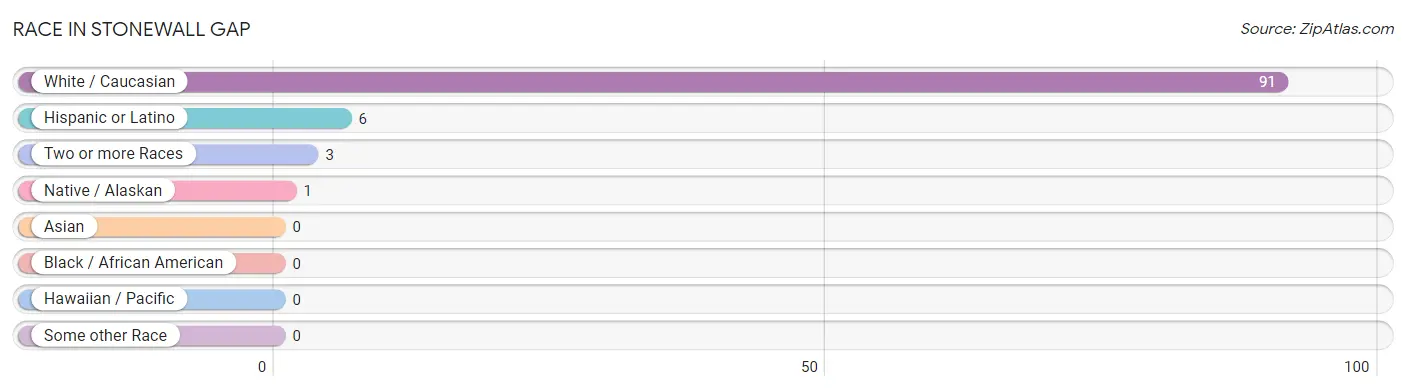
| Race | # Population | % Population |
| Asian | 0 | 0.0% |
| Black / African American | 0 | 0.0% |
| Hawaiian / Pacific | 0 | 0.0% |
| Hispanic or Latino | 6 | 6.3% |
| Native / Alaskan | 1 | 1.1% |
| White / Caucasian | 91 | 95.8% |
| Two or more Races | 3 | 3.2% |
| Some other Race | 0 | 0.0% |
| Total | 95 | 100.0% |
Ancestry in Stonewall Gap
The most populous ancestries reported in Stonewall Gap are English (39 | 41.0%), American (18 | 19.0%), Irish (16 | 16.8%), Italian (14 | 14.7%), and Dutch (10 | 10.5%), together accounting for 102.1% of all Stonewall Gap residents.
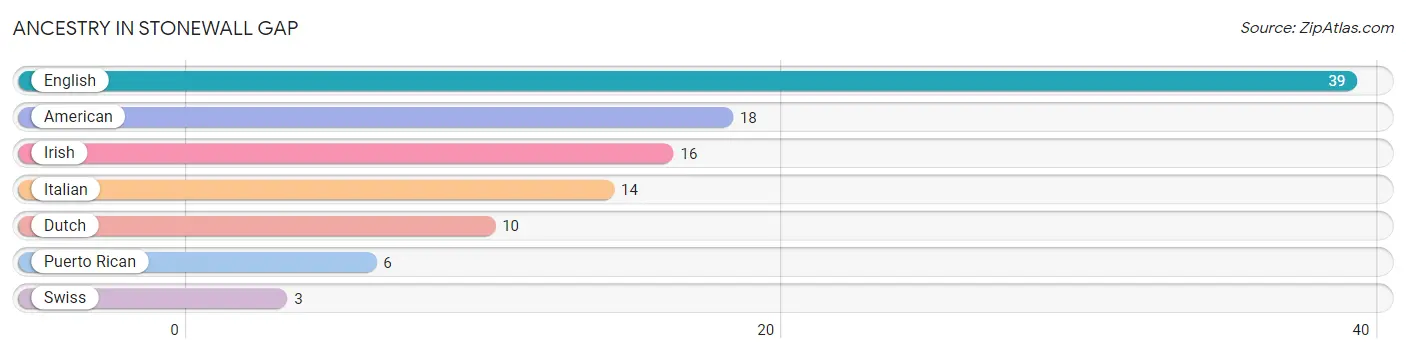
| Ancestry | # Population | % Population |
| American | 18 | 19.0% |
| Dutch | 10 | 10.5% |
| English | 39 | 41.0% |
| Irish | 16 | 16.8% |
| Italian | 14 | 14.7% |
| Puerto Rican | 6 | 6.3% |
| Swiss | 3 | 3.2% | View All 7 Rows |
Immigrants in Stonewall Gap

| Immigration Origin | # Population | % Population | View All 0 Rows |
Sex and Age in Stonewall Gap
Sex and Age in Stonewall Gap
The most populous age groups in Stonewall Gap are 70 to 74 Years (22 | 61.1%) for men and 65 to 69 Years (22 | 37.3%) for women.
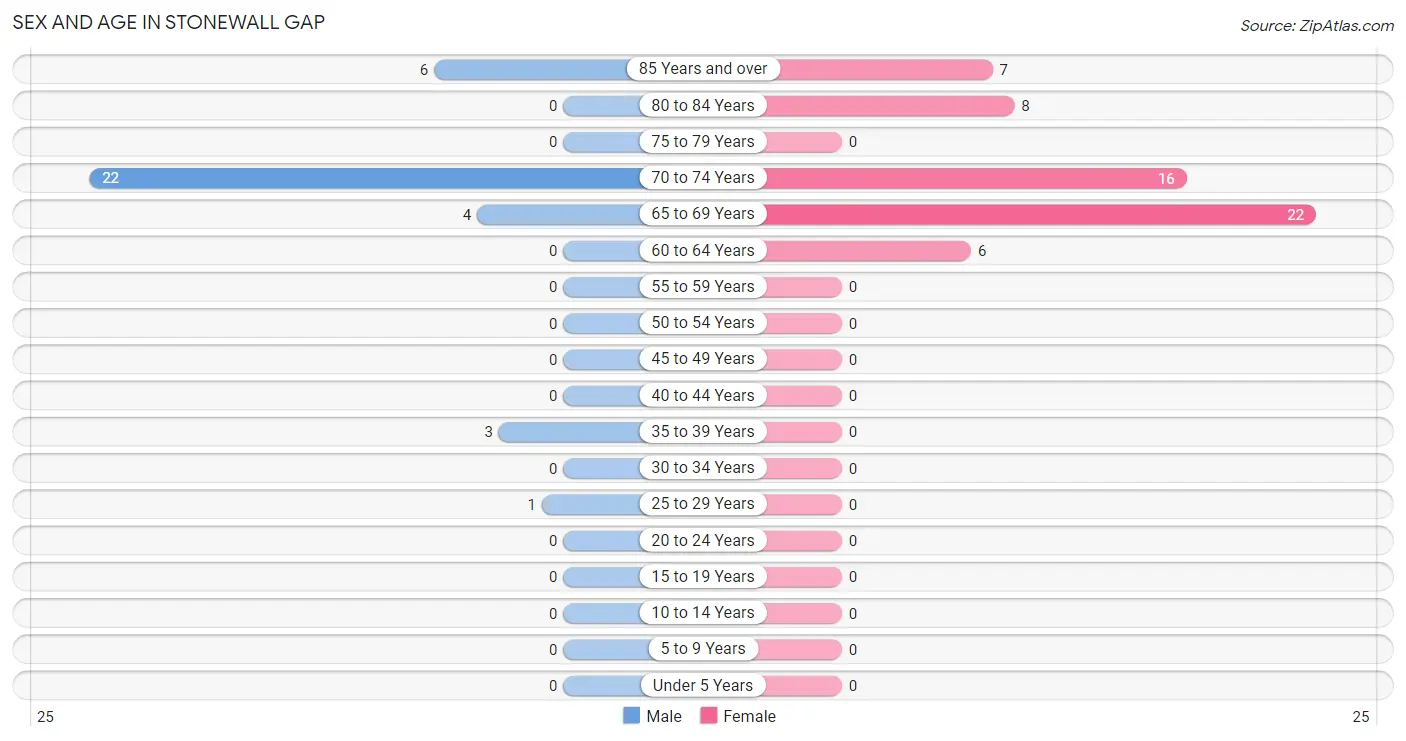
| Age Bracket | Male | Female |
| Under 5 Years | 0 (0.0%) | 0 (0.0%) |
| 5 to 9 Years | 0 (0.0%) | 0 (0.0%) |
| 10 to 14 Years | 0 (0.0%) | 0 (0.0%) |
| 15 to 19 Years | 0 (0.0%) | 0 (0.0%) |
| 20 to 24 Years | 0 (0.0%) | 0 (0.0%) |
| 25 to 29 Years | 1 (2.8%) | 0 (0.0%) |
| 30 to 34 Years | 0 (0.0%) | 0 (0.0%) |
| 35 to 39 Years | 3 (8.3%) | 0 (0.0%) |
| 40 to 44 Years | 0 (0.0%) | 0 (0.0%) |
| 45 to 49 Years | 0 (0.0%) | 0 (0.0%) |
| 50 to 54 Years | 0 (0.0%) | 0 (0.0%) |
| 55 to 59 Years | 0 (0.0%) | 0 (0.0%) |
| 60 to 64 Years | 0 (0.0%) | 6 (10.2%) |
| 65 to 69 Years | 4 (11.1%) | 22 (37.3%) |
| 70 to 74 Years | 22 (61.1%) | 16 (27.1%) |
| 75 to 79 Years | 0 (0.0%) | 0 (0.0%) |
| 80 to 84 Years | 0 (0.0%) | 8 (13.6%) |
| 85 Years and over | 6 (16.7%) | 7 (11.9%) |
| Total | 36 (100.0%) | 59 (100.0%) |
Families and Households in Stonewall Gap
Median Family Size in Stonewall Gap
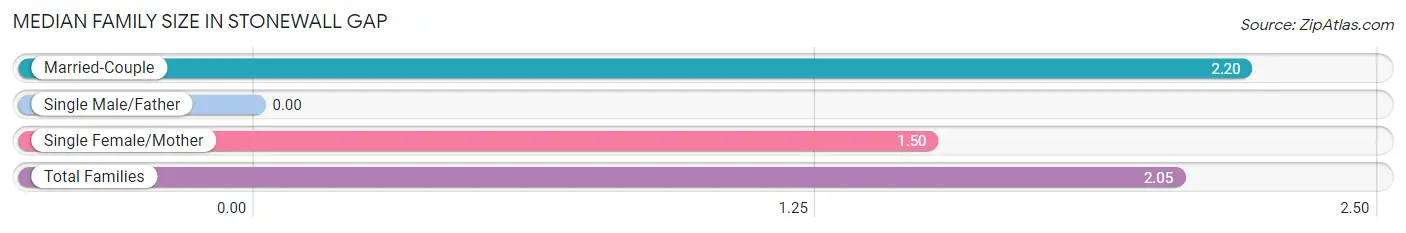
| Family Type | # Families | Family Size |
| Married-Couple | 30 (78.9%) | 2.20 |
| Single Male/Father | 0 (0.0%) | - |
| Single Female/Mother | 8 (21.0%) | 1.50 |
| Total Families | 38 (100.0%) | 2.05 |
Median Household Size in Stonewall Gap
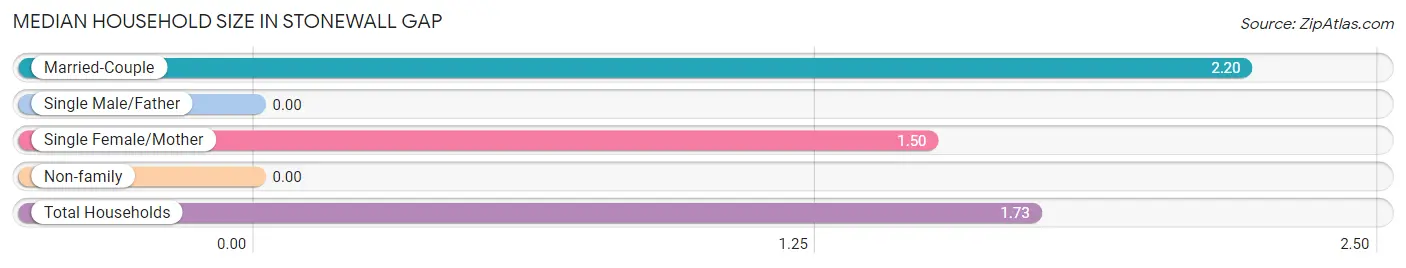
| Household Type | # Households | Household Size |
| Married-Couple | 30 (54.5%) | 2.20 |
| Single Male/Father | 0 (0.0%) | - |
| Single Female/Mother | 8 (14.5%) | 1.50 |
| Non-family | 17 (30.9%) | - |
| Total Households | 55 (100.0%) | 1.73 |
Household Size by Marriage Status in Stonewall Gap
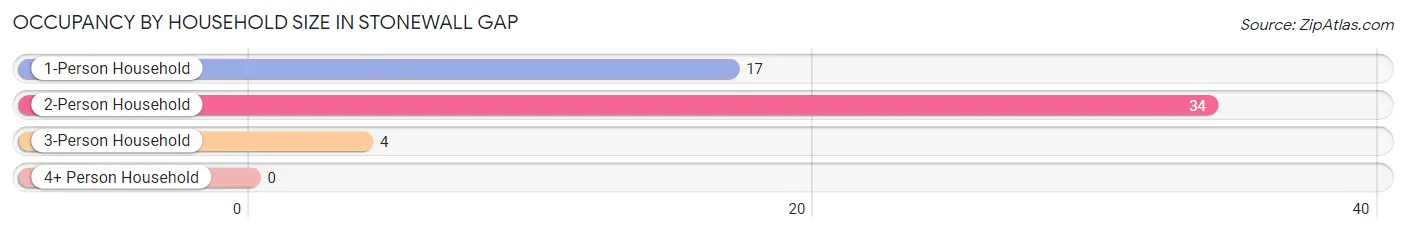
Out of a total of 55 households in Stonewall Gap, 38 (69.1%) are family households, while 17 (30.9%) are nonfamily households. The most numerous type of family households are 2-person households, comprising 34, and the most common type of nonfamily households are 1-person households, comprising 17.
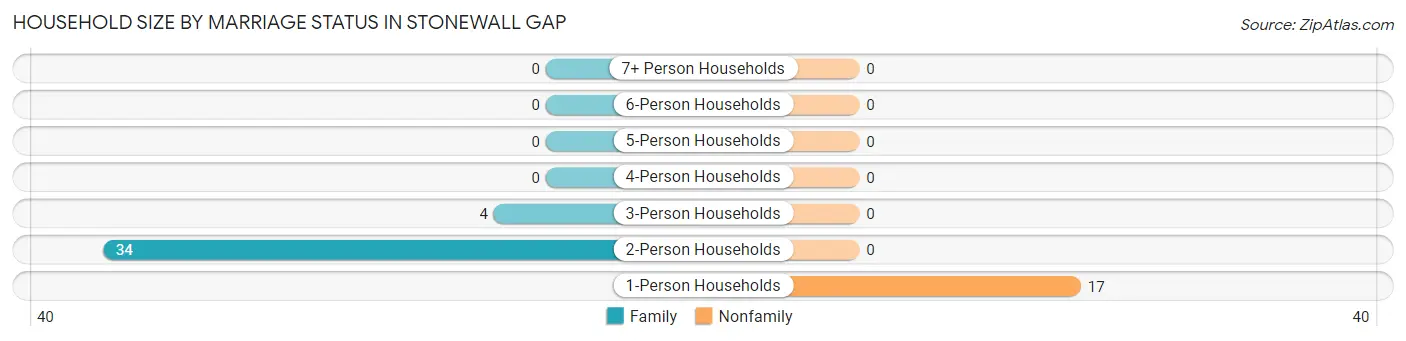
| Household Size | Family Households | Nonfamily Households |
| 1-Person Households | - | 17 (30.9%) |
| 2-Person Households | 34 (61.8%) | 0 (0.0%) |
| 3-Person Households | 4 (7.3%) | 0 (0.0%) |
| 4-Person Households | 0 (0.0%) | 0 (0.0%) |
| 5-Person Households | 0 (0.0%) | 0 (0.0%) |
| 6-Person Households | 0 (0.0%) | 0 (0.0%) |
| 7+ Person Households | 0 (0.0%) | 0 (0.0%) |
| Total | 38 (69.1%) | 17 (30.9%) |
Female Fertility in Stonewall Gap
Fertility by Age in Stonewall Gap
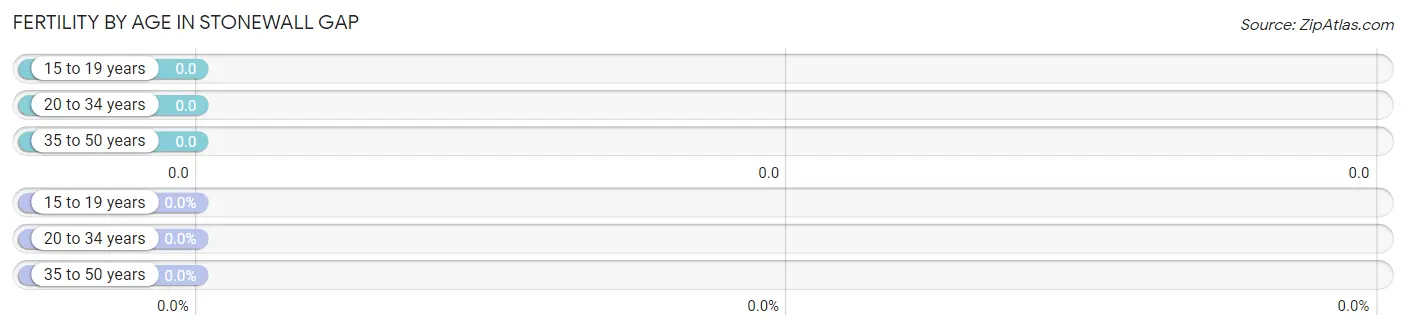
| Age Bracket | Women with Births | Births / 1,000 Women |
| 15 to 19 years | 0 (0.0%) | 0.0 |
| 20 to 34 years | 0 (0.0%) | 0.0 |
| 35 to 50 years | 0 (0.0%) | 0.0 |
| Total | 0 (0.0%) | 0.0 |
Fertility by Age by Marriage Status in Stonewall Gap
| Age Bracket | Married | Unmarried |
| 15 to 19 years | 0 (0.0%) | 0 (0.0%) |
| 20 to 34 years | 0 (0.0%) | 0 (0.0%) |
| 35 to 50 years | 0 (0.0%) | 0 (0.0%) |
| Total | 0 (0.0%) | 0 (0.0%) |
Fertility by Education in Stonewall Gap
| Educational Attainment | Women with Births | Births / 1,000 Women |
| Less than High School | 0 (0.0%) | 0.0 |
| High School Diploma | 0 (0.0%) | 0.0 |
| College or Associate's Degree | 0 (0.0%) | 0.0 |
| Bachelor's Degree | 0 (0.0%) | 0.0 |
| Graduate Degree | 0 (0.0%) | 0.0 |
| Total | 0 (0.0%) | 0.0 |
Fertility by Education by Marriage Status in Stonewall Gap
| Educational Attainment | Married | Unmarried |
| Less than High School | 0 (0.0%) | 0 (0.0%) |
| High School Diploma | 0 (0.0%) | 0 (0.0%) |
| College or Associate's Degree | 0 (0.0%) | 0 (0.0%) |
| Bachelor's Degree | 0 (0.0%) | 0 (0.0%) |
| Graduate Degree | 0 (0.0%) | 0 (0.0%) |
| Total | 0 (0.0%) | 0 (0.0%) |
Employment Characteristics in Stonewall Gap
Employment by Class of Employer in Stonewall Gap
Among the 11 employed individuals in Stonewall Gap, self-employed (not incorporated) (7 | 63.6%), and private company employees (4 | 36.4%) make up the most common classes of employment.
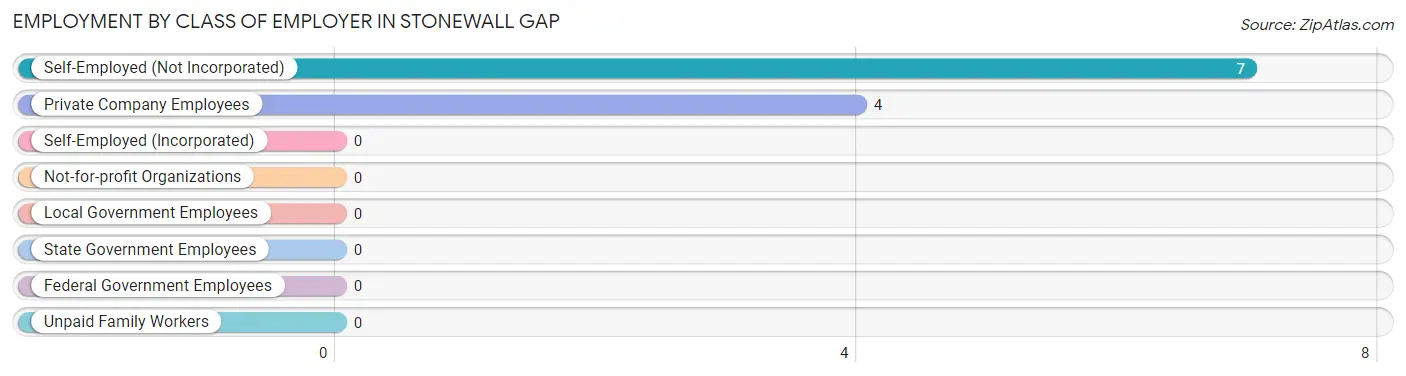
| Employer Class | # Employees | % Employees |
| Private Company Employees | 4 | 36.4% |
| Self-Employed (Incorporated) | 0 | 0.0% |
| Self-Employed (Not Incorporated) | 7 | 63.6% |
| Not-for-profit Organizations | 0 | 0.0% |
| Local Government Employees | 0 | 0.0% |
| State Government Employees | 0 | 0.0% |
| Federal Government Employees | 0 | 0.0% |
| Unpaid Family Workers | 0 | 0.0% |
| Total | 11 | 100.0% |
Employment Status by Age in Stonewall Gap
According to the labor force statistics for Stonewall Gap, out of the total population over 16 years of age (95), 12.6% or 12 individuals are in the labor force, with 8.3% or 1 of them unemployed. The age group with the highest labor force participation rate is 25 to 29 years, with 100.0% or 1 individuals in the labor force. Within the labor force, the 25 to 29 years age range has the highest percentage of unemployed individuals, with 100.0% or 1 of them being unemployed.
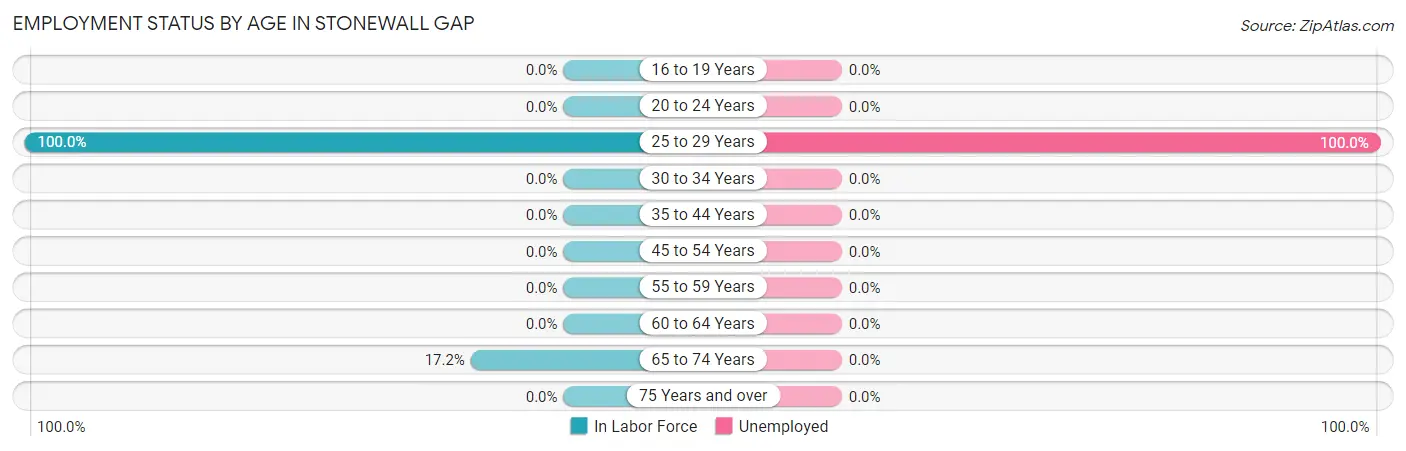
| Age Bracket | In Labor Force | Unemployed |
| 16 to 19 Years | 0 (0.0%) | 0 (0.0%) |
| 20 to 24 Years | 0 (0.0%) | 0 (0.0%) |
| 25 to 29 Years | 1 (100.0%) | 1 (100.0%) |
| 30 to 34 Years | 0 (0.0%) | 0 (0.0%) |
| 35 to 44 Years | 0 (0.0%) | 0 (0.0%) |
| 45 to 54 Years | 0 (0.0%) | 0 (0.0%) |
| 55 to 59 Years | 0 (0.0%) | 0 (0.0%) |
| 60 to 64 Years | 0 (0.0%) | 0 (0.0%) |
| 65 to 74 Years | 11 (17.2%) | 0 (0.0%) |
| 75 Years and over | 0 (0.0%) | 0 (0.0%) |
| Total | 12 (12.6%) | 1 (8.3%) |
Employment Status by Educational Attainment in Stonewall Gap
According to labor force statistics for Stonewall Gap, 10.0% of individuals (1) out of the total population between 25 and 64 years of age (10) are in the labor force, with 100.0% or 1 of them being unemployed. The group with the highest labor force participation rate are those with the educational attainment of college / associate degree, with 14.3% or 1 individuals in the labor force. Within the labor force, individuals with college / associate degree education have the highest percentage of unemployment, with 100.0% or 1 of them being unemployed.
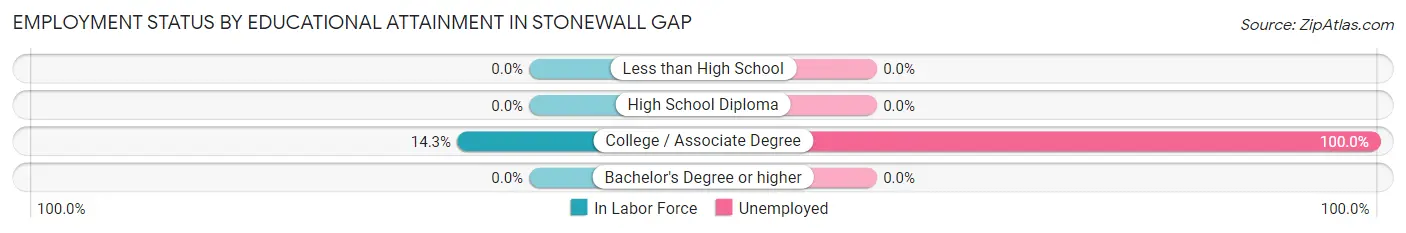
| Educational Attainment | In Labor Force | Unemployed |
| Less than High School | 0 (0.0%) | 0 (0.0%) |
| High School Diploma | 0 (0.0%) | 0 (0.0%) |
| College / Associate Degree | 1 (14.3%) | 7 (100.0%) |
| Bachelor's Degree or higher | 0 (0.0%) | 0 (0.0%) |
| Total | 1 (10.0%) | 10 (100.0%) |
Employment Occupations by Sex in Stonewall Gap
Management, Business, Science and Arts Occupations
Management, Business, Science and Arts Occupations by Sex
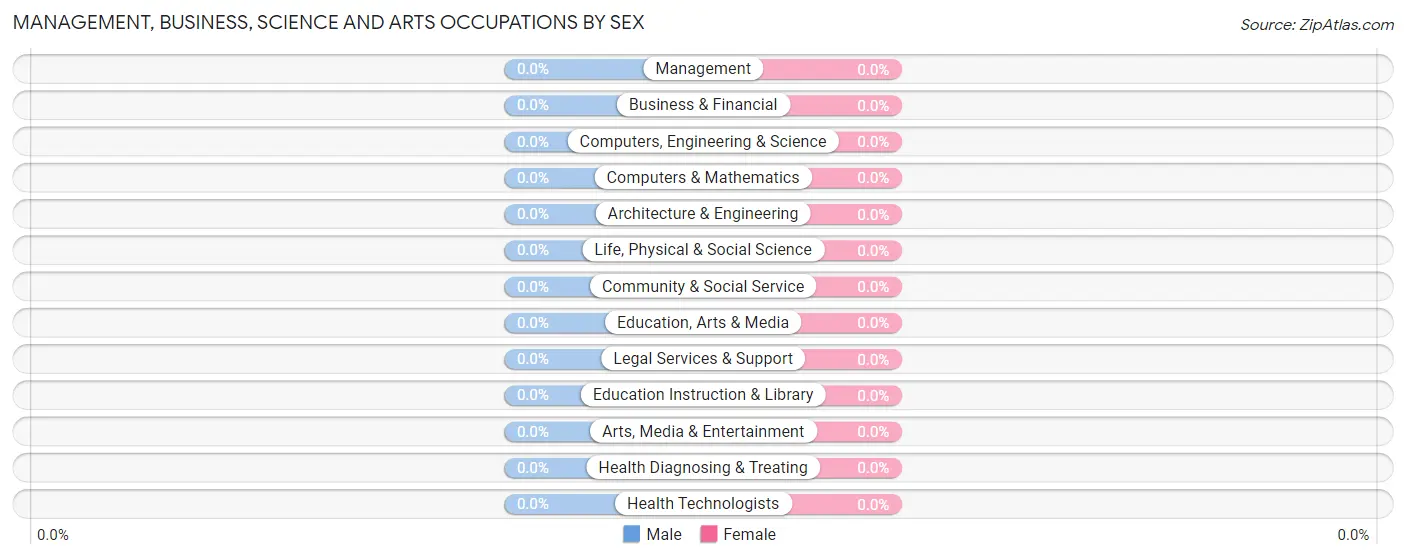
| Occupation | Male | Female |
| Management | 0 (0.0%) | 0 (0.0%) |
| Business & Financial | 0 (0.0%) | 0 (0.0%) |
| Computers, Engineering & Science | 0 (0.0%) | 0 (0.0%) |
| Computers & Mathematics | 0 (0.0%) | 0 (0.0%) |
| Architecture & Engineering | 0 (0.0%) | 0 (0.0%) |
| Life, Physical & Social Science | 0 (0.0%) | 0 (0.0%) |
| Community & Social Service | 0 (0.0%) | 0 (0.0%) |
| Education, Arts & Media | 0 (0.0%) | 0 (0.0%) |
| Legal Services & Support | 0 (0.0%) | 0 (0.0%) |
| Education Instruction & Library | 0 (0.0%) | 0 (0.0%) |
| Arts, Media & Entertainment | 0 (0.0%) | 0 (0.0%) |
| Health Diagnosing & Treating | 0 (0.0%) | 0 (0.0%) |
| Health Technologists | 0 (0.0%) | 0 (0.0%) |
| Total (Category) | 0 (0.0%) | 0 (0.0%) |
| Total (Overall) | 4 (36.4%) | 7 (63.6%) |
Services Occupations
Services Occupations by Sex
| Occupation | Male | Female |
| Healthcare Support | 0 (0.0%) | 0 (0.0%) |
| Security & Protection | 0 (0.0%) | 0 (0.0%) |
| Firefighting & Prevention | 0 (0.0%) | 0 (0.0%) |
| Law Enforcement | 0 (0.0%) | 0 (0.0%) |
| Food Preparation & Serving | 0 (0.0%) | 0 (0.0%) |
| Cleaning & Maintenance | 0 (0.0%) | 0 (0.0%) |
| Personal Care & Service | 0 (0.0%) | 0 (0.0%) |
| Total (Category) | 0 (0.0%) | 0 (0.0%) |
| Total (Overall) | 4 (36.4%) | 7 (63.6%) |
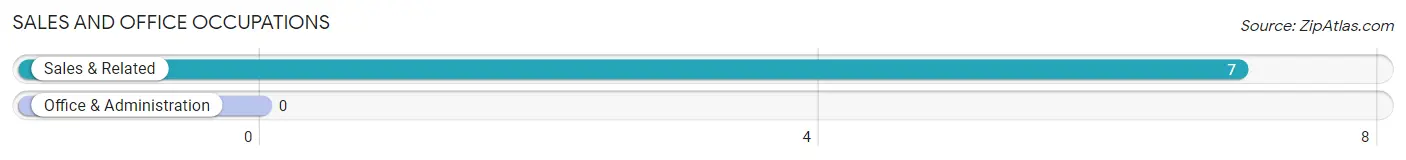
Sales and Office Occupations
The most common Sales and Office occupations in Stonewall Gap are , and Sales & Related (7 | 63.6%).
Sales and Office Occupations by Sex
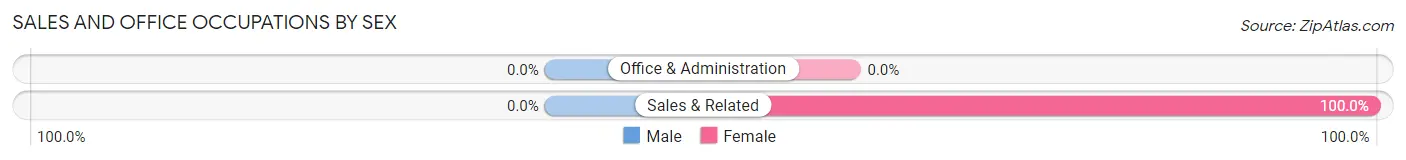
| Occupation | Male | Female |
| Sales & Related | 0 (0.0%) | 7 (100.0%) |
| Office & Administration | 0 (0.0%) | 0 (0.0%) |
| Total (Category) | 0 (0.0%) | 7 (100.0%) |
| Total (Overall) | 4 (36.4%) | 7 (63.6%) |
Natural Resources, Construction and Maintenance Occupations
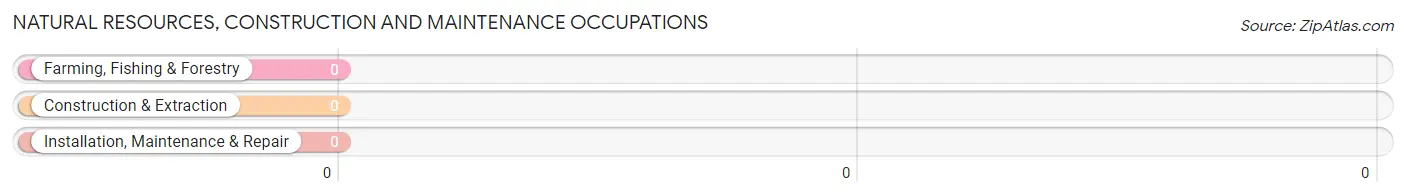
Natural Resources, Construction and Maintenance Occupations by Sex
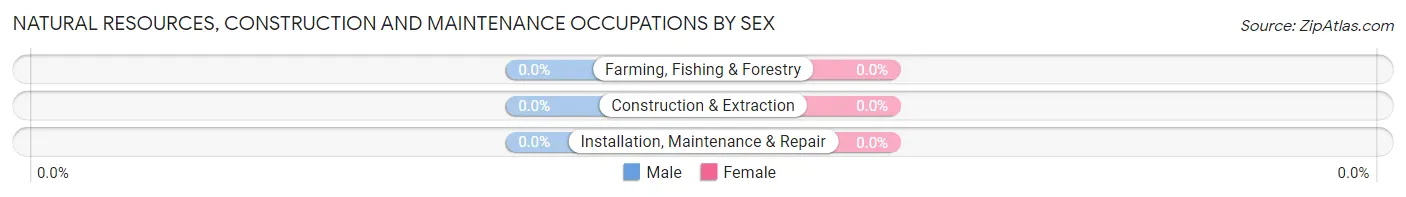
| Occupation | Male | Female |
| Farming, Fishing & Forestry | 0 (0.0%) | 0 (0.0%) |
| Construction & Extraction | 0 (0.0%) | 0 (0.0%) |
| Installation, Maintenance & Repair | 0 (0.0%) | 0 (0.0%) |
| Total (Category) | 0 (0.0%) | 0 (0.0%) |
| Total (Overall) | 4 (36.4%) | 7 (63.6%) |
Production, Transportation and Moving Occupations
The most common Production, Transportation and Moving occupations in Stonewall Gap are , and Transportation (4 | 36.4%).
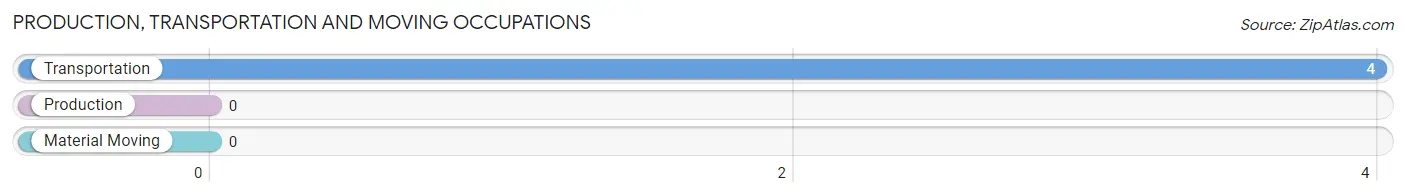
Production, Transportation and Moving Occupations by Sex
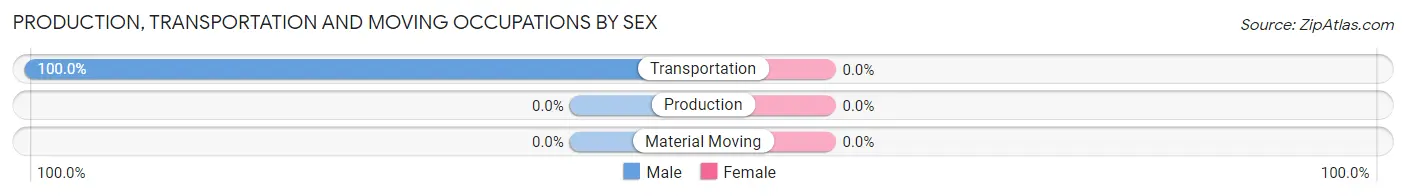
| Occupation | Male | Female |
| Production | 0 (0.0%) | 0 (0.0%) |
| Transportation | 4 (100.0%) | 0 (0.0%) |
| Material Moving | 0 (0.0%) | 0 (0.0%) |
| Total (Category) | 4 (100.0%) | 0 (0.0%) |
| Total (Overall) | 4 (36.4%) | 7 (63.6%) |
Employment Industries by Sex in Stonewall Gap
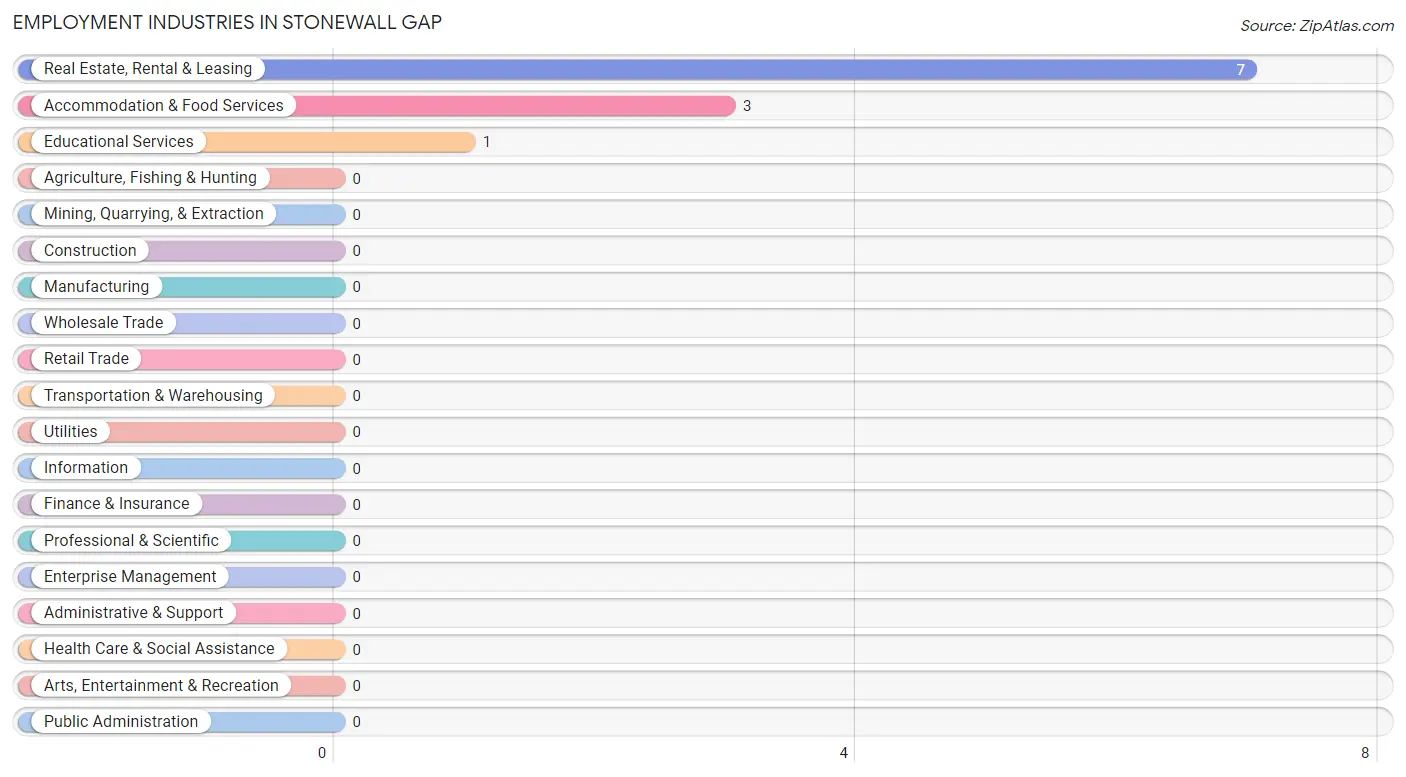
Employment Industries in Stonewall Gap
The major employment industries in Stonewall Gap include Real Estate, Rental & Leasing (7 | 63.6%), Accommodation & Food Services (3 | 27.3%), and Educational Services (1 | 9.1%).
Employment Industries by Sex in Stonewall Gap
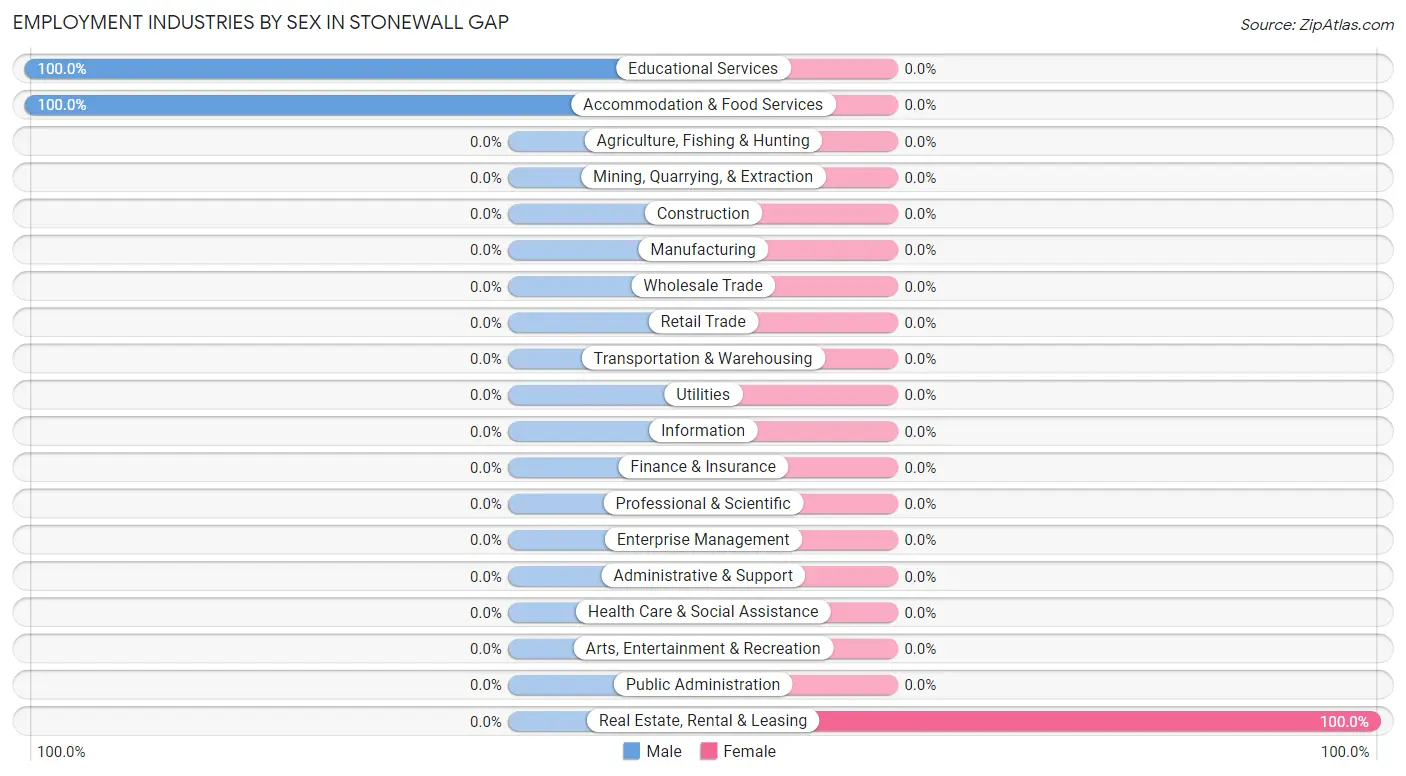
| Industry | Male | Female |
| Agriculture, Fishing & Hunting | 0 (0.0%) | 0 (0.0%) |
| Mining, Quarrying, & Extraction | 0 (0.0%) | 0 (0.0%) |
| Construction | 0 (0.0%) | 0 (0.0%) |
| Manufacturing | 0 (0.0%) | 0 (0.0%) |
| Wholesale Trade | 0 (0.0%) | 0 (0.0%) |
| Retail Trade | 0 (0.0%) | 0 (0.0%) |
| Transportation & Warehousing | 0 (0.0%) | 0 (0.0%) |
| Utilities | 0 (0.0%) | 0 (0.0%) |
| Information | 0 (0.0%) | 0 (0.0%) |
| Finance & Insurance | 0 (0.0%) | 0 (0.0%) |
| Real Estate, Rental & Leasing | 0 (0.0%) | 7 (100.0%) |
| Professional & Scientific | 0 (0.0%) | 0 (0.0%) |
| Enterprise Management | 0 (0.0%) | 0 (0.0%) |
| Administrative & Support | 0 (0.0%) | 0 (0.0%) |
| Educational Services | 1 (100.0%) | 0 (0.0%) |
| Health Care & Social Assistance | 0 (0.0%) | 0 (0.0%) |
| Arts, Entertainment & Recreation | 0 (0.0%) | 0 (0.0%) |
| Accommodation & Food Services | 3 (100.0%) | 0 (0.0%) |
| Public Administration | 0 (0.0%) | 0 (0.0%) |
| Total | 4 (36.4%) | 7 (63.6%) |
Education in Stonewall Gap
School Enrollment in Stonewall Gap
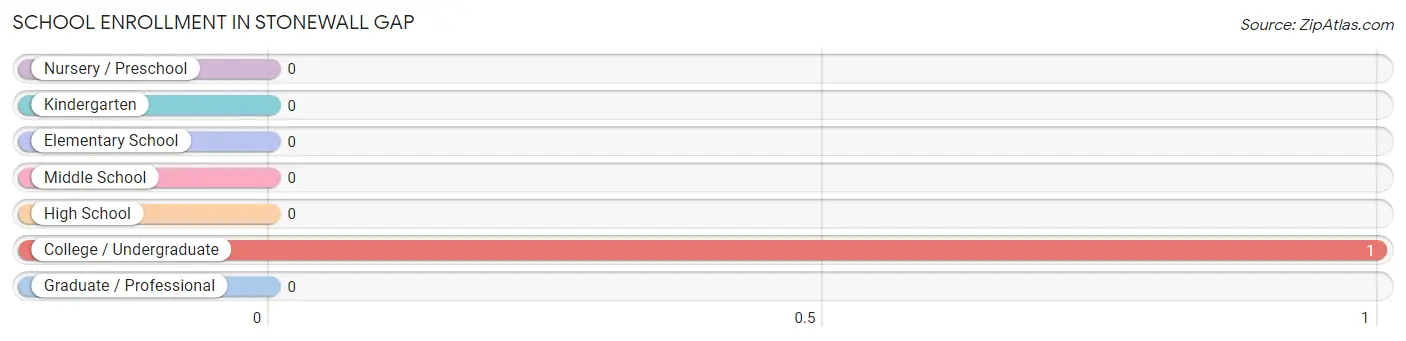
| School Level | # Students | % Students |
| Nursery / Preschool | 0 | 0.0% |
| Kindergarten | 0 | 0.0% |
| Elementary School | 0 | 0.0% |
| Middle School | 0 | 0.0% |
| High School | 0 | 0.0% |
| College / Undergraduate | 1 | 100.0% |
| Graduate / Professional | 0 | 0.0% |
| Total | 1 | 100.0% |
School Enrollment by Age by Funding Source in Stonewall Gap
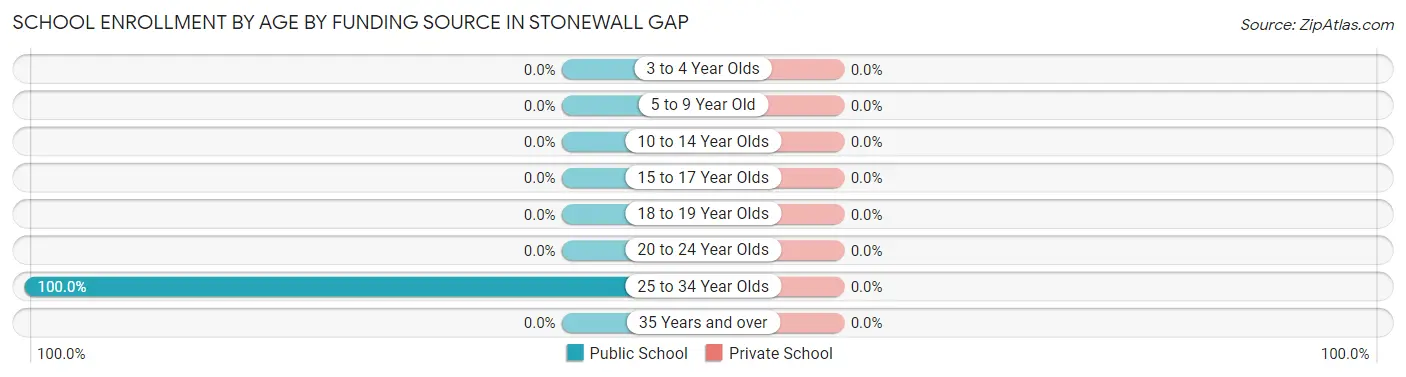
| Age Bracket | Public School | Private School |
| 3 to 4 Year Olds | 0 (0.0%) | 0 (0.0%) |
| 5 to 9 Year Old | 0 (0.0%) | 0 (0.0%) |
| 10 to 14 Year Olds | 0 (0.0%) | 0 (0.0%) |
| 15 to 17 Year Olds | 0 (0.0%) | 0 (0.0%) |
| 18 to 19 Year Olds | 0 (0.0%) | 0 (0.0%) |
| 20 to 24 Year Olds | 0 (0.0%) | 0 (0.0%) |
| 25 to 34 Year Olds | 1 (100.0%) | 0 (0.0%) |
| 35 Years and over | 0 (0.0%) | 0 (0.0%) |
| Total | 1 (100.0%) | 0 (0.0%) |
Educational Attainment by Field of Study in Stonewall Gap
Education (13 | 61.9%), liberal arts & history (3 | 14.3%), business (2 | 9.5%), bio, nature & agricultural (1 | 4.8%), and physical & health sciences (1 | 4.8%) are the most common fields of study among 21 individuals in Stonewall Gap who have obtained a bachelor's degree or higher.
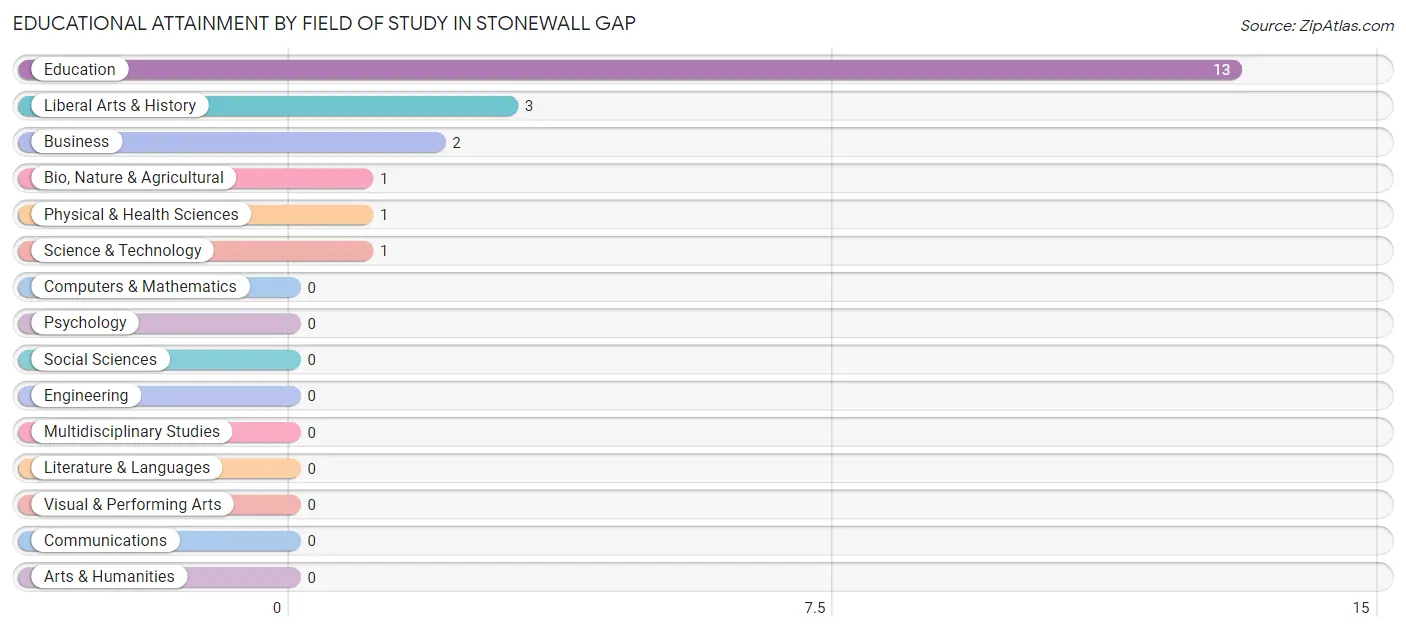
| Field of Study | # Graduates | % Graduates |
| Computers & Mathematics | 0 | 0.0% |
| Bio, Nature & Agricultural | 1 | 4.8% |
| Physical & Health Sciences | 1 | 4.8% |
| Psychology | 0 | 0.0% |
| Social Sciences | 0 | 0.0% |
| Engineering | 0 | 0.0% |
| Multidisciplinary Studies | 0 | 0.0% |
| Science & Technology | 1 | 4.8% |
| Business | 2 | 9.5% |
| Education | 13 | 61.9% |
| Literature & Languages | 0 | 0.0% |
| Liberal Arts & History | 3 | 14.3% |
| Visual & Performing Arts | 0 | 0.0% |
| Communications | 0 | 0.0% |
| Arts & Humanities | 0 | 0.0% |
| Total | 21 | 100.0% |
Transportation & Commute in Stonewall Gap
Vehicle Availability by Sex in Stonewall Gap
The most prevalent vehicle ownership categories in Stonewall Gap are males with 3 vehicles (3, accounting for 75.0%) and females with 3 vehicles (0, making up 42.9%).
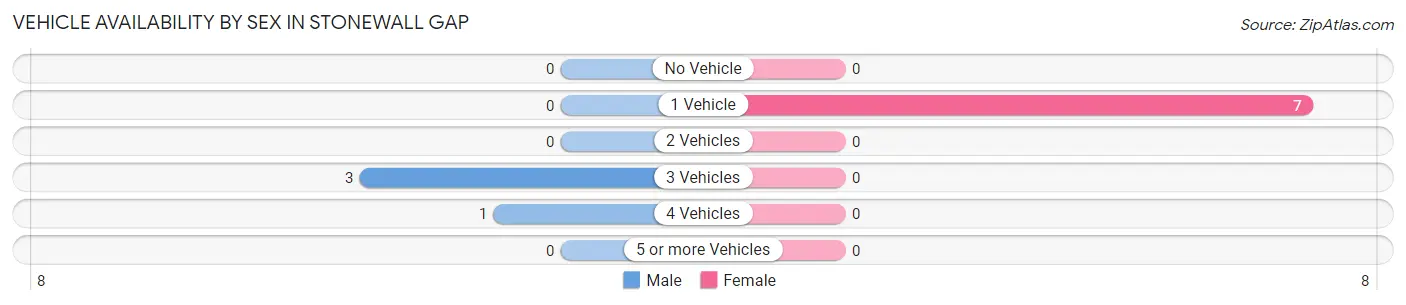
| Vehicles Available | Male | Female |
| No Vehicle | 0 (0.0%) | 0 (0.0%) |
| 1 Vehicle | 0 (0.0%) | 7 (100.0%) |
| 2 Vehicles | 0 (0.0%) | 0 (0.0%) |
| 3 Vehicles | 3 (75.0%) | 0 (0.0%) |
| 4 Vehicles | 1 (25.0%) | 0 (0.0%) |
| 5 or more Vehicles | 0 (0.0%) | 0 (0.0%) |
| Total | 4 (100.0%) | 7 (100.0%) |
Commute Time in Stonewall Gap
The most frequently occuring commute durations in Stonewall Gap are 15 to 19 minutes (10 commuters, 90.9%), 20 to 24 minutes (1 commuters, 9.1%), and less than 5 minutes (0 commuters, 0.0%).
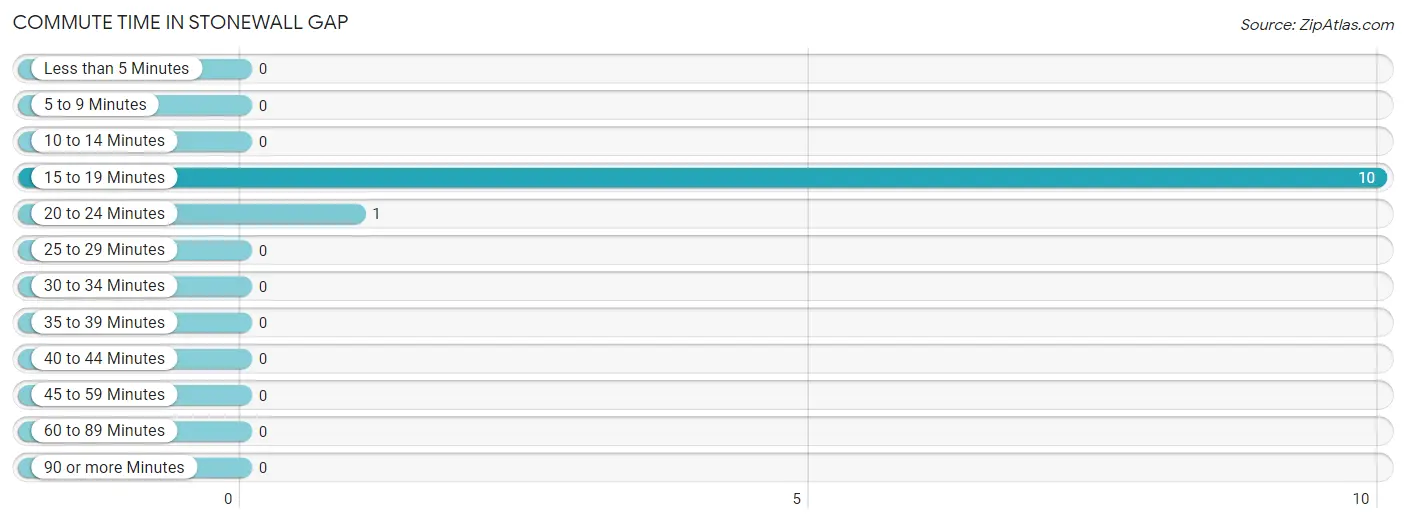
| Commute Time | # Commuters | % Commuters |
| Less than 5 Minutes | 0 | 0.0% |
| 5 to 9 Minutes | 0 | 0.0% |
| 10 to 14 Minutes | 0 | 0.0% |
| 15 to 19 Minutes | 10 | 90.9% |
| 20 to 24 Minutes | 1 | 9.1% |
| 25 to 29 Minutes | 0 | 0.0% |
| 30 to 34 Minutes | 0 | 0.0% |
| 35 to 39 Minutes | 0 | 0.0% |
| 40 to 44 Minutes | 0 | 0.0% |
| 45 to 59 Minutes | 0 | 0.0% |
| 60 to 89 Minutes | 0 | 0.0% |
| 90 or more Minutes | 0 | 0.0% |
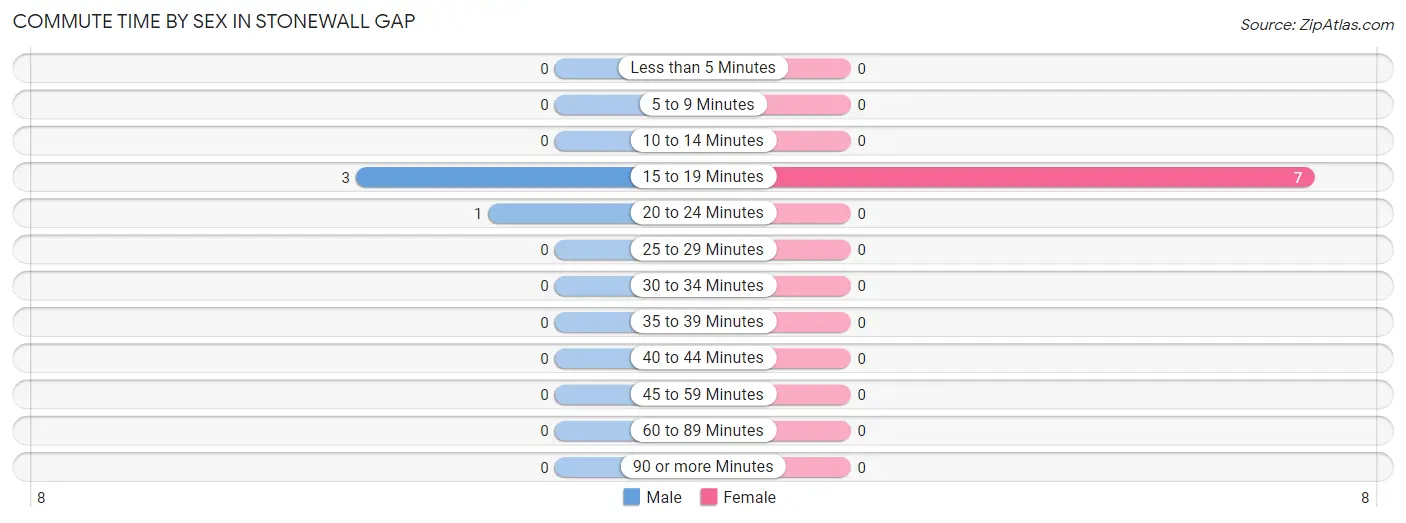
Commute Time by Sex in Stonewall Gap
The most common commute times in Stonewall Gap are 15 to 19 minutes (3 commuters, 75.0%) for males and 15 to 19 minutes (7 commuters, 100.0%) for females.
| Commute Time | Male | Female |
| Less than 5 Minutes | 0 (0.0%) | 0 (0.0%) |
| 5 to 9 Minutes | 0 (0.0%) | 0 (0.0%) |
| 10 to 14 Minutes | 0 (0.0%) | 0 (0.0%) |
| 15 to 19 Minutes | 3 (75.0%) | 7 (100.0%) |
| 20 to 24 Minutes | 1 (25.0%) | 0 (0.0%) |
| 25 to 29 Minutes | 0 (0.0%) | 0 (0.0%) |
| 30 to 34 Minutes | 0 (0.0%) | 0 (0.0%) |
| 35 to 39 Minutes | 0 (0.0%) | 0 (0.0%) |
| 40 to 44 Minutes | 0 (0.0%) | 0 (0.0%) |
| 45 to 59 Minutes | 0 (0.0%) | 0 (0.0%) |
| 60 to 89 Minutes | 0 (0.0%) | 0 (0.0%) |
| 90 or more Minutes | 0 (0.0%) | 0 (0.0%) |
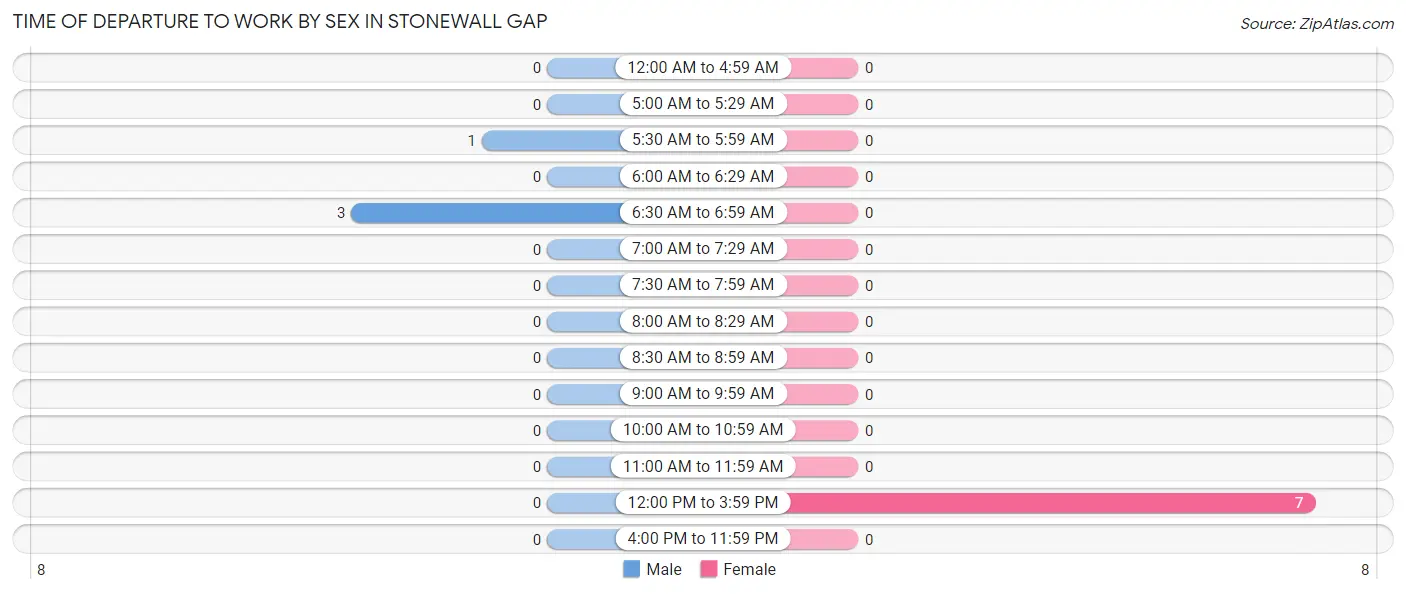
Time of Departure to Work by Sex in Stonewall Gap
The most frequent times of departure to work in Stonewall Gap are 6:30 AM to 6:59 AM (3, 75.0%) for males and 12:00 PM to 3:59 PM (7, 100.0%) for females.
| Time of Departure | Male | Female |
| 12:00 AM to 4:59 AM | 0 (0.0%) | 0 (0.0%) |
| 5:00 AM to 5:29 AM | 0 (0.0%) | 0 (0.0%) |
| 5:30 AM to 5:59 AM | 1 (25.0%) | 0 (0.0%) |
| 6:00 AM to 6:29 AM | 0 (0.0%) | 0 (0.0%) |
| 6:30 AM to 6:59 AM | 3 (75.0%) | 0 (0.0%) |
| 7:00 AM to 7:29 AM | 0 (0.0%) | 0 (0.0%) |
| 7:30 AM to 7:59 AM | 0 (0.0%) | 0 (0.0%) |
| 8:00 AM to 8:29 AM | 0 (0.0%) | 0 (0.0%) |
| 8:30 AM to 8:59 AM | 0 (0.0%) | 0 (0.0%) |
| 9:00 AM to 9:59 AM | 0 (0.0%) | 0 (0.0%) |
| 10:00 AM to 10:59 AM | 0 (0.0%) | 0 (0.0%) |
| 11:00 AM to 11:59 AM | 0 (0.0%) | 0 (0.0%) |
| 12:00 PM to 3:59 PM | 0 (0.0%) | 7 (100.0%) |
| 4:00 PM to 11:59 PM | 0 (0.0%) | 0 (0.0%) |
| Total | 4 (100.0%) | 7 (100.0%) |
Housing Occupancy in Stonewall Gap
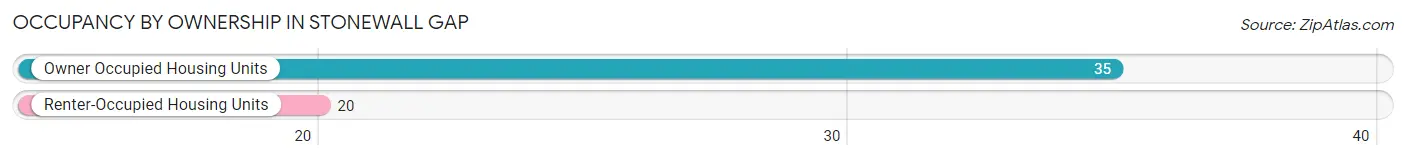
Occupancy by Ownership in Stonewall Gap
Of the total 55 dwellings in Stonewall Gap, owner-occupied units account for 35 (63.6%), while renter-occupied units make up 20 (36.4%).
| Occupancy | # Housing Units | % Housing Units |
| Owner Occupied Housing Units | 35 | 63.6% |
| Renter-Occupied Housing Units | 20 | 36.4% |
| Total Occupied Housing Units | 55 | 100.0% |
Occupancy by Household Size in Stonewall Gap
| Household Size | # Housing Units | % Housing Units |
| 1-Person Household | 17 | 30.9% |
| 2-Person Household | 34 | 61.8% |
| 3-Person Household | 4 | 7.3% |
| 4+ Person Household | 0 | 0.0% |
| Total Housing Units | 55 | 100.0% |
Occupancy by Ownership by Household Size in Stonewall Gap
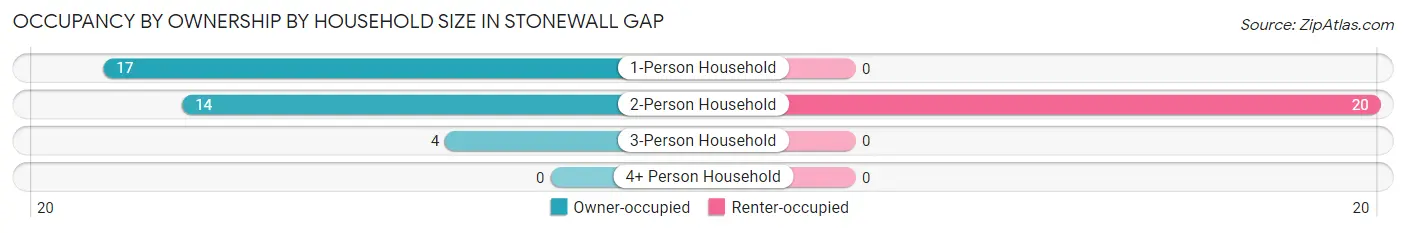
| Household Size | Owner-occupied | Renter-occupied |
| 1-Person Household | 17 (100.0%) | 0 (0.0%) |
| 2-Person Household | 14 (41.2%) | 20 (58.8%) |
| 3-Person Household | 4 (100.0%) | 0 (0.0%) |
| 4+ Person Household | 0 (0.0%) | 0 (0.0%) |
| Total Housing Units | 35 (63.6%) | 20 (36.4%) |
Occupancy by Educational Attainment in Stonewall Gap
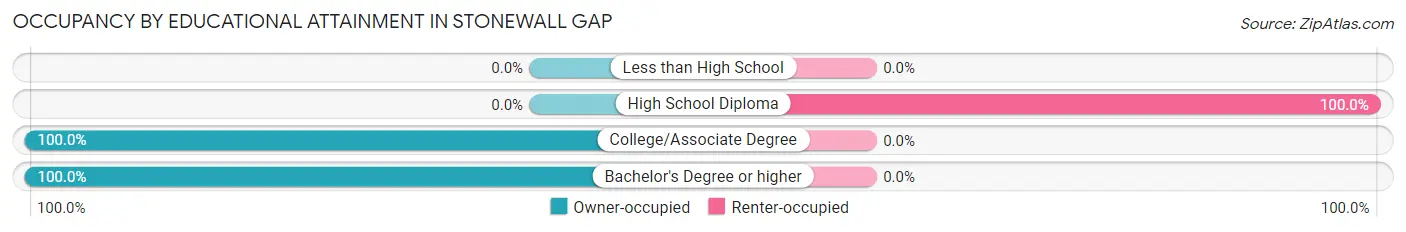
| Household Size | Owner-occupied | Renter-occupied |
| Less than High School | 0 (0.0%) | 0 (0.0%) |
| High School Diploma | 0 (0.0%) | 20 (100.0%) |
| College/Associate Degree | 24 (100.0%) | 0 (0.0%) |
| Bachelor's Degree or higher | 11 (100.0%) | 0 (0.0%) |
Occupancy by Age of Householder in Stonewall Gap
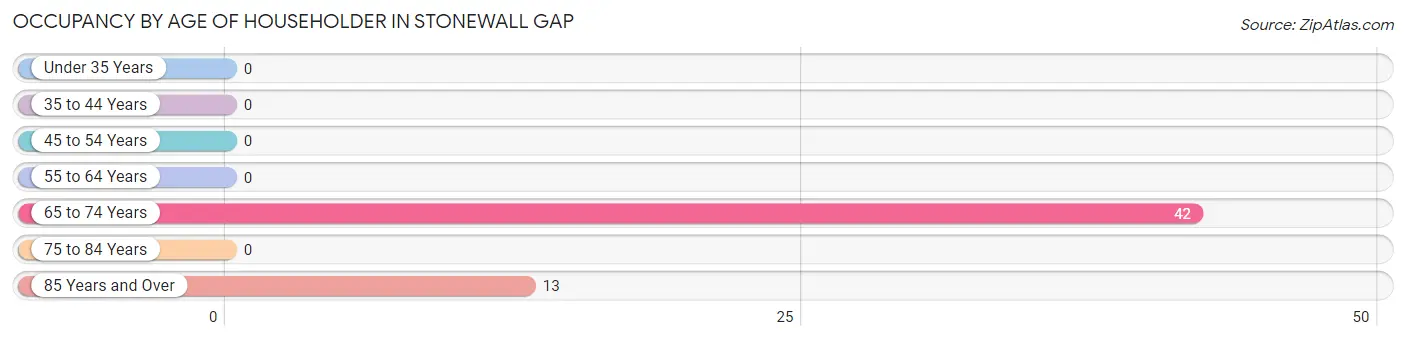
| Age Bracket | # Households | % Households |
| Under 35 Years | 0 | 0.0% |
| 35 to 44 Years | 0 | 0.0% |
| 45 to 54 Years | 0 | 0.0% |
| 55 to 64 Years | 0 | 0.0% |
| 65 to 74 Years | 42 | 76.4% |
| 75 to 84 Years | 0 | 0.0% |
| 85 Years and Over | 13 | 23.6% |
| Total | 55 | 100.0% |
Housing Finances in Stonewall Gap
Median Income by Occupancy in Stonewall Gap
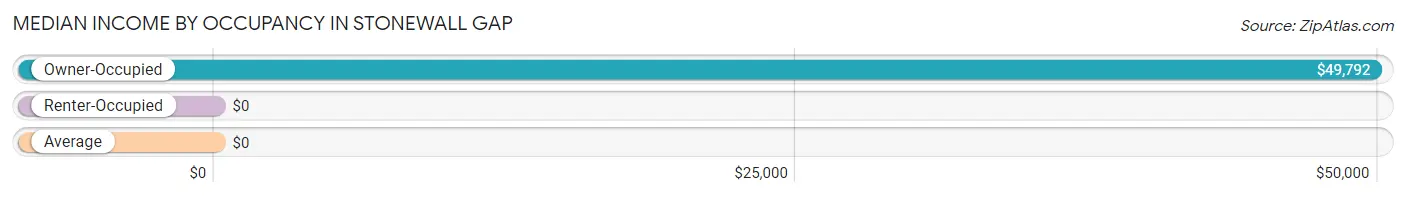
| Occupancy Type | # Households | Median Income |
| Owner-Occupied | 35 (63.6%) | $49,792 |
| Renter-Occupied | 20 (36.4%) | $0 |
| Average | 55 (100.0%) | $0 |
Occupancy by Householder Income Bracket in Stonewall Gap
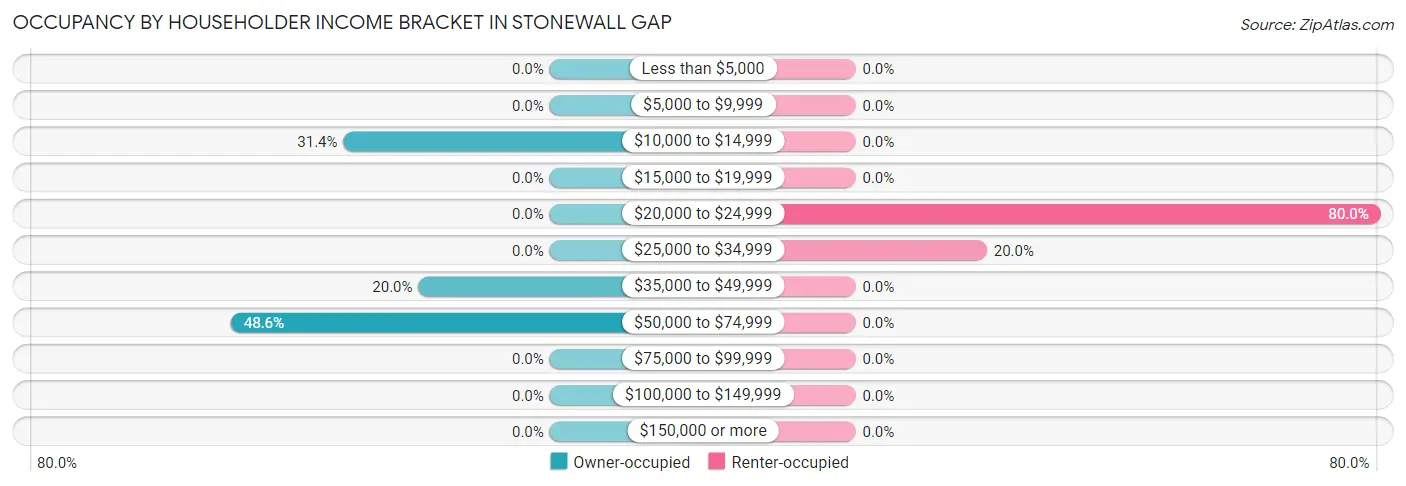
| Income Bracket | Owner-occupied | Renter-occupied |
| Less than $5,000 | 0 (0.0%) | 0 (0.0%) |
| $5,000 to $9,999 | 0 (0.0%) | 0 (0.0%) |
| $10,000 to $14,999 | 11 (31.4%) | 0 (0.0%) |
| $15,000 to $19,999 | 0 (0.0%) | 0 (0.0%) |
| $20,000 to $24,999 | 0 (0.0%) | 16 (80.0%) |
| $25,000 to $34,999 | 0 (0.0%) | 4 (20.0%) |
| $35,000 to $49,999 | 7 (20.0%) | 0 (0.0%) |
| $50,000 to $74,999 | 17 (48.6%) | 0 (0.0%) |
| $75,000 to $99,999 | 0 (0.0%) | 0 (0.0%) |
| $100,000 to $149,999 | 0 (0.0%) | 0 (0.0%) |
| $150,000 or more | 0 (0.0%) | 0 (0.0%) |
| Total | 35 (100.0%) | 20 (100.0%) |
Monthly Housing Cost Tiers in Stonewall Gap
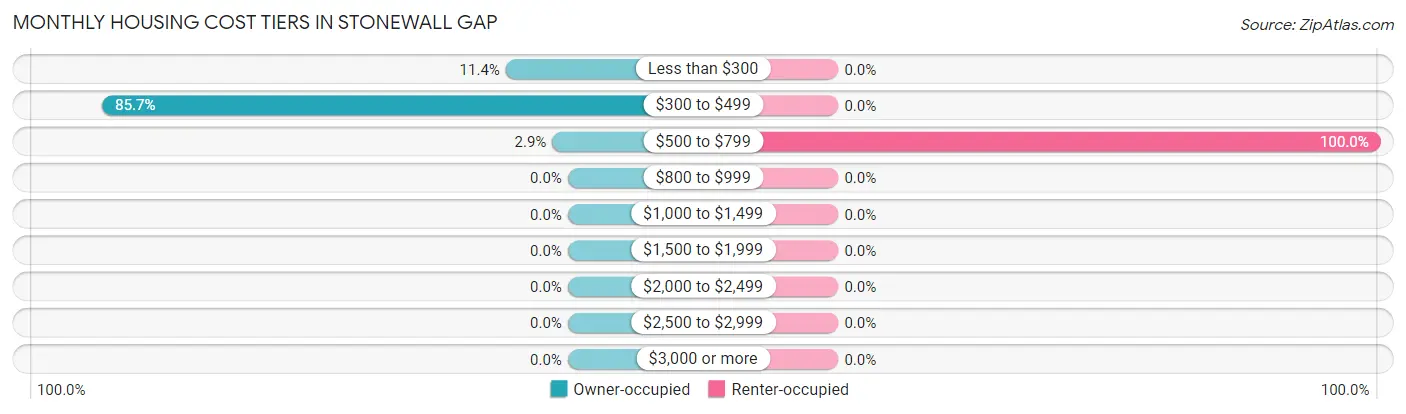
| Monthly Cost | Owner-occupied | Renter-occupied |
| Less than $300 | 4 (11.4%) | 0 (0.0%) |
| $300 to $499 | 30 (85.7%) | 0 (0.0%) |
| $500 to $799 | 1 (2.9%) | 20 (100.0%) |
| $800 to $999 | 0 (0.0%) | 0 (0.0%) |
| $1,000 to $1,499 | 0 (0.0%) | 0 (0.0%) |
| $1,500 to $1,999 | 0 (0.0%) | 0 (0.0%) |
| $2,000 to $2,499 | 0 (0.0%) | 0 (0.0%) |
| $2,500 to $2,999 | 0 (0.0%) | 0 (0.0%) |
| $3,000 or more | 0 (0.0%) | 0 (0.0%) |
| Total | 35 (100.0%) | 20 (100.0%) |
Physical Housing Characteristics in Stonewall Gap
Housing Structures in Stonewall Gap
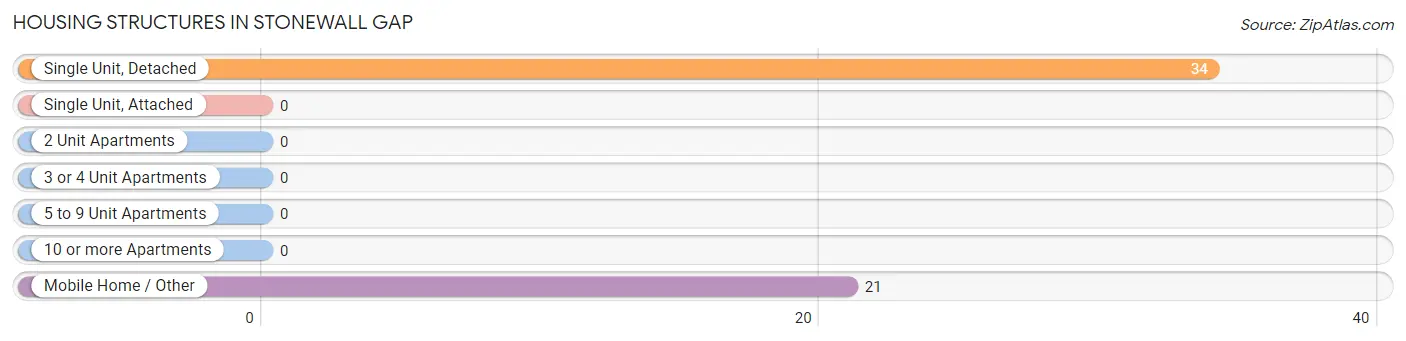
| Structure Type | # Housing Units | % Housing Units |
| Single Unit, Detached | 34 | 61.8% |
| Single Unit, Attached | 0 | 0.0% |
| 2 Unit Apartments | 0 | 0.0% |
| 3 or 4 Unit Apartments | 0 | 0.0% |
| 5 to 9 Unit Apartments | 0 | 0.0% |
| 10 or more Apartments | 0 | 0.0% |
| Mobile Home / Other | 21 | 38.2% |
| Total | 55 | 100.0% |
Housing Structures by Occupancy in Stonewall Gap
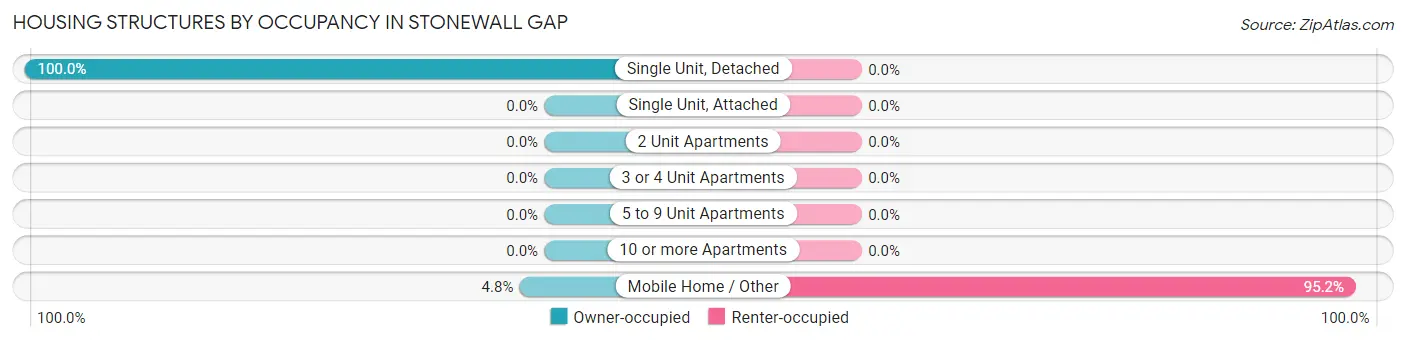
| Structure Type | Owner-occupied | Renter-occupied |
| Single Unit, Detached | 34 (100.0%) | 0 (0.0%) |
| Single Unit, Attached | 0 (0.0%) | 0 (0.0%) |
| 2 Unit Apartments | 0 (0.0%) | 0 (0.0%) |
| 3 or 4 Unit Apartments | 0 (0.0%) | 0 (0.0%) |
| 5 to 9 Unit Apartments | 0 (0.0%) | 0 (0.0%) |
| 10 or more Apartments | 0 (0.0%) | 0 (0.0%) |
| Mobile Home / Other | 1 (4.8%) | 20 (95.2%) |
| Total | 35 (63.6%) | 20 (36.4%) |
Housing Structures by Number of Rooms in Stonewall Gap
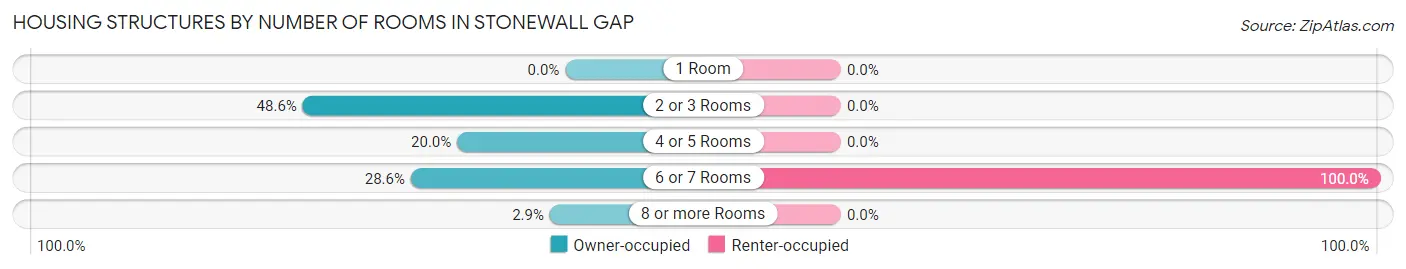
| Number of Rooms | Owner-occupied | Renter-occupied |
| 1 Room | 0 (0.0%) | 0 (0.0%) |
| 2 or 3 Rooms | 17 (48.6%) | 0 (0.0%) |
| 4 or 5 Rooms | 7 (20.0%) | 0 (0.0%) |
| 6 or 7 Rooms | 10 (28.6%) | 20 (100.0%) |
| 8 or more Rooms | 1 (2.9%) | 0 (0.0%) |
| Total | 35 (100.0%) | 20 (100.0%) |
Housing Structure by Heating Type in Stonewall Gap
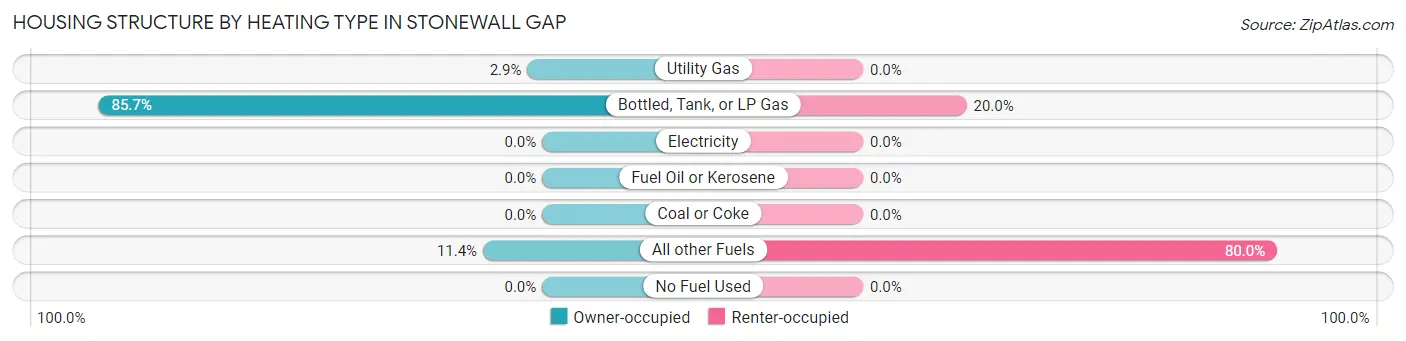
| Heating Type | Owner-occupied | Renter-occupied |
| Utility Gas | 1 (2.9%) | 0 (0.0%) |
| Bottled, Tank, or LP Gas | 30 (85.7%) | 4 (20.0%) |
| Electricity | 0 (0.0%) | 0 (0.0%) |
| Fuel Oil or Kerosene | 0 (0.0%) | 0 (0.0%) |
| Coal or Coke | 0 (0.0%) | 0 (0.0%) |
| All other Fuels | 4 (11.4%) | 16 (80.0%) |
| No Fuel Used | 0 (0.0%) | 0 (0.0%) |
| Total | 35 (100.0%) | 20 (100.0%) |
Household Vehicle Usage in Stonewall Gap
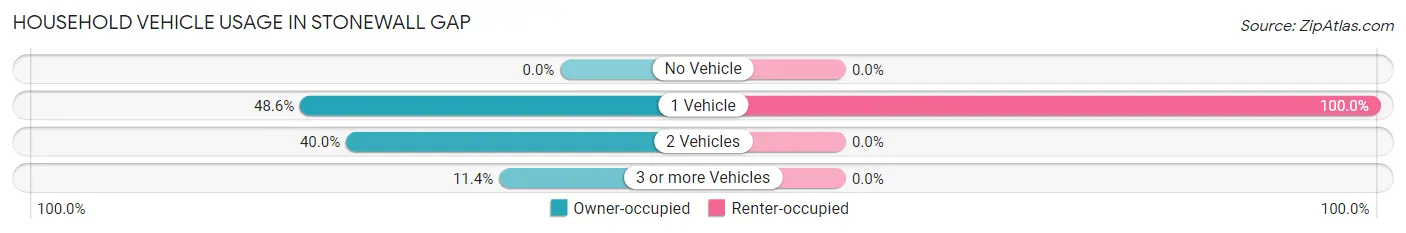
| Vehicles per Household | Owner-occupied | Renter-occupied |
| No Vehicle | 0 (0.0%) | 0 (0.0%) |
| 1 Vehicle | 17 (48.6%) | 20 (100.0%) |
| 2 Vehicles | 14 (40.0%) | 0 (0.0%) |
| 3 or more Vehicles | 4 (11.4%) | 0 (0.0%) |
| Total | 35 (100.0%) | 20 (100.0%) |
Real Estate & Mortgages in Stonewall Gap
Real Estate and Mortgage Overview in Stonewall Gap
| Characteristic | Without Mortgage | With Mortgage |
| Housing Units | 34 | 1 |
| Median Property Value | $280,000 | $0 |
| Median Household Income | $50,000 | $0 |
| Monthly Housing Costs | $338 | $0 |
| Real Estate Taxes | $430 | $0 |
Property Value by Mortgage Status in Stonewall Gap
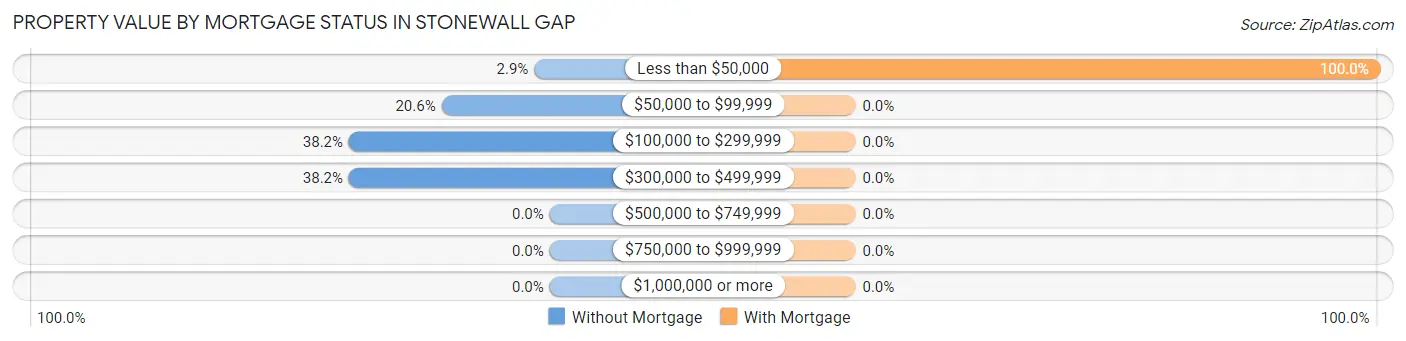
| Property Value | Without Mortgage | With Mortgage |
| Less than $50,000 | 1 (2.9%) | 1 (100.0%) |
| $50,000 to $99,999 | 7 (20.6%) | 0 (0.0%) |
| $100,000 to $299,999 | 13 (38.2%) | 0 (0.0%) |
| $300,000 to $499,999 | 13 (38.2%) | 0 (0.0%) |
| $500,000 to $749,999 | 0 (0.0%) | 0 (0.0%) |
| $750,000 to $999,999 | 0 (0.0%) | 0 (0.0%) |
| $1,000,000 or more | 0 (0.0%) | 0 (0.0%) |
| Total | 34 (100.0%) | 1 (100.0%) |
Household Income by Mortgage Status in Stonewall Gap
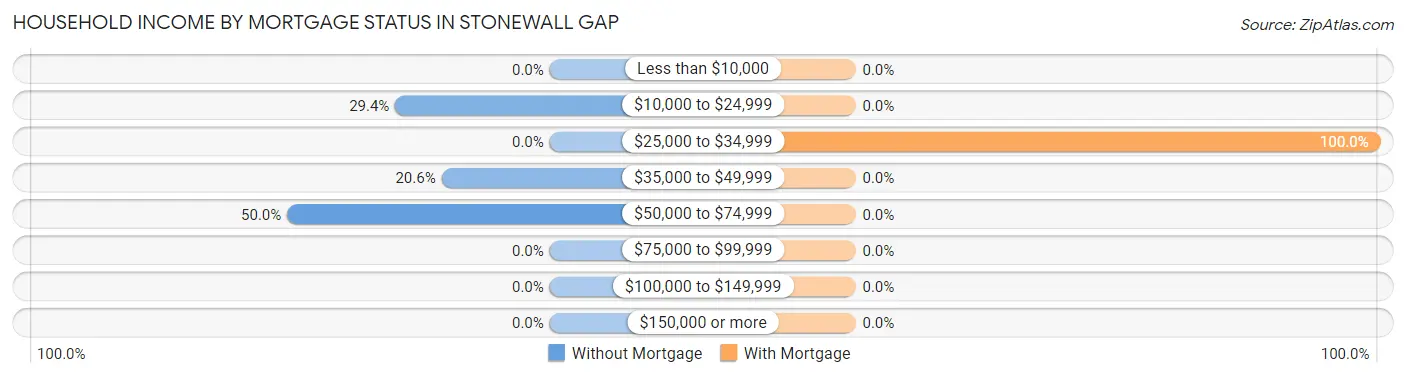
| Household Income | Without Mortgage | With Mortgage |
| Less than $10,000 | 0 (0.0%) | 0 (0.0%) |
| $10,000 to $24,999 | 10 (29.4%) | 0 (0.0%) |
| $25,000 to $34,999 | 0 (0.0%) | 1 (100.0%) |
| $35,000 to $49,999 | 7 (20.6%) | 0 (0.0%) |
| $50,000 to $74,999 | 17 (50.0%) | 0 (0.0%) |
| $75,000 to $99,999 | 0 (0.0%) | 0 (0.0%) |
| $100,000 to $149,999 | 0 (0.0%) | 0 (0.0%) |
| $150,000 or more | 0 (0.0%) | 0 (0.0%) |
| Total | 34 (100.0%) | 1 (100.0%) |
Property Value to Household Income Ratio in Stonewall Gap
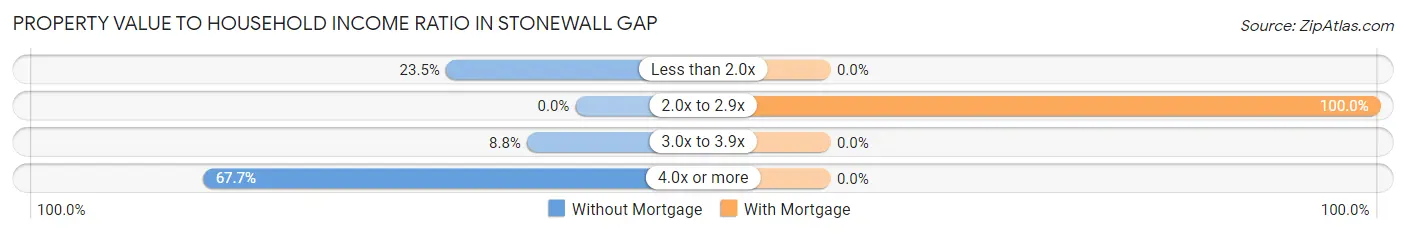
| Value-to-Income Ratio | Without Mortgage | With Mortgage |
| Less than 2.0x | 8 (23.5%) | 0 (0.0%) |
| 2.0x to 2.9x | 0 (0.0%) | 1 (100.0%) |
| 3.0x to 3.9x | 3 (8.8%) | 0 (0.0%) |
| 4.0x or more | 23 (67.6%) | 0 (0.0%) |
| Total | 34 (100.0%) | 1 (100.0%) |
Real Estate Taxes by Mortgage Status in Stonewall Gap
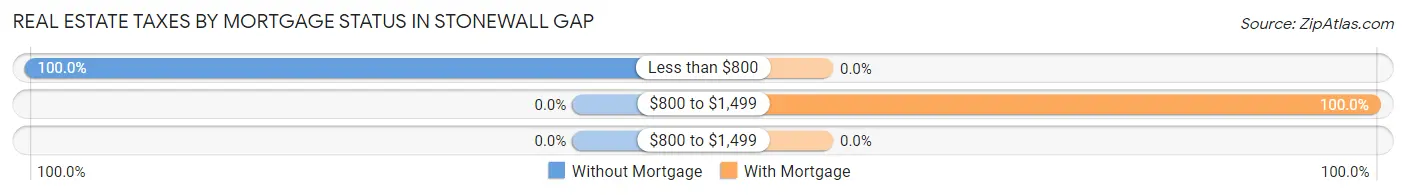
| Property Taxes | Without Mortgage | With Mortgage |
| Less than $800 | 34 (100.0%) | 0 (0.0%) |
| $800 to $1,499 | 0 (0.0%) | 1 (100.0%) |
| $800 to $1,499 | 0 (0.0%) | 0 (0.0%) |
| Total | 34 (100.0%) | 1 (100.0%) |
Health & Disability in Stonewall Gap
Health Insurance Coverage by Age in Stonewall Gap
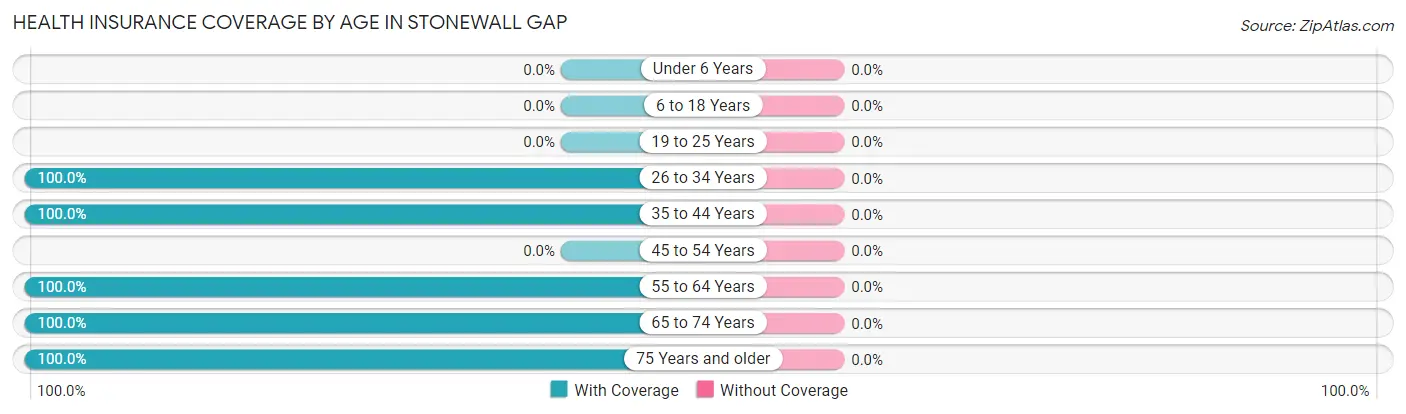
| Age Bracket | With Coverage | Without Coverage |
| Under 6 Years | 0 (0.0%) | 0 (0.0%) |
| 6 to 18 Years | 0 (0.0%) | 0 (0.0%) |
| 19 to 25 Years | 0 (0.0%) | 0 (0.0%) |
| 26 to 34 Years | 1 (100.0%) | 0 (0.0%) |
| 35 to 44 Years | 3 (100.0%) | 0 (0.0%) |
| 45 to 54 Years | 0 (0.0%) | 0 (0.0%) |
| 55 to 64 Years | 6 (100.0%) | 0 (0.0%) |
| 65 to 74 Years | 64 (100.0%) | 0 (0.0%) |
| 75 Years and older | 21 (100.0%) | 0 (0.0%) |
| Total | 95 (100.0%) | 0 (0.0%) |
Health Insurance Coverage by Citizenship Status in Stonewall Gap
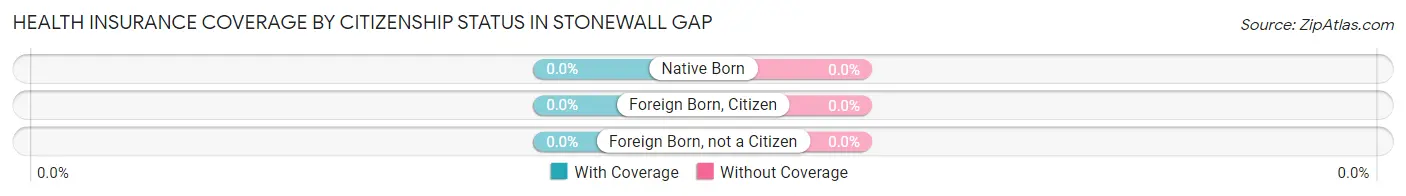
| Citizenship Status | With Coverage | Without Coverage |
| Native Born | 0 (0.0%) | 0 (0.0%) |
| Foreign Born, Citizen | 0 (0.0%) | 0 (0.0%) |
| Foreign Born, not a Citizen | 0 (0.0%) | 0 (0.0%) |
Health Insurance Coverage by Household Income in Stonewall Gap
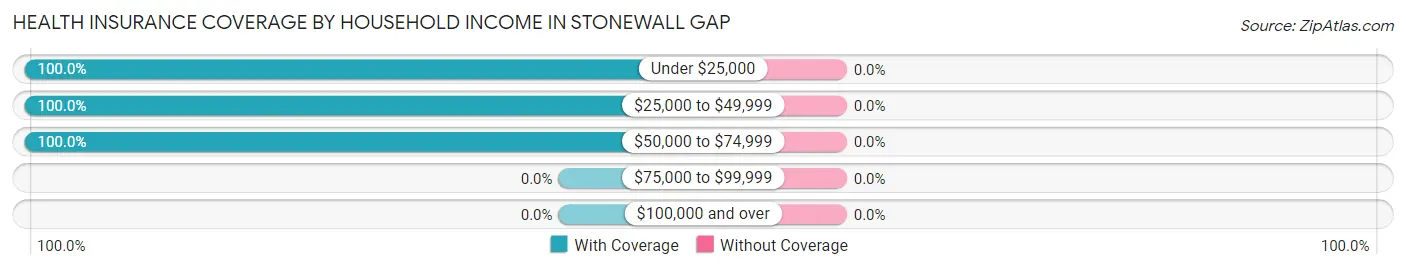
| Household Income | With Coverage | Without Coverage |
| Under $25,000 | 43 (100.0%) | 0 (0.0%) |
| $25,000 to $49,999 | 27 (100.0%) | 0 (0.0%) |
| $50,000 to $74,999 | 25 (100.0%) | 0 (0.0%) |
| $75,000 to $99,999 | 0 (0.0%) | 0 (0.0%) |
| $100,000 and over | 0 (0.0%) | 0 (0.0%) |
Public vs Private Health Insurance Coverage by Age in Stonewall Gap
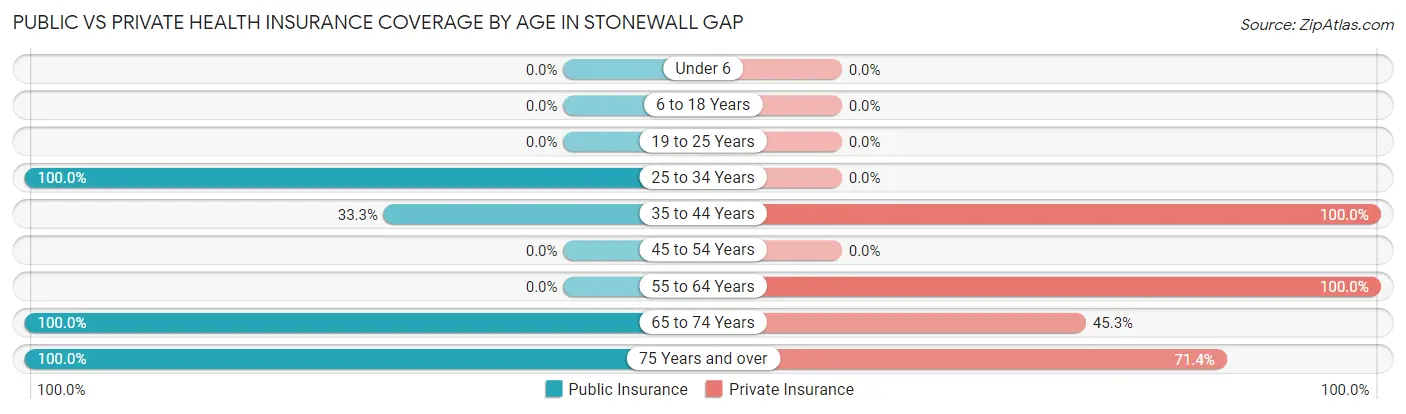
| Age Bracket | Public Insurance | Private Insurance |
| Under 6 | 0 (0.0%) | 0 (0.0%) |
| 6 to 18 Years | 0 (0.0%) | 0 (0.0%) |
| 19 to 25 Years | 0 (0.0%) | 0 (0.0%) |
| 25 to 34 Years | 1 (100.0%) | 0 (0.0%) |
| 35 to 44 Years | 1 (33.3%) | 3 (100.0%) |
| 45 to 54 Years | 0 (0.0%) | 0 (0.0%) |
| 55 to 64 Years | 0 (0.0%) | 6 (100.0%) |
| 65 to 74 Years | 64 (100.0%) | 29 (45.3%) |
| 75 Years and over | 21 (100.0%) | 15 (71.4%) |
| Total | 87 (91.6%) | 53 (55.8%) |
Disability Status by Sex by Age in Stonewall Gap
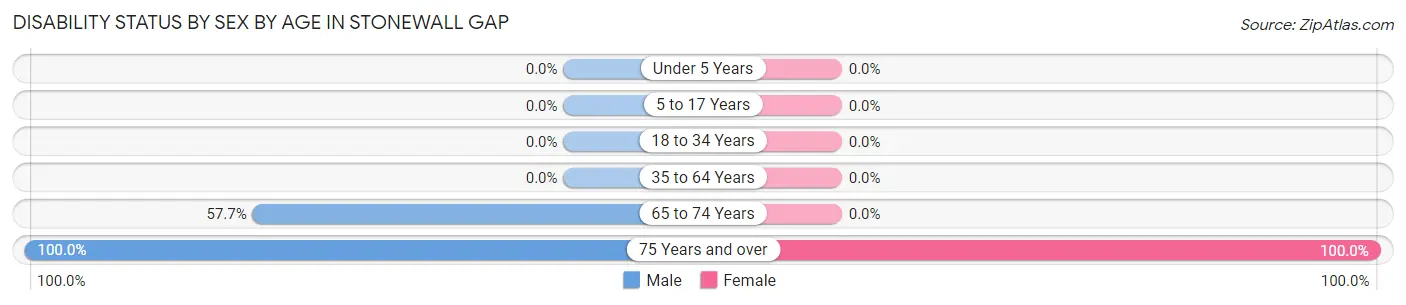
| Age Bracket | Male | Female |
| Under 5 Years | 0 (0.0%) | 0 (0.0%) |
| 5 to 17 Years | 0 (0.0%) | 0 (0.0%) |
| 18 to 34 Years | 0 (0.0%) | 0 (0.0%) |
| 35 to 64 Years | 0 (0.0%) | 0 (0.0%) |
| 65 to 74 Years | 15 (57.7%) | 0 (0.0%) |
| 75 Years and over | 6 (100.0%) | 15 (100.0%) |
Disability Class by Sex by Age in Stonewall Gap
Disability Class: Hearing Difficulty
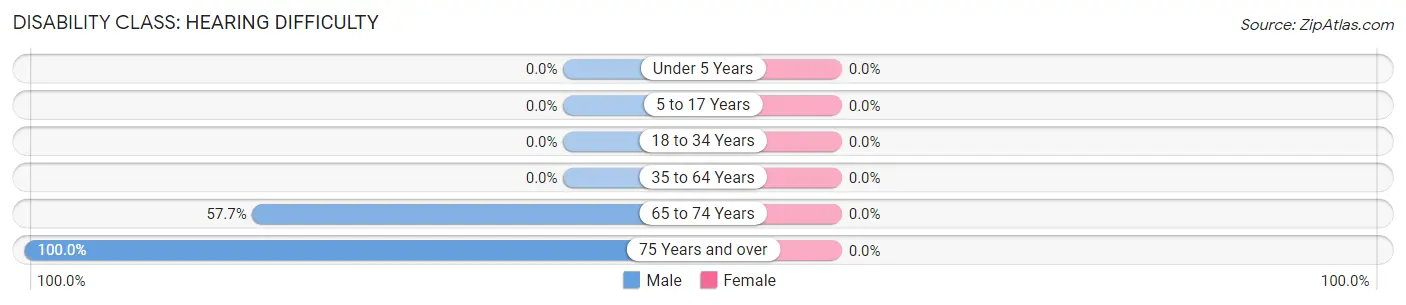
| Age Bracket | Male | Female |
| Under 5 Years | 0 (0.0%) | 0 (0.0%) |
| 5 to 17 Years | 0 (0.0%) | 0 (0.0%) |
| 18 to 34 Years | 0 (0.0%) | 0 (0.0%) |
| 35 to 64 Years | 0 (0.0%) | 0 (0.0%) |
| 65 to 74 Years | 15 (57.7%) | 0 (0.0%) |
| 75 Years and over | 6 (100.0%) | 0 (0.0%) |
Disability Class: Vision Difficulty
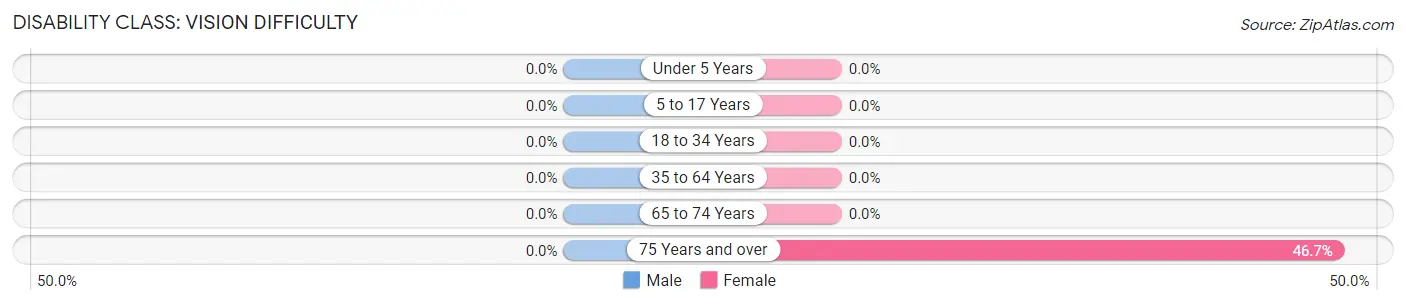
| Age Bracket | Male | Female |
| Under 5 Years | 0 (0.0%) | 0 (0.0%) |
| 5 to 17 Years | 0 (0.0%) | 0 (0.0%) |
| 18 to 34 Years | 0 (0.0%) | 0 (0.0%) |
| 35 to 64 Years | 0 (0.0%) | 0 (0.0%) |
| 65 to 74 Years | 0 (0.0%) | 0 (0.0%) |
| 75 Years and over | 0 (0.0%) | 7 (46.7%) |
Disability Class: Cognitive Difficulty
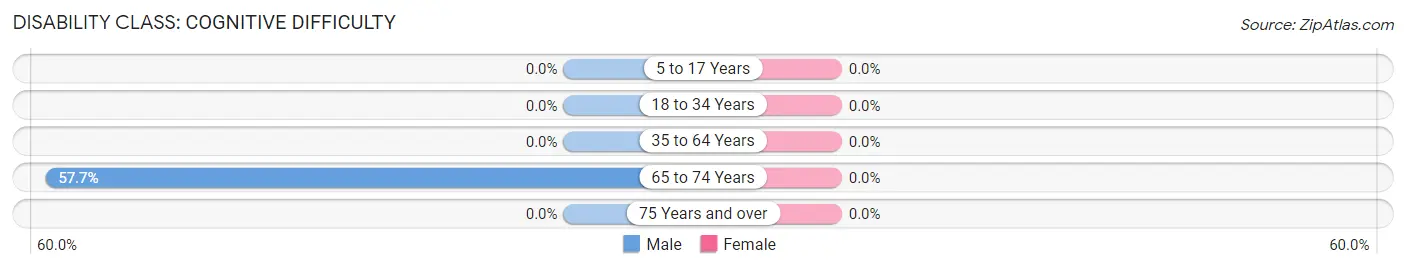
| Age Bracket | Male | Female |
| 5 to 17 Years | 0 (0.0%) | 0 (0.0%) |
| 18 to 34 Years | 0 (0.0%) | 0 (0.0%) |
| 35 to 64 Years | 0 (0.0%) | 0 (0.0%) |
| 65 to 74 Years | 15 (57.7%) | 0 (0.0%) |
| 75 Years and over | 0 (0.0%) | 0 (0.0%) |
Disability Class: Ambulatory Difficulty
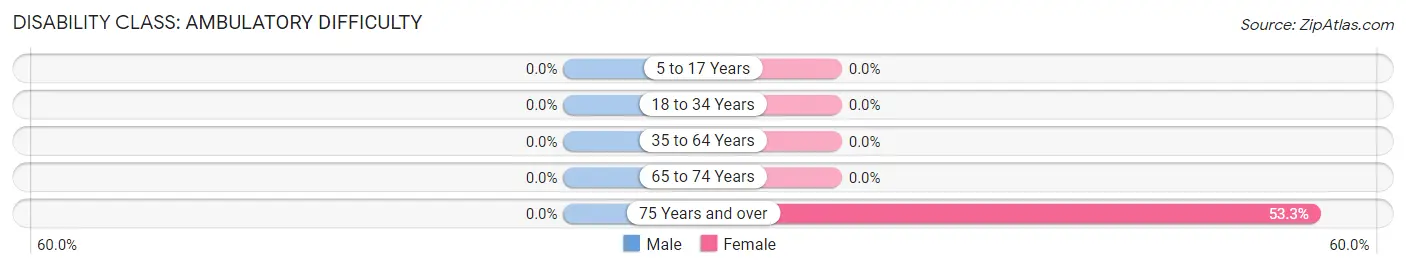
| Age Bracket | Male | Female |
| 5 to 17 Years | 0 (0.0%) | 0 (0.0%) |
| 18 to 34 Years | 0 (0.0%) | 0 (0.0%) |
| 35 to 64 Years | 0 (0.0%) | 0 (0.0%) |
| 65 to 74 Years | 0 (0.0%) | 0 (0.0%) |
| 75 Years and over | 0 (0.0%) | 8 (53.3%) |
Disability Class: Self-Care Difficulty
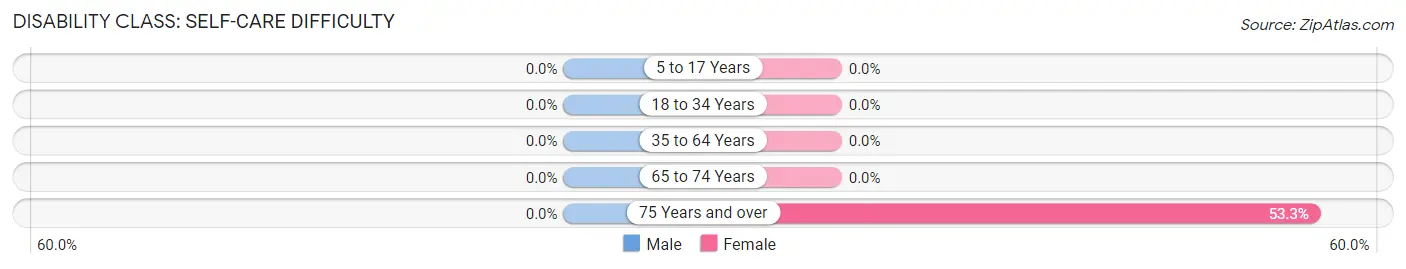
| Age Bracket | Male | Female |
| 5 to 17 Years | 0 (0.0%) | 0 (0.0%) |
| 18 to 34 Years | 0 (0.0%) | 0 (0.0%) |
| 35 to 64 Years | 0 (0.0%) | 0 (0.0%) |
| 65 to 74 Years | 0 (0.0%) | 0 (0.0%) |
| 75 Years and over | 0 (0.0%) | 8 (53.3%) |
Technology Access in Stonewall Gap
Computing Device Access in Stonewall Gap
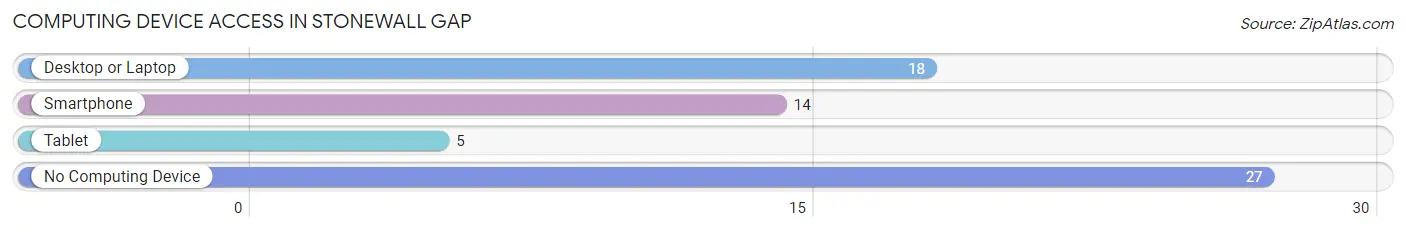
| Device Type | # Households | % Households |
| Desktop or Laptop | 18 | 32.7% |
| Smartphone | 14 | 25.5% |
| Tablet | 5 | 9.1% |
| No Computing Device | 27 | 49.1% |
| Total | 55 | 100.0% |
Internet Access in Stonewall Gap
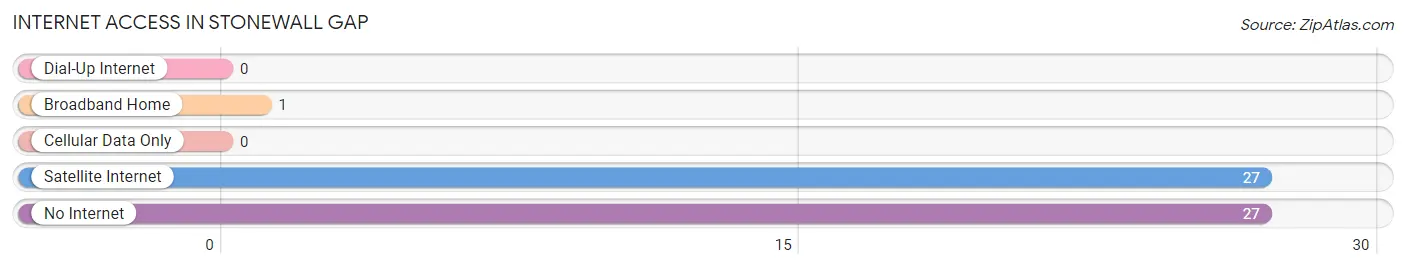
| Internet Type | # Households | % Households |
| Dial-Up Internet | 0 | 0.0% |
| Broadband Home | 1 | 1.8% |
| Cellular Data Only | 0 | 0.0% |
| Satellite Internet | 27 | 49.1% |
| No Internet | 27 | 49.1% |
| Total | 55 | 100.0% |
Stonewall Gap Summary
Stonewall Gap is a small unincorporated community located in the San Luis Valley of Colorado. It is situated in the northern part of the valley, approximately 20 miles south of Alamosa and 40 miles north of Monte Vista. The community is located at an elevation of 7,890 feet and is surrounded by the Sangre de Cristo Mountains to the east and the San Juan Mountains to the west.
History
Stonewall Gap was first settled in the late 1800s by homesteaders who were attracted to the area by its fertile soil and abundant water. The community was named after a nearby mountain pass, which was used by Native Americans and early settlers to cross the Sangre de Cristo Mountains. The pass was named after a large boulder that was said to resemble a stonewall.
The first post office in Stonewall Gap was established in 1891 and the community was officially incorporated in 1895. The town grew slowly but steadily over the next few decades, and by the 1930s it had a population of around 200 people.
Geography
Stonewall Gap is located in the San Luis Valley, which is a large intermontane basin located in south-central Colorado. The valley is surrounded by the Sangre de Cristo Mountains to the east and the San Juan Mountains to the west. The valley is approximately 8,000 feet above sea level and is the largest alpine valley in the world.
The climate in Stonewall Gap is semi-arid, with hot summers and cold winters. The average annual precipitation is around 12 inches, with most of it falling in the form of snow. The average high temperature in July is around 80 degrees Fahrenheit, while the average low temperature in January is around 10 degrees Fahrenheit.
Economy
The economy of Stonewall Gap is largely based on agriculture and tourism. The town is home to several small farms that produce hay, alfalfa, and other crops. The town is also a popular destination for tourists, who come to enjoy the area’s natural beauty and outdoor activities.
The town is home to several small businesses, including a general store, a gas station, and a few restaurants. There is also a small airport located nearby, which serves as a hub for private and commercial flights.
Demographics
As of the 2010 census, the population of Stonewall Gap was 545 people. The racial makeup of the town was 95.3% White, 0.7% Native American, 0.2% Asian, 0.2% from other races, and 3.6% from two or more races. The median household income was $37,500 and the median family income was $41,250.
Conclusion
Stonewall Gap is a small unincorporated community located in the San Luis Valley of Colorado. It is situated in the northern part of the valley, approximately 20 miles south of Alamosa and 40 miles north of Monte Vista. The community is located at an elevation of 7,890 feet and is surrounded by the Sangre de Cristo Mountains to the east and the San Juan Mountains to the west. The economy of Stonewall Gap is largely based on agriculture and tourism, and the town is home to several small businesses. As of the 2010 census, the population of Stonewall Gap was 545 people.
Common Questions
What is Per Capita Income in Stonewall Gap?
Per Capita income in Stonewall Gap is $21,169.
What is Inequality or Gini Index in Stonewall Gap?
Inequality or Gini Index in Stonewall Gap is 0.31.
What is the Total Population of Stonewall Gap?
Total Population of Stonewall Gap is 95.
What is the Total Male Population of Stonewall Gap?
Total Male Population of Stonewall Gap is 36.
What is the Total Female Population of Stonewall Gap?
Total Female Population of Stonewall Gap is 59.
What is the Ratio of Males per 100 Females in Stonewall Gap?
There are 61.02 Males per 100 Females in Stonewall Gap.
What is the Ratio of Females per 100 Males in Stonewall Gap?
There are 163.89 Females per 100 Males in Stonewall Gap.
What is the Median Population Age in Stonewall Gap?
Median Population Age in Stonewall Gap is 72.4 Years.
What is the Average Family Size in Stonewall Gap
Average Family Size in Stonewall Gap is 2.0 People.
What is the Average Household Size in Stonewall Gap
Average Household Size in Stonewall Gap is 1.7 People.
How Large is the Labor Force in Stonewall Gap?
There are 12 People in the Labor Forcein in Stonewall Gap.
What is the Percentage of People in the Labor Force in Stonewall Gap?
12.6% of People are in the Labor Force in Stonewall Gap.
What is the Unemployment Rate in Stonewall Gap?
Unemployment Rate in Stonewall Gap is 8.3%.