Cardiff, AL Map & Demographics
Cardiff Map
Cardiff Overview
$22,423
PER CAPITA INCOME
$123,750
AVG FAMILY INCOME
0.50
INEQUALITY / GINI INDEX
26
TOTAL POPULATION
16
MALE POPULATION
10
FEMALE POPULATION
160.00
MALES / 100 FEMALES
62.50
FEMALES / 100 MALES
38.5
MEDIAN AGE
4.5
AVG FAMILY SIZE
2.6
AVG HOUSEHOLD SIZE
14
LABOR FORCE [ PEOPLE ]
70.0%
PERCENT IN LABOR FORCE
Cardiff Area Codes
Income in Cardiff
Income Overview in Cardiff
| Characteristic | Number | Measure |
| Per Capita Income | 26 | $22,423 |
| Median Family Income | 4 | $123,750 |
| Mean Family Income | 4 | $119,325 |
| Median Household Income | 10 | $0 |
| Mean Household Income | 10 | $55,930 |
| Income Deficit | 4 | $0 |
| Wage / Income Gap (%) | 26 | 0.00% |
| Wage / Income Gap ($) | 26 | 100.00¢ per $1 |
| Gini / Inequality Index | 26 | 0.50 |
Earnings by Sex in Cardiff
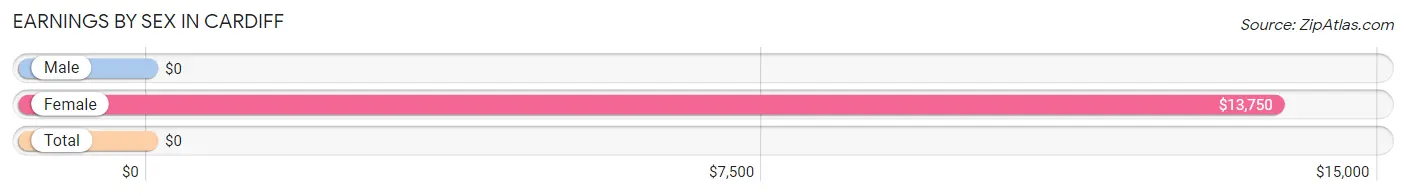
| Sex | Number | Average Earnings |
| Male | 8 (57.1%) | $0 |
| Female | 6 (42.9%) | $13,750 |
| Total | 14 (100.0%) | $0 |
Earnings by Sex by Income Bracket in Cardiff
The most common earnings brackets in Cardiff are $10,000 to $12,499 for men (2 | 25.0%) and $12,500 to $14,999 for women (4 | 66.7%).
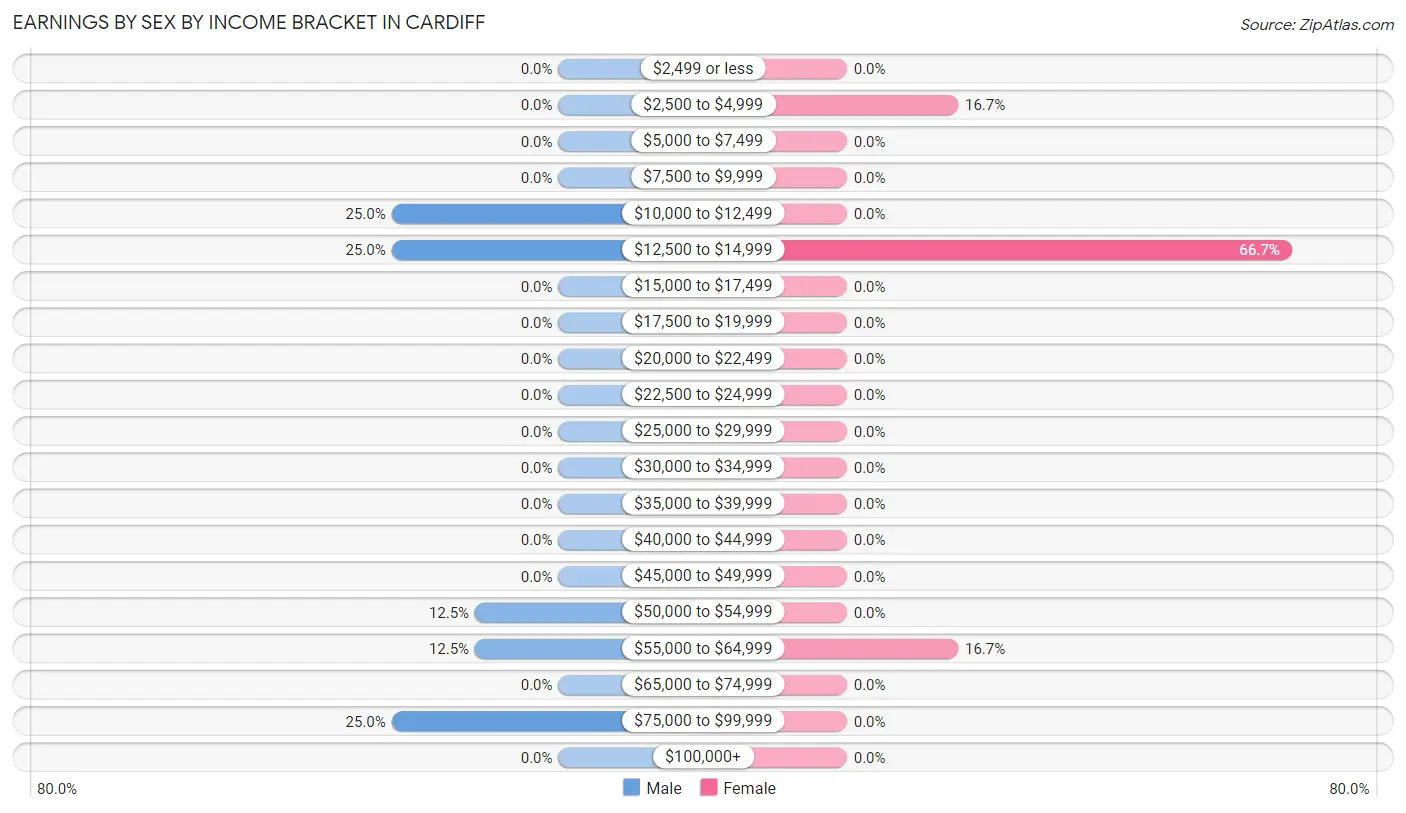
| Income | Male | Female |
| $2,499 or less | 0 (0.0%) | 0 (0.0%) |
| $2,500 to $4,999 | 0 (0.0%) | 1 (16.7%) |
| $5,000 to $7,499 | 0 (0.0%) | 0 (0.0%) |
| $7,500 to $9,999 | 0 (0.0%) | 0 (0.0%) |
| $10,000 to $12,499 | 2 (25.0%) | 0 (0.0%) |
| $12,500 to $14,999 | 2 (25.0%) | 4 (66.7%) |
| $15,000 to $17,499 | 0 (0.0%) | 0 (0.0%) |
| $17,500 to $19,999 | 0 (0.0%) | 0 (0.0%) |
| $20,000 to $22,499 | 0 (0.0%) | 0 (0.0%) |
| $22,500 to $24,999 | 0 (0.0%) | 0 (0.0%) |
| $25,000 to $29,999 | 0 (0.0%) | 0 (0.0%) |
| $30,000 to $34,999 | 0 (0.0%) | 0 (0.0%) |
| $35,000 to $39,999 | 0 (0.0%) | 0 (0.0%) |
| $40,000 to $44,999 | 0 (0.0%) | 0 (0.0%) |
| $45,000 to $49,999 | 0 (0.0%) | 0 (0.0%) |
| $50,000 to $54,999 | 1 (12.5%) | 0 (0.0%) |
| $55,000 to $64,999 | 1 (12.5%) | 1 (16.7%) |
| $65,000 to $74,999 | 0 (0.0%) | 0 (0.0%) |
| $75,000 to $99,999 | 2 (25.0%) | 0 (0.0%) |
| $100,000+ | 0 (0.0%) | 0 (0.0%) |
| Total | 8 (100.0%) | 6 (100.0%) |
Earnings by Sex by Educational Attainment in Cardiff
| Educational Attainment | Male Income | Female Income |
| Less than High School | - | - |
| High School Diploma | - | - |
| College or Associate's Degree | - | - |
| Bachelor's Degree | - | - |
| Graduate Degree | - | - |
| Total | - | - |
Family Income in Cardiff
Family Income Brackets in Cardiff
According to the Cardiff family income data, there are 3 families falling into the $100,000 to $149,999 income range, which is the most common income bracket and makes up 75.0% of all families.
| Income Bracket | # Families | % Families |
| Less than $10,000 | 0 | 0.0% |
| $10,000 to $14,999 | 0 | 0.0% |
| $15,000 to $24,999 | 0 | 0.0% |
| $25,000 to $34,999 | 0 | 0.0% |
| $35,000 to $49,999 | 0 | 0.0% |
| $50,000 to $74,999 | 0 | 0.0% |
| $75,000 to $99,999 | 1 | 25.0% |
| $100,000 to $149,999 | 3 | 75.0% |
| $150,000 to $199,999 | 0 | 0.0% |
| $200,000+ | 0 | 0.0% |
Family Income by Famaliy Size in Cardiff
| Income Bracket | # Families | Median Income |
| 2-Person Families | 1 (25.0%) | $0 |
| 3-Person Families | 0 (0.0%) | $0 |
| 4-Person Families | 0 (0.0%) | $0 |
| 5-Person Families | 3 (75.0%) | $0 |
| 6-Person Families | 0 (0.0%) | $0 |
| 7+ Person Families | 0 (0.0%) | $0 |
| Total | 4 (100.0%) | $123,750 |
Family Income by Number of Earners in Cardiff
| Number of Earners | # Families | Median Income |
| No Earners | 0 (0.0%) | $0 |
| 1 Earner | 1 (25.0%) | $0 |
| 2 Earners | 1 (25.0%) | $0 |
| 3+ Earners | 2 (50.0%) | $0 |
| Total | 4 (100.0%) | $123,750 |
Household Income in Cardiff
Household Income Brackets in Cardiff
With 3 households falling in the category, the $100,000 to $149,999 income range is the most frequent in Cardiff, accounting for 30.0% of all households.
| Income Bracket | # Households | % Households |
| Less than $10,000 | 2 | 20.0% |
| $10,000 to $14,999 | 2 | 20.0% |
| $15,000 to $24,999 | 1 | 10.0% |
| $25,000 to $34,999 | 1 | 10.0% |
| $35,000 to $49,999 | 0 | 0.0% |
| $50,000 to $74,999 | 0 | 0.0% |
| $75,000 to $99,999 | 1 | 10.0% |
| $100,000 to $149,999 | 3 | 30.0% |
| $150,000 to $199,999 | 0 | 0.0% |
| $200,000+ | 0 | 0.0% |
Household Income by Householder Age in Cardiff
The median household income in Cardiff is $0, with the highest median household income of $10,625 found in the 45 to 64 years age bracket for the primary householder. A total of 5 households (50.0%) fall into this category.
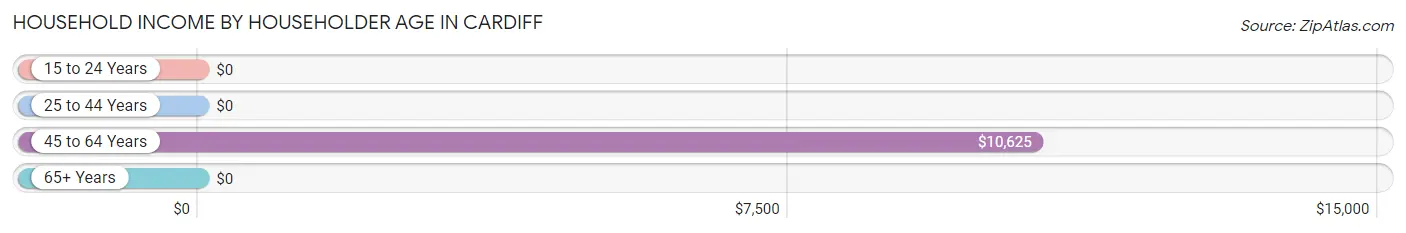
| Income Bracket | # Households | Median Income |
| 15 to 24 Years | 0 (0.0%) | $0 |
| 25 to 44 Years | 4 (40.0%) | $0 |
| 45 to 64 Years | 5 (50.0%) | $10,625 |
| 65+ Years | 1 (10.0%) | $0 |
| Total | 10 (100.0%) | $0 |
Poverty in Cardiff
Income Below Poverty by Sex and Age in Cardiff
With 31.2% poverty level for males and 20.0% for females among the residents of Cardiff, 45 to 54 year old males and 25 to 34 year old females are the most vulnerable to poverty, with 1 males (100.0%) and 1 females (100.0%) in their respective age groups living below the poverty level.
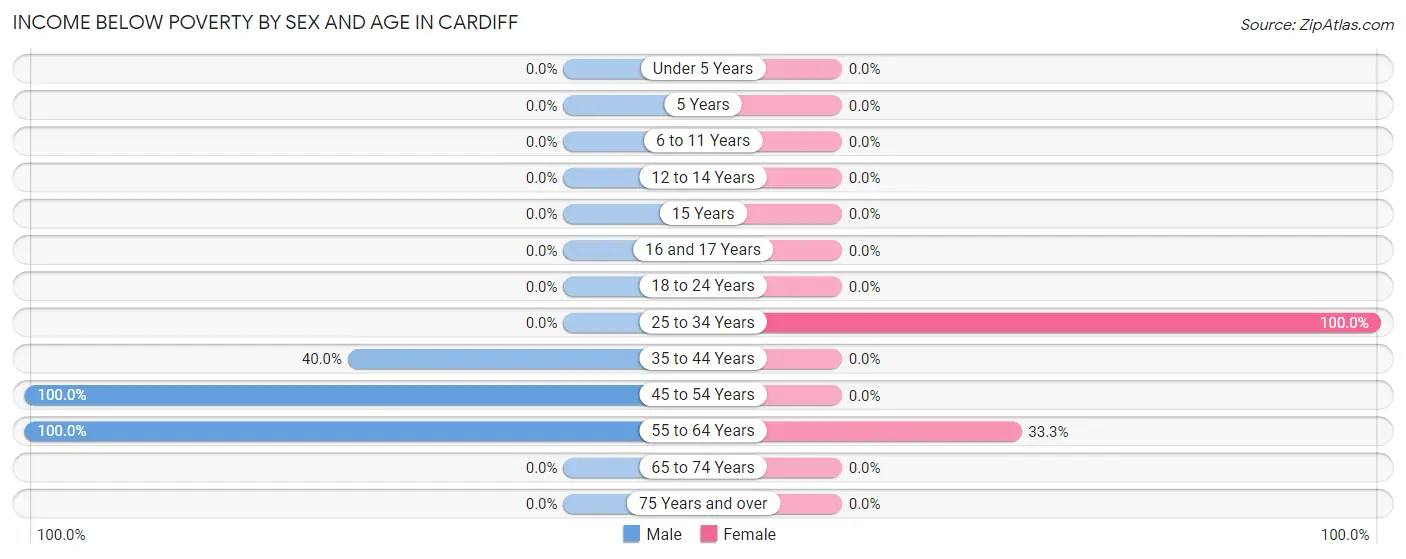
| Age Bracket | Male | Female |
| Under 5 Years | 0 (0.0%) | 0 (0.0%) |
| 5 Years | 0 (0.0%) | 0 (0.0%) |
| 6 to 11 Years | 0 (0.0%) | 0 (0.0%) |
| 12 to 14 Years | 0 (0.0%) | 0 (0.0%) |
| 15 Years | 0 (0.0%) | 0 (0.0%) |
| 16 and 17 Years | 0 (0.0%) | 0 (0.0%) |
| 18 to 24 Years | 0 (0.0%) | 0 (0.0%) |
| 25 to 34 Years | 0 (0.0%) | 1 (100.0%) |
| 35 to 44 Years | 2 (40.0%) | 0 (0.0%) |
| 45 to 54 Years | 1 (100.0%) | 0 (0.0%) |
| 55 to 64 Years | 2 (100.0%) | 1 (33.3%) |
| 65 to 74 Years | 0 (0.0%) | 0 (0.0%) |
| 75 Years and over | 0 (0.0%) | 0 (0.0%) |
| Total | 5 (31.2%) | 2 (20.0%) |
Income Above Poverty by Sex and Age in Cardiff
According to the poverty statistics in Cardiff, males aged 5 years and females aged 5 years are the age groups that are most secure financially, with 100.0% of males and 100.0% of females in these age groups living above the poverty line.
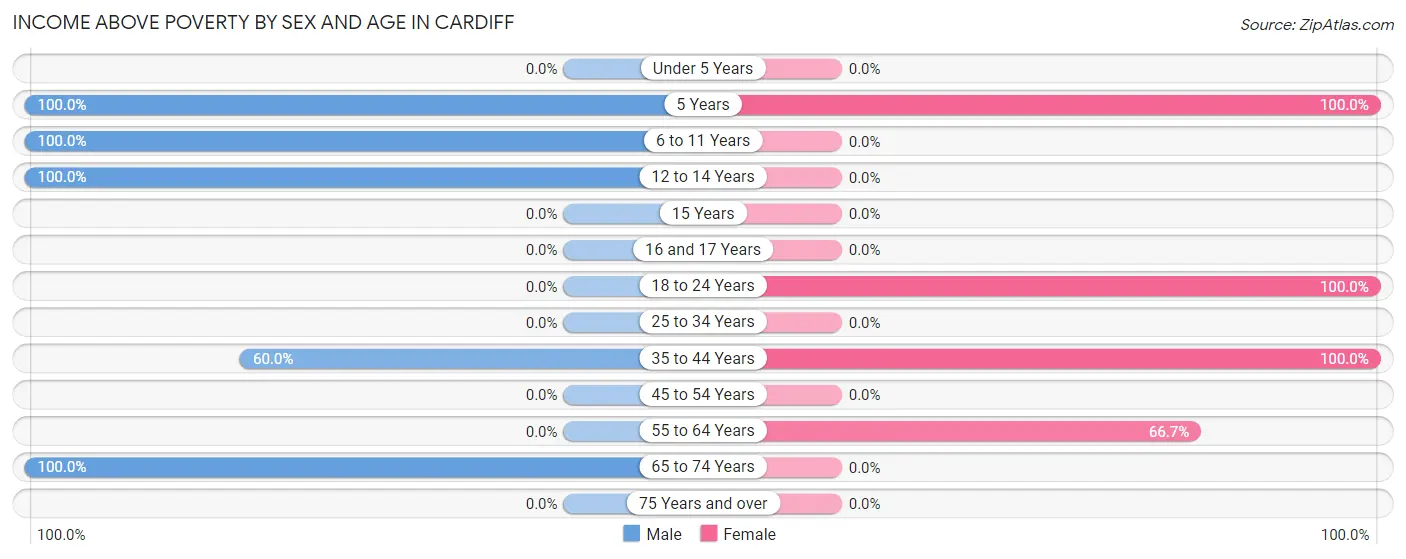
| Age Bracket | Male | Female |
| Under 5 Years | 0 (0.0%) | 0 (0.0%) |
| 5 Years | 1 (100.0%) | 1 (100.0%) |
| 6 to 11 Years | 2 (100.0%) | 0 (0.0%) |
| 12 to 14 Years | 2 (100.0%) | 0 (0.0%) |
| 15 Years | 0 (0.0%) | 0 (0.0%) |
| 16 and 17 Years | 0 (0.0%) | 0 (0.0%) |
| 18 to 24 Years | 0 (0.0%) | 3 (100.0%) |
| 25 to 34 Years | 0 (0.0%) | 0 (0.0%) |
| 35 to 44 Years | 3 (60.0%) | 2 (100.0%) |
| 45 to 54 Years | 0 (0.0%) | 0 (0.0%) |
| 55 to 64 Years | 0 (0.0%) | 2 (66.7%) |
| 65 to 74 Years | 3 (100.0%) | 0 (0.0%) |
| 75 Years and over | 0 (0.0%) | 0 (0.0%) |
| Total | 11 (68.8%) | 8 (80.0%) |
Income Below Poverty Among Married-Couple Families in Cardiff
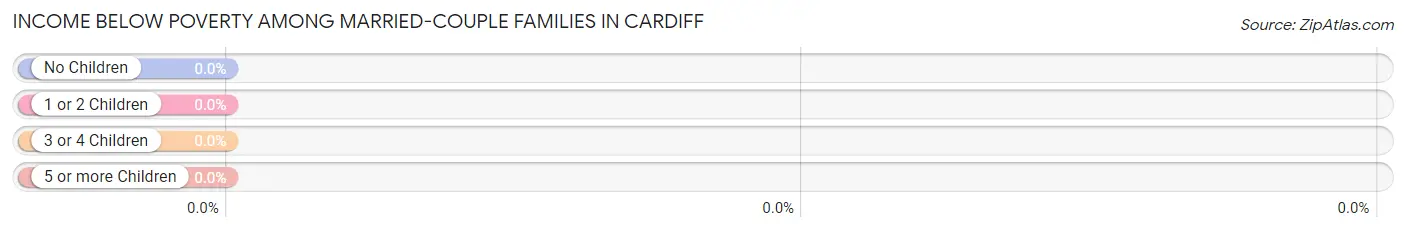
| Children | Above Poverty | Below Poverty |
| No Children | 1 (100.0%) | 0 (0.0%) |
| 1 or 2 Children | 2 (100.0%) | 0 (0.0%) |
| 3 or 4 Children | 1 (100.0%) | 0 (0.0%) |
| 5 or more Children | 0 (0.0%) | 0 (0.0%) |
| Total | 4 (100.0%) | 0 (0.0%) |
Income Below Poverty Among Single-Parent Households in Cardiff
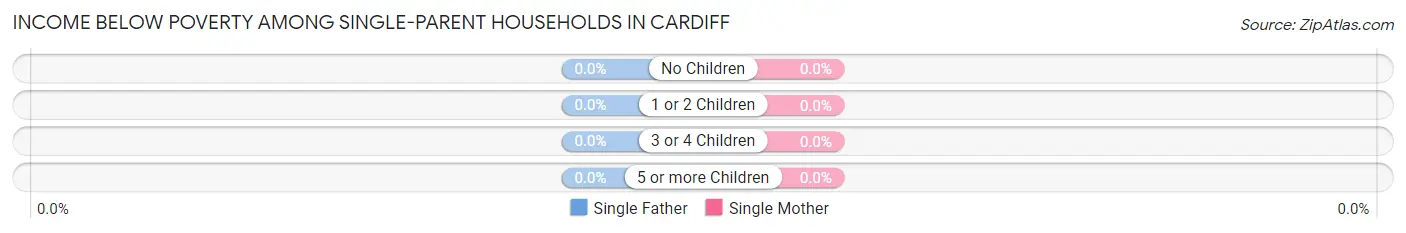
| Children | Single Father | Single Mother |
| No Children | 0 (0.0%) | 0 (0.0%) |
| 1 or 2 Children | 0 (0.0%) | 0 (0.0%) |
| 3 or 4 Children | 0 (0.0%) | 0 (0.0%) |
| 5 or more Children | 0 (0.0%) | 0 (0.0%) |
| Total | 0 (0.0%) | 0 (0.0%) |
Income Below Poverty Among Married-Couple vs Single-Parent Households in Cardiff
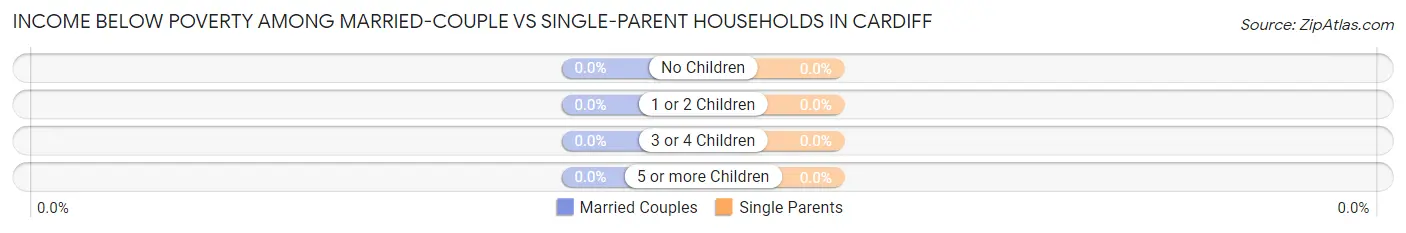
| Children | Married-Couple Families | Single-Parent Households |
| No Children | 0 (0.0%) | 0 (0.0%) |
| 1 or 2 Children | 0 (0.0%) | 0 (0.0%) |
| 3 or 4 Children | 0 (0.0%) | 0 (0.0%) |
| 5 or more Children | 0 (0.0%) | 0 (0.0%) |
| Total | 0 (0.0%) | 0 (0.0%) |
Race in Cardiff
The most populous races in Cardiff are , and White / Caucasian (26 | 100.0%).
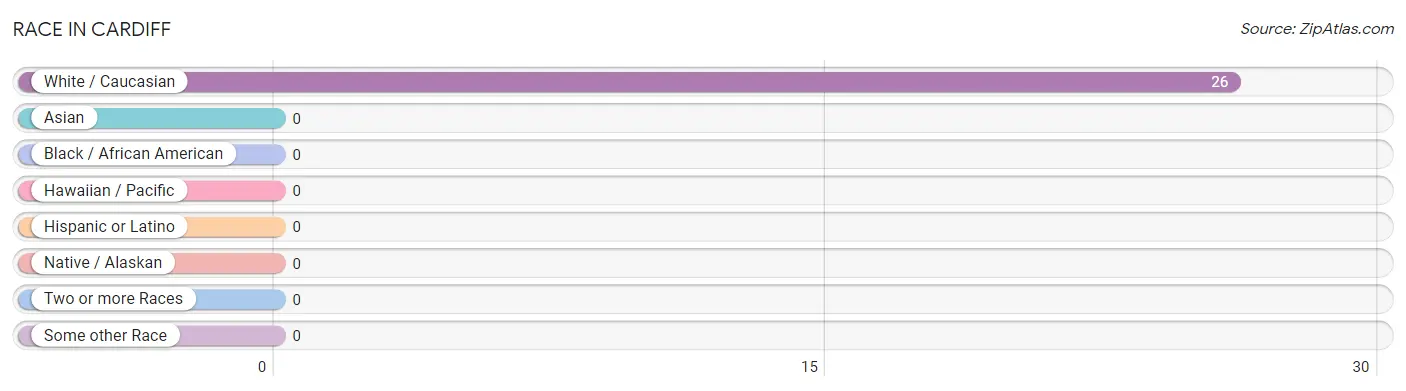
| Race | # Population | % Population |
| Asian | 0 | 0.0% |
| Black / African American | 0 | 0.0% |
| Hawaiian / Pacific | 0 | 0.0% |
| Hispanic or Latino | 0 | 0.0% |
| Native / Alaskan | 0 | 0.0% |
| White / Caucasian | 26 | 100.0% |
| Two or more Races | 0 | 0.0% |
| Some other Race | 0 | 0.0% |
| Total | 26 | 100.0% |
Ancestry in Cardiff
The most populous ancestries reported in Cardiff are German (6 | 23.1%), Italian (5 | 19.2%), American (3 | 11.5%), Irish (3 | 11.5%), and English (1 | 3.8%), together accounting for 69.2% of all Cardiff residents.
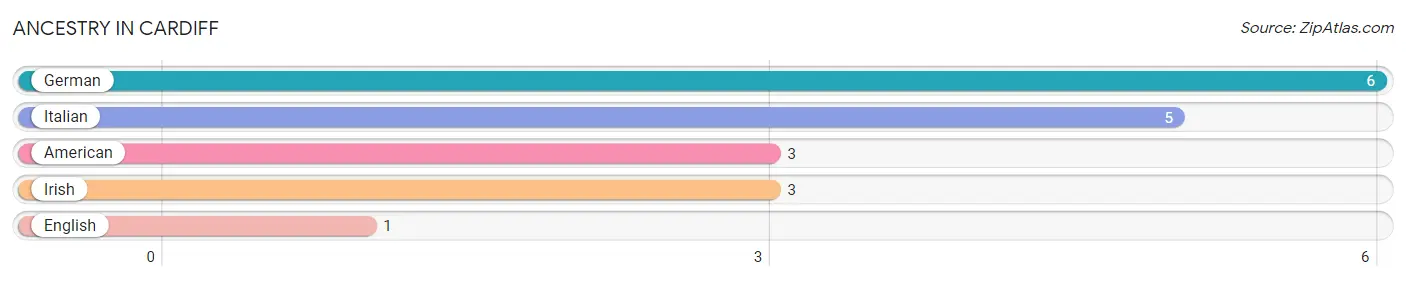
| Ancestry | # Population | % Population |
| American | 3 | 11.5% |
| English | 1 | 3.8% |
| German | 6 | 23.1% |
| Irish | 3 | 11.5% |
| Italian | 5 | 19.2% | View All 5 Rows |
Immigrants in Cardiff

| Immigration Origin | # Population | % Population | View All 0 Rows |
Sex and Age in Cardiff
Sex and Age in Cardiff
The most populous age groups in Cardiff are 10 to 14 Years (4 | 25.0%) for men and 15 to 19 Years (3 | 30.0%) for women.
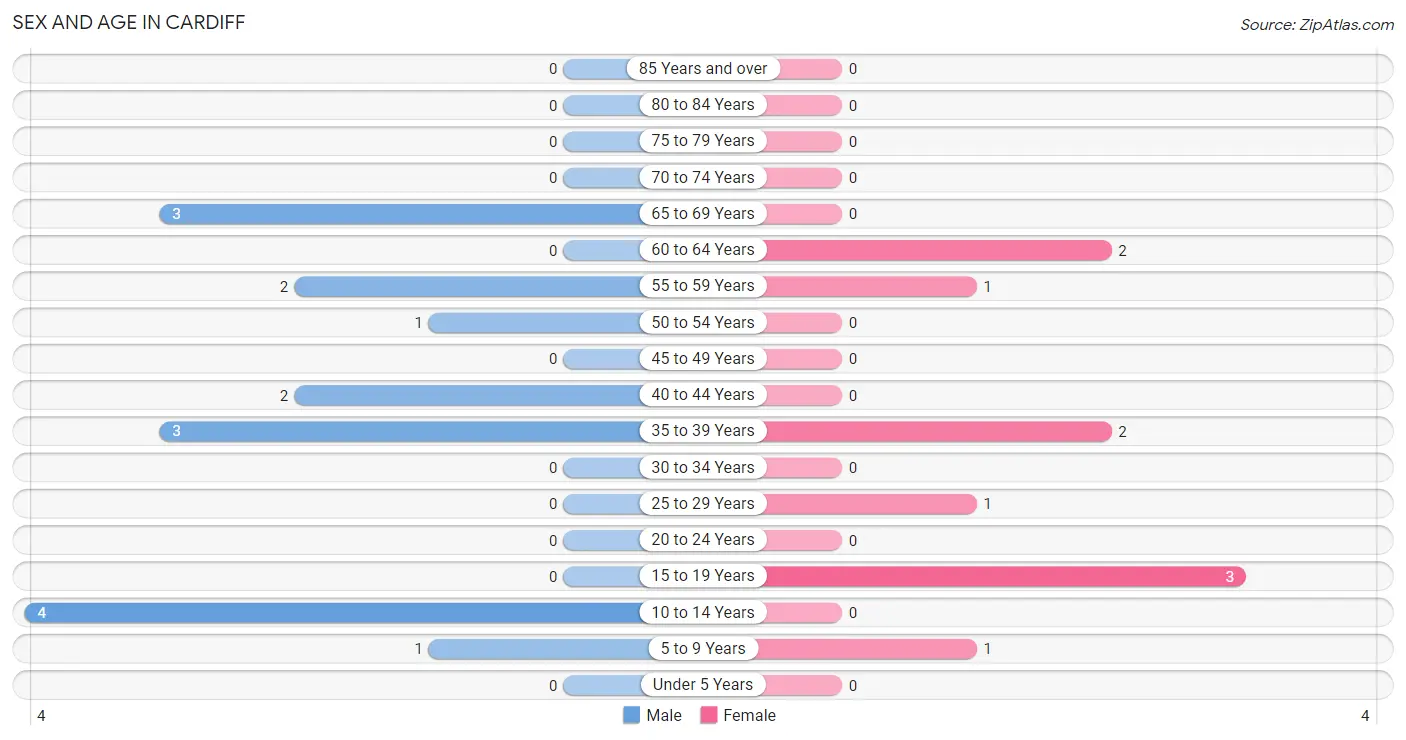
| Age Bracket | Male | Female |
| Under 5 Years | 0 (0.0%) | 0 (0.0%) |
| 5 to 9 Years | 1 (6.2%) | 1 (10.0%) |
| 10 to 14 Years | 4 (25.0%) | 0 (0.0%) |
| 15 to 19 Years | 0 (0.0%) | 3 (30.0%) |
| 20 to 24 Years | 0 (0.0%) | 0 (0.0%) |
| 25 to 29 Years | 0 (0.0%) | 1 (10.0%) |
| 30 to 34 Years | 0 (0.0%) | 0 (0.0%) |
| 35 to 39 Years | 3 (18.8%) | 2 (20.0%) |
| 40 to 44 Years | 2 (12.5%) | 0 (0.0%) |
| 45 to 49 Years | 0 (0.0%) | 0 (0.0%) |
| 50 to 54 Years | 1 (6.2%) | 0 (0.0%) |
| 55 to 59 Years | 2 (12.5%) | 1 (10.0%) |
| 60 to 64 Years | 0 (0.0%) | 2 (20.0%) |
| 65 to 69 Years | 3 (18.8%) | 0 (0.0%) |
| 70 to 74 Years | 0 (0.0%) | 0 (0.0%) |
| 75 to 79 Years | 0 (0.0%) | 0 (0.0%) |
| 80 to 84 Years | 0 (0.0%) | 0 (0.0%) |
| 85 Years and over | 0 (0.0%) | 0 (0.0%) |
| Total | 16 (100.0%) | 10 (100.0%) |
Families and Households in Cardiff
Median Family Size in Cardiff
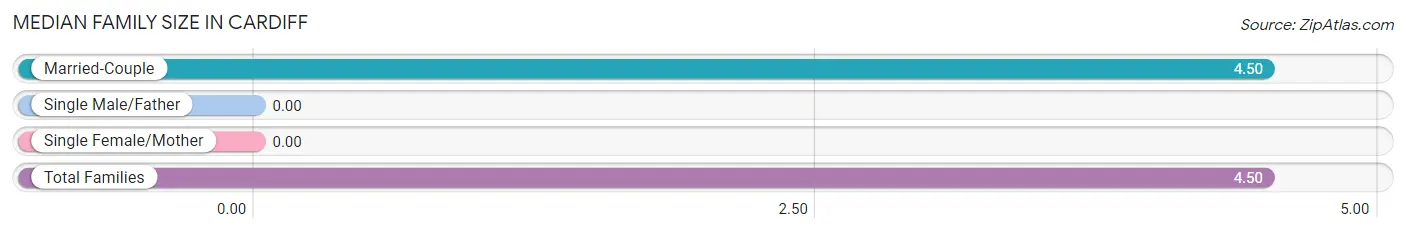
| Family Type | # Families | Family Size |
| Married-Couple | 4 (100.0%) | 4.50 |
| Single Male/Father | 0 (0.0%) | - |
| Single Female/Mother | 0 (0.0%) | - |
| Total Families | 4 (100.0%) | 4.50 |
Median Household Size in Cardiff
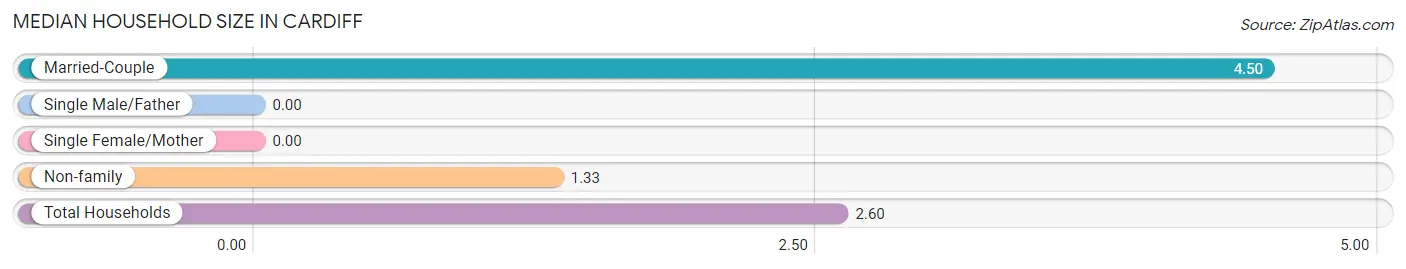
| Household Type | # Households | Household Size |
| Married-Couple | 4 (40.0%) | 4.50 |
| Single Male/Father | 0 (0.0%) | - |
| Single Female/Mother | 0 (0.0%) | - |
| Non-family | 6 (60.0%) | 1.33 |
| Total Households | 10 (100.0%) | 2.60 |
Household Size by Marriage Status in Cardiff
Out of a total of 10 households in Cardiff, 4 (40.0%) are family households, while 6 (60.0%) are nonfamily households. The most numerous type of family households are 5-person households, comprising 3, and the most common type of nonfamily households are 1-person households, comprising 5.
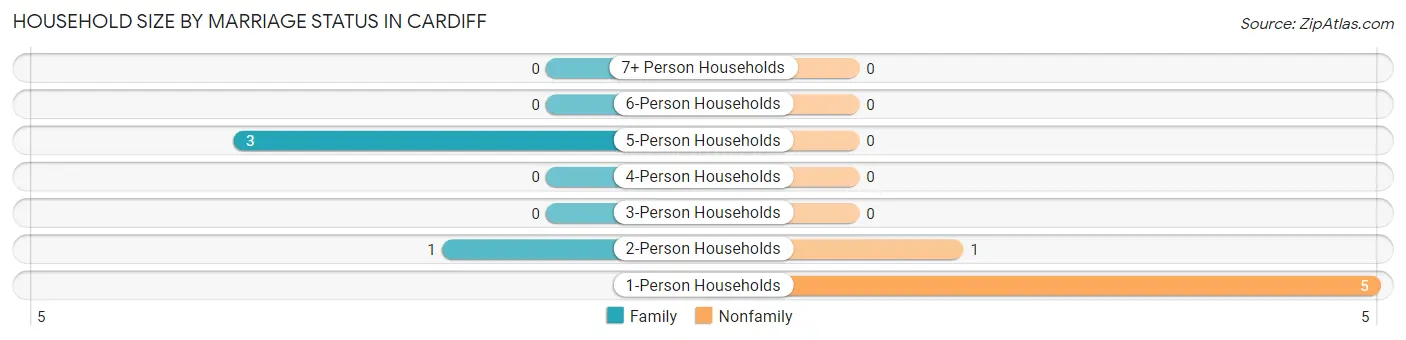
| Household Size | Family Households | Nonfamily Households |
| 1-Person Households | - | 5 (50.0%) |
| 2-Person Households | 1 (10.0%) | 1 (10.0%) |
| 3-Person Households | 0 (0.0%) | 0 (0.0%) |
| 4-Person Households | 0 (0.0%) | 0 (0.0%) |
| 5-Person Households | 3 (30.0%) | 0 (0.0%) |
| 6-Person Households | 0 (0.0%) | 0 (0.0%) |
| 7+ Person Households | 0 (0.0%) | 0 (0.0%) |
| Total | 4 (40.0%) | 6 (60.0%) |
Female Fertility in Cardiff
Fertility by Age in Cardiff
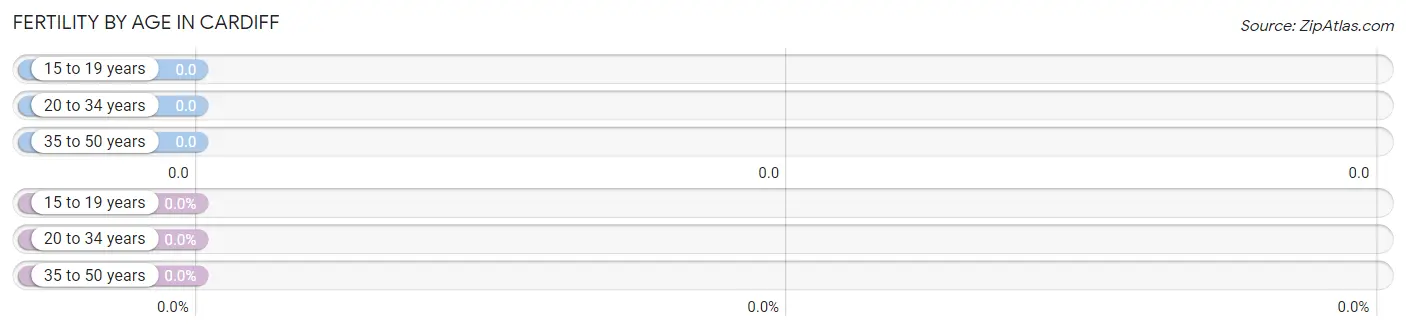
| Age Bracket | Women with Births | Births / 1,000 Women |
| 15 to 19 years | 0 (0.0%) | 0.0 |
| 20 to 34 years | 0 (0.0%) | 0.0 |
| 35 to 50 years | 0 (0.0%) | 0.0 |
| Total | 0 (0.0%) | 0.0 |
Fertility by Age by Marriage Status in Cardiff
| Age Bracket | Married | Unmarried |
| 15 to 19 years | 0 (0.0%) | 0 (0.0%) |
| 20 to 34 years | 0 (0.0%) | 0 (0.0%) |
| 35 to 50 years | 0 (0.0%) | 0 (0.0%) |
| Total | 0 (0.0%) | 0 (0.0%) |
Fertility by Education in Cardiff
| Educational Attainment | Women with Births | Births / 1,000 Women |
| Less than High School | 0 (0.0%) | 0.0 |
| High School Diploma | 0 (0.0%) | 0.0 |
| College or Associate's Degree | 0 (0.0%) | 0.0 |
| Bachelor's Degree | 0 (0.0%) | 0.0 |
| Graduate Degree | 0 (0.0%) | 0.0 |
| Total | 0 (0.0%) | 0.0 |
Fertility by Education by Marriage Status in Cardiff
| Educational Attainment | Married | Unmarried |
| Less than High School | 0 (0.0%) | 0 (0.0%) |
| High School Diploma | 0 (0.0%) | 0 (0.0%) |
| College or Associate's Degree | 0 (0.0%) | 0 (0.0%) |
| Bachelor's Degree | 0 (0.0%) | 0 (0.0%) |
| Graduate Degree | 0 (0.0%) | 0 (0.0%) |
| Total | 0 (0.0%) | 0 (0.0%) |
Employment Characteristics in Cardiff
Employment by Class of Employer in Cardiff
Among the 14 employed individuals in Cardiff, , and private company employees (14 | 100.0%) make up the most common classes of employment.
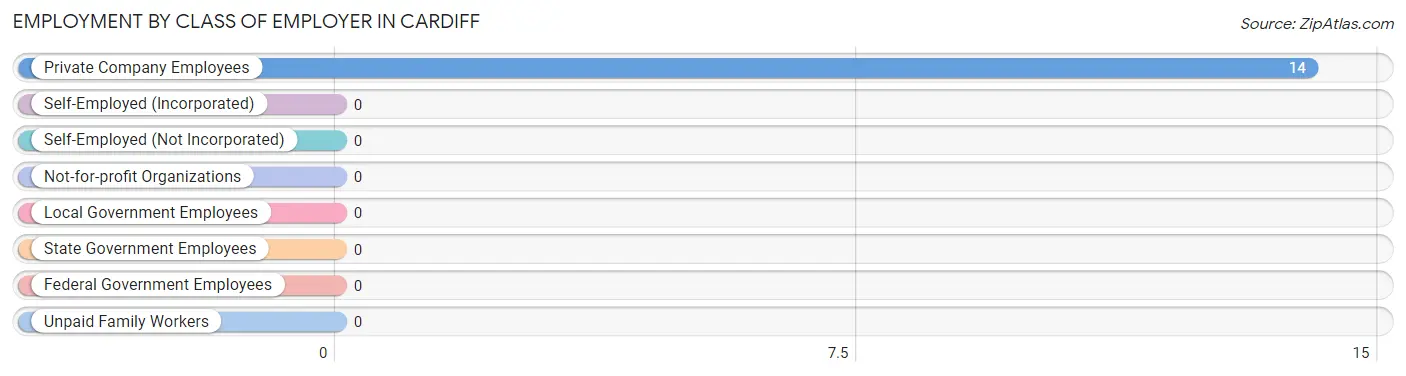
| Employer Class | # Employees | % Employees |
| Private Company Employees | 14 | 100.0% |
| Self-Employed (Incorporated) | 0 | 0.0% |
| Self-Employed (Not Incorporated) | 0 | 0.0% |
| Not-for-profit Organizations | 0 | 0.0% |
| Local Government Employees | 0 | 0.0% |
| State Government Employees | 0 | 0.0% |
| Federal Government Employees | 0 | 0.0% |
| Unpaid Family Workers | 0 | 0.0% |
| Total | 14 | 100.0% |
Employment Status by Age in Cardiff
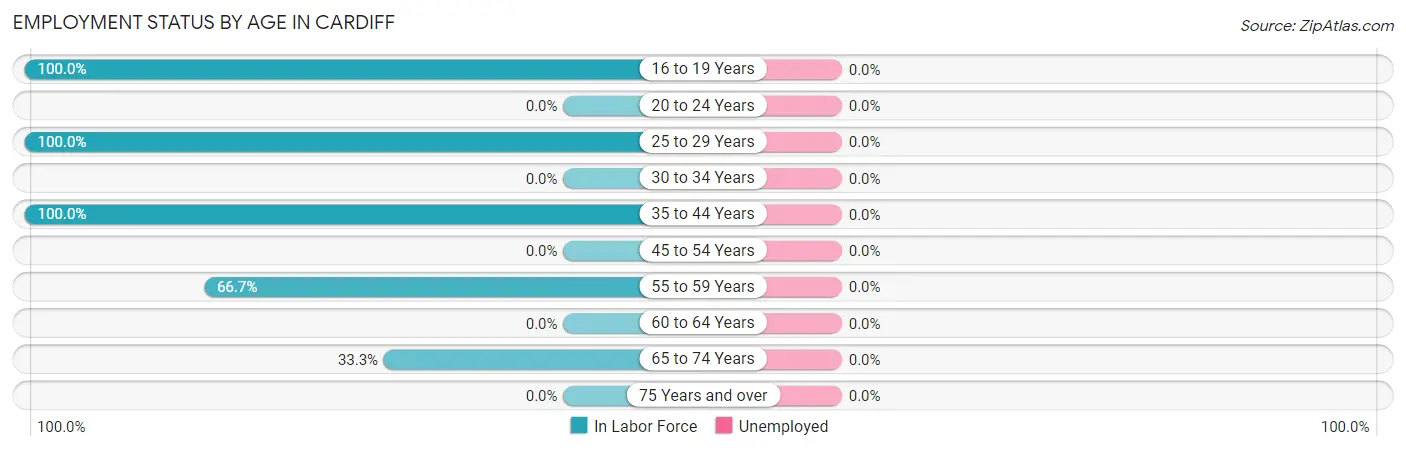
| Age Bracket | In Labor Force | Unemployed |
| 16 to 19 Years | 3 (100.0%) | 0 (0.0%) |
| 20 to 24 Years | 0 (0.0%) | 0 (0.0%) |
| 25 to 29 Years | 1 (100.0%) | 0 (0.0%) |
| 30 to 34 Years | 0 (0.0%) | 0 (0.0%) |
| 35 to 44 Years | 7 (100.0%) | 0 (0.0%) |
| 45 to 54 Years | 0 (0.0%) | 0 (0.0%) |
| 55 to 59 Years | 2 (66.7%) | 0 (0.0%) |
| 60 to 64 Years | 0 (0.0%) | 0 (0.0%) |
| 65 to 74 Years | 1 (33.3%) | 0 (0.0%) |
| 75 Years and over | 0 (0.0%) | 0 (0.0%) |
| Total | 14 (70.0%) | 0 (0.0%) |
Employment Status by Educational Attainment in Cardiff
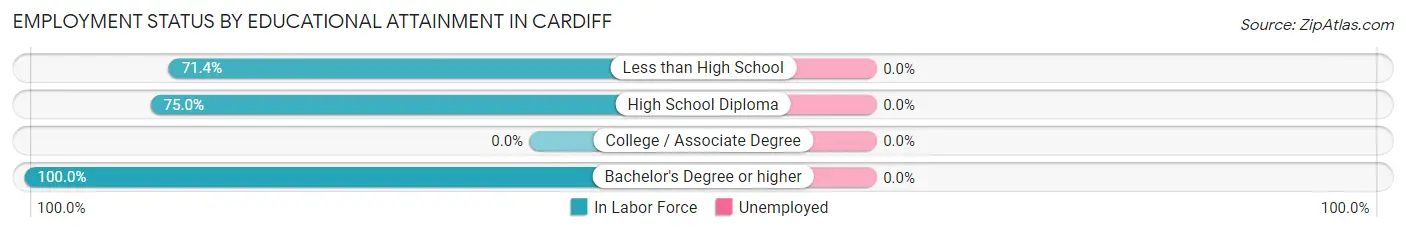
| Educational Attainment | In Labor Force | Unemployed |
| Less than High School | 5 (71.4%) | 0 (0.0%) |
| High School Diploma | 3 (75.0%) | 0 (0.0%) |
| College / Associate Degree | 0 (0.0%) | 0 (0.0%) |
| Bachelor's Degree or higher | 2 (100.0%) | 0 (0.0%) |
| Total | 10 (71.4%) | 0 (0.0%) |
Employment Occupations by Sex in Cardiff
Management, Business, Science and Arts Occupations
The most common Management, Business, Science and Arts occupations in Cardiff are Business & Financial (1 | 7.1%), Community & Social Service (1 | 7.1%), and Arts, Media & Entertainment (1 | 7.1%).
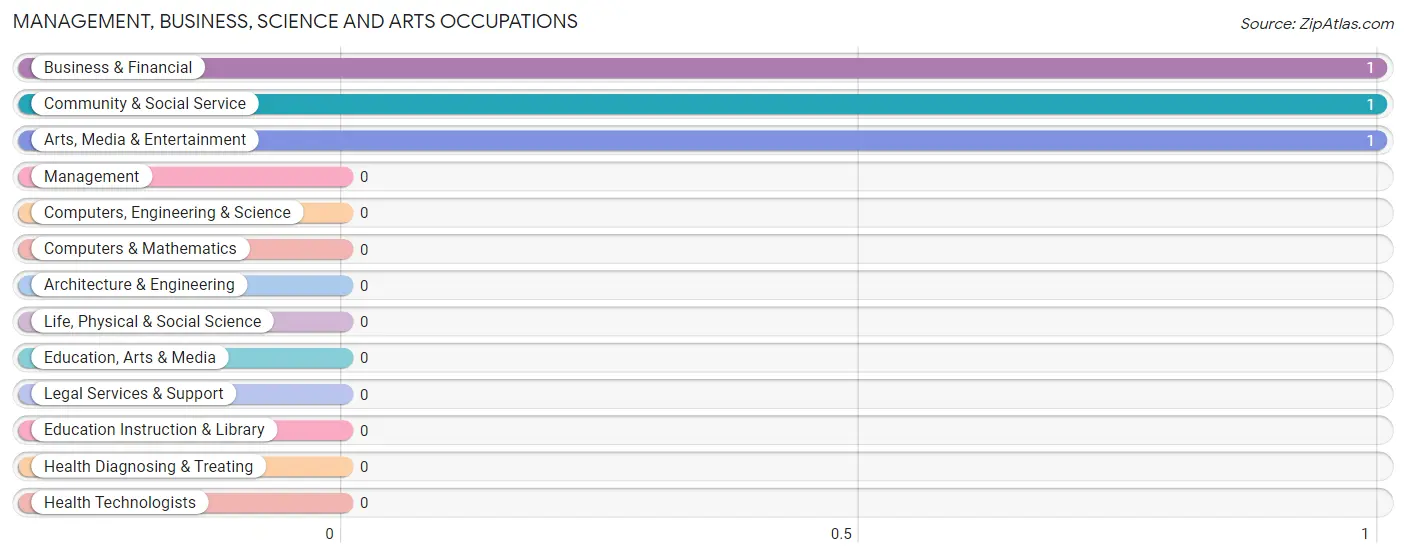
Management, Business, Science and Arts Occupations by Sex
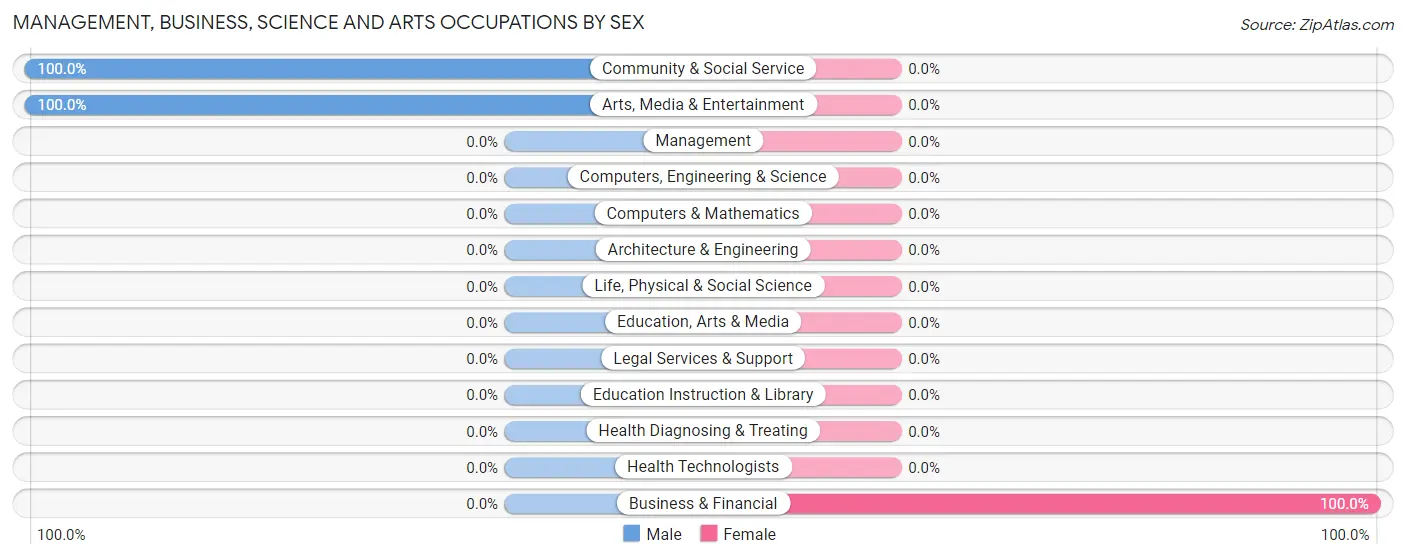
| Occupation | Male | Female |
| Management | 0 (0.0%) | 0 (0.0%) |
| Business & Financial | 0 (0.0%) | 1 (100.0%) |
| Computers, Engineering & Science | 0 (0.0%) | 0 (0.0%) |
| Computers & Mathematics | 0 (0.0%) | 0 (0.0%) |
| Architecture & Engineering | 0 (0.0%) | 0 (0.0%) |
| Life, Physical & Social Science | 0 (0.0%) | 0 (0.0%) |
| Community & Social Service | 1 (100.0%) | 0 (0.0%) |
| Education, Arts & Media | 0 (0.0%) | 0 (0.0%) |
| Legal Services & Support | 0 (0.0%) | 0 (0.0%) |
| Education Instruction & Library | 0 (0.0%) | 0 (0.0%) |
| Arts, Media & Entertainment | 1 (100.0%) | 0 (0.0%) |
| Health Diagnosing & Treating | 0 (0.0%) | 0 (0.0%) |
| Health Technologists | 0 (0.0%) | 0 (0.0%) |
| Total (Category) | 1 (50.0%) | 1 (50.0%) |
| Total (Overall) | 8 (57.1%) | 6 (42.9%) |
Services Occupations
The most common Services occupations in Cardiff are Food Preparation & Serving (4 | 28.6%), and Cleaning & Maintenance (2 | 14.3%).
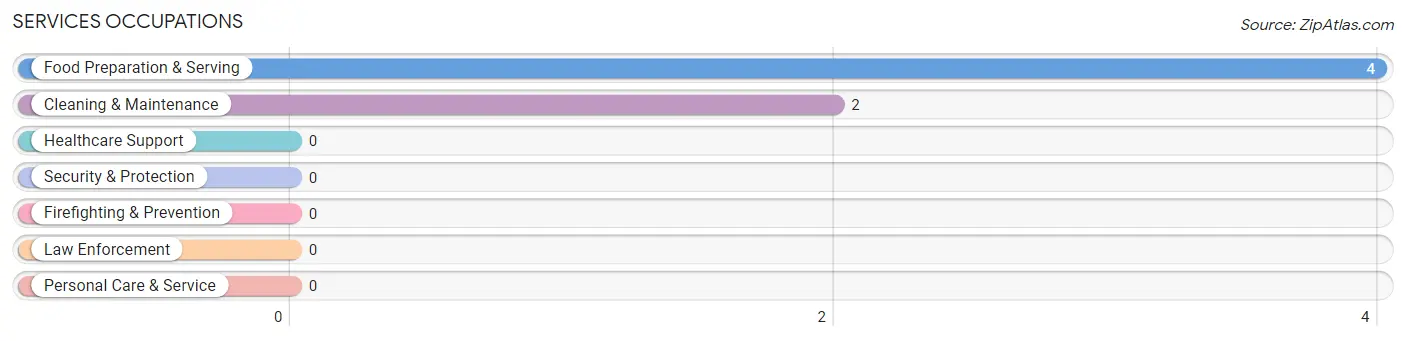
Services Occupations by Sex
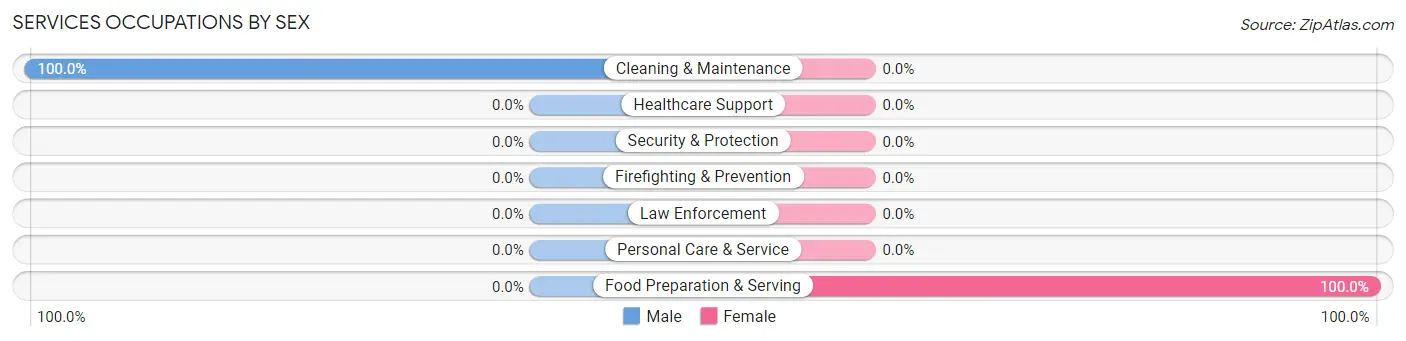
| Occupation | Male | Female |
| Healthcare Support | 0 (0.0%) | 0 (0.0%) |
| Security & Protection | 0 (0.0%) | 0 (0.0%) |
| Firefighting & Prevention | 0 (0.0%) | 0 (0.0%) |
| Law Enforcement | 0 (0.0%) | 0 (0.0%) |
| Food Preparation & Serving | 0 (0.0%) | 4 (100.0%) |
| Cleaning & Maintenance | 2 (100.0%) | 0 (0.0%) |
| Personal Care & Service | 0 (0.0%) | 0 (0.0%) |
| Total (Category) | 2 (33.3%) | 4 (66.7%) |
| Total (Overall) | 8 (57.1%) | 6 (42.9%) |
Sales and Office Occupations
The most common Sales and Office occupations in Cardiff are , and Office & Administration (1 | 7.1%).
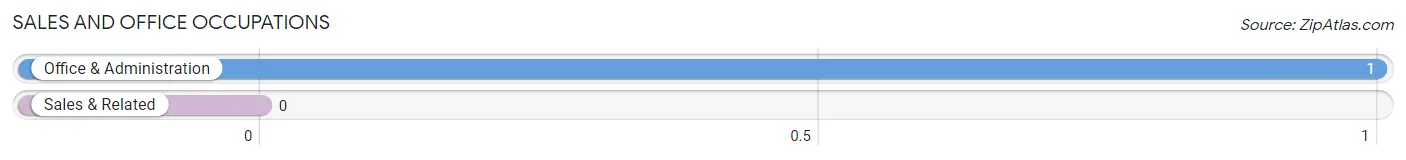
Sales and Office Occupations by Sex
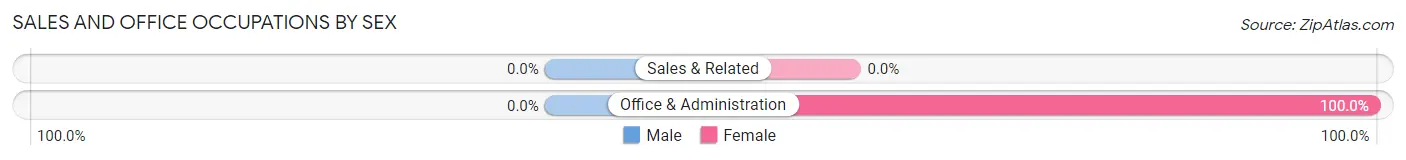
| Occupation | Male | Female |
| Sales & Related | 0 (0.0%) | 0 (0.0%) |
| Office & Administration | 0 (0.0%) | 1 (100.0%) |
| Total (Category) | 0 (0.0%) | 1 (100.0%) |
| Total (Overall) | 8 (57.1%) | 6 (42.9%) |
Natural Resources, Construction and Maintenance Occupations
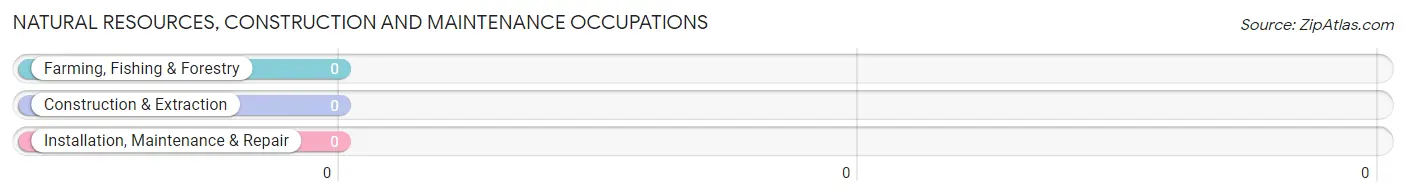
Natural Resources, Construction and Maintenance Occupations by Sex
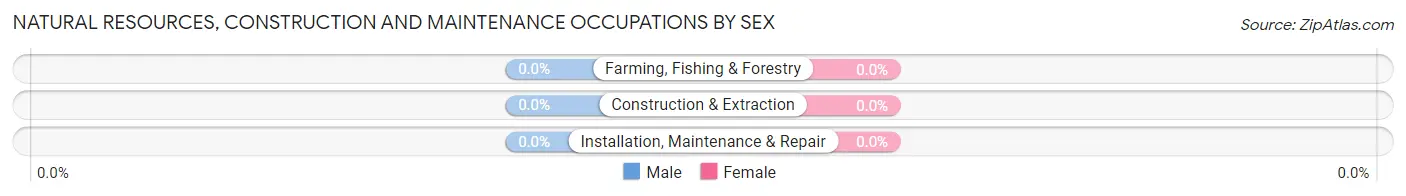
| Occupation | Male | Female |
| Farming, Fishing & Forestry | 0 (0.0%) | 0 (0.0%) |
| Construction & Extraction | 0 (0.0%) | 0 (0.0%) |
| Installation, Maintenance & Repair | 0 (0.0%) | 0 (0.0%) |
| Total (Category) | 0 (0.0%) | 0 (0.0%) |
| Total (Overall) | 8 (57.1%) | 6 (42.9%) |
Production, Transportation and Moving Occupations
The most common Production, Transportation and Moving occupations in Cardiff are Production (4 | 28.6%), and Transportation (1 | 7.1%).
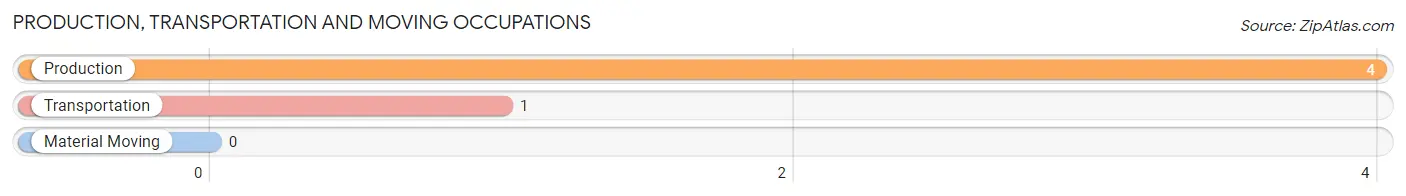
Production, Transportation and Moving Occupations by Sex
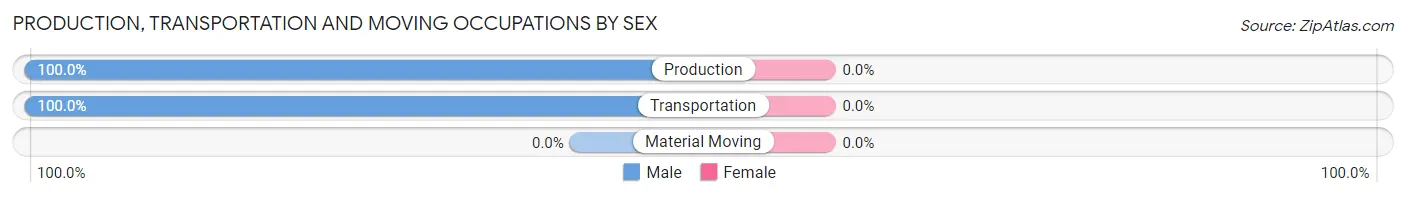
| Occupation | Male | Female |
| Production | 4 (100.0%) | 0 (0.0%) |
| Transportation | 1 (100.0%) | 0 (0.0%) |
| Material Moving | 0 (0.0%) | 0 (0.0%) |
| Total (Category) | 5 (100.0%) | 0 (0.0%) |
| Total (Overall) | 8 (57.1%) | 6 (42.9%) |
Employment Industries by Sex in Cardiff
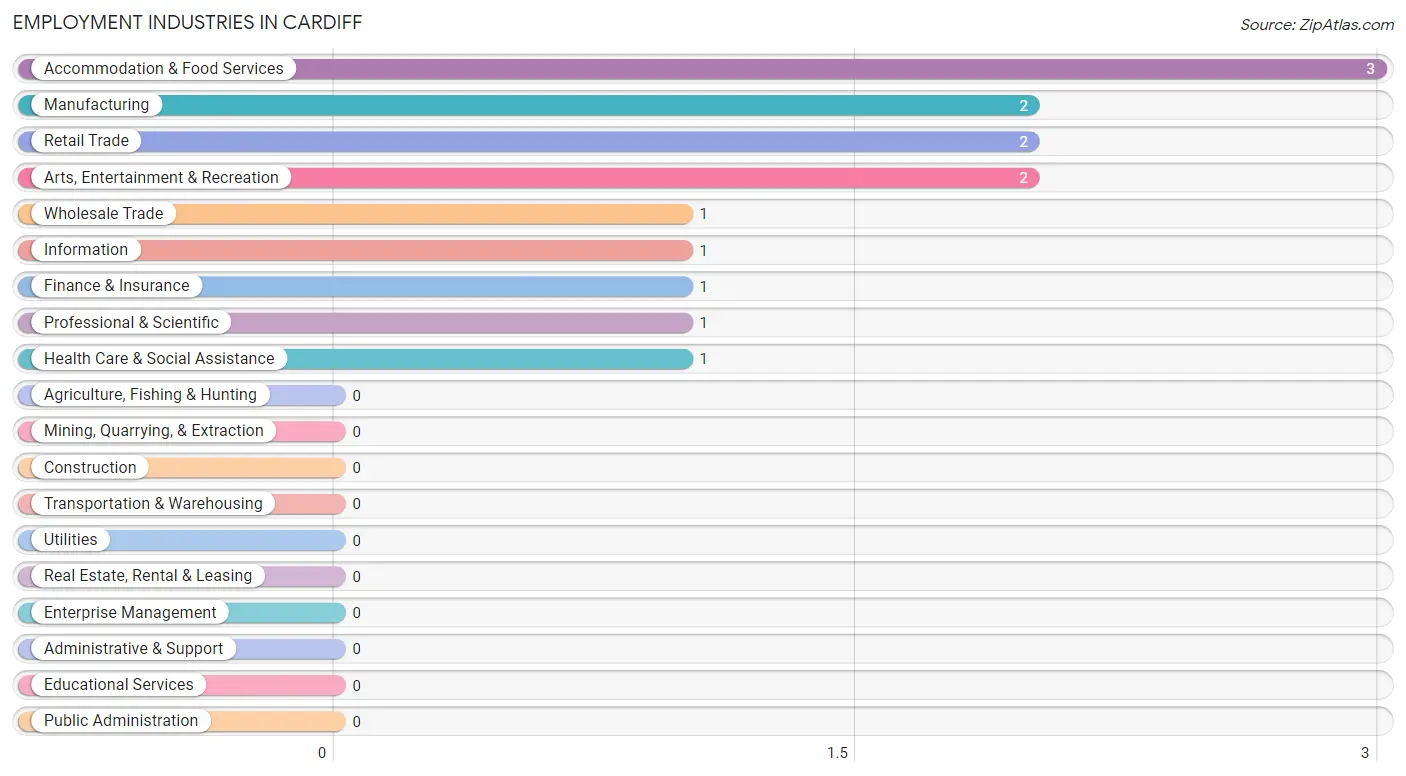
Employment Industries in Cardiff
The major employment industries in Cardiff include Accommodation & Food Services (3 | 21.4%), Manufacturing (2 | 14.3%), Retail Trade (2 | 14.3%), Arts, Entertainment & Recreation (2 | 14.3%), and Wholesale Trade (1 | 7.1%).
Employment Industries by Sex in Cardiff
The Cardiff industries that see more men than women are Manufacturing (100.0%), Wholesale Trade (100.0%), and Retail Trade (100.0%), whereas the industries that tend to have a higher number of women are Finance & Insurance (100.0%), Professional & Scientific (100.0%), and Health Care & Social Assistance (100.0%).
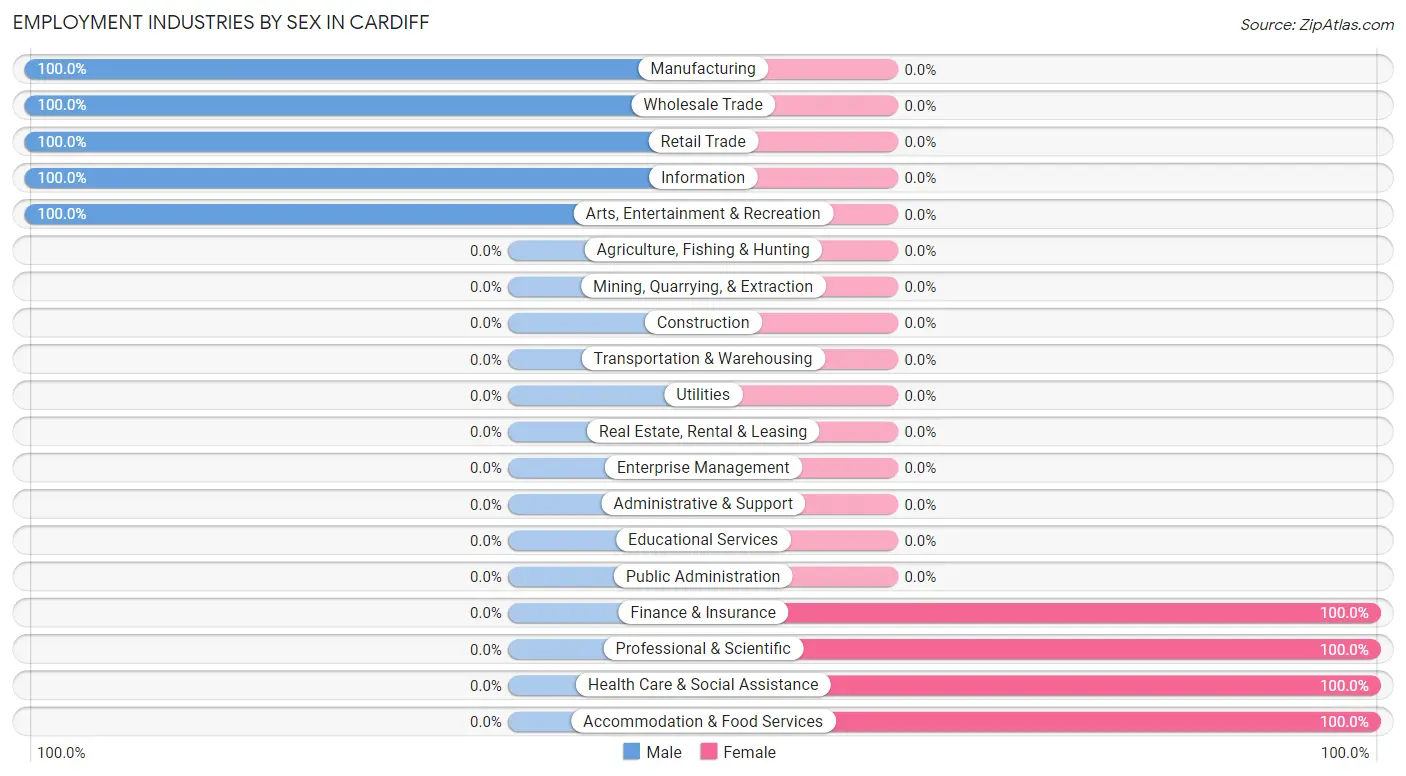
| Industry | Male | Female |
| Agriculture, Fishing & Hunting | 0 (0.0%) | 0 (0.0%) |
| Mining, Quarrying, & Extraction | 0 (0.0%) | 0 (0.0%) |
| Construction | 0 (0.0%) | 0 (0.0%) |
| Manufacturing | 2 (100.0%) | 0 (0.0%) |
| Wholesale Trade | 1 (100.0%) | 0 (0.0%) |
| Retail Trade | 2 (100.0%) | 0 (0.0%) |
| Transportation & Warehousing | 0 (0.0%) | 0 (0.0%) |
| Utilities | 0 (0.0%) | 0 (0.0%) |
| Information | 1 (100.0%) | 0 (0.0%) |
| Finance & Insurance | 0 (0.0%) | 1 (100.0%) |
| Real Estate, Rental & Leasing | 0 (0.0%) | 0 (0.0%) |
| Professional & Scientific | 0 (0.0%) | 1 (100.0%) |
| Enterprise Management | 0 (0.0%) | 0 (0.0%) |
| Administrative & Support | 0 (0.0%) | 0 (0.0%) |
| Educational Services | 0 (0.0%) | 0 (0.0%) |
| Health Care & Social Assistance | 0 (0.0%) | 1 (100.0%) |
| Arts, Entertainment & Recreation | 2 (100.0%) | 0 (0.0%) |
| Accommodation & Food Services | 0 (0.0%) | 3 (100.0%) |
| Public Administration | 0 (0.0%) | 0 (0.0%) |
| Total | 8 (57.1%) | 6 (42.9%) |
Education in Cardiff
School Enrollment in Cardiff
The most common levels of schooling among the 6 students in Cardiff are nursery / preschool (2 | 33.3%), elementary school (2 | 33.3%), and middle school (2 | 33.3%).
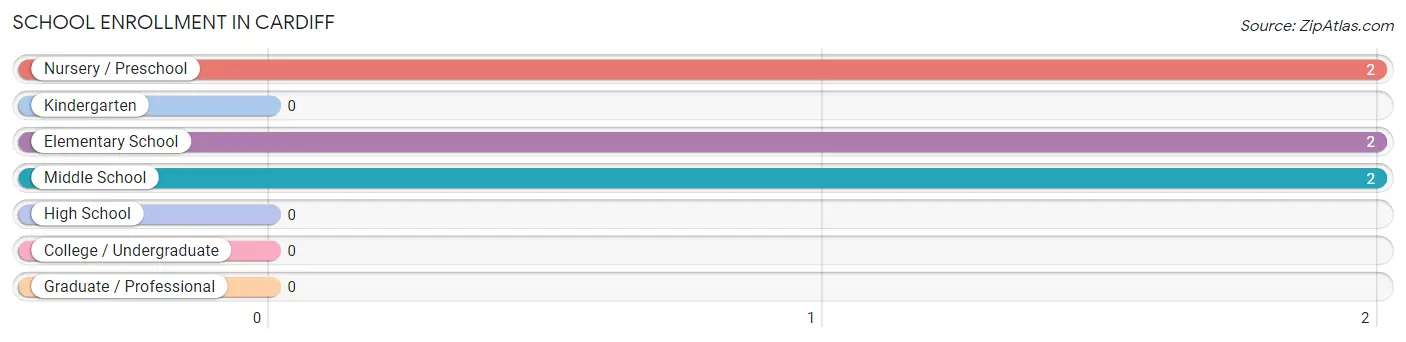
| School Level | # Students | % Students |
| Nursery / Preschool | 2 | 33.3% |
| Kindergarten | 0 | 0.0% |
| Elementary School | 2 | 33.3% |
| Middle School | 2 | 33.3% |
| High School | 0 | 0.0% |
| College / Undergraduate | 0 | 0.0% |
| Graduate / Professional | 0 | 0.0% |
| Total | 6 | 100.0% |
School Enrollment by Age by Funding Source in Cardiff
Out of a total of 6 students who are enrolled in schools in Cardiff, 2 (33.3%) attend a private institution, while the remaining 4 (66.7%) are enrolled in public schools. The age group of 5 to 9 year old has the highest likelihood of being enrolled in private schools, with 2 (100.0% in the age bracket) enrolled. Conversely, the age group of 10 to 14 year olds has the lowest likelihood of being enrolled in a private school, with 4 (100.0% in the age bracket) attending a public institution.
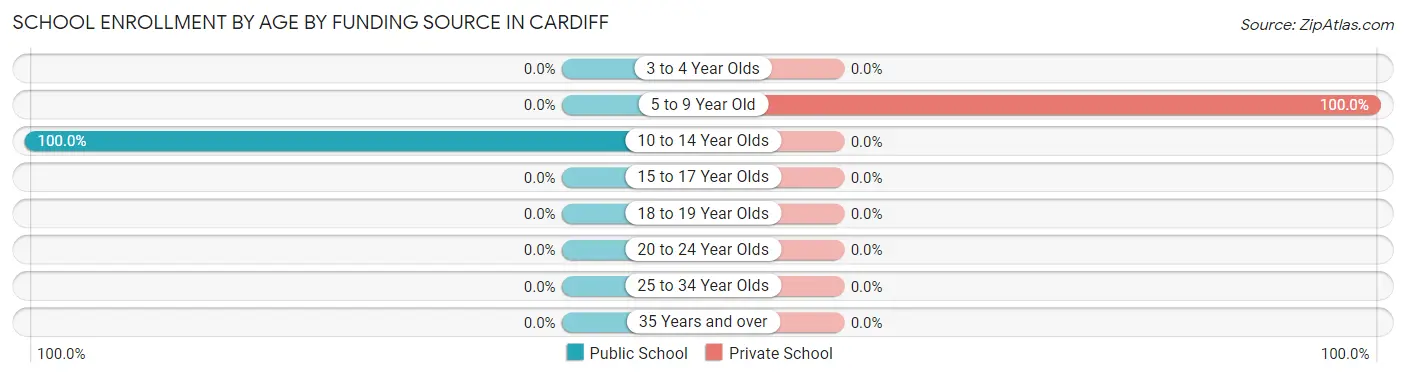
| Age Bracket | Public School | Private School |
| 3 to 4 Year Olds | 0 (0.0%) | 0 (0.0%) |
| 5 to 9 Year Old | 0 (0.0%) | 2 (100.0%) |
| 10 to 14 Year Olds | 4 (100.0%) | 0 (0.0%) |
| 15 to 17 Year Olds | 0 (0.0%) | 0 (0.0%) |
| 18 to 19 Year Olds | 0 (0.0%) | 0 (0.0%) |
| 20 to 24 Year Olds | 0 (0.0%) | 0 (0.0%) |
| 25 to 34 Year Olds | 0 (0.0%) | 0 (0.0%) |
| 35 Years and over | 0 (0.0%) | 0 (0.0%) |
| Total | 4 (66.7%) | 2 (33.3%) |
Educational Attainment by Field of Study in Cardiff
Business (1 | 50.0%), and visual & performing arts (1 | 50.0%) are the most common fields of study among 2 individuals in Cardiff who have obtained a bachelor's degree or higher.
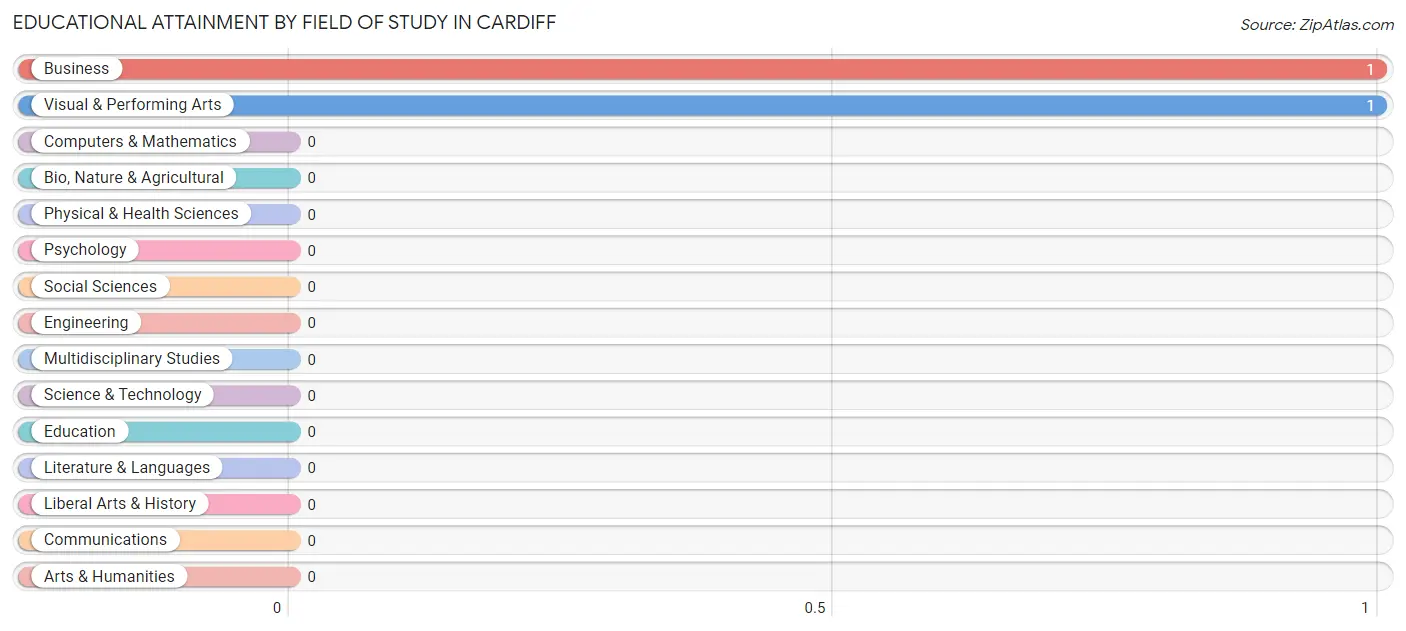
| Field of Study | # Graduates | % Graduates |
| Computers & Mathematics | 0 | 0.0% |
| Bio, Nature & Agricultural | 0 | 0.0% |
| Physical & Health Sciences | 0 | 0.0% |
| Psychology | 0 | 0.0% |
| Social Sciences | 0 | 0.0% |
| Engineering | 0 | 0.0% |
| Multidisciplinary Studies | 0 | 0.0% |
| Science & Technology | 0 | 0.0% |
| Business | 1 | 50.0% |
| Education | 0 | 0.0% |
| Literature & Languages | 0 | 0.0% |
| Liberal Arts & History | 0 | 0.0% |
| Visual & Performing Arts | 1 | 50.0% |
| Communications | 0 | 0.0% |
| Arts & Humanities | 0 | 0.0% |
| Total | 2 | 100.0% |
Transportation & Commute in Cardiff
Vehicle Availability by Sex in Cardiff
The most prevalent vehicle ownership categories in Cardiff are males with 2 vehicles (3, accounting for 37.5%) and females with 2 vehicles (1, making up 50.0%).
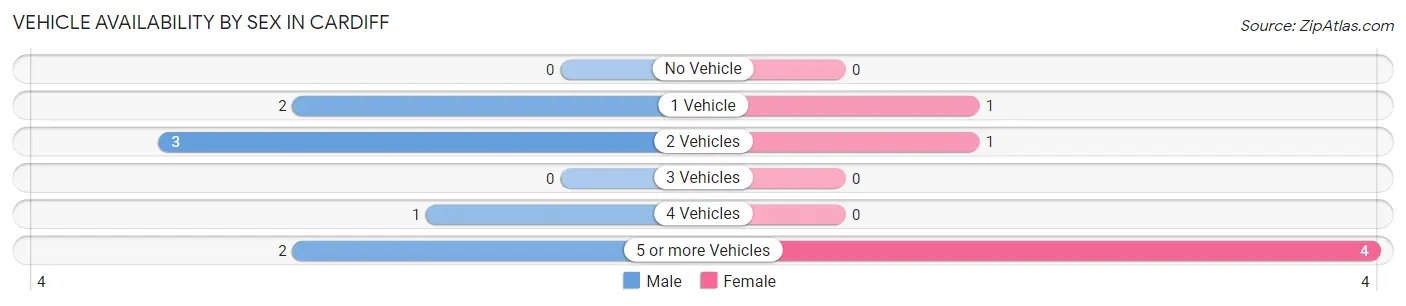
| Vehicles Available | Male | Female |
| No Vehicle | 0 (0.0%) | 0 (0.0%) |
| 1 Vehicle | 2 (25.0%) | 1 (16.7%) |
| 2 Vehicles | 3 (37.5%) | 1 (16.7%) |
| 3 Vehicles | 0 (0.0%) | 0 (0.0%) |
| 4 Vehicles | 1 (12.5%) | 0 (0.0%) |
| 5 or more Vehicles | 2 (25.0%) | 4 (66.7%) |
| Total | 8 (100.0%) | 6 (100.0%) |
Commute Time in Cardiff
The most frequently occuring commute durations in Cardiff are 30 to 34 minutes (7 commuters, 50.0%), 10 to 14 minutes (2 commuters, 14.3%), and 45 to 59 minutes (2 commuters, 14.3%).
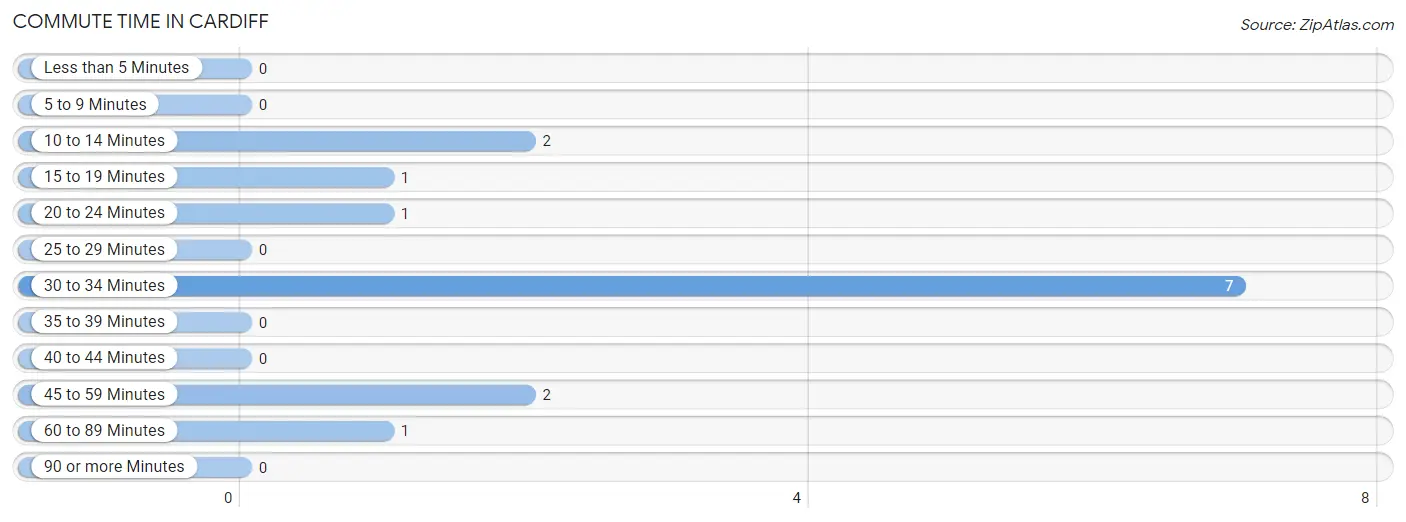
| Commute Time | # Commuters | % Commuters |
| Less than 5 Minutes | 0 | 0.0% |
| 5 to 9 Minutes | 0 | 0.0% |
| 10 to 14 Minutes | 2 | 14.3% |
| 15 to 19 Minutes | 1 | 7.1% |
| 20 to 24 Minutes | 1 | 7.1% |
| 25 to 29 Minutes | 0 | 0.0% |
| 30 to 34 Minutes | 7 | 50.0% |
| 35 to 39 Minutes | 0 | 0.0% |
| 40 to 44 Minutes | 0 | 0.0% |
| 45 to 59 Minutes | 2 | 14.3% |
| 60 to 89 Minutes | 1 | 7.1% |
| 90 or more Minutes | 0 | 0.0% |
Commute Time by Sex in Cardiff
The most common commute times in Cardiff are 30 to 34 minutes (4 commuters, 50.0%) for males and 30 to 34 minutes (3 commuters, 50.0%) for females.
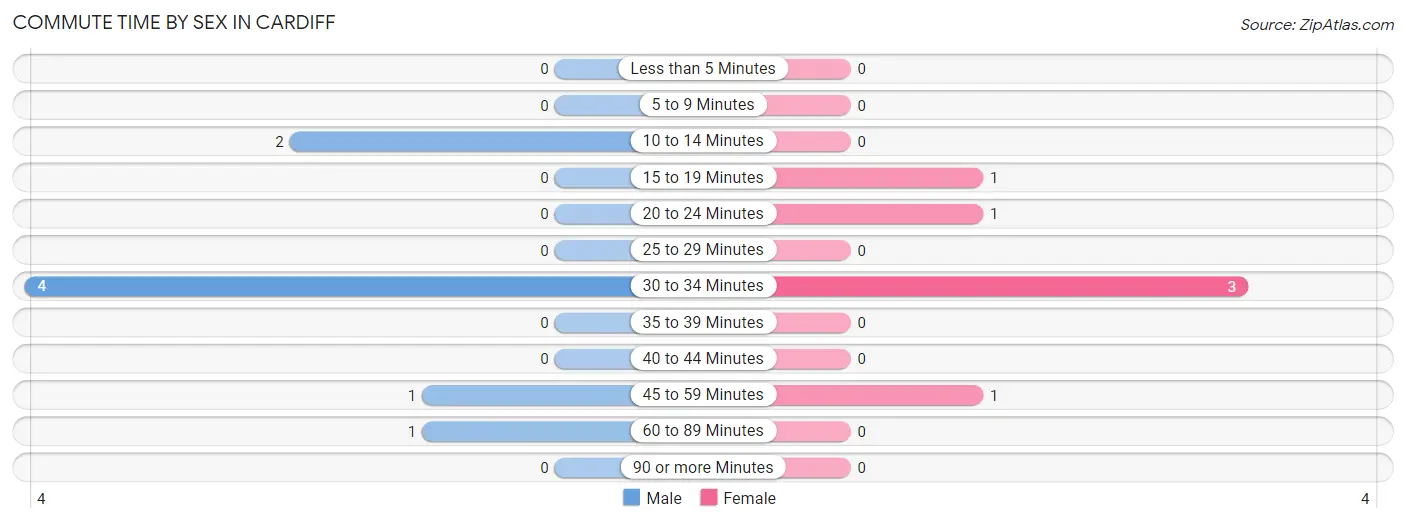
| Commute Time | Male | Female |
| Less than 5 Minutes | 0 (0.0%) | 0 (0.0%) |
| 5 to 9 Minutes | 0 (0.0%) | 0 (0.0%) |
| 10 to 14 Minutes | 2 (25.0%) | 0 (0.0%) |
| 15 to 19 Minutes | 0 (0.0%) | 1 (16.7%) |
| 20 to 24 Minutes | 0 (0.0%) | 1 (16.7%) |
| 25 to 29 Minutes | 0 (0.0%) | 0 (0.0%) |
| 30 to 34 Minutes | 4 (50.0%) | 3 (50.0%) |
| 35 to 39 Minutes | 0 (0.0%) | 0 (0.0%) |
| 40 to 44 Minutes | 0 (0.0%) | 0 (0.0%) |
| 45 to 59 Minutes | 1 (12.5%) | 1 (16.7%) |
| 60 to 89 Minutes | 1 (12.5%) | 0 (0.0%) |
| 90 or more Minutes | 0 (0.0%) | 0 (0.0%) |
Time of Departure to Work by Sex in Cardiff
The most frequent times of departure to work in Cardiff are 4:00 PM to 11:59 PM (3, 37.5%) for males and 12:00 PM to 3:59 PM (3, 50.0%) for females.
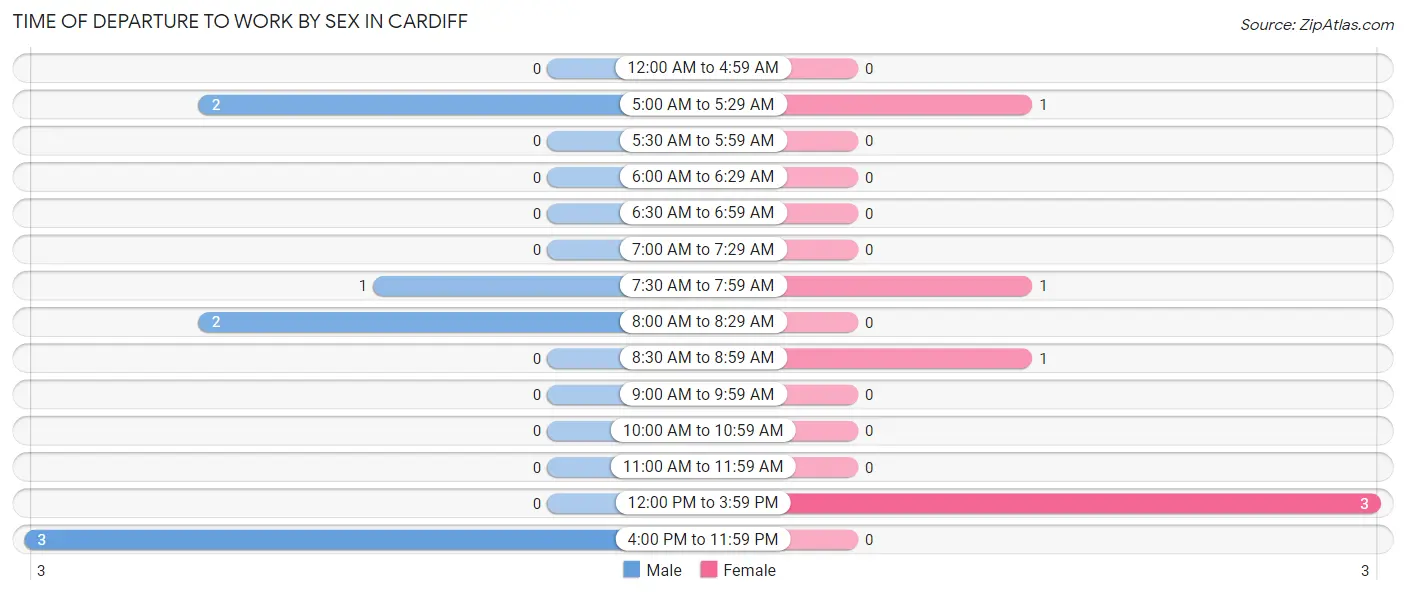
| Time of Departure | Male | Female |
| 12:00 AM to 4:59 AM | 0 (0.0%) | 0 (0.0%) |
| 5:00 AM to 5:29 AM | 2 (25.0%) | 1 (16.7%) |
| 5:30 AM to 5:59 AM | 0 (0.0%) | 0 (0.0%) |
| 6:00 AM to 6:29 AM | 0 (0.0%) | 0 (0.0%) |
| 6:30 AM to 6:59 AM | 0 (0.0%) | 0 (0.0%) |
| 7:00 AM to 7:29 AM | 0 (0.0%) | 0 (0.0%) |
| 7:30 AM to 7:59 AM | 1 (12.5%) | 1 (16.7%) |
| 8:00 AM to 8:29 AM | 2 (25.0%) | 0 (0.0%) |
| 8:30 AM to 8:59 AM | 0 (0.0%) | 1 (16.7%) |
| 9:00 AM to 9:59 AM | 0 (0.0%) | 0 (0.0%) |
| 10:00 AM to 10:59 AM | 0 (0.0%) | 0 (0.0%) |
| 11:00 AM to 11:59 AM | 0 (0.0%) | 0 (0.0%) |
| 12:00 PM to 3:59 PM | 0 (0.0%) | 3 (50.0%) |
| 4:00 PM to 11:59 PM | 3 (37.5%) | 0 (0.0%) |
| Total | 8 (100.0%) | 6 (100.0%) |
Housing Occupancy in Cardiff
Occupancy by Ownership in Cardiff
Of the total 10 dwellings in Cardiff, owner-occupied units account for 7 (70.0%), while renter-occupied units make up 3 (30.0%).
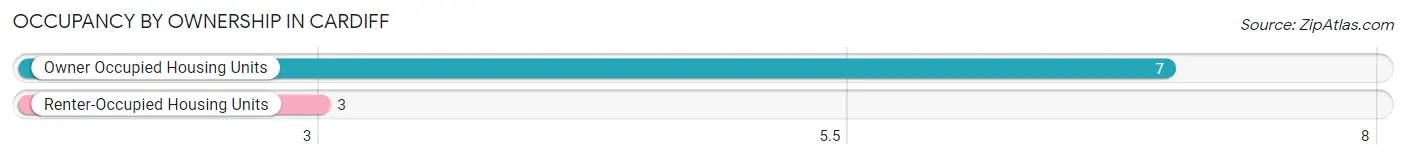
| Occupancy | # Housing Units | % Housing Units |
| Owner Occupied Housing Units | 7 | 70.0% |
| Renter-Occupied Housing Units | 3 | 30.0% |
| Total Occupied Housing Units | 10 | 100.0% |
Occupancy by Household Size in Cardiff
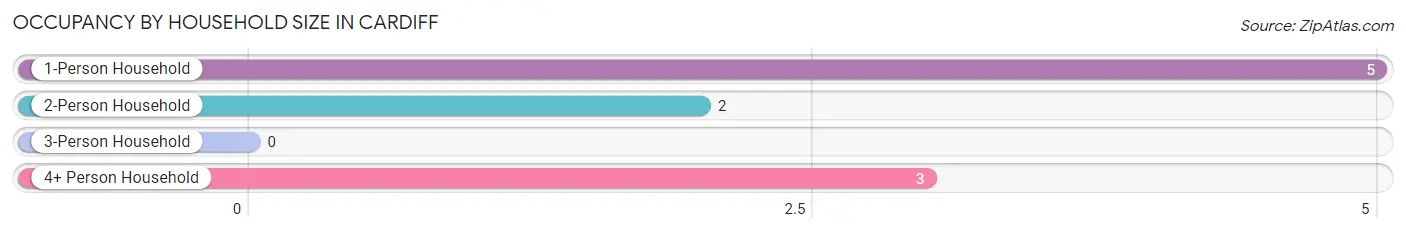
| Household Size | # Housing Units | % Housing Units |
| 1-Person Household | 5 | 50.0% |
| 2-Person Household | 2 | 20.0% |
| 3-Person Household | 0 | 0.0% |
| 4+ Person Household | 3 | 30.0% |
| Total Housing Units | 10 | 100.0% |
Occupancy by Ownership by Household Size in Cardiff
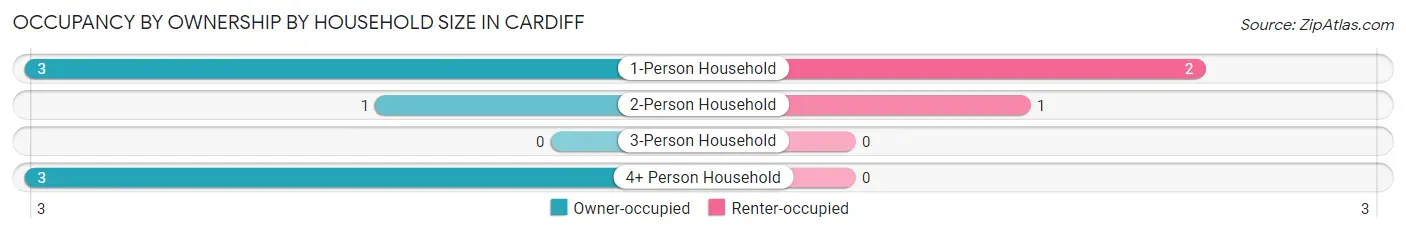
| Household Size | Owner-occupied | Renter-occupied |
| 1-Person Household | 3 (60.0%) | 2 (40.0%) |
| 2-Person Household | 1 (50.0%) | 1 (50.0%) |
| 3-Person Household | 0 (0.0%) | 0 (0.0%) |
| 4+ Person Household | 3 (100.0%) | 0 (0.0%) |
| Total Housing Units | 7 (70.0%) | 3 (30.0%) |
Occupancy by Educational Attainment in Cardiff
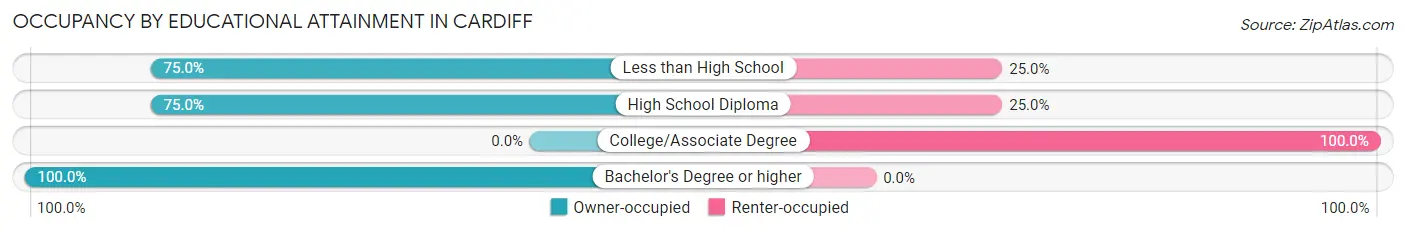
| Household Size | Owner-occupied | Renter-occupied |
| Less than High School | 3 (75.0%) | 1 (25.0%) |
| High School Diploma | 3 (75.0%) | 1 (25.0%) |
| College/Associate Degree | 0 (0.0%) | 1 (100.0%) |
| Bachelor's Degree or higher | 1 (100.0%) | 0 (0.0%) |
Occupancy by Age of Householder in Cardiff
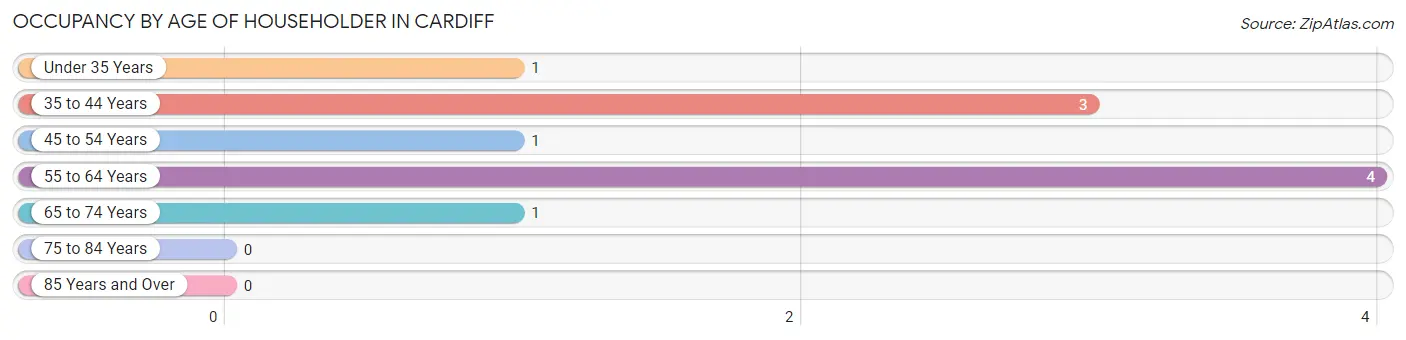
| Age Bracket | # Households | % Households |
| Under 35 Years | 1 | 10.0% |
| 35 to 44 Years | 3 | 30.0% |
| 45 to 54 Years | 1 | 10.0% |
| 55 to 64 Years | 4 | 40.0% |
| 65 to 74 Years | 1 | 10.0% |
| 75 to 84 Years | 0 | 0.0% |
| 85 Years and Over | 0 | 0.0% |
| Total | 10 | 100.0% |
Housing Finances in Cardiff
Median Income by Occupancy in Cardiff
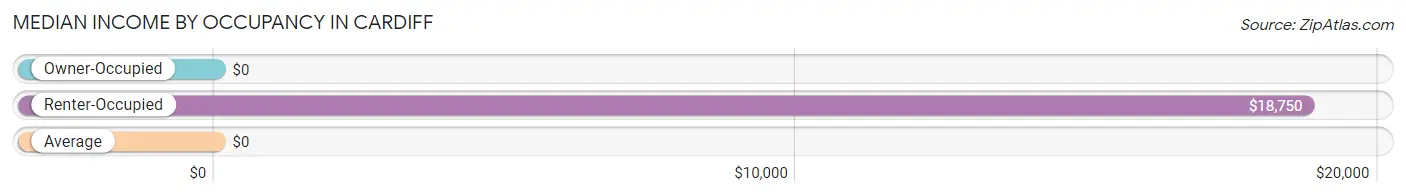
| Occupancy Type | # Households | Median Income |
| Owner-Occupied | 7 (70.0%) | $0 |
| Renter-Occupied | 3 (30.0%) | $18,750 |
| Average | 10 (100.0%) | $0 |
Occupancy by Householder Income Bracket in Cardiff
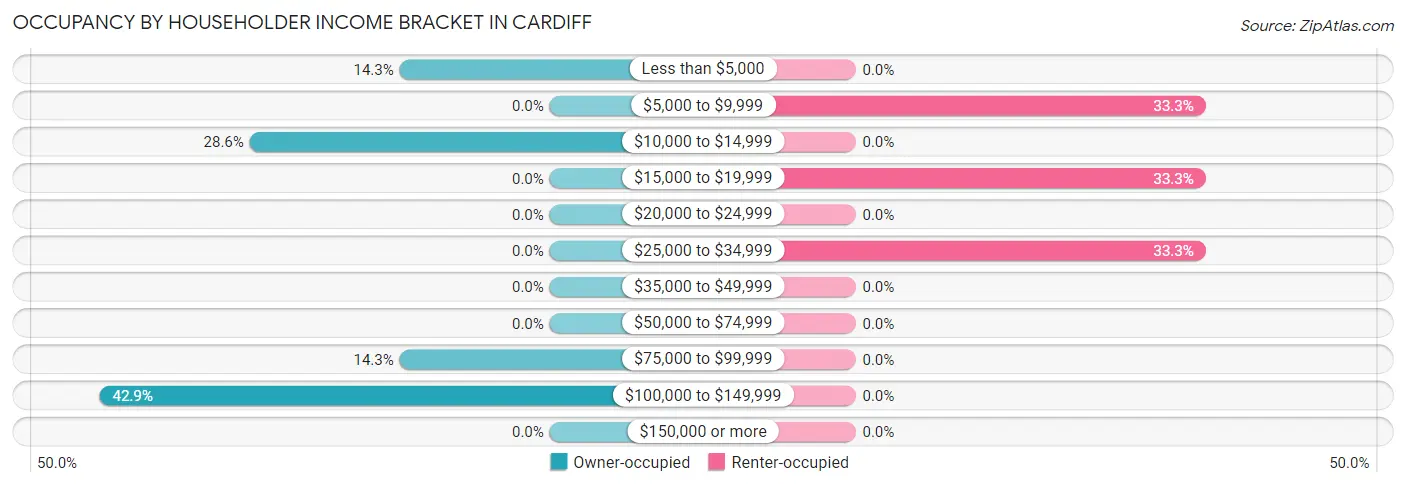
| Income Bracket | Owner-occupied | Renter-occupied |
| Less than $5,000 | 1 (14.3%) | 0 (0.0%) |
| $5,000 to $9,999 | 0 (0.0%) | 1 (33.3%) |
| $10,000 to $14,999 | 2 (28.6%) | 0 (0.0%) |
| $15,000 to $19,999 | 0 (0.0%) | 1 (33.3%) |
| $20,000 to $24,999 | 0 (0.0%) | 0 (0.0%) |
| $25,000 to $34,999 | 0 (0.0%) | 1 (33.3%) |
| $35,000 to $49,999 | 0 (0.0%) | 0 (0.0%) |
| $50,000 to $74,999 | 0 (0.0%) | 0 (0.0%) |
| $75,000 to $99,999 | 1 (14.3%) | 0 (0.0%) |
| $100,000 to $149,999 | 3 (42.9%) | 0 (0.0%) |
| $150,000 or more | 0 (0.0%) | 0 (0.0%) |
| Total | 7 (100.0%) | 3 (100.0%) |
Monthly Housing Cost Tiers in Cardiff
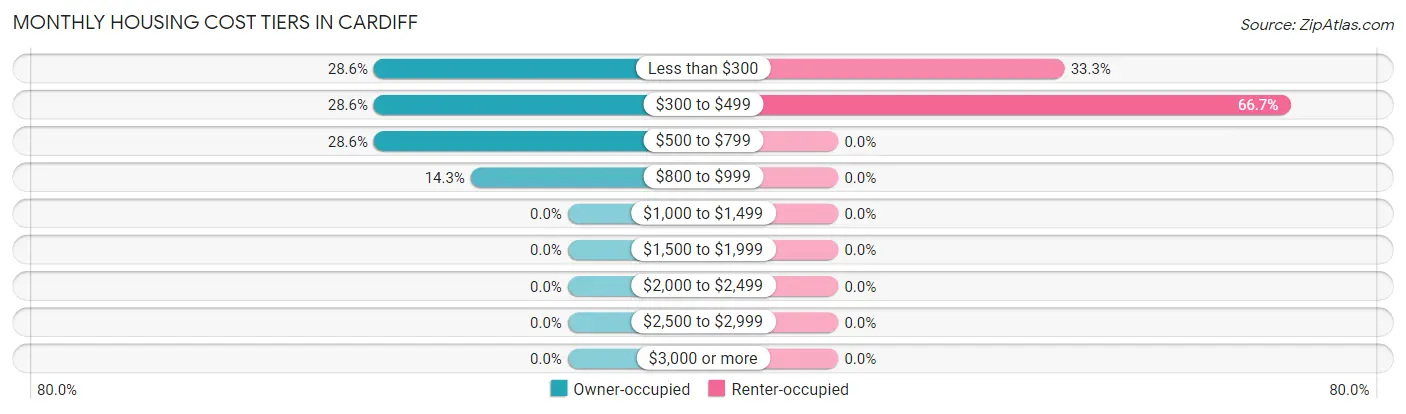
| Monthly Cost | Owner-occupied | Renter-occupied |
| Less than $300 | 2 (28.6%) | 1 (33.3%) |
| $300 to $499 | 2 (28.6%) | 2 (66.7%) |
| $500 to $799 | 2 (28.6%) | 0 (0.0%) |
| $800 to $999 | 1 (14.3%) | 0 (0.0%) |
| $1,000 to $1,499 | 0 (0.0%) | 0 (0.0%) |
| $1,500 to $1,999 | 0 (0.0%) | 0 (0.0%) |
| $2,000 to $2,499 | 0 (0.0%) | 0 (0.0%) |
| $2,500 to $2,999 | 0 (0.0%) | 0 (0.0%) |
| $3,000 or more | 0 (0.0%) | 0 (0.0%) |
| Total | 7 (100.0%) | 3 (100.0%) |
Physical Housing Characteristics in Cardiff
Housing Structures in Cardiff
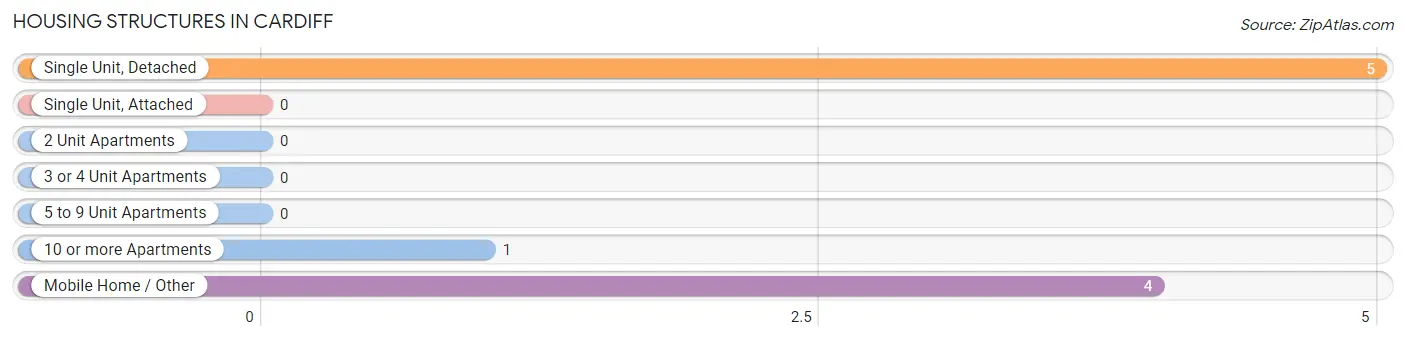
| Structure Type | # Housing Units | % Housing Units |
| Single Unit, Detached | 5 | 50.0% |
| Single Unit, Attached | 0 | 0.0% |
| 2 Unit Apartments | 0 | 0.0% |
| 3 or 4 Unit Apartments | 0 | 0.0% |
| 5 to 9 Unit Apartments | 0 | 0.0% |
| 10 or more Apartments | 1 | 10.0% |
| Mobile Home / Other | 4 | 40.0% |
| Total | 10 | 100.0% |
Housing Structures by Occupancy in Cardiff
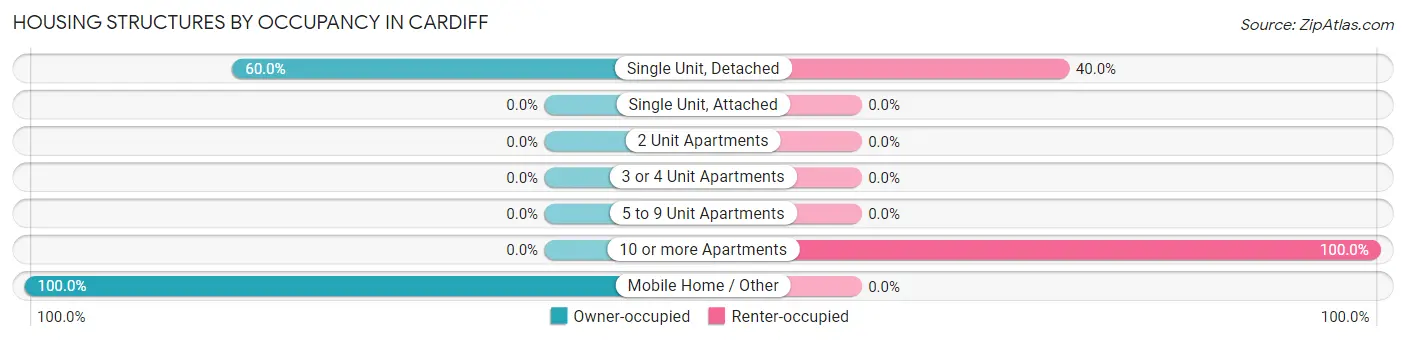
| Structure Type | Owner-occupied | Renter-occupied |
| Single Unit, Detached | 3 (60.0%) | 2 (40.0%) |
| Single Unit, Attached | 0 (0.0%) | 0 (0.0%) |
| 2 Unit Apartments | 0 (0.0%) | 0 (0.0%) |
| 3 or 4 Unit Apartments | 0 (0.0%) | 0 (0.0%) |
| 5 to 9 Unit Apartments | 0 (0.0%) | 0 (0.0%) |
| 10 or more Apartments | 0 (0.0%) | 1 (100.0%) |
| Mobile Home / Other | 4 (100.0%) | 0 (0.0%) |
| Total | 7 (70.0%) | 3 (30.0%) |
Housing Structures by Number of Rooms in Cardiff
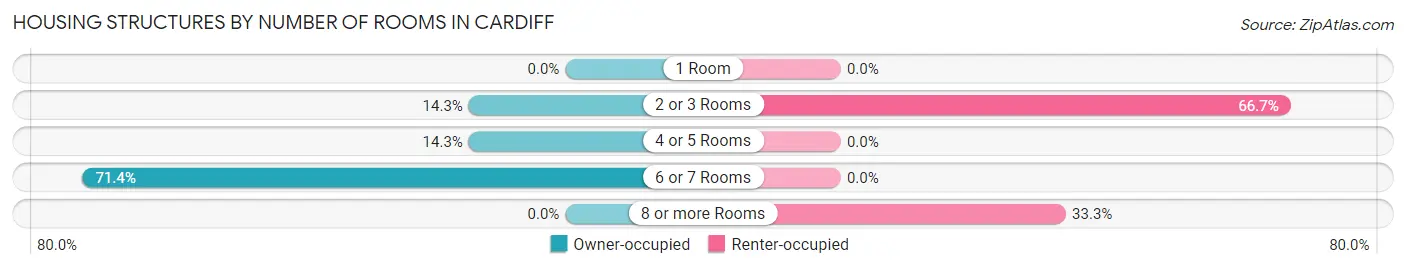
| Number of Rooms | Owner-occupied | Renter-occupied |
| 1 Room | 0 (0.0%) | 0 (0.0%) |
| 2 or 3 Rooms | 1 (14.3%) | 2 (66.7%) |
| 4 or 5 Rooms | 1 (14.3%) | 0 (0.0%) |
| 6 or 7 Rooms | 5 (71.4%) | 0 (0.0%) |
| 8 or more Rooms | 0 (0.0%) | 1 (33.3%) |
| Total | 7 (100.0%) | 3 (100.0%) |
Housing Structure by Heating Type in Cardiff
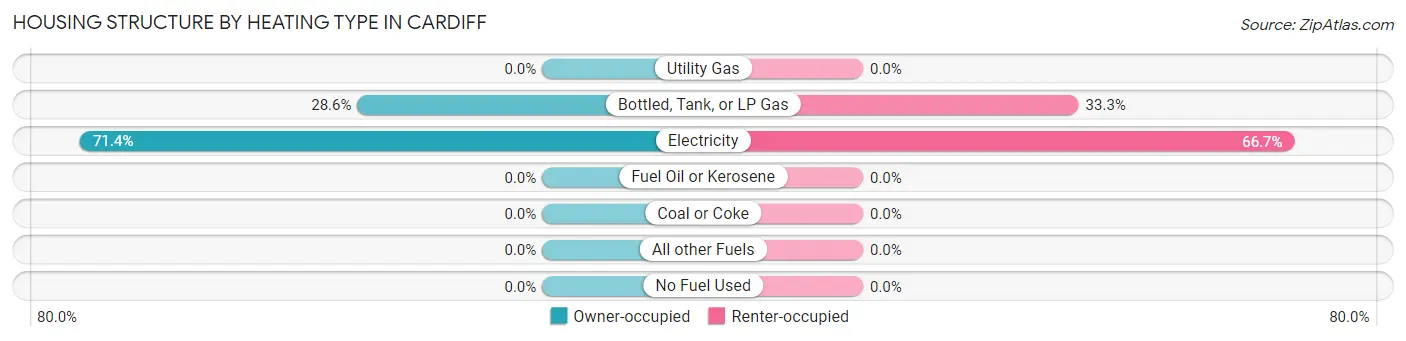
| Heating Type | Owner-occupied | Renter-occupied |
| Utility Gas | 0 (0.0%) | 0 (0.0%) |
| Bottled, Tank, or LP Gas | 2 (28.6%) | 1 (33.3%) |
| Electricity | 5 (71.4%) | 2 (66.7%) |
| Fuel Oil or Kerosene | 0 (0.0%) | 0 (0.0%) |
| Coal or Coke | 0 (0.0%) | 0 (0.0%) |
| All other Fuels | 0 (0.0%) | 0 (0.0%) |
| No Fuel Used | 0 (0.0%) | 0 (0.0%) |
| Total | 7 (100.0%) | 3 (100.0%) |
Household Vehicle Usage in Cardiff
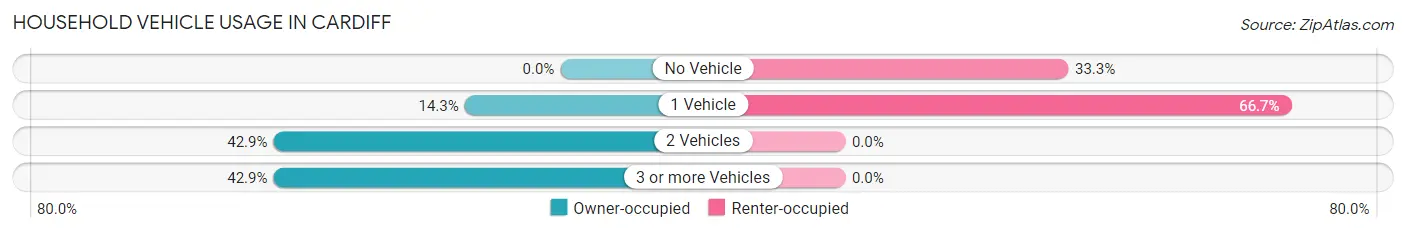
| Vehicles per Household | Owner-occupied | Renter-occupied |
| No Vehicle | 0 (0.0%) | 1 (33.3%) |
| 1 Vehicle | 1 (14.3%) | 2 (66.7%) |
| 2 Vehicles | 3 (42.9%) | 0 (0.0%) |
| 3 or more Vehicles | 3 (42.9%) | 0 (0.0%) |
| Total | 7 (100.0%) | 3 (100.0%) |
Real Estate & Mortgages in Cardiff
Real Estate and Mortgage Overview in Cardiff
| Characteristic | Without Mortgage | With Mortgage |
| Housing Units | 6 | 1 |
| Median Property Value | $80,000 | $0 |
| Median Household Income | - | - |
| Monthly Housing Costs | $400 | $0 |
| Real Estate Taxes | $199 | $0 |
Property Value by Mortgage Status in Cardiff
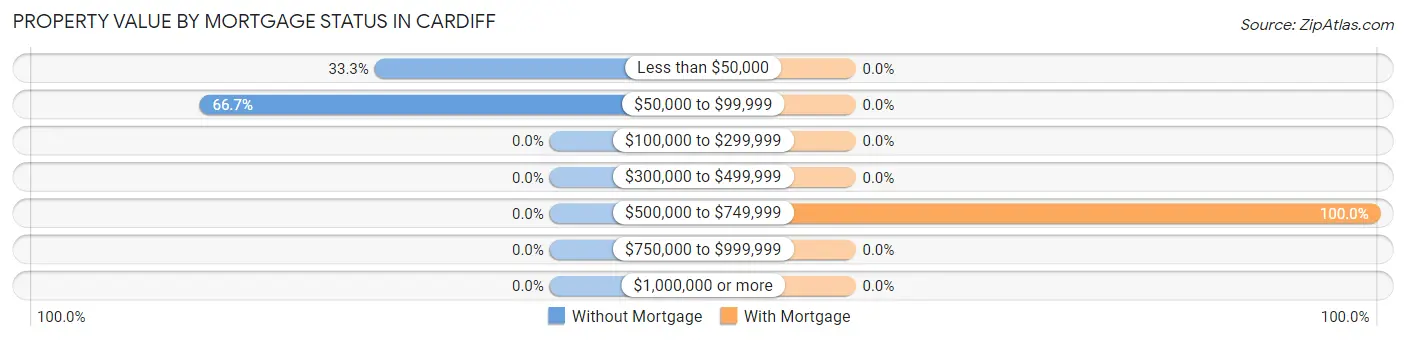
| Property Value | Without Mortgage | With Mortgage |
| Less than $50,000 | 2 (33.3%) | 0 (0.0%) |
| $50,000 to $99,999 | 4 (66.7%) | 0 (0.0%) |
| $100,000 to $299,999 | 0 (0.0%) | 0 (0.0%) |
| $300,000 to $499,999 | 0 (0.0%) | 0 (0.0%) |
| $500,000 to $749,999 | 0 (0.0%) | 1 (100.0%) |
| $750,000 to $999,999 | 0 (0.0%) | 0 (0.0%) |
| $1,000,000 or more | 0 (0.0%) | 0 (0.0%) |
| Total | 6 (100.0%) | 1 (100.0%) |
Household Income by Mortgage Status in Cardiff
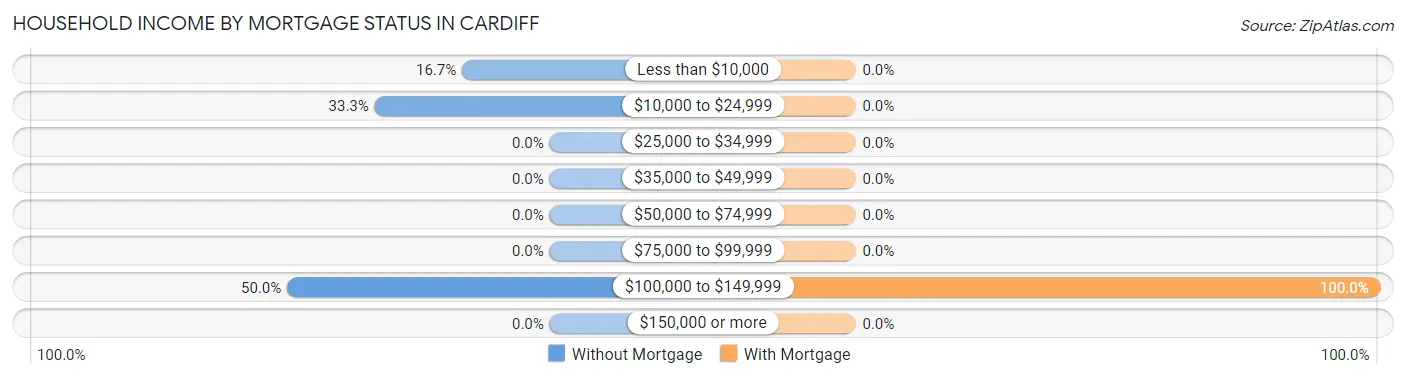
| Household Income | Without Mortgage | With Mortgage |
| Less than $10,000 | 1 (16.7%) | 0 (0.0%) |
| $10,000 to $24,999 | 2 (33.3%) | 0 (0.0%) |
| $25,000 to $34,999 | 0 (0.0%) | 0 (0.0%) |
| $35,000 to $49,999 | 0 (0.0%) | 0 (0.0%) |
| $50,000 to $74,999 | 0 (0.0%) | 0 (0.0%) |
| $75,000 to $99,999 | 0 (0.0%) | 0 (0.0%) |
| $100,000 to $149,999 | 3 (50.0%) | 1 (100.0%) |
| $150,000 or more | 0 (0.0%) | 0 (0.0%) |
| Total | 6 (100.0%) | 1 (100.0%) |
Property Value to Household Income Ratio in Cardiff
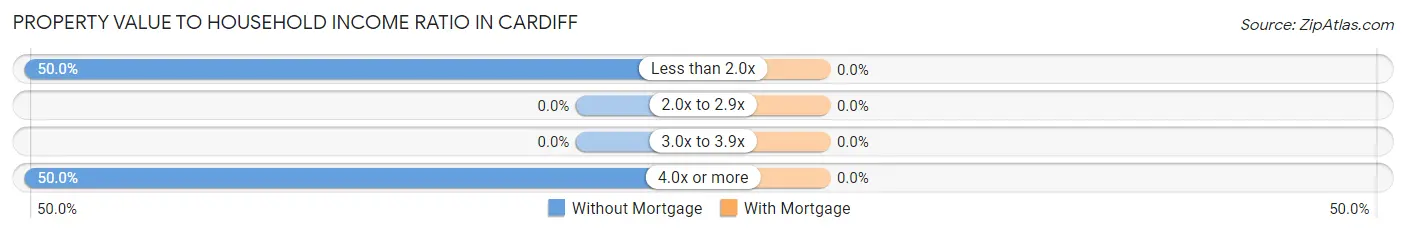
| Value-to-Income Ratio | Without Mortgage | With Mortgage |
| Less than 2.0x | 3 (50.0%) | 0 (0.0%) |
| 2.0x to 2.9x | 0 (0.0%) | 0 (0.0%) |
| 3.0x to 3.9x | 0 (0.0%) | 0 (0.0%) |
| 4.0x or more | 3 (50.0%) | 0 (0.0%) |
| Total | 6 (100.0%) | 1 (100.0%) |
Real Estate Taxes by Mortgage Status in Cardiff
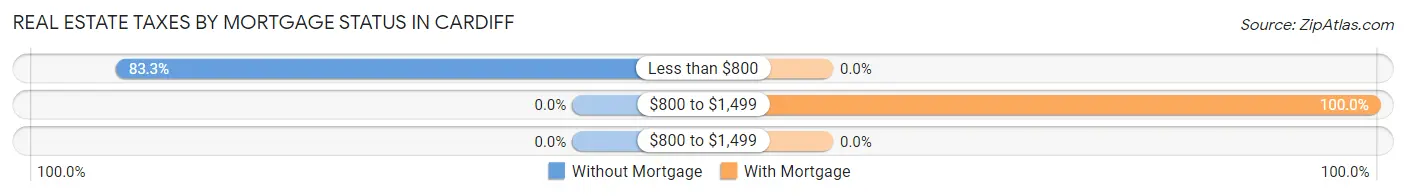
| Property Taxes | Without Mortgage | With Mortgage |
| Less than $800 | 5 (83.3%) | 0 (0.0%) |
| $800 to $1,499 | 0 (0.0%) | 1 (100.0%) |
| $800 to $1,499 | 0 (0.0%) | 0 (0.0%) |
| Total | 6 (100.0%) | 1 (100.0%) |
Health & Disability in Cardiff
Health Insurance Coverage by Age in Cardiff
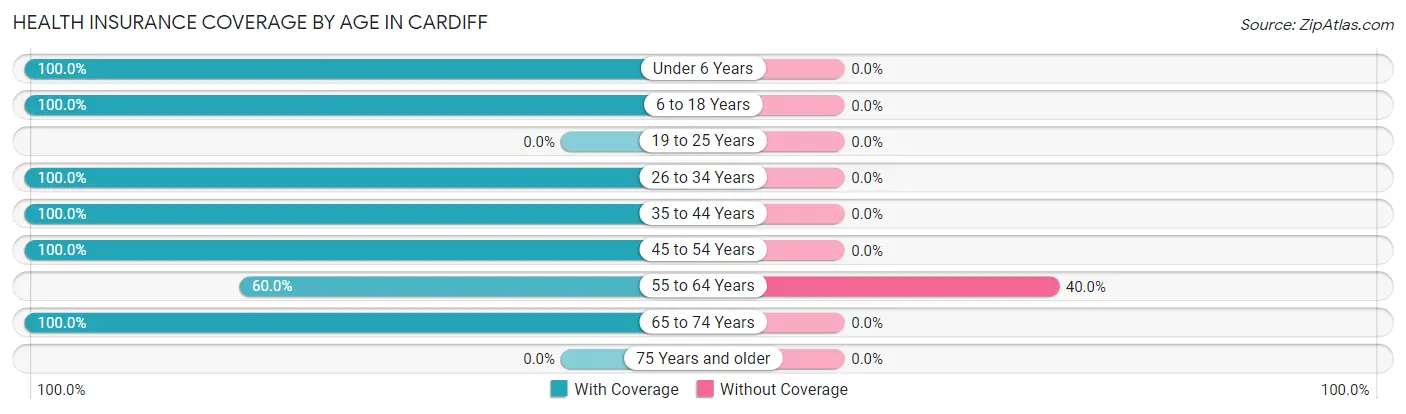
| Age Bracket | With Coverage | Without Coverage |
| Under 6 Years | 2 (100.0%) | 0 (0.0%) |
| 6 to 18 Years | 7 (100.0%) | 0 (0.0%) |
| 19 to 25 Years | 0 (0.0%) | 0 (0.0%) |
| 26 to 34 Years | 1 (100.0%) | 0 (0.0%) |
| 35 to 44 Years | 7 (100.0%) | 0 (0.0%) |
| 45 to 54 Years | 1 (100.0%) | 0 (0.0%) |
| 55 to 64 Years | 3 (60.0%) | 2 (40.0%) |
| 65 to 74 Years | 3 (100.0%) | 0 (0.0%) |
| 75 Years and older | 0 (0.0%) | 0 (0.0%) |
| Total | 24 (92.3%) | 2 (7.7%) |
Health Insurance Coverage by Citizenship Status in Cardiff
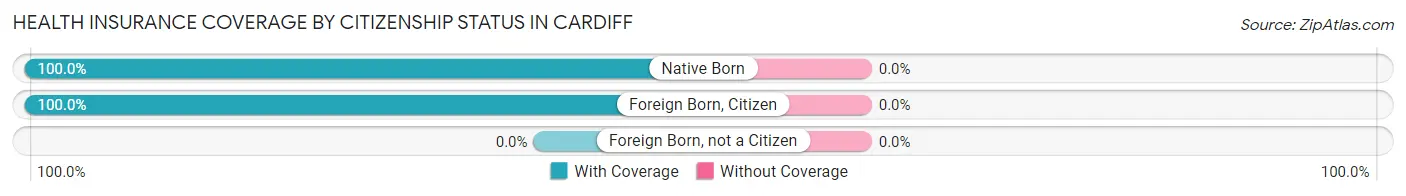
| Citizenship Status | With Coverage | Without Coverage |
| Native Born | 2 (100.0%) | 0 (0.0%) |
| Foreign Born, Citizen | 7 (100.0%) | 0 (0.0%) |
| Foreign Born, not a Citizen | 0 (0.0%) | 0 (0.0%) |
Health Insurance Coverage by Household Income in Cardiff
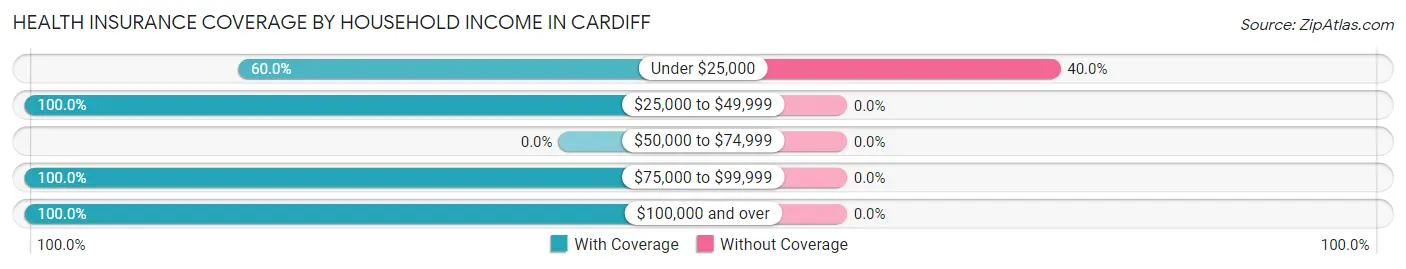
| Household Income | With Coverage | Without Coverage |
| Under $25,000 | 3 (60.0%) | 2 (40.0%) |
| $25,000 to $49,999 | 3 (100.0%) | 0 (0.0%) |
| $50,000 to $74,999 | 0 (0.0%) | 0 (0.0%) |
| $75,000 to $99,999 | 2 (100.0%) | 0 (0.0%) |
| $100,000 and over | 16 (100.0%) | 0 (0.0%) |
Public vs Private Health Insurance Coverage by Age in Cardiff
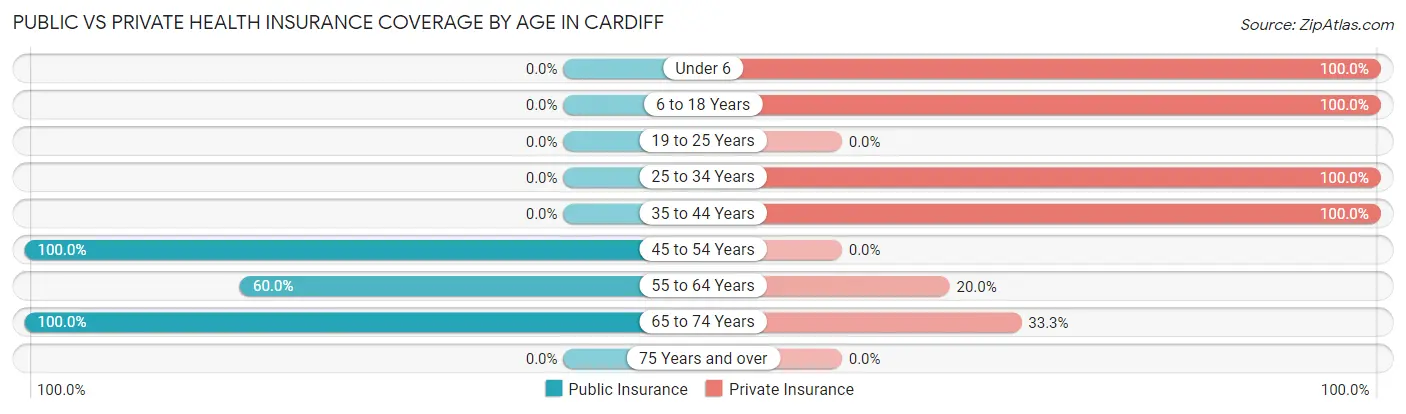
| Age Bracket | Public Insurance | Private Insurance |
| Under 6 | 0 (0.0%) | 2 (100.0%) |
| 6 to 18 Years | 0 (0.0%) | 7 (100.0%) |
| 19 to 25 Years | 0 (0.0%) | 0 (0.0%) |
| 25 to 34 Years | 0 (0.0%) | 1 (100.0%) |
| 35 to 44 Years | 0 (0.0%) | 7 (100.0%) |
| 45 to 54 Years | 1 (100.0%) | 0 (0.0%) |
| 55 to 64 Years | 3 (60.0%) | 1 (20.0%) |
| 65 to 74 Years | 3 (100.0%) | 1 (33.3%) |
| 75 Years and over | 0 (0.0%) | 0 (0.0%) |
| Total | 7 (26.9%) | 19 (73.1%) |
Disability Status by Sex by Age in Cardiff
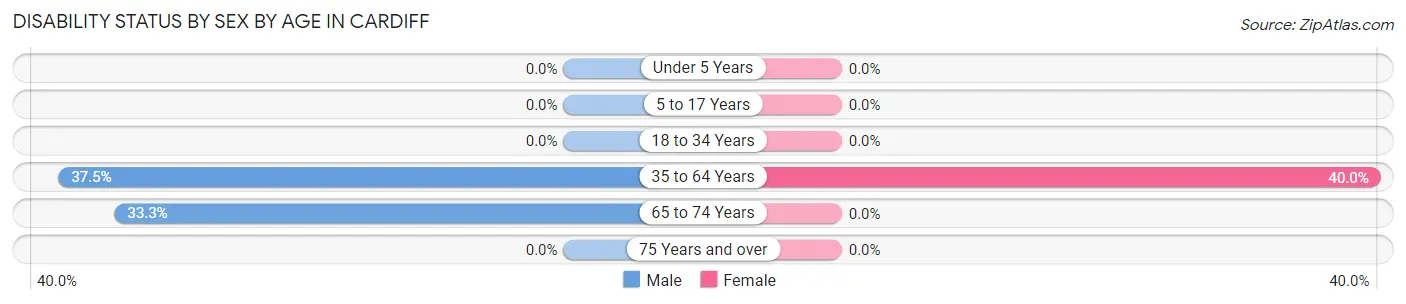
| Age Bracket | Male | Female |
| Under 5 Years | 0 (0.0%) | 0 (0.0%) |
| 5 to 17 Years | 0 (0.0%) | 0 (0.0%) |
| 18 to 34 Years | 0 (0.0%) | 0 (0.0%) |
| 35 to 64 Years | 3 (37.5%) | 2 (40.0%) |
| 65 to 74 Years | 1 (33.3%) | 0 (0.0%) |
| 75 Years and over | 0 (0.0%) | 0 (0.0%) |
Disability Class by Sex by Age in Cardiff
Disability Class: Hearing Difficulty
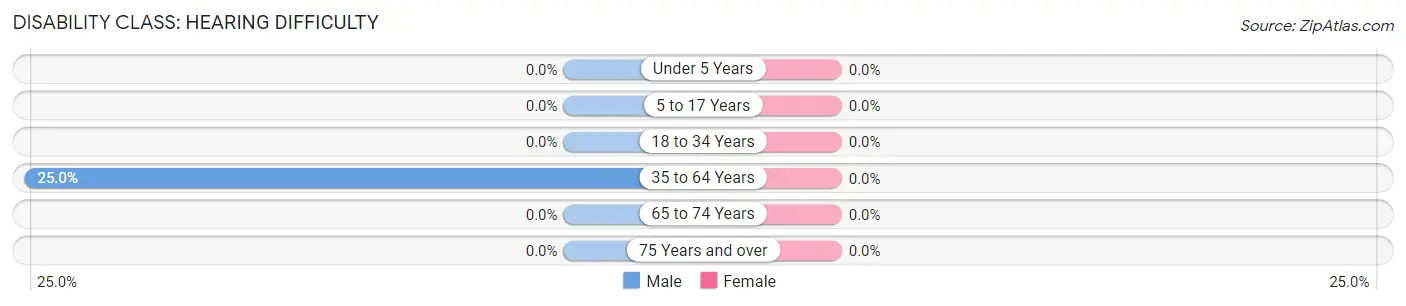
| Age Bracket | Male | Female |
| Under 5 Years | 0 (0.0%) | 0 (0.0%) |
| 5 to 17 Years | 0 (0.0%) | 0 (0.0%) |
| 18 to 34 Years | 0 (0.0%) | 0 (0.0%) |
| 35 to 64 Years | 2 (25.0%) | 0 (0.0%) |
| 65 to 74 Years | 0 (0.0%) | 0 (0.0%) |
| 75 Years and over | 0 (0.0%) | 0 (0.0%) |
Disability Class: Vision Difficulty
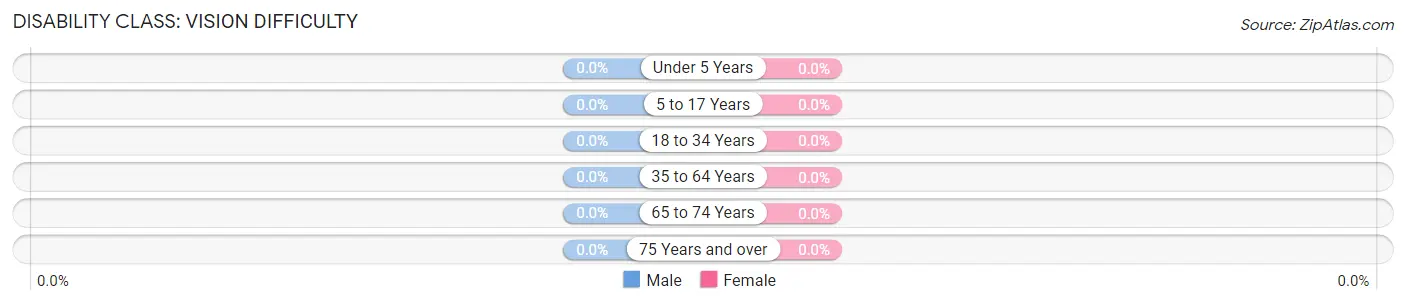
| Age Bracket | Male | Female |
| Under 5 Years | 0 (0.0%) | 0 (0.0%) |
| 5 to 17 Years | 0 (0.0%) | 0 (0.0%) |
| 18 to 34 Years | 0 (0.0%) | 0 (0.0%) |
| 35 to 64 Years | 0 (0.0%) | 0 (0.0%) |
| 65 to 74 Years | 0 (0.0%) | 0 (0.0%) |
| 75 Years and over | 0 (0.0%) | 0 (0.0%) |
Disability Class: Cognitive Difficulty
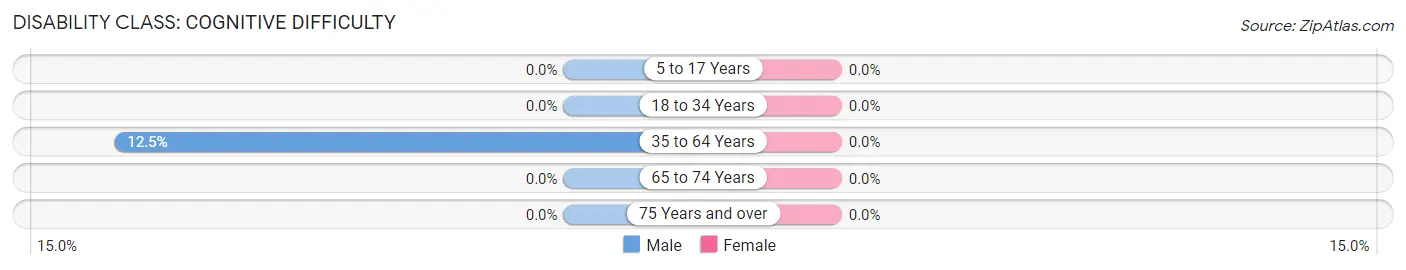
| Age Bracket | Male | Female |
| 5 to 17 Years | 0 (0.0%) | 0 (0.0%) |
| 18 to 34 Years | 0 (0.0%) | 0 (0.0%) |
| 35 to 64 Years | 1 (12.5%) | 0 (0.0%) |
| 65 to 74 Years | 0 (0.0%) | 0 (0.0%) |
| 75 Years and over | 0 (0.0%) | 0 (0.0%) |
Disability Class: Ambulatory Difficulty
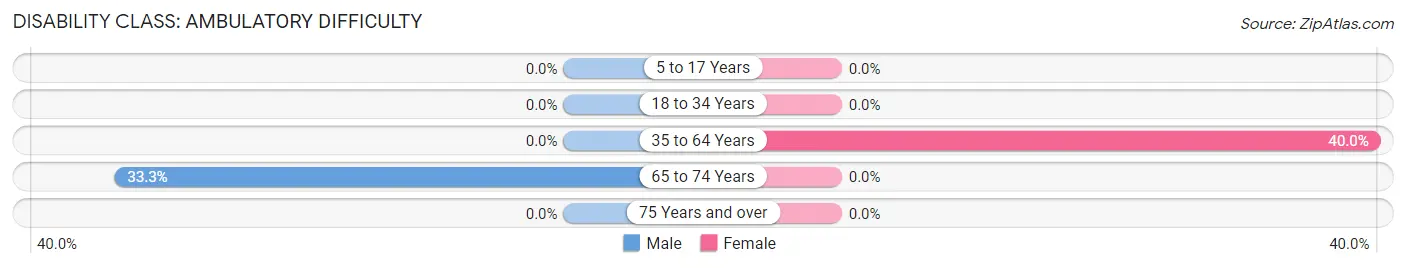
| Age Bracket | Male | Female |
| 5 to 17 Years | 0 (0.0%) | 0 (0.0%) |
| 18 to 34 Years | 0 (0.0%) | 0 (0.0%) |
| 35 to 64 Years | 0 (0.0%) | 2 (40.0%) |
| 65 to 74 Years | 1 (33.3%) | 0 (0.0%) |
| 75 Years and over | 0 (0.0%) | 0 (0.0%) |
Disability Class: Self-Care Difficulty
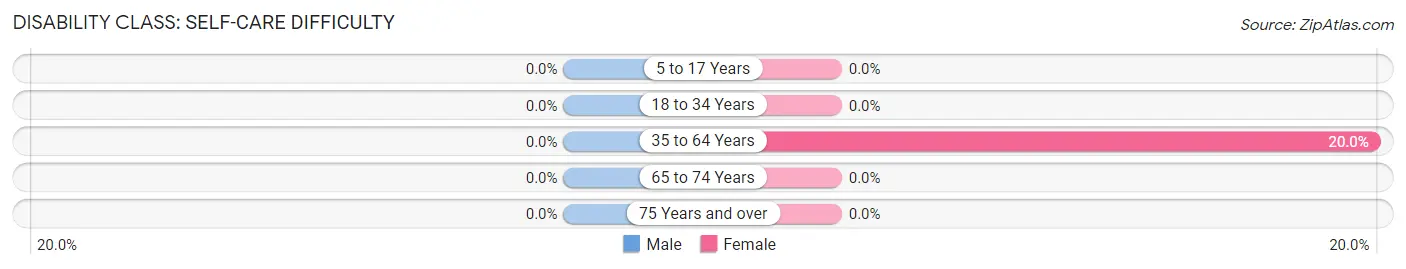
| Age Bracket | Male | Female |
| 5 to 17 Years | 0 (0.0%) | 0 (0.0%) |
| 18 to 34 Years | 0 (0.0%) | 0 (0.0%) |
| 35 to 64 Years | 0 (0.0%) | 1 (20.0%) |
| 65 to 74 Years | 0 (0.0%) | 0 (0.0%) |
| 75 Years and over | 0 (0.0%) | 0 (0.0%) |
Technology Access in Cardiff
Computing Device Access in Cardiff
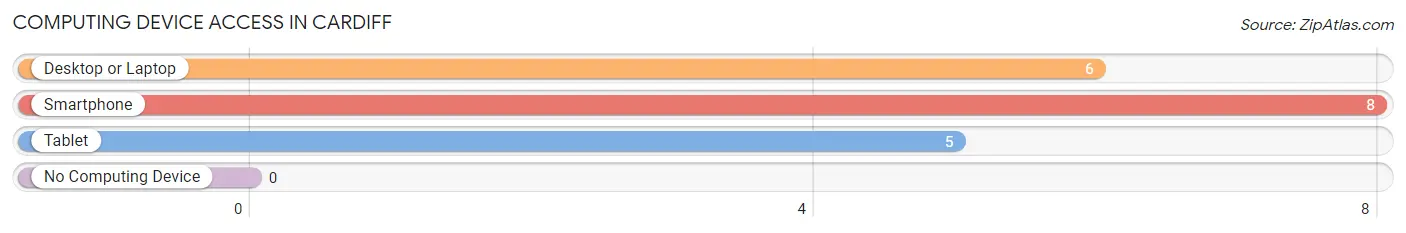
| Device Type | # Households | % Households |
| Desktop or Laptop | 6 | 60.0% |
| Smartphone | 8 | 80.0% |
| Tablet | 5 | 50.0% |
| No Computing Device | 0 | 0.0% |
| Total | 10 | 100.0% |
Internet Access in Cardiff
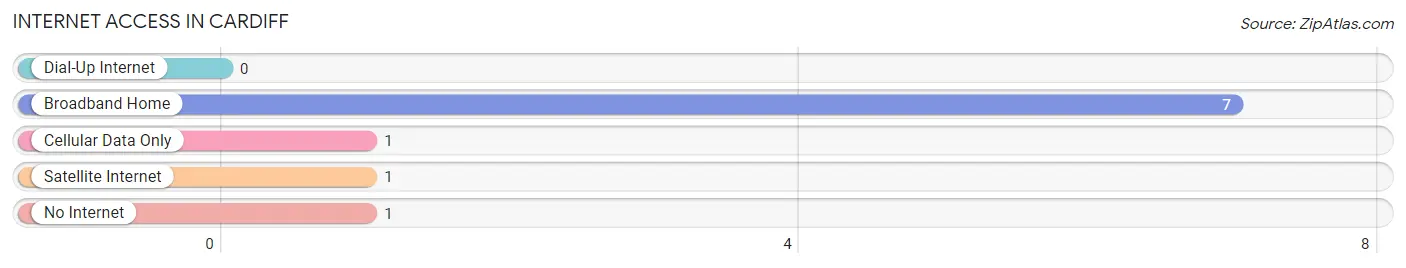
| Internet Type | # Households | % Households |
| Dial-Up Internet | 0 | 0.0% |
| Broadband Home | 7 | 70.0% |
| Cellular Data Only | 1 | 10.0% |
| Satellite Internet | 1 | 10.0% |
| No Internet | 1 | 10.0% |
| Total | 10 | 100.0% |
Cardiff Summary
Cardiff is a city located in the county of South Glamorgan, Wales. It is the capital and largest city in Wales, with a population of approximately 346,100 in 2019. Cardiff is a major commercial centre and the main economic driver in the region. It is home to the Welsh Assembly, the National Assembly for Wales, and the Welsh Government.
History
Cardiff has a long and varied history, with evidence of human settlement in the area dating back to the Neolithic period. The Romans established a fort in the area in AD 75, and the Normans built a castle in the 12th century. The city was granted its first charter in 1155, and by the 14th century it had become an important port and trading centre.
In the 19th century, Cardiff experienced a period of rapid growth and development, becoming a major coal-exporting port. This led to the construction of the Cardiff Docks, which were the largest in the world at the time. The city was also the site of the first passenger railway in Wales, which opened in 1850.
In the 20th century, Cardiff continued to grow and develop, becoming the capital of Wales in 1955. The city has since become a major centre for culture, sport, education, and business.
Geography
Cardiff is located in the south of Wales, on the Bristol Channel coast. It is situated on the River Taff, which flows through the city centre. The city is surrounded by hills and mountains, including the Brecon Beacons to the north and the Black Mountains to the east.
The city has a temperate climate, with mild winters and warm summers. The average temperature in July is 17°C (63°F), and the average temperature in January is 5°C (41°F).
Economy
Cardiff is the main economic driver in the region, and is home to a number of major employers. The city is a major centre for finance, with several banks and insurance companies based in the city. It is also a major centre for retail, with the St. David's shopping centre being the largest in Wales.
The city is home to a number of major companies, including Admiral Insurance, BBC Wales, and the Welsh Government. The Cardiff Bay area is home to a number of media companies, including the BBC and ITV Wales.
Demographics
Cardiff has a diverse population, with people from a variety of backgrounds and cultures. The city has a large Welsh-speaking population, with around 30% of the population speaking Welsh as their first language.
The city has a young population, with around 40% of the population aged under 25. The city also has a large student population, with around 40,000 students attending the city's universities.
Conclusion
Cardiff is a vibrant and diverse city, with a long and varied history. It is the capital and largest city in Wales, and is a major commercial centre and the main economic driver in the region. The city has a diverse population, with people from a variety of backgrounds and cultures. It is also a major centre for finance, retail, media, and education.
Common Questions
What is Per Capita Income in Cardiff?
Per Capita income in Cardiff is $22,423.
What is the Median Family Income in Cardiff?
Median Family Income in Cardiff is $123,750.
What is Inequality or Gini Index in Cardiff?
Inequality or Gini Index in Cardiff is 0.50.
What is the Total Population of Cardiff?
Total Population of Cardiff is 26.
What is the Total Male Population of Cardiff?
Total Male Population of Cardiff is 16.
What is the Total Female Population of Cardiff?
Total Female Population of Cardiff is 10.
What is the Ratio of Males per 100 Females in Cardiff?
There are 160.00 Males per 100 Females in Cardiff.
What is the Ratio of Females per 100 Males in Cardiff?
There are 62.50 Females per 100 Males in Cardiff.
What is the Median Population Age in Cardiff?
Median Population Age in Cardiff is 38.5 Years.
What is the Average Family Size in Cardiff
Average Family Size in Cardiff is 4.5 People.
What is the Average Household Size in Cardiff
Average Household Size in Cardiff is 2.6 People.
How Large is the Labor Force in Cardiff?
There are 14 People in the Labor Forcein in Cardiff.
What is the Percentage of People in the Labor Force in Cardiff?
70.0% of People are in the Labor Force in Cardiff.