Joppa, AL Map & Demographics
Joppa Map
Joppa Overview
$35,561
PER CAPITA INCOME
25.8%
WAGE / INCOME GAP [ % ]
74.2¢/ $1
WAGE / INCOME GAP [ $ ]
0.47
INEQUALITY / GINI INDEX
378
TOTAL POPULATION
219
MALE POPULATION
159
FEMALE POPULATION
137.74
MALES / 100 FEMALES
72.60
FEMALES / 100 MALES
37.5
MEDIAN AGE
3.5
AVG FAMILY SIZE
3.0
AVG HOUSEHOLD SIZE
219
LABOR FORCE [ PEOPLE ]
75.0%
PERCENT IN LABOR FORCE
Joppa Zip Codes
Income in Joppa
Income Overview in Joppa
| Characteristic | Number | Measure |
| Per Capita Income | 378 | $35,561 |
| Median Family Income | 95 | $0 |
| Mean Family Income | 95 | $78,508 |
| Median Household Income | 125 | $0 |
| Mean Household Income | 125 | $97,618 |
| Income Deficit | 95 | $0 |
| Wage / Income Gap (%) | 378 | 25.76% |
| Wage / Income Gap ($) | 378 | 74.24¢ per $1 |
| Gini / Inequality Index | 378 | 0.47 |
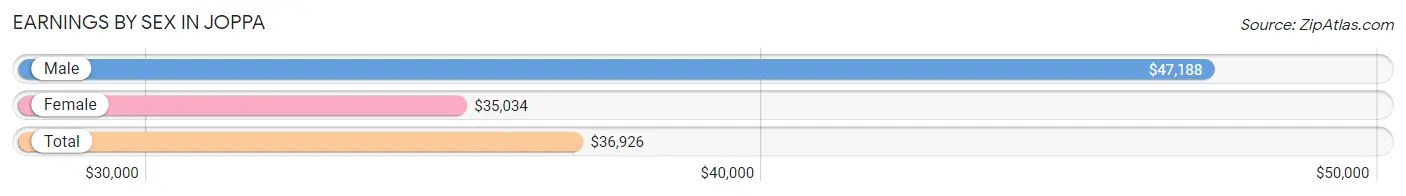
Earnings by Sex in Joppa
Average Earnings in Joppa are $36,926, $47,188 for men and $35,034 for women, a difference of 25.8%.
| Sex | Number | Average Earnings |
| Male | 116 (53.0%) | $47,188 |
| Female | 103 (47.0%) | $35,034 |
| Total | 219 (100.0%) | $36,926 |
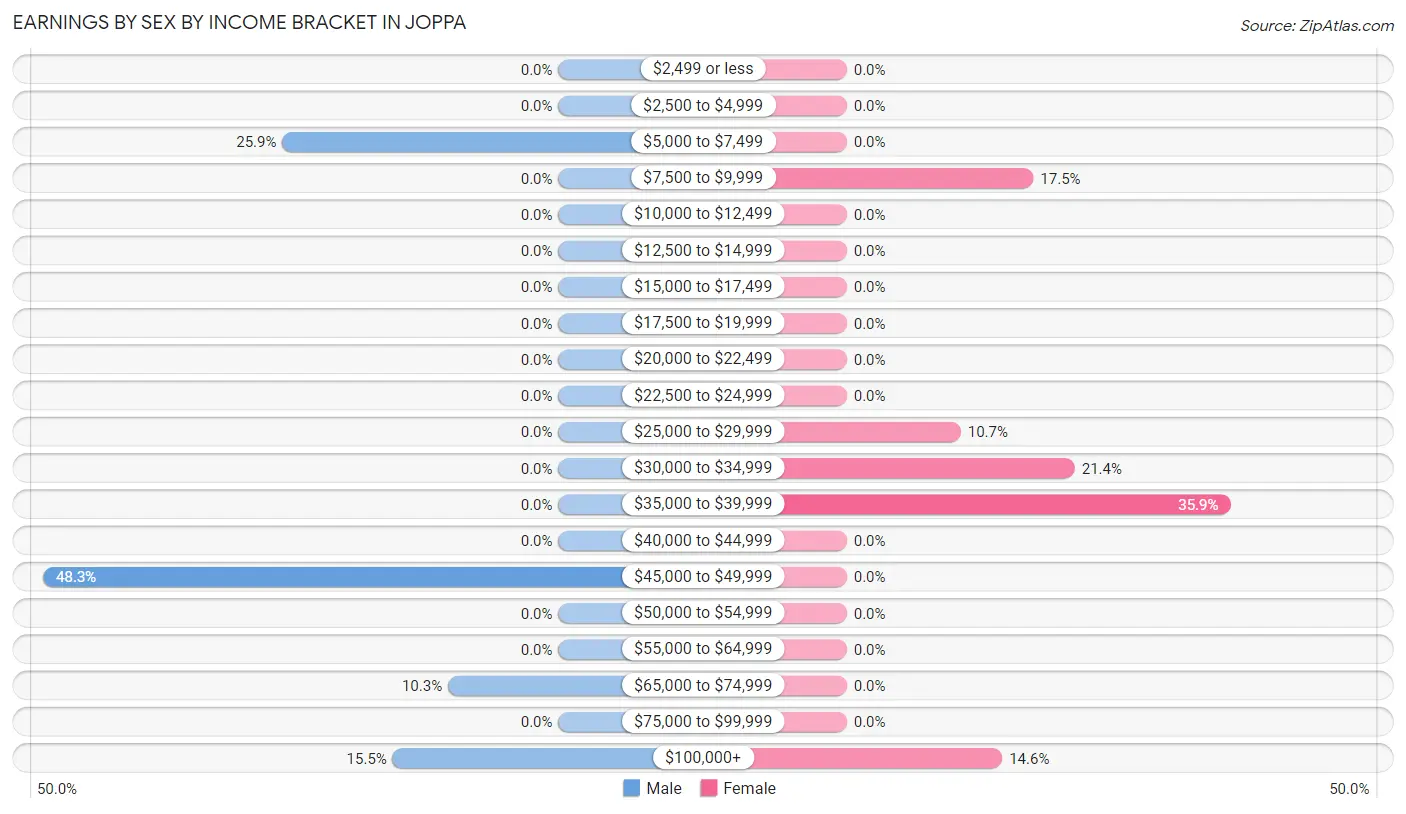
Earnings by Sex by Income Bracket in Joppa
The most common earnings brackets in Joppa are $45,000 to $49,999 for men (56 | 48.3%) and $35,000 to $39,999 for women (37 | 35.9%).
| Income | Male | Female |
| $2,499 or less | 0 (0.0%) | 0 (0.0%) |
| $2,500 to $4,999 | 0 (0.0%) | 0 (0.0%) |
| $5,000 to $7,499 | 30 (25.9%) | 0 (0.0%) |
| $7,500 to $9,999 | 0 (0.0%) | 18 (17.5%) |
| $10,000 to $12,499 | 0 (0.0%) | 0 (0.0%) |
| $12,500 to $14,999 | 0 (0.0%) | 0 (0.0%) |
| $15,000 to $17,499 | 0 (0.0%) | 0 (0.0%) |
| $17,500 to $19,999 | 0 (0.0%) | 0 (0.0%) |
| $20,000 to $22,499 | 0 (0.0%) | 0 (0.0%) |
| $22,500 to $24,999 | 0 (0.0%) | 0 (0.0%) |
| $25,000 to $29,999 | 0 (0.0%) | 11 (10.7%) |
| $30,000 to $34,999 | 0 (0.0%) | 22 (21.4%) |
| $35,000 to $39,999 | 0 (0.0%) | 37 (35.9%) |
| $40,000 to $44,999 | 0 (0.0%) | 0 (0.0%) |
| $45,000 to $49,999 | 56 (48.3%) | 0 (0.0%) |
| $50,000 to $54,999 | 0 (0.0%) | 0 (0.0%) |
| $55,000 to $64,999 | 0 (0.0%) | 0 (0.0%) |
| $65,000 to $74,999 | 12 (10.3%) | 0 (0.0%) |
| $75,000 to $99,999 | 0 (0.0%) | 0 (0.0%) |
| $100,000+ | 18 (15.5%) | 15 (14.6%) |
| Total | 116 (100.0%) | 103 (100.0%) |
Earnings by Sex by Educational Attainment in Joppa
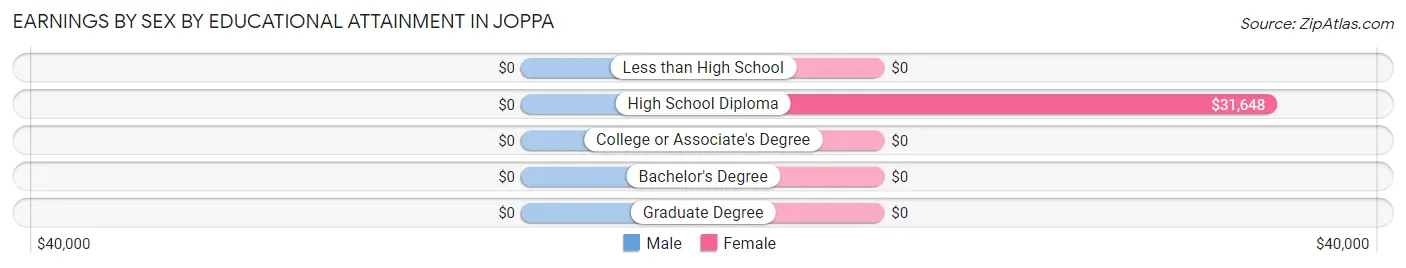
| Educational Attainment | Male Income | Female Income |
| Less than High School | - | - |
| High School Diploma | - | - |
| College or Associate's Degree | - | - |
| Bachelor's Degree | - | - |
| Graduate Degree | - | - |
| Total | - | - |
Family Income in Joppa
Family Income Brackets in Joppa
According to the Joppa family income data, there are 50 families falling into the $35,000 to $49,999 income range, which is the most common income bracket and makes up 52.6% of all families.
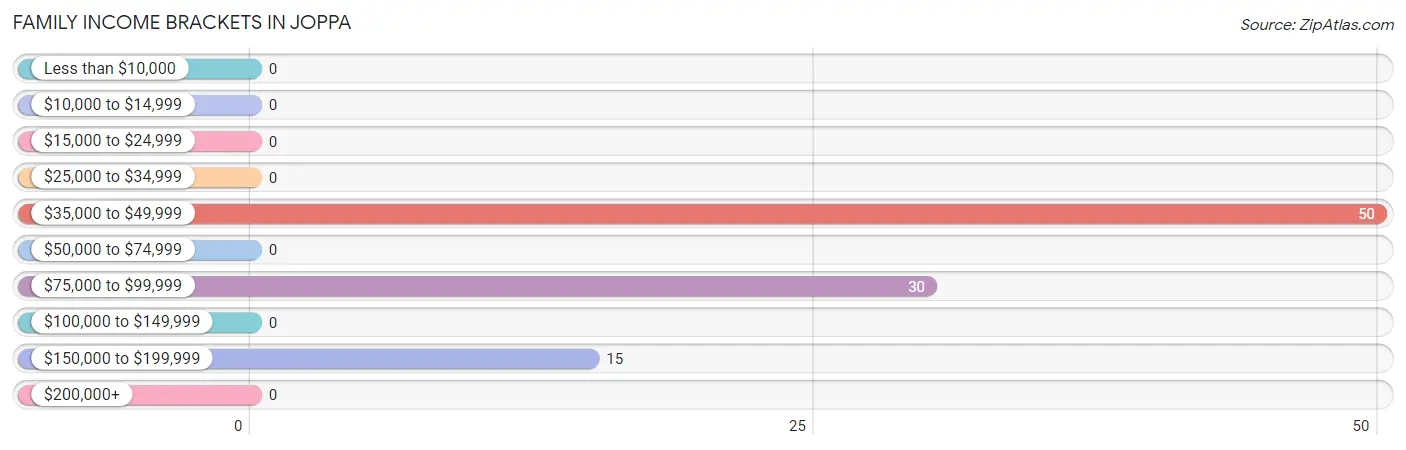
| Income Bracket | # Families | % Families |
| Less than $10,000 | 0 | 0.0% |
| $10,000 to $14,999 | 0 | 0.0% |
| $15,000 to $24,999 | 0 | 0.0% |
| $25,000 to $34,999 | 0 | 0.0% |
| $35,000 to $49,999 | 50 | 52.6% |
| $50,000 to $74,999 | 0 | 0.0% |
| $75,000 to $99,999 | 30 | 31.6% |
| $100,000 to $149,999 | 0 | 0.0% |
| $150,000 to $199,999 | 15 | 15.8% |
| $200,000+ | 0 | 0.0% |
Family Income by Famaliy Size in Joppa
| Income Bracket | # Families | Median Income |
| 2-Person Families | 43 (45.3%) | $0 |
| 3-Person Families | 19 (20.0%) | $0 |
| 4-Person Families | 33 (34.7%) | $0 |
| 5-Person Families | 0 (0.0%) | $0 |
| 6-Person Families | 0 (0.0%) | $0 |
| 7+ Person Families | 0 (0.0%) | $0 |
| Total | 95 (100.0%) | $0 |
Family Income by Number of Earners in Joppa
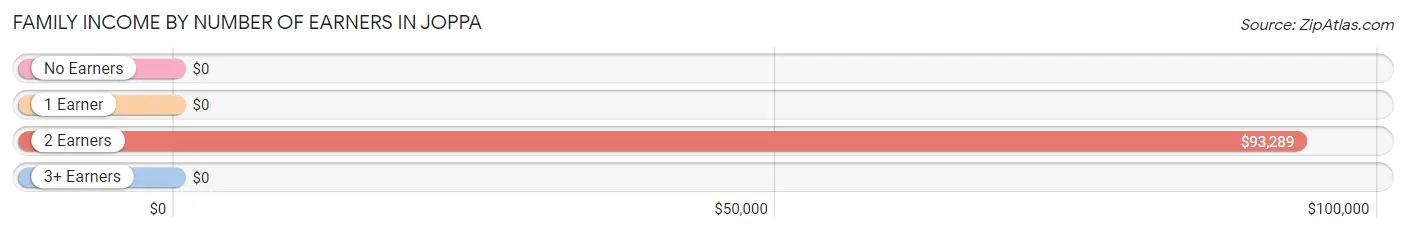
| Number of Earners | # Families | Median Income |
| No Earners | 32 (33.7%) | $0 |
| 1 Earner | 0 (0.0%) | $0 |
| 2 Earners | 48 (50.5%) | $93,289 |
| 3+ Earners | 15 (15.8%) | $0 |
| Total | 95 (100.0%) | $0 |
Household Income in Joppa
Household Income Brackets in Joppa
With 50 households falling in the category, the $35,000 to $49,999 income range is the most frequent in Joppa, accounting for 40.0% of all households.
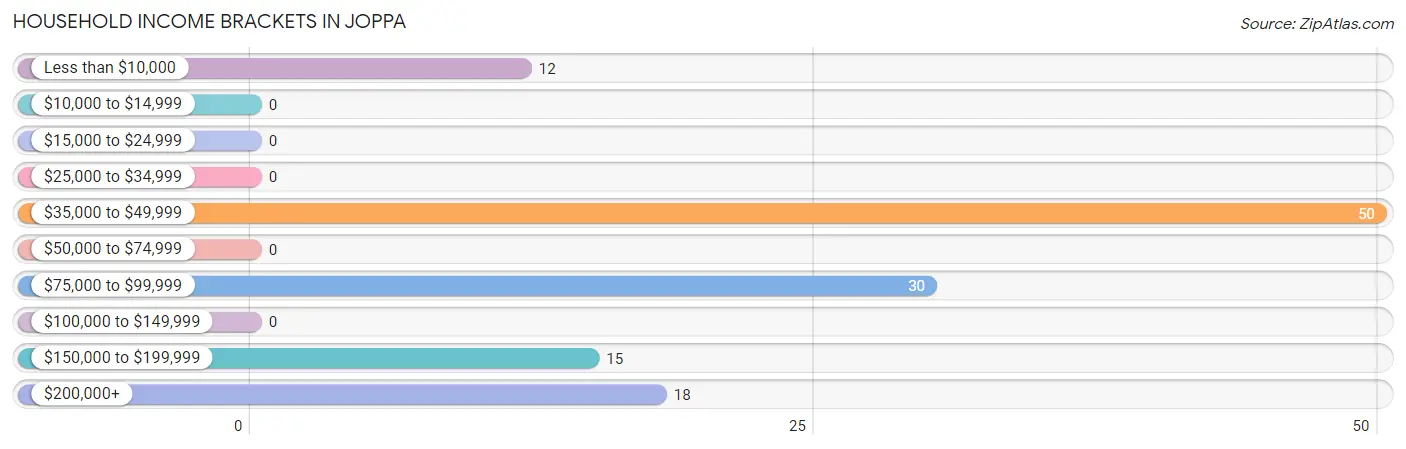
| Income Bracket | # Households | % Households |
| Less than $10,000 | 12 | 9.6% |
| $10,000 to $14,999 | 0 | 0.0% |
| $15,000 to $24,999 | 0 | 0.0% |
| $25,000 to $34,999 | 0 | 0.0% |
| $35,000 to $49,999 | 50 | 40.0% |
| $50,000 to $74,999 | 0 | 0.0% |
| $75,000 to $99,999 | 30 | 24.0% |
| $100,000 to $149,999 | 0 | 0.0% |
| $150,000 to $199,999 | 15 | 12.0% |
| $200,000+ | 18 | 14.4% |
Household Income by Householder Age in Joppa
The median household income in Joppa is $0, with the highest median household income of $181,167 found in the 25 to 44 years age bracket for the primary householder. A total of 52 households (41.6%) fall into this category.
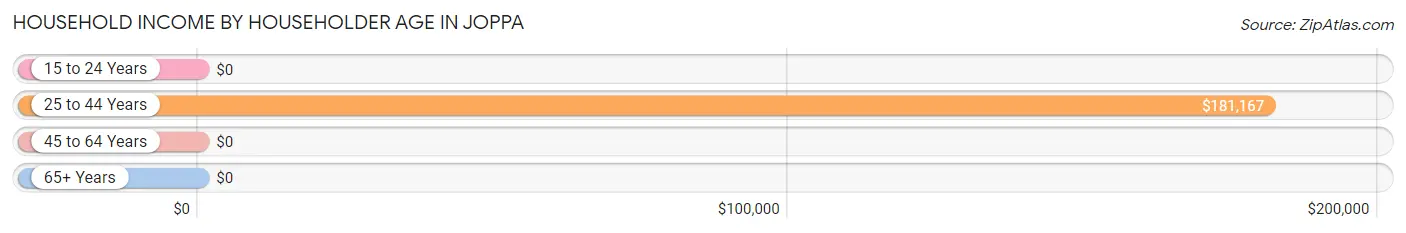
| Income Bracket | # Households | Median Income |
| 15 to 24 Years | 0 (0.0%) | $0 |
| 25 to 44 Years | 52 (41.6%) | $181,167 |
| 45 to 64 Years | 41 (32.8%) | $0 |
| 65+ Years | 32 (25.6%) | $0 |
| Total | 125 (100.0%) | $0 |
Poverty in Joppa
Income Below Poverty by Sex and Age in Joppa
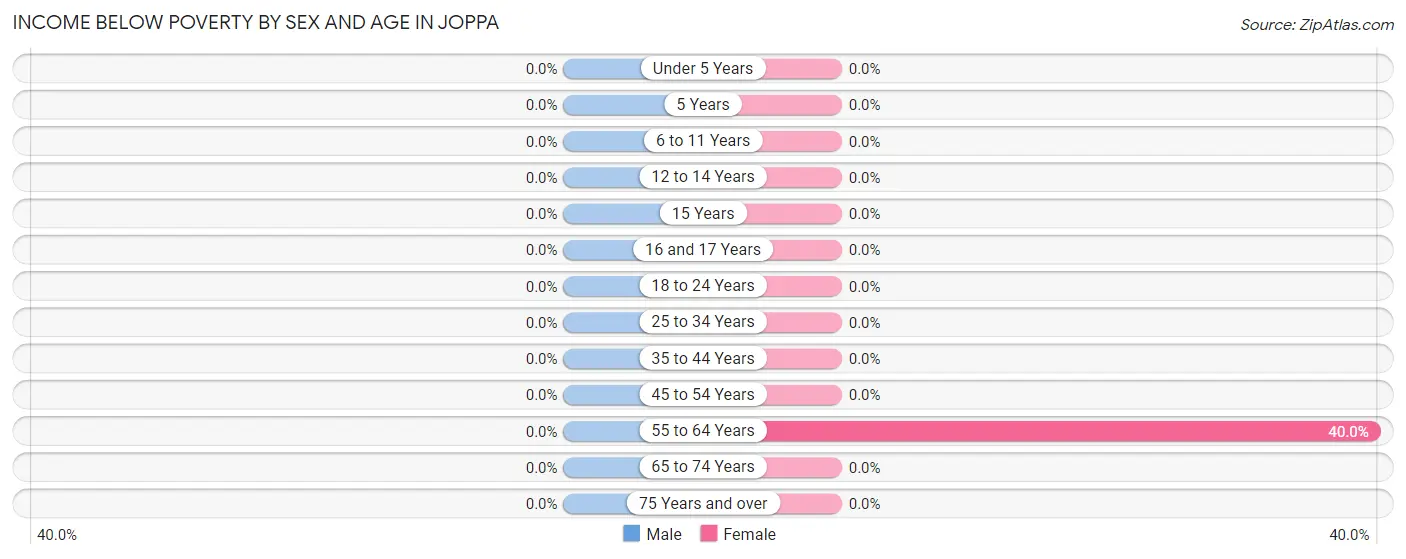
| Age Bracket | Male | Female |
| Under 5 Years | 0 (0.0%) | 0 (0.0%) |
| 5 Years | 0 (0.0%) | 0 (0.0%) |
| 6 to 11 Years | 0 (0.0%) | 0 (0.0%) |
| 12 to 14 Years | 0 (0.0%) | 0 (0.0%) |
| 15 Years | 0 (0.0%) | 0 (0.0%) |
| 16 and 17 Years | 0 (0.0%) | 0 (0.0%) |
| 18 to 24 Years | 0 (0.0%) | 0 (0.0%) |
| 25 to 34 Years | 0 (0.0%) | 0 (0.0%) |
| 35 to 44 Years | 0 (0.0%) | 0 (0.0%) |
| 45 to 54 Years | 0 (0.0%) | 0 (0.0%) |
| 55 to 64 Years | 0 (0.0%) | 12 (40.0%) |
| 65 to 74 Years | 0 (0.0%) | 0 (0.0%) |
| 75 Years and over | 0 (0.0%) | 0 (0.0%) |
| Total | 0 (0.0%) | 12 (7.5%) |
Income Above Poverty by Sex and Age in Joppa
According to the poverty statistics in Joppa, males aged under 5 years and females aged 6 to 11 years are the age groups that are most secure financially, with 100.0% of males and 100.0% of females in these age groups living above the poverty line.
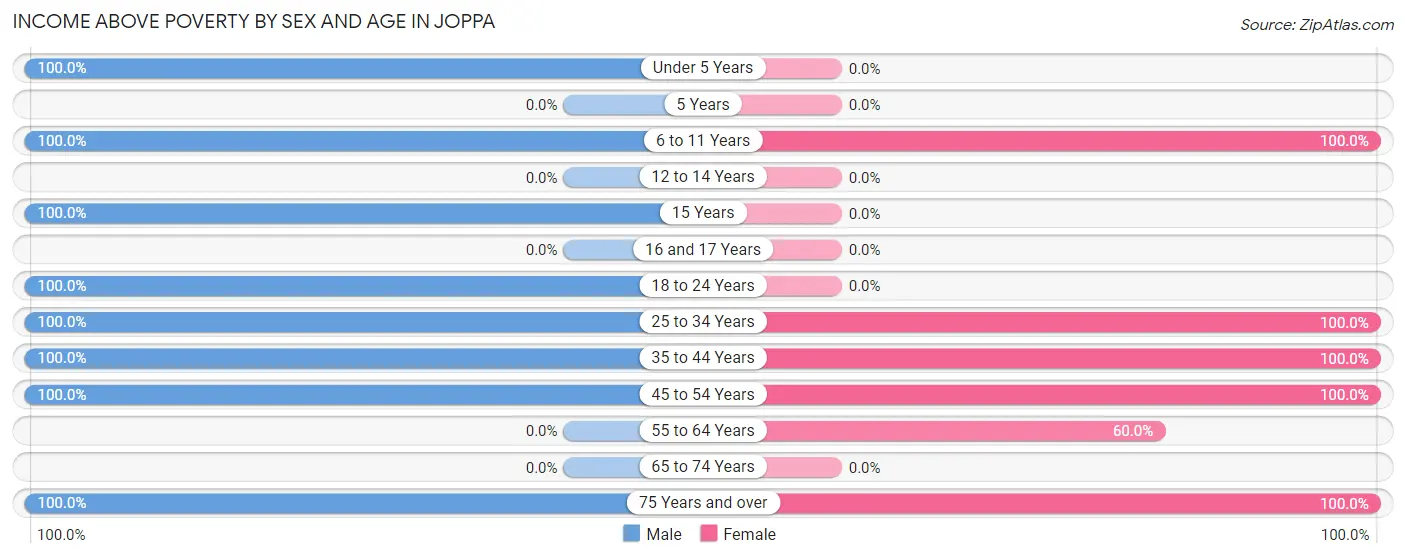
| Age Bracket | Male | Female |
| Under 5 Years | 20 (100.0%) | 0 (0.0%) |
| 5 Years | 0 (0.0%) | 0 (0.0%) |
| 6 to 11 Years | 18 (100.0%) | 15 (100.0%) |
| 12 to 14 Years | 0 (0.0%) | 0 (0.0%) |
| 15 Years | 33 (100.0%) | 0 (0.0%) |
| 16 and 17 Years | 0 (0.0%) | 0 (0.0%) |
| 18 to 24 Years | 30 (100.0%) | 0 (0.0%) |
| 25 to 34 Years | 24 (100.0%) | 37 (100.0%) |
| 35 to 44 Years | 18 (100.0%) | 37 (100.0%) |
| 45 to 54 Years | 44 (100.0%) | 11 (100.0%) |
| 55 to 64 Years | 0 (0.0%) | 18 (60.0%) |
| 65 to 74 Years | 0 (0.0%) | 0 (0.0%) |
| 75 Years and over | 32 (100.0%) | 29 (100.0%) |
| Total | 219 (100.0%) | 147 (92.4%) |
Income Below Poverty Among Married-Couple Families in Joppa
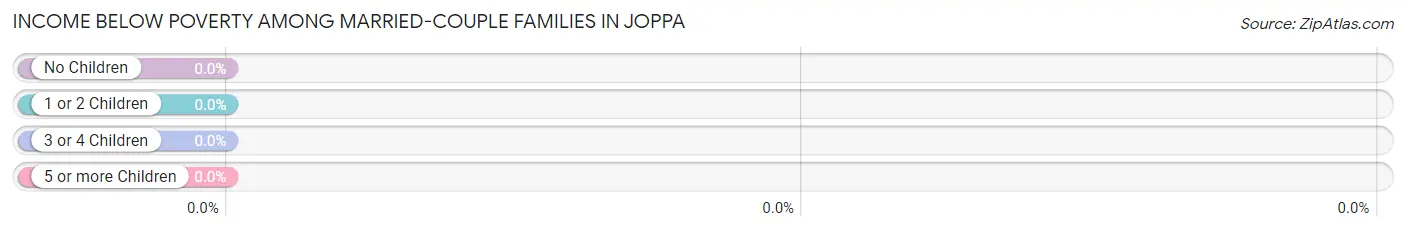
| Children | Above Poverty | Below Poverty |
| No Children | 43 (100.0%) | 0 (0.0%) |
| 1 or 2 Children | 34 (100.0%) | 0 (0.0%) |
| 3 or 4 Children | 0 (0.0%) | 0 (0.0%) |
| 5 or more Children | 0 (0.0%) | 0 (0.0%) |
| Total | 77 (100.0%) | 0 (0.0%) |
Income Below Poverty Among Single-Parent Households in Joppa
| Children | Single Father | Single Mother |
| No Children | 0 (0.0%) | 0 (0.0%) |
| 1 or 2 Children | 0 (0.0%) | 0 (0.0%) |
| 3 or 4 Children | 0 (0.0%) | 0 (0.0%) |
| 5 or more Children | 0 (0.0%) | 0 (0.0%) |
| Total | 0 (0.0%) | 0 (0.0%) |
Income Below Poverty Among Married-Couple vs Single-Parent Households in Joppa
| Children | Married-Couple Families | Single-Parent Households |
| No Children | 0 (0.0%) | 0 (0.0%) |
| 1 or 2 Children | 0 (0.0%) | 0 (0.0%) |
| 3 or 4 Children | 0 (0.0%) | 0 (0.0%) |
| 5 or more Children | 0 (0.0%) | 0 (0.0%) |
| Total | 0 (0.0%) | 0 (0.0%) |
Race in Joppa
The most populous races in Joppa are , and White / Caucasian (378 | 100.0%).
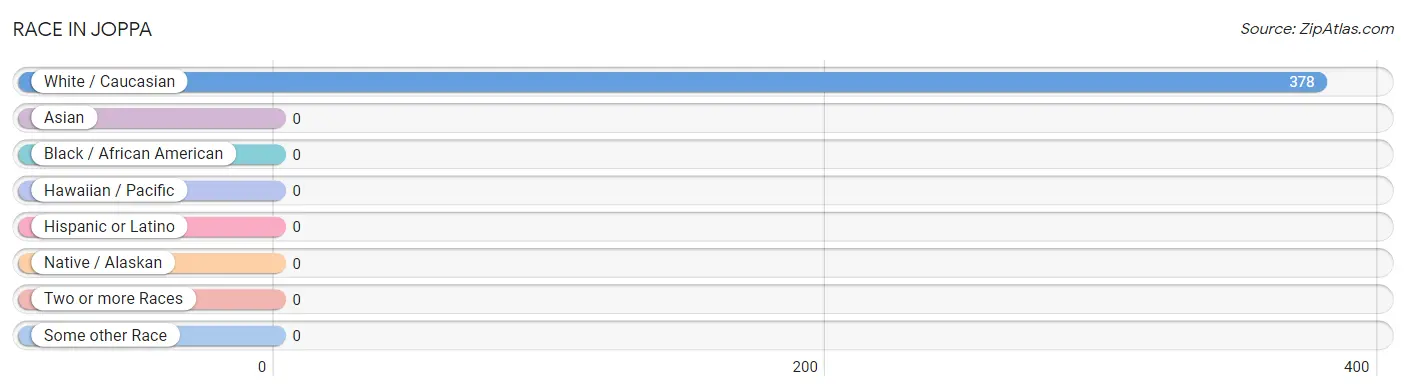
| Race | # Population | % Population |
| Asian | 0 | 0.0% |
| Black / African American | 0 | 0.0% |
| Hawaiian / Pacific | 0 | 0.0% |
| Hispanic or Latino | 0 | 0.0% |
| Native / Alaskan | 0 | 0.0% |
| White / Caucasian | 378 | 100.0% |
| Two or more Races | 0 | 0.0% |
| Some other Race | 0 | 0.0% |
| Total | 378 | 100.0% |
Ancestry in Joppa
The most populous ancestries reported in Joppa are American (61 | 16.1%), German (18 | 4.8%), European (12 | 3.2%), and Irish (11 | 2.9%), together accounting for 27.0% of all Joppa residents.
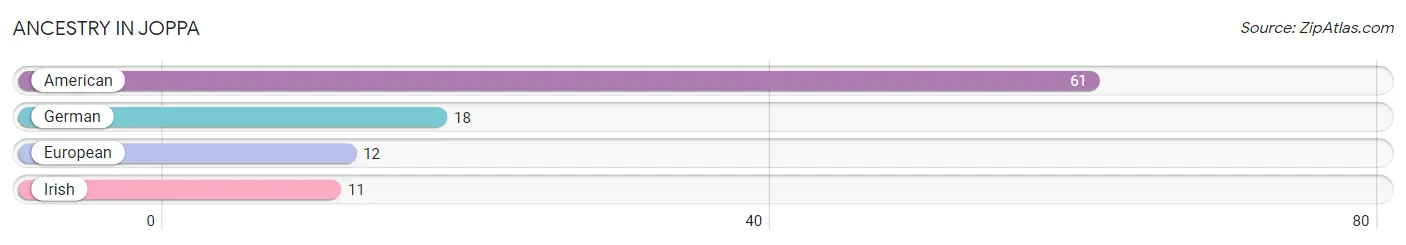
| Ancestry | # Population | % Population |
| American | 61 | 16.1% |
| European | 12 | 3.2% |
| German | 18 | 4.8% |
| Irish | 11 | 2.9% | View All 4 Rows |
Immigrants in Joppa

| Immigration Origin | # Population | % Population | View All 0 Rows |
Sex and Age in Joppa
Sex and Age in Joppa
The most populous age groups in Joppa are 15 to 19 Years (33 | 15.1%) for men and 80 to 84 Years (29 | 18.2%) for women.
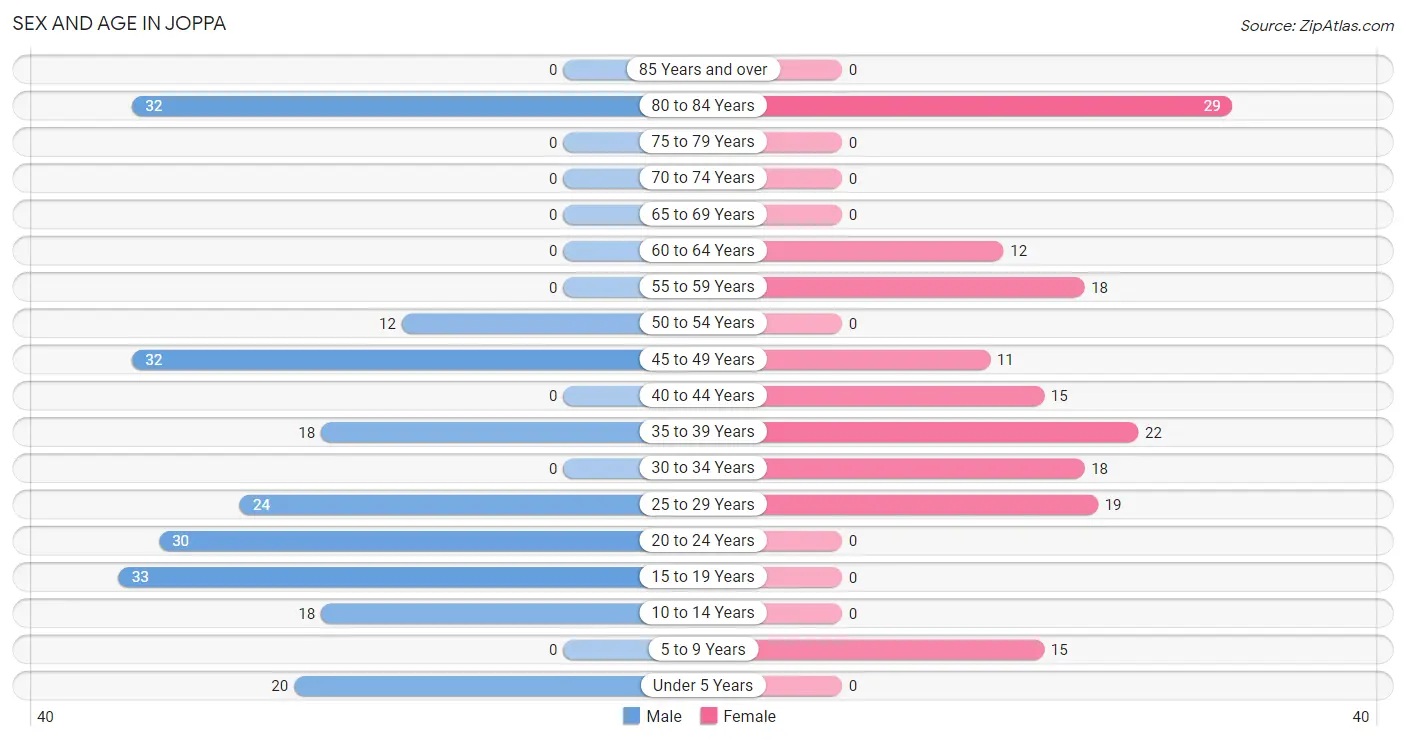
| Age Bracket | Male | Female |
| Under 5 Years | 20 (9.1%) | 0 (0.0%) |
| 5 to 9 Years | 0 (0.0%) | 15 (9.4%) |
| 10 to 14 Years | 18 (8.2%) | 0 (0.0%) |
| 15 to 19 Years | 33 (15.1%) | 0 (0.0%) |
| 20 to 24 Years | 30 (13.7%) | 0 (0.0%) |
| 25 to 29 Years | 24 (11.0%) | 19 (11.9%) |
| 30 to 34 Years | 0 (0.0%) | 18 (11.3%) |
| 35 to 39 Years | 18 (8.2%) | 22 (13.8%) |
| 40 to 44 Years | 0 (0.0%) | 15 (9.4%) |
| 45 to 49 Years | 32 (14.6%) | 11 (6.9%) |
| 50 to 54 Years | 12 (5.5%) | 0 (0.0%) |
| 55 to 59 Years | 0 (0.0%) | 18 (11.3%) |
| 60 to 64 Years | 0 (0.0%) | 12 (7.5%) |
| 65 to 69 Years | 0 (0.0%) | 0 (0.0%) |
| 70 to 74 Years | 0 (0.0%) | 0 (0.0%) |
| 75 to 79 Years | 0 (0.0%) | 0 (0.0%) |
| 80 to 84 Years | 32 (14.6%) | 29 (18.2%) |
| 85 Years and over | 0 (0.0%) | 0 (0.0%) |
| Total | 219 (100.0%) | 159 (100.0%) |
Families and Households in Joppa
Median Family Size in Joppa
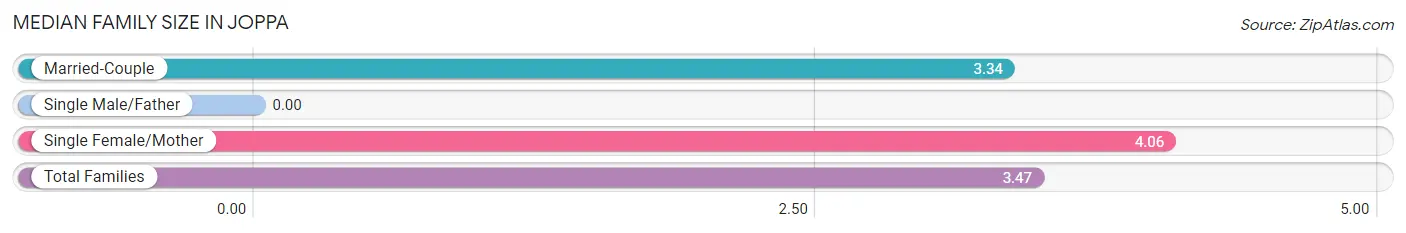
| Family Type | # Families | Family Size |
| Married-Couple | 77 (81.0%) | 3.34 |
| Single Male/Father | 0 (0.0%) | - |
| Single Female/Mother | 18 (19.0%) | 4.06 |
| Total Families | 95 (100.0%) | 3.47 |
Median Household Size in Joppa
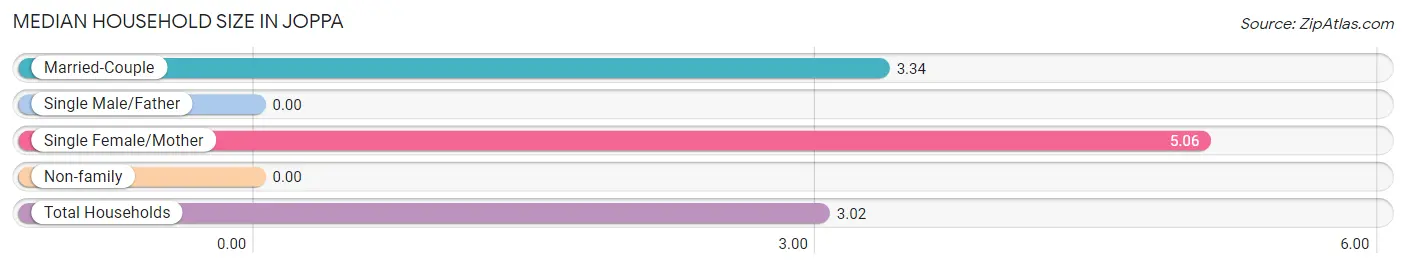
| Household Type | # Households | Household Size |
| Married-Couple | 77 (61.6%) | 3.34 |
| Single Male/Father | 0 (0.0%) | - |
| Single Female/Mother | 18 (14.4%) | 5.06 |
| Non-family | 30 (24.0%) | - |
| Total Households | 125 (100.0%) | 3.02 |
Household Size by Marriage Status in Joppa
Out of a total of 125 households in Joppa, 95 (76.0%) are family households, while 30 (24.0%) are nonfamily households. The most numerous type of family households are 2-person households, comprising 43, and the most common type of nonfamily households are 1-person households, comprising 30.
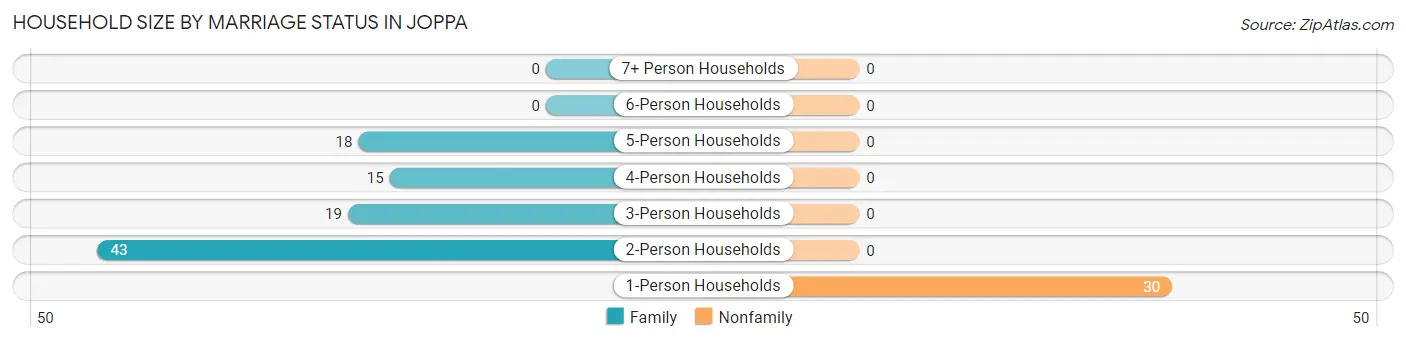
| Household Size | Family Households | Nonfamily Households |
| 1-Person Households | - | 30 (24.0%) |
| 2-Person Households | 43 (34.4%) | 0 (0.0%) |
| 3-Person Households | 19 (15.2%) | 0 (0.0%) |
| 4-Person Households | 15 (12.0%) | 0 (0.0%) |
| 5-Person Households | 18 (14.4%) | 0 (0.0%) |
| 6-Person Households | 0 (0.0%) | 0 (0.0%) |
| 7+ Person Households | 0 (0.0%) | 0 (0.0%) |
| Total | 95 (76.0%) | 30 (24.0%) |
Female Fertility in Joppa
Fertility by Age in Joppa
Average fertility rate in Joppa is 224.0 births per 1,000 women. Women in the age bracket of 20 to 34 years have the highest fertility rate with 514.0 births per 1,000 women. Women in the age bracket of 20 to 34 years acount for 100.0% of all women with births.
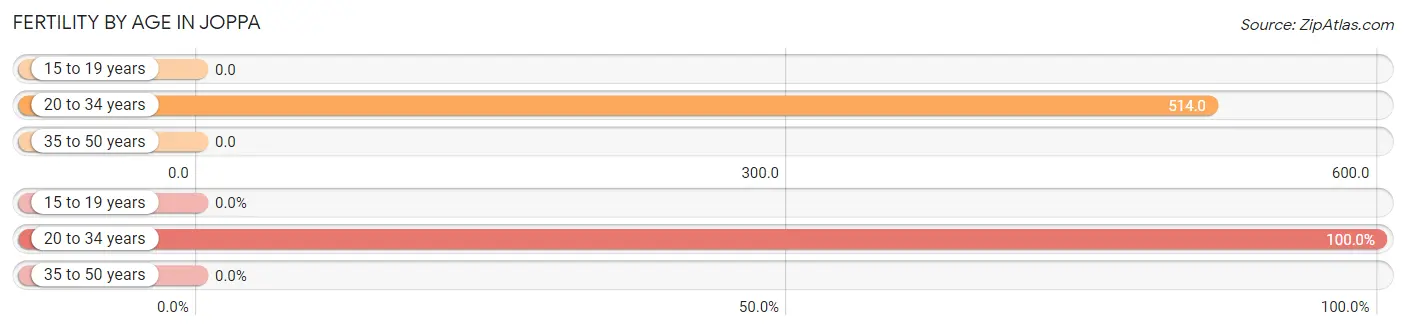
| Age Bracket | Women with Births | Births / 1,000 Women |
| 15 to 19 years | 0 (0.0%) | 0.0 |
| 20 to 34 years | 19 (100.0%) | 514.0 |
| 35 to 50 years | 0 (0.0%) | 0.0 |
| Total | 19 (100.0%) | 224.0 |
Fertility by Age by Marriage Status in Joppa
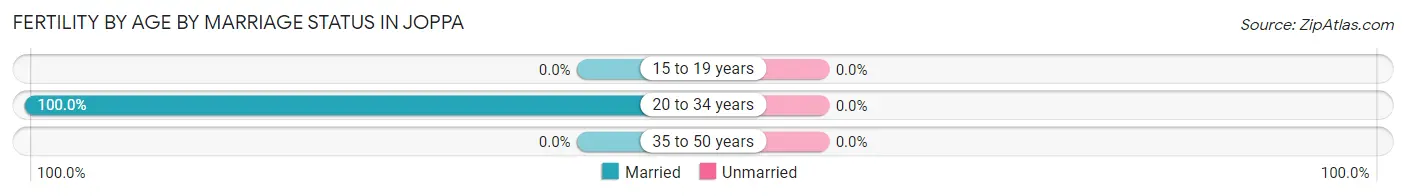
| Age Bracket | Married | Unmarried |
| 15 to 19 years | 0 (0.0%) | 0 (0.0%) |
| 20 to 34 years | 19 (100.0%) | 0 (0.0%) |
| 35 to 50 years | 0 (0.0%) | 0 (0.0%) |
| Total | 19 (100.0%) | 0 (0.0%) |
Fertility by Education in Joppa
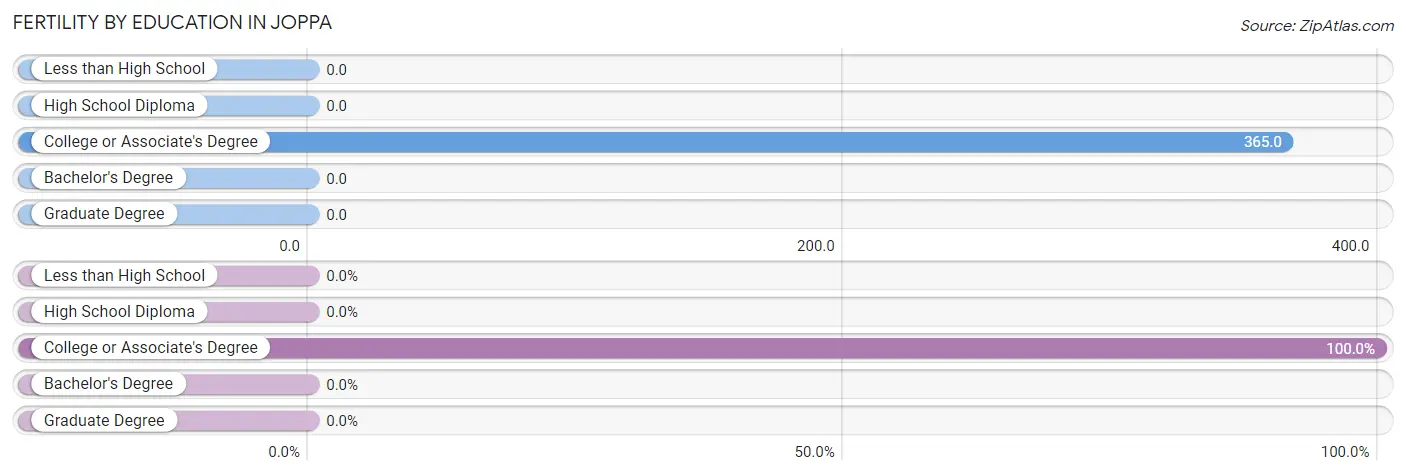
| Educational Attainment | Women with Births | Births / 1,000 Women |
| Less than High School | 0 (0.0%) | 0.0 |
| High School Diploma | 0 (0.0%) | 0.0 |
| College or Associate's Degree | 19 (100.0%) | 365.0 |
| Bachelor's Degree | 0 (0.0%) | 0.0 |
| Graduate Degree | 0 (0.0%) | 0.0 |
| Total | 19 (100.0%) | 224.0 |
Fertility by Education by Marriage Status in Joppa
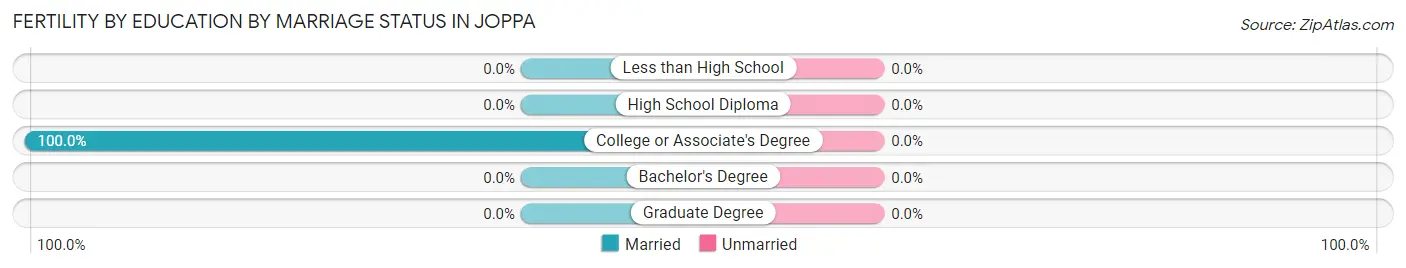
| Educational Attainment | Married | Unmarried |
| Less than High School | 0 (0.0%) | 0 (0.0%) |
| High School Diploma | 0 (0.0%) | 0 (0.0%) |
| College or Associate's Degree | 19 (100.0%) | 0 (0.0%) |
| Bachelor's Degree | 0 (0.0%) | 0 (0.0%) |
| Graduate Degree | 0 (0.0%) | 0 (0.0%) |
| Total | 19 (100.0%) | 0 (0.0%) |
Employment Characteristics in Joppa
Employment by Class of Employer in Joppa
Among the 219 employed individuals in Joppa, private company employees (153 | 69.9%), self-employed (not incorporated) (37 | 16.9%), and state government employees (18 | 8.2%) make up the most common classes of employment.
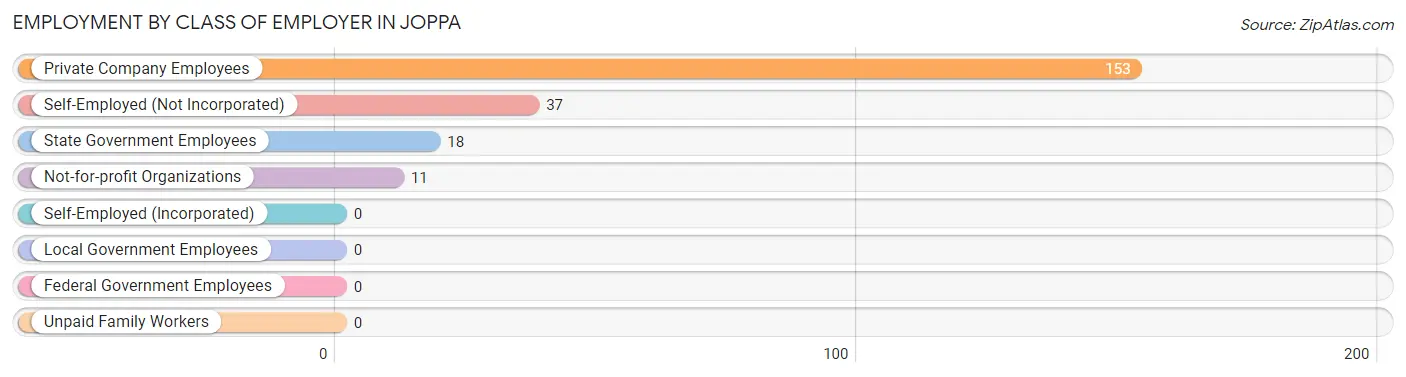
| Employer Class | # Employees | % Employees |
| Private Company Employees | 153 | 69.9% |
| Self-Employed (Incorporated) | 0 | 0.0% |
| Self-Employed (Not Incorporated) | 37 | 16.9% |
| Not-for-profit Organizations | 11 | 5.0% |
| Local Government Employees | 0 | 0.0% |
| State Government Employees | 18 | 8.2% |
| Federal Government Employees | 0 | 0.0% |
| Unpaid Family Workers | 0 | 0.0% |
| Total | 219 | 100.0% |
Employment Status by Age in Joppa
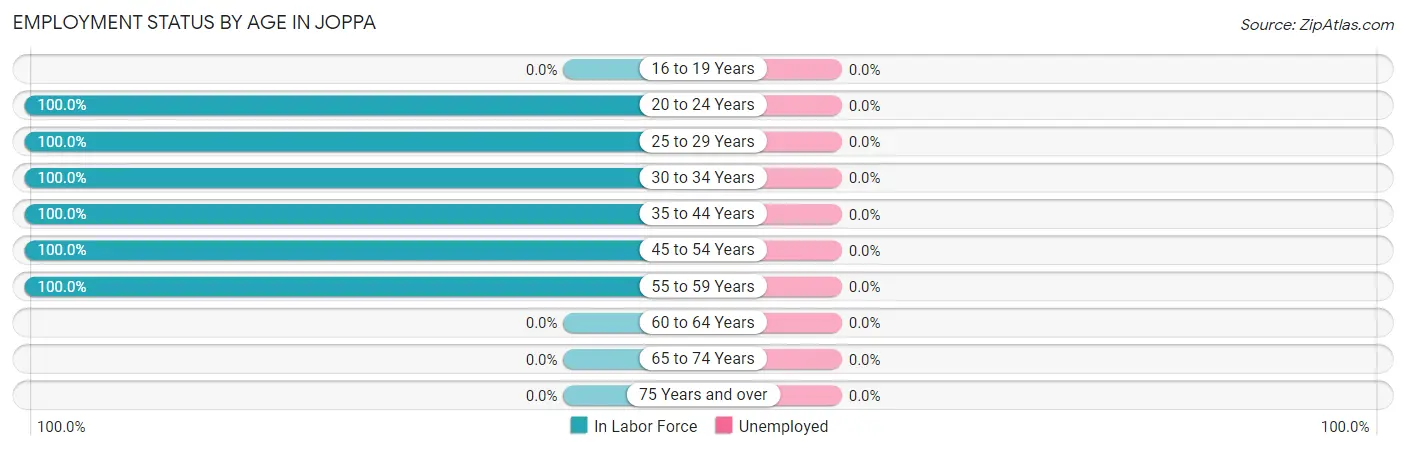
| Age Bracket | In Labor Force | Unemployed |
| 16 to 19 Years | 0 (0.0%) | 0 (0.0%) |
| 20 to 24 Years | 30 (100.0%) | 0 (0.0%) |
| 25 to 29 Years | 43 (100.0%) | 0 (0.0%) |
| 30 to 34 Years | 18 (100.0%) | 0 (0.0%) |
| 35 to 44 Years | 55 (100.0%) | 0 (0.0%) |
| 45 to 54 Years | 55 (100.0%) | 0 (0.0%) |
| 55 to 59 Years | 18 (100.0%) | 0 (0.0%) |
| 60 to 64 Years | 0 (0.0%) | 0 (0.0%) |
| 65 to 74 Years | 0 (0.0%) | 0 (0.0%) |
| 75 Years and over | 0 (0.0%) | 0 (0.0%) |
| Total | 219 (75.0%) | 0 (0.0%) |
Employment Status by Educational Attainment in Joppa
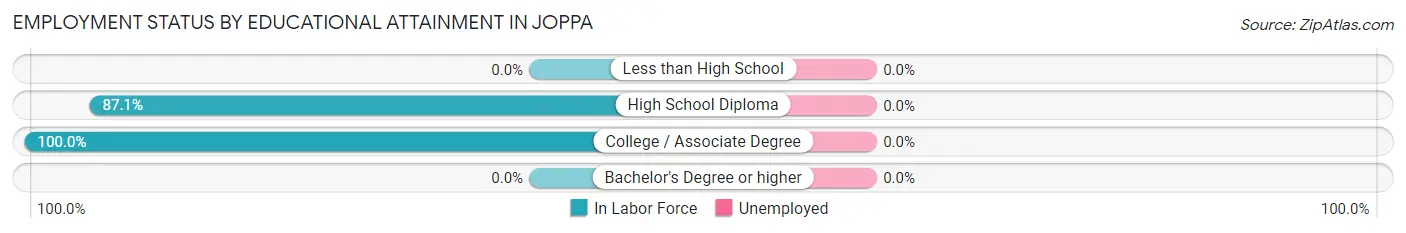
| Educational Attainment | In Labor Force | Unemployed |
| Less than High School | 0 (0.0%) | 0 (0.0%) |
| High School Diploma | 81 (87.1%) | 0 (0.0%) |
| College / Associate Degree | 108 (100.0%) | 0 (0.0%) |
| Bachelor's Degree or higher | 0 (0.0%) | 0 (0.0%) |
| Total | 189 (94.0%) | 0 (0.0%) |
Employment Occupations by Sex in Joppa
Management, Business, Science and Arts Occupations
The most common Management, Business, Science and Arts occupations in Joppa are , and Management (15 | 6.9%).
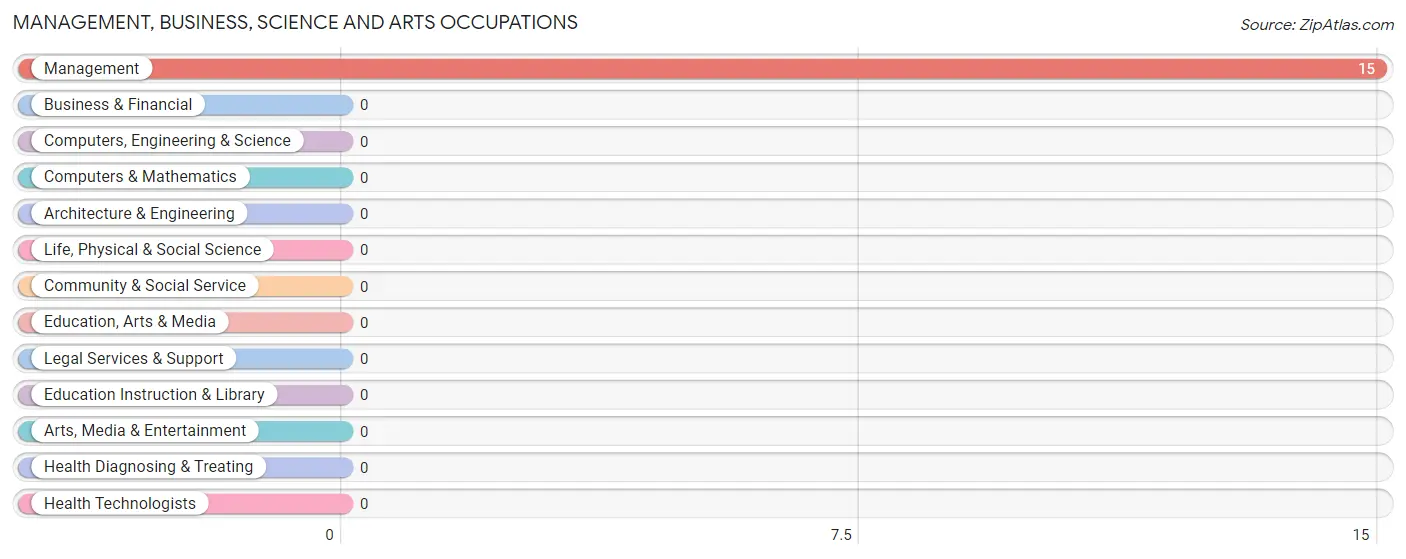
Management, Business, Science and Arts Occupations by Sex
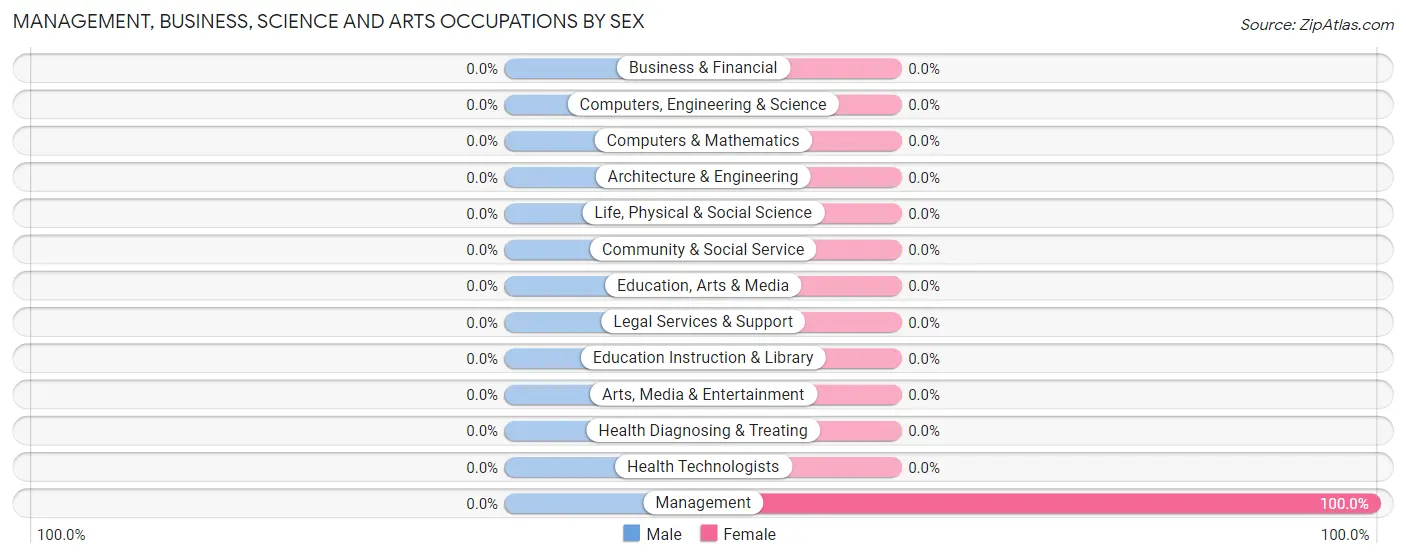
| Occupation | Male | Female |
| Management | 0 (0.0%) | 15 (100.0%) |
| Business & Financial | 0 (0.0%) | 0 (0.0%) |
| Computers, Engineering & Science | 0 (0.0%) | 0 (0.0%) |
| Computers & Mathematics | 0 (0.0%) | 0 (0.0%) |
| Architecture & Engineering | 0 (0.0%) | 0 (0.0%) |
| Life, Physical & Social Science | 0 (0.0%) | 0 (0.0%) |
| Community & Social Service | 0 (0.0%) | 0 (0.0%) |
| Education, Arts & Media | 0 (0.0%) | 0 (0.0%) |
| Legal Services & Support | 0 (0.0%) | 0 (0.0%) |
| Education Instruction & Library | 0 (0.0%) | 0 (0.0%) |
| Arts, Media & Entertainment | 0 (0.0%) | 0 (0.0%) |
| Health Diagnosing & Treating | 0 (0.0%) | 0 (0.0%) |
| Health Technologists | 0 (0.0%) | 0 (0.0%) |
| Total (Category) | 0 (0.0%) | 15 (100.0%) |
| Total (Overall) | 116 (53.0%) | 103 (47.0%) |
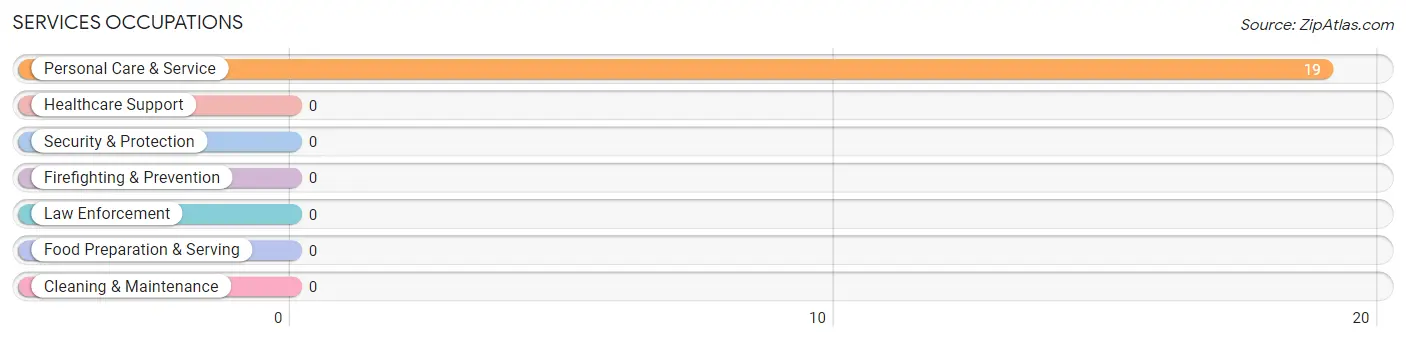
Services Occupations
The most common Services occupations in Joppa are , and Personal Care & Service (19 | 8.7%).
Services Occupations by Sex
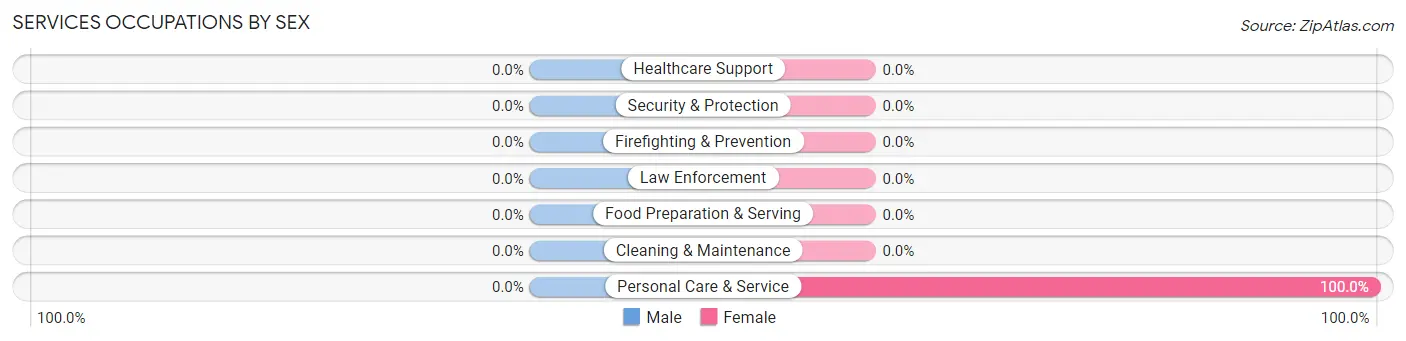
| Occupation | Male | Female |
| Healthcare Support | 0 (0.0%) | 0 (0.0%) |
| Security & Protection | 0 (0.0%) | 0 (0.0%) |
| Firefighting & Prevention | 0 (0.0%) | 0 (0.0%) |
| Law Enforcement | 0 (0.0%) | 0 (0.0%) |
| Food Preparation & Serving | 0 (0.0%) | 0 (0.0%) |
| Cleaning & Maintenance | 0 (0.0%) | 0 (0.0%) |
| Personal Care & Service | 0 (0.0%) | 19 (100.0%) |
| Total (Category) | 0 (0.0%) | 19 (100.0%) |
| Total (Overall) | 116 (53.0%) | 103 (47.0%) |
Sales and Office Occupations
The most common Sales and Office occupations in Joppa are Office & Administration (51 | 23.3%), and Sales & Related (12 | 5.5%).
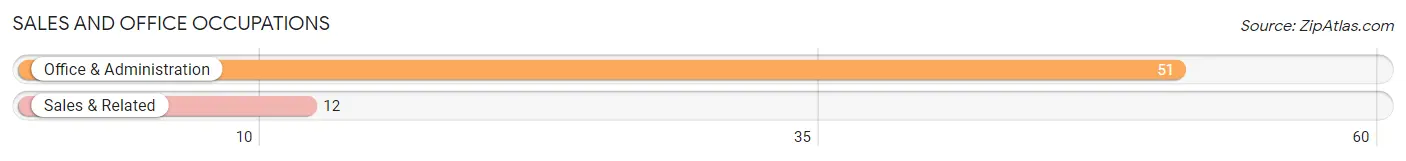
Sales and Office Occupations by Sex
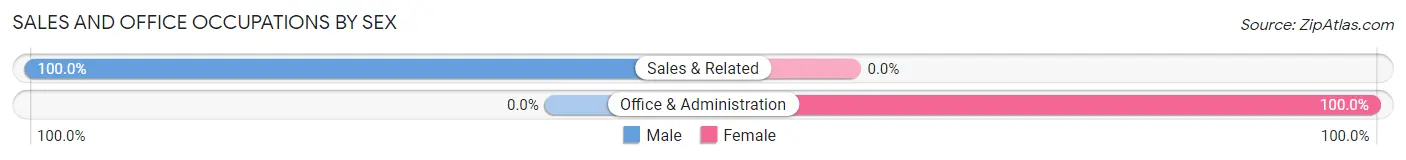
| Occupation | Male | Female |
| Sales & Related | 12 (100.0%) | 0 (0.0%) |
| Office & Administration | 0 (0.0%) | 51 (100.0%) |
| Total (Category) | 12 (19.1%) | 51 (80.9%) |
| Total (Overall) | 116 (53.0%) | 103 (47.0%) |
Natural Resources, Construction and Maintenance Occupations
The most common Natural Resources, Construction and Maintenance occupations in Joppa are , and Installation, Maintenance & Repair (50 | 22.8%).
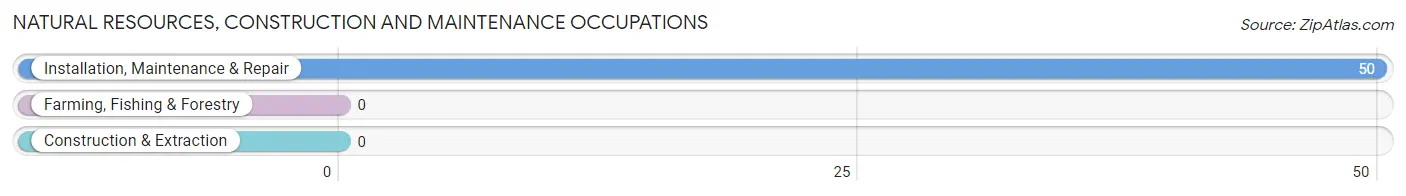
Natural Resources, Construction and Maintenance Occupations by Sex
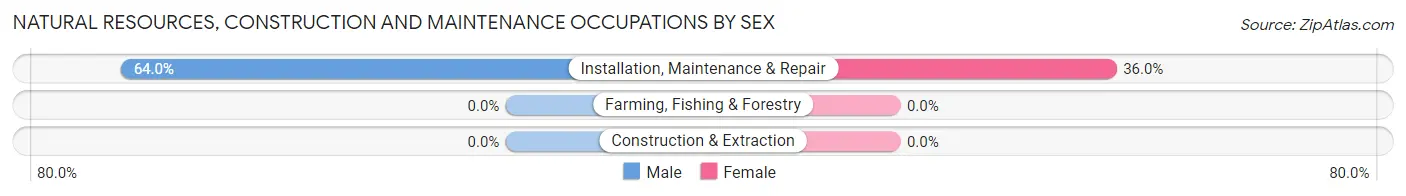
| Occupation | Male | Female |
| Farming, Fishing & Forestry | 0 (0.0%) | 0 (0.0%) |
| Construction & Extraction | 0 (0.0%) | 0 (0.0%) |
| Installation, Maintenance & Repair | 32 (64.0%) | 18 (36.0%) |
| Total (Category) | 32 (64.0%) | 18 (36.0%) |
| Total (Overall) | 116 (53.0%) | 103 (47.0%) |
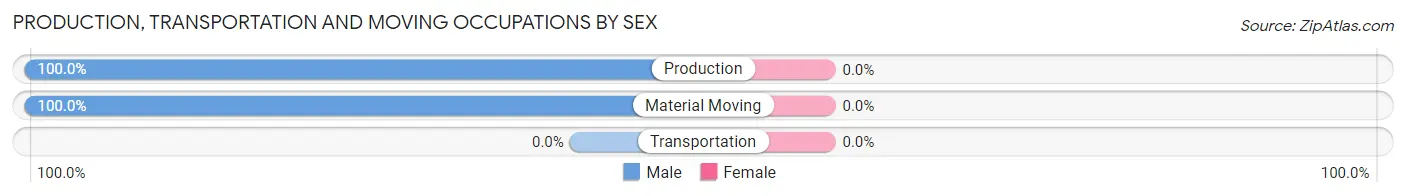
Production, Transportation and Moving Occupations
The most common Production, Transportation and Moving occupations in Joppa are Material Moving (48 | 21.9%), and Production (24 | 11.0%).
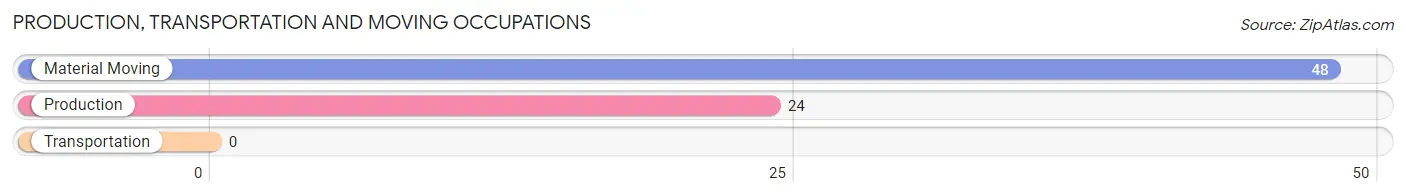
Production, Transportation and Moving Occupations by Sex
| Occupation | Male | Female |
| Production | 24 (100.0%) | 0 (0.0%) |
| Transportation | 0 (0.0%) | 0 (0.0%) |
| Material Moving | 48 (100.0%) | 0 (0.0%) |
| Total (Category) | 72 (100.0%) | 0 (0.0%) |
| Total (Overall) | 116 (53.0%) | 103 (47.0%) |
Employment Industries by Sex in Joppa
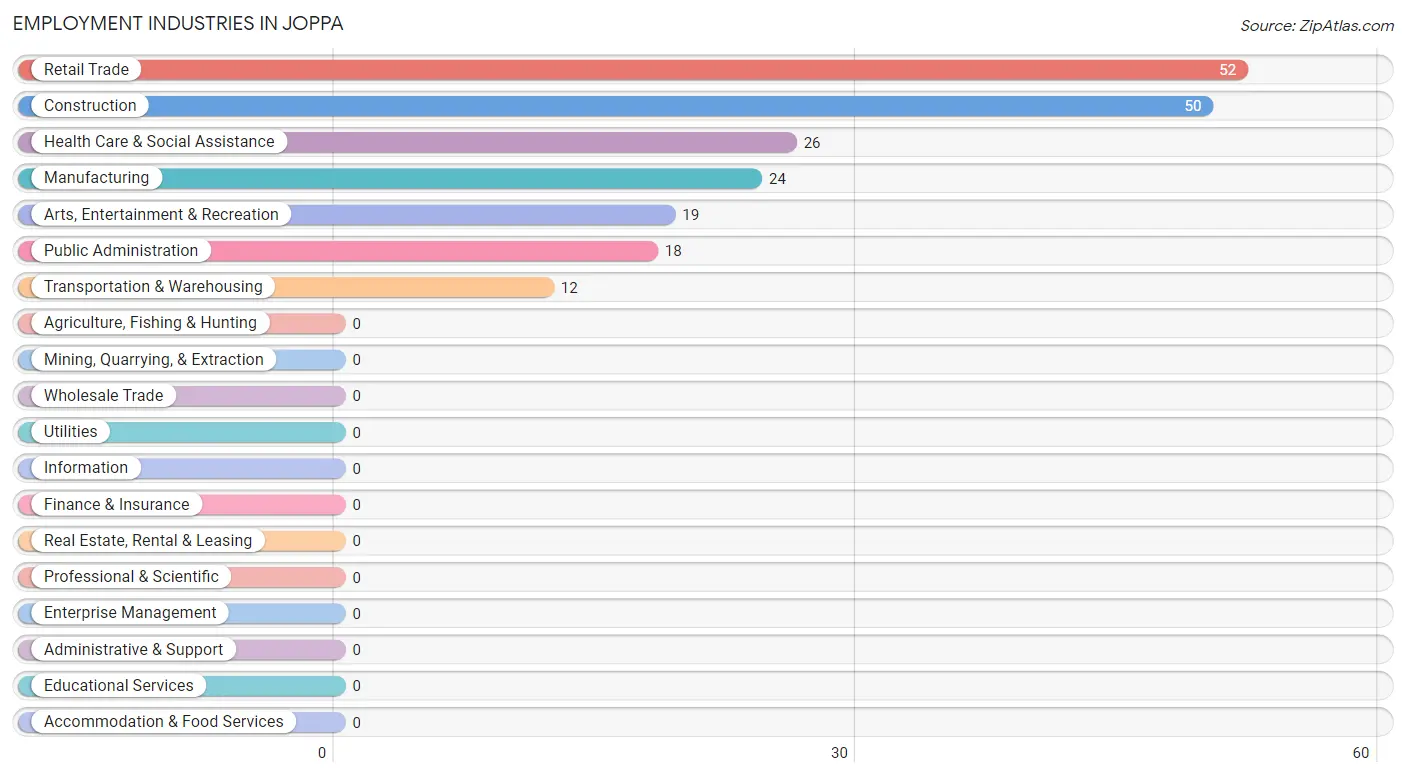
Employment Industries in Joppa
The major employment industries in Joppa include Retail Trade (52 | 23.7%), Construction (50 | 22.8%), Health Care & Social Assistance (26 | 11.9%), Manufacturing (24 | 11.0%), and Arts, Entertainment & Recreation (19 | 8.7%).
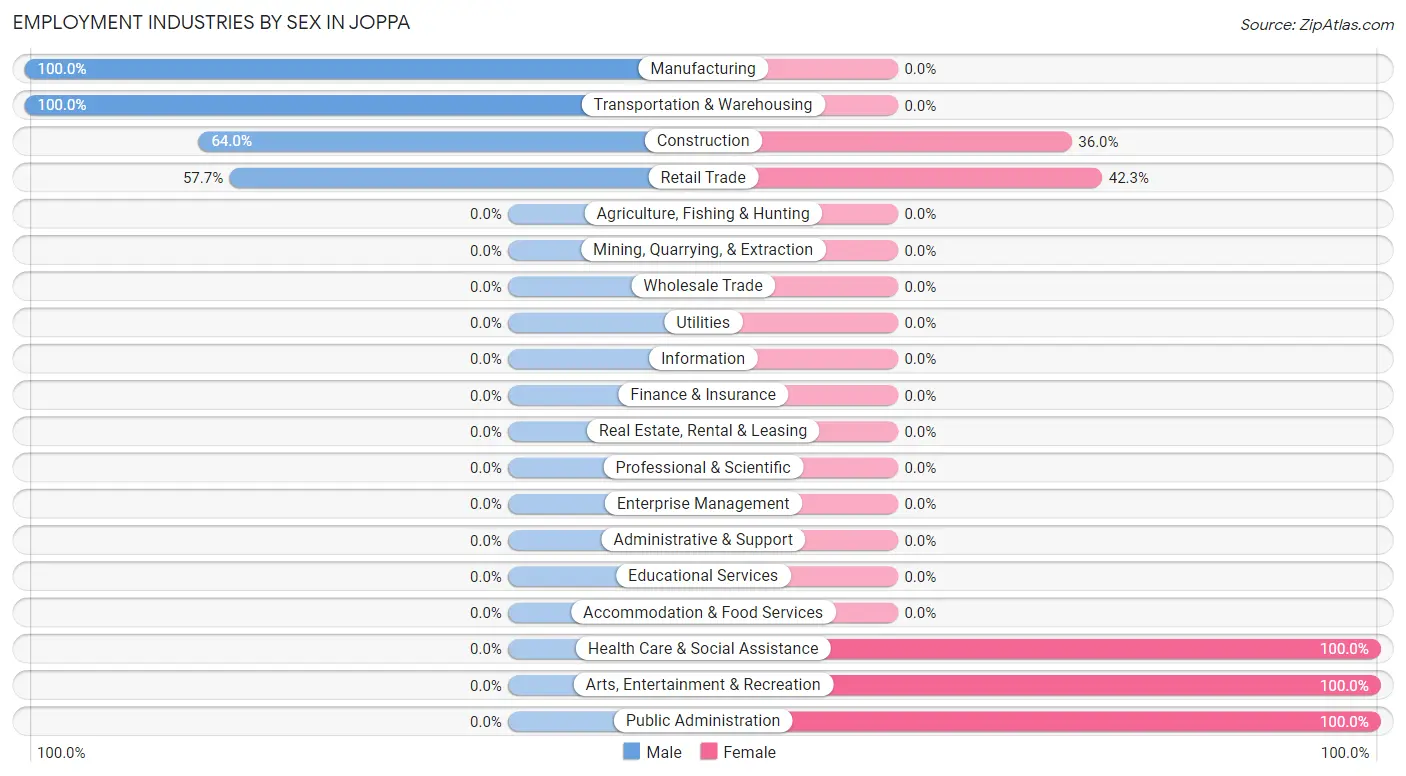
Employment Industries by Sex in Joppa
The Joppa industries that see more men than women are Manufacturing (100.0%), Transportation & Warehousing (100.0%), and Construction (64.0%), whereas the industries that tend to have a higher number of women are Health Care & Social Assistance (100.0%), Arts, Entertainment & Recreation (100.0%), and Public Administration (100.0%).
| Industry | Male | Female |
| Agriculture, Fishing & Hunting | 0 (0.0%) | 0 (0.0%) |
| Mining, Quarrying, & Extraction | 0 (0.0%) | 0 (0.0%) |
| Construction | 32 (64.0%) | 18 (36.0%) |
| Manufacturing | 24 (100.0%) | 0 (0.0%) |
| Wholesale Trade | 0 (0.0%) | 0 (0.0%) |
| Retail Trade | 30 (57.7%) | 22 (42.3%) |
| Transportation & Warehousing | 12 (100.0%) | 0 (0.0%) |
| Utilities | 0 (0.0%) | 0 (0.0%) |
| Information | 0 (0.0%) | 0 (0.0%) |
| Finance & Insurance | 0 (0.0%) | 0 (0.0%) |
| Real Estate, Rental & Leasing | 0 (0.0%) | 0 (0.0%) |
| Professional & Scientific | 0 (0.0%) | 0 (0.0%) |
| Enterprise Management | 0 (0.0%) | 0 (0.0%) |
| Administrative & Support | 0 (0.0%) | 0 (0.0%) |
| Educational Services | 0 (0.0%) | 0 (0.0%) |
| Health Care & Social Assistance | 0 (0.0%) | 26 (100.0%) |
| Arts, Entertainment & Recreation | 0 (0.0%) | 19 (100.0%) |
| Accommodation & Food Services | 0 (0.0%) | 0 (0.0%) |
| Public Administration | 0 (0.0%) | 18 (100.0%) |
| Total | 116 (53.0%) | 103 (47.0%) |
Education in Joppa
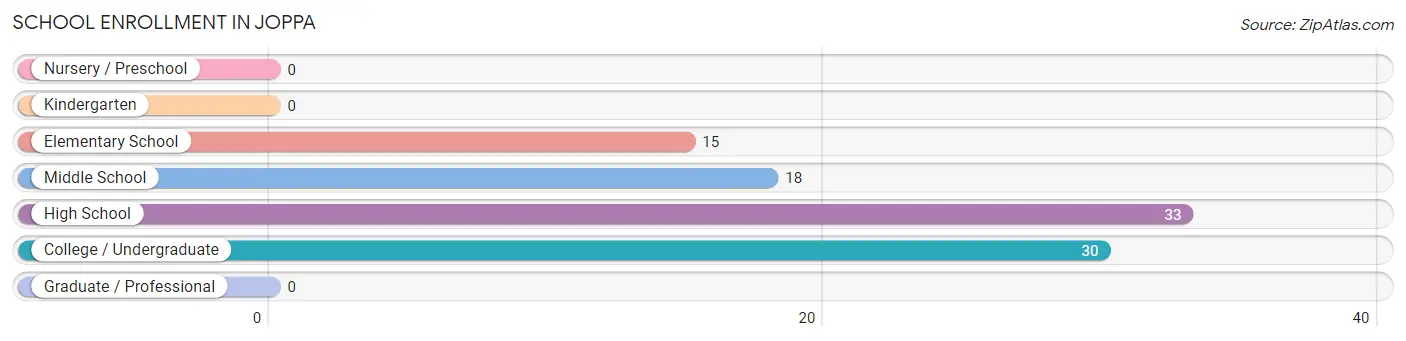
School Enrollment in Joppa
The most common levels of schooling among the 96 students in Joppa are high school (33 | 34.4%), college / undergraduate (30 | 31.2%), and middle school (18 | 18.8%).
| School Level | # Students | % Students |
| Nursery / Preschool | 0 | 0.0% |
| Kindergarten | 0 | 0.0% |
| Elementary School | 15 | 15.6% |
| Middle School | 18 | 18.8% |
| High School | 33 | 34.4% |
| College / Undergraduate | 30 | 31.2% |
| Graduate / Professional | 0 | 0.0% |
| Total | 96 | 100.0% |
School Enrollment by Age by Funding Source in Joppa
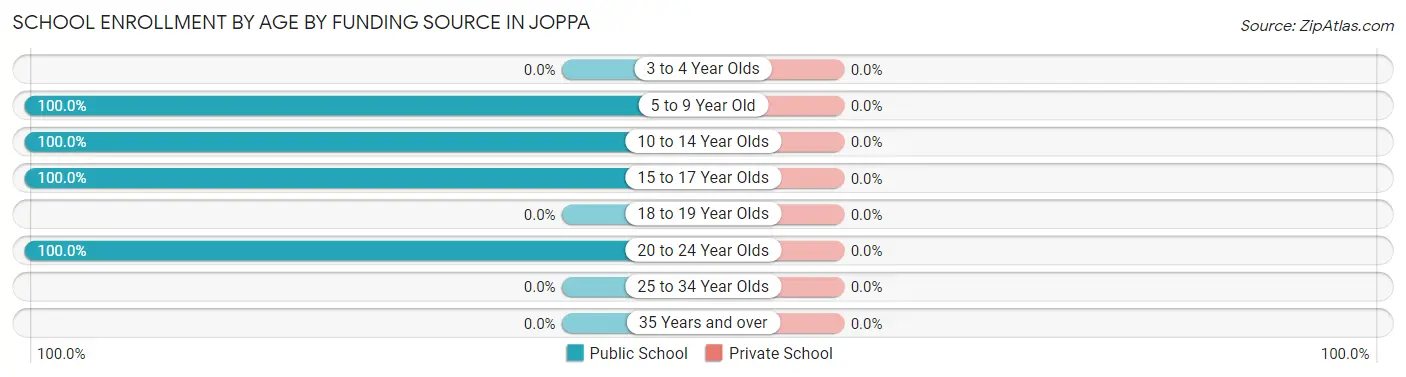
| Age Bracket | Public School | Private School |
| 3 to 4 Year Olds | 0 (0.0%) | 0 (0.0%) |
| 5 to 9 Year Old | 15 (100.0%) | 0 (0.0%) |
| 10 to 14 Year Olds | 18 (100.0%) | 0 (0.0%) |
| 15 to 17 Year Olds | 33 (100.0%) | 0 (0.0%) |
| 18 to 19 Year Olds | 0 (0.0%) | 0 (0.0%) |
| 20 to 24 Year Olds | 30 (100.0%) | 0 (0.0%) |
| 25 to 34 Year Olds | 0 (0.0%) | 0 (0.0%) |
| 35 Years and over | 0 (0.0%) | 0 (0.0%) |
| Total | 96 (100.0%) | 0 (0.0%) |
Educational Attainment by Field of Study in Joppa
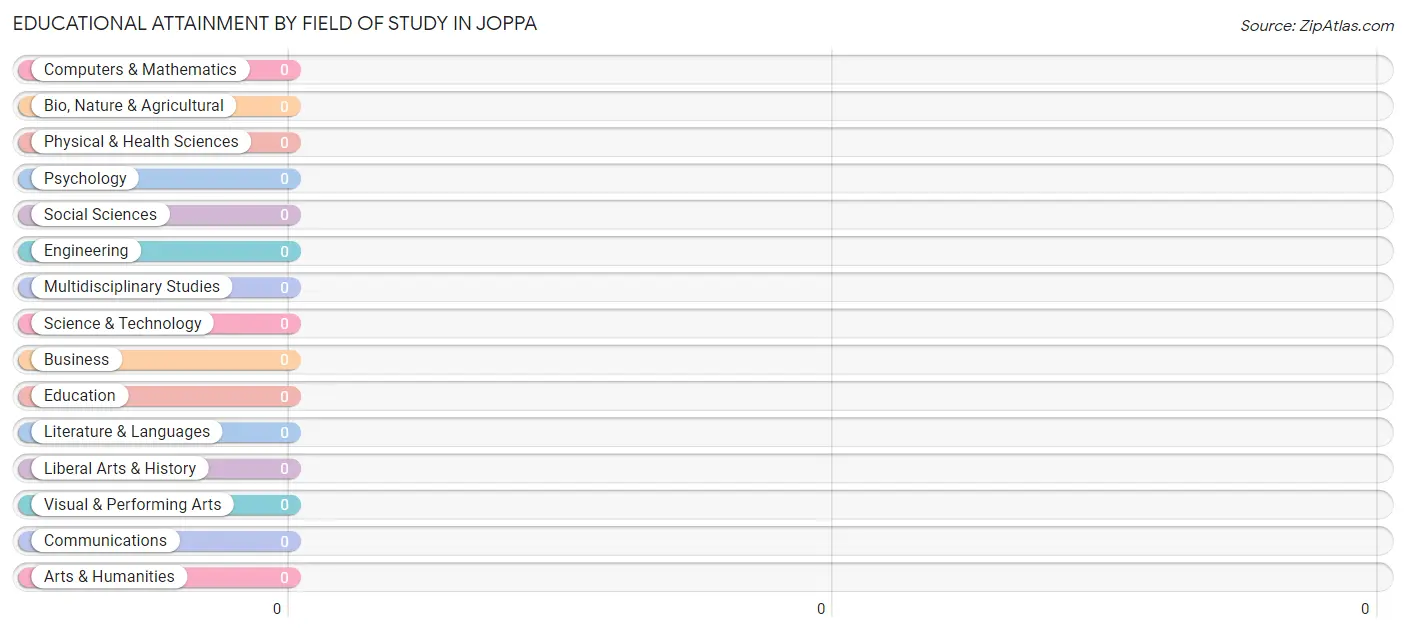
| Field of Study | # Graduates | % Graduates |
| Computers & Mathematics | 0 | 0.0% |
| Bio, Nature & Agricultural | 0 | 0.0% |
| Physical & Health Sciences | 0 | 0.0% |
| Psychology | 0 | 0.0% |
| Social Sciences | 0 | 0.0% |
| Engineering | 0 | 0.0% |
| Multidisciplinary Studies | 0 | 0.0% |
| Science & Technology | 0 | 0.0% |
| Business | 0 | 0.0% |
| Education | 0 | 0.0% |
| Literature & Languages | 0 | 0.0% |
| Liberal Arts & History | 0 | 0.0% |
| Visual & Performing Arts | 0 | 0.0% |
| Communications | 0 | 0.0% |
| Arts & Humanities | 0 | 0.0% |
| Total | 0 | 0.0% |
Transportation & Commute in Joppa
Vehicle Availability by Sex in Joppa
The most prevalent vehicle ownership categories in Joppa are males with 5 or more vehicles (62, accounting for 53.4%) and females with 5 or more vehicles (15, making up 60.2%).
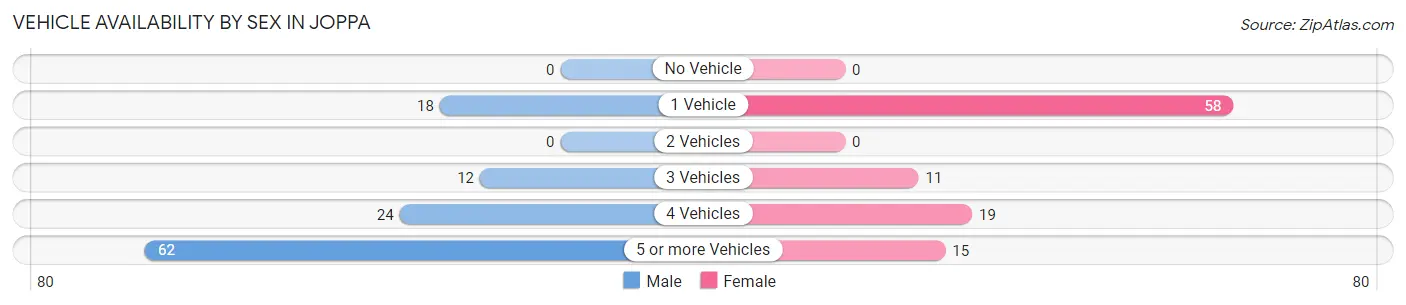
| Vehicles Available | Male | Female |
| No Vehicle | 0 (0.0%) | 0 (0.0%) |
| 1 Vehicle | 18 (15.5%) | 58 (56.3%) |
| 2 Vehicles | 0 (0.0%) | 0 (0.0%) |
| 3 Vehicles | 12 (10.3%) | 11 (10.7%) |
| 4 Vehicles | 24 (20.7%) | 19 (18.4%) |
| 5 or more Vehicles | 62 (53.4%) | 15 (14.6%) |
| Total | 116 (100.0%) | 103 (100.0%) |
Commute Time in Joppa
The most frequently occuring commute durations in Joppa are 30 to 34 minutes (69 commuters, 34.3%), 10 to 14 minutes (53 commuters, 26.4%), and 20 to 24 minutes (42 commuters, 20.9%).
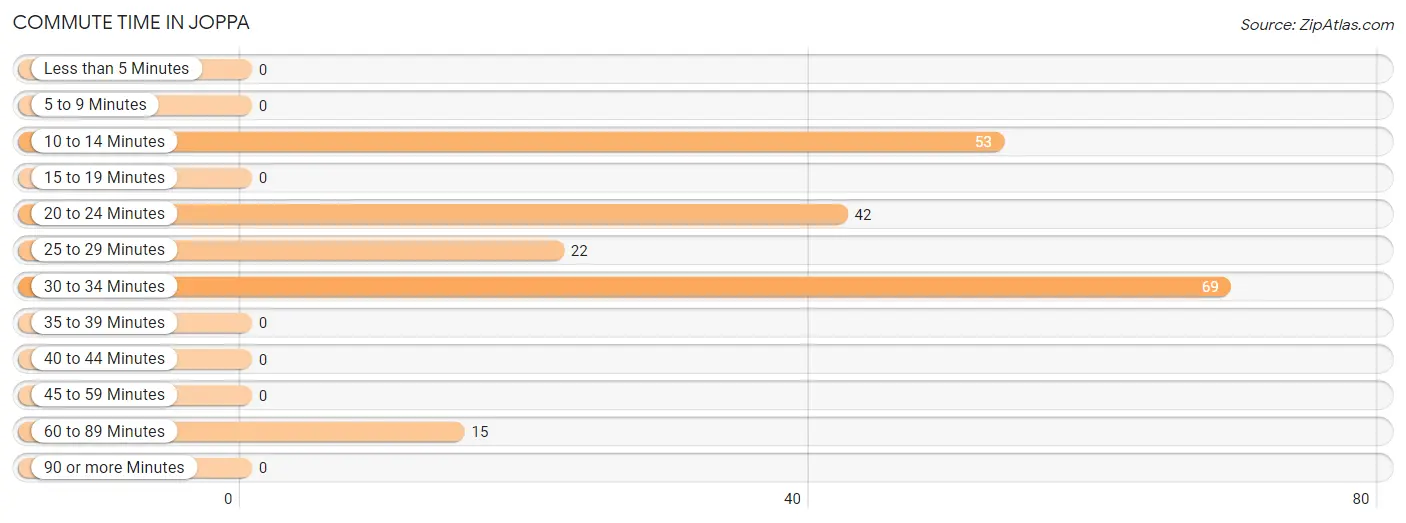
| Commute Time | # Commuters | % Commuters |
| Less than 5 Minutes | 0 | 0.0% |
| 5 to 9 Minutes | 0 | 0.0% |
| 10 to 14 Minutes | 53 | 26.4% |
| 15 to 19 Minutes | 0 | 0.0% |
| 20 to 24 Minutes | 42 | 20.9% |
| 25 to 29 Minutes | 22 | 11.0% |
| 30 to 34 Minutes | 69 | 34.3% |
| 35 to 39 Minutes | 0 | 0.0% |
| 40 to 44 Minutes | 0 | 0.0% |
| 45 to 59 Minutes | 0 | 0.0% |
| 60 to 89 Minutes | 15 | 7.5% |
| 90 or more Minutes | 0 | 0.0% |
Commute Time by Sex in Joppa
The most common commute times in Joppa are 30 to 34 minutes (50 commuters, 43.1%) for males and 25 to 29 minutes (22 commuters, 25.9%) for females.
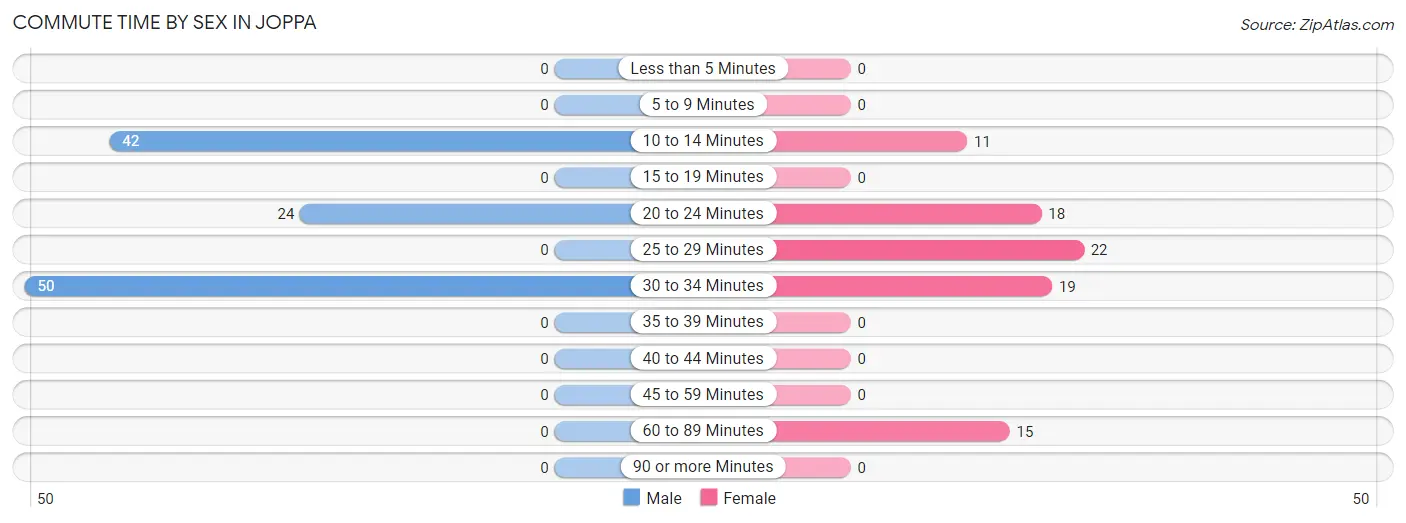
| Commute Time | Male | Female |
| Less than 5 Minutes | 0 (0.0%) | 0 (0.0%) |
| 5 to 9 Minutes | 0 (0.0%) | 0 (0.0%) |
| 10 to 14 Minutes | 42 (36.2%) | 11 (12.9%) |
| 15 to 19 Minutes | 0 (0.0%) | 0 (0.0%) |
| 20 to 24 Minutes | 24 (20.7%) | 18 (21.2%) |
| 25 to 29 Minutes | 0 (0.0%) | 22 (25.9%) |
| 30 to 34 Minutes | 50 (43.1%) | 19 (22.4%) |
| 35 to 39 Minutes | 0 (0.0%) | 0 (0.0%) |
| 40 to 44 Minutes | 0 (0.0%) | 0 (0.0%) |
| 45 to 59 Minutes | 0 (0.0%) | 0 (0.0%) |
| 60 to 89 Minutes | 0 (0.0%) | 15 (17.6%) |
| 90 or more Minutes | 0 (0.0%) | 0 (0.0%) |
Time of Departure to Work by Sex in Joppa
The most frequent times of departure to work in Joppa are 7:00 AM to 7:29 AM (62, 53.4%) for males and 12:00 AM to 4:59 AM (33, 38.8%) for females.
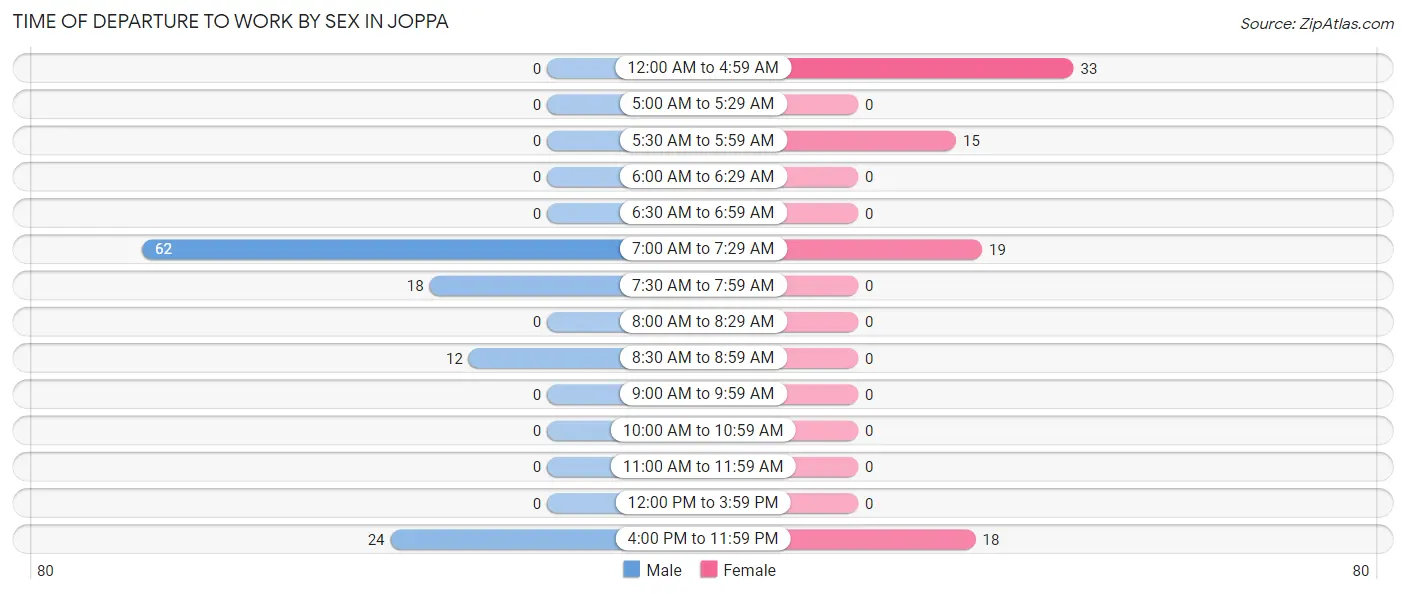
| Time of Departure | Male | Female |
| 12:00 AM to 4:59 AM | 0 (0.0%) | 33 (38.8%) |
| 5:00 AM to 5:29 AM | 0 (0.0%) | 0 (0.0%) |
| 5:30 AM to 5:59 AM | 0 (0.0%) | 15 (17.6%) |
| 6:00 AM to 6:29 AM | 0 (0.0%) | 0 (0.0%) |
| 6:30 AM to 6:59 AM | 0 (0.0%) | 0 (0.0%) |
| 7:00 AM to 7:29 AM | 62 (53.4%) | 19 (22.4%) |
| 7:30 AM to 7:59 AM | 18 (15.5%) | 0 (0.0%) |
| 8:00 AM to 8:29 AM | 0 (0.0%) | 0 (0.0%) |
| 8:30 AM to 8:59 AM | 12 (10.3%) | 0 (0.0%) |
| 9:00 AM to 9:59 AM | 0 (0.0%) | 0 (0.0%) |
| 10:00 AM to 10:59 AM | 0 (0.0%) | 0 (0.0%) |
| 11:00 AM to 11:59 AM | 0 (0.0%) | 0 (0.0%) |
| 12:00 PM to 3:59 PM | 0 (0.0%) | 0 (0.0%) |
| 4:00 PM to 11:59 PM | 24 (20.7%) | 18 (21.2%) |
| Total | 116 (100.0%) | 85 (100.0%) |
Housing Occupancy in Joppa
Occupancy by Ownership in Joppa
Of the total 125 dwellings in Joppa, owner-occupied units account for 107 (85.6%), while renter-occupied units make up 18 (14.4%).
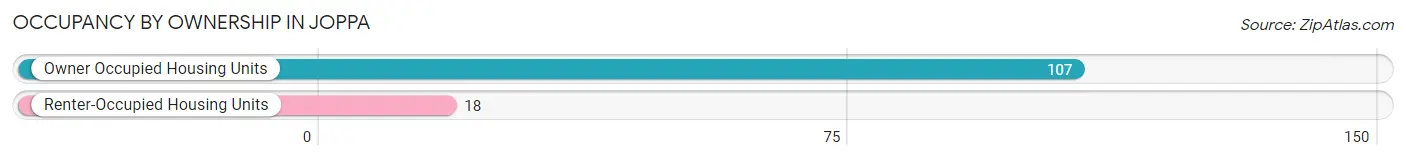
| Occupancy | # Housing Units | % Housing Units |
| Owner Occupied Housing Units | 107 | 85.6% |
| Renter-Occupied Housing Units | 18 | 14.4% |
| Total Occupied Housing Units | 125 | 100.0% |
Occupancy by Household Size in Joppa
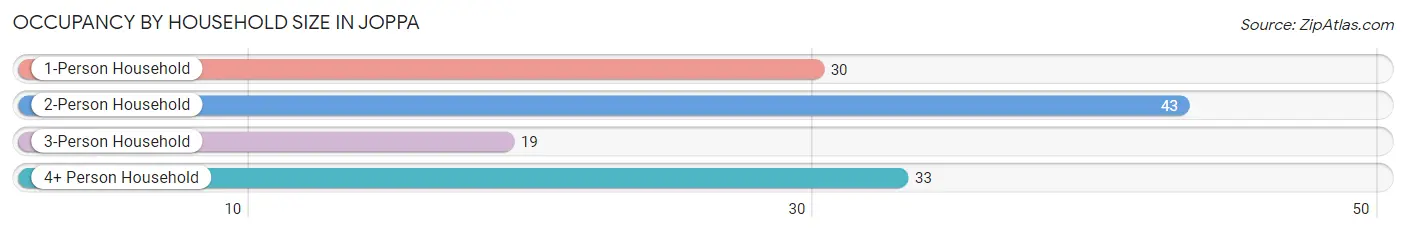
| Household Size | # Housing Units | % Housing Units |
| 1-Person Household | 30 | 24.0% |
| 2-Person Household | 43 | 34.4% |
| 3-Person Household | 19 | 15.2% |
| 4+ Person Household | 33 | 26.4% |
| Total Housing Units | 125 | 100.0% |
Occupancy by Ownership by Household Size in Joppa
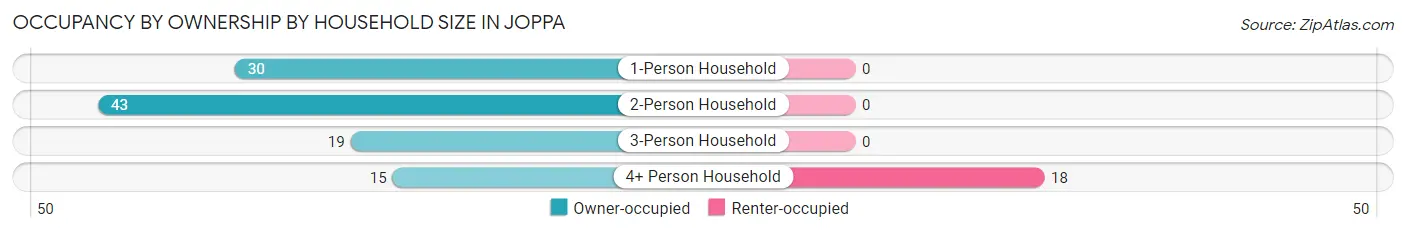
| Household Size | Owner-occupied | Renter-occupied |
| 1-Person Household | 30 (100.0%) | 0 (0.0%) |
| 2-Person Household | 43 (100.0%) | 0 (0.0%) |
| 3-Person Household | 19 (100.0%) | 0 (0.0%) |
| 4+ Person Household | 15 (45.5%) | 18 (54.5%) |
| Total Housing Units | 107 (85.6%) | 18 (14.4%) |
Occupancy by Educational Attainment in Joppa
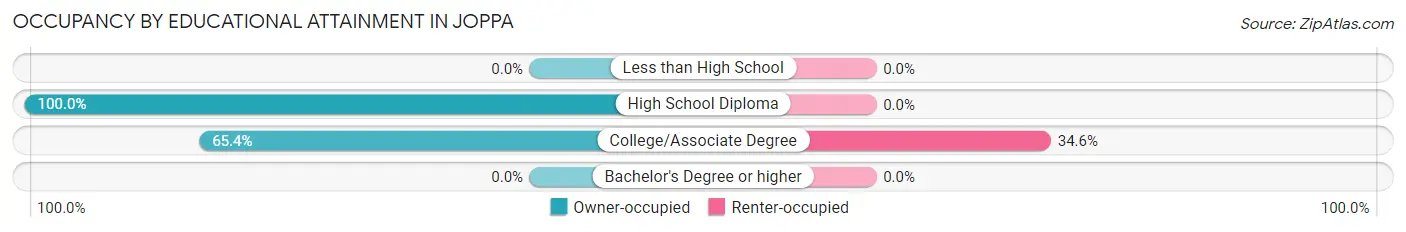
| Household Size | Owner-occupied | Renter-occupied |
| Less than High School | 0 (0.0%) | 0 (0.0%) |
| High School Diploma | 73 (100.0%) | 0 (0.0%) |
| College/Associate Degree | 34 (65.4%) | 18 (34.6%) |
| Bachelor's Degree or higher | 0 (0.0%) | 0 (0.0%) |
Occupancy by Age of Householder in Joppa
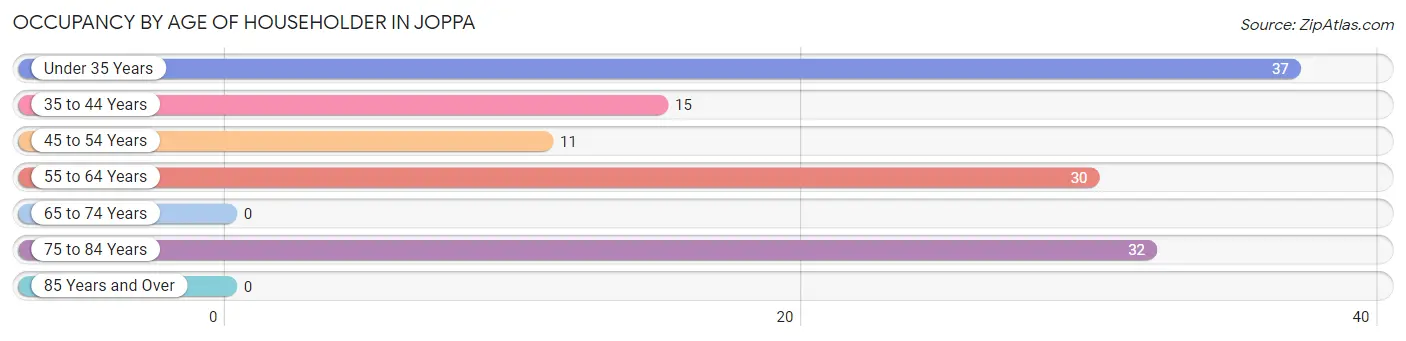
| Age Bracket | # Households | % Households |
| Under 35 Years | 37 | 29.6% |
| 35 to 44 Years | 15 | 12.0% |
| 45 to 54 Years | 11 | 8.8% |
| 55 to 64 Years | 30 | 24.0% |
| 65 to 74 Years | 0 | 0.0% |
| 75 to 84 Years | 32 | 25.6% |
| 85 Years and Over | 0 | 0.0% |
| Total | 125 | 100.0% |
Housing Finances in Joppa
Median Income by Occupancy in Joppa
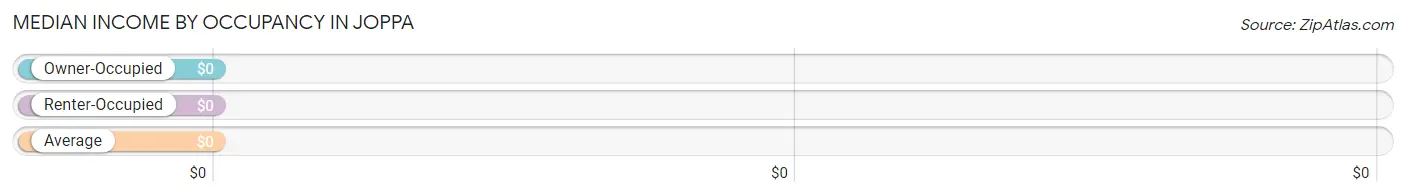
| Occupancy Type | # Households | Median Income |
| Owner-Occupied | 107 (85.6%) | $0 |
| Renter-Occupied | 18 (14.4%) | $0 |
| Average | 125 (100.0%) | $0 |
Occupancy by Householder Income Bracket in Joppa
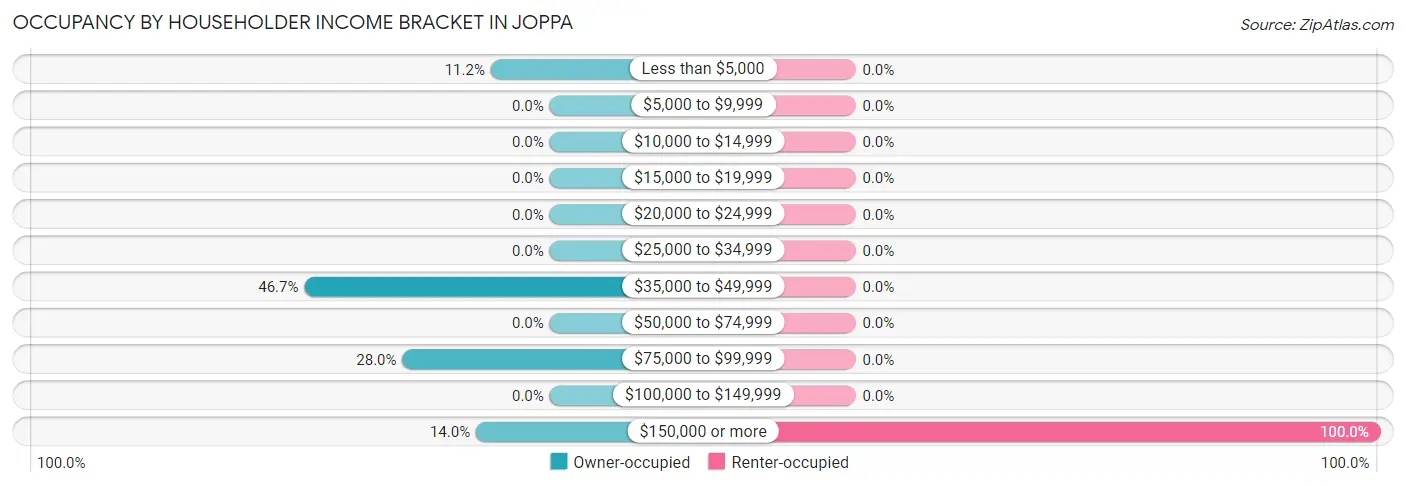
| Income Bracket | Owner-occupied | Renter-occupied |
| Less than $5,000 | 12 (11.2%) | 0 (0.0%) |
| $5,000 to $9,999 | 0 (0.0%) | 0 (0.0%) |
| $10,000 to $14,999 | 0 (0.0%) | 0 (0.0%) |
| $15,000 to $19,999 | 0 (0.0%) | 0 (0.0%) |
| $20,000 to $24,999 | 0 (0.0%) | 0 (0.0%) |
| $25,000 to $34,999 | 0 (0.0%) | 0 (0.0%) |
| $35,000 to $49,999 | 50 (46.7%) | 0 (0.0%) |
| $50,000 to $74,999 | 0 (0.0%) | 0 (0.0%) |
| $75,000 to $99,999 | 30 (28.0%) | 0 (0.0%) |
| $100,000 to $149,999 | 0 (0.0%) | 0 (0.0%) |
| $150,000 or more | 15 (14.0%) | 18 (100.0%) |
| Total | 107 (100.0%) | 18 (100.0%) |
Monthly Housing Cost Tiers in Joppa
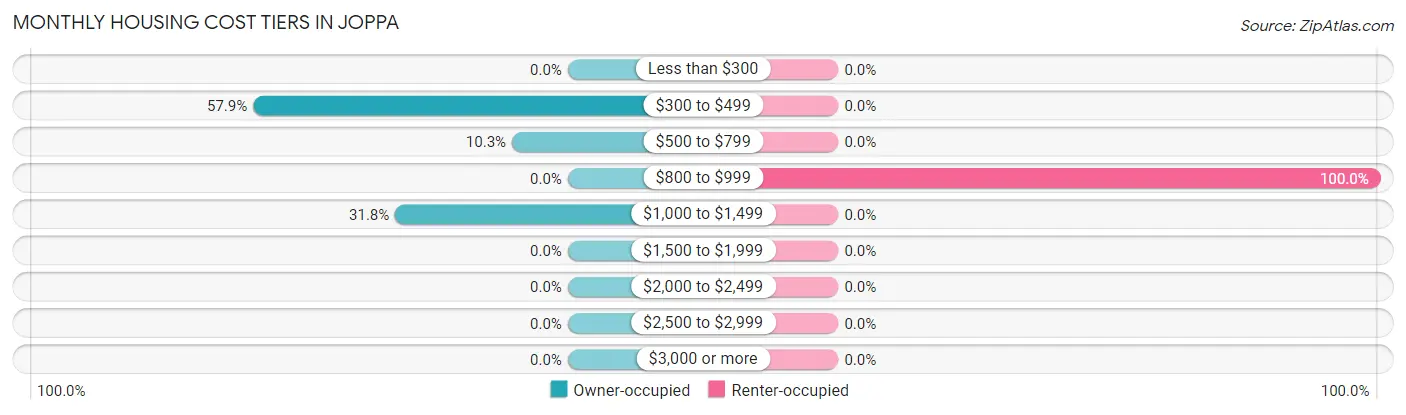
| Monthly Cost | Owner-occupied | Renter-occupied |
| Less than $300 | 0 (0.0%) | 0 (0.0%) |
| $300 to $499 | 62 (57.9%) | 0 (0.0%) |
| $500 to $799 | 11 (10.3%) | 0 (0.0%) |
| $800 to $999 | 0 (0.0%) | 18 (100.0%) |
| $1,000 to $1,499 | 34 (31.8%) | 0 (0.0%) |
| $1,500 to $1,999 | 0 (0.0%) | 0 (0.0%) |
| $2,000 to $2,499 | 0 (0.0%) | 0 (0.0%) |
| $2,500 to $2,999 | 0 (0.0%) | 0 (0.0%) |
| $3,000 or more | 0 (0.0%) | 0 (0.0%) |
| Total | 107 (100.0%) | 18 (100.0%) |
Physical Housing Characteristics in Joppa
Housing Structures in Joppa
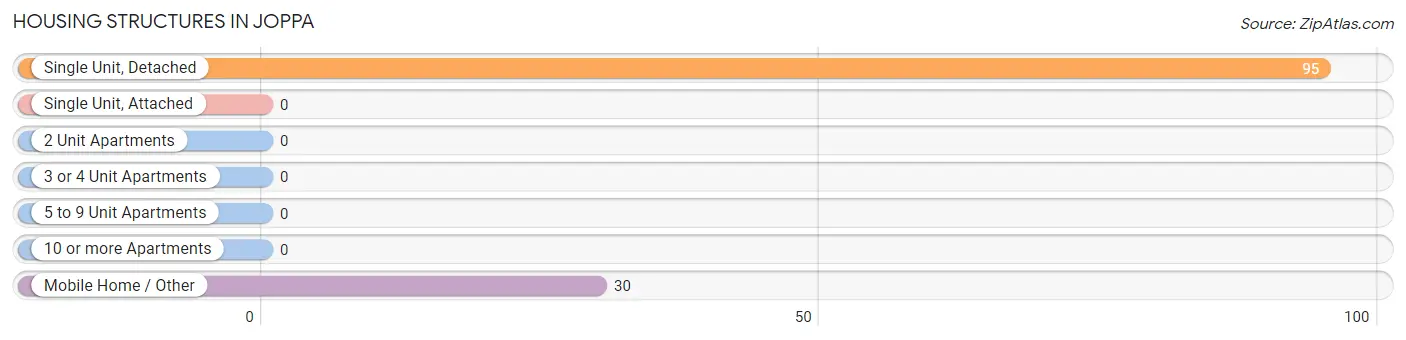
| Structure Type | # Housing Units | % Housing Units |
| Single Unit, Detached | 95 | 76.0% |
| Single Unit, Attached | 0 | 0.0% |
| 2 Unit Apartments | 0 | 0.0% |
| 3 or 4 Unit Apartments | 0 | 0.0% |
| 5 to 9 Unit Apartments | 0 | 0.0% |
| 10 or more Apartments | 0 | 0.0% |
| Mobile Home / Other | 30 | 24.0% |
| Total | 125 | 100.0% |
Housing Structures by Occupancy in Joppa
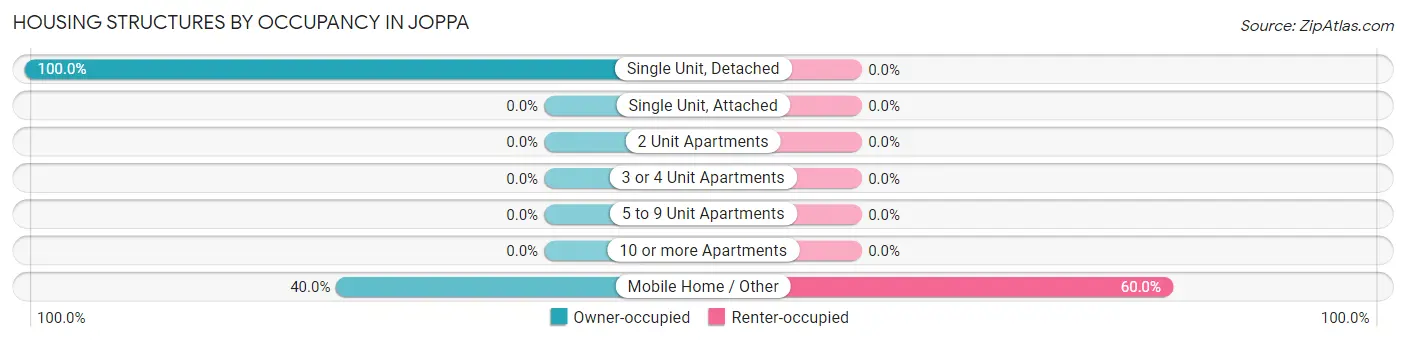
| Structure Type | Owner-occupied | Renter-occupied |
| Single Unit, Detached | 95 (100.0%) | 0 (0.0%) |
| Single Unit, Attached | 0 (0.0%) | 0 (0.0%) |
| 2 Unit Apartments | 0 (0.0%) | 0 (0.0%) |
| 3 or 4 Unit Apartments | 0 (0.0%) | 0 (0.0%) |
| 5 to 9 Unit Apartments | 0 (0.0%) | 0 (0.0%) |
| 10 or more Apartments | 0 (0.0%) | 0 (0.0%) |
| Mobile Home / Other | 12 (40.0%) | 18 (60.0%) |
| Total | 107 (85.6%) | 18 (14.4%) |
Housing Structures by Number of Rooms in Joppa
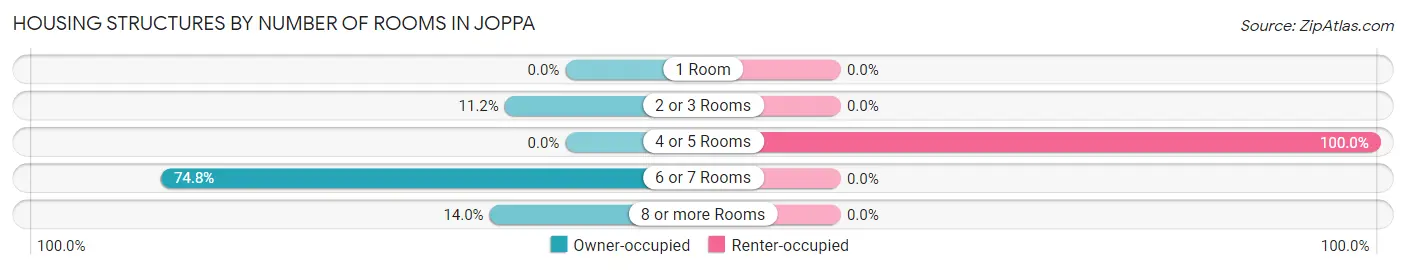
| Number of Rooms | Owner-occupied | Renter-occupied |
| 1 Room | 0 (0.0%) | 0 (0.0%) |
| 2 or 3 Rooms | 12 (11.2%) | 0 (0.0%) |
| 4 or 5 Rooms | 0 (0.0%) | 18 (100.0%) |
| 6 or 7 Rooms | 80 (74.8%) | 0 (0.0%) |
| 8 or more Rooms | 15 (14.0%) | 0 (0.0%) |
| Total | 107 (100.0%) | 18 (100.0%) |
Housing Structure by Heating Type in Joppa

| Heating Type | Owner-occupied | Renter-occupied |
| Utility Gas | 0 (0.0%) | 0 (0.0%) |
| Bottled, Tank, or LP Gas | 32 (29.9%) | 0 (0.0%) |
| Electricity | 75 (70.1%) | 18 (100.0%) |
| Fuel Oil or Kerosene | 0 (0.0%) | 0 (0.0%) |
| Coal or Coke | 0 (0.0%) | 0 (0.0%) |
| All other Fuels | 0 (0.0%) | 0 (0.0%) |
| No Fuel Used | 0 (0.0%) | 0 (0.0%) |
| Total | 107 (100.0%) | 18 (100.0%) |
Household Vehicle Usage in Joppa
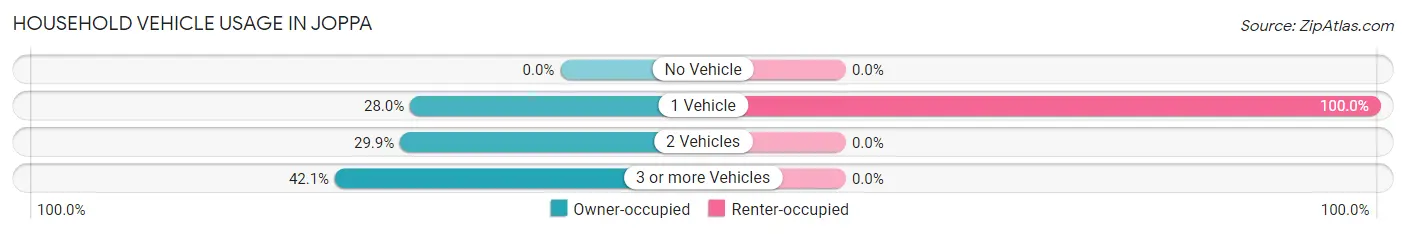
| Vehicles per Household | Owner-occupied | Renter-occupied |
| No Vehicle | 0 (0.0%) | 0 (0.0%) |
| 1 Vehicle | 30 (28.0%) | 18 (100.0%) |
| 2 Vehicles | 32 (29.9%) | 0 (0.0%) |
| 3 or more Vehicles | 45 (42.1%) | 0 (0.0%) |
| Total | 107 (100.0%) | 18 (100.0%) |
Real Estate & Mortgages in Joppa
Real Estate and Mortgage Overview in Joppa
| Characteristic | Without Mortgage | With Mortgage |
| Housing Units | 62 | 45 |
| Median Property Value | $99,700 | $194,200 |
| Median Household Income | $35,950 | $15 |
| Monthly Housing Costs | $430 | $0 |
| Real Estate Taxes | - | - |
Property Value by Mortgage Status in Joppa
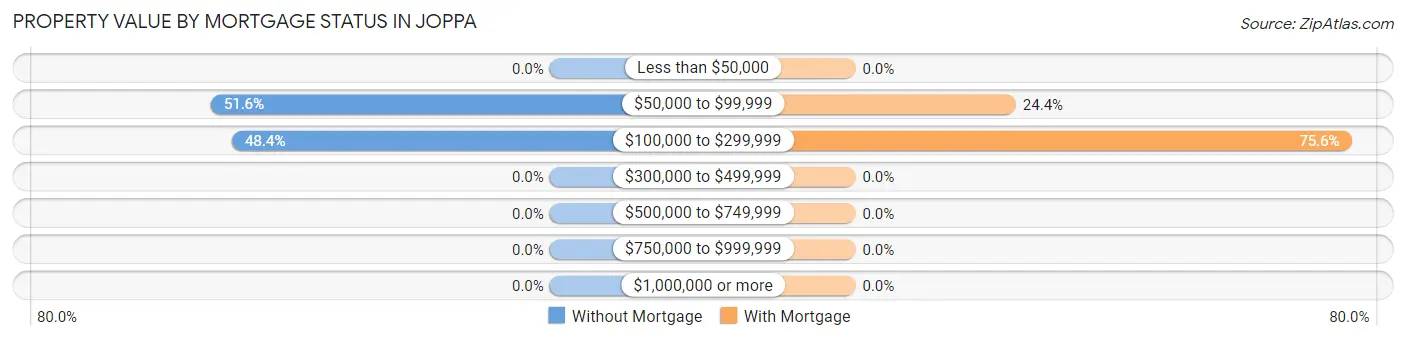
| Property Value | Without Mortgage | With Mortgage |
| Less than $50,000 | 0 (0.0%) | 0 (0.0%) |
| $50,000 to $99,999 | 32 (51.6%) | 11 (24.4%) |
| $100,000 to $299,999 | 30 (48.4%) | 34 (75.6%) |
| $300,000 to $499,999 | 0 (0.0%) | 0 (0.0%) |
| $500,000 to $749,999 | 0 (0.0%) | 0 (0.0%) |
| $750,000 to $999,999 | 0 (0.0%) | 0 (0.0%) |
| $1,000,000 or more | 0 (0.0%) | 0 (0.0%) |
| Total | 62 (100.0%) | 45 (100.0%) |
Household Income by Mortgage Status in Joppa
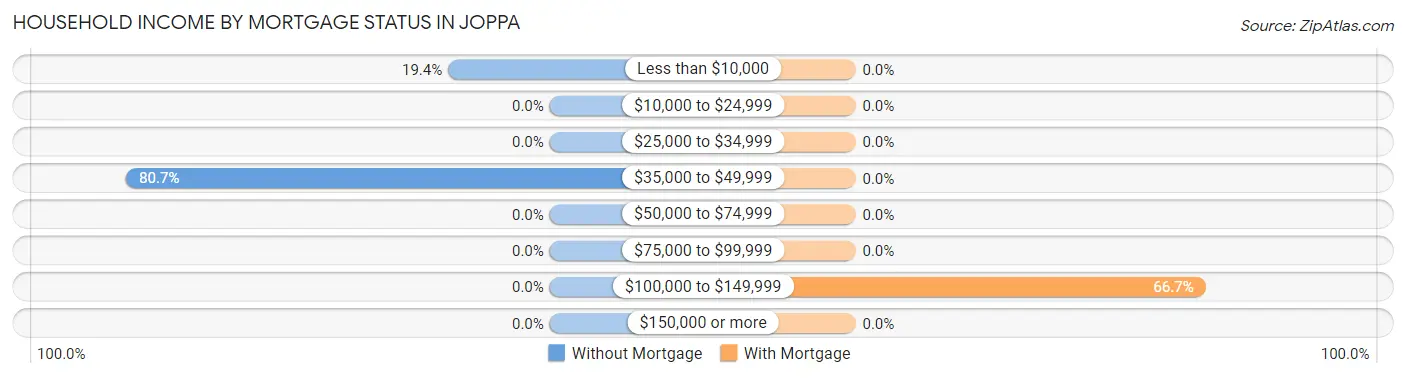
| Household Income | Without Mortgage | With Mortgage |
| Less than $10,000 | 12 (19.4%) | 0 (0.0%) |
| $10,000 to $24,999 | 0 (0.0%) | 0 (0.0%) |
| $25,000 to $34,999 | 0 (0.0%) | 0 (0.0%) |
| $35,000 to $49,999 | 50 (80.6%) | 0 (0.0%) |
| $50,000 to $74,999 | 0 (0.0%) | 0 (0.0%) |
| $75,000 to $99,999 | 0 (0.0%) | 0 (0.0%) |
| $100,000 to $149,999 | 0 (0.0%) | 30 (66.7%) |
| $150,000 or more | 0 (0.0%) | 0 (0.0%) |
| Total | 62 (100.0%) | 45 (100.0%) |
Property Value to Household Income Ratio in Joppa
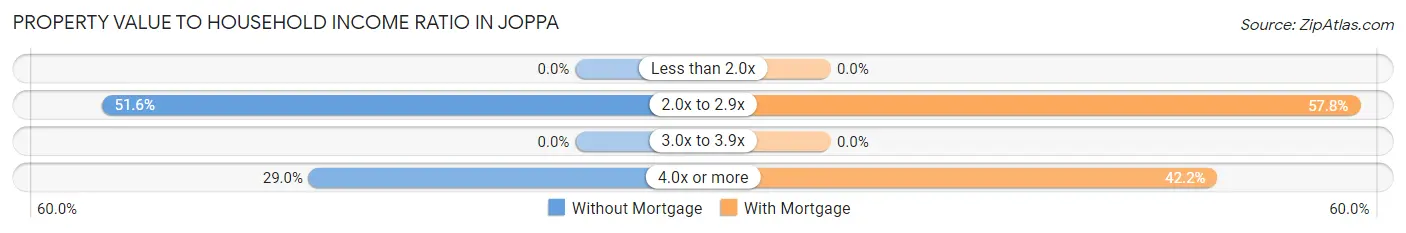
| Value-to-Income Ratio | Without Mortgage | With Mortgage |
| Less than 2.0x | 0 (0.0%) | 0 (0.0%) |
| 2.0x to 2.9x | 32 (51.6%) | 26 (57.8%) |
| 3.0x to 3.9x | 0 (0.0%) | 0 (0.0%) |
| 4.0x or more | 18 (29.0%) | 19 (42.2%) |
| Total | 62 (100.0%) | 45 (100.0%) |
Real Estate Taxes by Mortgage Status in Joppa
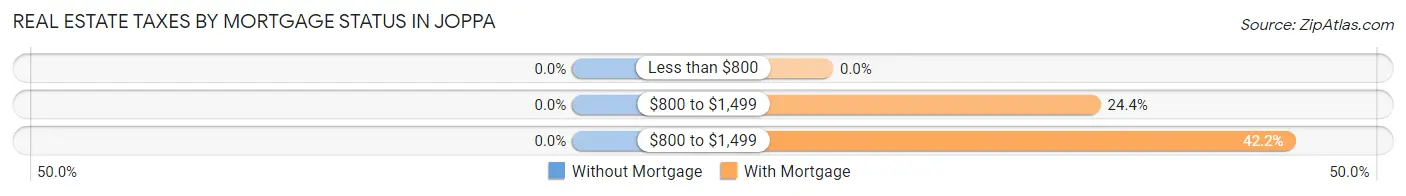
| Property Taxes | Without Mortgage | With Mortgage |
| Less than $800 | 0 (0.0%) | 0 (0.0%) |
| $800 to $1,499 | 0 (0.0%) | 11 (24.4%) |
| $800 to $1,499 | 0 (0.0%) | 19 (42.2%) |
| Total | 62 (100.0%) | 45 (100.0%) |
Health & Disability in Joppa
Health Insurance Coverage by Age in Joppa
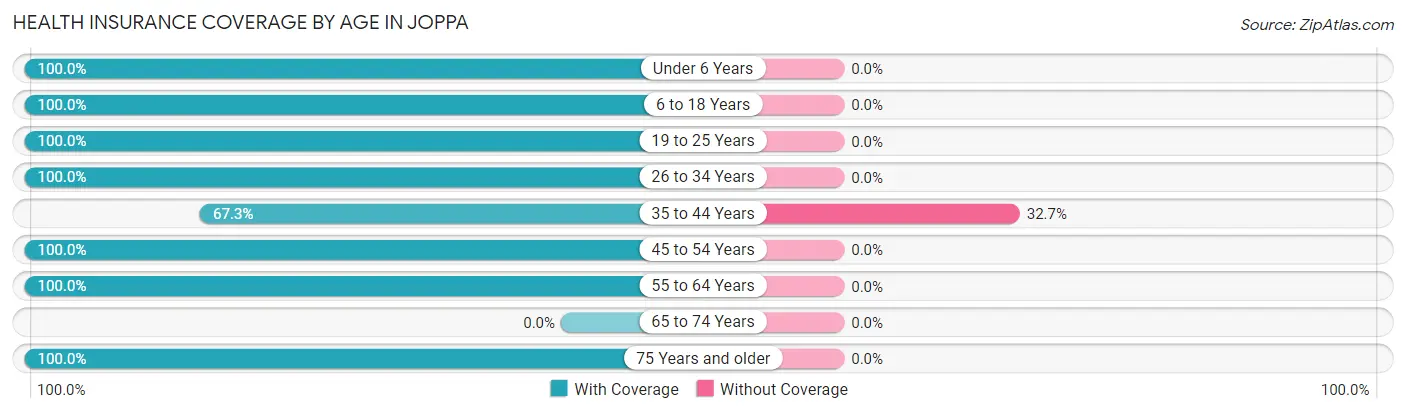
| Age Bracket | With Coverage | Without Coverage |
| Under 6 Years | 20 (100.0%) | 0 (0.0%) |
| 6 to 18 Years | 66 (100.0%) | 0 (0.0%) |
| 19 to 25 Years | 30 (100.0%) | 0 (0.0%) |
| 26 to 34 Years | 61 (100.0%) | 0 (0.0%) |
| 35 to 44 Years | 37 (67.3%) | 18 (32.7%) |
| 45 to 54 Years | 55 (100.0%) | 0 (0.0%) |
| 55 to 64 Years | 30 (100.0%) | 0 (0.0%) |
| 65 to 74 Years | 0 (0.0%) | 0 (0.0%) |
| 75 Years and older | 61 (100.0%) | 0 (0.0%) |
| Total | 360 (95.2%) | 18 (4.8%) |
Health Insurance Coverage by Citizenship Status in Joppa
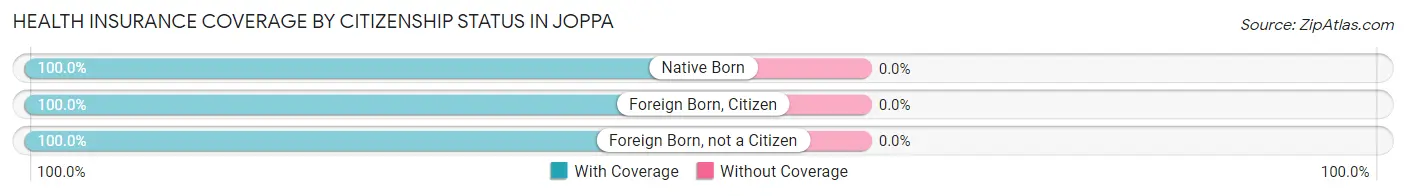
| Citizenship Status | With Coverage | Without Coverage |
| Native Born | 20 (100.0%) | 0 (0.0%) |
| Foreign Born, Citizen | 66 (100.0%) | 0 (0.0%) |
| Foreign Born, not a Citizen | 30 (100.0%) | 0 (0.0%) |
Health Insurance Coverage by Household Income in Joppa
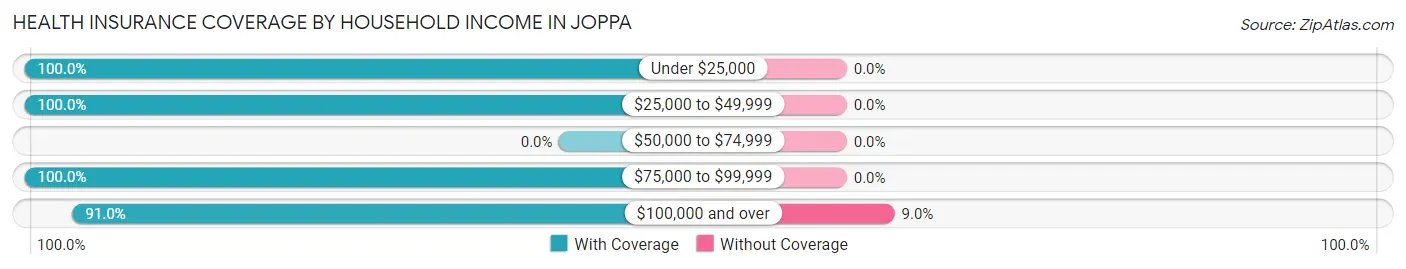
| Household Income | With Coverage | Without Coverage |
| Under $25,000 | 12 (100.0%) | 0 (0.0%) |
| $25,000 to $49,999 | 79 (100.0%) | 0 (0.0%) |
| $50,000 to $74,999 | 0 (0.0%) | 0 (0.0%) |
| $75,000 to $99,999 | 86 (100.0%) | 0 (0.0%) |
| $100,000 and over | 183 (91.0%) | 18 (9.0%) |
Public vs Private Health Insurance Coverage by Age in Joppa
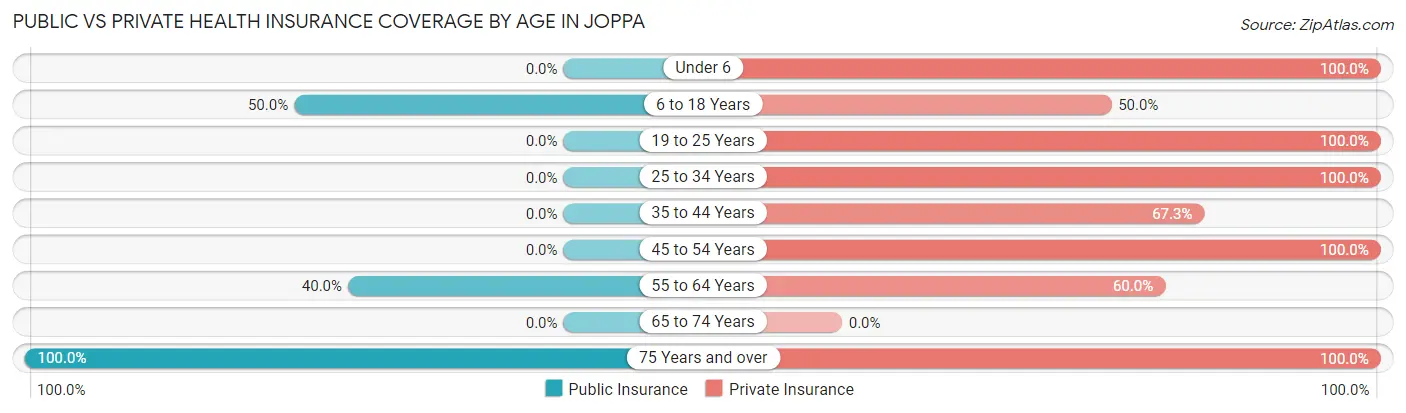
| Age Bracket | Public Insurance | Private Insurance |
| Under 6 | 0 (0.0%) | 20 (100.0%) |
| 6 to 18 Years | 33 (50.0%) | 33 (50.0%) |
| 19 to 25 Years | 0 (0.0%) | 30 (100.0%) |
| 25 to 34 Years | 0 (0.0%) | 61 (100.0%) |
| 35 to 44 Years | 0 (0.0%) | 37 (67.3%) |
| 45 to 54 Years | 0 (0.0%) | 55 (100.0%) |
| 55 to 64 Years | 12 (40.0%) | 18 (60.0%) |
| 65 to 74 Years | 0 (0.0%) | 0 (0.0%) |
| 75 Years and over | 61 (100.0%) | 61 (100.0%) |
| Total | 106 (28.0%) | 315 (83.3%) |
Disability Status by Sex by Age in Joppa
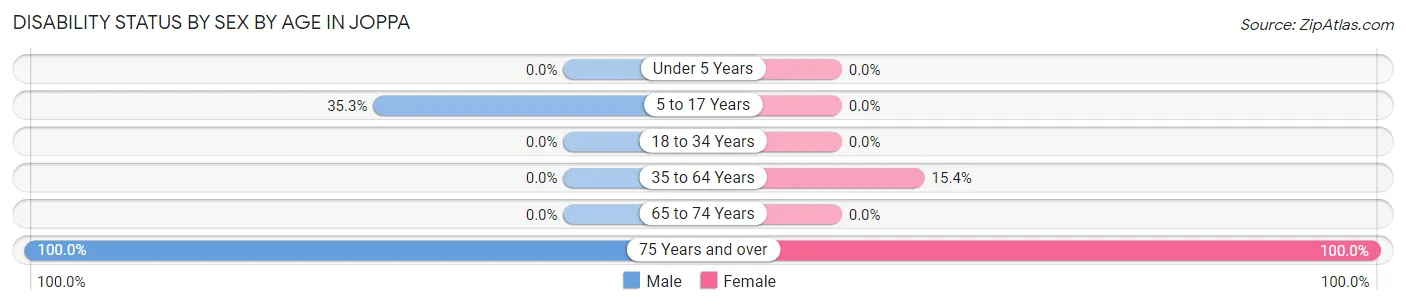
| Age Bracket | Male | Female |
| Under 5 Years | 0 (0.0%) | 0 (0.0%) |
| 5 to 17 Years | 18 (35.3%) | 0 (0.0%) |
| 18 to 34 Years | 0 (0.0%) | 0 (0.0%) |
| 35 to 64 Years | 0 (0.0%) | 12 (15.4%) |
| 65 to 74 Years | 0 (0.0%) | 0 (0.0%) |
| 75 Years and over | 32 (100.0%) | 29 (100.0%) |
Disability Class by Sex by Age in Joppa
Disability Class: Hearing Difficulty
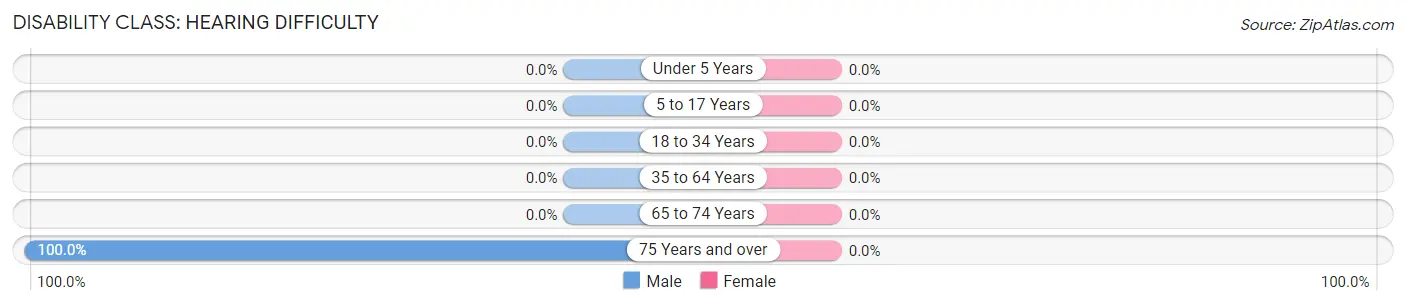
| Age Bracket | Male | Female |
| Under 5 Years | 0 (0.0%) | 0 (0.0%) |
| 5 to 17 Years | 0 (0.0%) | 0 (0.0%) |
| 18 to 34 Years | 0 (0.0%) | 0 (0.0%) |
| 35 to 64 Years | 0 (0.0%) | 0 (0.0%) |
| 65 to 74 Years | 0 (0.0%) | 0 (0.0%) |
| 75 Years and over | 32 (100.0%) | 0 (0.0%) |
Disability Class: Vision Difficulty
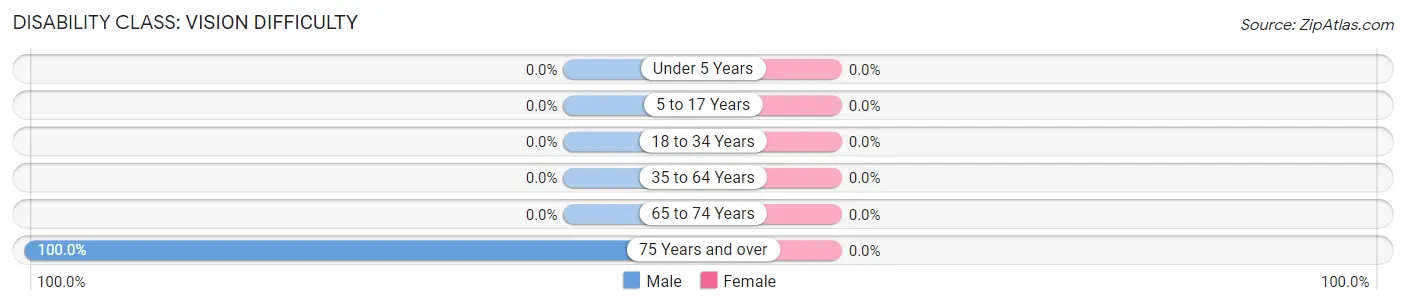
| Age Bracket | Male | Female |
| Under 5 Years | 0 (0.0%) | 0 (0.0%) |
| 5 to 17 Years | 0 (0.0%) | 0 (0.0%) |
| 18 to 34 Years | 0 (0.0%) | 0 (0.0%) |
| 35 to 64 Years | 0 (0.0%) | 0 (0.0%) |
| 65 to 74 Years | 0 (0.0%) | 0 (0.0%) |
| 75 Years and over | 32 (100.0%) | 0 (0.0%) |
Disability Class: Cognitive Difficulty
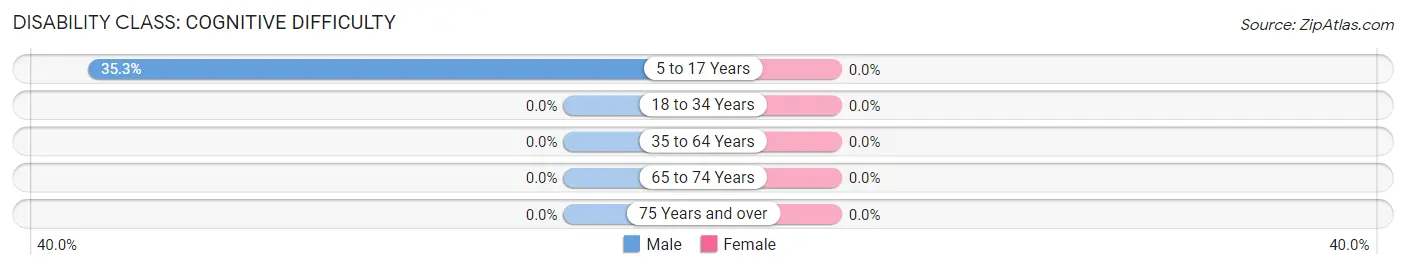
| Age Bracket | Male | Female |
| 5 to 17 Years | 18 (35.3%) | 0 (0.0%) |
| 18 to 34 Years | 0 (0.0%) | 0 (0.0%) |
| 35 to 64 Years | 0 (0.0%) | 0 (0.0%) |
| 65 to 74 Years | 0 (0.0%) | 0 (0.0%) |
| 75 Years and over | 0 (0.0%) | 0 (0.0%) |
Disability Class: Ambulatory Difficulty
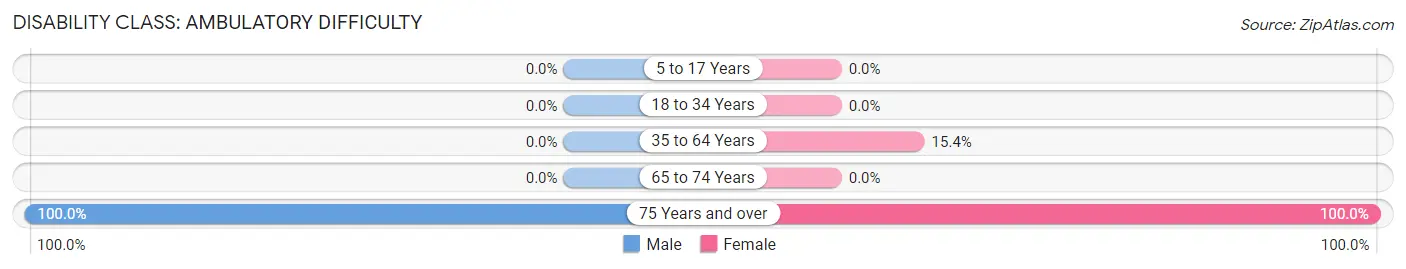
| Age Bracket | Male | Female |
| 5 to 17 Years | 0 (0.0%) | 0 (0.0%) |
| 18 to 34 Years | 0 (0.0%) | 0 (0.0%) |
| 35 to 64 Years | 0 (0.0%) | 12 (15.4%) |
| 65 to 74 Years | 0 (0.0%) | 0 (0.0%) |
| 75 Years and over | 32 (100.0%) | 29 (100.0%) |
Disability Class: Self-Care Difficulty
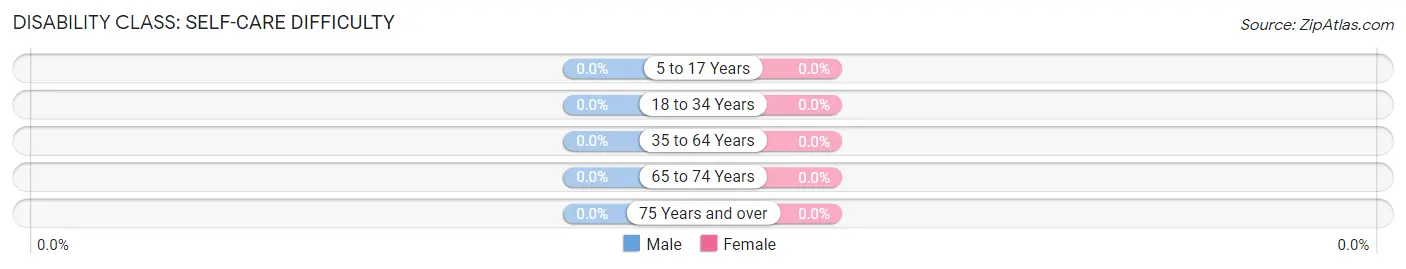
| Age Bracket | Male | Female |
| 5 to 17 Years | 0 (0.0%) | 0 (0.0%) |
| 18 to 34 Years | 0 (0.0%) | 0 (0.0%) |
| 35 to 64 Years | 0 (0.0%) | 0 (0.0%) |
| 65 to 74 Years | 0 (0.0%) | 0 (0.0%) |
| 75 Years and over | 0 (0.0%) | 0 (0.0%) |
Technology Access in Joppa
Computing Device Access in Joppa
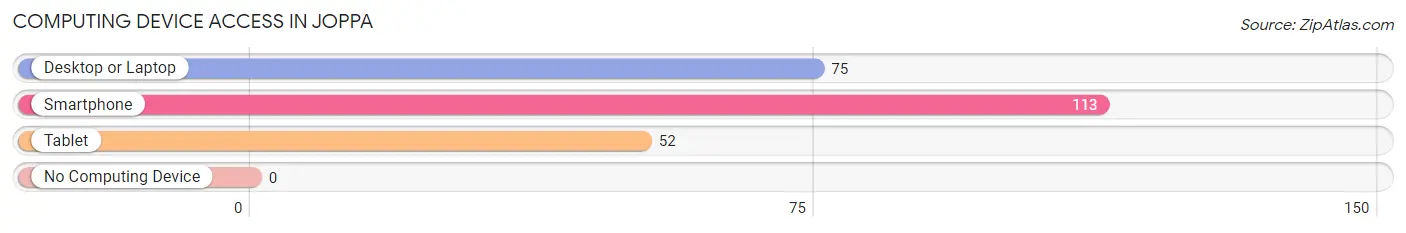
| Device Type | # Households | % Households |
| Desktop or Laptop | 75 | 60.0% |
| Smartphone | 113 | 90.4% |
| Tablet | 52 | 41.6% |
| No Computing Device | 0 | 0.0% |
| Total | 125 | 100.0% |
Internet Access in Joppa
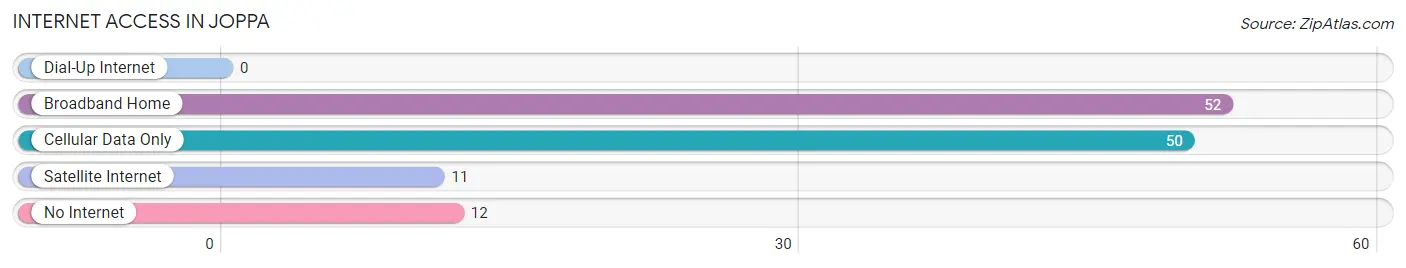
| Internet Type | # Households | % Households |
| Dial-Up Internet | 0 | 0.0% |
| Broadband Home | 52 | 41.6% |
| Cellular Data Only | 50 | 40.0% |
| Satellite Internet | 11 | 8.8% |
| No Internet | 12 | 9.6% |
| Total | 125 | 100.0% |
Joppa Summary
Joppa, Alabama is a small unincorporated community located in the northeastern corner of the state, in Jackson County. It is situated on the banks of the Tennessee River, and is home to a population of just over 500 people. The town was founded in 1818, and has a rich history of farming, industry, and commerce.
History
Joppa was founded in 1818 by a group of settlers from North Carolina. The town was named after the biblical city of Joppa, which was located in modern-day Israel. The settlers were attracted to the area due to its fertile soil and abundant natural resources. The town quickly grew and became a center of commerce and industry. In 1820, the first post office was established, and in 1821, the first school was built.
In the late 19th century, Joppa was a thriving agricultural community. Cotton was the main crop, and the town was home to several cotton gins and warehouses. The town also had a number of stores, a hotel, and a blacksmith shop. In the early 20th century, the town began to decline as the cotton industry moved away.
Geography
Joppa is located in the northeastern corner of Alabama, in Jackson County. It is situated on the banks of the Tennessee River, and is surrounded by rolling hills and forests. The town is located about 25 miles south of Huntsville, and about 50 miles north of Birmingham.
The climate in Joppa is humid subtropical, with hot summers and mild winters. The average annual temperature is around 68 degrees Fahrenheit, and the average annual precipitation is around 50 inches.
Economy
The economy of Joppa is largely based on agriculture. The town is home to several farms, and the main crops are cotton, corn, soybeans, and hay. The town also has a number of small businesses, including a grocery store, a hardware store, and a gas station.
Demographics
As of the 2010 census, the population of Joppa was 514. The racial makeup of the town was 97.3% White, 0.6% African American, 0.4% Native American, 0.2% Asian, and 1.5% from other races. The median household income was $31,250, and the median family income was $37,500.
Conclusion
Joppa, Alabama is a small unincorporated community located in the northeastern corner of the state, in Jackson County. It is situated on the banks of the Tennessee River, and is home to a population of just over 500 people. The town was founded in 1818, and has a rich history of farming, industry, and commerce. The economy of Joppa is largely based on agriculture, and the town is home to several farms. The racial makeup of the town is predominantly White, with a small percentage of African American, Native American, and Asian residents. The median household income is $31,250, and the median family income is $37,500.
Common Questions
What is Per Capita Income in Joppa?
Per Capita income in Joppa is $35,561.
What is Income or Wage Gap in Joppa?
Income or Wage Gap in Joppa is 25.8%.
Women in Joppa earn 74.2 cents for every dollar earned by a man.
What is Inequality or Gini Index in Joppa?
Inequality or Gini Index in Joppa is 0.47.
What is the Total Population of Joppa?
Total Population of Joppa is 378.
What is the Total Male Population of Joppa?
Total Male Population of Joppa is 219.
What is the Total Female Population of Joppa?
Total Female Population of Joppa is 159.
What is the Ratio of Males per 100 Females in Joppa?
There are 137.74 Males per 100 Females in Joppa.
What is the Ratio of Females per 100 Males in Joppa?
There are 72.60 Females per 100 Males in Joppa.
What is the Median Population Age in Joppa?
Median Population Age in Joppa is 37.5 Years.
What is the Average Family Size in Joppa
Average Family Size in Joppa is 3.5 People.
What is the Average Household Size in Joppa
Average Household Size in Joppa is 3.0 People.
How Large is the Labor Force in Joppa?
There are 219 People in the Labor Forcein in Joppa.
What is the Percentage of People in the Labor Force in Joppa?
75.0% of People are in the Labor Force in Joppa.