Zip Codes with the Highest Percentage of Population Employed in Food Preparation & Serving in Georgia
RELATED REPORTS & OPTIONS
Food Preparation & Serving
Georgia
Compare Zip Codes
Map of Zip Codes with the Highest Percentage of Population Employed in Food Preparation & Serving in Georgia
0.0%
60.0%
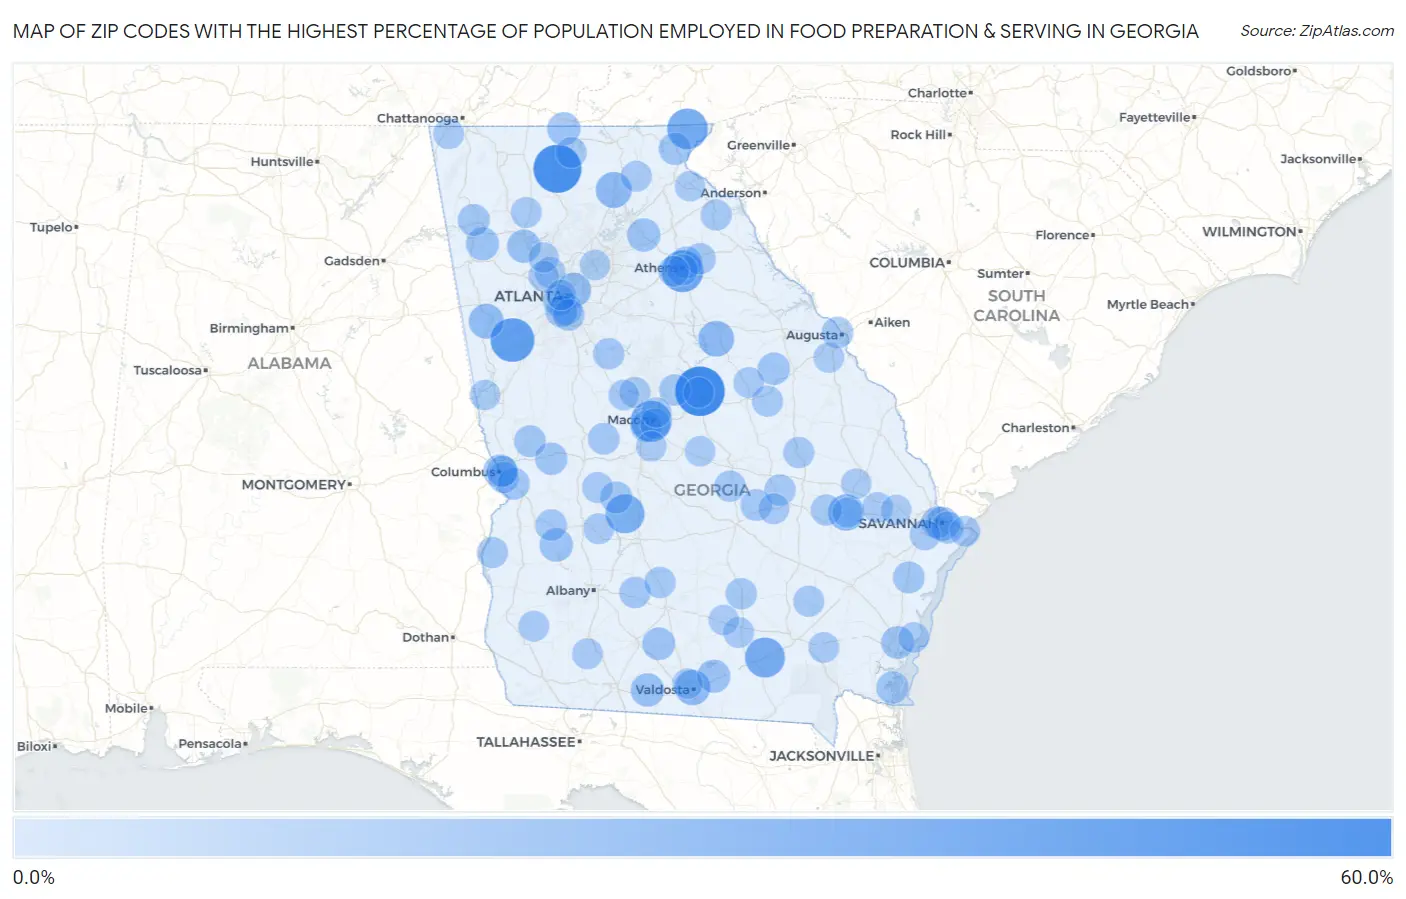
Zip Codes with the Highest Percentage of Population Employed in Food Preparation & Serving in Georgia
| Zip Code | % Employed | vs State | vs National | |
| 1. | 31034 | 52.0% | 5.1%(+46.9)#1 | 5.3%(+46.7)#50 |
| 2. | 30539 | 48.5% | 5.1%(+43.3)#2 | 5.3%(+43.2)#62 |
| 3. | 30275 | 38.4% | 5.1%(+33.3)#3 | 5.3%(+33.1)#111 |
| 4. | 30609 | 33.8% | 5.1%(+28.6)#4 | 5.3%(+28.5)#163 |
| 5. | 31207 | 32.5% | 5.1%(+27.4)#5 | 5.3%(+27.2)#178 |
| 6. | 30537 | 31.1% | 5.1%(+25.9)#6 | 5.3%(+25.8)#194 |
| 7. | 31623 | 29.7% | 5.1%(+24.5)#7 | 5.3%(+24.4)#219 |
| 8. | 31051 | 27.6% | 5.1%(+22.4)#8 | 5.3%(+22.3)#251 |
| 9. | 30429 | 21.2% | 5.1%(+16.0)#9 | 5.3%(+15.9)#452 |
| 10. | 30597 | 20.3% | 5.1%(+15.2)#10 | 5.3%(+15.0)#484 |
| 11. | 30678 | 19.9% | 5.1%(+14.7)#11 | 5.3%(+14.6)#515 |
| 12. | 31698 | 19.2% | 5.1%(+14.0)#12 | 5.3%(+13.9)#551 |
| 13. | 30118 | 18.2% | 5.1%(+13.0)#13 | 5.3%(+12.9)#643 |
| 14. | 30322 | 17.4% | 5.1%(+12.2)#14 | 5.3%(+12.1)#717 |
| 15. | 31401 | 15.5% | 5.1%(+10.3)#15 | 5.3%(+10.2)#918 |
| 16. | 31629 | 14.8% | 5.1%(+9.68)#16 | 5.3%(+9.54)#1,005 |
| 17. | 30137 | 14.5% | 5.1%(+9.39)#17 | 5.3%(+9.25)#1,054 |
| 18. | 31901 | 14.4% | 5.1%(+9.27)#18 | 5.3%(+9.13)#1,076 |
| 19. | 30575 | 14.3% | 5.1%(+9.18)#19 | 5.3%(+9.04)#1,088 |
| 20. | 39877 | 14.3% | 5.1%(+9.14)#20 | 5.3%(+9.00)#1,098 |
| 21. | 31641 | 14.2% | 5.1%(+9.10)#21 | 5.3%(+8.96)#1,114 |
| 22. | 30555 | 14.0% | 5.1%(+8.86)#22 | 5.3%(+8.72)#1,161 |
| 23. | 30173 | 13.8% | 5.1%(+8.62)#23 | 5.3%(+8.47)#1,220 |
| 24. | 31520 | 13.1% | 5.1%(+7.92)#24 | 5.3%(+7.78)#1,378 |
| 25. | 31747 | 13.0% | 5.1%(+7.90)#25 | 5.3%(+7.76)#1,383 |
| 26. | 31810 | 12.5% | 5.1%(+7.36)#26 | 5.3%(+7.21)#1,521 |
| 27. | 30576 | 12.4% | 5.1%(+7.23)#27 | 5.3%(+7.09)#1,549 |
| 28. | 30810 | 12.3% | 5.1%(+7.13)#28 | 5.3%(+6.98)#1,575 |
| 29. | 31558 | 11.9% | 5.1%(+6.76)#29 | 5.3%(+6.62)#1,703 |
| 30. | 31415 | 11.6% | 5.1%(+6.50)#30 | 5.3%(+6.36)#1,797 |
| 31. | 31404 | 11.6% | 5.1%(+6.47)#31 | 5.3%(+6.33)#1,813 |
| 32. | 30149 | 11.4% | 5.1%(+6.30)#32 | 5.3%(+6.16)#1,858 |
| 33. | 31063 | 11.4% | 5.1%(+6.25)#33 | 5.3%(+6.11)#1,877 |
| 34. | 30354 | 11.4% | 5.1%(+6.22)#34 | 5.3%(+6.08)#1,888 |
| 35. | 30601 | 11.2% | 5.1%(+6.10)#35 | 5.3%(+5.96)#1,939 |
| 36. | 30311 | 11.2% | 5.1%(+6.05)#36 | 5.3%(+5.91)#1,963 |
| 37. | 31905 | 11.2% | 5.1%(+6.02)#37 | 5.3%(+5.88)#1,977 |
| 38. | 31323 | 11.0% | 5.1%(+5.86)#38 | 5.3%(+5.72)#2,056 |
| 39. | 30337 | 11.0% | 5.1%(+5.82)#39 | 5.3%(+5.68)#2,069 |
| 40. | 31831 | 10.9% | 5.1%(+5.71)#40 | 5.3%(+5.57)#2,132 |
| 41. | 30428 | 10.8% | 5.1%(+5.61)#41 | 5.3%(+5.47)#2,174 |
| 42. | 31078 | 10.7% | 5.1%(+5.53)#42 | 5.3%(+5.39)#2,216 |
| 43. | 30904 | 10.6% | 5.1%(+5.43)#43 | 5.3%(+5.29)#2,284 |
| 44. | 30297 | 10.5% | 5.1%(+5.38)#44 | 5.3%(+5.24)#2,310 |
| 45. | 31206 | 10.5% | 5.1%(+5.31)#45 | 5.3%(+5.17)#2,345 |
| 46. | 31824 | 10.3% | 5.1%(+5.19)#46 | 5.3%(+5.05)#2,403 |
| 47. | 31033 | 10.2% | 5.1%(+5.05)#47 | 5.3%(+4.91)#2,484 |
| 48. | 30628 | 10.2% | 5.1%(+5.01)#48 | 5.3%(+4.87)#2,516 |
| 49. | 31075 | 10.1% | 5.1%(+4.96)#49 | 5.3%(+4.82)#2,552 |
| 50. | 30234 | 10.0% | 5.1%(+4.89)#50 | 5.3%(+4.75)#2,602 |
| 51. | 31781 | 10.0% | 5.1%(+4.83)#51 | 5.3%(+4.69)#2,654 |
| 52. | 31903 | 10.0% | 5.1%(+4.83)#52 | 5.3%(+4.69)#2,656 |
| 53. | 31533 | 9.9% | 5.1%(+4.78)#53 | 5.3%(+4.64)#2,690 |
| 54. | 31790 | 9.9% | 5.1%(+4.74)#54 | 5.3%(+4.60)#2,720 |
| 55. | 30470 | 9.8% | 5.1%(+4.62)#55 | 5.3%(+4.48)#2,825 |
| 56. | 31906 | 9.6% | 5.1%(+4.50)#56 | 5.3%(+4.36)#2,929 |
| 57. | 30421 | 9.4% | 5.1%(+4.22)#57 | 5.3%(+4.08)#3,170 |
| 58. | 30401 | 9.3% | 5.1%(+4.15)#58 | 5.3%(+4.01)#3,240 |
| 59. | 31018 | 9.3% | 5.1%(+4.14)#59 | 5.3%(+4.00)#3,244 |
| 60. | 30602 | 9.2% | 5.1%(+4.08)#60 | 5.3%(+3.94)#3,299 |
| 61. | 30520 | 9.2% | 5.1%(+4.05)#61 | 5.3%(+3.90)#3,332 |
| 62. | 31551 | 9.2% | 5.1%(+4.02)#62 | 5.3%(+3.88)#3,354 |
| 63. | 39854 | 9.1% | 5.1%(+4.00)#63 | 5.3%(+3.86)#3,373 |
| 64. | 30513 | 9.1% | 5.1%(+3.94)#64 | 5.3%(+3.80)#3,441 |
| 65. | 31068 | 9.1% | 5.1%(+3.91)#65 | 5.3%(+3.77)#3,466 |
| 66. | 30445 | 9.0% | 5.1%(+3.87)#66 | 5.3%(+3.72)#3,518 |
| 67. | 30528 | 9.0% | 5.1%(+3.85)#67 | 5.3%(+3.71)#3,533 |
| 68. | 30060 | 9.0% | 5.1%(+3.82)#68 | 5.3%(+3.68)#3,558 |
| 69. | 31046 | 8.8% | 5.1%(+3.68)#69 | 5.3%(+3.54)#3,697 |
| 70. | 30606 | 8.8% | 5.1%(+3.67)#70 | 5.3%(+3.53)#3,718 |
| 71. | 39841 | 8.7% | 5.1%(+3.58)#71 | 5.3%(+3.43)#3,817 |
| 72. | 30171 | 8.7% | 5.1%(+3.57)#72 | 5.3%(+3.43)#3,821 |
| 73. | 31709 | 8.7% | 5.1%(+3.57)#73 | 5.3%(+3.43)#3,827 |
| 74. | 31642 | 8.6% | 5.1%(+3.51)#74 | 5.3%(+3.36)#3,912 |
| 75. | 31779 | 8.6% | 5.1%(+3.47)#75 | 5.3%(+3.33)#3,950 |
| 76. | 31542 | 8.5% | 5.1%(+3.32)#76 | 5.3%(+3.17)#4,109 |
| 77. | 31419 | 8.4% | 5.1%(+3.30)#77 | 5.3%(+3.16)#4,120 |
| 78. | 31094 | 8.4% | 5.1%(+3.30)#78 | 5.3%(+3.16)#4,121 |
| 79. | 31029 | 8.4% | 5.1%(+3.28)#79 | 5.3%(+3.14)#4,144 |
| 80. | 31321 | 8.4% | 5.1%(+3.27)#80 | 5.3%(+3.13)#4,149 |
| 81. | 30757 | 8.4% | 5.1%(+3.22)#81 | 5.3%(+3.08)#4,215 |
| 82. | 31061 | 8.3% | 5.1%(+3.18)#82 | 5.3%(+3.03)#4,293 |
| 83. | 31201 | 8.3% | 5.1%(+3.17)#83 | 5.3%(+3.03)#4,299 |
| 84. | 31328 | 8.3% | 5.1%(+3.11)#84 | 5.3%(+2.97)#4,362 |
| 85. | 30008 | 8.3% | 5.1%(+3.11)#85 | 5.3%(+2.97)#4,365 |
| 86. | 31602 | 8.2% | 5.1%(+3.10)#86 | 5.3%(+2.96)#4,381 |
| 87. | 31522 | 8.2% | 5.1%(+3.06)#87 | 5.3%(+2.92)#4,429 |
| 88. | 30815 | 8.2% | 5.1%(+3.05)#88 | 5.3%(+2.91)#4,441 |
| 89. | 30314 | 8.1% | 5.1%(+2.99)#89 | 5.3%(+2.85)#4,530 |
| 90. | 30096 | 8.1% | 5.1%(+2.96)#90 | 5.3%(+2.82)#4,565 |
| 91. | 31017 | 8.0% | 5.1%(+2.87)#91 | 5.3%(+2.73)#4,707 |
| 92. | 31308 | 7.9% | 5.1%(+2.77)#92 | 5.3%(+2.63)#4,859 |
| 93. | 30144 | 7.9% | 5.1%(+2.77)#93 | 5.3%(+2.63)#4,868 |
| 94. | 31650 | 7.9% | 5.1%(+2.72)#94 | 5.3%(+2.57)#4,949 |
| 95. | 30458 | 7.8% | 5.1%(+2.69)#95 | 5.3%(+2.55)#4,980 |
| 96. | 30417 | 7.8% | 5.1%(+2.67)#96 | 5.3%(+2.53)#5,013 |
| 97. | 31093 | 7.8% | 5.1%(+2.66)#97 | 5.3%(+2.52)#5,048 |
| 98. | 30577 | 7.8% | 5.1%(+2.63)#98 | 5.3%(+2.49)#5,096 |
| 99. | 30240 | 7.8% | 5.1%(+2.62)#99 | 5.3%(+2.48)#5,120 |
| 100. | 31211 | 7.8% | 5.1%(+2.62)#100 | 5.3%(+2.47)#5,123 |
Common Questions
What are the Top 10 Zip Codes with the Highest Percentage of Population Employed in Food Preparation & Serving in Georgia?
Top 10 Zip Codes with the Highest Percentage of Population Employed in Food Preparation & Serving in Georgia are:
What zip code has the Highest Percentage of Population Employed in Food Preparation & Serving in Georgia?
31034 has the Highest Percentage of Population Employed in Food Preparation & Serving in Georgia with 52.0%.
What is the Percentage of Population Employed in Food Preparation & Serving in the State of Georgia?
Percentage of Population Employed in Food Preparation & Serving in Georgia is 5.1%.
What is the Percentage of Population Employed in Food Preparation & Serving in the United States?
Percentage of Population Employed in Food Preparation & Serving in the United States is 5.3%.