Zip Codes with the Highest Percentage of Population Employed in Food Preparation & Serving in Puerto Rico
RELATED REPORTS & OPTIONS
Food Preparation & Serving
Puerto Rico
Compare Zip Codes
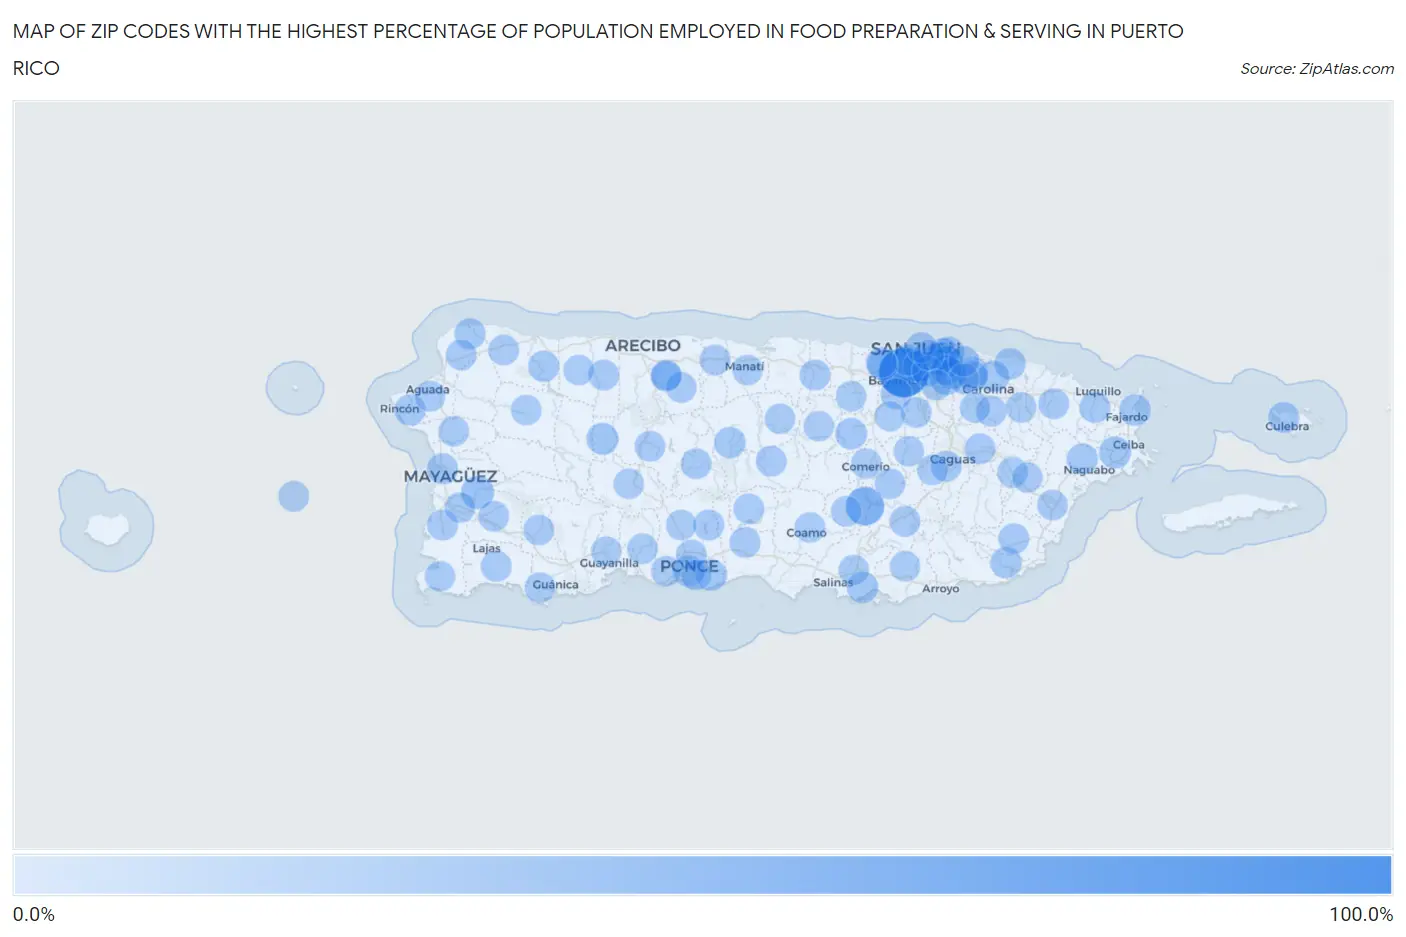
Map of Zip Codes with the Highest Percentage of Population Employed in Food Preparation & Serving in Puerto Rico
0.0%
100.0%
Zip Codes with the Highest Percentage of Population Employed in Food Preparation & Serving in Puerto Rico
| Zip Code | % Employed | vs State | vs National | |
| 1. | 00960 | 100.0% | 5.7%(+94.3)#1 | 5.3%(+94.7)#1 |
| 2. | 00786 | 43.5% | 5.7%(+37.8)#2 | 5.3%(+38.2)#84 |
| 3. | 00636 | 17.2% | 5.7%(+11.5)#3 | 5.3%(+11.9)#727 |
| 4. | 00925 | 14.5% | 5.7%(+8.86)#4 | 5.3%(+9.26)#1,051 |
| 5. | 00909 | 13.9% | 5.7%(+8.24)#5 | 5.3%(+8.63)#1,182 |
| 6. | 00735 | 11.8% | 5.7%(+6.14)#6 | 5.3%(+6.54)#1,726 |
| 7. | 00611 | 11.7% | 5.7%(+5.98)#7 | 5.3%(+6.37)#1,790 |
| 8. | 00913 | 11.2% | 5.7%(+5.54)#8 | 5.3%(+5.94)#1,946 |
| 9. | 00965 | 11.0% | 5.7%(+5.33)#9 | 5.3%(+5.73)#2,052 |
| 10. | 00719 | 10.7% | 5.7%(+5.06)#10 | 5.3%(+5.45)#2,186 |
| 11. | 00717 | 10.5% | 5.7%(+4.83)#11 | 5.3%(+5.23)#2,322 |
| 12. | 00738 | 10.2% | 5.7%(+4.57)#12 | 5.3%(+4.96)#2,456 |
| 13. | 00715 | 10.0% | 5.7%(+4.27)#13 | 5.3%(+4.66)#2,672 |
| 14. | 00911 | 9.6% | 5.7%(+3.96)#14 | 5.3%(+4.36)#2,931 |
| 15. | 00983 | 9.4% | 5.7%(+3.69)#15 | 5.3%(+4.09)#3,159 |
| 16. | 00772 | 9.3% | 5.7%(+3.57)#16 | 5.3%(+3.97)#3,277 |
| 17. | 00638 | 9.1% | 5.7%(+3.40)#17 | 5.3%(+3.79)#3,444 |
| 18. | 00962 | 8.9% | 5.7%(+3.17)#18 | 5.3%(+3.57)#3,657 |
| 19. | 00704 | 8.8% | 5.7%(+3.08)#19 | 5.3%(+3.48)#3,762 |
| 20. | 00985 | 8.8% | 5.7%(+3.08)#20 | 5.3%(+3.48)#3,768 |
| 21. | 00775 | 8.5% | 5.7%(+2.85)#21 | 5.3%(+3.25)#4,035 |
| 22. | 00912 | 8.4% | 5.7%(+2.73)#22 | 5.3%(+3.12)#4,159 |
| 23. | 00678 | 8.4% | 5.7%(+2.72)#23 | 5.3%(+3.12)#4,171 |
| 24. | 00677 | 8.3% | 5.7%(+2.66)#24 | 5.3%(+3.05)#4,248 |
| 25. | 00707 | 8.3% | 5.7%(+2.61)#25 | 5.3%(+3.01)#4,328 |
| 26. | 00690 | 8.0% | 5.7%(+2.29)#26 | 5.3%(+2.69)#4,765 |
| 27. | 00915 | 7.9% | 5.7%(+2.21)#27 | 5.3%(+2.61)#4,896 |
| 28. | 00682 | 7.8% | 5.7%(+2.07)#28 | 5.3%(+2.47)#5,138 |
| 29. | 00718 | 7.7% | 5.7%(+2.04)#29 | 5.3%(+2.44)#5,177 |
| 30. | 00920 | 7.7% | 5.7%(+1.98)#30 | 5.3%(+2.38)#5,268 |
| 31. | 00773 | 7.6% | 5.7%(+1.94)#31 | 5.3%(+2.34)#5,339 |
| 32. | 00923 | 7.4% | 5.7%(+1.68)#32 | 5.3%(+2.08)#5,805 |
| 33. | 00901 | 7.1% | 5.7%(+1.40)#33 | 5.3%(+1.80)#6,373 |
| 34. | 00778 | 7.1% | 5.7%(+1.38)#34 | 5.3%(+1.78)#6,414 |
| 35. | 00623 | 7.0% | 5.7%(+1.31)#35 | 5.3%(+1.70)#6,586 |
| 36. | 00780 | 6.9% | 5.7%(+1.26)#36 | 5.3%(+1.66)#6,709 |
| 37. | 00659 | 6.9% | 5.7%(+1.22)#37 | 5.3%(+1.62)#6,807 |
| 38. | 00667 | 6.9% | 5.7%(+1.22)#38 | 5.3%(+1.61)#6,823 |
| 39. | 00959 | 6.8% | 5.7%(+1.15)#39 | 5.3%(+1.55)#6,978 |
| 40. | 00616 | 6.8% | 5.7%(+1.15)#40 | 5.3%(+1.54)#6,987 |
| 41. | 00982 | 6.8% | 5.7%(+1.14)#41 | 5.3%(+1.54)#7,010 |
| 42. | 00725 | 6.8% | 5.7%(+1.09)#42 | 5.3%(+1.49)#7,118 |
| 43. | 00917 | 6.7% | 5.7%(+1.04)#43 | 5.3%(+1.44)#7,279 |
| 44. | 00617 | 6.7% | 5.7%(+1.00)#44 | 5.3%(+1.40)#7,374 |
| 45. | 00680 | 6.7% | 5.7%(+0.973)#45 | 5.3%(+1.37)#7,460 |
| 46. | 00907 | 6.6% | 5.7%(+0.892)#46 | 5.3%(+1.29)#7,664 |
| 47. | 00692 | 6.6% | 5.7%(+0.877)#47 | 5.3%(+1.27)#7,697 |
| 48. | 00924 | 6.6% | 5.7%(+0.870)#48 | 5.3%(+1.27)#7,718 |
| 49. | 00603 | 6.5% | 5.7%(+0.859)#49 | 5.3%(+1.26)#7,756 |
| 50. | 00777 | 6.5% | 5.7%(+0.816)#50 | 5.3%(+1.21)#7,879 |
| 51. | 00952 | 6.5% | 5.7%(+0.801)#51 | 5.3%(+1.20)#7,919 |
| 52. | 00745 | 6.4% | 5.7%(+0.749)#52 | 5.3%(+1.15)#8,057 |
| 53. | 00720 | 6.4% | 5.7%(+0.731)#53 | 5.3%(+1.13)#8,109 |
| 54. | 00795 | 6.4% | 5.7%(+0.696)#54 | 5.3%(+1.09)#8,195 |
| 55. | 00987 | 6.4% | 5.7%(+0.667)#55 | 5.3%(+1.06)#8,276 |
| 56. | 00602 | 6.3% | 5.7%(+0.648)#56 | 5.3%(+1.05)#8,336 |
| 57. | 00767 | 6.3% | 5.7%(+0.603)#57 | 5.3%(+1.00)#8,472 |
| 58. | 00736 | 6.2% | 5.7%(+0.512)#58 | 5.3%(+0.910)#8,743 |
| 59. | 00730 | 6.1% | 5.7%(+0.390)#59 | 5.3%(+0.787)#9,107 |
| 60. | 00979 | 6.0% | 5.7%(+0.315)#60 | 5.3%(+0.712)#9,352 |
| 61. | 00688 | 6.0% | 5.7%(+0.298)#61 | 5.3%(+0.696)#9,403 |
| 62. | 00683 | 5.9% | 5.7%(+0.221)#62 | 5.3%(+0.619)#9,663 |
| 63. | 00716 | 5.9% | 5.7%(+0.173)#63 | 5.3%(+0.571)#9,837 |
| 64. | 00949 | 5.7% | 5.7%(+0.028)#64 | 5.3%(+0.425)#10,298 |
| 65. | 00664 | 5.7% | 5.7%(+0.023)#65 | 5.3%(+0.420)#10,310 |
| 66. | 00766 | 5.6% | 5.7%(-0.057)#66 | 5.3%(+0.341)#10,616 |
| 67. | 00624 | 5.6% | 5.7%(-0.063)#67 | 5.3%(+0.334)#10,640 |
| 68. | 00637 | 5.6% | 5.7%(-0.095)#68 | 5.3%(+0.302)#10,750 |
| 69. | 00662 | 5.5% | 5.7%(-0.179)#69 | 5.3%(+0.218)#11,056 |
| 70. | 00641 | 5.5% | 5.7%(-0.188)#70 | 5.3%(+0.209)#11,081 |
| 71. | 00610 | 5.5% | 5.7%(-0.198)#71 | 5.3%(+0.199)#11,113 |
| 72. | 00791 | 5.5% | 5.7%(-0.208)#72 | 5.3%(+0.190)#11,138 |
| 73. | 00971 | 5.5% | 5.7%(-0.220)#73 | 5.3%(+0.178)#11,169 |
| 74. | 00739 | 5.5% | 5.7%(-0.223)#74 | 5.3%(+0.175)#11,180 |
| 75. | 00660 | 5.4% | 5.7%(-0.278)#75 | 5.3%(+0.119)#11,380 |
| 76. | 00953 | 5.4% | 5.7%(-0.282)#76 | 5.3%(+0.116)#11,400 |
| 77. | 00769 | 5.3% | 5.7%(-0.361)#77 | 5.3%(+0.037)#11,680 |
| 78. | 00784 | 5.3% | 5.7%(-0.416)#78 | 5.3%(-0.018)#11,874 |
| 79. | 00612 | 5.3% | 5.7%(-0.424)#79 | 5.3%(-0.027)#11,926 |
| 80. | 00729 | 5.2% | 5.7%(-0.448)#80 | 5.3%(-0.050)#12,004 |
| 81. | 00705 | 5.2% | 5.7%(-0.493)#81 | 5.3%(-0.096)#12,185 |
| 82. | 00685 | 5.2% | 5.7%(-0.527)#82 | 5.3%(-0.129)#12,334 |
| 83. | 00703 | 5.2% | 5.7%(-0.533)#83 | 5.3%(-0.135)#12,357 |
| 84. | 00731 | 5.1% | 5.7%(-0.594)#84 | 5.3%(-0.196)#12,581 |
| 85. | 00674 | 5.0% | 5.7%(-0.640)#85 | 5.3%(-0.242)#12,769 |
| 86. | 00771 | 4.9% | 5.7%(-0.773)#86 | 5.3%(-0.375)#13,302 |
| 87. | 00728 | 4.9% | 5.7%(-0.778)#87 | 5.3%(-0.381)#13,320 |
| 88. | 00927 | 4.9% | 5.7%(-0.799)#88 | 5.3%(-0.402)#13,422 |
| 89. | 00601 | 4.9% | 5.7%(-0.811)#89 | 5.3%(-0.414)#13,472 |
| 90. | 00751 | 4.8% | 5.7%(-0.844)#90 | 5.3%(-0.446)#13,607 |
| 91. | 00782 | 4.8% | 5.7%(-0.873)#91 | 5.3%(-0.476)#13,719 |
| 92. | 00627 | 4.8% | 5.7%(-0.909)#92 | 5.3%(-0.511)#13,845 |
| 93. | 00647 | 4.7% | 5.7%(-1.01)#93 | 5.3%(-0.608)#14,248 |
| 94. | 00656 | 4.5% | 5.7%(-1.15)#94 | 5.3%(-0.748)#14,869 |
| 95. | 00956 | 4.5% | 5.7%(-1.17)#95 | 5.3%(-0.772)#14,968 |
| 96. | 00622 | 4.5% | 5.7%(-1.17)#96 | 5.3%(-0.776)#14,987 |
| 97. | 00687 | 4.5% | 5.7%(-1.18)#97 | 5.3%(-0.778)#14,998 |
| 98. | 00976 | 4.4% | 5.7%(-1.25)#98 | 5.3%(-0.851)#15,268 |
| 99. | 00783 | 4.4% | 5.7%(-1.26)#99 | 5.3%(-0.862)#15,317 |
| 100. | 00727 | 4.4% | 5.7%(-1.28)#100 | 5.3%(-0.878)#15,386 |
1
2Common Questions
What are the Top 10 Zip Codes with the Highest Percentage of Population Employed in Food Preparation & Serving in Puerto Rico?
Top 10 Zip Codes with the Highest Percentage of Population Employed in Food Preparation & Serving in Puerto Rico are:
What zip code has the Highest Percentage of Population Employed in Food Preparation & Serving in Puerto Rico?
00960 has the Highest Percentage of Population Employed in Food Preparation & Serving in Puerto Rico with 100.0%.
What is the Percentage of Population Employed in Food Preparation & Serving in the State of Puerto Rico?
Percentage of Population Employed in Food Preparation & Serving in Puerto Rico is 5.7%.
What is the Percentage of Population Employed in Food Preparation & Serving in the United States?
Percentage of Population Employed in Food Preparation & Serving in the United States is 5.3%.