Zip Codes with the Highest Percentage of Population Employed in Food Preparation & Serving in Kansas
RELATED REPORTS & OPTIONS
Food Preparation & Serving
Kansas
Compare Zip Codes
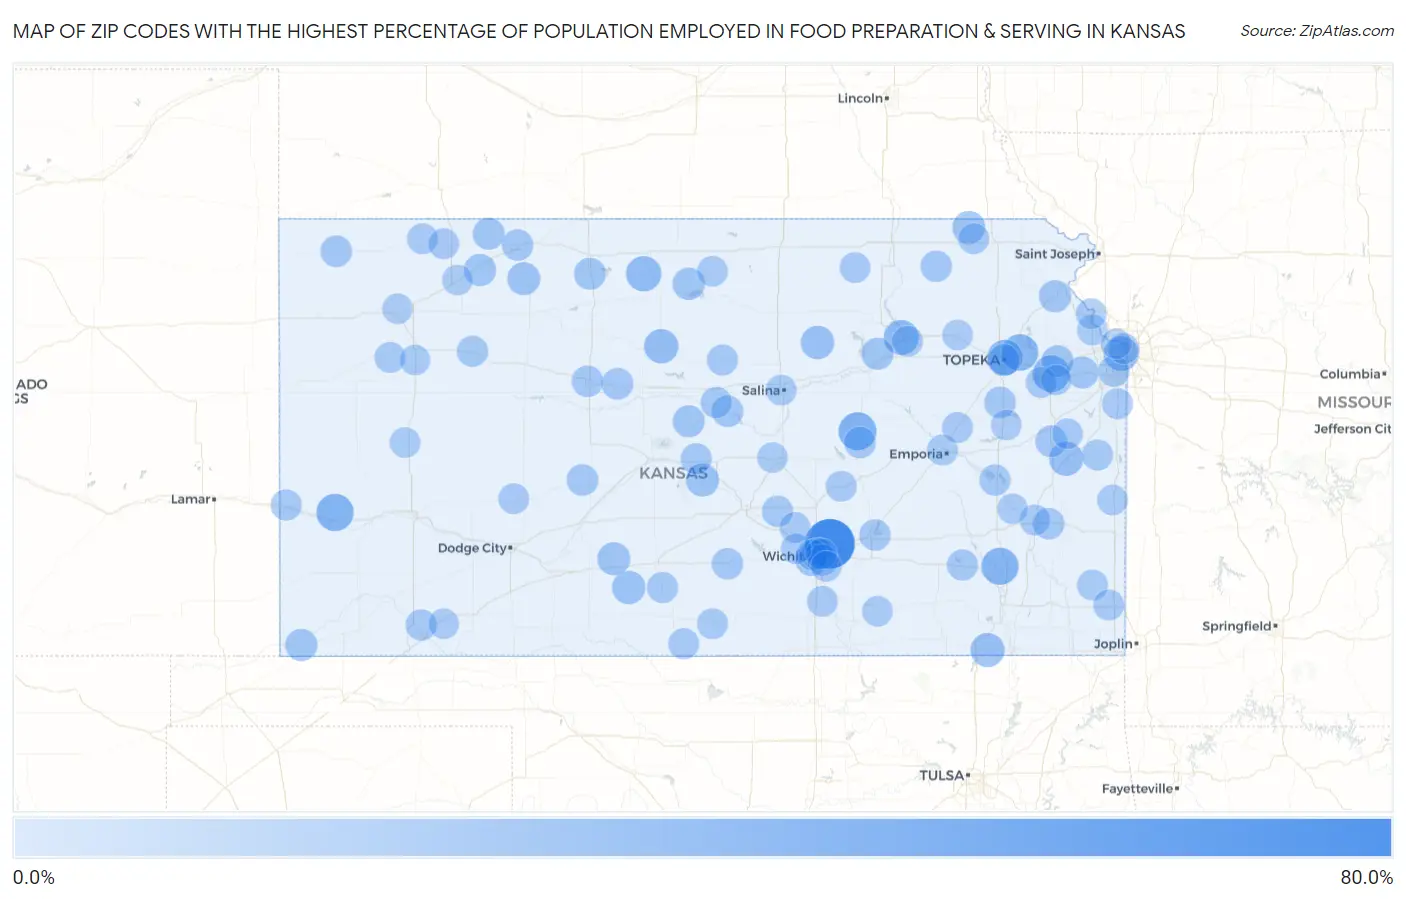
Map of Zip Codes with the Highest Percentage of Population Employed in Food Preparation & Serving in Kansas
0.0%
80.0%
Zip Codes with the Highest Percentage of Population Employed in Food Preparation & Serving in Kansas
| Zip Code | % Employed | vs State | vs National | |
| 1. | 67055 | 68.3% | 5.2%(+63.1)#1 | 5.3%(+63.0)#25 |
| 2. | 66859 | 30.8% | 5.2%(+25.6)#2 | 5.3%(+25.5)#199 |
| 3. | 67857 | 28.6% | 5.2%(+23.4)#3 | 5.3%(+23.3)#238 |
| 4. | 66714 | 28.1% | 5.2%(+22.9)#4 | 5.3%(+22.8)#246 |
| 5. | 66045 | 27.0% | 5.2%(+21.8)#5 | 5.3%(+21.7)#265 |
| 6. | 66429 | 26.1% | 5.2%(+20.9)#6 | 5.3%(+20.8)#287 |
| 7. | 66603 | 22.9% | 5.2%(+17.7)#7 | 5.3%(+17.6)#386 |
| 8. | 67638 | 22.2% | 5.2%(+17.0)#8 | 5.3%(+16.9)#411 |
| 9. | 66506 | 21.4% | 5.2%(+16.2)#9 | 5.3%(+16.1)#442 |
| 10. | 66105 | 20.6% | 5.2%(+15.4)#10 | 5.3%(+15.3)#476 |
| 11. | 67649 | 19.1% | 5.2%(+14.0)#11 | 5.3%(+13.9)#556 |
| 12. | 66033 | 18.7% | 5.2%(+13.5)#12 | 5.3%(+13.4)#594 |
| 13. | 67364 | 18.4% | 5.2%(+13.2)#13 | 5.3%(+13.1)#617 |
| 14. | 67458 | 16.3% | 5.2%(+11.1)#14 | 5.3%(+11.0)#822 |
| 15. | 67028 | 16.2% | 5.2%(+11.0)#15 | 5.3%(+11.0)#828 |
| 16. | 67512 | 15.4% | 5.2%(+10.2)#16 | 5.3%(+10.1)#931 |
| 17. | 66408 | 15.0% | 5.2%(+9.77)#17 | 5.3%(+9.67)#987 |
| 18. | 67645 | 14.9% | 5.2%(+9.74)#18 | 5.3%(+9.65)#989 |
| 19. | 67059 | 14.8% | 5.2%(+9.60)#19 | 5.3%(+9.51)#1,008 |
| 20. | 67430 | 13.3% | 5.2%(+8.09)#20 | 5.3%(+8.00)#1,324 |
| 21. | 67643 | 12.7% | 5.2%(+7.48)#21 | 5.3%(+7.39)#1,475 |
| 22. | 66016 | 12.6% | 5.2%(+7.39)#22 | 5.3%(+7.29)#1,498 |
| 23. | 67950 | 12.5% | 5.2%(+7.34)#23 | 5.3%(+7.25)#1,507 |
| 24. | 66018 | 12.1% | 5.2%(+6.87)#24 | 5.3%(+6.78)#1,640 |
| 25. | 67450 | 12.0% | 5.2%(+6.85)#25 | 5.3%(+6.76)#1,646 |
| 26. | 66442 | 12.0% | 5.2%(+6.83)#26 | 5.3%(+6.74)#1,654 |
| 27. | 66612 | 11.8% | 5.2%(+6.62)#27 | 5.3%(+6.53)#1,731 |
| 28. | 67653 | 11.8% | 5.2%(+6.57)#28 | 5.3%(+6.48)#1,750 |
| 29. | 67639 | 11.6% | 5.2%(+6.45)#29 | 5.3%(+6.36)#1,798 |
| 30. | 66044 | 11.6% | 5.2%(+6.42)#30 | 5.3%(+6.33)#1,814 |
| 31. | 67213 | 11.5% | 5.2%(+6.29)#31 | 5.3%(+6.20)#1,846 |
| 32. | 66078 | 11.2% | 5.2%(+6.05)#32 | 5.3%(+5.96)#1,938 |
| 33. | 67640 | 11.2% | 5.2%(+5.97)#33 | 5.3%(+5.88)#1,976 |
| 34. | 67454 | 11.1% | 5.2%(+5.92)#34 | 5.3%(+5.83)#1,996 |
| 35. | 66537 | 11.0% | 5.2%(+5.83)#35 | 5.3%(+5.74)#2,048 |
| 36. | 67731 | 11.0% | 5.2%(+5.81)#36 | 5.3%(+5.71)#2,057 |
| 37. | 67214 | 10.9% | 5.2%(+5.69)#37 | 5.3%(+5.60)#2,109 |
| 38. | 67574 | 10.8% | 5.2%(+5.56)#38 | 5.3%(+5.47)#2,178 |
| 39. | 66858 | 10.6% | 5.2%(+5.45)#39 | 5.3%(+5.36)#2,233 |
| 40. | 67068 | 10.4% | 5.2%(+5.18)#40 | 5.3%(+5.09)#2,388 |
| 41. | 66544 | 10.3% | 5.2%(+5.13)#41 | 5.3%(+5.04)#2,412 |
| 42. | 67654 | 10.3% | 5.2%(+5.12)#42 | 5.3%(+5.03)#2,414 |
| 43. | 66751 | 10.2% | 5.2%(+4.99)#43 | 5.3%(+4.89)#2,496 |
| 44. | 67601 | 10.2% | 5.2%(+4.96)#44 | 5.3%(+4.87)#2,519 |
| 45. | 67042 | 9.9% | 5.2%(+4.71)#45 | 5.3%(+4.62)#2,699 |
| 46. | 67439 | 9.8% | 5.2%(+4.57)#46 | 5.3%(+4.48)#2,827 |
| 47. | 66839 | 9.6% | 5.2%(+4.45)#47 | 5.3%(+4.36)#2,932 |
| 48. | 67751 | 9.6% | 5.2%(+4.42)#48 | 5.3%(+4.33)#2,956 |
| 49. | 66214 | 9.6% | 5.2%(+4.41)#49 | 5.3%(+4.31)#2,970 |
| 50. | 67047 | 9.5% | 5.2%(+4.35)#50 | 5.3%(+4.26)#3,019 |
| 51. | 67020 | 9.5% | 5.2%(+4.26)#51 | 5.3%(+4.17)#3,094 |
| 52. | 67859 | 9.3% | 5.2%(+4.08)#52 | 5.3%(+3.99)#3,255 |
| 53. | 67455 | 9.2% | 5.2%(+3.99)#53 | 5.3%(+3.89)#3,344 |
| 54. | 66026 | 9.2% | 5.2%(+3.98)#54 | 5.3%(+3.89)#3,346 |
| 55. | 67524 | 9.2% | 5.2%(+3.98)#55 | 5.3%(+3.89)#3,347 |
| 56. | 67203 | 9.2% | 5.2%(+3.97)#56 | 5.3%(+3.88)#3,362 |
| 57. | 67134 | 9.2% | 5.2%(+3.96)#57 | 5.3%(+3.87)#3,366 |
| 58. | 67218 | 9.0% | 5.2%(+3.83)#58 | 5.3%(+3.74)#3,505 |
| 59. | 67836 | 8.9% | 5.2%(+3.73)#59 | 5.3%(+3.64)#3,593 |
| 60. | 66502 | 8.9% | 5.2%(+3.72)#60 | 5.3%(+3.63)#3,604 |
| 61. | 66801 | 8.9% | 5.2%(+3.67)#61 | 5.3%(+3.58)#3,652 |
| 62. | 67747 | 8.7% | 5.2%(+3.56)#62 | 5.3%(+3.46)#3,787 |
| 63. | 67070 | 8.7% | 5.2%(+3.51)#63 | 5.3%(+3.42)#3,841 |
| 64. | 67016 | 8.7% | 5.2%(+3.48)#64 | 5.3%(+3.39)#3,890 |
| 65. | 67739 | 8.7% | 5.2%(+3.46)#65 | 5.3%(+3.37)#3,910 |
| 66. | 66743 | 8.6% | 5.2%(+3.43)#66 | 5.3%(+3.34)#3,930 |
| 67. | 66013 | 8.6% | 5.2%(+3.42)#67 | 5.3%(+3.33)#3,948 |
| 68. | 66830 | 8.6% | 5.2%(+3.36)#68 | 5.3%(+3.27)#4,024 |
| 69. | 66866 | 8.5% | 5.2%(+3.33)#69 | 5.3%(+3.24)#4,043 |
| 70. | 67009 | 8.5% | 5.2%(+3.28)#70 | 5.3%(+3.18)#4,103 |
| 71. | 67208 | 8.4% | 5.2%(+3.24)#71 | 5.3%(+3.15)#4,128 |
| 72. | 67749 | 8.4% | 5.2%(+3.21)#72 | 5.3%(+3.12)#4,170 |
| 73. | 66762 | 8.4% | 5.2%(+3.17)#73 | 5.3%(+3.08)#4,219 |
| 74. | 67210 | 8.4% | 5.2%(+3.17)#74 | 5.3%(+3.08)#4,222 |
| 75. | 66047 | 8.3% | 5.2%(+3.11)#75 | 5.3%(+3.02)#4,320 |
| 76. | 66043 | 8.3% | 5.2%(+3.08)#76 | 5.3%(+2.99)#4,346 |
| 77. | 66949 | 8.2% | 5.2%(+3.01)#77 | 5.3%(+2.92)#4,437 |
| 78. | 66101 | 8.1% | 5.2%(+2.93)#78 | 5.3%(+2.83)#4,550 |
| 79. | 66027 | 8.1% | 5.2%(+2.91)#79 | 5.3%(+2.82)#4,570 |
| 80. | 66749 | 8.1% | 5.2%(+2.88)#80 | 5.3%(+2.79)#4,621 |
| 81. | 66522 | 8.1% | 5.2%(+2.87)#81 | 5.3%(+2.78)#4,638 |
| 82. | 67223 | 8.0% | 5.2%(+2.83)#82 | 5.3%(+2.74)#4,698 |
| 83. | 67854 | 8.0% | 5.2%(+2.78)#83 | 5.3%(+2.69)#4,758 |
| 84. | 66767 | 8.0% | 5.2%(+2.77)#84 | 5.3%(+2.68)#4,779 |
| 85. | 67013 | 7.9% | 5.2%(+2.74)#85 | 5.3%(+2.65)#4,832 |
| 86. | 66943 | 7.9% | 5.2%(+2.74)#86 | 5.3%(+2.65)#4,835 |
| 87. | 67019 | 7.9% | 5.2%(+2.66)#87 | 5.3%(+2.57)#4,962 |
| 88. | 66079 | 7.8% | 5.2%(+2.62)#88 | 5.3%(+2.53)#5,023 |
| 89. | 67401 | 7.7% | 5.2%(+2.52)#89 | 5.3%(+2.43)#5,192 |
| 90. | 67871 | 7.7% | 5.2%(+2.46)#90 | 5.3%(+2.37)#5,285 |
| 91. | 67869 | 7.6% | 5.2%(+2.37)#91 | 5.3%(+2.27)#5,448 |
| 92. | 66451 | 7.5% | 5.2%(+2.35)#92 | 5.3%(+2.26)#5,481 |
| 93. | 66536 | 7.5% | 5.2%(+2.30)#93 | 5.3%(+2.21)#5,570 |
| 94. | 67635 | 7.4% | 5.2%(+2.25)#94 | 5.3%(+2.16)#5,656 |
| 95. | 67460 | 7.3% | 5.2%(+2.10)#95 | 5.3%(+2.00)#5,943 |
| 96. | 67701 | 7.2% | 5.2%(+2.04)#96 | 5.3%(+1.95)#6,058 |
| 97. | 66758 | 7.2% | 5.2%(+2.04)#97 | 5.3%(+1.94)#6,068 |
| 98. | 66104 | 7.2% | 5.2%(+2.02)#98 | 5.3%(+1.93)#6,096 |
| 99. | 66046 | 7.2% | 5.2%(+2.01)#99 | 5.3%(+1.92)#6,126 |
| 100. | 67748 | 7.1% | 5.2%(+1.89)#100 | 5.3%(+1.80)#6,369 |
Common Questions
What are the Top 10 Zip Codes with the Highest Percentage of Population Employed in Food Preparation & Serving in Kansas?
Top 10 Zip Codes with the Highest Percentage of Population Employed in Food Preparation & Serving in Kansas are:
What zip code has the Highest Percentage of Population Employed in Food Preparation & Serving in Kansas?
67055 has the Highest Percentage of Population Employed in Food Preparation & Serving in Kansas with 68.3%.
What is the Percentage of Population Employed in Food Preparation & Serving in the State of Kansas?
Percentage of Population Employed in Food Preparation & Serving in Kansas is 5.2%.
What is the Percentage of Population Employed in Food Preparation & Serving in the United States?
Percentage of Population Employed in Food Preparation & Serving in the United States is 5.3%.