Zip Codes with the Highest Percentage of Population Employed in Transportation & Warehousing in the United States
RELATED REPORTS & OPTIONS
Transportation & Warehousing
United States
Compare Zip Codes
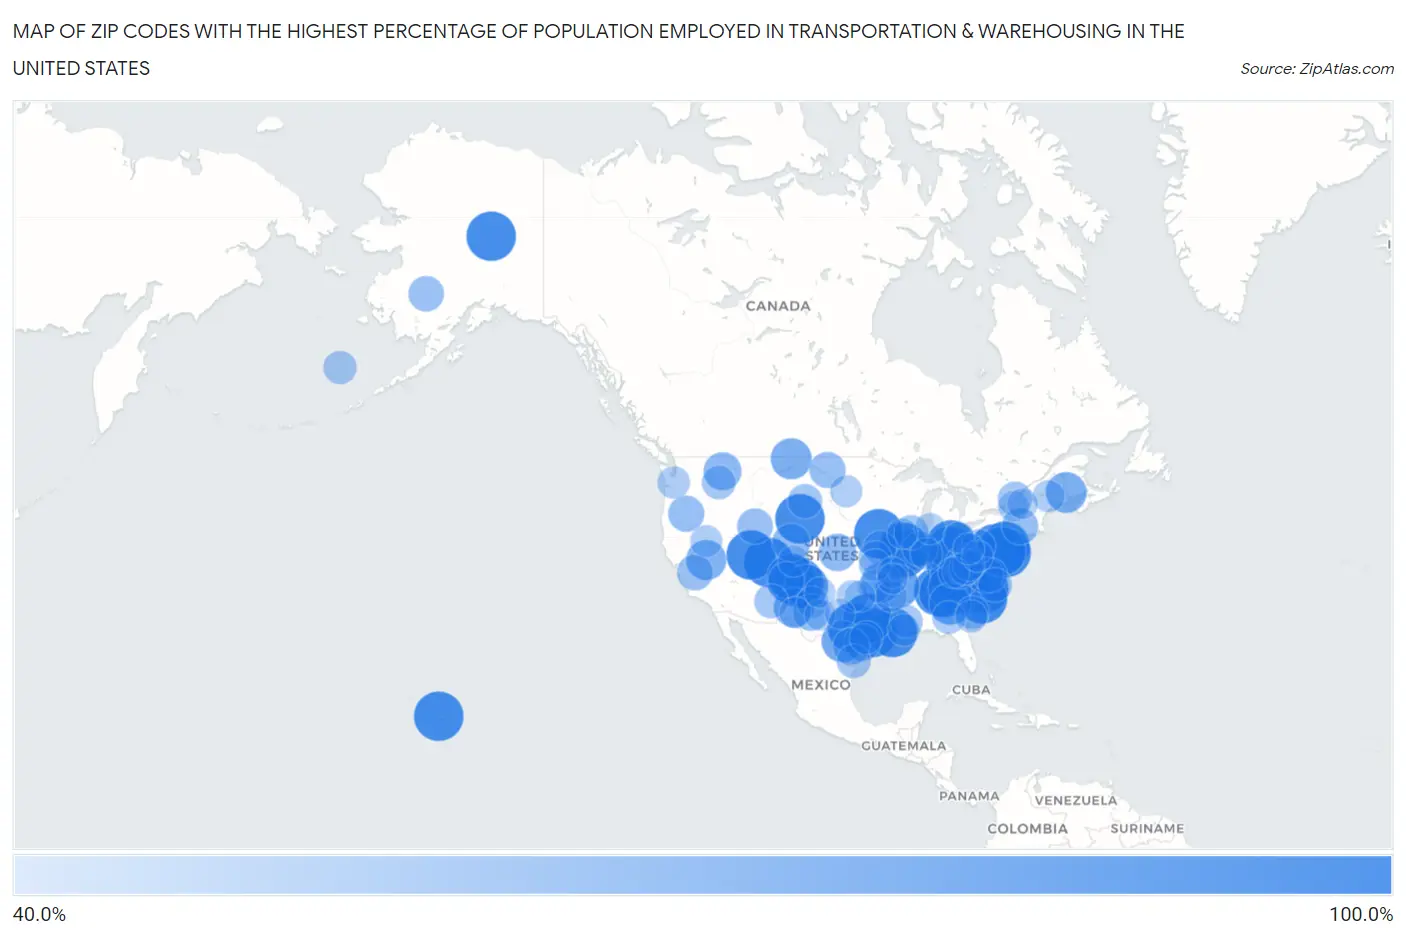
Map of Zip Codes with the Highest Percentage of Population Employed in Transportation & Warehousing in the United States
40.0%
100.0%
Zip Codes with the Highest Percentage of Population Employed in Transportation & Warehousing in the United States
| Zip Code | % Employed | vs State | vs National | |
| 1. | 84530 | 100.0% | 4.7%(+95.3)#1 | 4.9%(+95.1)#1 |
| 2. | 37396 | 100.0% | 6.1%(+93.9)#1 | 4.9%(+95.1)#2 |
| 3. | 28368 | 100.0% | 4.3%(+95.7)#1 | 4.9%(+95.1)#3 |
| 4. | 62622 | 100.0% | 6.2%(+93.8)#1 | 4.9%(+95.1)#4 |
| 5. | 17250 | 100.0% | 5.0%(+95.0)#1 | 4.9%(+95.1)#5 |
| 6. | 87736 | 100.0% | 3.6%(+96.4)#1 | 4.9%(+95.1)#6 |
| 7. | 29589 | 100.0% | 4.3%(+95.7)#1 | 4.9%(+95.1)#7 |
| 8. | 45166 | 100.0% | 4.9%(+95.1)#1 | 4.9%(+95.1)#8 |
| 9. | 40334 | 100.0% | 5.7%(+94.3)#1 | 4.9%(+95.1)#9 |
| 10. | 30724 | 100.0% | 6.3%(+93.7)#1 | 4.9%(+95.1)#10 |
| 11. | 77561 | 100.0% | 5.5%(+94.5)#1 | 4.9%(+95.1)#11 |
| 12. | 70519 | 100.0% | 4.6%(+95.4)#1 | 4.9%(+95.1)#12 |
| 13. | 17534 | 100.0% | 5.0%(+95.0)#2 | 4.9%(+95.1)#13 |
| 14. | 62098 | 100.0% | 6.2%(+93.8)#2 | 4.9%(+95.1)#16 |
| 15. | 96726 | 100.0% | 5.4%(+94.6)#1 | 4.9%(+95.1)#17 |
| 16. | 84621 | 100.0% | 4.7%(+95.3)#2 | 4.9%(+95.1)#18 |
| 17. | 87581 | 100.0% | 3.6%(+96.4)#2 | 4.9%(+95.1)#19 |
| 18. | 21930 | 100.0% | 4.4%(+95.6)#1 | 4.9%(+95.1)#20 |
| 19. | 76573 | 100.0% | 5.5%(+94.5)#2 | 4.9%(+95.1)#21 |
| 20. | 21031 | 100.0% | 4.4%(+95.6)#2 | 4.9%(+95.1)#22 |
| 21. | 75779 | 100.0% | 5.5%(+94.5)#3 | 4.9%(+95.1)#23 |
| 22. | 40849 | 100.0% | 5.7%(+94.3)#2 | 4.9%(+95.1)#24 |
| 23. | 99790 | 100.0% | 7.7%(+92.3)#1 | 4.9%(+95.1)#25 |
| 24. | 50033 | 100.0% | 4.3%(+95.7)#1 | 4.9%(+95.1)#26 |
| 25. | 43047 | 100.0% | 4.9%(+95.1)#2 | 4.9%(+95.1)#27 |
| 26. | 82224 | 100.0% | 4.4%(+95.6)#1 | 4.9%(+95.1)#28 |
| 27. | 87746 | 83.9% | 3.6%(+80.3)#3 | 4.9%(+78.9)#29 |
| 28. | 72075 | 83.3% | 5.0%(+78.3)#1 | 4.9%(+78.4)#30 |
| 29. | 28733 | 82.6% | 4.3%(+78.3)#2 | 4.9%(+77.7)#31 |
| 30. | 78057 | 78.0% | 5.5%(+72.5)#4 | 4.9%(+73.1)#32 |
| 31. | 30070 | 77.8% | 6.3%(+71.5)#2 | 4.9%(+72.8)#33 |
| 32. | 25205 | 76.0% | 4.5%(+71.5)#1 | 4.9%(+71.0)#34 |
| 33. | 59240 | 75.0% | 4.3%(+70.7)#1 | 4.9%(+70.1)#35 |
| 34. | 04491 | 74.6% | 3.4%(+71.2)#1 | 4.9%(+69.7)#36 |
| 35. | 72742 | 74.0% | 5.0%(+68.9)#2 | 4.9%(+69.0)#37 |
| 36. | 89420 | 73.0% | 6.1%(+66.8)#1 | 4.9%(+68.0)#38 |
| 37. | 88314 | 72.0% | 3.6%(+68.5)#4 | 4.9%(+67.1)#39 |
| 38. | 83874 | 66.7% | 4.0%(+62.7)#1 | 4.9%(+61.7)#40 |
| 39. | 80473 | 66.7% | 4.2%(+62.5)#1 | 4.9%(+61.7)#41 |
| 40. | 67625 | 65.6% | 4.3%(+61.2)#1 | 4.9%(+60.6)#42 |
| 41. | 77440 | 63.5% | 5.5%(+58.0)#5 | 4.9%(+58.5)#43 |
| 42. | 78104 | 63.4% | 5.5%(+57.9)#6 | 4.9%(+58.5)#44 |
| 43. | 88265 | 62.9% | 3.6%(+59.3)#5 | 4.9%(+58.0)#45 |
| 44. | 12436 | 62.5% | 5.1%(+57.4)#1 | 4.9%(+57.6)#46 |
| 45. | 24539 | 62.4% | 4.0%(+58.4)#1 | 4.9%(+57.4)#47 |
| 46. | 25022 | 62.2% | 4.5%(+57.7)#2 | 4.9%(+57.2)#48 |
| 47. | 97735 | 61.7% | 3.8%(+57.9)#1 | 4.9%(+56.7)#49 |
| 48. | 87046 | 61.5% | 3.6%(+58.0)#6 | 4.9%(+56.6)#50 |
| 49. | 58716 | 61.5% | 4.1%(+57.4)#1 | 4.9%(+56.5)#51 |
| 50. | 93645 | 60.6% | 5.1%(+55.5)#1 | 4.9%(+55.7)#52 |
| 51. | 83233 | 60.6% | 4.0%(+56.6)#2 | 4.9%(+55.6)#53 |
| 52. | 99656 | 60.0% | 7.7%(+52.3)#2 | 4.9%(+55.1)#54 |
| 53. | 41534 | 59.3% | 5.7%(+53.5)#3 | 4.9%(+54.3)#55 |
| 54. | 61941 | 59.0% | 6.2%(+52.8)#3 | 4.9%(+54.0)#56 |
| 55. | 23952 | 57.6% | 4.0%(+53.6)#2 | 4.9%(+52.6)#57 |
| 56. | 61374 | 57.1% | 6.2%(+50.9)#4 | 4.9%(+52.2)#58 |
| 57. | 82710 | 56.8% | 4.4%(+52.4)#2 | 4.9%(+51.8)#59 |
| 58. | 13649 | 56.2% | 5.1%(+51.2)#2 | 4.9%(+51.3)#60 |
| 59. | 24849 | 55.7% | 4.5%(+51.2)#3 | 4.9%(+50.7)#61 |
| 60. | 87824 | 55.6% | 3.6%(+52.0)#7 | 4.9%(+50.6)#62 |
| 61. | 78598 | 55.6% | 5.5%(+50.1)#7 | 4.9%(+50.6)#63 |
| 62. | 27827 | 55.5% | 4.3%(+51.1)#3 | 4.9%(+50.5)#64 |
| 63. | 83520 | 54.8% | 4.0%(+50.9)#3 | 4.9%(+49.9)#65 |
| 64. | 15488 | 54.5% | 5.0%(+49.6)#3 | 4.9%(+49.6)#66 |
| 65. | 99591 | 53.6% | 7.7%(+45.9)#3 | 4.9%(+48.6)#67 |
| 66. | 77481 | 53.3% | 5.5%(+47.8)#8 | 4.9%(+48.4)#68 |
| 67. | 64654 | 53.3% | 5.0%(+48.4)#1 | 4.9%(+48.4)#69 |
| 68. | 64149 | 52.8% | 5.0%(+47.9)#2 | 4.9%(+47.9)#70 |
| 69. | 39656 | 52.8% | 5.8%(+47.0)#1 | 4.9%(+47.9)#71 |
| 70. | 29904 | 52.6% | 4.3%(+48.4)#2 | 4.9%(+47.7)#72 |
| 71. | 31743 | 52.4% | 6.3%(+46.1)#3 | 4.9%(+47.4)#73 |
| 72. | 72955 | 51.9% | 5.0%(+46.9)#3 | 4.9%(+47.0)#74 |
| 73. | 98582 | 51.0% | 4.9%(+46.1)#1 | 4.9%(+46.0)#75 |
| 74. | 29915 | 50.9% | 4.3%(+46.6)#3 | 4.9%(+45.9)#76 |
| 75. | 70455 | 50.0% | 4.6%(+45.4)#2 | 4.9%(+45.1)#77 |
| 76. | 25119 | 50.0% | 4.5%(+45.5)#4 | 4.9%(+45.1)#78 |
| 77. | 89418 | 50.0% | 6.1%(+43.9)#2 | 4.9%(+45.1)#79 |
| 78. | 88125 | 50.0% | 3.6%(+46.4)#8 | 4.9%(+45.1)#80 |
| 79. | 57426 | 50.0% | 3.5%(+46.5)#1 | 4.9%(+45.1)#81 |
| 80. | 47845 | 50.0% | 5.1%(+44.9)#1 | 4.9%(+45.1)#82 |
| 81. | 73488 | 50.0% | 4.5%(+45.5)#1 | 4.9%(+45.1)#83 |
| 82. | 04925 | 50.0% | 3.4%(+46.6)#2 | 4.9%(+45.1)#84 |
| 83. | 64765 | 50.0% | 5.0%(+45.0)#3 | 4.9%(+45.1)#85 |
| 84. | 72079 | 48.7% | 5.0%(+43.6)#4 | 4.9%(+43.7)#86 |
| 85. | 88350 | 48.1% | 3.6%(+44.6)#9 | 4.9%(+43.2)#87 |
| 86. | 49115 | 48.1% | 3.9%(+44.2)#1 | 4.9%(+43.1)#88 |
| 87. | 81222 | 47.9% | 4.2%(+43.7)#2 | 4.9%(+42.9)#89 |
| 88. | 74535 | 47.8% | 4.5%(+43.4)#2 | 4.9%(+42.9)#90 |
| 89. | 44850 | 47.8% | 4.9%(+42.8)#3 | 4.9%(+42.8)#91 |
| 90. | 41764 | 47.7% | 5.7%(+42.0)#4 | 4.9%(+42.8)#92 |
| 91. | 26285 | 47.7% | 4.5%(+43.3)#5 | 4.9%(+42.8)#93 |
| 92. | 79783 | 47.7% | 5.5%(+42.2)#9 | 4.9%(+42.7)#94 |
| 93. | 43786 | 47.6% | 4.9%(+42.7)#4 | 4.9%(+42.7)#95 |
| 94. | 12927 | 47.4% | 5.1%(+42.3)#3 | 4.9%(+42.4)#96 |
| 95. | 65464 | 47.1% | 5.0%(+42.1)#4 | 4.9%(+42.1)#97 |
| 96. | 79091 | 46.9% | 5.5%(+41.4)#10 | 4.9%(+41.9)#98 |
| 97. | 72578 | 46.5% | 5.0%(+41.4)#5 | 4.9%(+41.5)#99 |
| 98. | 12924 | 46.3% | 5.1%(+41.2)#4 | 4.9%(+41.4)#100 |
| 99. | 61276 | 46.2% | 6.2%(+39.9)#5 | 4.9%(+41.2)#101 |
| 100. | 76469 | 45.5% | 5.5%(+40.0)#11 | 4.9%(+40.5)#102 |
Common Questions
What are the Top 10 Zip Codes with the Highest Percentage of Population Employed in Transportation & Warehousing in the United States?
Top 10 Zip Codes with the Highest Percentage of Population Employed in Transportation & Warehousing in the United States are:
#1
100.0%
#2
100.0%
#3
100.0%
#4
100.0%
#5
100.0%
#6
100.0%
#7
100.0%
#8
100.0%
#9
100.0%
#10
100.0%
What zip code has the Highest Percentage of Population Employed in Transportation & Warehousing in the United States?
84530 has the Highest Percentage of Population Employed in Transportation & Warehousing in the United States with 100.0%.
What is the Percentage of Population Employed in Transportation & Warehousing in the United States?
Percentage of Population Employed in Transportation & Warehousing in the United States is 4.9%.