Zip Codes with the Highest Percentage of Families with Income Above $200,000 in the United States
RELATED REPORTS & OPTIONS
Family Income | $200k+
United States
Compare Zip Codes
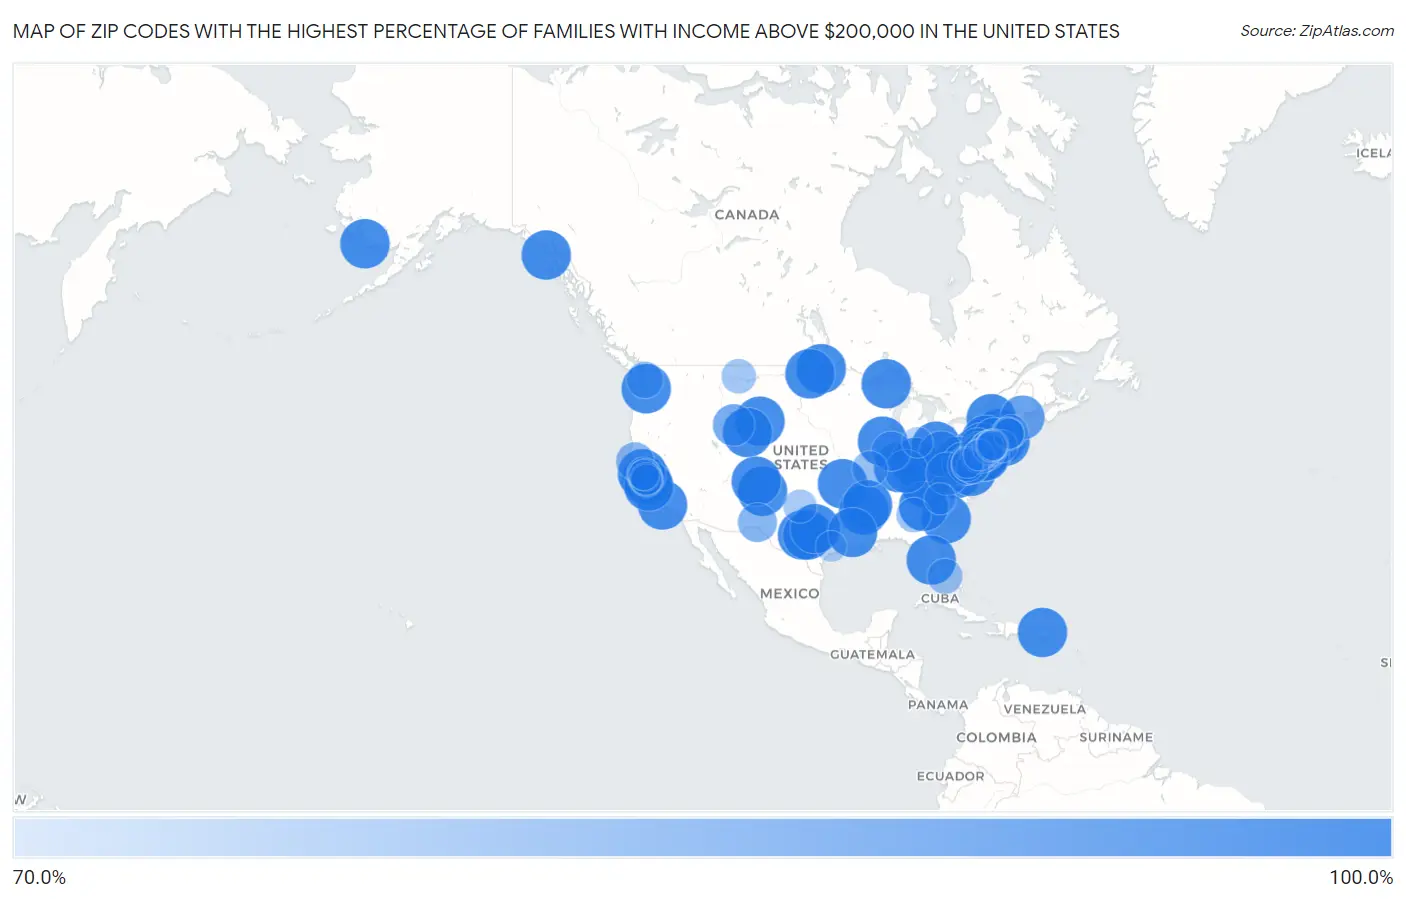
Map of Zip Codes with the Highest Percentage of Families with Income Above $200,000 in the United States
70.0%
100.0%
Zip Codes with the Highest Percentage of Families with Income Above $200,000 in the United States
| Zip Code | Families with Income > $200k | vs State | vs National | |
| 1. | 06269 | 100.0% | 22.8%(+77.2)#1 | 14.8%(+85.2)#1 |
| 2. | 22904 | 100.0% | 20.4%(+79.6)#1 | 14.8%(+85.2)#2 |
| 3. | 93106 | 100.0% | 21.1%(+78.9)#1 | 14.8%(+85.2)#3 |
| 4. | 01063 | 100.0% | 25.6%(+74.4)#1 | 14.8%(+85.2)#4 |
| 5. | 29424 | 100.0% | 9.8%(+90.2)#1 | 14.8%(+85.2)#5 |
| 6. | 06414 | 100.0% | 22.8%(+77.2)#2 | 14.8%(+85.2)#6 |
| 7. | 64858 | 100.0% | 10.1%(+89.9)#1 | 14.8%(+85.2)#7 |
| 8. | 19490 | 100.0% | 14.0%(+86.0)#1 | 14.8%(+85.2)#8 |
| 9. | 44630 | 100.0% | 10.8%(+89.2)#1 | 14.8%(+85.2)#9 |
| 10. | 76841 | 100.0% | 13.5%(+86.5)#1 | 14.8%(+85.2)#10 |
| 11. | 41821 | 100.0% | 8.2%(+91.8)#1 | 14.8%(+85.2)#12 |
| 12. | 87523 | 100.0% | 8.2%(+91.8)#1 | 14.8%(+85.2)#13 |
| 13. | 02875 | 100.0% | 15.7%(+84.3)#1 | 14.8%(+85.2)#14 |
| 14. | 19375 | 100.0% | 14.0%(+86.0)#2 | 14.8%(+85.2)#15 |
| 15. | 08528 | 100.0% | 24.7%(+75.3)#1 | 14.8%(+85.2)#16 |
| 16. | 10279 | 100.0% | 19.2%(+80.8)#1 | 14.8%(+85.2)#17 |
| 17. | 20667 | 100.0% | 23.6%(+76.4)#1 | 14.8%(+85.2)#18 |
| 18. | 18921 | 100.0% | 14.0%(+86.0)#3 | 14.8%(+85.2)#19 |
| 19. | 18933 | 100.0% | 14.0%(+86.0)#4 | 14.8%(+85.2)#20 |
| 20. | 94021 | 100.0% | 21.1%(+78.9)#2 | 14.8%(+85.2)#21 |
| 21. | 82640 | 100.0% | 9.5%(+90.5)#1 | 14.8%(+85.2)#22 |
| 22. | 12872 | 100.0% | 19.2%(+80.8)#2 | 14.8%(+85.2)#23 |
| 23. | 00694 | 100.0% | 1.8%(+98.2)#1 | 14.8%(+85.2)#24 |
| 24. | 47437 | 100.0% | 9.3%(+90.7)#1 | 14.8%(+85.2)#25 |
| 25. | 61371 | 100.0% | 16.3%(+83.7)#1 | 14.8%(+85.2)#26 |
| 26. | 08890 | 100.0% | 24.7%(+75.3)#2 | 14.8%(+85.2)#27 |
| 27. | 45147 | 100.0% | 10.8%(+89.2)#2 | 14.8%(+85.2)#28 |
| 28. | 49942 | 100.0% | 11.3%(+88.7)#1 | 14.8%(+85.2)#29 |
| 29. | 76848 | 100.0% | 13.5%(+86.5)#2 | 14.8%(+85.2)#30 |
| 30. | 19535 | 100.0% | 14.0%(+86.0)#5 | 14.8%(+85.2)#31 |
| 31. | 08064 | 100.0% | 24.7%(+75.3)#3 | 14.8%(+85.2)#32 |
| 32. | 71662 | 100.0% | 7.7%(+92.3)#1 | 14.8%(+85.2)#33 |
| 33. | 72383 | 100.0% | 7.7%(+92.3)#2 | 14.8%(+85.2)#34 |
| 34. | 08011 | 100.0% | 24.7%(+75.3)#4 | 14.8%(+85.2)#35 |
| 35. | 10985 | 100.0% | 19.2%(+80.8)#3 | 14.8%(+85.2)#36 |
| 36. | 58236 | 100.0% | 12.2%(+87.8)#1 | 14.8%(+85.2)#37 |
| 37. | 76565 | 100.0% | 13.5%(+86.5)#3 | 14.8%(+85.2)#38 |
| 38. | 30639 | 100.0% | 13.0%(+87.0)#1 | 14.8%(+85.2)#39 |
| 39. | 82310 | 100.0% | 9.5%(+90.5)#2 | 14.8%(+85.2)#40 |
| 40. | 07870 | 100.0% | 24.7%(+75.3)#5 | 14.8%(+85.2)#41 |
| 41. | 98330 | 100.0% | 19.4%(+80.6)#1 | 14.8%(+85.2)#42 |
| 42. | 99651 | 100.0% | 15.8%(+84.2)#1 | 14.8%(+85.2)#43 |
| 43. | 94950 | 100.0% | 21.1%(+78.9)#3 | 14.8%(+85.2)#44 |
| 44. | 25421 | 100.0% | 6.6%(+93.4)#1 | 14.8%(+85.2)#45 |
| 45. | 58362 | 100.0% | 12.2%(+87.8)#2 | 14.8%(+85.2)#46 |
| 46. | 33530 | 100.0% | 11.5%(+88.5)#1 | 14.8%(+85.2)#47 |
| 47. | 81128 | 100.0% | 18.4%(+81.6)#1 | 14.8%(+85.2)#48 |
| 48. | 99825 | 100.0% | 15.8%(+84.2)#2 | 14.8%(+85.2)#49 |
| 49. | 71475 | 100.0% | 9.2%(+90.8)#1 | 14.8%(+85.2)#50 |
| 50. | 93943 | 100.0% | 21.1%(+78.9)#4 | 14.8%(+85.2)#51 |
| 51. | 26058 | 93.5% | 6.6%(+86.9)#2 | 14.8%(+78.7)#52 |
| 52. | 04855 | 92.1% | 10.4%(+81.7)#1 | 14.8%(+77.3)#53 |
| 53. | 20129 | 91.0% | 20.4%(+70.6)#2 | 14.8%(+76.2)#54 |
| 54. | 40025 | 90.9% | 8.2%(+82.7)#2 | 14.8%(+76.1)#55 |
| 55. | 24412 | 90.4% | 20.4%(+70.0)#3 | 14.8%(+75.6)#56 |
| 56. | 06753 | 88.9% | 22.8%(+66.1)#3 | 14.8%(+74.1)#57 |
| 57. | 18927 | 88.6% | 14.0%(+74.6)#6 | 14.8%(+73.8)#58 |
| 58. | 82925 | 88.5% | 9.5%(+79.0)#3 | 14.8%(+73.7)#59 |
| 59. | 60932 | 85.3% | 16.3%(+69.0)#2 | 14.8%(+70.5)#60 |
| 60. | 20004 | 85.2% | 37.0%(+48.2)#1 | 14.8%(+70.4)#61 |
| 61. | 21056 | 84.6% | 23.6%(+61.0)#2 | 14.8%(+69.8)#62 |
| 62. | 18936 | 84.6% | 14.0%(+70.6)#7 | 14.8%(+69.8)#63 |
| 63. | 88052 | 84.6% | 8.2%(+76.4)#2 | 14.8%(+69.8)#64 |
| 64. | 94720 | 84.1% | 21.1%(+63.0)#5 | 14.8%(+69.3)#65 |
| 65. | 95420 | 83.1% | 21.1%(+62.0)#6 | 14.8%(+68.3)#66 |
| 66. | 10007 | 81.0% | 19.2%(+61.8)#4 | 14.8%(+66.2)#67 |
| 67. | 98164 | 80.9% | 19.4%(+61.5)#2 | 14.8%(+66.1)#68 |
| 68. | 63073 | 79.6% | 10.1%(+69.5)#2 | 14.8%(+64.8)#69 |
| 69. | 33109 | 78.8% | 11.5%(+67.3)#2 | 14.8%(+64.0)#70 |
| 70. | 30289 | 78.3% | 13.0%(+65.3)#2 | 14.8%(+63.5)#71 |
| 71. | 59535 | 77.8% | 9.6%(+68.2)#1 | 14.8%(+63.0)#72 |
| 72. | 10004 | 77.7% | 19.2%(+58.5)#5 | 14.8%(+62.9)#73 |
| 73. | 18624 | 77.2% | 14.0%(+63.2)#8 | 14.8%(+62.4)#74 |
| 74. | 07078 | 76.8% | 24.7%(+52.1)#6 | 14.8%(+62.0)#75 |
| 75. | 94020 | 76.4% | 21.1%(+55.3)#7 | 14.8%(+61.6)#76 |
| 76. | 02468 | 76.3% | 25.6%(+50.7)#2 | 14.8%(+61.5)#77 |
| 77. | 79259 | 76.2% | 13.5%(+62.7)#4 | 14.8%(+61.4)#78 |
| 78. | 01965 | 75.8% | 25.6%(+50.2)#3 | 14.8%(+61.0)#79 |
| 79. | 94957 | 75.5% | 21.1%(+54.4)#8 | 14.8%(+60.7)#80 |
| 80. | 02030 | 75.4% | 25.6%(+49.8)#4 | 14.8%(+60.6)#81 |
| 81. | 06820 | 75.3% | 22.8%(+52.5)#4 | 14.8%(+60.5)#82 |
| 82. | 19035 | 75.0% | 14.0%(+61.0)#9 | 14.8%(+60.2)#83 |
| 83. | 11975 | 75.0% | 19.2%(+55.8)#6 | 14.8%(+60.2)#84 |
| 84. | 21652 | 75.0% | 23.6%(+51.4)#3 | 14.8%(+60.2)#85 |
| 85. | 20015 | 74.9% | 37.0%(+37.9)#2 | 14.8%(+60.1)#86 |
| 86. | 94105 | 74.8% | 21.1%(+53.7)#9 | 14.8%(+60.0)#87 |
| 87. | 94027 | 74.4% | 21.1%(+53.3)#10 | 14.8%(+59.6)#88 |
| 88. | 10577 | 73.4% | 19.2%(+54.2)#7 | 14.8%(+58.6)#89 |
| 89. | 28207 | 73.3% | 11.5%(+61.8)#1 | 14.8%(+58.5)#90 |
| 90. | 94022 | 73.0% | 21.1%(+51.9)#11 | 14.8%(+58.2)#91 |
| 91. | 07423 | 73.0% | 24.7%(+48.3)#7 | 14.8%(+58.2)#92 |
| 92. | 21738 | 72.9% | 23.6%(+49.3)#4 | 14.8%(+58.1)#93 |
| 93. | 10006 | 72.9% | 19.2%(+53.7)#8 | 14.8%(+58.1)#94 |
| 94. | 77454 | 72.7% | 13.5%(+59.2)#5 | 14.8%(+57.9)#95 |
| 95. | 19085 | 72.6% | 14.0%(+58.6)#10 | 14.8%(+57.8)#96 |
| 96. | 43523 | 72.4% | 10.8%(+61.6)#3 | 14.8%(+57.6)#97 |
| 97. | 02481 | 72.1% | 25.6%(+46.5)#5 | 14.8%(+57.3)#98 |
| 98. | 06878 | 72.1% | 22.8%(+49.3)#5 | 14.8%(+57.3)#99 |
| 99. | 06853 | 72.1% | 22.8%(+49.3)#6 | 14.8%(+57.3)#100 |
| 100. | 94123 | 72.0% | 21.1%(+50.9)#12 | 14.8%(+57.2)#101 |
Common Questions
What are the Top 10 Zip Codes with the Highest Percentage of Families with Income Above $200,000 in the United States?
Top 10 Zip Codes with the Highest Percentage of Families with Income Above $200,000 in the United States are:
#1
100.0%
#2
100.0%
#3
100.0%
#4
100.0%
#5
100.0%
#6
100.0%
#7
100.0%
#8
100.0%
#9
100.0%
#10
100.0%
What zip code has the Highest Percentage of Families with Income Above $200,000 in the United States?
06269 has the Highest Percentage of Families with Income Above $200,000 in the United States with 100.0%.
What is the Percentage of Families with Income Above $200,000 in the United States?
Percentage of Families with Income Above $200,000 in the United States is 14.8%.