Zip Codes with the Highest Percentage of Population Employed in Food Preparation & Serving in Wyoming
RELATED REPORTS & OPTIONS
Food Preparation & Serving
Wyoming
Compare Zip Codes
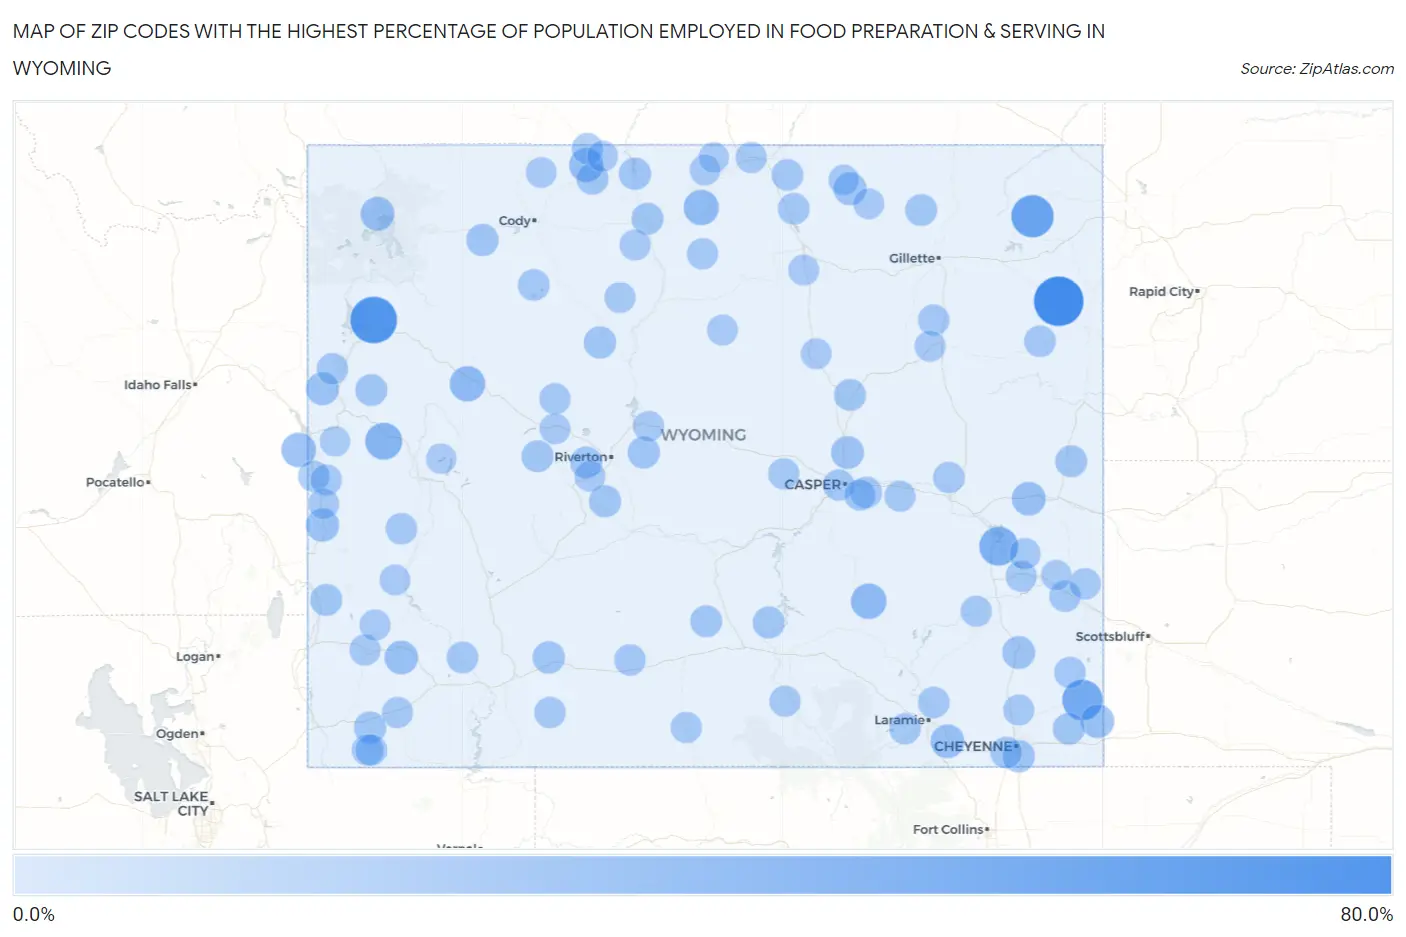
Map of Zip Codes with the Highest Percentage of Population Employed in Food Preparation & Serving in Wyoming
0.0%
80.0%
Zip Codes with the Highest Percentage of Population Employed in Food Preparation & Serving in Wyoming
| Zip Code | % Employed | vs State | vs National | |
| 1. | 82723 | 67.3% | 5.9%(+61.5)#1 | 5.3%(+62.1)#26 |
| 2. | 83013 | 57.1% | 5.9%(+51.2)#2 | 5.3%(+51.8)#38 |
| 3. | 82714 | 42.1% | 5.9%(+36.2)#3 | 5.3%(+36.8)#93 |
| 4. | 82050 | 35.6% | 5.9%(+29.8)#4 | 5.3%(+30.4)#144 |
| 5. | 82213 | 30.0% | 5.9%(+24.1)#5 | 5.3%(+24.7)#210 |
| 6. | 82922 | 23.9% | 5.9%(+18.1)#6 | 5.3%(+18.6)#347 |
| 7. | 82329 | 19.4% | 5.9%(+13.5)#7 | 5.3%(+14.1)#541 |
| 8. | 82513 | 18.6% | 5.9%(+12.7)#8 | 5.3%(+13.3)#603 |
| 9. | 82441 | 17.9% | 5.9%(+12.1)#9 | 5.3%(+12.6)#671 |
| 10. | 83120 | 16.1% | 5.9%(+10.2)#10 | 5.3%(+10.8)#857 |
| 11. | 82421 | 14.4% | 5.9%(+8.55)#11 | 5.3%(+9.12)#1,077 |
| 12. | 82190 | 13.3% | 5.9%(+7.49)#12 | 5.3%(+8.06)#1,302 |
| 13. | 82227 | 13.1% | 5.9%(+7.26)#13 | 5.3%(+7.83)#1,367 |
| 14. | 82073 | 12.8% | 5.9%(+6.96)#14 | 5.3%(+7.53)#1,438 |
| 15. | 83124 | 12.6% | 5.9%(+6.79)#15 | 5.3%(+7.36)#1,484 |
| 16. | 82082 | 12.6% | 5.9%(+6.74)#16 | 5.3%(+7.32)#1,490 |
| 17. | 83126 | 11.6% | 5.9%(+5.73)#17 | 5.3%(+6.30)#1,820 |
| 18. | 83014 | 10.5% | 5.9%(+4.67)#18 | 5.3%(+5.24)#2,311 |
| 19. | 82837 | 10.5% | 5.9%(+4.67)#19 | 5.3%(+5.24)#2,318 |
| 20. | 82601 | 10.1% | 5.9%(+4.26)#20 | 5.3%(+4.83)#2,546 |
| 21. | 82210 | 10.1% | 5.9%(+4.25)#21 | 5.3%(+4.83)#2,550 |
| 22. | 82007 | 8.8% | 5.9%(+2.98)#22 | 5.3%(+3.55)#3,674 |
| 23. | 82945 | 8.7% | 5.9%(+2.80)#23 | 5.3%(+3.37)#3,909 |
| 24. | 82414 | 8.4% | 5.9%(+2.55)#24 | 5.3%(+3.12)#4,160 |
| 25. | 82443 | 8.3% | 5.9%(+2.46)#25 | 5.3%(+3.03)#4,307 |
| 26. | 82431 | 7.9% | 5.9%(+2.06)#26 | 5.3%(+2.63)#4,865 |
| 27. | 82501 | 7.9% | 5.9%(+2.02)#27 | 5.3%(+2.59)#4,919 |
| 28. | 82520 | 7.6% | 5.9%(+1.72)#28 | 5.3%(+2.29)#5,409 |
| 29. | 82933 | 7.3% | 5.9%(+1.44)#29 | 5.3%(+2.01)#5,923 |
| 30. | 82053 | 7.2% | 5.9%(+1.32)#30 | 5.3%(+1.89)#6,176 |
| 31. | 82426 | 7.1% | 5.9%(+1.28)#31 | 5.3%(+1.85)#6,268 |
| 32. | 82334 | 7.1% | 5.9%(+1.24)#32 | 5.3%(+1.81)#6,346 |
| 33. | 82412 | 7.0% | 5.9%(+1.17)#33 | 5.3%(+1.74)#6,500 |
| 34. | 82514 | 7.0% | 5.9%(+1.16)#34 | 5.3%(+1.73)#6,514 |
| 35. | 82225 | 7.0% | 5.9%(+1.15)#35 | 5.3%(+1.72)#6,536 |
| 36. | 82643 | 6.9% | 5.9%(+1.04)#36 | 5.3%(+1.61)#6,835 |
| 37. | 82716 | 6.9% | 5.9%(+1.02)#37 | 5.3%(+1.59)#6,870 |
| 38. | 82301 | 6.9% | 5.9%(+1.01)#38 | 5.3%(+1.58)#6,904 |
| 39. | 83114 | 6.8% | 5.9%(+0.988)#39 | 5.3%(+1.56)#6,948 |
| 40. | 82510 | 6.8% | 5.9%(+0.954)#40 | 5.3%(+1.53)#7,042 |
| 41. | 83001 | 6.6% | 5.9%(+0.695)#41 | 5.3%(+1.27)#7,720 |
| 42. | 82636 | 6.3% | 5.9%(+0.426)#42 | 5.3%(+0.997)#8,481 |
| 43. | 82001 | 6.3% | 5.9%(+0.403)#43 | 5.3%(+0.974)#8,545 |
| 44. | 82701 | 6.2% | 5.9%(+0.347)#44 | 5.3%(+0.918)#8,714 |
| 45. | 82801 | 6.2% | 5.9%(+0.326)#45 | 5.3%(+0.897)#8,789 |
| 46. | 82832 | 6.1% | 5.9%(+0.224)#46 | 5.3%(+0.796)#9,077 |
| 47. | 82433 | 5.9% | 5.9%(-0.004)#47 | 5.3%(+0.568)#9,852 |
| 48. | 82935 | 5.8% | 5.9%(-0.030)#48 | 5.3%(+0.542)#9,944 |
| 49. | 82930 | 5.7% | 5.9%(-0.183)#49 | 5.3%(+0.389)#10,442 |
| 50. | 82072 | 5.7% | 5.9%(-0.198)#50 | 5.3%(+0.374)#10,490 |
| 51. | 83025 | 5.6% | 5.9%(-0.231)#51 | 5.3%(+0.341)#10,613 |
| 52. | 83113 | 5.6% | 5.9%(-0.271)#52 | 5.3%(+0.301)#10,755 |
| 53. | 82336 | 5.6% | 5.9%(-0.302)#53 | 5.3%(+0.270)#10,871 |
| 54. | 82221 | 5.5% | 5.9%(-0.389)#54 | 5.3%(+0.183)#11,155 |
| 55. | 82944 | 5.4% | 5.9%(-0.481)#55 | 5.3%(+0.090)#11,485 |
| 56. | 82718 | 5.3% | 5.9%(-0.601)#56 | 5.3%(-0.030)#11,936 |
| 57. | 82223 | 5.2% | 5.9%(-0.624)#57 | 5.3%(-0.052)#12,009 |
| 58. | 82644 | 5.1% | 5.9%(-0.710)#58 | 5.3%(-0.138)#12,373 |
| 59. | 82609 | 5.1% | 5.9%(-0.717)#59 | 5.3%(-0.145)#12,392 |
| 60. | 82423 | 5.1% | 5.9%(-0.729)#60 | 5.3%(-0.158)#12,436 |
| 61. | 82240 | 5.0% | 5.9%(-0.827)#61 | 5.3%(-0.255)#12,824 |
| 62. | 82901 | 5.0% | 5.9%(-0.837)#62 | 5.3%(-0.265)#12,867 |
| 63. | 82633 | 4.9% | 5.9%(-0.929)#63 | 5.3%(-0.358)#13,232 |
| 64. | 82070 | 4.9% | 5.9%(-0.972)#64 | 5.3%(-0.401)#13,419 |
| 65. | 82523 | 4.7% | 5.9%(-1.12)#65 | 5.3%(-0.546)#13,988 |
| 66. | 83127 | 4.7% | 5.9%(-1.19)#66 | 5.3%(-0.617)#14,287 |
| 67. | 82214 | 4.6% | 5.9%(-1.22)#67 | 5.3%(-0.646)#14,408 |
| 68. | 83112 | 4.6% | 5.9%(-1.22)#68 | 5.3%(-0.649)#14,422 |
| 69. | 82331 | 4.6% | 5.9%(-1.28)#69 | 5.3%(-0.706)#14,700 |
| 70. | 82839 | 4.5% | 5.9%(-1.39)#70 | 5.3%(-0.818)#15,150 |
| 71. | 82604 | 4.5% | 5.9%(-1.39)#71 | 5.3%(-0.820)#15,156 |
| 72. | 82215 | 4.3% | 5.9%(-1.51)#72 | 5.3%(-0.938)#15,665 |
| 73. | 82428 | 4.3% | 5.9%(-1.51)#73 | 5.3%(-0.938)#15,668 |
| 74. | 82321 | 4.3% | 5.9%(-1.55)#74 | 5.3%(-0.973)#15,828 |
| 75. | 82201 | 4.3% | 5.9%(-1.57)#75 | 5.3%(-0.994)#15,919 |
| 76. | 82637 | 4.2% | 5.9%(-1.62)#76 | 5.3%(-1.05)#16,169 |
| 77. | 82937 | 4.2% | 5.9%(-1.63)#77 | 5.3%(-1.05)#16,183 |
| 78. | 83116 | 4.2% | 5.9%(-1.69)#78 | 5.3%(-1.12)#16,443 |
| 79. | 82401 | 4.1% | 5.9%(-1.74)#79 | 5.3%(-1.17)#16,651 |
| 80. | 82009 | 3.9% | 5.9%(-2.00)#80 | 5.3%(-1.43)#17,727 |
| 81. | 82515 | 3.8% | 5.9%(-2.06)#81 | 5.3%(-1.49)#17,956 |
| 82. | 83101 | 3.8% | 5.9%(-2.07)#82 | 5.3%(-1.50)#17,984 |
| 83. | 82831 | 3.7% | 5.9%(-2.12)#83 | 5.3%(-1.55)#18,171 |
| 84. | 82732 | 3.7% | 5.9%(-2.12)#84 | 5.3%(-1.55)#18,177 |
| 85. | 82516 | 3.7% | 5.9%(-2.15)#85 | 5.3%(-1.58)#18,336 |
| 86. | 82420 | 3.6% | 5.9%(-2.25)#86 | 5.3%(-1.68)#18,748 |
| 87. | 82410 | 3.6% | 5.9%(-2.27)#87 | 5.3%(-1.70)#18,832 |
| 88. | 82834 | 3.6% | 5.9%(-2.28)#88 | 5.3%(-1.71)#18,868 |
| 89. | 82442 | 3.6% | 5.9%(-2.29)#89 | 5.3%(-1.71)#18,896 |
| 90. | 82639 | 3.4% | 5.9%(-2.49)#90 | 5.3%(-1.92)#19,741 |
| 91. | 83123 | 3.3% | 5.9%(-2.52)#91 | 5.3%(-1.95)#19,916 |
| 92. | 82649 | 3.3% | 5.9%(-2.57)#92 | 5.3%(-2.00)#20,123 |
| 93. | 83110 | 3.1% | 5.9%(-2.81)#93 | 5.3%(-2.23)#21,050 |
| 94. | 82435 | 2.9% | 5.9%(-2.94)#94 | 5.3%(-2.37)#21,581 |
| 95. | 82836 | 2.8% | 5.9%(-3.03)#95 | 5.3%(-2.46)#21,979 |
| 96. | 82835 | 2.6% | 5.9%(-3.21)#96 | 5.3%(-2.64)#22,620 |
| 97. | 82838 | 2.3% | 5.9%(-3.57)#97 | 5.3%(-3.00)#23,808 |
| 98. | 82212 | 2.0% | 5.9%(-3.81)#98 | 5.3%(-3.24)#24,557 |
| 99. | 83128 | 2.0% | 5.9%(-3.90)#99 | 5.3%(-3.33)#24,814 |
| 100. | 82941 | 1.8% | 5.9%(-4.02)#100 | 5.3%(-3.45)#25,182 |
1
2Common Questions
What are the Top 10 Zip Codes with the Highest Percentage of Population Employed in Food Preparation & Serving in Wyoming?
Top 10 Zip Codes with the Highest Percentage of Population Employed in Food Preparation & Serving in Wyoming are:
What zip code has the Highest Percentage of Population Employed in Food Preparation & Serving in Wyoming?
82723 has the Highest Percentage of Population Employed in Food Preparation & Serving in Wyoming with 67.3%.
What is the Percentage of Population Employed in Food Preparation & Serving in the State of Wyoming?
Percentage of Population Employed in Food Preparation & Serving in Wyoming is 5.9%.
What is the Percentage of Population Employed in Food Preparation & Serving in the United States?
Percentage of Population Employed in Food Preparation & Serving in the United States is 5.3%.