Zip Codes with the Highest Percentage of Population Employed in Education, Arts & Media in the United States
RELATED REPORTS & OPTIONS
Education, Arts & Media
United States
Compare Zip Codes
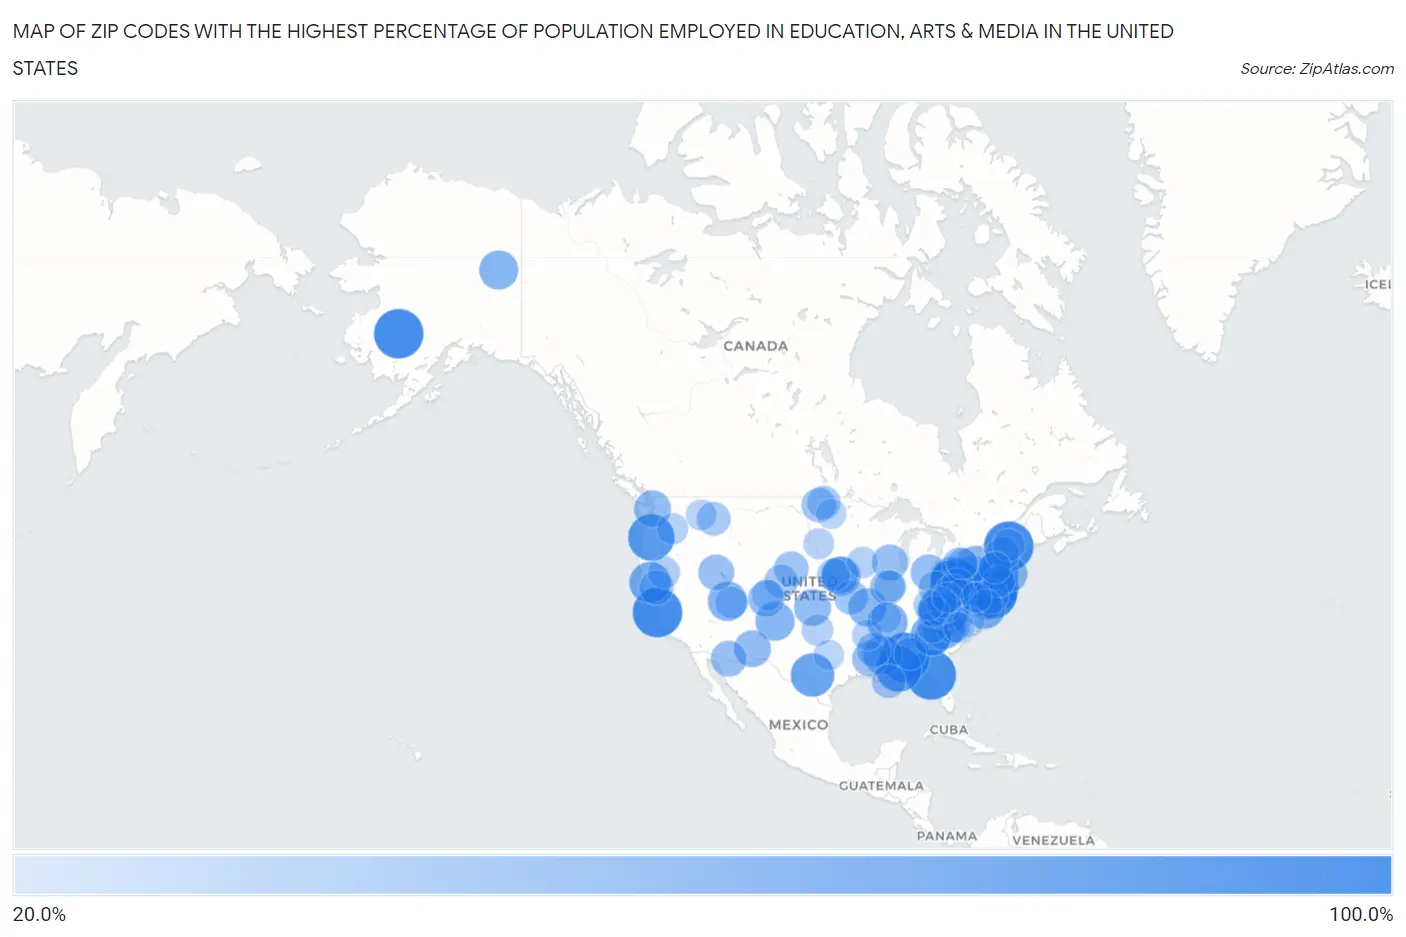
Map of Zip Codes with the Highest Percentage of Population Employed in Education, Arts & Media in the United States
20.0%
100.0%
Zip Codes with the Highest Percentage of Population Employed in Education, Arts & Media in the United States
| Zip Code | % Employed | vs State | vs National | |
| 1. | 32356 | 100.0% | 1.4%(+98.6)#1 | 1.8%(+98.2)#1 |
| 2. | 08064 | 100.0% | 1.8%(+98.2)#2 | 1.8%(+98.2)#3 |
| 3. | 08246 | 100.0% | 1.8%(+98.2)#3 | 1.8%(+98.2)#4 |
| 4. | 95013 | 100.0% | 1.7%(+98.3)#1 | 1.8%(+98.2)#5 |
| 5. | 05670 | 100.0% | 2.8%(+97.2)#1 | 1.8%(+98.2)#6 |
| 6. | 99575 | 100.0% | 2.1%(+97.9)#1 | 1.8%(+98.2)#7 |
| 7. | 36766 | 100.0% | 1.7%(+98.3)#1 | 1.8%(+98.2)#8 |
| 8. | 24895 | 100.0% | 2.1%(+97.9)#1 | 1.8%(+98.2)#9 |
| 9. | 15123 | 100.0% | 2.1%(+97.9)#1 | 1.8%(+98.2)#10 |
| 10. | 97373 | 87.5% | 2.1%(+85.4)#1 | 1.8%(+85.7)#11 |
| 11. | 36559 | 85.7% | 1.7%(+84.0)#2 | 1.8%(+83.9)#12 |
| 12. | 78828 | 75.9% | 1.5%(+74.4)#1 | 1.8%(+74.1)#13 |
| 13. | 28136 | 72.2% | 1.9%(+70.3)#1 | 1.8%(+70.4)#14 |
| 14. | 96076 | 67.4% | 1.7%(+65.7)#2 | 1.8%(+65.6)#15 |
| 15. | 30598 | 66.7% | 1.5%(+65.1)#1 | 1.8%(+64.9)#16 |
| 16. | 23422 | 62.5% | 1.9%(+60.6)#1 | 1.8%(+60.7)#17 |
| 17. | 38047 | 62.3% | 1.7%(+60.6)#1 | 1.8%(+60.5)#18 |
| 18. | 84732 | 60.0% | 1.5%(+58.5)#1 | 1.8%(+58.2)#19 |
| 19. | 10545 | 59.7% | 2.2%(+57.5)#1 | 1.8%(+57.9)#20 |
| 20. | 39201 | 59.0% | 1.8%(+57.1)#1 | 1.8%(+57.2)#21 |
| 21. | 87722 | 58.7% | 2.0%(+56.7)#1 | 1.8%(+57.0)#22 |
| 22. | 99733 | 58.3% | 2.1%(+56.2)#2 | 1.8%(+56.5)#23 |
| 23. | 21902 | 57.5% | 1.9%(+55.5)#1 | 1.8%(+55.7)#24 |
| 24. | 68056 | 57.1% | 1.8%(+55.3)#1 | 1.8%(+55.4)#25 |
| 25. | 16155 | 56.5% | 2.1%(+54.4)#2 | 1.8%(+54.7)#26 |
| 26. | 17779 | 56.1% | 2.1%(+54.0)#3 | 1.8%(+54.3)#27 |
| 27. | 65534 | 55.8% | 1.8%(+54.0)#1 | 1.8%(+54.0)#28 |
| 28. | 12483 | 53.3% | 2.2%(+51.2)#2 | 1.8%(+51.5)#29 |
| 29. | 15325 | 53.2% | 2.1%(+51.1)#4 | 1.8%(+51.4)#30 |
| 30. | 06439 | 52.2% | 2.0%(+50.2)#1 | 1.8%(+50.4)#31 |
| 31. | 68010 | 50.0% | 1.8%(+48.2)#2 | 1.8%(+48.2)#32 |
| 32. | 88038 | 50.0% | 2.0%(+48.0)#2 | 1.8%(+48.2)#33 |
| 33. | 67843 | 50.0% | 1.8%(+48.2)#1 | 1.8%(+48.2)#34 |
| 34. | 98364 | 50.0% | 1.8%(+48.2)#1 | 1.8%(+48.2)#35 |
| 35. | 24830 | 50.0% | 2.1%(+47.9)#2 | 1.8%(+48.2)#36 |
| 36. | 30639 | 50.0% | 1.5%(+48.5)#2 | 1.8%(+48.2)#37 |
| 37. | 44493 | 49.2% | 1.8%(+47.4)#1 | 1.8%(+47.4)#38 |
| 38. | 24861 | 48.3% | 2.1%(+46.1)#3 | 1.8%(+46.5)#39 |
| 39. | 25201 | 48.2% | 2.1%(+46.1)#4 | 1.8%(+46.4)#40 |
| 40. | 81237 | 47.8% | 1.8%(+46.0)#1 | 1.8%(+46.0)#41 |
| 41. | 43414 | 47.1% | 1.8%(+45.3)#2 | 1.8%(+45.3)#42 |
| 42. | 53501 | 47.1% | 1.7%(+45.4)#1 | 1.8%(+45.3)#43 |
| 43. | 84313 | 46.4% | 1.5%(+45.0)#2 | 1.8%(+44.6)#44 |
| 44. | 85639 | 46.3% | 1.7%(+44.6)#1 | 1.8%(+44.5)#45 |
| 45. | 14893 | 46.2% | 2.2%(+44.0)#3 | 1.8%(+44.4)#46 |
| 46. | 71401 | 45.8% | 2.0%(+43.8)#1 | 1.8%(+44.0)#47 |
| 47. | 14752 | 43.8% | 2.2%(+41.6)#4 | 1.8%(+42.0)#48 |
| 48. | 26361 | 43.5% | 2.1%(+41.3)#5 | 1.8%(+41.7)#49 |
| 49. | 62519 | 42.5% | 1.7%(+40.8)#1 | 1.8%(+40.7)#50 |
| 50. | 69331 | 41.7% | 1.8%(+39.9)#3 | 1.8%(+39.9)#51 |
| 51. | 08212 | 41.3% | 1.8%(+39.5)#4 | 1.8%(+39.5)#52 |
| 52. | 96092 | 40.8% | 1.7%(+39.1)#3 | 1.8%(+39.0)#53 |
| 53. | 25103 | 40.5% | 2.1%(+38.4)#6 | 1.8%(+38.8)#54 |
| 54. | 27351 | 40.4% | 1.9%(+38.5)#2 | 1.8%(+38.6)#55 |
| 55. | 64147 | 40.0% | 1.8%(+38.2)#2 | 1.8%(+38.2)#56 |
| 56. | 71242 | 40.0% | 2.0%(+38.0)#2 | 1.8%(+38.2)#57 |
| 57. | 58325 | 40.0% | 1.8%(+38.2)#1 | 1.8%(+38.2)#58 |
| 58. | 26576 | 39.7% | 2.1%(+37.6)#7 | 1.8%(+37.9)#59 |
| 59. | 41725 | 39.6% | 2.0%(+37.6)#1 | 1.8%(+37.8)#60 |
| 60. | 12854 | 38.8% | 2.2%(+36.6)#5 | 1.8%(+37.0)#61 |
| 61. | 25544 | 38.2% | 2.1%(+36.0)#8 | 1.8%(+36.4)#62 |
| 62. | 80622 | 38.1% | 1.8%(+36.4)#2 | 1.8%(+36.3)#63 |
| 63. | 70091 | 38.0% | 2.0%(+36.0)#3 | 1.8%(+36.2)#64 |
| 64. | 59851 | 37.5% | 2.0%(+35.5)#1 | 1.8%(+35.7)#65 |
| 65. | 58330 | 37.0% | 1.8%(+35.2)#2 | 1.8%(+35.2)#66 |
| 66. | 25180 | 35.1% | 2.1%(+32.9)#9 | 1.8%(+33.3)#67 |
| 67. | 68014 | 34.8% | 1.8%(+33.0)#4 | 1.8%(+33.0)#68 |
| 68. | 41567 | 34.4% | 2.0%(+32.3)#2 | 1.8%(+32.6)#69 |
| 69. | 43109 | 34.2% | 1.8%(+32.4)#3 | 1.8%(+32.4)#70 |
| 70. | 36112 | 33.3% | 1.7%(+31.6)#3 | 1.8%(+31.5)#71 |
| 71. | 84773 | 33.1% | 1.5%(+31.6)#3 | 1.8%(+31.3)#72 |
| 72. | 96015 | 32.8% | 1.7%(+31.1)#4 | 1.8%(+31.0)#73 |
| 73. | 05640 | 32.7% | 2.8%(+29.8)#2 | 1.8%(+30.9)#74 |
| 74. | 62518 | 31.4% | 1.7%(+29.7)#2 | 1.8%(+29.6)#75 |
| 75. | 11430 | 31.1% | 2.2%(+28.9)#6 | 1.8%(+29.3)#76 |
| 76. | 12412 | 31.1% | 2.2%(+28.9)#7 | 1.8%(+29.3)#77 |
| 77. | 26731 | 30.6% | 2.1%(+28.4)#10 | 1.8%(+28.8)#78 |
| 78. | 81251 | 30.0% | 1.8%(+28.2)#3 | 1.8%(+28.2)#79 |
| 79. | 73664 | 29.7% | 1.9%(+27.8)#1 | 1.8%(+27.9)#80 |
| 80. | 25206 | 29.2% | 2.1%(+27.0)#11 | 1.8%(+27.4)#81 |
| 81. | 15634 | 28.8% | 2.1%(+26.7)#5 | 1.8%(+27.0)#82 |
| 82. | 23488 | 28.8% | 1.9%(+26.9)#2 | 1.8%(+27.0)#83 |
| 83. | 99345 | 28.6% | 1.8%(+26.7)#2 | 1.8%(+26.8)#84 |
| 84. | 50608 | 28.6% | 1.6%(+26.9)#1 | 1.8%(+26.8)#85 |
| 85. | 25836 | 27.5% | 2.1%(+25.4)#12 | 1.8%(+25.7)#86 |
| 86. | 14041 | 27.5% | 2.2%(+25.3)#8 | 1.8%(+25.7)#87 |
| 87. | 83802 | 27.0% | 1.8%(+25.2)#1 | 1.8%(+25.2)#88 |
| 88. | 28707 | 26.9% | 1.9%(+25.0)#3 | 1.8%(+25.2)#89 |
| 89. | 27816 | 26.8% | 1.9%(+24.9)#4 | 1.8%(+25.1)#90 |
| 90. | 25573 | 26.8% | 2.1%(+24.7)#13 | 1.8%(+25.0)#91 |
| 91. | 57371 | 26.8% | 1.8%(+25.0)#1 | 1.8%(+25.0)#92 |
| 92. | 22211 | 26.7% | 1.9%(+24.8)#3 | 1.8%(+24.9)#93 |
| 93. | 27259 | 26.7% | 1.9%(+24.8)#5 | 1.8%(+24.9)#94 |
| 94. | 72180 | 26.7% | 1.8%(+24.8)#1 | 1.8%(+24.9)#95 |
| 95. | 41759 | 26.6% | 2.0%(+24.6)#3 | 1.8%(+24.9)#96 |
| 96. | 40358 | 26.1% | 2.0%(+24.1)#4 | 1.8%(+24.4)#97 |
| 97. | 26638 | 26.1% | 2.1%(+24.0)#14 | 1.8%(+24.3)#98 |
| 98. | 76077 | 25.3% | 1.5%(+23.8)#2 | 1.8%(+23.5)#99 |
| 99. | 63860 | 25.0% | 1.8%(+23.2)#3 | 1.8%(+23.2)#100 |
| 100. | 58016 | 25.0% | 1.8%(+23.2)#3 | 1.8%(+23.2)#101 |
Common Questions
What are the Top 10 Zip Codes with the Highest Percentage of Population Employed in Education, Arts & Media in the United States?
Top 10 Zip Codes with the Highest Percentage of Population Employed in Education, Arts & Media in the United States are:
#1
100.0%
#2
100.0%
#3
100.0%
#4
100.0%
#5
100.0%
#6
100.0%
#7
100.0%
#8
100.0%
#9
100.0%
#10
87.5%
What zip code has the Highest Percentage of Population Employed in Education, Arts & Media in the United States?
32356 has the Highest Percentage of Population Employed in Education, Arts & Media in the United States with 100.0%.
What is the Percentage of Population Employed in Education, Arts & Media in the United States?
Percentage of Population Employed in Education, Arts & Media in the United States is 1.8%.