Zip Codes with the Highest Percentage of Population Employed in Food Preparation & Serving in Ohio
RELATED REPORTS & OPTIONS
Food Preparation & Serving
Ohio
Compare Zip Codes
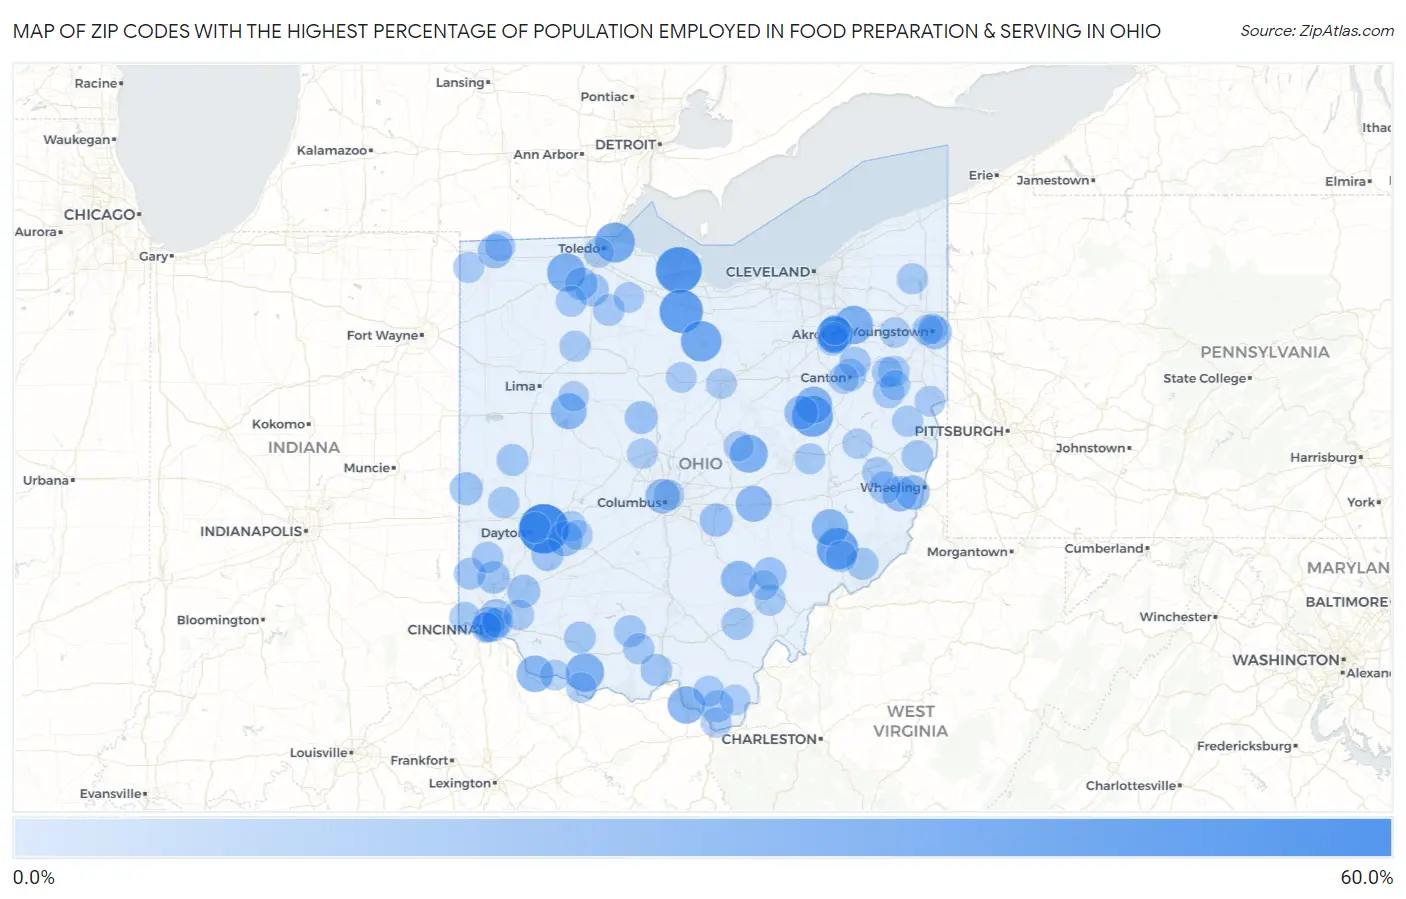
Map of Zip Codes with the Highest Percentage of Population Employed in Food Preparation & Serving in Ohio
0.0%
60.0%
Zip Codes with the Highest Percentage of Population Employed in Food Preparation & Serving in Ohio
| Zip Code | % Employed | vs State | vs National | |
| 1. | 45435 | 55.2% | 5.6%(+49.6)#1 | 5.3%(+49.9)#41 |
| 2. | 43433 | 46.5% | 5.6%(+40.9)#2 | 5.3%(+41.2)#69 |
| 3. | 44828 | 40.9% | 5.6%(+35.3)#3 | 5.3%(+35.6)#98 |
| 4. | 45727 | 36.2% | 5.6%(+30.6)#4 | 5.3%(+30.9)#135 |
| 5. | 44687 | 35.3% | 5.6%(+29.7)#5 | 5.3%(+30.0)#147 |
| 6. | 44850 | 34.3% | 5.6%(+28.7)#6 | 5.3%(+29.0)#157 |
| 7. | 43434 | 32.8% | 5.6%(+27.2)#7 | 5.3%(+27.5)#177 |
| 8. | 44243 | 29.2% | 5.6%(+23.6)#8 | 5.3%(+24.0)#228 |
| 9. | 43547 | 29.1% | 5.6%(+23.4)#9 | 5.3%(+23.8)#230 |
| 10. | 45115 | 28.7% | 5.6%(+23.1)#10 | 5.3%(+23.4)#236 |
| 11. | 43005 | 28.4% | 5.6%(+22.8)#11 | 5.3%(+23.1)#241 |
| 12. | 45636 | 26.7% | 5.6%(+21.1)#12 | 5.3%(+21.4)#269 |
| 13. | 44325 | 26.3% | 5.6%(+20.7)#13 | 5.3%(+21.0)#276 |
| 14. | 44690 | 25.7% | 5.6%(+20.1)#14 | 5.3%(+20.4)#295 |
| 15. | 43717 | 25.0% | 5.6%(+19.4)#15 | 5.3%(+19.7)#316 |
| 16. | 45112 | 25.0% | 5.6%(+19.4)#16 | 5.3%(+19.7)#318 |
| 17. | 43346 | 23.7% | 5.6%(+18.1)#17 | 5.3%(+18.4)#355 |
| 18. | 43740 | 23.6% | 5.6%(+18.0)#18 | 5.3%(+18.3)#358 |
| 19. | 43158 | 23.1% | 5.6%(+17.5)#19 | 5.3%(+17.8)#381 |
| 20. | 43967 | 22.1% | 5.6%(+16.5)#20 | 5.3%(+16.9)#415 |
| 21. | 44304 | 21.9% | 5.6%(+16.3)#21 | 5.3%(+16.7)#423 |
| 22. | 45384 | 21.1% | 5.6%(+15.5)#22 | 5.3%(+15.8)#456 |
| 23. | 43210 | 20.0% | 5.6%(+14.4)#23 | 5.3%(+14.8)#499 |
| 24. | 43940 | 20.0% | 5.6%(+14.4)#24 | 5.3%(+14.7)#501 |
| 25. | 43531 | 19.5% | 5.6%(+13.9)#25 | 5.3%(+14.2)#530 |
| 26. | 44610 | 18.9% | 5.6%(+13.3)#26 | 5.3%(+13.7)#570 |
| 27. | 44506 | 18.0% | 5.6%(+12.4)#27 | 5.3%(+12.7)#657 |
| 28. | 45219 | 18.0% | 5.6%(+12.4)#28 | 5.3%(+12.7)#660 |
| 29. | 43157 | 17.6% | 5.6%(+11.9)#29 | 5.3%(+12.3)#702 |
| 30. | 45352 | 17.2% | 5.6%(+11.6)#30 | 5.3%(+11.9)#728 |
| 31. | 45740 | 17.0% | 5.6%(+11.4)#31 | 5.3%(+11.7)#750 |
| 32. | 45034 | 17.0% | 5.6%(+11.4)#32 | 5.3%(+11.7)#752 |
| 33. | 43403 | 16.9% | 5.6%(+11.3)#33 | 5.3%(+11.6)#759 |
| 34. | 43322 | 16.7% | 5.6%(+11.1)#34 | 5.3%(+11.5)#769 |
| 35. | 43565 | 16.4% | 5.6%(+10.8)#35 | 5.3%(+11.1)#804 |
| 36. | 45055 | 15.7% | 5.6%(+10.1)#36 | 5.3%(+10.4)#890 |
| 37. | 44703 | 15.1% | 5.6%(+9.52)#37 | 5.3%(+9.84)#965 |
| 38. | 45370 | 15.0% | 5.6%(+9.37)#38 | 5.3%(+9.69)#984 |
| 39. | 43759 | 15.0% | 5.6%(+9.35)#39 | 5.3%(+9.67)#988 |
| 40. | 45652 | 14.9% | 5.6%(+9.27)#40 | 5.3%(+9.59)#1,002 |
| 41. | 45695 | 14.8% | 5.6%(+9.17)#41 | 5.3%(+9.49)#1,012 |
| 42. | 43948 | 14.7% | 5.6%(+9.13)#42 | 5.3%(+9.44)#1,024 |
| 43. | 45789 | 14.7% | 5.6%(+9.10)#43 | 5.3%(+9.42)#1,029 |
| 44. | 45216 | 14.6% | 5.6%(+8.95)#44 | 5.3%(+9.27)#1,047 |
| 45. | 45646 | 14.5% | 5.6%(+8.88)#45 | 5.3%(+9.19)#1,062 |
| 46. | 45333 | 14.5% | 5.6%(+8.85)#46 | 5.3%(+9.17)#1,071 |
| 47. | 45225 | 14.4% | 5.6%(+8.76)#47 | 5.3%(+9.08)#1,085 |
| 48. | 45645 | 14.3% | 5.6%(+8.68)#48 | 5.3%(+9.00)#1,094 |
| 49. | 45155 | 14.2% | 5.6%(+8.61)#49 | 5.3%(+8.93)#1,118 |
| 50. | 45056 | 14.2% | 5.6%(+8.59)#50 | 5.3%(+8.91)#1,123 |
| 51. | 43467 | 13.8% | 5.6%(+8.24)#51 | 5.3%(+8.56)#1,195 |
| 52. | 45070 | 13.6% | 5.6%(+7.95)#52 | 5.3%(+8.27)#1,262 |
| 53. | 44652 | 13.5% | 5.6%(+7.94)#53 | 5.3%(+8.26)#1,265 |
| 54. | 45746 | 13.5% | 5.6%(+7.91)#54 | 5.3%(+8.23)#1,270 |
| 55. | 44607 | 13.5% | 5.6%(+7.91)#55 | 5.3%(+8.23)#1,274 |
| 56. | 45701 | 13.2% | 5.6%(+7.63)#56 | 5.3%(+7.95)#1,332 |
| 57. | 45214 | 13.2% | 5.6%(+7.56)#57 | 5.3%(+7.88)#1,349 |
| 58. | 44665 | 13.2% | 5.6%(+7.55)#58 | 5.3%(+7.87)#1,356 |
| 59. | 45361 | 13.0% | 5.6%(+7.44)#59 | 5.3%(+7.76)#1,382 |
| 60. | 45671 | 13.0% | 5.6%(+7.41)#60 | 5.3%(+7.73)#1,391 |
| 61. | 44634 | 12.9% | 5.6%(+7.33)#61 | 5.3%(+7.65)#1,408 |
| 62. | 45404 | 12.8% | 5.6%(+7.23)#62 | 5.3%(+7.55)#1,434 |
| 63. | 45816 | 12.8% | 5.6%(+7.18)#63 | 5.3%(+7.50)#1,445 |
| 64. | 44450 | 12.7% | 5.6%(+7.14)#64 | 5.3%(+7.46)#1,454 |
| 65. | 45033 | 12.7% | 5.6%(+7.08)#65 | 5.3%(+7.40)#1,469 |
| 66. | 43908 | 12.6% | 5.6%(+6.95)#66 | 5.3%(+7.27)#1,505 |
| 67. | 43541 | 12.5% | 5.6%(+6.89)#67 | 5.3%(+7.21)#1,520 |
| 68. | 45659 | 12.4% | 5.6%(+6.82)#68 | 5.3%(+7.14)#1,537 |
| 69. | 43845 | 12.4% | 5.6%(+6.76)#69 | 5.3%(+7.08)#1,551 |
| 70. | 44509 | 12.4% | 5.6%(+6.76)#70 | 5.3%(+7.08)#1,552 |
| 71. | 43985 | 12.4% | 5.6%(+6.75)#71 | 5.3%(+7.07)#1,554 |
| 72. | 44301 | 12.2% | 5.6%(+6.62)#72 | 5.3%(+6.94)#1,588 |
| 73. | 44311 | 12.1% | 5.6%(+6.54)#73 | 5.3%(+6.86)#1,615 |
| 74. | 45207 | 12.1% | 5.6%(+6.48)#74 | 5.3%(+6.80)#1,631 |
| 75. | 43211 | 12.0% | 5.6%(+6.42)#75 | 5.3%(+6.74)#1,655 |
| 76. | 43505 | 12.0% | 5.6%(+6.39)#76 | 5.3%(+6.71)#1,668 |
| 77. | 45680 | 11.9% | 5.6%(+6.29)#77 | 5.3%(+6.61)#1,706 |
| 78. | 45678 | 11.8% | 5.6%(+6.24)#78 | 5.3%(+6.56)#1,720 |
| 79. | 43968 | 11.7% | 5.6%(+6.11)#79 | 5.3%(+6.43)#1,766 |
| 80. | 45316 | 11.7% | 5.6%(+6.04)#80 | 5.3%(+6.36)#1,794 |
| 81. | 44856 | 11.6% | 5.6%(+6.02)#81 | 5.3%(+6.34)#1,808 |
| 82. | 45111 | 11.6% | 5.6%(+6.00)#82 | 5.3%(+6.32)#1,817 |
| 83. | 45101 | 11.5% | 5.6%(+5.94)#83 | 5.3%(+6.26)#1,831 |
| 84. | 45205 | 11.5% | 5.6%(+5.89)#84 | 5.3%(+6.21)#1,844 |
| 85. | 43501 | 11.4% | 5.6%(+5.77)#85 | 5.3%(+6.09)#1,885 |
| 86. | 43061 | 11.3% | 5.6%(+5.74)#86 | 5.3%(+6.06)#1,899 |
| 87. | 43435 | 11.3% | 5.6%(+5.73)#87 | 5.3%(+6.05)#1,901 |
| 88. | 44429 | 11.2% | 5.6%(+5.62)#88 | 5.3%(+5.94)#1,945 |
| 89. | 45812 | 11.2% | 5.6%(+5.61)#89 | 5.3%(+5.93)#1,954 |
| 90. | 45131 | 11.2% | 5.6%(+5.60)#90 | 5.3%(+5.92)#1,955 |
| 91. | 44902 | 11.2% | 5.6%(+5.57)#91 | 5.3%(+5.89)#1,971 |
| 92. | 45314 | 11.2% | 5.6%(+5.56)#92 | 5.3%(+5.88)#1,974 |
| 93. | 43022 | 11.2% | 5.6%(+5.56)#93 | 5.3%(+5.88)#1,979 |
| 94. | 44683 | 11.1% | 5.6%(+5.50)#94 | 5.3%(+5.82)#2,014 |
| 95. | 44710 | 11.1% | 5.6%(+5.47)#95 | 5.3%(+5.79)#2,023 |
| 96. | 44310 | 11.1% | 5.6%(+5.45)#96 | 5.3%(+5.77)#2,031 |
| 97. | 45719 | 11.0% | 5.6%(+5.42)#97 | 5.3%(+5.74)#2,047 |
| 98. | 44625 | 10.9% | 5.6%(+5.31)#98 | 5.3%(+5.63)#2,093 |
| 99. | 44504 | 10.9% | 5.6%(+5.28)#99 | 5.3%(+5.60)#2,115 |
| 100. | 43609 | 10.8% | 5.6%(+5.22)#100 | 5.3%(+5.54)#2,143 |
Common Questions
What are the Top 10 Zip Codes with the Highest Percentage of Population Employed in Food Preparation & Serving in Ohio?
Top 10 Zip Codes with the Highest Percentage of Population Employed in Food Preparation & Serving in Ohio are:
What zip code has the Highest Percentage of Population Employed in Food Preparation & Serving in Ohio?
45435 has the Highest Percentage of Population Employed in Food Preparation & Serving in Ohio with 55.2%.
What is the Percentage of Population Employed in Food Preparation & Serving in the State of Ohio?
Percentage of Population Employed in Food Preparation & Serving in Ohio is 5.6%.
What is the Percentage of Population Employed in Food Preparation & Serving in the United States?
Percentage of Population Employed in Food Preparation & Serving in the United States is 5.3%.