Zip Codes with the Highest Percentage of Population Employed in Food Preparation & Serving in Arkansas
RELATED REPORTS & OPTIONS
Food Preparation & Serving
Arkansas
Compare Zip Codes
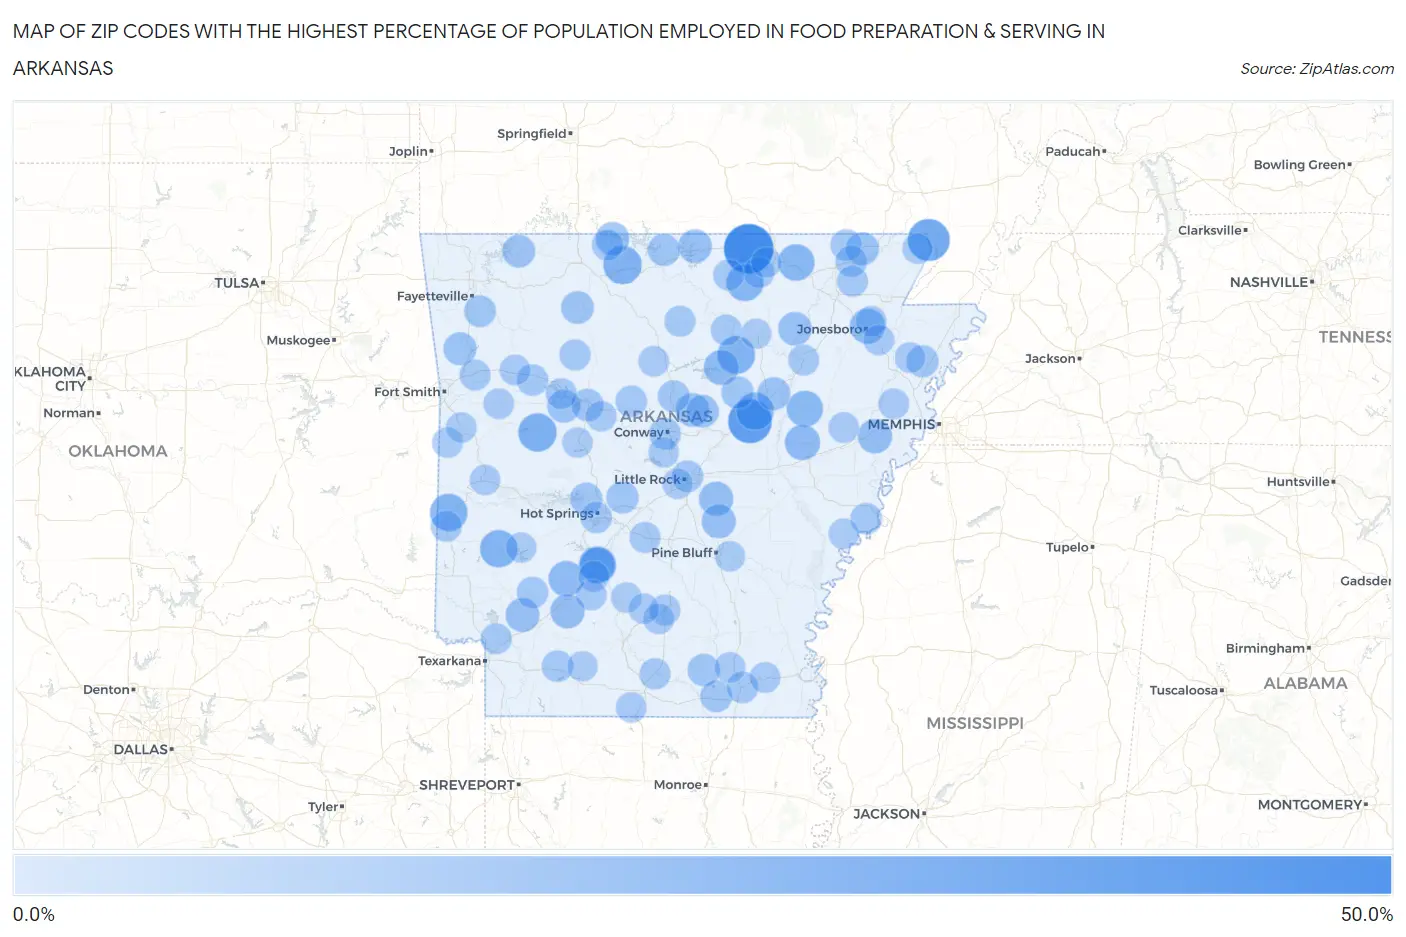
Map of Zip Codes with the Highest Percentage of Population Employed in Food Preparation & Serving in Arkansas
0.0%
50.0%
Zip Codes with the Highest Percentage of Population Employed in Food Preparation & Serving in Arkansas
| Zip Code | % Employed | vs State | vs National | |
| 1. | 72520 | 50.0% | 5.4%(+44.6)#1 | 5.3%(+44.7)#54 |
| 2. | 72068 | 37.2% | 5.4%(+31.8)#2 | 5.3%(+31.9)#129 |
| 3. | 72464 | 33.3% | 5.4%(+28.0)#3 | 5.3%(+28.0)#171 |
| 4. | 72842 | 25.3% | 5.4%(+20.0)#4 | 5.3%(+20.0)#305 |
| 5. | 72672 | 25.2% | 5.4%(+19.9)#5 | 5.3%(+19.9)#308 |
| 6. | 72523 | 23.7% | 5.4%(+18.4)#6 | 5.3%(+18.4)#354 |
| 7. | 71945 | 23.6% | 5.4%(+18.2)#7 | 5.3%(+18.3)#360 |
| 8. | 71959 | 23.4% | 5.4%(+18.1)#8 | 5.3%(+18.2)#369 |
| 9. | 71999 | 23.4% | 5.4%(+18.1)#9 | 5.3%(+18.1)#370 |
| 10. | 72082 | 23.2% | 5.4%(+17.9)#10 | 5.3%(+18.0)#377 |
| 11. | 72536 | 22.6% | 5.4%(+17.3)#11 | 5.3%(+17.4)#393 |
| 12. | 72459 | 21.4% | 5.4%(+16.1)#12 | 5.3%(+16.2)#439 |
| 13. | 72123 | 20.5% | 5.4%(+15.1)#13 | 5.3%(+15.2)#479 |
| 14. | 71962 | 19.1% | 5.4%(+13.7)#14 | 5.3%(+13.8)#558 |
| 15. | 72036 | 18.7% | 5.4%(+13.4)#15 | 5.3%(+13.4)#592 |
| 16. | 71998 | 18.6% | 5.4%(+13.2)#16 | 5.3%(+13.3)#606 |
| 17. | 72467 | 18.4% | 5.4%(+13.1)#17 | 5.3%(+13.2)#614 |
| 18. | 72581 | 17.8% | 5.4%(+12.4)#18 | 5.3%(+12.5)#674 |
| 19. | 72394 | 16.7% | 5.4%(+11.3)#19 | 5.3%(+11.4)#778 |
| 20. | 71857 | 16.5% | 5.4%(+11.2)#20 | 5.3%(+11.2)#795 |
| 21. | 72083 | 16.3% | 5.4%(+11.0)#21 | 5.3%(+11.0)#818 |
| 22. | 72168 | 16.0% | 5.4%(+10.6)#22 | 5.3%(+10.7)#869 |
| 23. | 71862 | 15.7% | 5.4%(+10.4)#23 | 5.3%(+10.5)#888 |
| 24. | 72047 | 15.3% | 5.4%(+9.94)#24 | 5.3%(+10.0)#944 |
| 25. | 72544 | 15.3% | 5.4%(+9.89)#25 | 5.3%(+9.97)#949 |
| 26. | 72524 | 15.1% | 5.4%(+9.71)#26 | 5.3%(+9.78)#972 |
| 27. | 72630 | 14.7% | 5.4%(+9.35)#27 | 5.3%(+9.42)#1,030 |
| 28. | 72139 | 14.3% | 5.4%(+8.93)#28 | 5.3%(+9.00)#1,101 |
| 29. | 72835 | 13.9% | 5.4%(+8.50)#29 | 5.3%(+8.57)#1,193 |
| 30. | 72934 | 13.8% | 5.4%(+8.41)#30 | 5.3%(+8.48)#1,217 |
| 31. | 72424 | 13.6% | 5.4%(+8.28)#31 | 5.3%(+8.35)#1,249 |
| 32. | 72632 | 13.5% | 5.4%(+8.12)#32 | 5.3%(+8.19)#1,285 |
| 33. | 72641 | 13.4% | 5.4%(+8.01)#33 | 5.3%(+8.08)#1,297 |
| 34. | 72111 | 13.3% | 5.4%(+7.89)#34 | 5.3%(+7.96)#1,328 |
| 35. | 72801 | 12.5% | 5.4%(+7.16)#35 | 5.3%(+7.23)#1,508 |
| 36. | 72085 | 12.5% | 5.4%(+7.14)#36 | 5.3%(+7.21)#1,519 |
| 37. | 71647 | 12.5% | 5.4%(+7.09)#37 | 5.3%(+7.17)#1,531 |
| 38. | 71956 | 12.1% | 5.4%(+6.76)#38 | 5.3%(+6.84)#1,623 |
| 39. | 72651 | 12.1% | 5.4%(+6.69)#39 | 5.3%(+6.77)#1,644 |
| 40. | 72087 | 12.0% | 5.4%(+6.65)#40 | 5.3%(+6.72)#1,659 |
| 41. | 72330 | 11.9% | 5.4%(+6.49)#41 | 5.3%(+6.57)#1,718 |
| 42. | 71635 | 11.5% | 5.4%(+6.10)#42 | 5.3%(+6.17)#1,856 |
| 43. | 72039 | 11.4% | 5.4%(+6.04)#43 | 5.3%(+6.11)#1,879 |
| 44. | 72701 | 11.4% | 5.4%(+6.00)#44 | 5.3%(+6.07)#1,895 |
| 45. | 72035 | 11.3% | 5.4%(+5.89)#45 | 5.3%(+5.96)#1,936 |
| 46. | 71847 | 10.9% | 5.4%(+5.55)#46 | 5.3%(+5.62)#2,097 |
| 47. | 71827 | 10.8% | 5.4%(+5.41)#47 | 5.3%(+5.49)#2,167 |
| 48. | 71646 | 10.7% | 5.4%(+5.31)#48 | 5.3%(+5.39)#2,218 |
| 49. | 72114 | 10.7% | 5.4%(+5.29)#49 | 5.3%(+5.37)#2,232 |
| 50. | 72342 | 10.6% | 5.4%(+5.27)#50 | 5.3%(+5.35)#2,244 |
| 51. | 72063 | 10.6% | 5.4%(+5.23)#51 | 5.3%(+5.30)#2,268 |
| 52. | 71913 | 10.6% | 5.4%(+5.22)#52 | 5.3%(+5.30)#2,281 |
| 53. | 72840 | 10.5% | 5.4%(+5.19)#53 | 5.3%(+5.26)#2,302 |
| 54. | 72444 | 10.3% | 5.4%(+4.98)#54 | 5.3%(+5.05)#2,402 |
| 55. | 72413 | 10.2% | 5.4%(+4.82)#55 | 5.3%(+4.89)#2,500 |
| 56. | 71724 | 9.9% | 5.4%(+4.57)#56 | 5.3%(+4.64)#2,685 |
| 57. | 72839 | 9.9% | 5.4%(+4.52)#57 | 5.3%(+4.60)#2,726 |
| 58. | 72513 | 9.9% | 5.4%(+4.50)#58 | 5.3%(+4.57)#2,745 |
| 59. | 72680 | 9.8% | 5.4%(+4.47)#59 | 5.3%(+4.55)#2,769 |
| 60. | 72644 | 9.8% | 5.4%(+4.43)#60 | 5.3%(+4.50)#2,807 |
| 61. | 71853 | 9.8% | 5.4%(+4.40)#61 | 5.3%(+4.47)#2,839 |
| 62. | 72565 | 9.7% | 5.4%(+4.36)#62 | 5.3%(+4.44)#2,864 |
| 63. | 71937 | 9.6% | 5.4%(+4.24)#63 | 5.3%(+4.31)#2,975 |
| 64. | 72128 | 9.6% | 5.4%(+4.23)#64 | 5.3%(+4.30)#2,986 |
| 65. | 72935 | 9.6% | 5.4%(+4.23)#65 | 5.3%(+4.30)#2,987 |
| 66. | 72845 | 9.5% | 5.4%(+4.16)#66 | 5.3%(+4.24)#3,033 |
| 67. | 72449 | 9.5% | 5.4%(+4.16)#67 | 5.3%(+4.24)#3,038 |
| 68. | 72567 | 9.5% | 5.4%(+4.10)#68 | 5.3%(+4.17)#3,090 |
| 69. | 72112 | 9.4% | 5.4%(+4.05)#69 | 5.3%(+4.13)#3,125 |
| 70. | 71742 | 9.3% | 5.4%(+3.93)#70 | 5.3%(+4.00)#3,245 |
| 71. | 71658 | 9.2% | 5.4%(+3.86)#71 | 5.3%(+3.93)#3,303 |
| 72. | 71923 | 9.1% | 5.4%(+3.79)#72 | 5.3%(+3.86)#3,371 |
| 73. | 71743 | 9.1% | 5.4%(+3.76)#73 | 5.3%(+3.83)#3,396 |
| 74. | 72928 | 9.1% | 5.4%(+3.73)#74 | 5.3%(+3.80)#3,428 |
| 75. | 71766 | 9.1% | 5.4%(+3.69)#75 | 5.3%(+3.77)#3,469 |
| 76. | 72949 | 9.0% | 5.4%(+3.60)#76 | 5.3%(+3.68)#3,561 |
| 77. | 72331 | 8.9% | 5.4%(+3.59)#77 | 5.3%(+3.66)#3,576 |
| 78. | 72401 | 8.9% | 5.4%(+3.55)#78 | 5.3%(+3.62)#3,611 |
| 79. | 71642 | 8.8% | 5.4%(+3.48)#79 | 5.3%(+3.56)#3,670 |
| 80. | 71749 | 8.8% | 5.4%(+3.47)#80 | 5.3%(+3.54)#3,686 |
| 81. | 72326 | 8.8% | 5.4%(+3.46)#81 | 5.3%(+3.53)#3,711 |
| 82. | 72938 | 8.8% | 5.4%(+3.45)#82 | 5.3%(+3.52)#3,724 |
| 83. | 72858 | 8.8% | 5.4%(+3.42)#83 | 5.3%(+3.49)#3,750 |
| 84. | 72031 | 8.8% | 5.4%(+3.42)#84 | 5.3%(+3.49)#3,751 |
| 85. | 72411 | 8.8% | 5.4%(+3.40)#85 | 5.3%(+3.47)#3,774 |
| 86. | 72926 | 8.7% | 5.4%(+3.32)#86 | 5.3%(+3.39)#3,882 |
| 87. | 72940 | 8.7% | 5.4%(+3.31)#87 | 5.3%(+3.39)#3,888 |
| 88. | 72354 | 8.6% | 5.4%(+3.24)#88 | 5.3%(+3.31)#3,974 |
| 89. | 72853 | 8.5% | 5.4%(+3.19)#89 | 5.3%(+3.26)#4,029 |
| 90. | 71763 | 8.5% | 5.4%(+3.12)#90 | 5.3%(+3.19)#4,092 |
| 91. | 72204 | 8.5% | 5.4%(+3.12)#91 | 5.3%(+3.19)#4,094 |
| 92. | 71950 | 8.4% | 5.4%(+3.03)#92 | 5.3%(+3.10)#4,190 |
| 93. | 72389 | 8.4% | 5.4%(+3.03)#93 | 5.3%(+3.10)#4,194 |
| 94. | 71720 | 8.3% | 5.4%(+2.97)#94 | 5.3%(+3.05)#4,253 |
| 95. | 72454 | 8.3% | 5.4%(+2.97)#95 | 5.3%(+3.04)#4,282 |
| 96. | 72106 | 8.3% | 5.4%(+2.90)#96 | 5.3%(+2.97)#4,366 |
| 97. | 71601 | 8.2% | 5.4%(+2.83)#97 | 5.3%(+2.90)#4,453 |
| 98. | 72529 | 8.2% | 5.4%(+2.79)#98 | 5.3%(+2.87)#4,507 |
| 99. | 71752 | 8.2% | 5.4%(+2.79)#99 | 5.3%(+2.87)#4,509 |
| 100. | 72501 | 8.1% | 5.4%(+2.77)#100 | 5.3%(+2.84)#4,542 |
Common Questions
What are the Top 10 Zip Codes with the Highest Percentage of Population Employed in Food Preparation & Serving in Arkansas?
Top 10 Zip Codes with the Highest Percentage of Population Employed in Food Preparation & Serving in Arkansas are:
What zip code has the Highest Percentage of Population Employed in Food Preparation & Serving in Arkansas?
72520 has the Highest Percentage of Population Employed in Food Preparation & Serving in Arkansas with 50.0%.
What is the Percentage of Population Employed in Food Preparation & Serving in the State of Arkansas?
Percentage of Population Employed in Food Preparation & Serving in Arkansas is 5.4%.
What is the Percentage of Population Employed in Food Preparation & Serving in the United States?
Percentage of Population Employed in Food Preparation & Serving in the United States is 5.3%.