Zip Codes with the Highest Percentage of Population Employed in Professional & Scientific Services in the United States
RELATED REPORTS & OPTIONS
Professional & Scientific Services
United States
Compare Zip Codes
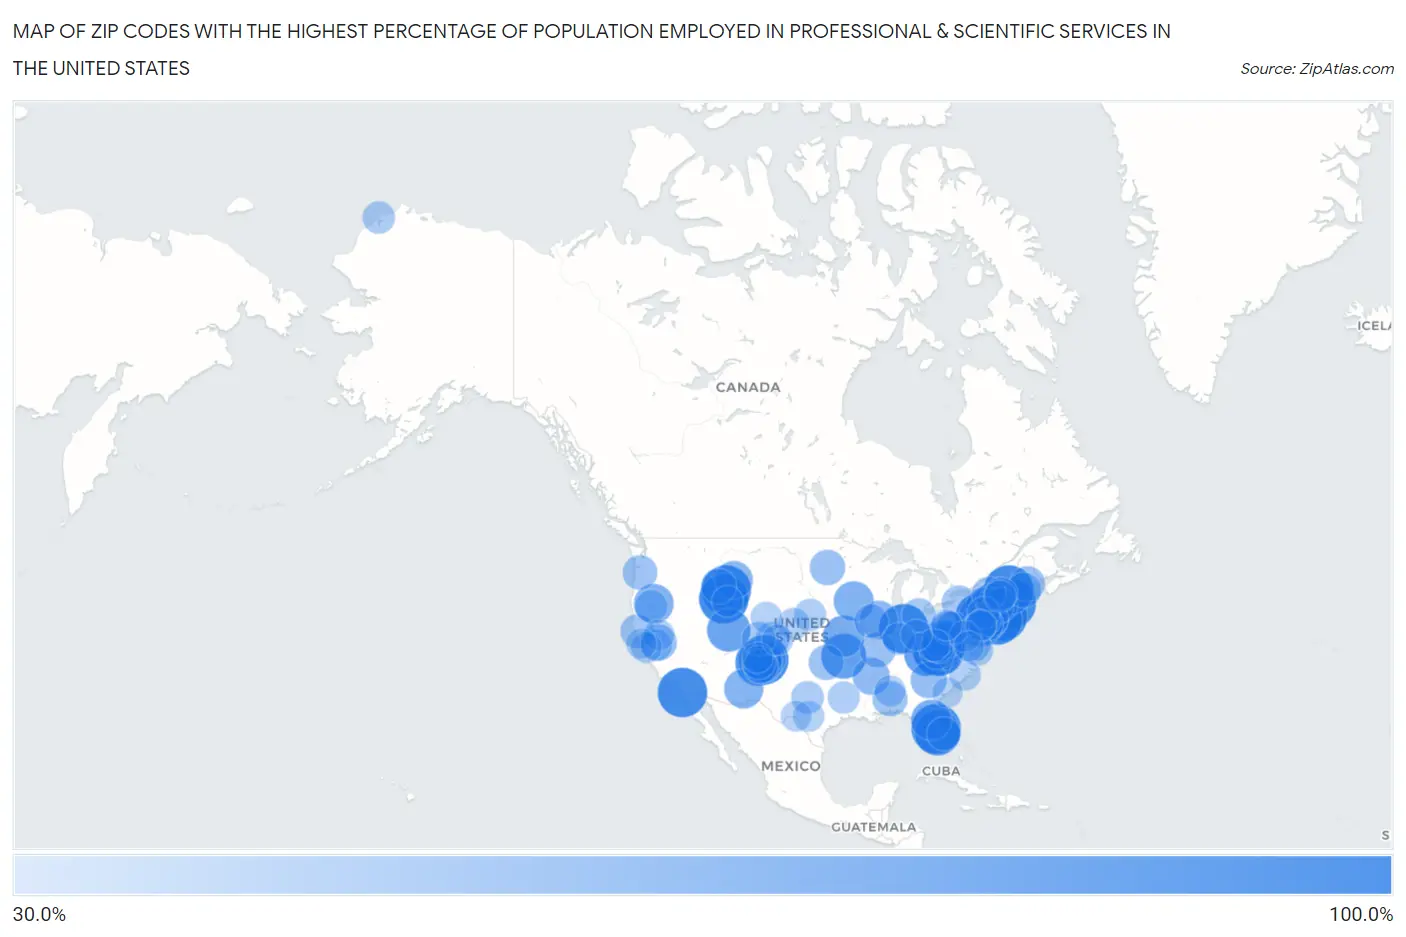
Map of Zip Codes with the Highest Percentage of Population Employed in Professional & Scientific Services in the United States
30.0%
100.0%
Zip Codes with the Highest Percentage of Population Employed in Professional & Scientific Services in the United States
| Zip Code | % Employed | vs State | vs National | |
| 1. | 33858 | 100.0% | 7.7%(+92.3)#1 | 7.8%(+92.2)#1 |
| 2. | 87517 | 100.0% | 8.1%(+91.9)#1 | 7.8%(+92.2)#2 |
| 3. | 92155 | 100.0% | 9.4%(+90.6)#1 | 7.8%(+92.2)#3 |
| 4. | 18349 | 100.0% | 7.1%(+92.9)#1 | 7.8%(+92.2)#4 |
| 5. | 01937 | 100.0% | 11.5%(+88.5)#1 | 7.8%(+92.2)#5 |
| 6. | 46290 | 100.0% | 5.1%(+94.9)#1 | 7.8%(+92.2)#7 |
| 7. | 83424 | 100.0% | 6.2%(+93.8)#1 | 7.8%(+92.2)#8 |
| 8. | 25870 | 100.0% | 4.8%(+95.2)#1 | 7.8%(+92.2)#9 |
| 9. | 24729 | 100.0% | 4.8%(+95.2)#2 | 7.8%(+92.2)#10 |
| 10. | 06376 | 100.0% | 7.7%(+92.3)#1 | 7.8%(+92.2)#11 |
| 11. | 11973 | 100.0% | 8.8%(+91.2)#1 | 7.8%(+92.2)#12 |
| 12. | 83285 | 100.0% | 6.2%(+93.8)#2 | 7.8%(+92.2)#13 |
| 13. | 07881 | 100.0% | 9.9%(+90.1)#1 | 7.8%(+92.2)#14 |
| 14. | 03897 | 100.0% | 8.0%(+92.0)#1 | 7.8%(+92.2)#15 |
| 15. | 25936 | 100.0% | 4.8%(+95.2)#3 | 7.8%(+92.2)#16 |
| 16. | 87064 | 90.9% | 8.1%(+82.8)#2 | 7.8%(+83.1)#17 |
| 17. | 33856 | 88.0% | 7.7%(+80.3)#2 | 7.8%(+80.2)#18 |
| 18. | 64858 | 85.0% | 6.3%(+78.7)#1 | 7.8%(+77.1)#19 |
| 19. | 41845 | 83.0% | 4.9%(+78.1)#1 | 7.8%(+75.2)#20 |
| 20. | 12115 | 80.5% | 8.8%(+71.7)#2 | 7.8%(+72.6)#21 |
| 21. | 84529 | 79.7% | 8.4%(+71.3)#1 | 7.8%(+71.9)#22 |
| 22. | 18927 | 77.3% | 7.1%(+70.2)#2 | 7.8%(+69.5)#23 |
| 23. | 64101 | 73.8% | 6.3%(+67.6)#2 | 7.8%(+66.0)#24 |
| 24. | 12441 | 71.8% | 8.8%(+63.0)#3 | 7.8%(+63.9)#25 |
| 25. | 32681 | 70.3% | 7.7%(+62.6)#3 | 7.8%(+62.4)#26 |
| 26. | 50427 | 69.1% | 4.4%(+64.7)#1 | 7.8%(+61.3)#27 |
| 27. | 97621 | 68.2% | 7.7%(+60.5)#1 | 7.8%(+60.3)#28 |
| 28. | 88025 | 66.7% | 8.1%(+58.5)#3 | 7.8%(+58.8)#29 |
| 29. | 87525 | 64.4% | 8.1%(+56.3)#4 | 7.8%(+56.6)#30 |
| 30. | 61552 | 63.3% | 8.3%(+55.0)#1 | 7.8%(+55.5)#31 |
| 31. | 59081 | 62.7% | 6.1%(+56.6)#1 | 7.8%(+54.9)#32 |
| 32. | 25036 | 61.4% | 4.8%(+56.6)#4 | 7.8%(+53.6)#33 |
| 33. | 26259 | 60.0% | 4.8%(+55.2)#5 | 7.8%(+52.2)#34 |
| 34. | 72352 | 60.0% | 4.4%(+55.6)#1 | 7.8%(+52.2)#35 |
| 35. | 87578 | 58.1% | 8.1%(+50.0)#5 | 7.8%(+50.3)#36 |
| 36. | 01229 | 58.0% | 11.5%(+46.5)#2 | 7.8%(+50.2)#37 |
| 37. | 20688 | 57.4% | 11.8%(+45.6)#1 | 7.8%(+49.5)#38 |
| 38. | 29659 | 57.1% | 6.0%(+51.2)#1 | 7.8%(+49.3)#39 |
| 39. | 95232 | 56.5% | 9.4%(+47.1)#2 | 7.8%(+48.7)#40 |
| 40. | 24719 | 56.1% | 4.8%(+51.3)#6 | 7.8%(+48.3)#41 |
| 41. | 63743 | 54.5% | 6.3%(+48.3)#3 | 7.8%(+46.7)#42 |
| 42. | 58074 | 54.3% | 4.5%(+49.7)#1 | 7.8%(+46.4)#43 |
| 43. | 01066 | 53.8% | 11.5%(+42.4)#3 | 7.8%(+46.0)#44 |
| 44. | 83446 | 53.8% | 6.2%(+47.6)#3 | 7.8%(+46.0)#45 |
| 45. | 74078 | 53.5% | 5.3%(+48.2)#1 | 7.8%(+45.7)#46 |
| 46. | 04431 | 53.3% | 6.3%(+47.0)#1 | 7.8%(+45.5)#47 |
| 47. | 36727 | 53.2% | 5.8%(+47.4)#1 | 7.8%(+45.3)#48 |
| 48. | 04855 | 53.1% | 6.3%(+46.8)#2 | 7.8%(+45.3)#49 |
| 49. | 87580 | 52.5% | 8.1%(+44.3)#6 | 7.8%(+44.6)#50 |
| 50. | 15421 | 52.1% | 7.1%(+45.0)#3 | 7.8%(+44.2)#51 |
| 51. | 97125 | 51.7% | 7.7%(+44.1)#2 | 7.8%(+43.9)#52 |
| 52. | 87544 | 51.5% | 8.1%(+43.3)#7 | 7.8%(+43.6)#53 |
| 53. | 10503 | 51.1% | 8.8%(+42.3)#4 | 7.8%(+43.3)#54 |
| 54. | 95417 | 50.7% | 9.4%(+41.3)#3 | 7.8%(+42.9)#55 |
| 55. | 87547 | 50.6% | 8.1%(+42.5)#8 | 7.8%(+42.8)#56 |
| 56. | 61478 | 50.0% | 8.3%(+41.7)#2 | 7.8%(+42.2)#57 |
| 57. | 08528 | 50.0% | 9.9%(+40.1)#2 | 7.8%(+42.2)#58 |
| 58. | 80929 | 50.0% | 10.6%(+39.4)#1 | 7.8%(+42.2)#59 |
| 59. | 07870 | 50.0% | 9.9%(+40.1)#3 | 7.8%(+42.2)#60 |
| 60. | 14083 | 50.0% | 8.8%(+41.2)#5 | 7.8%(+42.2)#61 |
| 61. | 12856 | 49.3% | 8.8%(+40.4)#6 | 7.8%(+41.4)#62 |
| 62. | 43523 | 48.8% | 6.1%(+42.8)#1 | 7.8%(+41.0)#63 |
| 63. | 81210 | 48.7% | 10.6%(+38.1)#2 | 7.8%(+40.8)#64 |
| 64. | 32970 | 48.1% | 7.7%(+40.4)#4 | 7.8%(+40.3)#65 |
| 65. | 87516 | 47.8% | 8.1%(+39.6)#9 | 7.8%(+39.9)#66 |
| 66. | 25251 | 47.1% | 4.8%(+42.3)#7 | 7.8%(+39.2)#67 |
| 67. | 15450 | 46.2% | 7.1%(+39.1)#4 | 7.8%(+38.4)#68 |
| 68. | 79519 | 45.8% | 7.6%(+38.2)#1 | 7.8%(+38.0)#69 |
| 69. | 97625 | 45.7% | 7.7%(+38.0)#3 | 7.8%(+37.8)#70 |
| 70. | 05073 | 45.5% | 6.3%(+39.2)#1 | 7.8%(+37.6)#71 |
| 71. | 15502 | 45.3% | 7.1%(+38.2)#5 | 7.8%(+37.4)#72 |
| 72. | 99782 | 45.1% | 5.4%(+39.7)#1 | 7.8%(+37.3)#73 |
| 73. | 25060 | 45.1% | 4.8%(+40.3)#8 | 7.8%(+37.3)#74 |
| 74. | 25565 | 45.0% | 4.8%(+40.2)#9 | 7.8%(+37.2)#75 |
| 75. | 47522 | 44.6% | 5.1%(+39.4)#2 | 7.8%(+36.7)#76 |
| 76. | 68881 | 44.0% | 5.7%(+38.3)#1 | 7.8%(+36.2)#77 |
| 77. | 75669 | 43.9% | 7.6%(+36.3)#2 | 7.8%(+36.1)#78 |
| 78. | 12720 | 43.6% | 8.8%(+34.8)#7 | 7.8%(+35.8)#79 |
| 79. | 95254 | 43.4% | 9.4%(+34.0)#4 | 7.8%(+35.5)#80 |
| 80. | 05150 | 43.2% | 6.3%(+36.9)#2 | 7.8%(+35.3)#81 |
| 81. | 69027 | 42.9% | 5.7%(+37.1)#2 | 7.8%(+35.0)#82 |
| 82. | 23423 | 42.2% | 12.2%(+30.0)#1 | 7.8%(+34.4)#83 |
| 83. | 28542 | 42.0% | 7.5%(+34.4)#1 | 7.8%(+34.1)#84 |
| 84. | 19490 | 41.7% | 7.1%(+34.6)#6 | 7.8%(+33.9)#85 |
| 85. | 95715 | 41.5% | 9.4%(+32.1)#5 | 7.8%(+33.7)#86 |
| 86. | 35443 | 41.3% | 5.8%(+35.5)#2 | 7.8%(+33.5)#87 |
| 87. | 20129 | 41.3% | 12.2%(+29.1)#2 | 7.8%(+33.5)#88 |
| 88. | 82073 | 41.0% | 4.4%(+36.7)#1 | 7.8%(+33.2)#89 |
| 89. | 45147 | 40.9% | 6.1%(+34.9)#2 | 7.8%(+33.1)#90 |
| 90. | 15363 | 40.8% | 7.1%(+33.6)#7 | 7.8%(+32.9)#91 |
| 91. | 94105 | 40.7% | 9.4%(+31.3)#6 | 7.8%(+32.9)#92 |
| 92. | 83111 | 40.7% | 4.4%(+36.3)#2 | 7.8%(+32.9)#93 |
| 93. | 78885 | 40.5% | 7.6%(+32.9)#3 | 7.8%(+32.6)#94 |
| 94. | 80833 | 40.4% | 10.6%(+29.8)#3 | 7.8%(+32.6)#95 |
| 95. | 78837 | 40.0% | 7.6%(+32.4)#4 | 7.8%(+32.2)#96 |
| 96. | 87551 | 39.4% | 8.1%(+31.3)#10 | 7.8%(+31.5)#97 |
| 97. | 18932 | 39.4% | 7.1%(+32.3)#8 | 7.8%(+31.5)#98 |
| 98. | 29439 | 39.1% | 6.0%(+33.2)#2 | 7.8%(+31.3)#99 |
| 99. | 94929 | 38.9% | 9.4%(+29.5)#7 | 7.8%(+31.0)#100 |
| 100. | 22476 | 38.5% | 12.2%(+26.3)#3 | 7.8%(+30.6)#101 |
Common Questions
What are the Top 10 Zip Codes with the Highest Percentage of Population Employed in Professional & Scientific Services in the United States?
Top 10 Zip Codes with the Highest Percentage of Population Employed in Professional & Scientific Services in the United States are:
#1
100.0%
#2
100.0%
#3
100.0%
#4
100.0%
#5
100.0%
#6
100.0%
#7
100.0%
#8
100.0%
#9
100.0%
#10
100.0%
What zip code has the Highest Percentage of Population Employed in Professional & Scientific Services in the United States?
33858 has the Highest Percentage of Population Employed in Professional & Scientific Services in the United States with 100.0%.
What is the Percentage of Population Employed in Professional & Scientific Services in the United States?
Percentage of Population Employed in Professional & Scientific Services in the United States is 7.8%.