Zip Codes with the Highest Percentage of Population Employed in Food Preparation & Serving in Nevada
RELATED REPORTS & OPTIONS
Food Preparation & Serving
Nevada
Compare Zip Codes
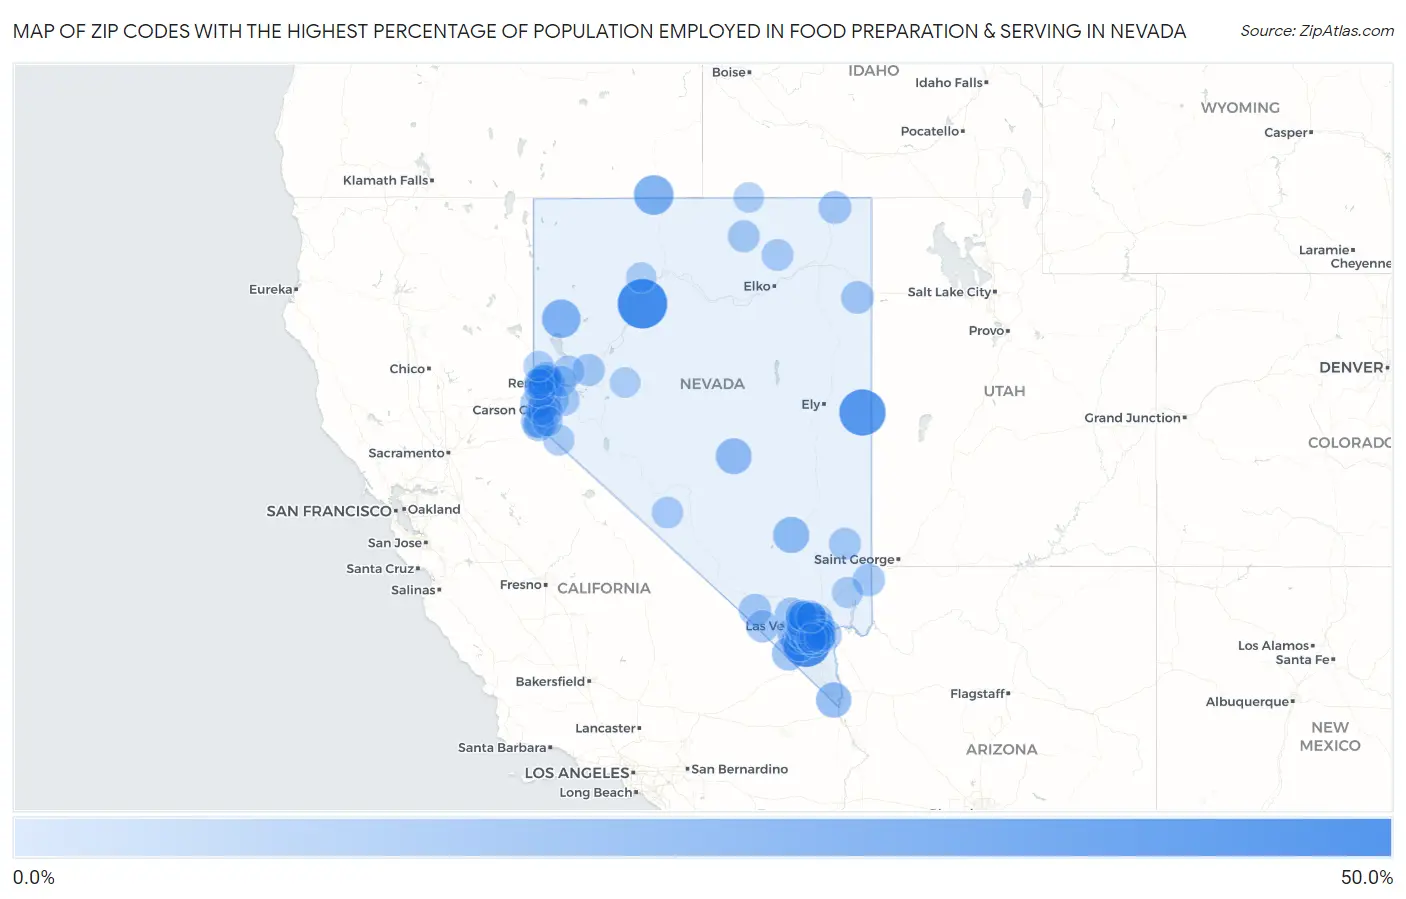
Map of Zip Codes with the Highest Percentage of Population Employed in Food Preparation & Serving in Nevada
0.0%
50.0%
Zip Codes with the Highest Percentage of Population Employed in Food Preparation & Serving in Nevada
| Zip Code | % Employed | vs State | vs National | |
| 1. | 89418 | 50.0% | 8.6%(+41.4)#1 | 5.3%(+44.7)#57 |
| 2. | 89054 | 48.3% | 8.6%(+39.6)#2 | 5.3%(+43.0)#64 |
| 3. | 89311 | 42.2% | 8.6%(+33.5)#3 | 5.3%(+36.9)#92 |
| 4. | 89421 | 26.2% | 8.6%(+17.6)#4 | 5.3%(+21.0)#279 |
| 5. | 89405 | 23.5% | 8.6%(+14.8)#5 | 5.3%(+18.2)#368 |
| 6. | 89158 | 18.8% | 8.6%(+10.1)#6 | 5.3%(+13.5)#585 |
| 7. | 89001 | 17.9% | 8.6%(+9.25)#7 | 5.3%(+12.6)#673 |
| 8. | 89049 | 17.4% | 8.6%(+8.78)#8 | 5.3%(+12.1)#712 |
| 9. | 89103 | 16.1% | 8.6%(+7.41)#9 | 5.3%(+10.8)#860 |
| 10. | 89029 | 16.0% | 8.6%(+7.36)#10 | 5.3%(+10.7)#863 |
| 11. | 89119 | 15.3% | 8.6%(+6.70)#11 | 5.3%(+10.1)#939 |
| 12. | 89147 | 15.3% | 8.6%(+6.69)#12 | 5.3%(+10.0)#940 |
| 13. | 89004 | 15.3% | 8.6%(+6.64)#13 | 5.3%(+9.99)#948 |
| 14. | 89557 | 14.9% | 8.6%(+6.24)#14 | 5.3%(+9.60)#1,000 |
| 15. | 89106 | 14.0% | 8.6%(+5.33)#15 | 5.3%(+8.68)#1,169 |
| 16. | 89104 | 14.0% | 8.6%(+5.32)#16 | 5.3%(+8.67)#1,172 |
| 17. | 89120 | 13.7% | 8.6%(+5.07)#17 | 5.3%(+8.43)#1,229 |
| 18. | 89169 | 13.1% | 8.6%(+4.41)#18 | 5.3%(+7.77)#1,380 |
| 19. | 89102 | 12.8% | 8.6%(+4.11)#19 | 5.3%(+7.47)#1,449 |
| 20. | 89108 | 12.5% | 8.6%(+3.83)#20 | 5.3%(+7.19)#1,527 |
| 21. | 89019 | 12.5% | 8.6%(+3.83)#21 | 5.3%(+7.19)#1,528 |
| 22. | 89146 | 12.2% | 8.6%(+3.58)#22 | 5.3%(+6.94)#1,589 |
| 23. | 89121 | 12.0% | 8.6%(+3.39)#23 | 5.3%(+6.75)#1,651 |
| 24. | 89110 | 12.0% | 8.6%(+3.32)#24 | 5.3%(+6.67)#1,683 |
| 25. | 89107 | 11.9% | 8.6%(+3.23)#25 | 5.3%(+6.59)#1,710 |
| 26. | 89411 | 11.6% | 8.6%(+2.99)#26 | 5.3%(+6.35)#1,804 |
| 27. | 89139 | 11.5% | 8.6%(+2.84)#27 | 5.3%(+6.19)#1,849 |
| 28. | 89183 | 11.4% | 8.6%(+2.72)#28 | 5.3%(+6.08)#1,894 |
| 29. | 89178 | 11.3% | 8.6%(+2.63)#29 | 5.3%(+5.98)#1,928 |
| 30. | 89101 | 11.1% | 8.6%(+2.51)#30 | 5.3%(+5.86)#1,983 |
| 31. | 89122 | 10.9% | 8.6%(+2.24)#31 | 5.3%(+5.59)#2,118 |
| 32. | 89179 | 10.8% | 8.6%(+2.17)#32 | 5.3%(+5.52)#2,153 |
| 33. | 89448 | 10.7% | 8.6%(+2.10)#33 | 5.3%(+5.46)#2,183 |
| 34. | 89130 | 10.6% | 8.6%(+2.00)#34 | 5.3%(+5.35)#2,236 |
| 35. | 89142 | 10.4% | 8.6%(+1.78)#35 | 5.3%(+5.14)#2,361 |
| 36. | 89109 | 10.4% | 8.6%(+1.78)#36 | 5.3%(+5.13)#2,364 |
| 37. | 89118 | 10.4% | 8.6%(+1.72)#37 | 5.3%(+5.07)#2,395 |
| 38. | 89115 | 10.3% | 8.6%(+1.68)#38 | 5.3%(+5.04)#2,407 |
| 39. | 89825 | 10.3% | 8.6%(+1.61)#39 | 5.3%(+4.97)#2,452 |
| 40. | 89113 | 10.0% | 8.6%(+1.39)#40 | 5.3%(+4.75)#2,604 |
| 41. | 89883 | 9.9% | 8.6%(+1.28)#41 | 5.3%(+4.64)#2,689 |
| 42. | 89030 | 9.6% | 8.6%(+0.993)#42 | 5.3%(+4.35)#2,941 |
| 43. | 89166 | 9.6% | 8.6%(+0.949)#43 | 5.3%(+4.30)#2,984 |
| 44. | 89032 | 9.5% | 8.6%(+0.871)#44 | 5.3%(+4.23)#3,046 |
| 45. | 89502 | 9.5% | 8.6%(+0.817)#45 | 5.3%(+4.17)#3,092 |
| 46. | 89027 | 9.4% | 8.6%(+0.729)#46 | 5.3%(+4.08)#3,167 |
| 47. | 89074 | 9.4% | 8.6%(+0.711)#47 | 5.3%(+4.07)#3,186 |
| 48. | 89512 | 9.3% | 8.6%(+0.702)#48 | 5.3%(+4.06)#3,194 |
| 49. | 89503 | 9.3% | 8.6%(+0.622)#49 | 5.3%(+3.98)#3,268 |
| 50. | 89060 | 9.2% | 8.6%(+0.604)#50 | 5.3%(+3.96)#3,282 |
| 51. | 89148 | 9.2% | 8.6%(+0.596)#51 | 5.3%(+3.95)#3,285 |
| 52. | 89048 | 9.1% | 8.6%(+0.487)#52 | 5.3%(+3.84)#3,386 |
| 53. | 89440 | 9.1% | 8.6%(+0.478)#53 | 5.3%(+3.83)#3,395 |
| 54. | 89081 | 9.1% | 8.6%(+0.434)#54 | 5.3%(+3.79)#3,448 |
| 55. | 89141 | 9.0% | 8.6%(+0.372)#55 | 5.3%(+3.73)#3,512 |
| 56. | 89123 | 9.0% | 8.6%(+0.368)#56 | 5.3%(+3.72)#3,520 |
| 57. | 89704 | 8.9% | 8.6%(+0.294)#57 | 5.3%(+3.65)#3,586 |
| 58. | 89449 | 8.7% | 8.6%(+0.034)#58 | 5.3%(+3.39)#3,886 |
| 59. | 89145 | 8.7% | 8.6%(+0.027)#59 | 5.3%(+3.38)#3,895 |
| 60. | 89408 | 8.5% | 8.6%(-0.144)#60 | 5.3%(+3.21)#4,078 |
| 61. | 89008 | 8.4% | 8.6%(-0.200)#61 | 5.3%(+3.16)#4,124 |
| 62. | 89431 | 8.4% | 8.6%(-0.288)#62 | 5.3%(+3.07)#4,233 |
| 63. | 89031 | 8.4% | 8.6%(-0.290)#63 | 5.3%(+3.07)#4,238 |
| 64. | 89014 | 8.3% | 8.6%(-0.301)#64 | 5.3%(+3.05)#4,247 |
| 65. | 89834 | 8.3% | 8.6%(-0.308)#65 | 5.3%(+3.05)#4,275 |
| 66. | 89128 | 8.3% | 8.6%(-0.310)#66 | 5.3%(+3.05)#4,279 |
| 67. | 89451 | 8.2% | 8.6%(-0.443)#67 | 5.3%(+2.91)#4,439 |
| 68. | 89156 | 8.0% | 8.6%(-0.633)#68 | 5.3%(+2.72)#4,712 |
| 69. | 89129 | 7.8% | 8.6%(-0.886)#69 | 5.3%(+2.47)#5,132 |
| 70. | 89084 | 7.5% | 8.6%(-1.10)#70 | 5.3%(+2.25)#5,486 |
| 71. | 89801 | 7.5% | 8.6%(-1.12)#71 | 5.3%(+2.24)#5,507 |
| 72. | 89403 | 7.5% | 8.6%(-1.12)#72 | 5.3%(+2.23)#5,524 |
| 73. | 89044 | 7.5% | 8.6%(-1.13)#73 | 5.3%(+2.22)#5,546 |
| 74. | 89501 | 7.4% | 8.6%(-1.22)#74 | 5.3%(+2.13)#5,708 |
| 75. | 89047 | 7.3% | 8.6%(-1.36)#75 | 5.3%(+2.00)#5,951 |
| 76. | 89149 | 7.2% | 8.6%(-1.47)#76 | 5.3%(+1.89)#6,186 |
| 77. | 89442 | 6.9% | 8.6%(-1.71)#77 | 5.3%(+1.64)#6,743 |
| 78. | 89117 | 6.9% | 8.6%(-1.77)#78 | 5.3%(+1.58)#6,889 |
| 79. | 89011 | 6.8% | 8.6%(-1.87)#79 | 5.3%(+1.49)#7,123 |
| 80. | 89410 | 6.5% | 8.6%(-2.13)#80 | 5.3%(+1.23)#7,844 |
| 81. | 89701 | 6.5% | 8.6%(-2.15)#81 | 5.3%(+1.21)#7,893 |
| 82. | 89005 | 6.5% | 8.6%(-2.17)#82 | 5.3%(+1.19)#7,944 |
| 83. | 89021 | 6.3% | 8.6%(-2.38)#83 | 5.3%(+0.975)#8,540 |
| 84. | 89433 | 6.2% | 8.6%(-2.40)#84 | 5.3%(+0.959)#8,604 |
| 85. | 89143 | 6.1% | 8.6%(-2.54)#85 | 5.3%(+0.812)#9,029 |
| 86. | 89015 | 6.0% | 8.6%(-2.60)#86 | 5.3%(+0.752)#9,216 |
| 87. | 89434 | 6.0% | 8.6%(-2.62)#87 | 5.3%(+0.740)#9,254 |
| 88. | 89012 | 6.0% | 8.6%(-2.66)#88 | 5.3%(+0.691)#9,422 |
| 89. | 89703 | 5.7% | 8.6%(-2.94)#89 | 5.3%(+0.418)#10,319 |
| 90. | 89002 | 5.5% | 8.6%(-3.15)#90 | 5.3%(+0.203)#11,103 |
| 91. | 89511 | 5.2% | 8.6%(-3.44)#91 | 5.3%(-0.087)#12,146 |
| 92. | 89523 | 5.1% | 8.6%(-3.57)#92 | 5.3%(-0.214)#12,645 |
| 93. | 89508 | 5.1% | 8.6%(-3.58)#93 | 5.3%(-0.224)#12,682 |
| 94. | 89131 | 5.0% | 8.6%(-3.62)#94 | 5.3%(-0.261)#12,843 |
| 95. | 89832 | 4.9% | 8.6%(-3.72)#95 | 5.3%(-0.368)#13,276 |
| 96. | 89406 | 4.8% | 8.6%(-3.81)#96 | 5.3%(-0.459)#13,651 |
| 97. | 89052 | 4.8% | 8.6%(-3.83)#97 | 5.3%(-0.474)#13,714 |
| 98. | 89423 | 4.7% | 8.6%(-3.98)#98 | 5.3%(-0.629)#14,341 |
| 99. | 89445 | 4.6% | 8.6%(-4.03)#99 | 5.3%(-0.679)#14,563 |
| 100. | 89086 | 4.6% | 8.6%(-4.04)#100 | 5.3%(-0.687)#14,603 |
1
2Common Questions
What are the Top 10 Zip Codes with the Highest Percentage of Population Employed in Food Preparation & Serving in Nevada?
Top 10 Zip Codes with the Highest Percentage of Population Employed in Food Preparation & Serving in Nevada are:
What zip code has the Highest Percentage of Population Employed in Food Preparation & Serving in Nevada?
89418 has the Highest Percentage of Population Employed in Food Preparation & Serving in Nevada with 50.0%.
What is the Percentage of Population Employed in Food Preparation & Serving in the State of Nevada?
Percentage of Population Employed in Food Preparation & Serving in Nevada is 8.6%.
What is the Percentage of Population Employed in Food Preparation & Serving in the United States?
Percentage of Population Employed in Food Preparation & Serving in the United States is 5.3%.