Zip Codes with the Highest Percentage of Population Employed in Cleaning & Maintenance in the United States
RELATED REPORTS & OPTIONS
Cleaning & Maintenance
United States
Compare Zip Codes
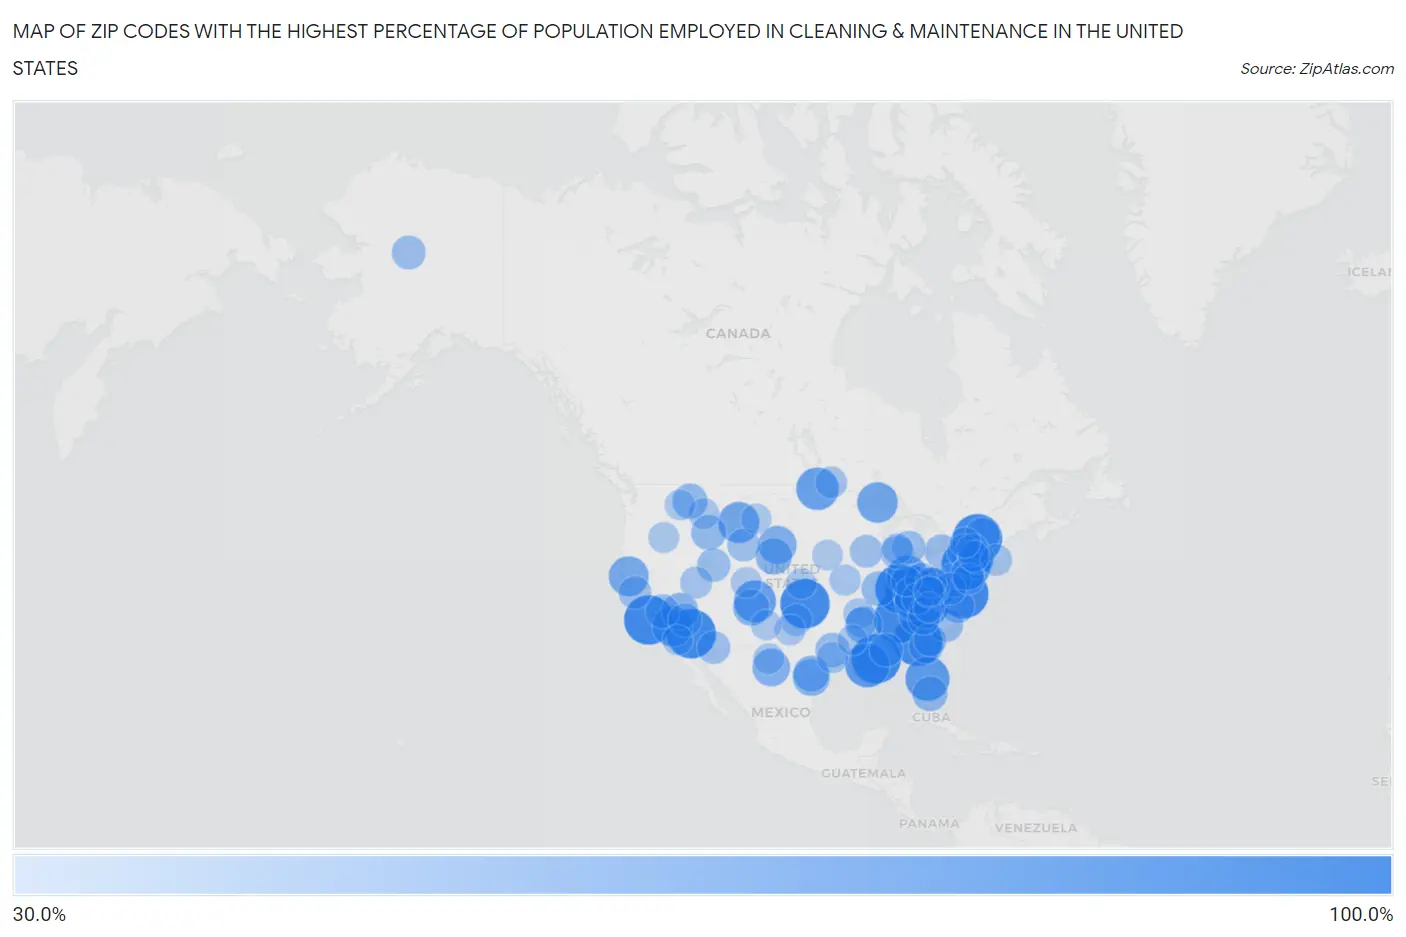
Map of Zip Codes with the Highest Percentage of Population Employed in Cleaning & Maintenance in the United States
30.0%
100.0%
Zip Codes with the Highest Percentage of Population Employed in Cleaning & Maintenance in the United States
| Zip Code | % Employed | vs State | vs National | |
| 1. | 30454 | 100.0% | 3.4%(+96.6)#1 | 3.5%(+96.5)#1 |
| 2. | 37396 | 100.0% | 3.4%(+96.6)#1 | 3.5%(+96.5)#2 |
| 3. | 85328 | 100.0% | 3.9%(+96.1)#1 | 3.5%(+96.5)#3 |
| 4. | 22432 | 100.0% | 3.1%(+96.9)#1 | 3.5%(+96.5)#4 |
| 5. | 40350 | 100.0% | 3.3%(+96.7)#1 | 3.5%(+96.5)#5 |
| 6. | 18223 | 100.0% | 3.1%(+96.9)#1 | 3.5%(+96.5)#6 |
| 7. | 93429 | 100.0% | 3.7%(+96.3)#1 | 3.5%(+96.5)#7 |
| 8. | 24316 | 100.0% | 3.1%(+96.9)#2 | 3.5%(+96.5)#8 |
| 9. | 40058 | 100.0% | 3.3%(+96.7)#2 | 3.5%(+96.5)#9 |
| 10. | 39595 | 100.0% | 3.6%(+96.4)#1 | 3.5%(+96.5)#10 |
| 11. | 12864 | 100.0% | 3.6%(+96.4)#1 | 3.5%(+96.5)#11 |
| 12. | 73746 | 100.0% | 3.6%(+96.4)#1 | 3.5%(+96.5)#12 |
| 13. | 41607 | 91.5% | 3.3%(+88.2)#3 | 3.5%(+88.1)#13 |
| 14. | 70082 | 84.3% | 3.7%(+80.6)#1 | 3.5%(+80.8)#14 |
| 15. | 33855 | 82.6% | 4.4%(+78.2)#1 | 3.5%(+79.1)#15 |
| 16. | 26266 | 80.4% | 3.7%(+76.7)#1 | 3.5%(+76.9)#16 |
| 17. | 56720 | 77.8% | 3.0%(+74.8)#1 | 3.5%(+74.3)#17 |
| 18. | 24884 | 77.3% | 3.7%(+73.5)#2 | 3.5%(+73.8)#18 |
| 19. | 81138 | 76.2% | 2.9%(+73.3)#1 | 3.5%(+72.7)#19 |
| 20. | 45428 | 75.0% | 3.2%(+71.8)#1 | 3.5%(+71.5)#20 |
| 21. | 59035 | 73.5% | 3.8%(+69.7)#1 | 3.5%(+70.0)#21 |
| 22. | 92369 | 71.4% | 3.7%(+67.7)#2 | 3.5%(+67.9)#22 |
| 23. | 49942 | 71.4% | 3.4%(+68.0)#1 | 3.5%(+67.9)#23 |
| 24. | 95429 | 69.2% | 3.7%(+65.5)#3 | 3.5%(+65.7)#24 |
| 25. | 57794 | 64.1% | 3.4%(+60.7)#1 | 3.5%(+60.6)#25 |
| 26. | 79834 | 62.0% | 3.6%(+58.4)#1 | 3.5%(+58.5)#26 |
| 27. | 38623 | 60.8% | 3.6%(+57.2)#2 | 3.5%(+57.3)#27 |
| 28. | 78352 | 59.7% | 3.6%(+56.1)#2 | 3.5%(+56.2)#28 |
| 29. | 92389 | 59.1% | 3.7%(+55.4)#4 | 3.5%(+55.6)#29 |
| 30. | 28708 | 58.5% | 3.5%(+55.0)#1 | 3.5%(+55.1)#30 |
| 31. | 69331 | 58.3% | 3.0%(+55.3)#1 | 3.5%(+54.9)#31 |
| 32. | 87530 | 58.0% | 3.9%(+54.2)#1 | 3.5%(+54.5)#32 |
| 33. | 40840 | 57.6% | 3.3%(+54.3)#4 | 3.5%(+54.2)#33 |
| 34. | 18454 | 57.1% | 3.1%(+54.0)#2 | 3.5%(+53.7)#34 |
| 35. | 78142 | 57.1% | 3.6%(+53.6)#3 | 3.5%(+53.7)#35 |
| 36. | 18340 | 55.6% | 3.1%(+52.4)#3 | 3.5%(+52.1)#36 |
| 37. | 41397 | 55.1% | 3.3%(+51.7)#5 | 3.5%(+51.6)#37 |
| 38. | 59856 | 54.2% | 3.8%(+50.4)#2 | 3.5%(+50.7)#38 |
| 39. | 83446 | 53.8% | 3.5%(+50.3)#1 | 3.5%(+50.4)#39 |
| 40. | 34141 | 53.3% | 4.4%(+48.9)#2 | 3.5%(+49.9)#40 |
| 41. | 62843 | 52.6% | 3.2%(+49.4)#1 | 3.5%(+49.1)#41 |
| 42. | 12998 | 51.9% | 3.6%(+48.3)#2 | 3.5%(+48.4)#42 |
| 43. | 75903 | 51.5% | 3.6%(+47.9)#4 | 3.5%(+48.0)#43 |
| 44. | 31333 | 51.2% | 3.4%(+47.9)#2 | 3.5%(+47.7)#44 |
| 45. | 14166 | 50.0% | 3.6%(+46.4)#3 | 3.5%(+46.5)#45 |
| 46. | 93260 | 50.0% | 3.7%(+46.3)#5 | 3.5%(+46.5)#46 |
| 47. | 28424 | 50.0% | 3.5%(+46.5)#2 | 3.5%(+46.5)#47 |
| 48. | 99745 | 50.0% | 3.7%(+46.3)#1 | 3.5%(+46.5)#48 |
| 49. | 21715 | 50.0% | 3.2%(+46.8)#1 | 3.5%(+46.5)#49 |
| 50. | 27877 | 50.0% | 3.5%(+46.5)#3 | 3.5%(+46.5)#50 |
| 51. | 26376 | 49.3% | 3.7%(+45.6)#3 | 3.5%(+45.8)#51 |
| 52. | 49074 | 49.1% | 3.4%(+45.7)#2 | 3.5%(+45.6)#52 |
| 53. | 92332 | 48.9% | 3.7%(+45.2)#6 | 3.5%(+45.4)#53 |
| 54. | 84024 | 48.7% | 3.2%(+45.5)#1 | 3.5%(+45.2)#54 |
| 55. | 48816 | 48.4% | 3.4%(+45.0)#3 | 3.5%(+44.9)#55 |
| 56. | 36473 | 48.2% | 3.5%(+44.7)#1 | 3.5%(+44.7)#56 |
| 57. | 13784 | 47.9% | 3.6%(+44.3)#4 | 3.5%(+44.4)#57 |
| 58. | 19316 | 47.9% | 3.1%(+44.8)#4 | 3.5%(+44.4)#58 |
| 59. | 12489 | 47.6% | 3.6%(+44.0)#5 | 3.5%(+44.1)#59 |
| 60. | 82638 | 47.1% | 3.7%(+43.4)#1 | 3.5%(+43.6)#60 |
| 61. | 85633 | 47.1% | 3.9%(+43.1)#2 | 3.5%(+43.6)#61 |
| 62. | 28628 | 47.1% | 3.5%(+43.6)#4 | 3.5%(+43.6)#62 |
| 63. | 61059 | 47.0% | 3.2%(+43.8)#2 | 3.5%(+43.5)#63 |
| 64. | 29934 | 46.3% | 3.9%(+42.4)#1 | 3.5%(+42.8)#64 |
| 65. | 94964 | 46.2% | 3.7%(+42.5)#7 | 3.5%(+42.8)#65 |
| 66. | 29378 | 44.9% | 3.9%(+41.0)#2 | 3.5%(+41.4)#66 |
| 67. | 13861 | 44.6% | 3.6%(+41.0)#6 | 3.5%(+41.1)#67 |
| 68. | 26662 | 44.5% | 3.7%(+40.8)#4 | 3.5%(+41.0)#68 |
| 69. | 84728 | 44.2% | 3.2%(+41.0)#2 | 3.5%(+40.7)#69 |
| 70. | 22731 | 43.8% | 3.1%(+40.7)#3 | 3.5%(+40.3)#70 |
| 71. | 43111 | 43.5% | 3.2%(+40.3)#2 | 3.5%(+40.0)#71 |
| 72. | 56711 | 43.1% | 3.0%(+40.1)#2 | 3.5%(+39.6)#72 |
| 73. | 02873 | 42.9% | 3.4%(+39.4)#1 | 3.5%(+39.4)#73 |
| 74. | 73571 | 42.9% | 3.6%(+39.2)#2 | 3.5%(+39.4)#74 |
| 75. | 25942 | 42.3% | 3.7%(+38.6)#5 | 3.5%(+38.8)#75 |
| 76. | 77376 | 42.0% | 3.6%(+38.5)#5 | 3.5%(+38.6)#76 |
| 77. | 19733 | 41.9% | 4.0%(+37.9)#1 | 3.5%(+38.4)#77 |
| 78. | 12724 | 41.9% | 3.6%(+38.2)#7 | 3.5%(+38.4)#78 |
| 79. | 65246 | 41.7% | 3.2%(+38.5)#1 | 3.5%(+38.2)#79 |
| 80. | 49335 | 41.3% | 3.4%(+37.9)#4 | 3.5%(+37.8)#80 |
| 81. | 59756 | 40.9% | 3.8%(+37.1)#3 | 3.5%(+37.4)#81 |
| 82. | 72005 | 40.9% | 3.7%(+37.2)#1 | 3.5%(+37.4)#82 |
| 83. | 41606 | 40.7% | 3.3%(+37.4)#6 | 3.5%(+37.3)#83 |
| 84. | 79832 | 40.7% | 3.6%(+37.2)#6 | 3.5%(+37.3)#84 |
| 85. | 97904 | 40.6% | 3.2%(+37.4)#1 | 3.5%(+37.1)#85 |
| 86. | 79220 | 40.3% | 3.6%(+36.8)#7 | 3.5%(+36.9)#86 |
| 87. | 81612 | 40.2% | 2.9%(+37.3)#2 | 3.5%(+36.7)#87 |
| 88. | 51520 | 40.0% | 3.1%(+36.9)#1 | 3.5%(+36.5)#88 |
| 89. | 26327 | 40.0% | 3.7%(+36.3)#6 | 3.5%(+36.5)#89 |
| 90. | 83812 | 40.0% | 3.5%(+36.5)#2 | 3.5%(+36.5)#90 |
| 91. | 72352 | 40.0% | 3.7%(+36.3)#2 | 3.5%(+36.5)#91 |
| 92. | 13103 | 39.8% | 3.6%(+36.2)#8 | 3.5%(+36.3)#92 |
| 93. | 88134 | 39.4% | 3.9%(+35.5)#2 | 3.5%(+35.9)#93 |
| 94. | 67627 | 39.3% | 3.3%(+36.1)#1 | 3.5%(+35.8)#94 |
| 95. | 59343 | 39.3% | 3.8%(+35.5)#4 | 3.5%(+35.8)#95 |
| 96. | 28649 | 39.0% | 3.5%(+35.5)#5 | 3.5%(+35.6)#96 |
| 97. | 71279 | 39.0% | 3.7%(+35.3)#2 | 3.5%(+35.5)#97 |
| 98. | 91980 | 38.9% | 3.7%(+35.2)#8 | 3.5%(+35.4)#98 |
| 99. | 45147 | 38.6% | 3.2%(+35.4)#3 | 3.5%(+35.2)#99 |
| 100. | 25036 | 38.6% | 3.7%(+34.8)#7 | 3.5%(+35.1)#100 |
Common Questions
What are the Top 10 Zip Codes with the Highest Percentage of Population Employed in Cleaning & Maintenance in the United States?
Top 10 Zip Codes with the Highest Percentage of Population Employed in Cleaning & Maintenance in the United States are:
What zip code has the Highest Percentage of Population Employed in Cleaning & Maintenance in the United States?
30454 has the Highest Percentage of Population Employed in Cleaning & Maintenance in the United States with 100.0%.
What is the Percentage of Population Employed in Cleaning & Maintenance in the United States?
Percentage of Population Employed in Cleaning & Maintenance in the United States is 3.5%.