Zip Codes with the Highest Percentage of Population with a Degree in Physical and Health Sciences in the United States
RELATED REPORTS & OPTIONS
Physical and Health Sciences
United States
Compare Zip Codes
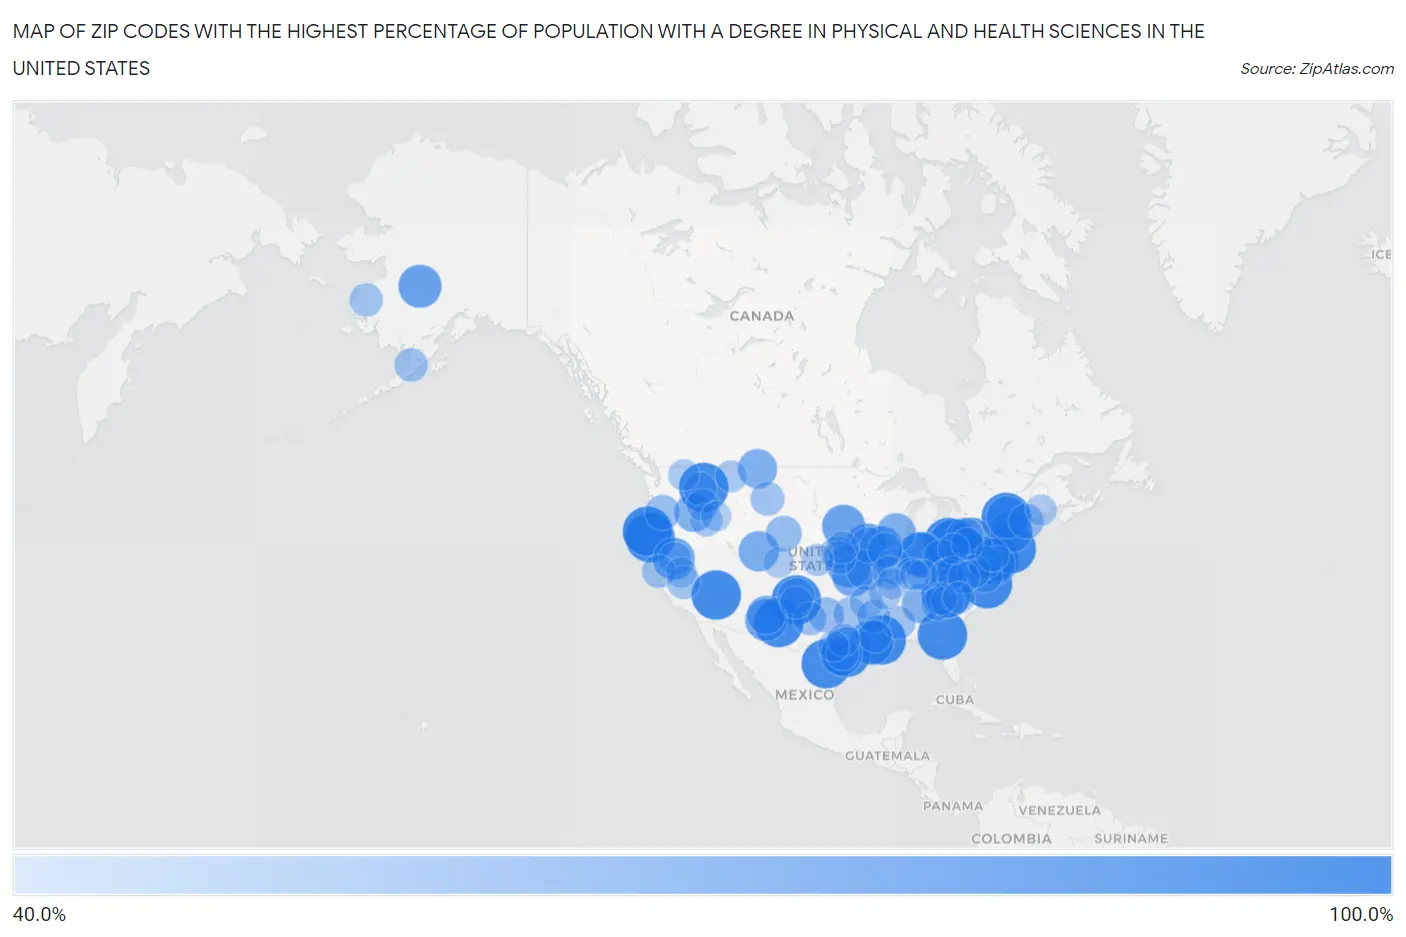
Map of Zip Codes with the Highest Percentage of Population with a Degree in Physical and Health Sciences in the United States
40.0%
100.0%
Zip Codes with the Highest Percentage of Population with a Degree in Physical and Health Sciences in the United States
| Zip Code | % Graduates | vs State | vs National | |
| 1. | 70803 | 100.0% | 3.1%(+96.9)#1 | 3.1%(+96.9)#1 |
| 2. | 23668 | 100.0% | 3.2%(+96.8)#1 | 3.1%(+96.9)#2 |
| 3. | 15546 | 100.0% | 3.3%(+96.7)#1 | 3.1%(+96.9)#3 |
| 4. | 97534 | 100.0% | 3.9%(+96.1)#1 | 3.1%(+96.9)#4 |
| 5. | 44101 | 100.0% | 3.0%(+97.0)#1 | 3.1%(+96.9)#5 |
| 6. | 31623 | 100.0% | 2.6%(+97.4)#1 | 3.1%(+96.9)#6 |
| 7. | 78344 | 100.0% | 3.3%(+96.7)#1 | 3.1%(+96.9)#7 |
| 8. | 97406 | 100.0% | 3.9%(+96.1)#2 | 3.1%(+96.9)#8 |
| 9. | 08023 | 100.0% | 3.3%(+96.7)#1 | 3.1%(+96.9)#9 |
| 10. | 86445 | 100.0% | 2.9%(+97.1)#1 | 3.1%(+96.9)#10 |
| 11. | 88411 | 100.0% | 4.8%(+95.2)#1 | 3.1%(+96.9)#11 |
| 12. | 77440 | 100.0% | 3.3%(+96.7)#2 | 3.1%(+96.9)#12 |
| 13. | 88350 | 100.0% | 4.8%(+95.2)#2 | 3.1%(+96.9)#13 |
| 14. | 44080 | 100.0% | 3.0%(+97.0)#2 | 3.1%(+96.9)#14 |
| 15. | 12961 | 100.0% | 2.9%(+97.1)#1 | 3.1%(+96.9)#15 |
| 16. | 28749 | 100.0% | 3.1%(+96.9)#1 | 3.1%(+96.9)#16 |
| 17. | 11973 | 100.0% | 2.9%(+97.1)#2 | 3.1%(+96.9)#17 |
| 18. | 83812 | 100.0% | 3.2%(+96.8)#1 | 3.1%(+96.9)#18 |
| 19. | 47306 | 87.8% | 3.1%(+84.7)#1 | 3.1%(+84.7)#19 |
| 20. | 70556 | 84.5% | 3.1%(+81.4)#2 | 3.1%(+81.4)#20 |
| 21. | 46063 | 81.2% | 3.1%(+78.1)#2 | 3.1%(+78.2)#21 |
| 22. | 50057 | 80.0% | 2.4%(+77.6)#1 | 3.1%(+76.9)#22 |
| 23. | 57027 | 80.0% | 2.1%(+77.9)#1 | 3.1%(+76.9)#23 |
| 24. | 99675 | 80.0% | 4.7%(+75.3)#1 | 3.1%(+76.9)#24 |
| 25. | 52660 | 78.6% | 2.4%(+76.2)#2 | 3.1%(+75.5)#25 |
| 26. | 16744 | 78.6% | 3.3%(+75.3)#2 | 3.1%(+75.5)#26 |
| 27. | 01343 | 78.6% | 3.7%(+74.9)#1 | 3.1%(+75.5)#27 |
| 28. | 12960 | 78.5% | 2.9%(+75.6)#3 | 3.1%(+75.4)#28 |
| 29. | 66622 | 77.8% | 2.5%(+75.2)#1 | 3.1%(+74.7)#29 |
| 30. | 96129 | 76.8% | 3.1%(+73.7)#1 | 3.1%(+73.7)#30 |
| 31. | 87930 | 76.7% | 4.8%(+71.8)#3 | 3.1%(+73.6)#31 |
| 32. | 77951 | 74.4% | 3.3%(+71.0)#3 | 3.1%(+71.3)#32 |
| 33. | 66732 | 72.2% | 2.5%(+69.7)#2 | 3.1%(+69.1)#33 |
| 34. | 81640 | 71.2% | 3.6%(+67.5)#1 | 3.1%(+68.1)#34 |
| 35. | 65335 | 70.3% | 2.6%(+67.7)#1 | 3.1%(+67.2)#35 |
| 36. | 59529 | 68.1% | 3.7%(+64.4)#1 | 3.1%(+65.0)#36 |
| 37. | 53501 | 66.7% | 2.9%(+63.8)#1 | 3.1%(+63.6)#37 |
| 38. | 97905 | 66.7% | 3.9%(+62.8)#3 | 3.1%(+63.6)#38 |
| 39. | 35981 | 66.5% | 2.9%(+63.6)#1 | 3.1%(+63.4)#39 |
| 40. | 87939 | 65.9% | 4.8%(+61.0)#4 | 3.1%(+62.8)#40 |
| 41. | 14785 | 60.4% | 2.9%(+57.5)#4 | 3.1%(+57.3)#41 |
| 42. | 88430 | 60.0% | 4.8%(+55.2)#5 | 3.1%(+56.9)#42 |
| 43. | 50256 | 58.1% | 2.4%(+55.7)#3 | 3.1%(+55.0)#43 |
| 44. | 43109 | 58.0% | 3.0%(+55.0)#3 | 3.1%(+54.9)#44 |
| 45. | 82213 | 57.7% | 4.3%(+53.4)#1 | 3.1%(+54.6)#45 |
| 46. | 08316 | 56.1% | 3.3%(+52.8)#2 | 3.1%(+53.0)#46 |
| 47. | 76370 | 56.1% | 3.3%(+52.7)#4 | 3.1%(+53.0)#47 |
| 48. | 62019 | 56.0% | 2.9%(+53.1)#1 | 3.1%(+52.9)#48 |
| 49. | 97350 | 55.6% | 3.9%(+51.7)#4 | 3.1%(+52.5)#49 |
| 50. | 04056 | 55.0% | 2.8%(+52.2)#1 | 3.1%(+51.9)#50 |
| 51. | 22472 | 54.8% | 3.2%(+51.6)#2 | 3.1%(+51.7)#51 |
| 52. | 61478 | 54.5% | 2.9%(+51.7)#2 | 3.1%(+51.4)#52 |
| 53. | 25637 | 54.2% | 3.3%(+51.0)#1 | 3.1%(+51.1)#53 |
| 54. | 59010 | 52.0% | 3.7%(+48.3)#2 | 3.1%(+48.9)#54 |
| 55. | 96105 | 50.5% | 3.1%(+47.4)#2 | 3.1%(+47.4)#55 |
| 56. | 99632 | 50.0% | 4.7%(+45.3)#2 | 3.1%(+46.9)#56 |
| 57. | 75421 | 50.0% | 3.3%(+46.7)#5 | 3.1%(+46.9)#57 |
| 58. | 21251 | 50.0% | 3.6%(+46.4)#1 | 3.1%(+46.9)#58 |
| 59. | 39326 | 50.0% | 3.0%(+47.0)#1 | 3.1%(+46.9)#59 |
| 60. | 68416 | 50.0% | 2.7%(+47.3)#1 | 3.1%(+46.9)#60 |
| 61. | 25203 | 50.0% | 3.3%(+46.7)#2 | 3.1%(+46.9)#61 |
| 62. | 22730 | 50.0% | 3.2%(+46.8)#3 | 3.1%(+46.9)#62 |
| 63. | 19457 | 50.0% | 3.3%(+46.7)#3 | 3.1%(+46.9)#63 |
| 64. | 72860 | 50.0% | 3.2%(+46.8)#1 | 3.1%(+46.9)#64 |
| 65. | 95431 | 50.0% | 3.1%(+46.9)#3 | 3.1%(+46.9)#65 |
| 66. | 99649 | 50.0% | 4.7%(+45.3)#3 | 3.1%(+46.9)#66 |
| 67. | 79330 | 50.0% | 3.3%(+46.7)#6 | 3.1%(+46.9)#67 |
| 68. | 71651 | 50.0% | 3.2%(+46.8)#2 | 3.1%(+46.9)#68 |
| 69. | 62256 | 50.0% | 2.9%(+47.1)#3 | 3.1%(+46.9)#69 |
| 70. | 93634 | 50.0% | 3.1%(+46.9)#4 | 3.1%(+46.9)#70 |
| 71. | 29658 | 48.8% | 2.9%(+45.9)#1 | 3.1%(+45.7)#71 |
| 72. | 83834 | 48.7% | 3.2%(+45.5)#2 | 3.1%(+45.6)#72 |
| 73. | 29368 | 48.6% | 2.9%(+45.7)#2 | 3.1%(+45.5)#73 |
| 74. | 71333 | 48.5% | 3.1%(+45.4)#3 | 3.1%(+45.4)#74 |
| 75. | 77991 | 48.5% | 3.3%(+45.1)#7 | 3.1%(+45.4)#75 |
| 76. | 66946 | 48.4% | 2.5%(+45.8)#3 | 3.1%(+45.3)#76 |
| 77. | 83631 | 48.2% | 3.2%(+45.0)#3 | 3.1%(+45.1)#77 |
| 78. | 25125 | 48.2% | 3.3%(+44.9)#3 | 3.1%(+45.1)#78 |
| 79. | 77863 | 48.1% | 3.3%(+44.8)#8 | 3.1%(+45.0)#79 |
| 80. | 88112 | 47.3% | 4.8%(+42.5)#6 | 3.1%(+44.2)#80 |
| 81. | 83547 | 47.2% | 3.2%(+44.0)#4 | 3.1%(+44.1)#81 |
| 82. | 47523 | 47.0% | 3.1%(+43.9)#3 | 3.1%(+43.9)#82 |
| 83. | 68517 | 46.7% | 2.7%(+44.0)#2 | 3.1%(+43.6)#83 |
| 84. | 28708 | 46.3% | 3.1%(+43.2)#2 | 3.1%(+43.2)#84 |
| 85. | 72467 | 46.2% | 3.2%(+42.9)#3 | 3.1%(+43.1)#85 |
| 86. | 24578 | 46.2% | 3.2%(+42.9)#4 | 3.1%(+43.1)#86 |
| 87. | 67629 | 46.2% | 2.5%(+43.6)#4 | 3.1%(+43.1)#87 |
| 88. | 16217 | 46.2% | 3.3%(+42.9)#4 | 3.1%(+43.1)#88 |
| 89. | 28109 | 45.5% | 3.1%(+42.3)#3 | 3.1%(+42.4)#89 |
| 90. | 59467 | 45.5% | 3.7%(+41.7)#3 | 3.1%(+42.4)#90 |
| 91. | 99155 | 44.1% | 3.4%(+40.7)#1 | 3.1%(+41.0)#91 |
| 92. | 04469 | 43.2% | 2.8%(+40.5)#2 | 3.1%(+40.1)#92 |
| 93. | 44619 | 43.2% | 3.0%(+40.2)#4 | 3.1%(+40.1)#93 |
| 94. | 40020 | 42.9% | 3.1%(+39.8)#1 | 3.1%(+39.8)#94 |
| 95. | 63784 | 42.9% | 2.6%(+40.3)#2 | 3.1%(+39.8)#95 |
| 96. | 80456 | 42.6% | 3.6%(+39.0)#2 | 3.1%(+39.5)#96 |
| 97. | 93517 | 42.6% | 3.1%(+39.5)#5 | 3.1%(+39.5)#97 |
| 98. | 78670 | 42.4% | 3.3%(+39.1)#9 | 3.1%(+39.3)#98 |
| 99. | 40170 | 41.2% | 3.1%(+38.1)#2 | 3.1%(+38.1)#99 |
| 100. | 83227 | 40.8% | 3.2%(+37.6)#5 | 3.1%(+37.7)#100 |
Common Questions
What are the Top 10 Zip Codes with the Highest Percentage of Population with a Degree in Physical and Health Sciences in the United States?
Top 10 Zip Codes with the Highest Percentage of Population with a Degree in Physical and Health Sciences in the United States are:
What zip code has the Highest Percentage of Population with a Degree in Physical and Health Sciences in the United States?
70803 has the Highest Percentage of Population with a Degree in Physical and Health Sciences in the United States with 100.0%.
What is the Percentage of Population with a Degree in Physical and Health Sciences in the United States?
Percentage of Population with a Degree in Physical and Health Sciences in the United States is 3.1%.