Zip Codes with the Highest Percentage of Population with a Degree in Communications in the United States
RELATED REPORTS & OPTIONS
Communications
United States
Compare Zip Codes
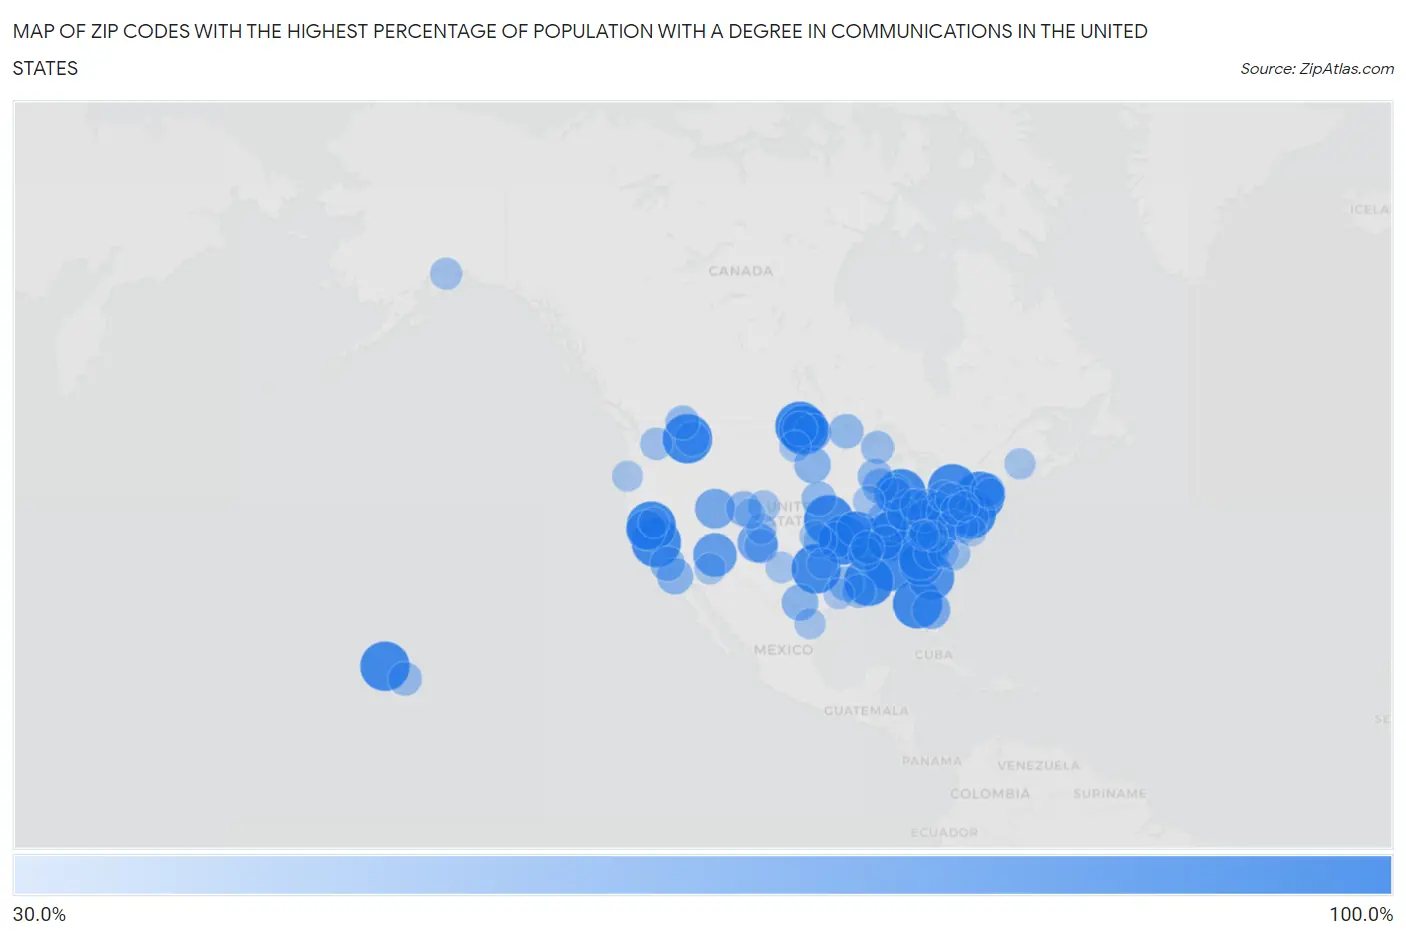
Map of Zip Codes with the Highest Percentage of Population with a Degree in Communications in the United States
30.0%
100.0%
Zip Codes with the Highest Percentage of Population with a Degree in Communications in the United States
| Zip Code | % Graduates | vs State | vs National | |
| 1. | 42337 | 100.0% | 4.2%(+95.8)#1 | 4.1%(+95.9)#1 |
| 2. | 66621 | 100.0% | 4.1%(+95.9)#1 | 4.1%(+95.9)#2 |
| 3. | 41745 | 100.0% | 4.2%(+95.8)#2 | 4.1%(+95.9)#3 |
| 4. | 93652 | 100.0% | 4.6%(+95.4)#1 | 4.1%(+95.9)#4 |
| 5. | 41226 | 100.0% | 4.2%(+95.8)#3 | 4.1%(+95.9)#5 |
| 6. | 96759 | 100.0% | 3.6%(+96.4)#1 | 4.1%(+95.9)#6 |
| 7. | 76253 | 100.0% | 4.1%(+95.9)#1 | 4.1%(+95.9)#7 |
| 8. | 25915 | 100.0% | 3.1%(+96.9)#1 | 4.1%(+95.9)#8 |
| 9. | 35584 | 100.0% | 3.2%(+96.8)#1 | 4.1%(+95.9)#9 |
| 10. | 95232 | 100.0% | 4.6%(+95.4)#2 | 4.1%(+95.9)#10 |
| 11. | 49075 | 100.0% | 3.9%(+96.1)#1 | 4.1%(+95.9)#11 |
| 12. | 58353 | 100.0% | 3.4%(+96.6)#1 | 4.1%(+95.9)#12 |
| 13. | 32692 | 100.0% | 3.9%(+96.1)#1 | 4.1%(+95.9)#13 |
| 14. | 65468 | 100.0% | 4.4%(+95.6)#1 | 4.1%(+95.9)#14 |
| 15. | 10985 | 100.0% | 4.4%(+95.6)#1 | 4.1%(+95.9)#15 |
| 16. | 65675 | 100.0% | 4.4%(+95.6)#2 | 4.1%(+95.9)#16 |
| 17. | 14029 | 100.0% | 4.4%(+95.6)#2 | 4.1%(+95.9)#17 |
| 18. | 58362 | 100.0% | 3.4%(+96.6)#2 | 4.1%(+95.9)#18 |
| 19. | 19736 | 100.0% | 2.6%(+97.4)#1 | 4.1%(+95.9)#19 |
| 20. | 39148 | 100.0% | 2.4%(+97.6)#1 | 4.1%(+95.9)#21 |
| 21. | 59867 | 100.0% | 3.2%(+96.8)#1 | 4.1%(+95.9)#22 |
| 22. | 29922 | 88.2% | 3.3%(+84.9)#1 | 4.1%(+84.1)#23 |
| 23. | 29659 | 81.2% | 3.3%(+77.9)#2 | 4.1%(+77.1)#24 |
| 24. | 86011 | 80.0% | 4.0%(+76.0)#1 | 4.1%(+75.9)#25 |
| 25. | 29634 | 76.2% | 3.3%(+72.9)#3 | 4.1%(+72.1)#26 |
| 26. | 87513 | 68.6% | 3.0%(+65.6)#1 | 4.1%(+64.5)#27 |
| 27. | 95211 | 68.2% | 4.6%(+63.6)#3 | 4.1%(+64.0)#28 |
| 28. | 84602 | 68.0% | 4.4%(+63.6)#1 | 4.1%(+63.9)#29 |
| 29. | 49119 | 66.7% | 3.9%(+62.8)#2 | 4.1%(+62.5)#30 |
| 30. | 32816 | 61.5% | 3.9%(+57.6)#2 | 4.1%(+57.4)#31 |
| 31. | 45336 | 60.0% | 4.3%(+55.7)#1 | 4.1%(+55.9)#32 |
| 32. | 58266 | 58.8% | 3.4%(+55.4)#3 | 4.1%(+54.7)#33 |
| 33. | 17974 | 58.3% | 4.2%(+54.1)#1 | 4.1%(+54.2)#34 |
| 34. | 21650 | 58.3% | 3.9%(+54.4)#1 | 4.1%(+54.2)#35 |
| 35. | 57258 | 56.9% | 3.0%(+53.9)#1 | 4.1%(+52.7)#36 |
| 36. | 78838 | 56.7% | 4.1%(+52.6)#2 | 4.1%(+52.5)#37 |
| 37. | 43913 | 56.5% | 4.3%(+52.1)#2 | 4.1%(+52.3)#38 |
| 38. | 92147 | 55.6% | 4.6%(+50.9)#4 | 4.1%(+51.4)#39 |
| 39. | 64858 | 55.0% | 4.4%(+50.6)#3 | 4.1%(+50.9)#40 |
| 40. | 81638 | 52.2% | 4.8%(+47.4)#1 | 4.1%(+48.0)#41 |
| 41. | 53176 | 51.7% | 4.4%(+47.4)#1 | 4.1%(+47.6)#42 |
| 42. | 91608 | 50.9% | 4.6%(+46.3)#5 | 4.1%(+46.8)#43 |
| 43. | 47552 | 50.9% | 3.7%(+47.2)#1 | 4.1%(+46.7)#44 |
| 44. | 15082 | 50.6% | 4.2%(+46.4)#2 | 4.1%(+46.5)#45 |
| 45. | 28077 | 50.0% | 4.1%(+45.9)#1 | 4.1%(+45.9)#46 |
| 46. | 62478 | 50.0% | 5.1%(+44.9)#1 | 4.1%(+45.9)#47 |
| 47. | 53947 | 50.0% | 4.4%(+45.6)#2 | 4.1%(+45.9)#48 |
| 48. | 59856 | 50.0% | 3.2%(+46.8)#2 | 4.1%(+45.9)#49 |
| 49. | 65443 | 50.0% | 4.4%(+45.6)#4 | 4.1%(+45.9)#50 |
| 50. | 55772 | 50.0% | 4.8%(+45.2)#1 | 4.1%(+45.9)#51 |
| 51. | 68001 | 50.0% | 4.0%(+46.0)#1 | 4.1%(+45.9)#52 |
| 52. | 58343 | 50.0% | 3.4%(+46.6)#4 | 4.1%(+45.9)#53 |
| 53. | 71066 | 50.0% | 3.2%(+46.8)#1 | 4.1%(+45.9)#54 |
| 54. | 44687 | 49.3% | 4.3%(+44.9)#3 | 4.1%(+45.1)#55 |
| 55. | 24966 | 49.2% | 3.1%(+46.2)#2 | 4.1%(+45.1)#56 |
| 56. | 83826 | 48.4% | 3.7%(+44.7)#1 | 4.1%(+44.3)#57 |
| 57. | 87734 | 47.9% | 3.0%(+44.9)#2 | 4.1%(+43.8)#58 |
| 58. | 37023 | 47.6% | 4.3%(+43.3)#1 | 4.1%(+43.5)#59 |
| 59. | 96710 | 47.3% | 3.6%(+43.7)#2 | 4.1%(+43.1)#60 |
| 60. | 01242 | 46.8% | 3.5%(+43.3)#1 | 4.1%(+42.7)#61 |
| 61. | 70787 | 46.4% | 3.2%(+43.2)#2 | 4.1%(+42.3)#62 |
| 62. | 25076 | 46.2% | 3.1%(+43.1)#3 | 4.1%(+42.0)#63 |
| 63. | 72331 | 46.1% | 3.3%(+42.8)#1 | 4.1%(+42.0)#64 |
| 64. | 63821 | 45.5% | 4.4%(+41.1)#5 | 4.1%(+41.3)#65 |
| 65. | 74633 | 45.5% | 3.8%(+41.7)#1 | 4.1%(+41.3)#66 |
| 66. | 27533 | 45.5% | 4.1%(+41.4)#2 | 4.1%(+41.3)#67 |
| 67. | 49961 | 45.5% | 3.9%(+41.6)#3 | 4.1%(+41.3)#68 |
| 68. | 47370 | 45.5% | 3.7%(+41.8)#2 | 4.1%(+41.3)#69 |
| 69. | 15361 | 45.5% | 4.2%(+41.3)#3 | 4.1%(+41.3)#70 |
| 70. | 43144 | 43.8% | 4.3%(+39.4)#4 | 4.1%(+39.6)#71 |
| 71. | 49104 | 43.5% | 3.9%(+39.6)#4 | 4.1%(+39.3)#72 |
| 72. | 99321 | 43.4% | 3.9%(+39.5)#1 | 4.1%(+39.3)#73 |
| 73. | 43323 | 42.2% | 4.3%(+37.9)#5 | 4.1%(+38.1)#74 |
| 74. | 80546 | 41.8% | 4.8%(+37.0)#2 | 4.1%(+37.7)#75 |
| 75. | 99605 | 41.8% | 2.5%(+39.3)#1 | 4.1%(+37.7)#76 |
| 76. | 15421 | 41.7% | 4.2%(+37.5)#4 | 4.1%(+37.5)#77 |
| 77. | 61449 | 40.0% | 5.1%(+34.9)#2 | 4.1%(+35.9)#78 |
| 78. | 16322 | 40.0% | 4.2%(+35.8)#5 | 4.1%(+35.9)#79 |
| 79. | 79380 | 40.0% | 4.1%(+35.9)#3 | 4.1%(+35.9)#80 |
| 80. | 15821 | 40.0% | 4.2%(+35.8)#6 | 4.1%(+35.9)#81 |
| 81. | 20606 | 39.5% | 3.9%(+35.6)#2 | 4.1%(+35.4)#82 |
| 82. | 58560 | 39.3% | 3.4%(+35.9)#5 | 4.1%(+35.2)#83 |
| 83. | 04489 | 39.1% | 3.2%(+35.9)#1 | 4.1%(+34.9)#84 |
| 84. | 78353 | 39.0% | 4.1%(+35.0)#4 | 4.1%(+34.9)#85 |
| 85. | 85309 | 39.0% | 4.0%(+35.0)#2 | 4.1%(+34.8)#86 |
| 86. | 67103 | 38.7% | 4.1%(+34.6)#2 | 4.1%(+34.6)#87 |
| 87. | 22749 | 38.7% | 3.4%(+35.3)#1 | 4.1%(+34.6)#88 |
| 88. | 06059 | 38.3% | 3.9%(+34.4)#1 | 4.1%(+34.2)#89 |
| 89. | 81253 | 38.0% | 4.8%(+33.3)#3 | 4.1%(+33.9)#90 |
| 90. | 97473 | 37.9% | 4.3%(+33.7)#1 | 4.1%(+33.8)#91 |
| 91. | 27259 | 37.7% | 4.1%(+33.7)#3 | 4.1%(+33.6)#92 |
| 92. | 77660 | 37.5% | 4.1%(+33.4)#5 | 4.1%(+33.4)#93 |
| 93. | 24366 | 37.5% | 3.4%(+34.1)#2 | 4.1%(+33.4)#94 |
| 94. | 74748 | 37.1% | 3.8%(+33.3)#2 | 4.1%(+33.0)#95 |
| 95. | 17219 | 37.0% | 4.2%(+32.8)#7 | 4.1%(+32.9)#96 |
| 96. | 95720 | 36.8% | 4.6%(+32.2)#6 | 4.1%(+32.7)#97 |
| 97. | 23303 | 36.7% | 3.4%(+33.2)#3 | 4.1%(+32.5)#98 |
| 98. | 81655 | 36.2% | 4.8%(+31.4)#4 | 4.1%(+32.1)#99 |
| 99. | 41566 | 35.8% | 4.2%(+31.6)#4 | 4.1%(+31.7)#100 |
| 100. | 17097 | 35.7% | 4.2%(+31.5)#8 | 4.1%(+31.6)#101 |
Common Questions
What are the Top 10 Zip Codes with the Highest Percentage of Population with a Degree in Communications in the United States?
Top 10 Zip Codes with the Highest Percentage of Population with a Degree in Communications in the United States are:
What zip code has the Highest Percentage of Population with a Degree in Communications in the United States?
42337 has the Highest Percentage of Population with a Degree in Communications in the United States with 100.0%.
What is the Percentage of Population with a Degree in Communications in the United States?
Percentage of Population with a Degree in Communications in the United States is 4.1%.