Zip Codes with the Highest Percentage of Population Employed in Food Preparation & Serving in Virginia
RELATED REPORTS & OPTIONS
Food Preparation & Serving
Virginia
Compare Zip Codes
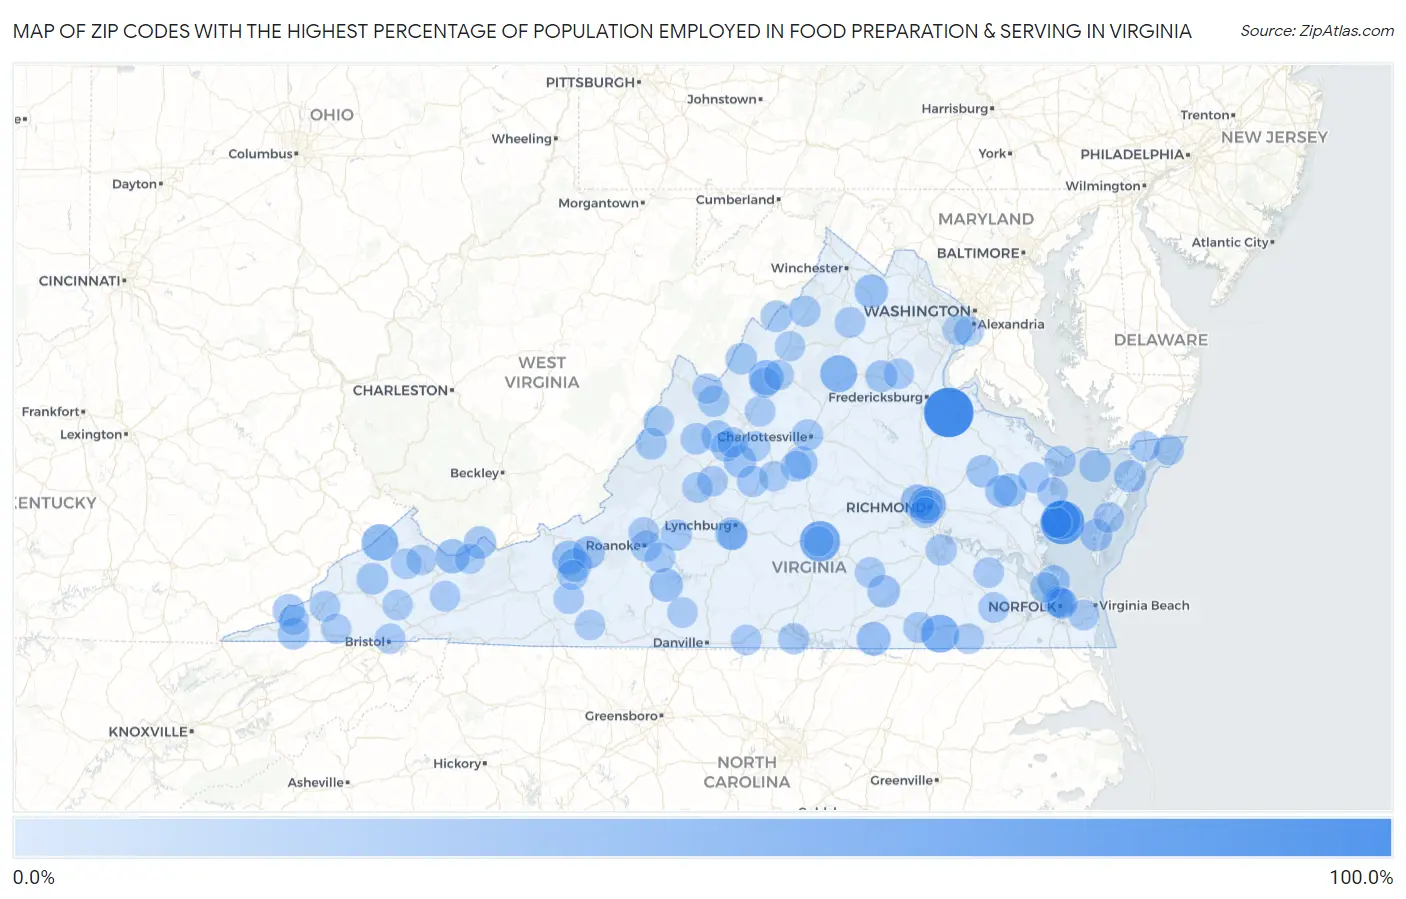
Map of Zip Codes with the Highest Percentage of Population Employed in Food Preparation & Serving in Virginia
0.0%
100.0%
Zip Codes with the Highest Percentage of Population Employed in Food Preparation & Serving in Virginia
| Zip Code | % Employed | vs State | vs National | |
| 1. | 22538 | 100.0% | 4.8%(+95.2)#1 | 5.3%(+94.7)#7 |
| 2. | 23045 | 73.1% | 4.8%(+68.3)#2 | 5.3%(+67.8)#20 |
| 3. | 23909 | 55.3% | 4.8%(+50.5)#3 | 5.3%(+50.0)#40 |
| 4. | 23119 | 47.6% | 4.8%(+42.8)#4 | 5.3%(+42.3)#65 |
| 5. | 23844 | 44.3% | 4.8%(+39.5)#5 | 5.3%(+39.0)#80 |
| 6. | 23284 | 40.1% | 4.8%(+35.3)#6 | 5.3%(+34.8)#103 |
| 7. | 22722 | 39.5% | 4.8%(+34.7)#7 | 5.3%(+34.2)#107 |
| 8. | 24607 | 38.0% | 4.8%(+33.2)#8 | 5.3%(+32.7)#116 |
| 9. | 22807 | 29.9% | 4.8%(+25.1)#9 | 5.3%(+24.6)#214 |
| 10. | 24602 | 27.3% | 4.8%(+22.5)#10 | 5.3%(+22.0)#257 |
| 11. | 23893 | 25.1% | 4.8%(+20.3)#11 | 5.3%(+19.8)#313 |
| 12. | 24058 | 24.0% | 4.8%(+19.2)#12 | 5.3%(+18.7)#344 |
| 13. | 20130 | 23.9% | 4.8%(+19.2)#13 | 5.3%(+18.7)#345 |
| 14. | 24092 | 23.7% | 4.8%(+18.9)#14 | 5.3%(+18.4)#357 |
| 15. | 23173 | 23.6% | 4.8%(+18.8)#15 | 5.3%(+18.3)#361 |
| 16. | 24142 | 23.2% | 4.8%(+18.4)#16 | 5.3%(+17.9)#379 |
| 17. | 23108 | 21.7% | 4.8%(+17.0)#17 | 5.3%(+16.5)#430 |
| 18. | 22946 | 19.7% | 4.8%(+14.9)#18 | 5.3%(+14.4)#525 |
| 19. | 23876 | 19.4% | 4.8%(+14.7)#19 | 5.3%(+14.2)#536 |
| 20. | 24061 | 19.3% | 4.8%(+14.5)#20 | 5.3%(+14.0)#543 |
| 21. | 24464 | 19.1% | 4.8%(+14.4)#21 | 5.3%(+13.9)#555 |
| 22. | 24606 | 19.0% | 4.8%(+14.2)#22 | 5.3%(+13.7)#569 |
| 23. | 23668 | 18.7% | 4.8%(+13.9)#23 | 5.3%(+13.4)#597 |
| 24. | 24515 | 18.1% | 4.8%(+13.3)#24 | 5.3%(+12.8)#651 |
| 25. | 23023 | 18.0% | 4.8%(+13.3)#25 | 5.3%(+12.8)#655 |
| 26. | 23091 | 18.0% | 4.8%(+13.2)#26 | 5.3%(+12.7)#661 |
| 27. | 23347 | 17.5% | 4.8%(+12.8)#27 | 5.3%(+12.3)#703 |
| 28. | 23357 | 17.0% | 4.8%(+12.3)#28 | 5.3%(+11.8)#742 |
| 29. | 24282 | 16.7% | 4.8%(+11.9)#29 | 5.3%(+11.4)#776 |
| 30. | 24459 | 16.2% | 4.8%(+11.4)#30 | 5.3%(+10.9)#829 |
| 31. | 22741 | 16.1% | 4.8%(+11.3)#31 | 5.3%(+10.8)#852 |
| 32. | 24272 | 15.5% | 4.8%(+10.7)#32 | 5.3%(+10.2)#914 |
| 33. | 24221 | 15.5% | 4.8%(+10.7)#33 | 5.3%(+10.2)#920 |
| 34. | 23440 | 15.1% | 4.8%(+10.3)#34 | 5.3%(+9.77)#976 |
| 35. | 22831 | 14.5% | 4.8%(+9.75)#35 | 5.3%(+9.25)#1,053 |
| 36. | 22810 | 14.4% | 4.8%(+9.65)#36 | 5.3%(+9.15)#1,073 |
| 37. | 24439 | 14.4% | 4.8%(+9.58)#37 | 5.3%(+9.09)#1,084 |
| 38. | 22904 | 14.1% | 4.8%(+9.28)#38 | 5.3%(+8.78)#1,150 |
| 39. | 22964 | 13.9% | 4.8%(+9.15)#39 | 5.3%(+8.65)#1,176 |
| 40. | 24445 | 13.8% | 4.8%(+8.99)#40 | 5.3%(+8.49)#1,215 |
| 41. | 24485 | 13.5% | 4.8%(+8.76)#41 | 5.3%(+8.26)#1,266 |
| 42. | 24174 | 13.2% | 4.8%(+8.41)#42 | 5.3%(+7.91)#1,339 |
| 43. | 23801 | 13.2% | 4.8%(+8.40)#43 | 5.3%(+7.90)#1,340 |
| 44. | 24013 | 13.2% | 4.8%(+8.38)#44 | 5.3%(+7.88)#1,350 |
| 45. | 22539 | 13.1% | 4.8%(+8.35)#45 | 5.3%(+7.85)#1,359 |
| 46. | 24529 | 12.9% | 4.8%(+8.08)#46 | 5.3%(+7.58)#1,424 |
| 47. | 22664 | 12.7% | 4.8%(+7.89)#47 | 5.3%(+7.39)#1,476 |
| 48. | 23847 | 12.2% | 4.8%(+7.40)#48 | 5.3%(+6.91)#1,601 |
| 49. | 24476 | 12.0% | 4.8%(+7.21)#49 | 5.3%(+6.71)#1,667 |
| 50. | 23508 | 11.7% | 4.8%(+6.89)#50 | 5.3%(+6.39)#1,785 |
| 51. | 23415 | 11.1% | 4.8%(+6.30)#51 | 5.3%(+5.80)#2,018 |
| 52. | 23220 | 11.1% | 4.8%(+6.27)#52 | 5.3%(+5.77)#2,029 |
| 53. | 23517 | 11.0% | 4.8%(+6.25)#53 | 5.3%(+5.75)#2,040 |
| 54. | 22937 | 11.0% | 4.8%(+6.19)#54 | 5.3%(+5.69)#2,065 |
| 55. | 23453 | 10.9% | 4.8%(+6.08)#55 | 5.3%(+5.58)#2,128 |
| 56. | 22640 | 10.8% | 4.8%(+6.06)#56 | 5.3%(+5.56)#2,140 |
| 57. | 24219 | 10.8% | 4.8%(+6.02)#57 | 5.3%(+5.52)#2,152 |
| 58. | 24484 | 10.8% | 4.8%(+6.01)#58 | 5.3%(+5.51)#2,160 |
| 59. | 24020 | 10.7% | 4.8%(+5.93)#59 | 5.3%(+5.43)#2,199 |
| 60. | 22503 | 10.6% | 4.8%(+5.81)#60 | 5.3%(+5.31)#2,267 |
| 61. | 23413 | 10.5% | 4.8%(+5.72)#61 | 5.3%(+5.22)#2,324 |
| 62. | 24370 | 10.5% | 4.8%(+5.72)#62 | 5.3%(+5.22)#2,326 |
| 63. | 23898 | 10.5% | 4.8%(+5.70)#63 | 5.3%(+5.20)#2,331 |
| 64. | 23504 | 10.4% | 4.8%(+5.66)#64 | 5.3%(+5.16)#2,353 |
| 65. | 23109 | 10.2% | 4.8%(+5.39)#65 | 5.3%(+4.89)#2,494 |
| 66. | 23824 | 10.2% | 4.8%(+5.39)#66 | 5.3%(+4.89)#2,498 |
| 67. | 23874 | 10.1% | 4.8%(+5.35)#67 | 5.3%(+4.85)#2,534 |
| 68. | 24416 | 10.1% | 4.8%(+5.35)#68 | 5.3%(+4.85)#2,536 |
| 69. | 24520 | 10.1% | 4.8%(+5.32)#69 | 5.3%(+4.82)#2,555 |
| 70. | 22742 | 10.1% | 4.8%(+5.30)#70 | 5.3%(+4.80)#2,565 |
| 71. | 24437 | 10.1% | 4.8%(+5.30)#71 | 5.3%(+4.80)#2,570 |
| 72. | 22578 | 10.1% | 4.8%(+5.29)#72 | 5.3%(+4.79)#2,579 |
| 73. | 24105 | 10.1% | 4.8%(+5.28)#73 | 5.3%(+4.78)#2,585 |
| 74. | 24646 | 10.0% | 4.8%(+5.21)#74 | 5.3%(+4.71)#2,631 |
| 75. | 24555 | 10.0% | 4.8%(+5.20)#75 | 5.3%(+4.70)#2,644 |
| 76. | 23839 | 10.0% | 4.8%(+5.17)#76 | 5.3%(+4.67)#2,664 |
| 77. | 22801 | 9.9% | 4.8%(+5.15)#77 | 5.3%(+4.65)#2,679 |
| 78. | 24201 | 9.8% | 4.8%(+5.05)#78 | 5.3%(+4.55)#2,770 |
| 79. | 24266 | 9.8% | 4.8%(+4.99)#79 | 5.3%(+4.49)#2,821 |
| 80. | 24101 | 9.7% | 4.8%(+4.92)#80 | 5.3%(+4.42)#2,882 |
| 81. | 24530 | 9.7% | 4.8%(+4.91)#81 | 5.3%(+4.42)#2,884 |
| 82. | 24141 | 9.6% | 4.8%(+4.86)#82 | 5.3%(+4.36)#2,930 |
| 83. | 24639 | 9.6% | 4.8%(+4.85)#83 | 5.3%(+4.35)#2,937 |
| 84. | 24277 | 9.6% | 4.8%(+4.84)#84 | 5.3%(+4.34)#2,948 |
| 85. | 24120 | 9.5% | 4.8%(+4.70)#85 | 5.3%(+4.20)#3,061 |
| 86. | 23224 | 9.4% | 4.8%(+4.61)#86 | 5.3%(+4.11)#3,143 |
| 87. | 24440 | 9.3% | 4.8%(+4.54)#87 | 5.3%(+4.04)#3,219 |
| 88. | 22832 | 9.3% | 4.8%(+4.47)#88 | 5.3%(+3.97)#3,276 |
| 89. | 23901 | 9.2% | 4.8%(+4.43)#89 | 5.3%(+3.93)#3,310 |
| 90. | 24630 | 9.2% | 4.8%(+4.42)#90 | 5.3%(+3.92)#3,320 |
| 91. | 22971 | 9.2% | 4.8%(+4.41)#91 | 5.3%(+3.91)#3,323 |
| 92. | 24251 | 9.2% | 4.8%(+4.40)#92 | 5.3%(+3.90)#3,342 |
| 93. | 23336 | 9.1% | 4.8%(+4.35)#93 | 5.3%(+3.85)#3,383 |
| 94. | 24501 | 9.1% | 4.8%(+4.31)#94 | 5.3%(+3.81)#3,419 |
| 95. | 24442 | 9.1% | 4.8%(+4.30)#95 | 5.3%(+3.80)#3,437 |
| 96. | 22150 | 9.0% | 4.8%(+4.26)#96 | 5.3%(+3.76)#3,476 |
| 97. | 23607 | 9.0% | 4.8%(+4.18)#97 | 5.3%(+3.68)#3,557 |
| 98. | 22952 | 8.9% | 4.8%(+4.12)#98 | 5.3%(+3.62)#3,608 |
| 99. | 22306 | 8.9% | 4.8%(+4.11)#99 | 5.3%(+3.61)#3,627 |
| 100. | 22844 | 8.8% | 4.8%(+4.01)#100 | 5.3%(+3.51)#3,733 |
Common Questions
What are the Top 10 Zip Codes with the Highest Percentage of Population Employed in Food Preparation & Serving in Virginia?
Top 10 Zip Codes with the Highest Percentage of Population Employed in Food Preparation & Serving in Virginia are:
What zip code has the Highest Percentage of Population Employed in Food Preparation & Serving in Virginia?
22538 has the Highest Percentage of Population Employed in Food Preparation & Serving in Virginia with 100.0%.
What is the Percentage of Population Employed in Food Preparation & Serving in the State of Virginia?
Percentage of Population Employed in Food Preparation & Serving in Virginia is 4.8%.
What is the Percentage of Population Employed in Food Preparation & Serving in the United States?
Percentage of Population Employed in Food Preparation & Serving in the United States is 5.3%.