Zip Codes with the Highest Percentage of Households with Income Below $10,000 in the United States
RELATED REPORTS & OPTIONS
Household Income | $0-10k
United States
Compare Zip Codes
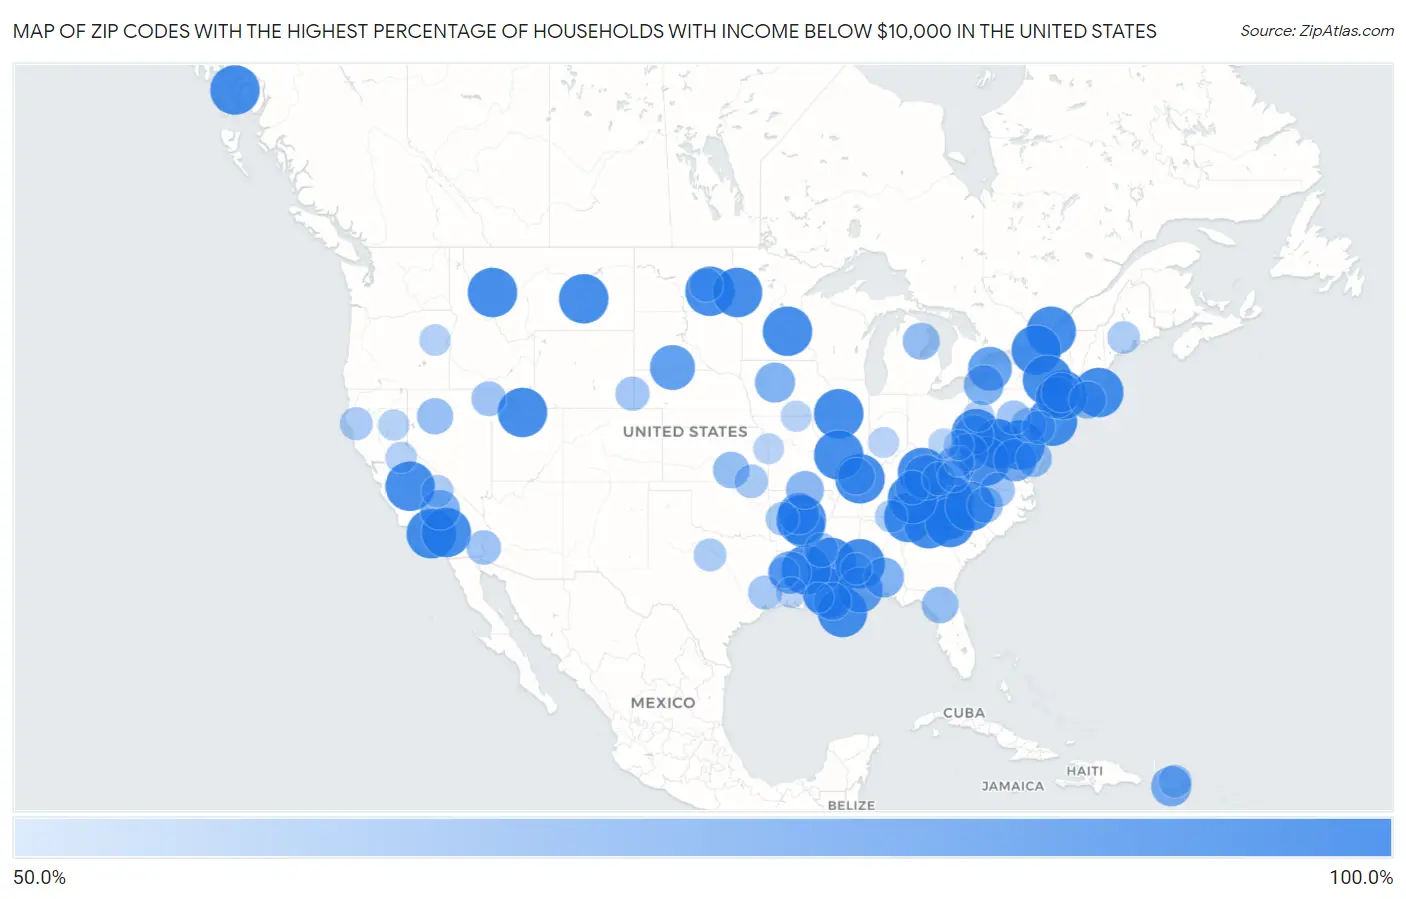
Map of Zip Codes with the Highest Percentage of Households with Income Below $10,000 in the United States
50.0%
100.0%
Zip Codes with the Highest Percentage of Households with Income Below $10,000 in the United States
| Zip Code | Households with Income < $10k | vs State | vs National | |
| 1. | 55455 | 100.0% | 3.6%(+96.4)#1 | 4.9%(+95.1)#1 |
| 2. | 02912 | 100.0% | 4.6%(+95.4)#1 | 4.9%(+95.1)#2 |
| 3. | 08544 | 100.0% | 4.1%(+95.9)#1 | 4.9%(+95.1)#3 |
| 4. | 20742 | 100.0% | 4.2%(+95.8)#1 | 4.9%(+95.1)#4 |
| 5. | 90089 | 100.0% | 4.4%(+95.6)#1 | 4.9%(+95.1)#5 |
| 6. | 39217 | 100.0% | 7.4%(+92.6)#1 | 4.9%(+95.1)#6 |
| 7. | 12604 | 100.0% | 5.6%(+94.4)#1 | 4.9%(+95.1)#7 |
| 8. | 59812 | 100.0% | 4.6%(+95.4)#1 | 4.9%(+95.1)#8 |
| 9. | 58405 | 100.0% | 4.6%(+95.4)#1 | 4.9%(+95.1)#9 |
| 10. | 56562 | 100.0% | 3.6%(+96.4)#2 | 4.9%(+95.1)#10 |
| 11. | 92350 | 100.0% | 4.4%(+95.6)#2 | 4.9%(+95.1)#11 |
| 12. | 61625 | 100.0% | 5.3%(+94.7)#1 | 4.9%(+95.1)#12 |
| 13. | 30751 | 100.0% | 5.4%(+94.6)#1 | 4.9%(+95.1)#13 |
| 14. | 29338 | 100.0% | 6.1%(+93.9)#1 | 4.9%(+95.1)#14 |
| 15. | 93741 | 100.0% | 4.4%(+95.6)#3 | 4.9%(+95.1)#15 |
| 16. | 30598 | 100.0% | 5.4%(+94.6)#2 | 4.9%(+95.1)#16 |
| 17. | 70451 | 100.0% | 7.4%(+92.6)#1 | 4.9%(+95.1)#17 |
| 18. | 13683 | 100.0% | 5.6%(+94.4)#2 | 4.9%(+95.1)#18 |
| 19. | 13643 | 100.0% | 5.6%(+94.4)#3 | 4.9%(+95.1)#19 |
| 20. | 28641 | 100.0% | 5.1%(+94.9)#1 | 4.9%(+95.1)#20 |
| 21. | 26543 | 100.0% | 6.5%(+93.5)#1 | 4.9%(+95.1)#21 |
| 22. | 13747 | 100.0% | 5.6%(+94.4)#4 | 4.9%(+95.1)#22 |
| 23. | 26823 | 100.0% | 6.5%(+93.5)#2 | 4.9%(+95.1)#23 |
| 24. | 29331 | 100.0% | 6.1%(+93.9)#2 | 4.9%(+95.1)#24 |
| 25. | 71425 | 100.0% | 7.4%(+92.6)#2 | 4.9%(+95.1)#25 |
| 26. | 72199 | 100.0% | 6.0%(+94.0)#1 | 4.9%(+95.1)#26 |
| 27. | 42037 | 100.0% | 6.1%(+93.9)#1 | 4.9%(+95.1)#27 |
| 28. | 70038 | 100.0% | 7.4%(+92.6)#3 | 4.9%(+95.1)#29 |
| 29. | 36910 | 100.0% | 6.5%(+93.5)#1 | 4.9%(+95.1)#30 |
| 30. | 62266 | 100.0% | 5.3%(+94.7)#2 | 4.9%(+95.1)#31 |
| 31. | 37719 | 100.0% | 5.3%(+94.7)#1 | 4.9%(+95.1)#32 |
| 32. | 41386 | 100.0% | 6.1%(+93.9)#2 | 4.9%(+95.1)#33 |
| 33. | 84150 | 100.0% | 3.1%(+96.9)#1 | 4.9%(+95.1)#34 |
| 34. | 24411 | 100.0% | 4.2%(+95.8)#1 | 4.9%(+95.1)#35 |
| 35. | 59083 | 100.0% | 4.6%(+95.4)#2 | 4.9%(+95.1)#36 |
| 36. | 28041 | 100.0% | 5.1%(+94.9)#2 | 4.9%(+95.1)#37 |
| 37. | 99903 | 100.0% | 3.9%(+96.1)#1 | 4.9%(+95.1)#38 |
| 38. | 36688 | 89.3% | 6.5%(+82.8)#2 | 4.9%(+84.4)#39 |
| 39. | 57574 | 88.7% | 4.2%(+84.5)#1 | 4.9%(+83.8)#40 |
| 40. | 41762 | 88.6% | 6.1%(+82.5)#3 | 4.9%(+83.7)#41 |
| 41. | 14302 | 85.6% | 5.6%(+80.0)#5 | 4.9%(+80.7)#42 |
| 42. | 72182 | 82.8% | 6.0%(+76.8)#2 | 4.9%(+77.9)#43 |
| 43. | 22538 | 82.4% | 4.2%(+78.2)#2 | 4.9%(+77.5)#44 |
| 44. | 71497 | 82.1% | 7.4%(+74.7)#4 | 4.9%(+77.2)#45 |
| 45. | 10985 | 80.0% | 5.6%(+74.4)#6 | 4.9%(+75.1)#46 |
| 46. | 72181 | 80.0% | 6.0%(+74.0)#3 | 4.9%(+75.1)#47 |
| 47. | 00786 | 76.7% | 22.7%(+54.0)#1 | 4.9%(+71.8)#48 |
| 48. | 50521 | 76.5% | 4.2%(+72.3)#1 | 4.9%(+71.6)#49 |
| 49. | 36038 | 76.0% | 6.5%(+69.5)#3 | 4.9%(+71.1)#50 |
| 50. | 93528 | 76.0% | 4.4%(+71.6)#4 | 4.9%(+71.1)#51 |
| 51. | 14722 | 75.8% | 5.6%(+70.2)#7 | 4.9%(+70.9)#52 |
| 52. | 12471 | 75.7% | 5.6%(+70.1)#8 | 4.9%(+70.8)#53 |
| 53. | 26560 | 75.6% | 6.5%(+69.1)#3 | 4.9%(+70.7)#54 |
| 54. | 25062 | 74.4% | 6.5%(+67.9)#4 | 4.9%(+69.5)#55 |
| 55. | 26217 | 71.2% | 6.5%(+64.7)#5 | 4.9%(+66.3)#56 |
| 56. | 65777 | 71.2% | 5.0%(+66.2)#1 | 4.9%(+66.3)#57 |
| 57. | 70148 | 70.8% | 7.4%(+63.4)#5 | 4.9%(+65.9)#58 |
| 58. | 06353 | 69.3% | 4.3%(+65.0)#1 | 4.9%(+64.4)#59 |
| 59. | 42047 | 68.8% | 6.1%(+62.7)#4 | 4.9%(+63.9)#60 |
| 60. | 48743 | 68.4% | 5.0%(+63.4)#1 | 4.9%(+63.5)#61 |
| 61. | 67232 | 67.6% | 4.5%(+63.1)#1 | 4.9%(+62.7)#62 |
| 62. | 32616 | 67.6% | 5.2%(+62.4)#1 | 4.9%(+62.7)#63 |
| 63. | 89418 | 66.7% | 5.4%(+61.3)#1 | 4.9%(+61.8)#64 |
| 64. | 21814 | 66.7% | 4.2%(+62.5)#2 | 4.9%(+61.8)#65 |
| 65. | 27213 | 65.8% | 5.1%(+60.7)#3 | 4.9%(+60.9)#66 |
| 66. | 27584 | 63.0% | 5.1%(+57.9)#4 | 4.9%(+58.1)#67 |
| 67. | 89830 | 62.9% | 5.4%(+57.5)#2 | 4.9%(+58.0)#68 |
| 68. | 17606 | 62.8% | 4.8%(+58.0)#1 | 4.9%(+57.9)#69 |
| 69. | 85328 | 62.5% | 4.9%(+57.6)#1 | 4.9%(+57.6)#70 |
| 70. | 38765 | 61.9% | 7.4%(+54.5)#2 | 4.9%(+57.0)#71 |
| 71. | 42638 | 61.8% | 6.1%(+55.7)#5 | 4.9%(+56.9)#72 |
| 72. | 82217 | 61.5% | 4.6%(+56.9)#1 | 4.9%(+56.6)#73 |
| 73. | 17056 | 61.5% | 4.8%(+56.7)#2 | 4.9%(+56.6)#74 |
| 74. | 77326 | 60.9% | 5.1%(+55.8)#1 | 4.9%(+56.0)#75 |
| 75. | 58476 | 60.5% | 4.6%(+55.9)#2 | 4.9%(+55.6)#76 |
| 76. | 67364 | 60.4% | 4.5%(+55.9)#2 | 4.9%(+55.5)#77 |
| 77. | 72828 | 60.3% | 6.0%(+54.3)#4 | 4.9%(+55.4)#78 |
| 78. | 41517 | 60.0% | 6.1%(+53.9)#6 | 4.9%(+55.1)#79 |
| 79. | 19383 | 59.5% | 4.8%(+54.7)#3 | 4.9%(+54.6)#80 |
| 80. | 00913 | 59.0% | 22.7%(+36.3)#2 | 4.9%(+54.1)#81 |
| 81. | 95511 | 58.6% | 4.4%(+54.2)#5 | 4.9%(+53.7)#82 |
| 82. | 76429 | 58.3% | 5.1%(+53.2)#2 | 4.9%(+53.4)#83 |
| 83. | 04975 | 57.7% | 4.2%(+53.5)#1 | 4.9%(+52.8)#84 |
| 84. | 37376 | 57.6% | 5.3%(+52.3)#2 | 4.9%(+52.7)#85 |
| 85. | 93530 | 57.1% | 4.4%(+52.7)#6 | 4.9%(+52.2)#86 |
| 86. | 24830 | 56.7% | 6.5%(+50.2)#6 | 4.9%(+51.8)#87 |
| 87. | 36913 | 56.0% | 6.5%(+49.5)#4 | 4.9%(+51.1)#88 |
| 88. | 71406 | 55.3% | 7.4%(+47.9)#6 | 4.9%(+50.4)#89 |
| 89. | 15075 | 55.0% | 4.8%(+50.2)#4 | 4.9%(+50.1)#90 |
| 90. | 95248 | 54.8% | 4.4%(+50.4)#7 | 4.9%(+49.9)#91 |
| 91. | 97837 | 54.8% | 4.4%(+50.4)#1 | 4.9%(+49.9)#92 |
| 92. | 95934 | 54.2% | 4.4%(+49.8)#8 | 4.9%(+49.3)#93 |
| 93. | 70651 | 53.8% | 7.4%(+46.4)#7 | 4.9%(+48.9)#94 |
| 94. | 63535 | 53.8% | 5.0%(+48.8)#2 | 4.9%(+48.9)#95 |
| 95. | 47406 | 53.3% | 5.0%(+48.3)#1 | 4.9%(+48.4)#96 |
| 96. | 64147 | 53.3% | 5.0%(+48.3)#3 | 4.9%(+48.4)#97 |
| 97. | 25057 | 53.2% | 6.5%(+46.7)#7 | 4.9%(+48.3)#98 |
| 98. | 45741 | 53.0% | 5.2%(+47.8)#1 | 4.9%(+48.1)#99 |
| 99. | 26138 | 53.0% | 6.5%(+46.5)#8 | 4.9%(+48.1)#100 |
| 100. | 70721 | 52.4% | 7.4%(+45.0)#8 | 4.9%(+47.5)#101 |
Common Questions
What are the Top 10 Zip Codes with the Highest Percentage of Households with Income Below $10,000 in the United States?
Top 10 Zip Codes with the Highest Percentage of Households with Income Below $10,000 in the United States are:
#1
100.0%
#2
100.0%
#3
100.0%
#4
100.0%
#5
100.0%
#6
100.0%
#7
100.0%
#8
100.0%
#9
100.0%
#10
100.0%
What zip code has the Highest Percentage of Households with Income Below $10,000 in the United States?
55455 has the Highest Percentage of Households with Income Below $10,000 in the United States with 100.0%.
What is the Percentage of Households with Income Below $10,000 in the United States?
Percentage of Households with Income Below $10,000 in the United States is 4.9%.