Zip Codes with the Highest Percentage of Population Employed in Food Preparation & Serving in Michigan
RELATED REPORTS & OPTIONS
Food Preparation & Serving
Michigan
Compare Zip Codes
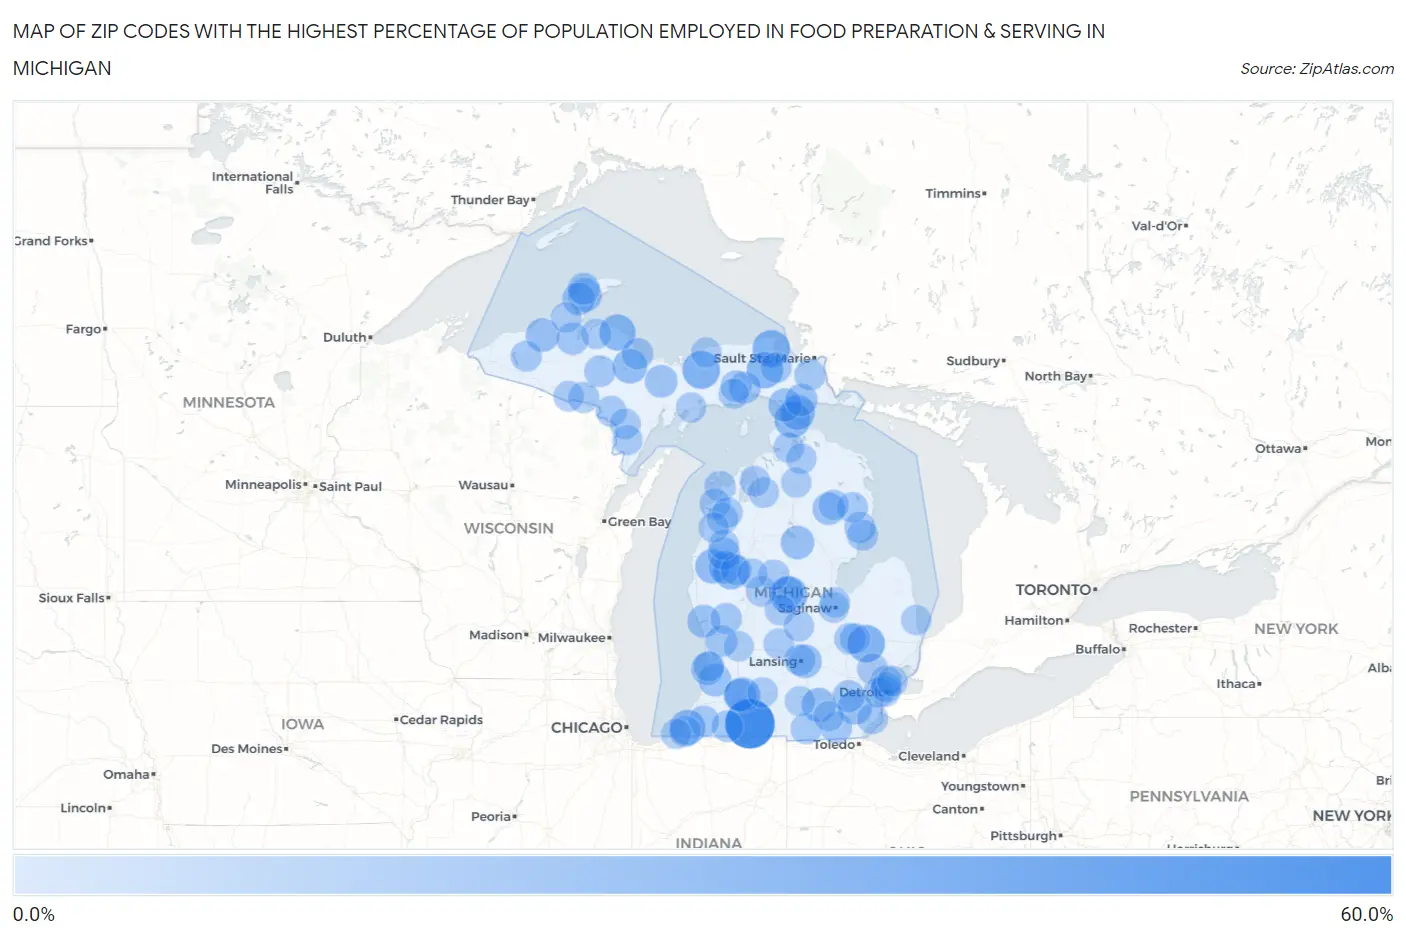
Map of Zip Codes with the Highest Percentage of Population Employed in Food Preparation & Serving in Michigan
0.0%
60.0%
Zip Codes with the Highest Percentage of Population Employed in Food Preparation & Serving in Michigan
| Zip Code | % Employed | vs State | vs National | |
| 1. | 49075 | 51.5% | 5.7%(+45.8)#1 | 5.3%(+46.2)#52 |
| 2. | 49884 | 25.1% | 5.7%(+19.5)#2 | 5.3%(+19.9)#312 |
| 3. | 49768 | 24.6% | 5.7%(+18.9)#3 | 5.3%(+19.3)#323 |
| 4. | 48440 | 24.4% | 5.7%(+18.7)#4 | 5.3%(+19.1)#329 |
| 5. | 48859 | 24.2% | 5.7%(+18.5)#5 | 5.3%(+18.9)#334 |
| 6. | 49748 | 22.5% | 5.7%(+16.8)#6 | 5.3%(+17.2)#401 |
| 7. | 49808 | 21.6% | 5.7%(+15.9)#7 | 5.3%(+16.3)#433 |
| 8. | 49642 | 21.3% | 5.7%(+15.6)#8 | 5.3%(+16.0)#448 |
| 9. | 49701 | 21.2% | 5.7%(+15.5)#9 | 5.3%(+15.9)#450 |
| 10. | 49119 | 20.2% | 5.7%(+14.6)#10 | 5.3%(+14.9)#491 |
| 11. | 49007 | 19.8% | 5.7%(+14.2)#11 | 5.3%(+14.5)#517 |
| 12. | 49757 | 19.0% | 5.7%(+13.4)#12 | 5.3%(+13.7)#562 |
| 13. | 49458 | 18.3% | 5.7%(+12.7)#13 | 5.3%(+13.0)#623 |
| 14. | 49871 | 18.1% | 5.7%(+12.5)#14 | 5.3%(+12.9)#644 |
| 15. | 49261 | 17.6% | 5.7%(+11.9)#15 | 5.3%(+12.3)#698 |
| 16. | 48190 | 17.6% | 5.7%(+11.9)#16 | 5.3%(+12.3)#701 |
| 17. | 49917 | 16.7% | 5.7%(+11.0)#17 | 5.3%(+11.4)#781 |
| 18. | 49929 | 16.3% | 5.7%(+10.6)#18 | 5.3%(+11.0)#821 |
| 19. | 48651 | 16.2% | 5.7%(+10.5)#19 | 5.3%(+10.9)#841 |
| 20. | 48825 | 16.1% | 5.7%(+10.5)#20 | 5.3%(+10.8)#843 |
| 21. | 49781 | 15.4% | 5.7%(+9.69)#21 | 5.3%(+10.1)#936 |
| 22. | 49304 | 14.9% | 5.7%(+9.22)#22 | 5.3%(+9.60)#996 |
| 23. | 49450 | 14.8% | 5.7%(+9.11)#23 | 5.3%(+9.50)#1,009 |
| 24. | 49440 | 14.8% | 5.7%(+9.10)#24 | 5.3%(+9.48)#1,013 |
| 25. | 49406 | 14.6% | 5.7%(+8.97)#25 | 5.3%(+9.36)#1,038 |
| 26. | 49006 | 14.4% | 5.7%(+8.73)#26 | 5.3%(+9.11)#1,078 |
| 27. | 49913 | 14.3% | 5.7%(+8.65)#27 | 5.3%(+9.03)#1,092 |
| 28. | 49644 | 13.9% | 5.7%(+8.25)#28 | 5.3%(+8.64)#1,178 |
| 29. | 48647 | 13.9% | 5.7%(+8.22)#29 | 5.3%(+8.61)#1,184 |
| 30. | 49891 | 13.9% | 5.7%(+8.19)#30 | 5.3%(+8.58)#1,191 |
| 31. | 49745 | 13.8% | 5.7%(+8.13)#31 | 5.3%(+8.52)#1,207 |
| 32. | 49908 | 13.6% | 5.7%(+7.95)#32 | 5.3%(+8.34)#1,252 |
| 33. | 48858 | 12.9% | 5.7%(+7.21)#33 | 5.3%(+7.60)#1,421 |
| 34. | 48109 | 12.9% | 5.7%(+7.19)#34 | 5.3%(+7.57)#1,426 |
| 35. | 49805 | 12.8% | 5.7%(+7.17)#35 | 5.3%(+7.56)#1,433 |
| 36. | 49401 | 12.6% | 5.7%(+6.91)#36 | 5.3%(+7.30)#1,497 |
| 37. | 49827 | 12.3% | 5.7%(+6.62)#37 | 5.3%(+7.01)#1,567 |
| 38. | 49855 | 12.1% | 5.7%(+6.39)#38 | 5.3%(+6.77)#1,642 |
| 39. | 49061 | 11.9% | 5.7%(+6.26)#39 | 5.3%(+6.65)#1,692 |
| 40. | 49879 | 11.8% | 5.7%(+6.15)#40 | 5.3%(+6.54)#1,727 |
| 41. | 48502 | 11.7% | 5.7%(+6.04)#41 | 5.3%(+6.42)#1,772 |
| 42. | 49820 | 11.6% | 5.7%(+5.96)#42 | 5.3%(+6.34)#1,807 |
| 43. | 49268 | 11.6% | 5.7%(+5.92)#43 | 5.3%(+6.31)#1,819 |
| 44. | 48915 | 11.4% | 5.7%(+5.73)#44 | 5.3%(+6.12)#1,875 |
| 45. | 49303 | 11.4% | 5.7%(+5.71)#45 | 5.3%(+6.10)#1,882 |
| 46. | 49102 | 11.2% | 5.7%(+5.48)#46 | 5.3%(+5.87)#1,981 |
| 47. | 48750 | 11.1% | 5.7%(+5.41)#47 | 5.3%(+5.80)#2,020 |
| 48. | 48730 | 11.0% | 5.7%(+5.37)#48 | 5.3%(+5.76)#2,037 |
| 49. | 49683 | 11.0% | 5.7%(+5.31)#49 | 5.3%(+5.70)#2,062 |
| 50. | 49128 | 11.0% | 5.7%(+5.31)#50 | 5.3%(+5.70)#2,063 |
| 51. | 49630 | 11.0% | 5.7%(+5.28)#51 | 5.3%(+5.67)#2,077 |
| 52. | 49724 | 10.9% | 5.7%(+5.25)#52 | 5.3%(+5.63)#2,091 |
| 53. | 49271 | 10.9% | 5.7%(+5.23)#53 | 5.3%(+5.62)#2,104 |
| 54. | 49925 | 10.9% | 5.7%(+5.20)#54 | 5.3%(+5.58)#2,124 |
| 55. | 48091 | 10.7% | 5.7%(+5.05)#55 | 5.3%(+5.44)#2,193 |
| 56. | 49640 | 10.6% | 5.7%(+4.97)#56 | 5.3%(+5.36)#2,234 |
| 57. | 49902 | 10.6% | 5.7%(+4.97)#57 | 5.3%(+5.35)#2,237 |
| 58. | 49870 | 10.6% | 5.7%(+4.90)#58 | 5.3%(+5.29)#2,288 |
| 59. | 48705 | 10.3% | 5.7%(+4.65)#59 | 5.3%(+5.04)#2,411 |
| 60. | 49728 | 10.3% | 5.7%(+4.64)#60 | 5.3%(+5.02)#2,422 |
| 61. | 48166 | 10.3% | 5.7%(+4.62)#61 | 5.3%(+5.01)#2,429 |
| 62. | 48341 | 10.3% | 5.7%(+4.59)#62 | 5.3%(+4.98)#2,444 |
| 63. | 49915 | 10.3% | 5.7%(+4.58)#63 | 5.3%(+4.97)#2,453 |
| 64. | 48208 | 10.2% | 5.7%(+4.55)#64 | 5.3%(+4.94)#2,470 |
| 65. | 49955 | 10.2% | 5.7%(+4.50)#65 | 5.3%(+4.88)#2,503 |
| 66. | 48891 | 10.1% | 5.7%(+4.45)#66 | 5.3%(+4.84)#2,541 |
| 67. | 48509 | 10.0% | 5.7%(+4.37)#67 | 5.3%(+4.76)#2,596 |
| 68. | 49623 | 10.0% | 5.7%(+4.35)#68 | 5.3%(+4.74)#2,614 |
| 69. | 48126 | 10.0% | 5.7%(+4.31)#69 | 5.3%(+4.69)#2,650 |
| 70. | 48851 | 9.9% | 5.7%(+4.26)#70 | 5.3%(+4.65)#2,676 |
| 71. | 49847 | 9.9% | 5.7%(+4.26)#71 | 5.3%(+4.65)#2,681 |
| 72. | 48874 | 9.9% | 5.7%(+4.23)#72 | 5.3%(+4.61)#2,705 |
| 73. | 49332 | 9.9% | 5.7%(+4.22)#73 | 5.3%(+4.61)#2,707 |
| 74. | 49706 | 9.9% | 5.7%(+4.22)#74 | 5.3%(+4.61)#2,712 |
| 75. | 48632 | 9.9% | 5.7%(+4.22)#75 | 5.3%(+4.61)#2,714 |
| 76. | 49612 | 9.8% | 5.7%(+4.15)#76 | 5.3%(+4.54)#2,775 |
| 77. | 48602 | 9.8% | 5.7%(+4.10)#77 | 5.3%(+4.48)#2,823 |
| 78. | 49799 | 9.7% | 5.7%(+4.06)#78 | 5.3%(+4.44)#2,861 |
| 79. | 49643 | 9.7% | 5.7%(+4.02)#79 | 5.3%(+4.41)#2,886 |
| 80. | 49037 | 9.7% | 5.7%(+3.99)#80 | 5.3%(+4.37)#2,919 |
| 81. | 49453 | 9.5% | 5.7%(+3.86)#81 | 5.3%(+4.25)#3,026 |
| 82. | 49962 | 9.5% | 5.7%(+3.85)#82 | 5.3%(+4.24)#3,037 |
| 83. | 48621 | 9.5% | 5.7%(+3.81)#83 | 5.3%(+4.20)#3,071 |
| 84. | 49648 | 9.5% | 5.7%(+3.80)#84 | 5.3%(+4.19)#3,076 |
| 85. | 48211 | 9.5% | 5.7%(+3.80)#85 | 5.3%(+4.18)#3,082 |
| 86. | 49117 | 9.4% | 5.7%(+3.74)#86 | 5.3%(+4.13)#3,121 |
| 87. | 49689 | 9.4% | 5.7%(+3.74)#87 | 5.3%(+4.13)#3,124 |
| 88. | 49287 | 9.4% | 5.7%(+3.70)#88 | 5.3%(+4.09)#3,160 |
| 89. | 49838 | 9.4% | 5.7%(+3.70)#89 | 5.3%(+4.09)#3,162 |
| 90. | 49507 | 9.4% | 5.7%(+3.70)#90 | 5.3%(+4.08)#3,166 |
| 91. | 48021 | 9.4% | 5.7%(+3.70)#91 | 5.3%(+4.08)#3,169 |
| 92. | 49614 | 9.4% | 5.7%(+3.68)#92 | 5.3%(+4.07)#3,181 |
| 93. | 49283 | 9.3% | 5.7%(+3.65)#93 | 5.3%(+4.03)#3,222 |
| 94. | 49817 | 9.2% | 5.7%(+3.56)#94 | 5.3%(+3.94)#3,290 |
| 95. | 49821 | 9.2% | 5.7%(+3.54)#95 | 5.3%(+3.93)#3,304 |
| 96. | 49839 | 9.2% | 5.7%(+3.52)#96 | 5.3%(+3.91)#3,327 |
| 97. | 48604 | 9.1% | 5.7%(+3.41)#97 | 5.3%(+3.80)#3,443 |
| 98. | 49735 | 9.1% | 5.7%(+3.41)#98 | 5.3%(+3.79)#3,445 |
| 99. | 49639 | 9.0% | 5.7%(+3.35)#99 | 5.3%(+3.74)#3,501 |
| 100. | 48450 | 9.0% | 5.7%(+3.35)#100 | 5.3%(+3.74)#3,502 |
Common Questions
What are the Top 10 Zip Codes with the Highest Percentage of Population Employed in Food Preparation & Serving in Michigan?
Top 10 Zip Codes with the Highest Percentage of Population Employed in Food Preparation & Serving in Michigan are:
What zip code has the Highest Percentage of Population Employed in Food Preparation & Serving in Michigan?
49075 has the Highest Percentage of Population Employed in Food Preparation & Serving in Michigan with 51.5%.
What is the Percentage of Population Employed in Food Preparation & Serving in the State of Michigan?
Percentage of Population Employed in Food Preparation & Serving in Michigan is 5.7%.
What is the Percentage of Population Employed in Food Preparation & Serving in the United States?
Percentage of Population Employed in Food Preparation & Serving in the United States is 5.3%.