Zip Codes with the Highest Percentage of Population Employed in Food Preparation & Serving in Rhode Island

RELATED REPORTS & OPTIONS

Food Preparation & Serving
Population
Families and Households
Female Fertility
Female Fertility (Unmarried)
Race (Community Size)
Race (Percentage)
Ancestry (Community Size)
AfghanAfricanAlaska NativeAlaskan AthabascanAlbanianAleutAlsatianAmericanApacheArabArapahoArgentineanArmenianAssyrian / Chaldean / SyriacAustralianAustrianBahamianBangladeshiBarbadianBasqueBelgianBelizeanBermudanBhutaneseBlackfeetBolivianBrazilianBritishBritish West IndianBulgarianBurmeseCajunCambodianCanadianCape VerdeanCarpatho RusynCelticCentral AmericanCentral American IndianCherokeeCheyenneChickasawChileanChineseChippewaChoctawColombianColvilleComancheCosta RicanCreeCreekCroatianCrowCubanCypriotCzechCzechoslovakianDanishDelawareDominicanDutchDutch West IndianEastern EuropeanEcuadorianEgyptianEnglishEstonianEthiopianEuropeanFijianFilipinoFinnishFrenchFrench American IndianFrench CanadianGermanGerman RussianGhanaianGreekGuamanian / ChamorroGuatemalanGuyaneseHaitianHmongHonduranHopiHoumaHungarianIcelanderIndian (Asian)IndonesianInupiatIranianIraqiIrishIroquoisIsraeliItalianJamaicanJapaneseJordanianKenyanKiowaKoreanLaotianLatvianLebaneseLiberianLithuanianLumbeeLuxembourgerMacedonianMalaysianMalteseMarshalleseMenomineeMexicanMexican American IndianMongolianMoroccanNative HawaiianNavajoNepaleseNew ZealanderNicaraguanNigerianNorthern EuropeanNorwegianOkinawanOsageOttawaPaiutePakistaniPalestinianPanamanianParaguayanPennsylvania GermanPeruvianPimaPolishPortuguesePotawatomiPuebloPuerto RicanPuget Sound SalishRomanianRussianSalvadoranSamoanScandinavianScotch-IrishScottishSeminoleSenegaleseSerbianShoshoneSierra LeoneanSiouxSlavicSlovakSloveneSomaliSouth AfricanSouth AmericanSouth American IndianSoviet UnionSpaniardSpanishSpanish AmericanSpanish American IndianSri LankanSubsaharan AfricanSudaneseSwedishSwissSyrianTaiwaneseThaiTlingit-HaidaTohono O'OdhamTonganTrinidadian and TobagonianTsimshianTurkishU.S. Virgin IslanderUgandanUkrainianUruguayanUteVenezuelanVietnameseWelshWest IndianYakamaYaquiYugoslavianYumanYup'ikZimbabwean
Ancestry (Percentage)
AfghanAfricanAlaska NativeAlaskan AthabascanAlbanianAleutAlsatianAmericanApacheArabArapahoArgentineanArmenianAssyrian / Chaldean / SyriacAustralianAustrianBahamianBangladeshiBarbadianBasqueBelgianBelizeanBermudanBhutaneseBlackfeetBolivianBrazilianBritishBritish West IndianBulgarianBurmeseCajunCambodianCanadianCape VerdeanCarpatho RusynCelticCentral AmericanCentral American IndianCherokeeCheyenneChickasawChileanChineseChippewaChoctawColombianColvilleComancheCosta RicanCreeCreekCroatianCrowCubanCypriotCzechCzechoslovakianDanishDelawareDominicanDutchDutch West IndianEastern EuropeanEcuadorianEgyptianEnglishEstonianEthiopianEuropeanFijianFilipinoFinnishFrenchFrench American IndianFrench CanadianGermanGerman RussianGhanaianGreekGuamanian / ChamorroGuatemalanGuyaneseHaitianHmongHonduranHopiHoumaHungarianIcelanderIndian (Asian)IndonesianInupiatIranianIraqiIrishIroquoisIsraeliItalianJamaicanJapaneseJordanianKenyanKiowaKoreanLaotianLatvianLebaneseLiberianLithuanianLumbeeLuxembourgerMacedonianMalaysianMalteseMarshalleseMenomineeMexicanMexican American IndianMongolianMoroccanNative HawaiianNavajoNepaleseNew ZealanderNicaraguanNigerianNorthern EuropeanNorwegianOkinawanOsageOttawaPaiutePakistaniPalestinianPanamanianParaguayanPennsylvania GermanPeruvianPimaPolishPortuguesePotawatomiPuebloPuerto RicanPuget Sound SalishRomanianRussianSalvadoranSamoanScandinavianScotch-IrishScottishSeminoleSenegaleseSerbianShoshoneSierra LeoneanSiouxSlavicSlovakSloveneSomaliSouth AfricanSouth AmericanSouth American IndianSoviet UnionSpaniardSpanishSpanish AmericanSpanish American IndianSri LankanSubsaharan AfricanSudaneseSwedishSwissSyrianTaiwaneseThaiTlingit-HaidaTohono O'OdhamTonganTrinidadian and TobagonianTsimshianTurkishU.S. Virgin IslanderUgandanUkrainianUruguayanUteVenezuelanVietnameseWelshWest IndianYakamaYaquiYugoslavianYumanYup'ikZimbabwean
Immigrant Origin (Total)
AfghanistanAfricaAlbaniaArgentinaArmeniaAsiaAustraliaAustriaAzoresBahamasBangladeshBarbadosBelarusBelgiumBelizeBoliviaBosnia and HerzegovinaBrazilBulgariaBurma / MyanmarCabo VerdeCambodiaCameroonCanadaCaribbeanCentral AmericaChileChinaColombiaCongoCosta RicaCroatiaCubaCzechoslovakiaDenmarkDominicaDominican RepublicEastern AfricaEastern AsiaEastern EuropeEcuadorEgyptEl SalvadorEnglandEritreaEthiopiaEuropeFijiFranceGermanyGhanaGreeceGrenadaGuatemalaGuyanaHaitiHondurasHong KongHungaryIndiaIndonesiaIranIraqIrelandIsraelItalyJamaicaJapanJordanKazakhstanKenyaKoreaKuwaitLaosLatin AmericaLatviaLebanonLiberiaLithuaniaMalaysiaMexicoMicronesiaMiddle AfricaMoldovaMoroccoNepalNetherlandsNicaraguaNigeriaNorth MacedoniaNorthern AfricaNorthern EuropeNorwayOceaniaPakistanPanamaPeruPhilippinesPolandPortugalRomaniaRussiaSaudi ArabiaScotlandSenegalSerbiaSierra LeoneSingaporeSomaliaSouth AfricaSouth AmericaSouth Central AsiaSouth Eastern AsiaSouthern EuropeSpainSri LankaSt. Vincent and the GrenadinesSudanSwedenSwitzerlandSyriaTaiwanThailandTrinidad and TobagoTurkeyUgandaUkraineUruguayUzbekistanVenezuelaVietnamWest IndiesWestern AfricaWestern AsiaWestern EuropeYemenZaireZimbabwe
Immigrant Origin (Percentage)
AfghanistanAfricaAlbaniaArgentinaArmeniaAsiaAustraliaAustriaAzoresBahamasBangladeshBarbadosBelarusBelgiumBelizeBoliviaBosnia and HerzegovinaBrazilBulgariaBurma / MyanmarCabo VerdeCambodiaCameroonCanadaCaribbeanCentral AmericaChileChinaColombiaCongoCosta RicaCroatiaCubaCzechoslovakiaDenmarkDominicaDominican RepublicEastern AfricaEastern AsiaEastern EuropeEcuadorEgyptEl SalvadorEnglandEritreaEthiopiaEuropeFijiFranceGermanyGhanaGreeceGrenadaGuatemalaGuyanaHaitiHondurasHong KongHungaryIndiaIndonesiaIranIraqIrelandIsraelItalyJamaicaJapanJordanKazakhstanKenyaKoreaKuwaitLaosLatin AmericaLatviaLebanonLiberiaLithuaniaMalaysiaMexicoMicronesiaMiddle AfricaMoldovaMoroccoNepalNetherlandsNicaraguaNigeriaNorth MacedoniaNorthern AfricaNorthern EuropeNorwayOceaniaPakistanPanamaPeruPhilippinesPolandPortugalRomaniaRussiaSaudi ArabiaScotlandSenegalSerbiaSierra LeoneSingaporeSomaliaSouth AfricaSouth AmericaSouth Central AsiaSouth Eastern AsiaSouthern EuropeSpainSri LankaSt. Vincent and the GrenadinesSudanSwedenSwitzerlandSyriaTaiwanThailandTrinidad and TobagoTurkeyUgandaUkraineUruguayUzbekistanVenezuelaVietnamWest IndiesWestern AfricaWestern AsiaWestern EuropeYemenZaireZimbabwe
Income
Income (Families)
Income (Households)
Poverty
Poverty (Families)
Unemployment
Employment Occupations
Employment Industries
Employer Class
Commute Time
Commute Means
School Enrollment
Education by Degree Field
Occupancy
Finances
Physical Characteristics
Rhode Island
Compare Zip Codes
Comparison Subject

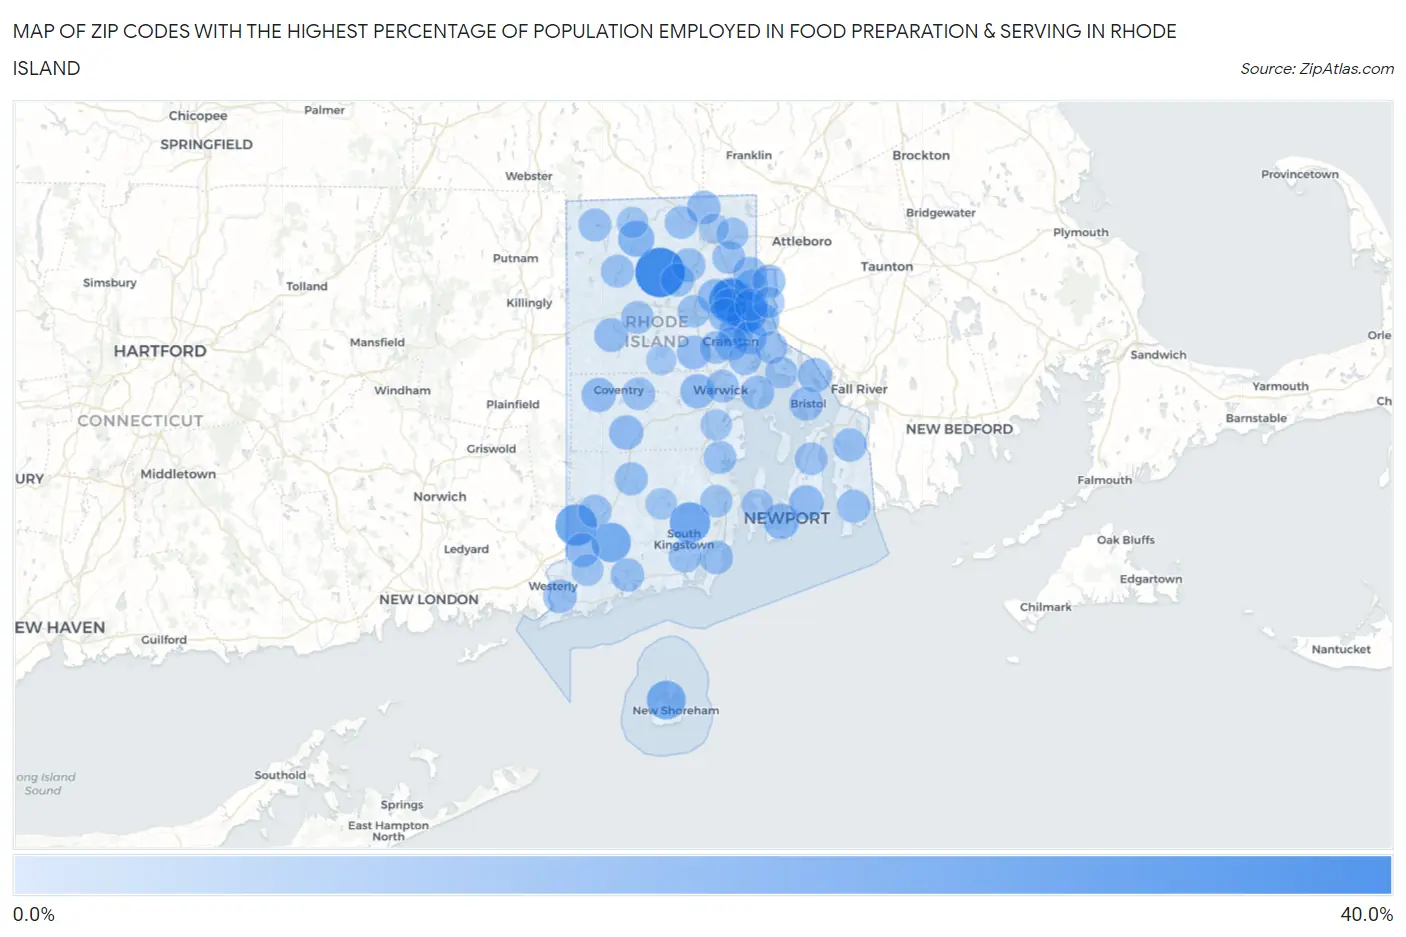
Map of Zip Codes with the Highest Percentage of Population Employed in Food Preparation & Serving in Rhode Island

0.0%
40.0%
Zip Codes with the Highest Percentage of Population Employed in Food Preparation & Serving in Rhode Island Map

Zip Codes with the Highest Percentage of Population Employed in Food Preparation & Serving in Rhode Island

Zip Code % Employed vs State vs National
1.0282935.0%5.6%(+29.4)#15.3%(+29.7)#149
2.0291825.6%5.6%(+20.0)#25.3%(+20.3)#299
3.0283320.3%5.6%(+14.8)#35.3%(+15.0)#485
4.0291218.5%5.6%(+12.9)#45.3%(+13.2)#612
5.0288118.5%5.6%(+12.9)#55.3%(+13.2)#613
6.0289416.2%5.6%(+10.6)#65.3%(+10.9)#840
7.0280715.3%5.6%(+9.76)#75.3%(+10.0)#942
8.0283910.6%5.6%(+5.04)#85.3%(+5.31)#2,263
9.028409.5%5.6%(+3.99)#95.3%(+4.26)#3,017
10.029047.9%5.6%(+2.31)#105.3%(+2.59)#4,931
11.028427.8%5.6%(+2.25)#115.3%(+2.52)#5,034
12.028937.6%5.6%(+2.01)#125.3%(+2.28)#5,436
13.028177.5%5.6%(+1.98)#135.3%(+2.25)#5,487
14.029117.5%5.6%(+1.97)#145.3%(+2.24)#5,498
15.028277.3%5.6%(+1.71)#155.3%(+1.98)#5,990
16.029037.3%5.6%(+1.70)#165.3%(+1.97)#6,018
17.028857.1%5.6%(+1.55)#175.3%(+1.82)#6,337
18.028046.8%5.6%(+1.26)#185.3%(+1.53)#7,037
19.029076.7%5.6%(+1.16)#195.3%(+1.43)#7,285
20.028916.6%5.6%(+1.06)#205.3%(+1.34)#7,547
21.028256.6%5.6%(+1.06)#215.3%(+1.33)#7,566
22.028096.5%5.6%(+0.969)#225.3%(+1.24)#7,807
23.029216.3%5.6%(+0.710)#235.3%(+0.982)#8,515
24.028956.1%5.6%(+0.561)#245.3%(+0.834)#8,962
25.028636.0%5.6%(+0.452)#255.3%(+0.725)#9,311
26.029085.9%5.6%(+0.383)#265.3%(+0.656)#9,532
27.028895.8%5.6%(+0.279)#275.3%(+0.551)#9,907
28.029175.8%5.6%(+0.248)#285.3%(+0.521)#10,014
29.028825.8%5.6%(+0.246)#295.3%(+0.519)#10,022
30.029055.8%5.6%(+0.209)#305.3%(+0.482)#10,130
31.028135.7%5.6%(+0.147)#315.3%(+0.420)#10,318
32.028375.7%5.6%(+0.109)#325.3%(+0.382)#10,466
33.028285.7%5.6%(+0.104)#335.3%(+0.377)#10,475
34.029145.6%5.6%(+0.045)#345.3%(+0.317)#10,687
35.028785.6%5.6%(+0.038)#355.3%(+0.311)#10,711
36.028605.5%5.6%(-0.045)#365.3%(+0.228)#11,026
37.029095.5%5.6%(-0.099)#375.3%(+0.174)#11,185
38.028615.4%5.6%(-0.131)#385.3%(+0.142)#11,310
39.028225.4%5.6%(-0.179)#395.3%(+0.093)#11,474
40.028325.3%5.6%(-0.267)#405.3%(+0.005)#11,799
41.028145.3%5.6%(-0.270)#415.3%(+0.003)#11,811
42.029105.2%5.6%(-0.370)#425.3%(-0.097)#12,194
43.028595.0%5.6%(-0.544)#435.3%(-0.271)#12,888
44.028795.0%5.6%(-0.602)#445.3%(-0.329)#13,124
45.029064.9%5.6%(-0.681)#455.3%(-0.409)#13,462
46.028524.8%5.6%(-0.750)#465.3%(-0.477)#13,726
47.028964.8%5.6%(-0.777)#475.3%(-0.504)#13,816
48.028654.7%5.6%(-0.835)#485.3%(-0.562)#14,065
49.029204.7%5.6%(-0.872)#495.3%(-0.599)#14,212
50.028864.7%5.6%(-0.876)#505.3%(-0.603)#14,231
51.028574.7%5.6%(-0.885)#515.3%(-0.613)#14,272
52.028164.6%5.6%(-0.992)#525.3%(-0.719)#14,756
53.028714.5%5.6%(-1.04)#535.3%(-0.766)#14,943
54.028884.4%5.6%(-1.16)#545.3%(-0.891)#15,444
55.029193.9%5.6%(-1.63)#555.3%(-1.36)#17,413
56.029153.9%5.6%(-1.65)#565.3%(-1.38)#17,520
57.028743.9%5.6%(-1.69)#575.3%(-1.42)#17,689
58.028063.4%5.6%(-2.14)#585.3%(-1.87)#19,550
59.028643.2%5.6%(-2.32)#595.3%(-2.04)#20,322
60.028083.1%5.6%(-2.50)#605.3%(-2.23)#21,034
61.028352.6%5.6%(-2.97)#615.3%(-2.70)#22,845
62.028302.4%5.6%(-3.16)#625.3%(-2.89)#23,461
63.028182.3%5.6%(-3.22)#635.3%(-2.95)#23,655
64.028922.3%5.6%(-3.26)#645.3%(-2.99)#23,784
65.029162.2%5.6%(-3.41)#655.3%(-3.13)#24,248
66.028310.35%5.6%(-5.21)#665.3%(-4.94)#27,818
67.028380.060%5.6%(-5.50)#675.3%(-5.23)#27,939

Common Questions

What are the Top 10 Zip Codes with the Highest Percentage of Population Employed in Food Preparation & Serving in Rhode Island?
Top 10 Zip Codes with the Highest Percentage of Population Employed in Food Preparation & Serving in Rhode Island are:
#1
35.0%
#2
25.6%
#3
20.3%
#4
18.5%
#5
18.5%
#6
16.2%
#7
15.3%
#8
10.6%
#9
9.5%
#10
7.9%
What zip code has the Highest Percentage of Population Employed in Food Preparation & Serving in Rhode Island?
02829 has the Highest Percentage of Population Employed in Food Preparation & Serving in Rhode Island with 35.0%.
What is the Percentage of Population Employed in Food Preparation & Serving in the State of Rhode Island?
Percentage of Population Employed in Food Preparation & Serving in Rhode Island is 5.6%.
What is the Percentage of Population Employed in Food Preparation & Serving in the United States?
Percentage of Population Employed in Food Preparation & Serving in the United States is 5.3%.