Zip Codes with the Highest Percentage of Immigrants from Burma / Myanmar in the United States
RELATED REPORTS & OPTIONS
Burma / Myanmar
United States
Compare Zip Codes
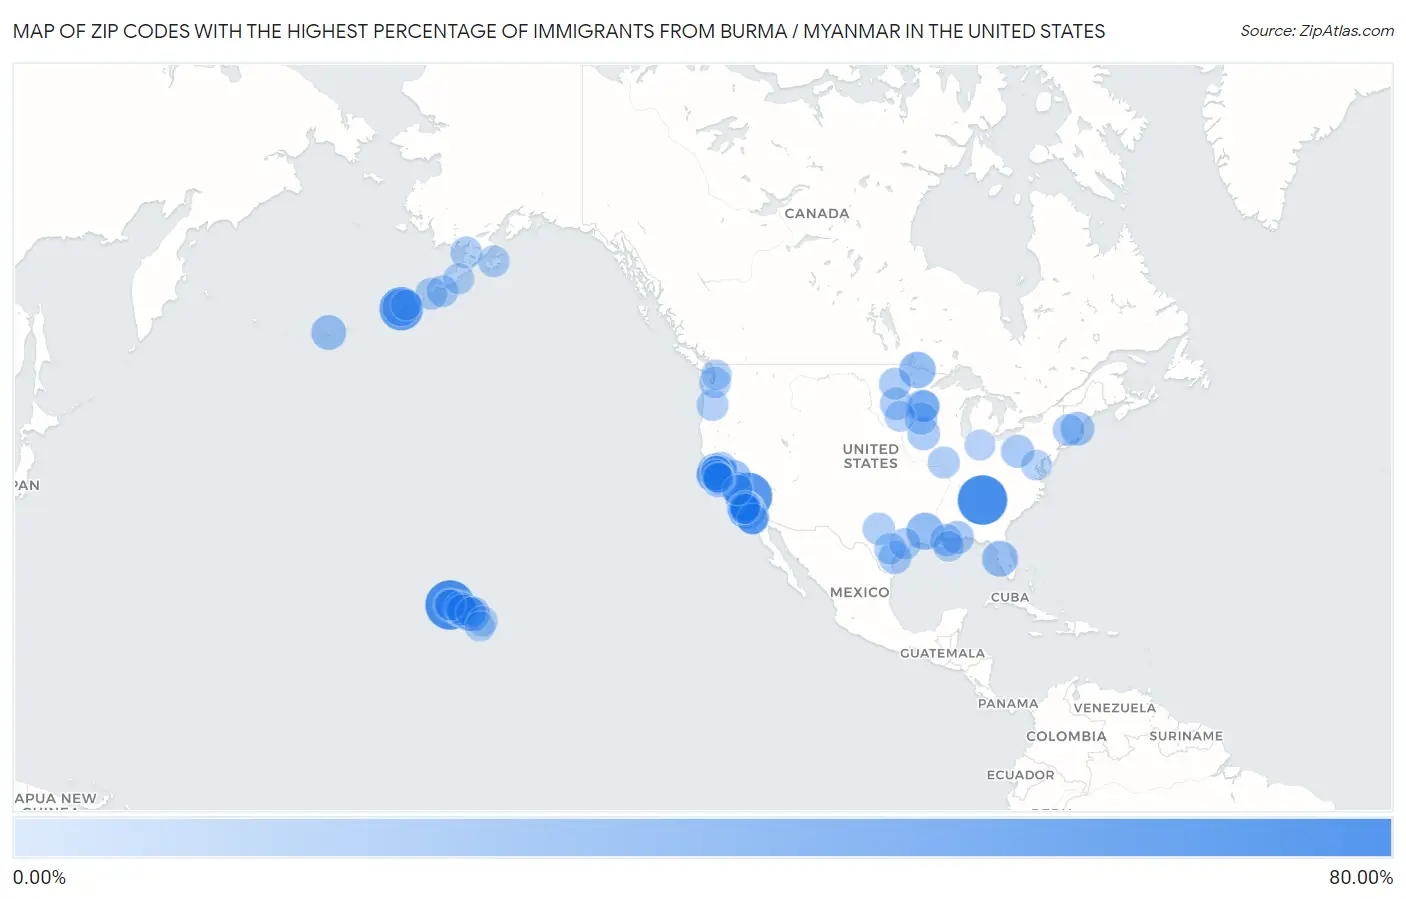
Map of Zip Codes with the Highest Percentage of Immigrants from Burma / Myanmar in the United States
0.00%
15.00%
Zip Codes with the Highest Percentage of Immigrants from Burma / Myanmar in the United States
| Zip Code | Burma / Myanmar | vs State | vs National | |
| 1. | 21523 | 12.78% | 0.079%(+12.7)#1 | 0.047%(+12.7)#110 |
| 2. | 56016 | 8.70% | 0.15%(+8.54)#3 | 0.047%(+8.65)#111 |
| 3. | 46227 | 7.92% | 0.24%(+7.68)#3 | 0.047%(+7.87)#221 |
| 4. | 46217 | 7.81% | 0.24%(+7.57)#4 | 0.047%(+7.76)#222 |
| 5. | 55130 | 6.88% | 0.15%(+6.73)#4 | 0.047%(+6.84)#223 |
| 6. | 46816 | 6.45% | 0.24%(+6.21)#5 | 0.047%(+6.40)#224 |
| 7. | 68104 | 5.33% | 0.20%(+5.13)#2 | 0.047%(+5.28)#227 |
| 8. | 20763 | 4.78% | 0.079%(+4.70)#3 | 0.047%(+4.73)#502 |
| 9. | 30021 | 4.32% | 0.047%(+4.27)#4 | 0.047%(+4.27)#503 |
| 10. | 13501 | 4.29% | 0.081%(+4.21)#2 | 0.047%(+4.24)#504 |
| 11. | 74037 | 4.21% | 0.10%(+4.11)#4 | 0.047%(+4.17)#563 |
| 12. | 14207 | 4.12% | 0.081%(+4.04)#8 | 0.047%(+4.07)#564 |
| 13. | 57350 | 3.88% | 0.094%(+3.79)#5 | 0.047%(+3.83)#565 |
| 14. | 55106 | 3.81% | 0.15%(+3.66)#5 | 0.047%(+3.76)#566 |
| 15. | 14213 | 3.70% | 0.081%(+3.62)#9 | 0.047%(+3.65)#567 |
| 16. | 65647 | 3.65% | 0.020%(+3.63)#6 | 0.047%(+3.60)#639 |
| 17. | 79013 | 3.54% | 0.042%(+3.50)#40 | 0.047%(+3.50)#657 |
| 18. | 74136 | 3.48% | 0.10%(+3.38)#5 | 0.047%(+3.43)#801 |
| 19. | 98829 | 3.45% | 0.041%(+3.41)#20 | 0.047%(+3.40)#802 |
| 20. | 66112 | 3.35% | 0.096%(+3.25)#6 | 0.047%(+3.30)#803 |
| 21. | 13616 | 3.31% | 0.081%(+3.22)#35 | 0.047%(+3.26)#1,063 |
| 22. | 50310 | 3.27% | 0.14%(+3.13)#2 | 0.047%(+3.22)#1,064 |
| 23. | 49015 | 3.14% | 0.041%(+3.10)#2 | 0.047%(+3.09)#1,065 |
| 24. | 46806 | 3.03% | 0.24%(+2.79)#6 | 0.047%(+2.98)#1,066 |
| 25. | 98207 | 2.89% | 0.041%(+2.85)#21 | 0.047%(+2.84)#1,067 |
| 26. | 78330 | 2.86% | 0.042%(+2.82)#81 | 0.047%(+2.82)#1,313 |
| 27. | 91916 | 2.84% | 0.072%(+2.77)#442 | 0.047%(+2.79)#1,314 |
| 28. | 14260 | 2.83% | 0.081%(+2.75)#43 | 0.047%(+2.79)#1,315 |
| 29. | 55103 | 2.81% | 0.15%(+2.66)#6 | 0.047%(+2.77)#1,316 |
| 30. | 46228 | 2.81% | 0.24%(+2.57)#7 | 0.047%(+2.76)#1,317 |
| 31. | 51101 | 2.80% | 0.14%(+2.66)#4 | 0.047%(+2.76)#1,318 |
| 32. | 14212 | 2.76% | 0.081%(+2.68)#44 | 0.047%(+2.71)#1,319 |
| 33. | 94015 | 2.75% | 0.072%(+2.67)#443 | 0.047%(+2.70)#1,320 |
| 34. | 52738 | 2.69% | 0.14%(+2.54)#32 | 0.047%(+2.64)#1,443 |
| 35. | 55117 | 2.63% | 0.15%(+2.48)#8 | 0.047%(+2.58)#1,444 |
| 36. | 66109 | 2.59% | 0.096%(+2.49)#16 | 0.047%(+2.54)#1,445 |
| 37. | 46805 | 2.57% | 0.24%(+2.33)#8 | 0.047%(+2.53)#1,446 |
| 38. | 30084 | 2.50% | 0.047%(+2.46)#7 | 0.047%(+2.46)#1,447 |
| 39. | 75231 | 2.46% | 0.042%(+2.42)#82 | 0.047%(+2.42)#1,448 |
| 40. | 44310 | 2.44% | 0.012%(+2.43)#2 | 0.047%(+2.40)#1,449 |
| 41. | 49508 | 2.37% | 0.041%(+2.33)#3 | 0.047%(+2.32)#1,450 |
| 42. | 96848 | 2.36% | 0.0085%(+2.35)#6 | 0.047%(+2.31)#1,451 |
| 43. | 56110 | 2.29% | 0.15%(+2.14)#40 | 0.047%(+2.24)#1,452 |
| 44. | 79102 | 2.28% | 0.042%(+2.24)#86 | 0.047%(+2.24)#1,453 |
| 45. | 50158 | 2.23% | 0.14%(+2.09)#33 | 0.047%(+2.18)#1,454 |
| 46. | 68333 | 2.20% | 0.20%(+2.00)#14 | 0.047%(+2.15)#1,605 |
| 47. | 68111 | 2.13% | 0.20%(+1.93)#15 | 0.047%(+2.08)#1,606 |
| 48. | 12209 | 2.12% | 0.081%(+2.04)#45 | 0.047%(+2.07)#1,607 |
| 49. | 46815 | 2.09% | 0.24%(+1.85)#9 | 0.047%(+2.04)#1,608 |
| 50. | 74132 | 2.08% | 0.10%(+1.98)#17 | 0.047%(+2.03)#1,612 |
| 51. | 75067 | 2.07% | 0.042%(+2.03)#87 | 0.047%(+2.02)#1,613 |
| 52. | 46237 | 2.03% | 0.24%(+1.79)#10 | 0.047%(+1.98)#1,614 |
| 53. | 13211 | 1.99% | 0.081%(+1.91)#46 | 0.047%(+1.95)#1,615 |
| 54. | 12202 | 1.90% | 0.081%(+1.82)#47 | 0.047%(+1.85)#1,616 |
| 55. | 79107 | 1.86% | 0.042%(+1.82)#88 | 0.047%(+1.81)#1,617 |
| 56. | 68748 | 1.85% | 0.20%(+1.65)#20 | 0.047%(+1.81)#1,978 |
| 57. | 28212 | 1.81% | 0.043%(+1.77)#7 | 0.047%(+1.76)#1,979 |
| 58. | 50325 | 1.80% | 0.14%(+1.66)#34 | 0.047%(+1.75)#1,980 |
| 59. | 32207 | 1.80% | 0.016%(+1.78)#7 | 0.047%(+1.75)#1,981 |
| 60. | 73149 | 1.79% | 0.10%(+1.69)#18 | 0.047%(+1.74)#1,982 |
| 61. | 42104 | 1.78% | 0.077%(+1.71)#4 | 0.047%(+1.73)#1,983 |
| 62. | 52739 | 1.78% | 0.14%(+1.64)#39 | 0.047%(+1.73)#1,984 |
| 63. | 50588 | 1.75% | 0.14%(+1.61)#40 | 0.047%(+1.70)#1,985 |
| 64. | 68110 | 1.71% | 0.20%(+1.51)#21 | 0.047%(+1.67)#1,986 |
| 65. | 46825 | 1.67% | 0.24%(+1.43)#11 | 0.047%(+1.62)#1,987 |
| 66. | 66102 | 1.66% | 0.096%(+1.56)#17 | 0.047%(+1.61)#1,988 |
| 67. | 13203 | 1.62% | 0.081%(+1.54)#48 | 0.047%(+1.58)#1,989 |
| 68. | 94132 | 1.62% | 0.072%(+1.55)#444 | 0.047%(+1.57)#1,990 |
| 69. | 91770 | 1.61% | 0.072%(+1.54)#445 | 0.047%(+1.57)#1,991 |
| 70. | 30627 | 1.61% | 0.047%(+1.56)#11 | 0.047%(+1.56)#1,992 |
| 71. | 13208 | 1.55% | 0.081%(+1.46)#49 | 0.047%(+1.50)#1,993 |
| 72. | 75861 | 1.53% | 0.042%(+1.49)#216 | 0.047%(+1.48)#2,905 |
| 73. | 53215 | 1.53% | 0.068%(+1.46)#5 | 0.047%(+1.48)#2,906 |
| 74. | 51443 | 1.53% | 0.14%(+1.38)#58 | 0.047%(+1.48)#2,918 |
| 75. | 42103 | 1.52% | 0.077%(+1.44)#6 | 0.047%(+1.47)#2,919 |
| 76. | 50322 | 1.52% | 0.14%(+1.37)#59 | 0.047%(+1.47)#2,920 |
| 77. | 65723 | 1.50% | 0.020%(+1.48)#7 | 0.047%(+1.46)#2,921 |
| 78. | 53208 | 1.50% | 0.068%(+1.43)#6 | 0.047%(+1.45)#2,922 |
| 79. | 49037 | 1.49% | 0.041%(+1.45)#17 | 0.047%(+1.44)#2,923 |
| 80. | 90505 | 1.49% | 0.072%(+1.41)#446 | 0.047%(+1.44)#2,924 |
| 81. | 21227 | 1.47% | 0.079%(+1.39)#43 | 0.047%(+1.42)#2,925 |
| 82. | 28560 | 1.46% | 0.043%(+1.42)#22 | 0.047%(+1.41)#2,926 |
| 83. | 30083 | 1.46% | 0.047%(+1.41)#18 | 0.047%(+1.41)#2,927 |
| 84. | 56119 | 1.44% | 0.15%(+1.29)#67 | 0.047%(+1.40)#2,928 |
| 85. | 25438 | 1.44% | 0.0085%(+1.43)#8 | 0.047%(+1.39)#2,929 |
| 86. | 50239 | 1.44% | 0.14%(+1.30)#60 | 0.047%(+1.39)#2,930 |
| 87. | 94538 | 1.43% | 0.072%(+1.35)#447 | 0.047%(+1.38)#2,931 |
| 88. | 64109 | 1.42% | 0.020%(+1.40)#40 | 0.047%(+1.37)#2,932 |
| 89. | 56258 | 1.40% | 0.15%(+1.25)#68 | 0.047%(+1.36)#2,933 |
| 90. | 55912 | 1.40% | 0.15%(+1.25)#69 | 0.047%(+1.35)#2,934 |
| 91. | 60187 | 1.40% | 0.036%(+1.36)#72 | 0.047%(+1.35)#2,935 |
| 92. | 85017 | 1.39% | 0.036%(+1.36)#7 | 0.047%(+1.35)#2,936 |
| 93. | 53221 | 1.39% | 0.068%(+1.32)#7 | 0.047%(+1.34)#2,937 |
| 94. | 50660 | 1.38% | 0.14%(+1.24)#65 | 0.047%(+1.33)#3,274 |
| 95. | 42101 | 1.33% | 0.077%(+1.25)#11 | 0.047%(+1.28)#3,275 |
| 96. | 61244 | 1.32% | 0.036%(+1.29)#89 | 0.047%(+1.27)#3,276 |
| 97. | 50314 | 1.32% | 0.14%(+1.18)#66 | 0.047%(+1.27)#3,277 |
| 98. | 80010 | 1.29% | 0.036%(+1.26)#8 | 0.047%(+1.25)#3,278 |
| 99. | 32204 | 1.29% | 0.016%(+1.28)#109 | 0.047%(+1.25)#3,279 |
| 100. | 46142 | 1.27% | 0.24%(+1.03)#21 | 0.047%(+1.22)#3,280 |
Common Questions
What are the Top 10 Zip Codes with the Highest Percentage of Immigrants from Burma / Myanmar in the United States?
Top 10 Zip Codes with the Highest Percentage of Immigrants from Burma / Myanmar in the United States are:
What zip code has the Highest Percentage of Immigrants from Burma / Myanmar in the United States?
21523 has the Highest Percentage of Immigrants from Burma / Myanmar in the United States with 12.78%.
What is the Percentage of Immigrants from Burma / Myanmar in the United States?
Percentage of Immigrants from Burma / Myanmar in the United States is 0.047%.